Oak Grove, LA Map & Demographics
Oak Grove Map
Oak Grove Overview
$27,743
PER CAPITA INCOME
$52,917
AVG FAMILY INCOME
$31,875
AVG HOUSEHOLD INCOME
20.3%
WAGE / INCOME GAP [ % ]
79.7¢/ $1
WAGE / INCOME GAP [ $ ]
0.57
INEQUALITY / GINI INDEX
1,531
TOTAL POPULATION
803
MALE POPULATION
728
FEMALE POPULATION
110.30
MALES / 100 FEMALES
90.66
FEMALES / 100 MALES
49.2
MEDIAN AGE
3.4
AVG FAMILY SIZE
2.5
AVG HOUSEHOLD SIZE
569
LABOR FORCE [ PEOPLE ]
43.7%
PERCENT IN LABOR FORCE
1.1%
UNEMPLOYMENT RATE
Oak Grove Zip Codes
Oak Grove Area Codes
Income in Oak Grove
Income Overview in Oak Grove
Per Capita Income in Oak Grove is $27,743, while median incomes of families and households are $52,917 and $31,875 respectively.
| Characteristic | Number | Measure |
| Per Capita Income | 1,531 | $27,743 |
| Median Family Income | 344 | $52,917 |
| Mean Family Income | 344 | $91,750 |
| Median Household Income | 587 | $31,875 |
| Mean Household Income | 587 | $65,522 |
| Income Deficit | 344 | $0 |
| Wage / Income Gap (%) | 1,531 | 20.34% |
| Wage / Income Gap ($) | 1,531 | 79.66¢ per $1 |
| Gini / Inequality Index | 1,531 | 0.57 |
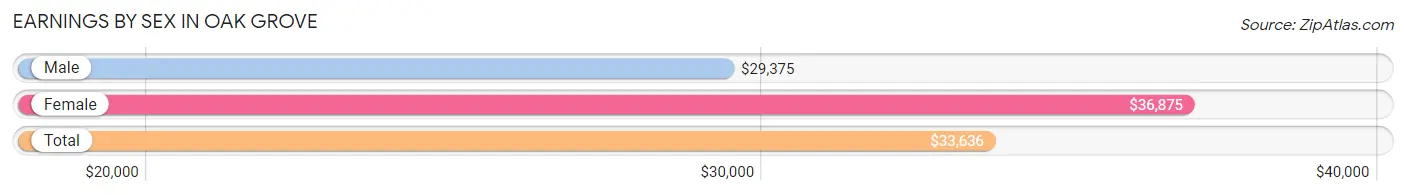
Earnings by Sex in Oak Grove
Average Earnings in Oak Grove are $33,636, $29,375 for men and $36,875 for women, a difference of 20.3%.
| Sex | Number | Average Earnings |
| Male | 382 (58.2%) | $29,375 |
| Female | 274 (41.8%) | $36,875 |
| Total | 656 (100.0%) | $33,636 |
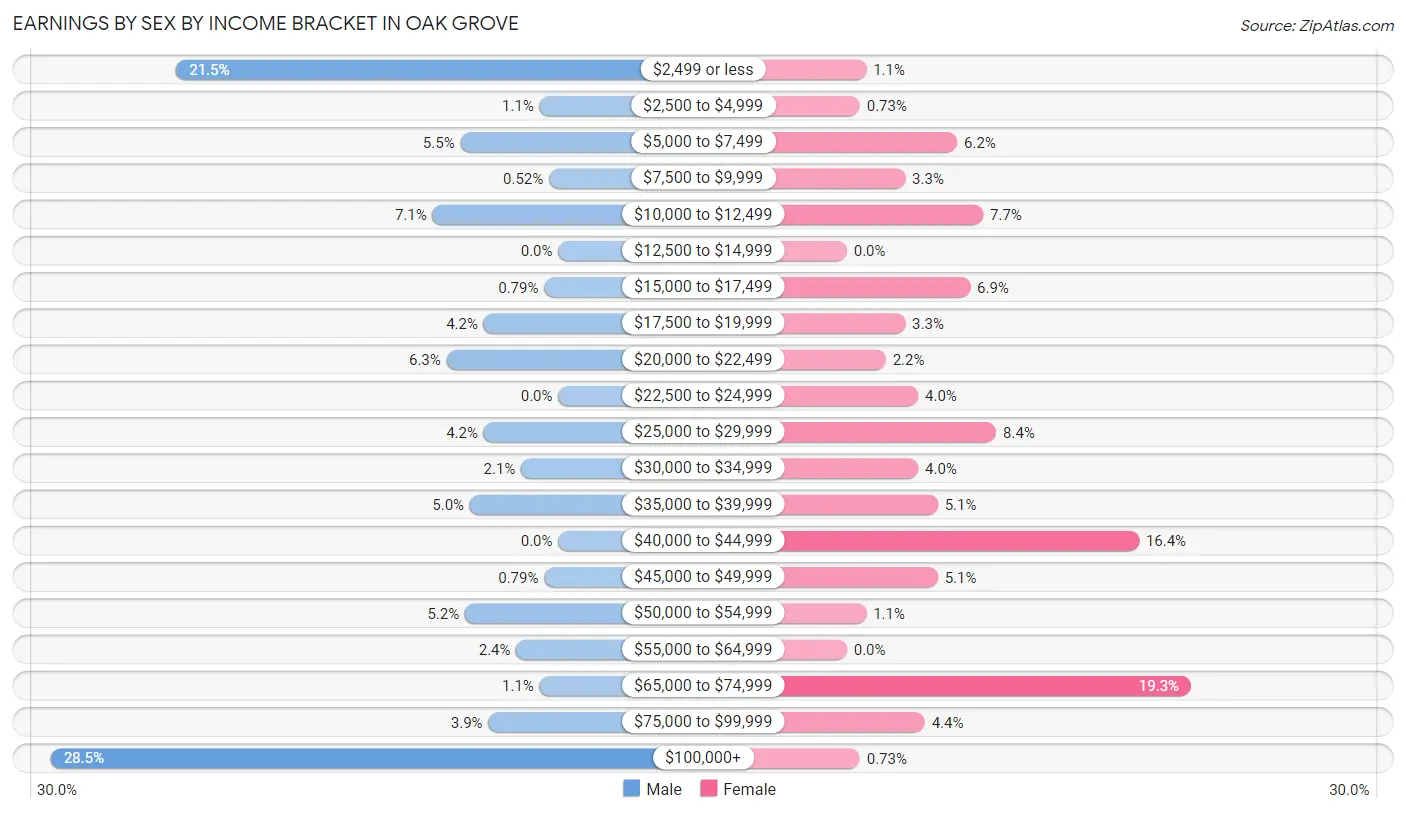
Earnings by Sex by Income Bracket in Oak Grove
The most common earnings brackets in Oak Grove are $100,000+ for men (109 | 28.5%) and $65,000 to $74,999 for women (53 | 19.3%).
| Income | Male | Female |
| $2,499 or less | 82 (21.5%) | 3 (1.1%) |
| $2,500 to $4,999 | 4 (1.1%) | 2 (0.7%) |
| $5,000 to $7,499 | 21 (5.5%) | 17 (6.2%) |
| $7,500 to $9,999 | 2 (0.5%) | 9 (3.3%) |
| $10,000 to $12,499 | 27 (7.1%) | 21 (7.7%) |
| $12,500 to $14,999 | 0 (0.0%) | 0 (0.0%) |
| $15,000 to $17,499 | 3 (0.8%) | 19 (6.9%) |
| $17,500 to $19,999 | 16 (4.2%) | 9 (3.3%) |
| $20,000 to $22,499 | 24 (6.3%) | 6 (2.2%) |
| $22,500 to $24,999 | 0 (0.0%) | 11 (4.0%) |
| $25,000 to $29,999 | 16 (4.2%) | 23 (8.4%) |
| $30,000 to $34,999 | 8 (2.1%) | 11 (4.0%) |
| $35,000 to $39,999 | 19 (5.0%) | 14 (5.1%) |
| $40,000 to $44,999 | 0 (0.0%) | 45 (16.4%) |
| $45,000 to $49,999 | 3 (0.8%) | 14 (5.1%) |
| $50,000 to $54,999 | 20 (5.2%) | 3 (1.1%) |
| $55,000 to $64,999 | 9 (2.4%) | 0 (0.0%) |
| $65,000 to $74,999 | 4 (1.1%) | 53 (19.3%) |
| $75,000 to $99,999 | 15 (3.9%) | 12 (4.4%) |
| $100,000+ | 109 (28.5%) | 2 (0.7%) |
| Total | 382 (100.0%) | 274 (100.0%) |
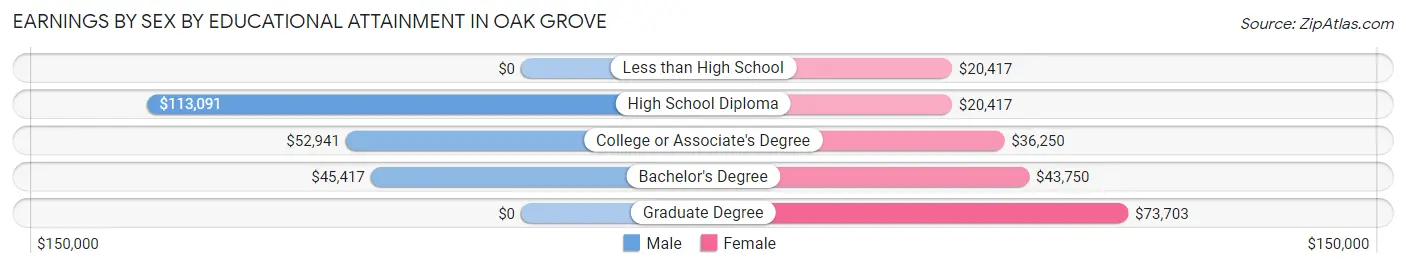
Earnings by Sex by Educational Attainment in Oak Grove
Average earnings in Oak Grove are $61,250 for men and $40,111 for women, a difference of 34.5%. Men with an educational attainment of high school diploma enjoy the highest average annual earnings of $113,091, while those with bachelor's degree education earn the least with $45,417. Women with an educational attainment of graduate degree earn the most with the average annual earnings of $73,703, while those with less than high school education have the smallest earnings of $20,417.
| Educational Attainment | Male Income | Female Income |
| Less than High School | - | - |
| High School Diploma | $113,091 | $20,417 |
| College or Associate's Degree | $52,941 | $36,250 |
| Bachelor's Degree | $45,417 | $43,750 |
| Graduate Degree | - | - |
| Total | $61,250 | $40,111 |
Family Income in Oak Grove
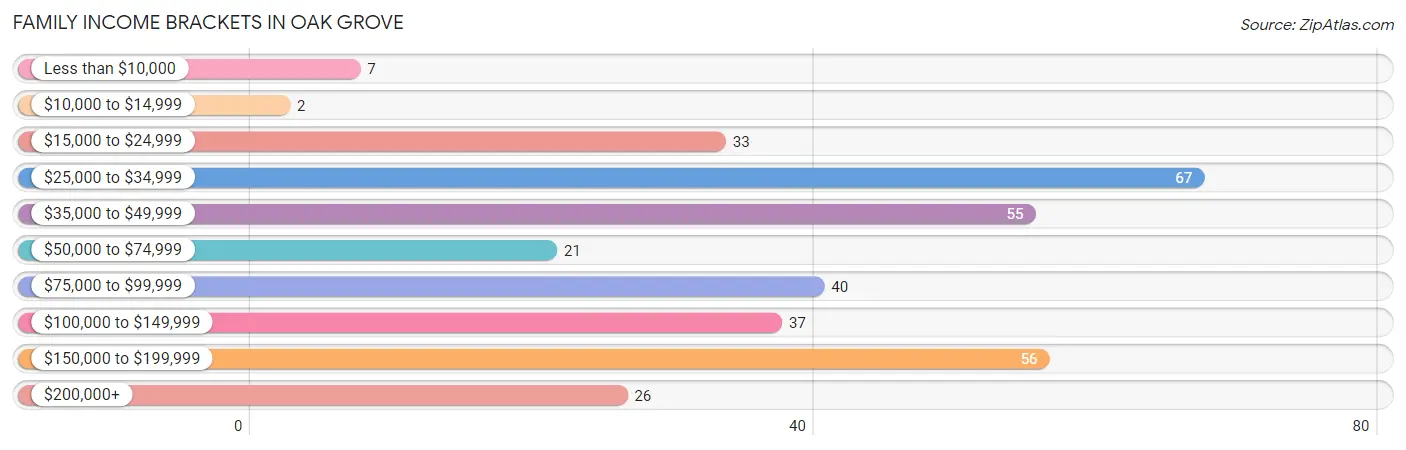
Family Income Brackets in Oak Grove
According to the Oak Grove family income data, there are 67 families falling into the $25,000 to $34,999 income range, which is the most common income bracket and makes up 19.5% of all families. Conversely, the $10,000 to $14,999 income bracket is the least frequent group with only 2 families (0.6%) belonging to this category.
| Income Bracket | # Families | % Families |
| Less than $10,000 | 7 | 2.0% |
| $10,000 to $14,999 | 2 | 0.6% |
| $15,000 to $24,999 | 33 | 9.6% |
| $25,000 to $34,999 | 67 | 19.5% |
| $35,000 to $49,999 | 55 | 16.0% |
| $50,000 to $74,999 | 21 | 6.1% |
| $75,000 to $99,999 | 40 | 11.6% |
| $100,000 to $149,999 | 37 | 10.8% |
| $150,000 to $199,999 | 56 | 16.3% |
| $200,000+ | 26 | 7.6% |
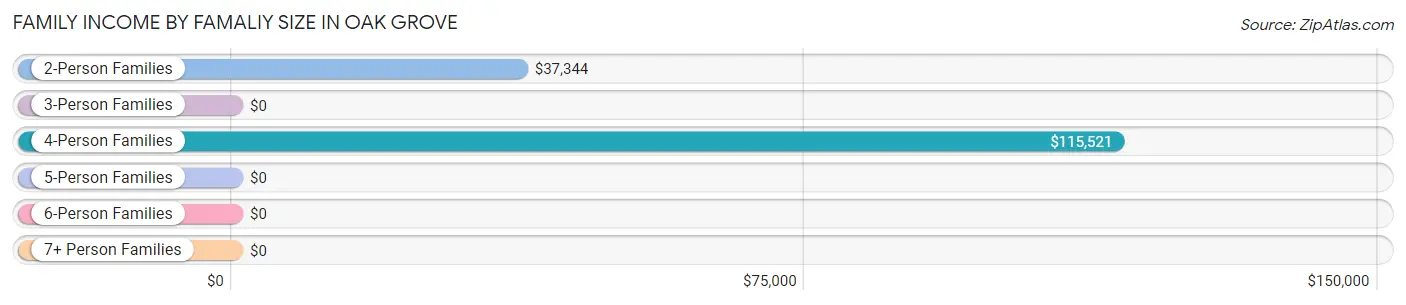
Family Income by Famaliy Size in Oak Grove
4-person families (49 | 14.2%) account for the highest median family income in Oak Grove with $115,521 per family, while 4-person families (49 | 14.2%) have the highest median income of $28,880 per family member.
| Income Bracket | # Families | Median Income |
| 2-Person Families | 167 (48.5%) | $37,344 |
| 3-Person Families | 109 (31.7%) | $0 |
| 4-Person Families | 49 (14.2%) | $115,521 |
| 5-Person Families | 15 (4.4%) | $0 |
| 6-Person Families | 4 (1.2%) | $0 |
| 7+ Person Families | 0 (0.0%) | $0 |
| Total | 344 (100.0%) | $52,917 |
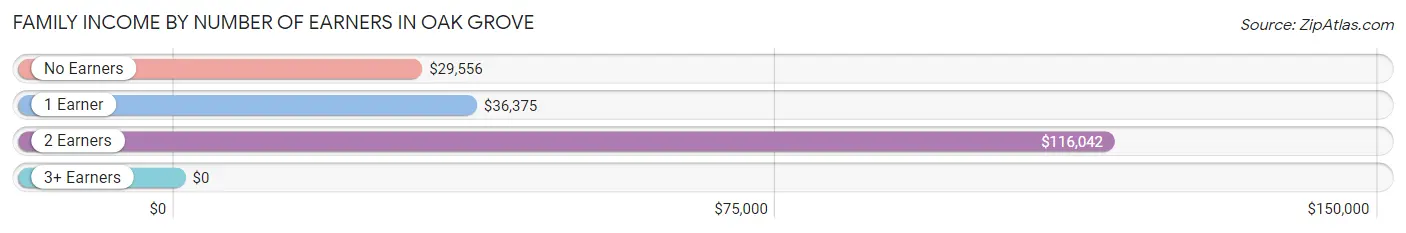
Family Income by Number of Earners in Oak Grove
| Number of Earners | # Families | Median Income |
| No Earners | 87 (25.3%) | $29,556 |
| 1 Earner | 89 (25.9%) | $36,375 |
| 2 Earners | 116 (33.7%) | $116,042 |
| 3+ Earners | 52 (15.1%) | $0 |
| Total | 344 (100.0%) | $52,917 |
Household Income in Oak Grove
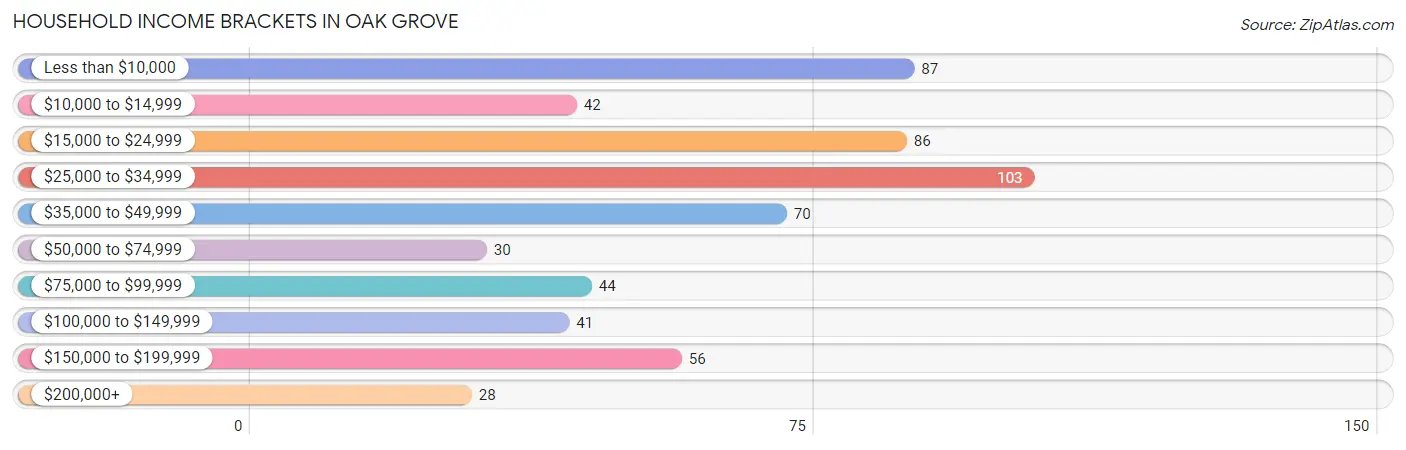
Household Income Brackets in Oak Grove
With 103 households falling in the category, the $25,000 to $34,999 income range is the most frequent in Oak Grove, accounting for 17.5% of all households. In contrast, only 28 households (4.8%) fall into the $200,000+ income bracket, making it the least populous group.
| Income Bracket | # Households | % Households |
| Less than $10,000 | 87 | 14.8% |
| $10,000 to $14,999 | 42 | 7.2% |
| $15,000 to $24,999 | 86 | 14.7% |
| $25,000 to $34,999 | 103 | 17.5% |
| $35,000 to $49,999 | 70 | 11.9% |
| $50,000 to $74,999 | 30 | 5.1% |
| $75,000 to $99,999 | 44 | 7.5% |
| $100,000 to $149,999 | 41 | 7.0% |
| $150,000 to $199,999 | 56 | 9.5% |
| $200,000+ | 28 | 4.8% |
Household Income by Householder Age in Oak Grove
The median household income in Oak Grove is $31,875, with the highest median household income of $46,875 found in the 45 to 64 years age bracket for the primary householder. A total of 284 households (48.4%) fall into this category. Meanwhile, the 25 to 44 years age bracket for the primary householder has the lowest median household income of $0, with 126 households (21.5%) in this group.
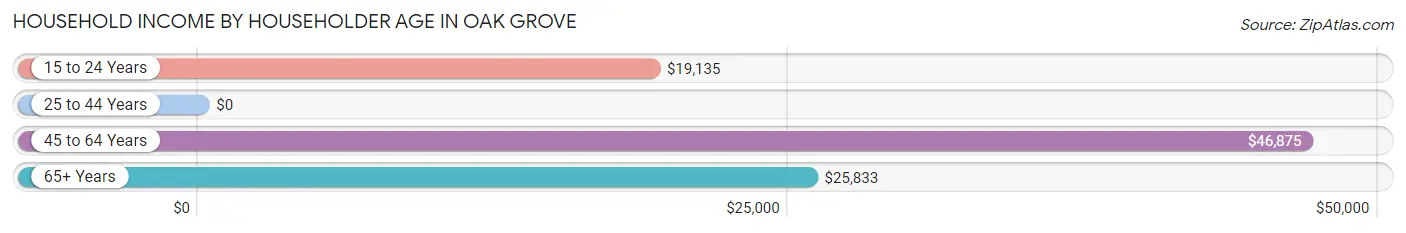
| Income Bracket | # Households | Median Income |
| 15 to 24 Years | 17 (2.9%) | $19,135 |
| 25 to 44 Years | 126 (21.5%) | $0 |
| 45 to 64 Years | 284 (48.4%) | $46,875 |
| 65+ Years | 160 (27.3%) | $25,833 |
| Total | 587 (100.0%) | $31,875 |
Poverty in Oak Grove
Income Below Poverty by Sex and Age in Oak Grove
With 14.7% poverty level for males and 28.7% for females among the residents of Oak Grove, 15 year old males and 5 year old females are the most vulnerable to poverty, with 12 males (100.0%) and 7 females (100.0%) in their respective age groups living below the poverty level.
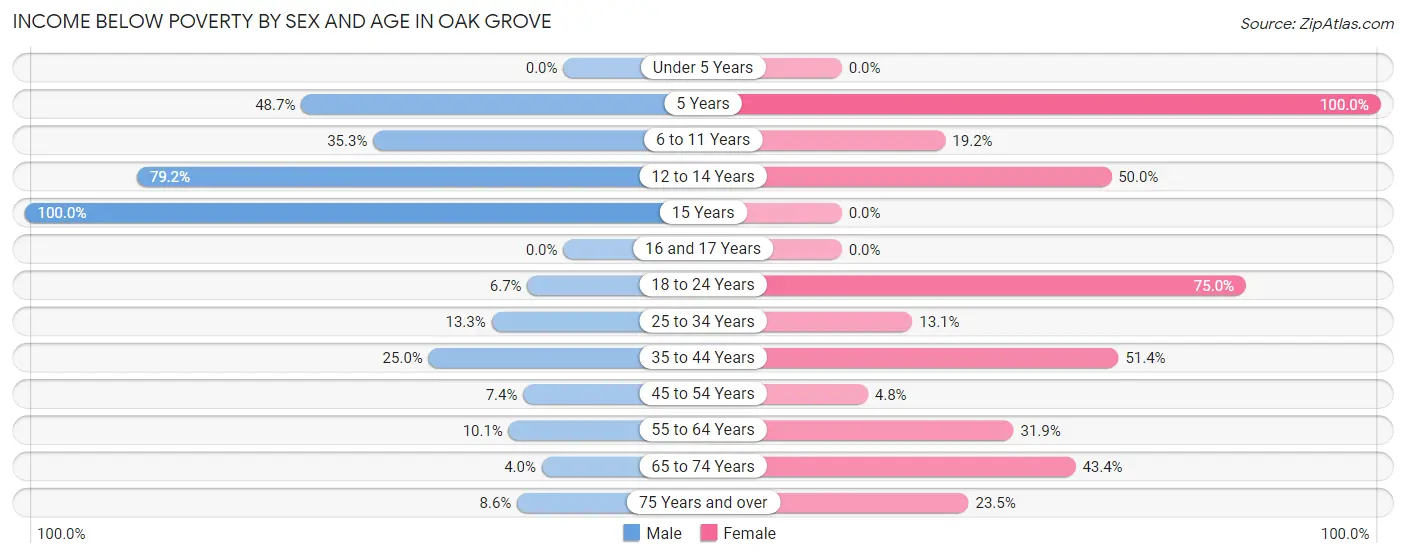
| Age Bracket | Male | Female |
| Under 5 Years | 0 (0.0%) | 0 (0.0%) |
| 5 Years | 18 (48.6%) | 7 (100.0%) |
| 6 to 11 Years | 12 (35.3%) | 5 (19.2%) |
| 12 to 14 Years | 19 (79.2%) | 5 (50.0%) |
| 15 Years | 12 (100.0%) | 0 (0.0%) |
| 16 and 17 Years | 0 (0.0%) | 0 (0.0%) |
| 18 to 24 Years | 11 (6.7%) | 15 (75.0%) |
| 25 to 34 Years | 4 (13.3%) | 11 (13.1%) |
| 35 to 44 Years | 9 (25.0%) | 57 (51.3%) |
| 45 to 54 Years | 11 (7.4%) | 7 (4.8%) |
| 55 to 64 Years | 7 (10.1%) | 44 (31.9%) |
| 65 to 74 Years | 2 (4.0%) | 36 (43.4%) |
| 75 Years and over | 6 (8.6%) | 16 (23.5%) |
| Total | 111 (14.7%) | 203 (28.7%) |
Income Above Poverty by Sex and Age in Oak Grove
According to the poverty statistics in Oak Grove, males aged under 5 years and females aged under 5 years are the age groups that are most secure financially, with 100.0% of males and 100.0% of females in these age groups living above the poverty line.
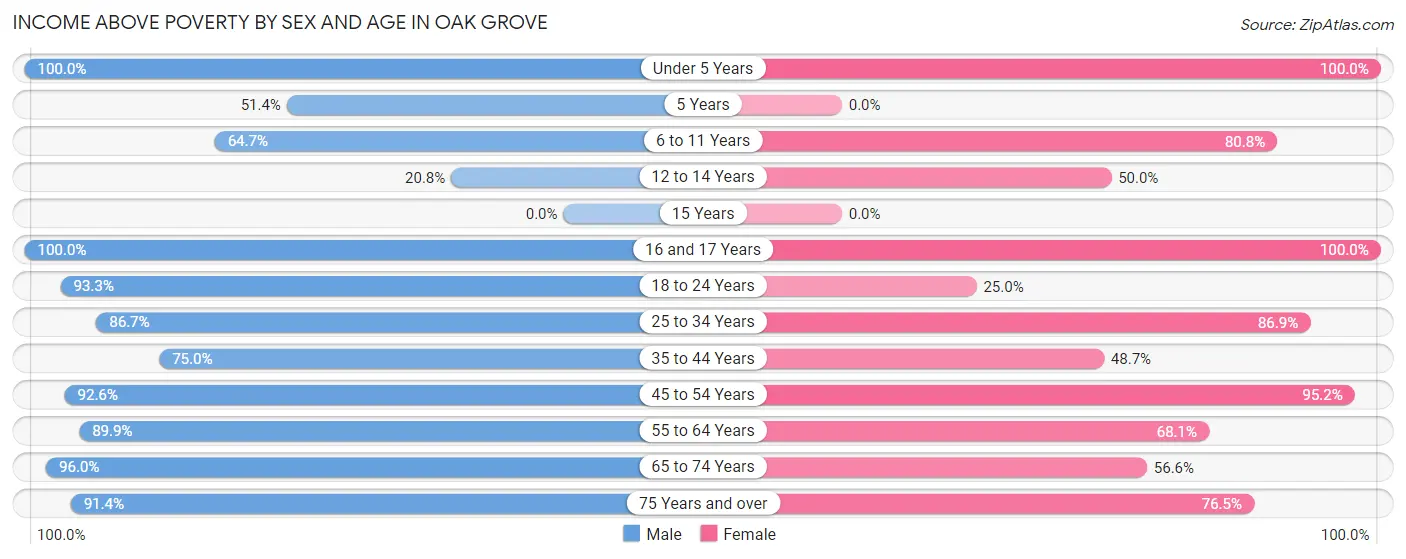
| Age Bracket | Male | Female |
| Under 5 Years | 51 (100.0%) | 14 (100.0%) |
| 5 Years | 19 (51.3%) | 0 (0.0%) |
| 6 to 11 Years | 22 (64.7%) | 21 (80.8%) |
| 12 to 14 Years | 5 (20.8%) | 5 (50.0%) |
| 15 Years | 0 (0.0%) | 0 (0.0%) |
| 16 and 17 Years | 28 (100.0%) | 1 (100.0%) |
| 18 to 24 Years | 154 (93.3%) | 5 (25.0%) |
| 25 to 34 Years | 26 (86.7%) | 73 (86.9%) |
| 35 to 44 Years | 27 (75.0%) | 54 (48.6%) |
| 45 to 54 Years | 137 (92.6%) | 138 (95.2%) |
| 55 to 64 Years | 62 (89.9%) | 94 (68.1%) |
| 65 to 74 Years | 48 (96.0%) | 47 (56.6%) |
| 75 Years and over | 64 (91.4%) | 52 (76.5%) |
| Total | 643 (85.3%) | 504 (71.3%) |
Income Below Poverty Among Married-Couple Families in Oak Grove
The poverty statistics for married-couple families in Oak Grove show that 2.1% or 5 of the total 234 families live below the poverty line. Families with 3 or 4 children have the highest poverty rate of 27.3%, comprising of 3 families. On the other hand, families with 1 or 2 children have the lowest poverty rate of 0.0%, which includes 0 families.
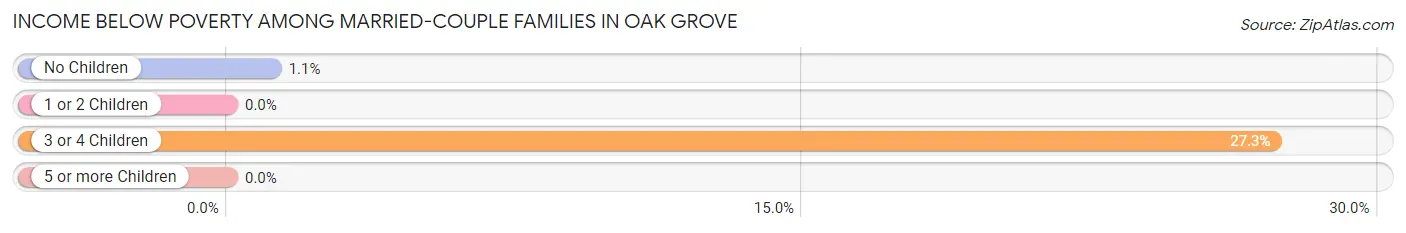
| Children | Above Poverty | Below Poverty |
| No Children | 174 (98.9%) | 2 (1.1%) |
| 1 or 2 Children | 47 (100.0%) | 0 (0.0%) |
| 3 or 4 Children | 8 (72.7%) | 3 (27.3%) |
| 5 or more Children | 0 (0.0%) | 0 (0.0%) |
| Total | 229 (97.9%) | 5 (2.1%) |
Income Below Poverty Among Single-Parent Households in Oak Grove
According to the poverty data in Oak Grove, 21.0% or 8 single-father households and 11.1% or 8 single-mother households are living below the poverty line. Among single-father households, those with 3 or 4 children have the highest poverty rate, with 4 households (100.0%) experiencing poverty. Likewise, among single-mother households, those with 1 or 2 children have the highest poverty rate, with 8 households (32.0%) falling below the poverty line.
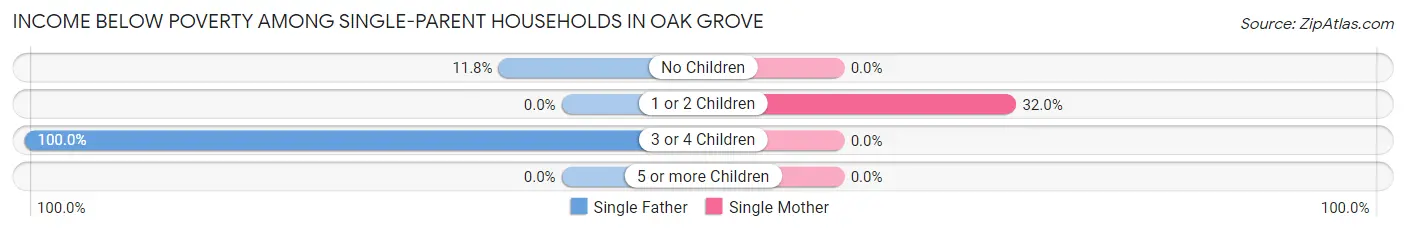
| Children | Single Father | Single Mother |
| No Children | 4 (11.8%) | 0 (0.0%) |
| 1 or 2 Children | 0 (0.0%) | 8 (32.0%) |
| 3 or 4 Children | 4 (100.0%) | 0 (0.0%) |
| 5 or more Children | 0 (0.0%) | 0 (0.0%) |
| Total | 8 (21.0%) | 8 (11.1%) |
Income Below Poverty Among Married-Couple vs Single-Parent Households in Oak Grove
The poverty data for Oak Grove shows that 5 of the married-couple family households (2.1%) and 16 of the single-parent households (14.5%) are living below the poverty level. Within the married-couple family households, those with 3 or 4 children have the highest poverty rate, with 3 households (27.3%) falling below the poverty line. Among the single-parent households, those with 3 or 4 children have the highest poverty rate, with 4 household (100.0%) living below poverty.
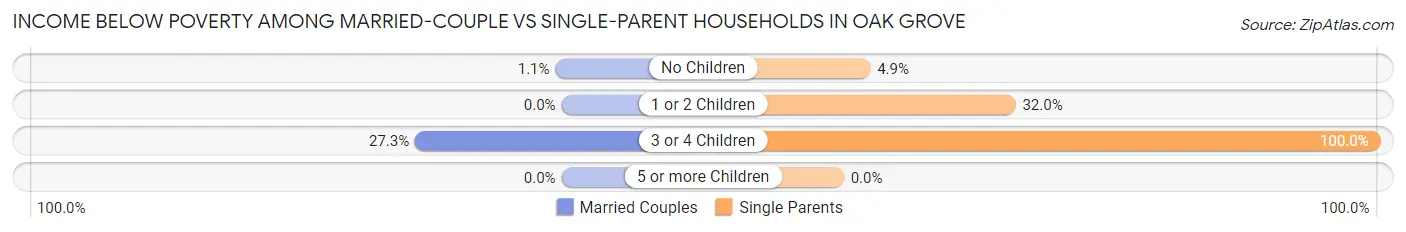
| Children | Married-Couple Families | Single-Parent Households |
| No Children | 2 (1.1%) | 4 (4.9%) |
| 1 or 2 Children | 0 (0.0%) | 8 (32.0%) |
| 3 or 4 Children | 3 (27.3%) | 4 (100.0%) |
| 5 or more Children | 0 (0.0%) | 0 (0.0%) |
| Total | 5 (2.1%) | 16 (14.5%) |
Race in Oak Grove
The most populous races in Oak Grove are White / Caucasian (1,002 | 65.4%), Black / African American (512 | 33.4%), and Hispanic or Latino (11 | 0.7%).
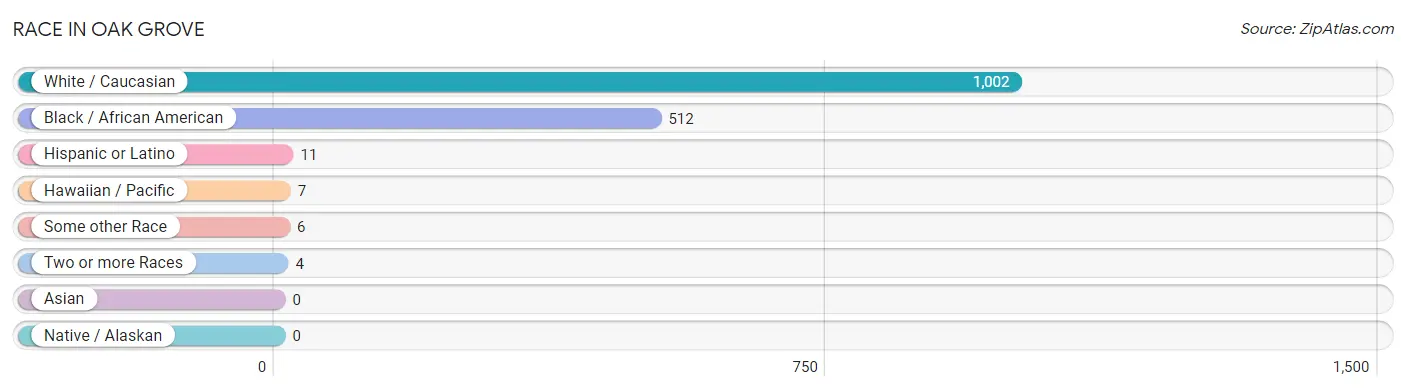
| Race | # Population | % Population |
| Asian | 0 | 0.0% |
| Black / African American | 512 | 33.4% |
| Hawaiian / Pacific | 7 | 0.5% |
| Hispanic or Latino | 11 | 0.7% |
| Native / Alaskan | 0 | 0.0% |
| White / Caucasian | 1,002 | 65.4% |
| Two or more Races | 4 | 0.3% |
| Some other Race | 6 | 0.4% |
| Total | 1,531 | 100.0% |
Ancestry in Oak Grove
The most populous ancestries reported in Oak Grove are Irish (336 | 22.0%), American (143 | 9.3%), English (63 | 4.1%), Italian (35 | 2.3%), and German (33 | 2.2%), together accounting for 39.8% of all Oak Grove residents.
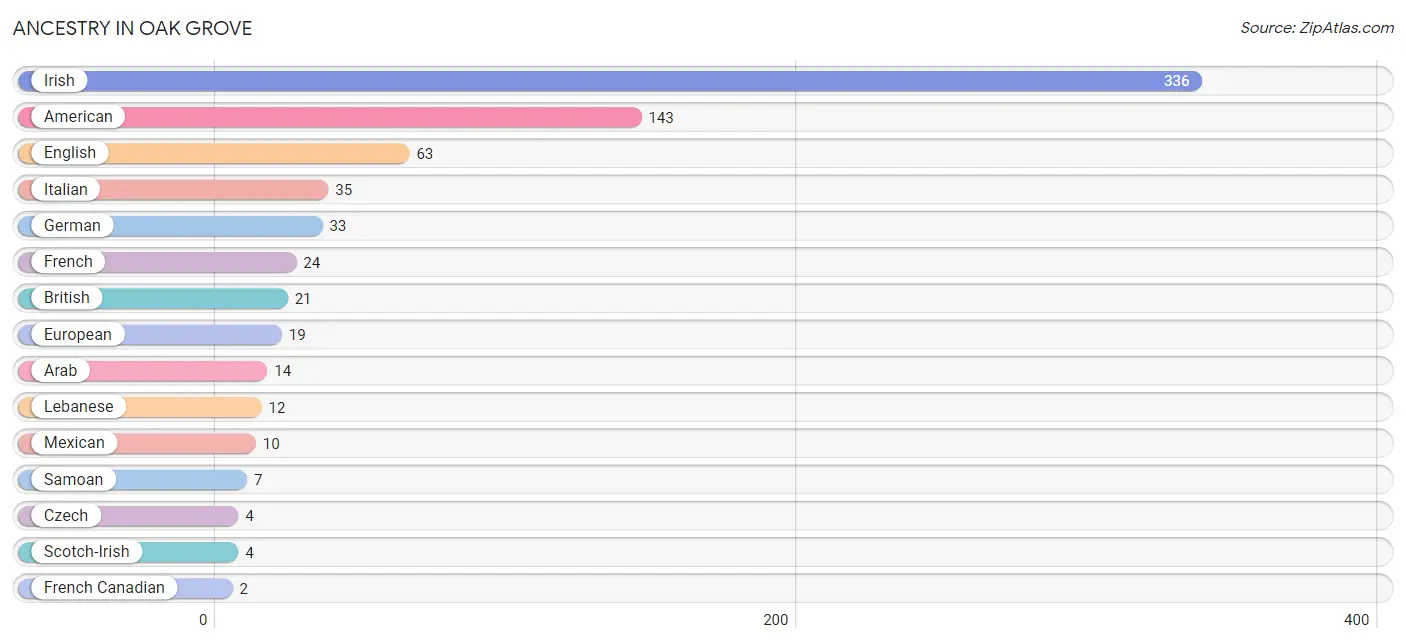
| Ancestry | # Population | % Population |
| American | 143 | 9.3% |
| Arab | 14 | 0.9% |
| British | 21 | 1.4% |
| Central American | 1 | 0.1% |
| Czech | 4 | 0.3% |
| English | 63 | 4.1% |
| European | 19 | 1.2% |
| French | 24 | 1.6% |
| French Canadian | 2 | 0.1% |
| German | 33 | 2.2% |
| Guatemalan | 1 | 0.1% |
| Irish | 336 | 22.0% |
| Italian | 35 | 2.3% |
| Lebanese | 12 | 0.8% |
| Mexican | 10 | 0.6% |
| Samoan | 7 | 0.5% |
| Scandinavian | 1 | 0.1% |
| Scotch-Irish | 4 | 0.3% |
| Swedish | 2 | 0.1% |
| Syrian | 2 | 0.1% | View All 20 Rows |
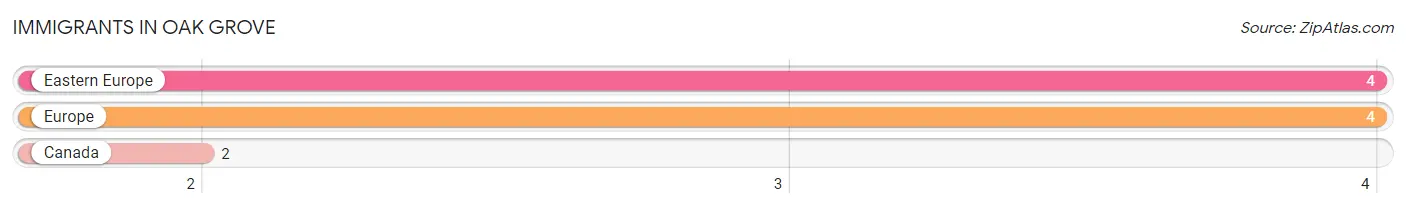
Immigrants in Oak Grove
The most numerous immigrant groups reported in Oak Grove came from Eastern Europe (4 | 0.3%), Europe (4 | 0.3%), and Canada (2 | 0.1%), together accounting for 0.6% of all Oak Grove residents.
| Immigration Origin | # Population | % Population |
| Canada | 2 | 0.1% |
| Eastern Europe | 4 | 0.3% |
| Europe | 4 | 0.3% | View All 3 Rows |
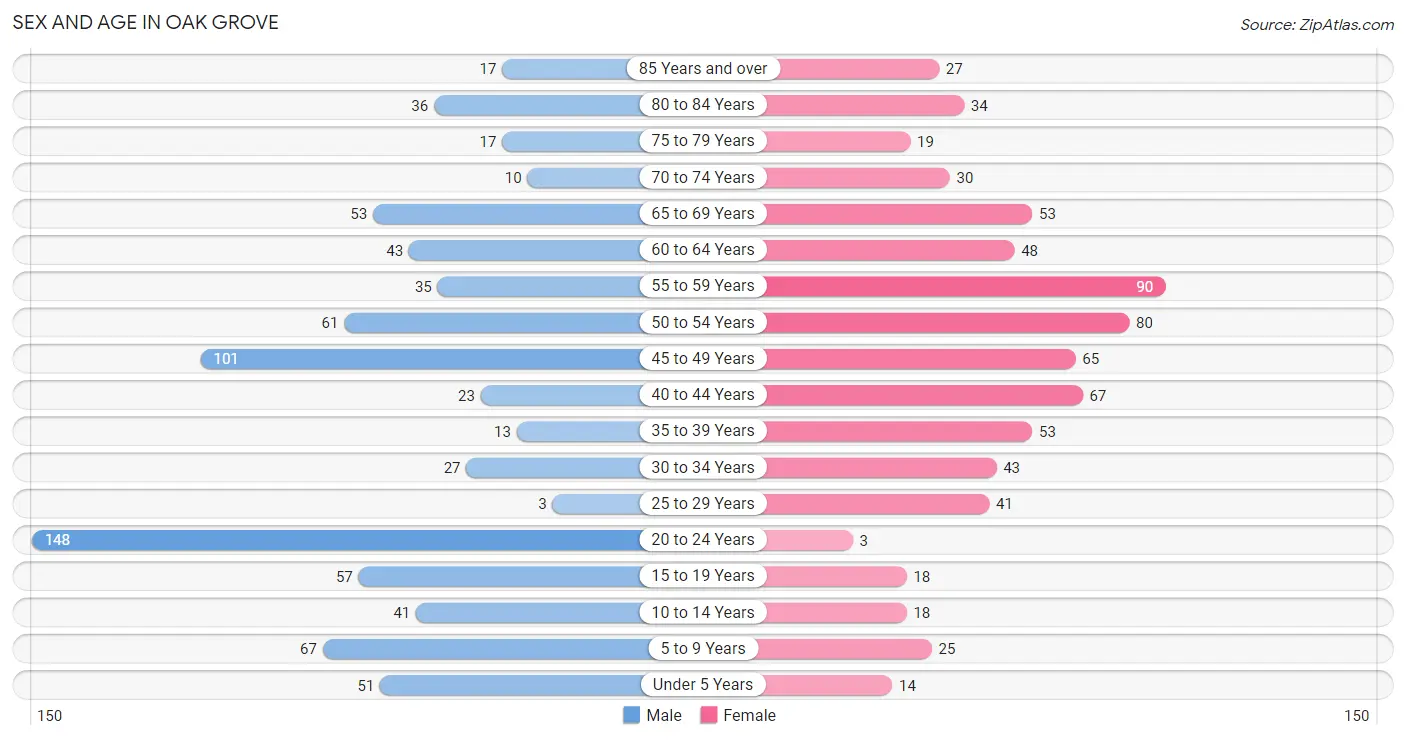
Sex and Age in Oak Grove
Sex and Age in Oak Grove
The most populous age groups in Oak Grove are 20 to 24 Years (148 | 18.4%) for men and 55 to 59 Years (90 | 12.4%) for women.
| Age Bracket | Male | Female |
| Under 5 Years | 51 (6.4%) | 14 (1.9%) |
| 5 to 9 Years | 67 (8.3%) | 25 (3.4%) |
| 10 to 14 Years | 41 (5.1%) | 18 (2.5%) |
| 15 to 19 Years | 57 (7.1%) | 18 (2.5%) |
| 20 to 24 Years | 148 (18.4%) | 3 (0.4%) |
| 25 to 29 Years | 3 (0.4%) | 41 (5.6%) |
| 30 to 34 Years | 27 (3.4%) | 43 (5.9%) |
| 35 to 39 Years | 13 (1.6%) | 53 (7.3%) |
| 40 to 44 Years | 23 (2.9%) | 67 (9.2%) |
| 45 to 49 Years | 101 (12.6%) | 65 (8.9%) |
| 50 to 54 Years | 61 (7.6%) | 80 (11.0%) |
| 55 to 59 Years | 35 (4.4%) | 90 (12.4%) |
| 60 to 64 Years | 43 (5.3%) | 48 (6.6%) |
| 65 to 69 Years | 53 (6.6%) | 53 (7.3%) |
| 70 to 74 Years | 10 (1.3%) | 30 (4.1%) |
| 75 to 79 Years | 17 (2.1%) | 19 (2.6%) |
| 80 to 84 Years | 36 (4.5%) | 34 (4.7%) |
| 85 Years and over | 17 (2.1%) | 27 (3.7%) |
| Total | 803 (100.0%) | 728 (100.0%) |
Families and Households in Oak Grove
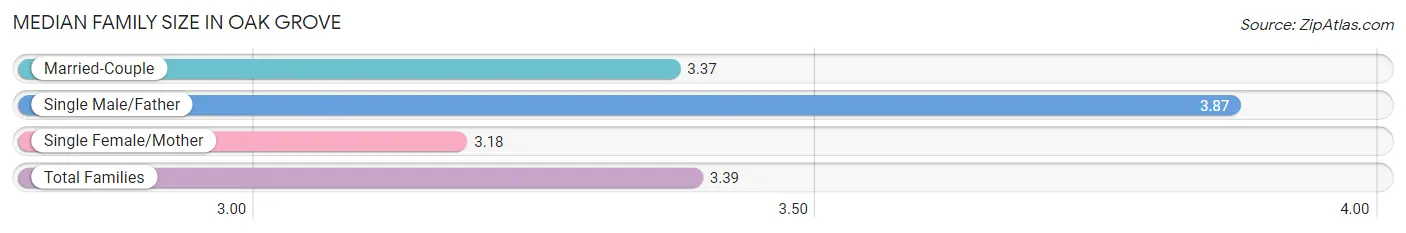
Median Family Size in Oak Grove
The median family size in Oak Grove is 3.39 persons per family, with single male/father families (38 | 11.1%) accounting for the largest median family size of 3.87 persons per family. On the other hand, single female/mother families (72 | 20.9%) represent the smallest median family size with 3.18 persons per family.
| Family Type | # Families | Family Size |
| Married-Couple | 234 (68.0%) | 3.37 |
| Single Male/Father | 38 (11.1%) | 3.87 |
| Single Female/Mother | 72 (20.9%) | 3.18 |
| Total Families | 344 (100.0%) | 3.39 |
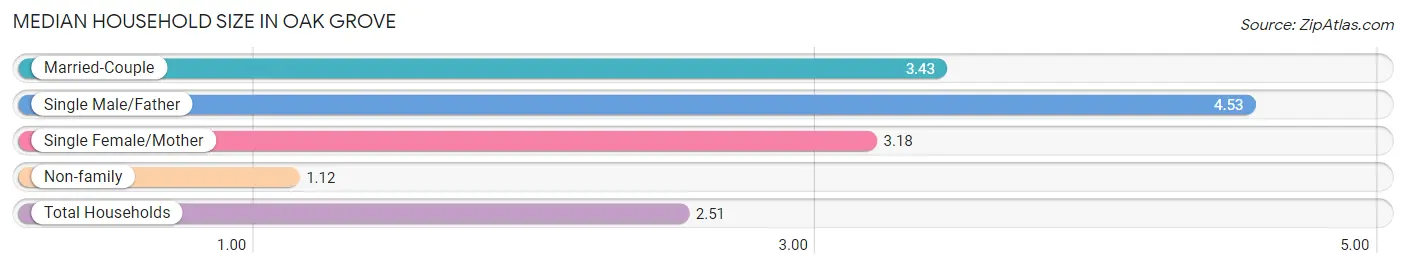
Median Household Size in Oak Grove
The median household size in Oak Grove is 2.51 persons per household, with single male/father households (38 | 6.5%) accounting for the largest median household size of 4.53 persons per household. non-family households (243 | 41.4%) represent the smallest median household size with 1.12 persons per household.
| Household Type | # Households | Household Size |
| Married-Couple | 234 (39.9%) | 3.43 |
| Single Male/Father | 38 (6.5%) | 4.53 |
| Single Female/Mother | 72 (12.3%) | 3.18 |
| Non-family | 243 (41.4%) | 1.12 |
| Total Households | 587 (100.0%) | 2.51 |
Household Size by Marriage Status in Oak Grove
Out of a total of 587 households in Oak Grove, 344 (58.6%) are family households, while 243 (41.4%) are nonfamily households. The most numerous type of family households are 2-person households, comprising 154, and the most common type of nonfamily households are 1-person households, comprising 217.
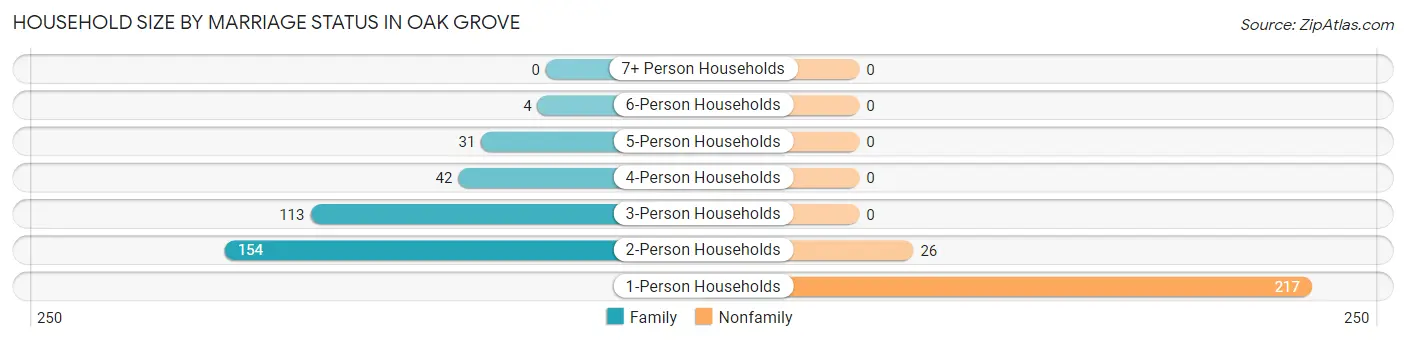
| Household Size | Family Households | Nonfamily Households |
| 1-Person Households | - | 217 (37.0%) |
| 2-Person Households | 154 (26.2%) | 26 (4.4%) |
| 3-Person Households | 113 (19.3%) | 0 (0.0%) |
| 4-Person Households | 42 (7.2%) | 0 (0.0%) |
| 5-Person Households | 31 (5.3%) | 0 (0.0%) |
| 6-Person Households | 4 (0.7%) | 0 (0.0%) |
| 7+ Person Households | 0 (0.0%) | 0 (0.0%) |
| Total | 344 (58.6%) | 243 (41.4%) |
Female Fertility in Oak Grove
Fertility by Age in Oak Grove
Average fertility rate in Oak Grove is 27.0 births per 1,000 women. Women in the age bracket of 20 to 34 years have the highest fertility rate with 46.0 births per 1,000 women. Women in the age bracket of 20 to 34 years acount for 50.0% of all women with births.
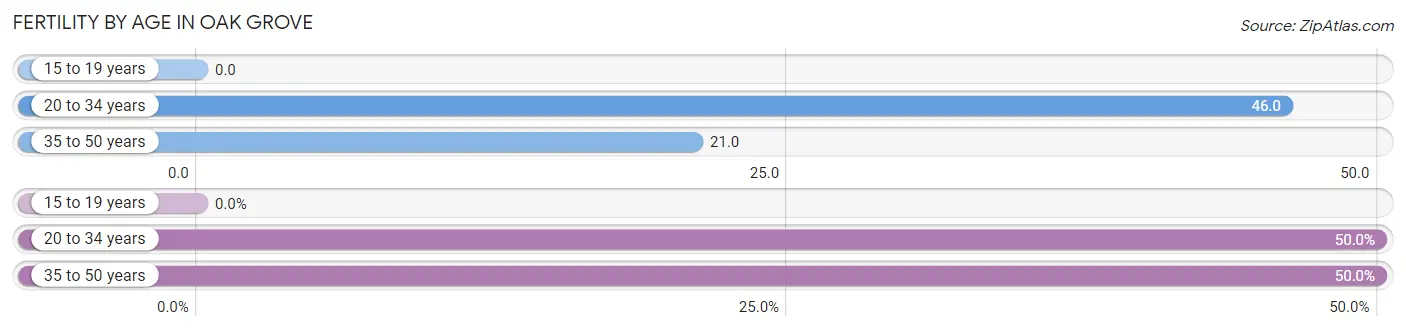
| Age Bracket | Women with Births | Births / 1,000 Women |
| 15 to 19 years | 0 (0.0%) | 0.0 |
| 20 to 34 years | 4 (50.0%) | 46.0 |
| 35 to 50 years | 4 (50.0%) | 21.0 |
| Total | 8 (100.0%) | 27.0 |
Fertility by Age by Marriage Status in Oak Grove
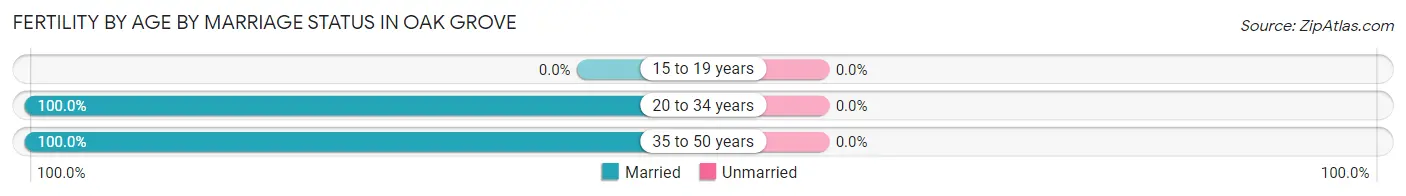
| Age Bracket | Married | Unmarried |
| 15 to 19 years | 0 (0.0%) | 0 (0.0%) |
| 20 to 34 years | 4 (100.0%) | 0 (0.0%) |
| 35 to 50 years | 4 (100.0%) | 0 (0.0%) |
| Total | 8 (100.0%) | 0 (0.0%) |
Fertility by Education in Oak Grove
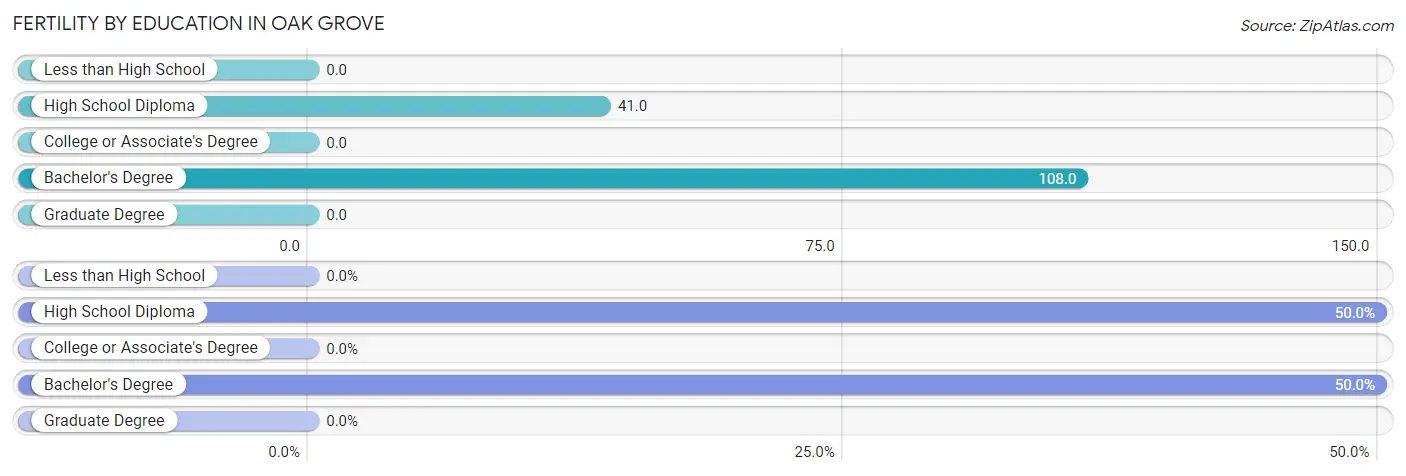
| Educational Attainment | Women with Births | Births / 1,000 Women |
| Less than High School | 0 (0.0%) | 0.0 |
| High School Diploma | 4 (50.0%) | 41.0 |
| College or Associate's Degree | 0 (0.0%) | 0.0 |
| Bachelor's Degree | 4 (50.0%) | 108.0 |
| Graduate Degree | 0 (0.0%) | 0.0 |
| Total | 8 (100.0%) | 27.0 |
Fertility by Education by Marriage Status in Oak Grove
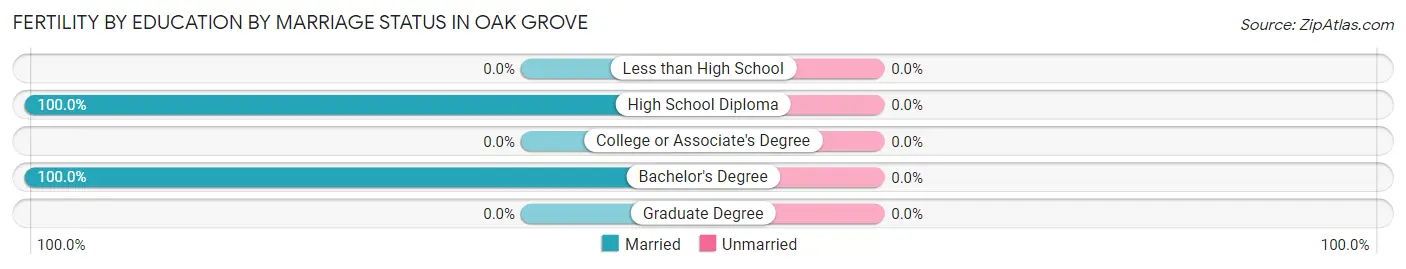
| Educational Attainment | Married | Unmarried |
| Less than High School | 0 (0.0%) | 0 (0.0%) |
| High School Diploma | 4 (100.0%) | 0 (0.0%) |
| College or Associate's Degree | 0 (0.0%) | 0 (0.0%) |
| Bachelor's Degree | 4 (100.0%) | 0 (0.0%) |
| Graduate Degree | 0 (0.0%) | 0 (0.0%) |
| Total | 8 (100.0%) | 0 (0.0%) |
Employment Characteristics in Oak Grove
Employment by Class of Employer in Oak Grove
Among the 563 employed individuals in Oak Grove, private company employees (362 | 64.3%), local government employees (108 | 19.2%), and self-employed (not incorporated) (46 | 8.2%) make up the most common classes of employment.
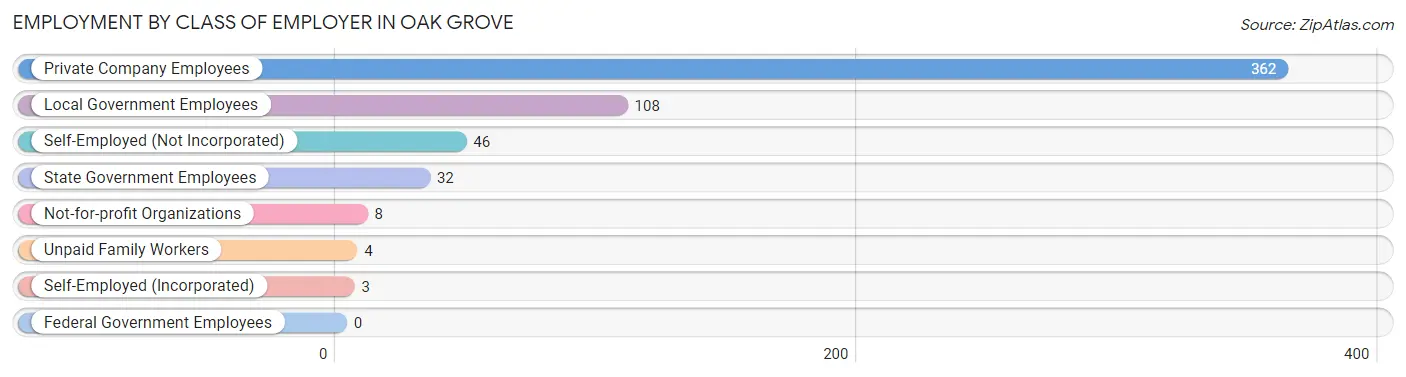
| Employer Class | # Employees | % Employees |
| Private Company Employees | 362 | 64.3% |
| Self-Employed (Incorporated) | 3 | 0.5% |
| Self-Employed (Not Incorporated) | 46 | 8.2% |
| Not-for-profit Organizations | 8 | 1.4% |
| Local Government Employees | 108 | 19.2% |
| State Government Employees | 32 | 5.7% |
| Federal Government Employees | 0 | 0.0% |
| Unpaid Family Workers | 4 | 0.7% |
| Total | 563 | 100.0% |
Employment Status by Age in Oak Grove
According to the labor force statistics for Oak Grove, out of the total population over 16 years of age (1,303), 43.7% or 569 individuals are in the labor force, with 1.1% or 6 of them unemployed. The age group with the highest labor force participation rate is 45 to 54 years, with 79.2% or 243 individuals in the labor force. Within the labor force, the 35 to 44 years age range has the highest percentage of unemployed individuals, with 7.5% or 4 of them being unemployed.
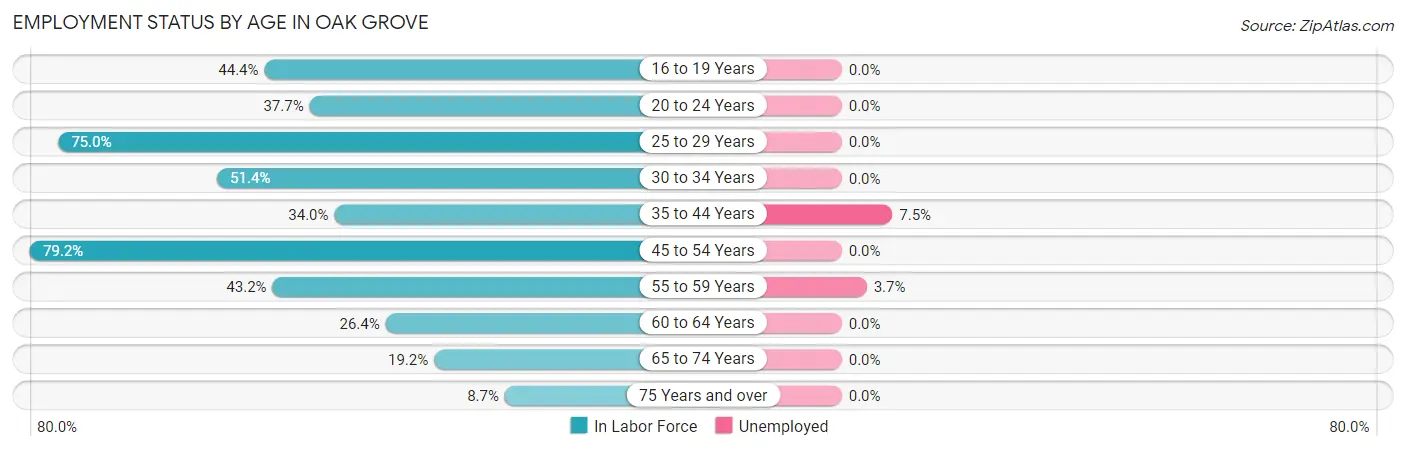
| Age Bracket | In Labor Force | Unemployed |
| 16 to 19 Years | 28 (44.4%) | 0 (0.0%) |
| 20 to 24 Years | 57 (37.7%) | 0 (0.0%) |
| 25 to 29 Years | 33 (75.0%) | 0 (0.0%) |
| 30 to 34 Years | 36 (51.4%) | 0 (0.0%) |
| 35 to 44 Years | 53 (34.0%) | 4 (7.5%) |
| 45 to 54 Years | 243 (79.2%) | 0 (0.0%) |
| 55 to 59 Years | 54 (43.2%) | 2 (3.7%) |
| 60 to 64 Years | 24 (26.4%) | 0 (0.0%) |
| 65 to 74 Years | 28 (19.2%) | 0 (0.0%) |
| 75 Years and over | 13 (8.7%) | 0 (0.0%) |
| Total | 569 (43.7%) | 6 (1.1%) |
Employment Status by Educational Attainment in Oak Grove
According to labor force statistics for Oak Grove, 55.9% of individuals (443) out of the total population between 25 and 64 years of age (793) are in the labor force, with 1.4% or 6 of them being unemployed. The group with the highest labor force participation rate are those with the educational attainment of bachelor's degree or higher, with 96.9% or 127 individuals in the labor force. Within the labor force, individuals with high school diploma education have the highest percentage of unemployment, with 2.1% or 4 of them being unemployed.
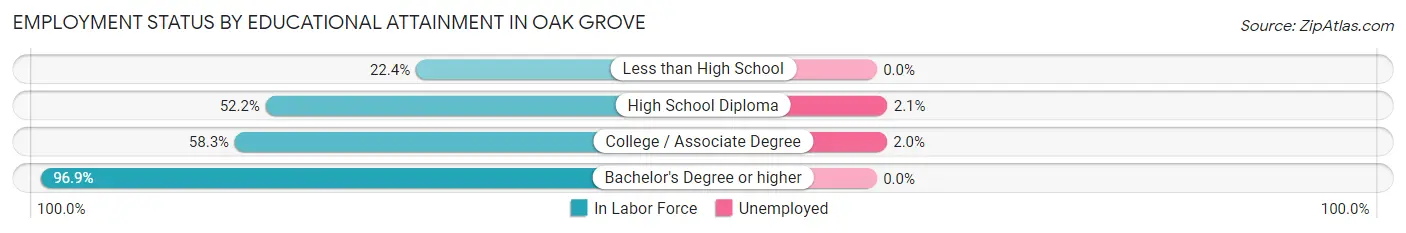
| Educational Attainment | In Labor Force | Unemployed |
| Less than High School | 30 (22.4%) | 0 (0.0%) |
| High School Diploma | 188 (52.2%) | 8 (2.1%) |
| College / Associate Degree | 98 (58.3%) | 3 (2.0%) |
| Bachelor's Degree or higher | 127 (96.9%) | 0 (0.0%) |
| Total | 443 (55.9%) | 11 (1.4%) |
Employment Occupations by Sex in Oak Grove
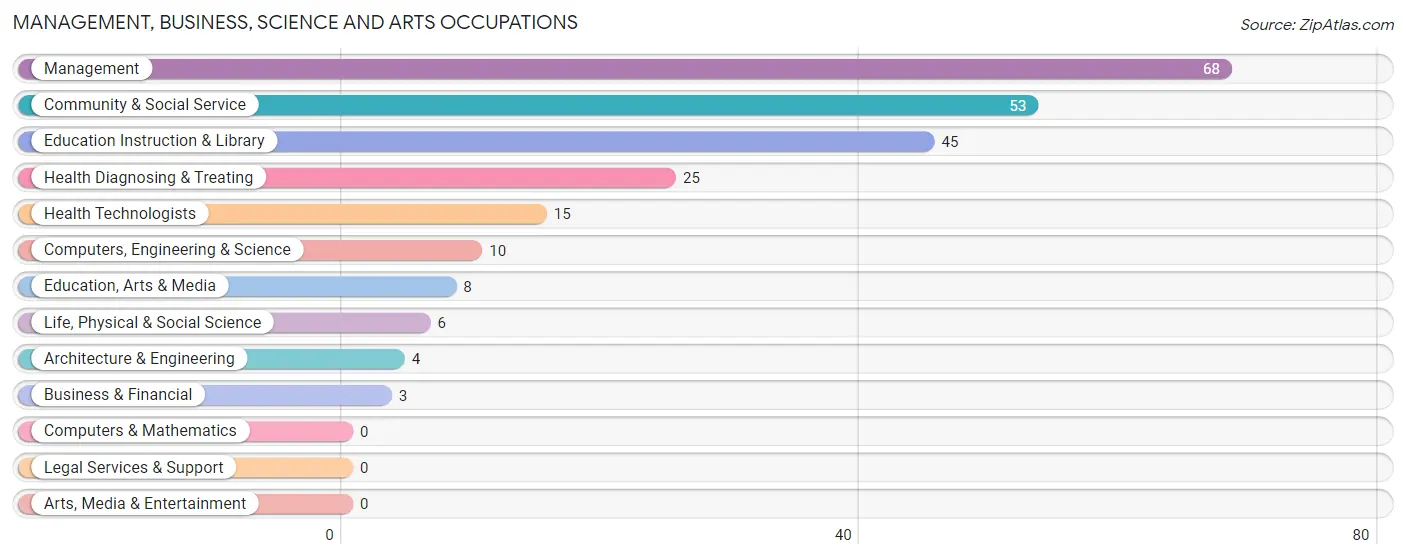
Management, Business, Science and Arts Occupations
The most common Management, Business, Science and Arts occupations in Oak Grove are Management (68 | 12.1%), Community & Social Service (53 | 9.4%), Education Instruction & Library (45 | 8.0%), Health Diagnosing & Treating (25 | 4.4%), and Health Technologists (15 | 2.7%).
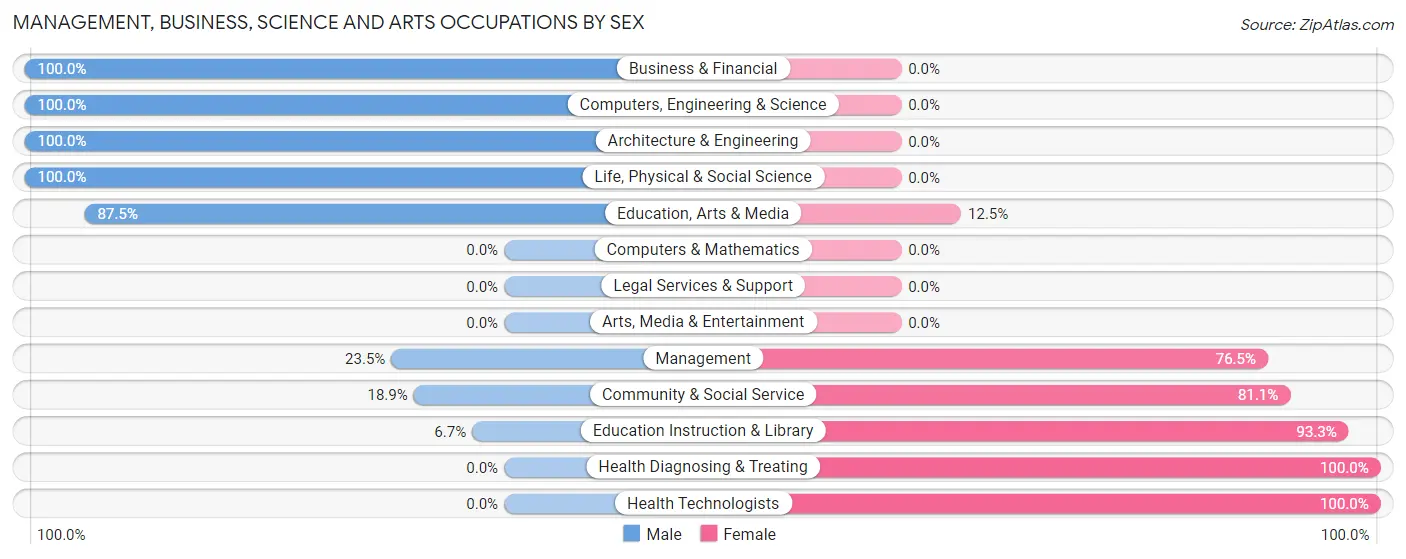
Management, Business, Science and Arts Occupations by Sex
Within the Management, Business, Science and Arts occupations in Oak Grove, the most male-oriented occupations are Business & Financial (100.0%), Computers, Engineering & Science (100.0%), and Architecture & Engineering (100.0%), while the most female-oriented occupations are Health Diagnosing & Treating (100.0%), Health Technologists (100.0%), and Education Instruction & Library (93.3%).
| Occupation | Male | Female |
| Management | 16 (23.5%) | 52 (76.5%) |
| Business & Financial | 3 (100.0%) | 0 (0.0%) |
| Computers, Engineering & Science | 10 (100.0%) | 0 (0.0%) |
| Computers & Mathematics | 0 (0.0%) | 0 (0.0%) |
| Architecture & Engineering | 4 (100.0%) | 0 (0.0%) |
| Life, Physical & Social Science | 6 (100.0%) | 0 (0.0%) |
| Community & Social Service | 10 (18.9%) | 43 (81.1%) |
| Education, Arts & Media | 7 (87.5%) | 1 (12.5%) |
| Legal Services & Support | 0 (0.0%) | 0 (0.0%) |
| Education Instruction & Library | 3 (6.7%) | 42 (93.3%) |
| Arts, Media & Entertainment | 0 (0.0%) | 0 (0.0%) |
| Health Diagnosing & Treating | 0 (0.0%) | 25 (100.0%) |
| Health Technologists | 0 (0.0%) | 15 (100.0%) |
| Total (Category) | 39 (24.5%) | 120 (75.5%) |
| Total (Overall) | 294 (52.2%) | 269 (47.8%) |
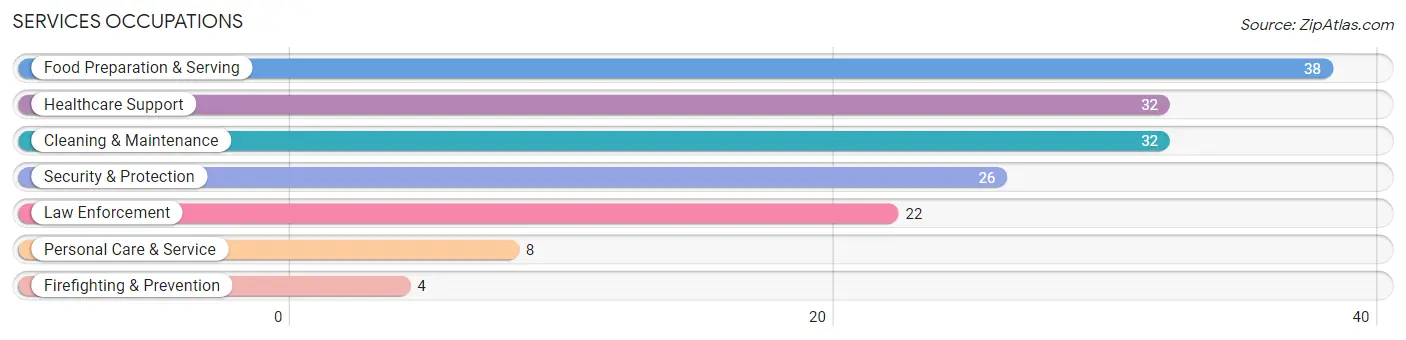
Services Occupations
The most common Services occupations in Oak Grove are Food Preparation & Serving (38 | 6.8%), Healthcare Support (32 | 5.7%), Cleaning & Maintenance (32 | 5.7%), Security & Protection (26 | 4.6%), and Law Enforcement (22 | 3.9%).
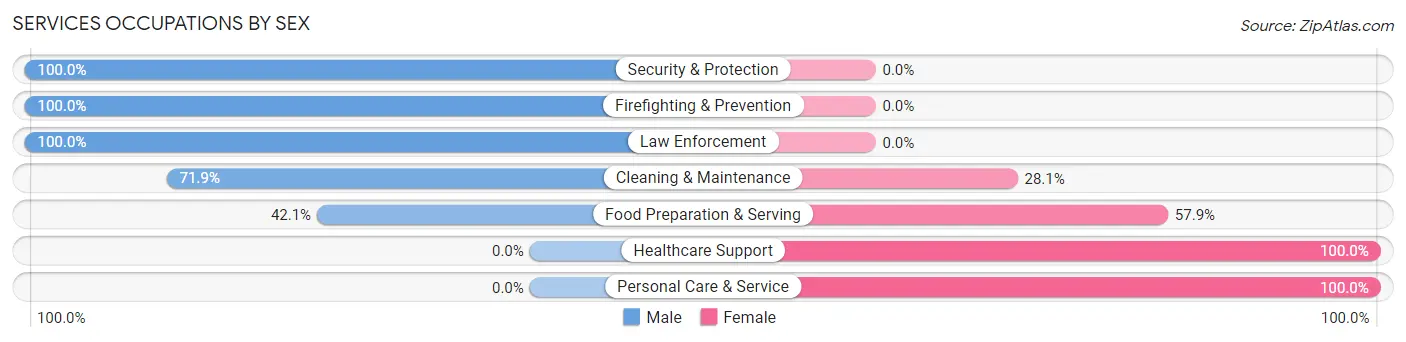
Services Occupations by Sex
Within the Services occupations in Oak Grove, the most male-oriented occupations are Security & Protection (100.0%), Firefighting & Prevention (100.0%), and Law Enforcement (100.0%), while the most female-oriented occupations are Healthcare Support (100.0%), Personal Care & Service (100.0%), and Food Preparation & Serving (57.9%).
| Occupation | Male | Female |
| Healthcare Support | 0 (0.0%) | 32 (100.0%) |
| Security & Protection | 26 (100.0%) | 0 (0.0%) |
| Firefighting & Prevention | 4 (100.0%) | 0 (0.0%) |
| Law Enforcement | 22 (100.0%) | 0 (0.0%) |
| Food Preparation & Serving | 16 (42.1%) | 22 (57.9%) |
| Cleaning & Maintenance | 23 (71.9%) | 9 (28.1%) |
| Personal Care & Service | 0 (0.0%) | 8 (100.0%) |
| Total (Category) | 65 (47.8%) | 71 (52.2%) |
| Total (Overall) | 294 (52.2%) | 269 (47.8%) |
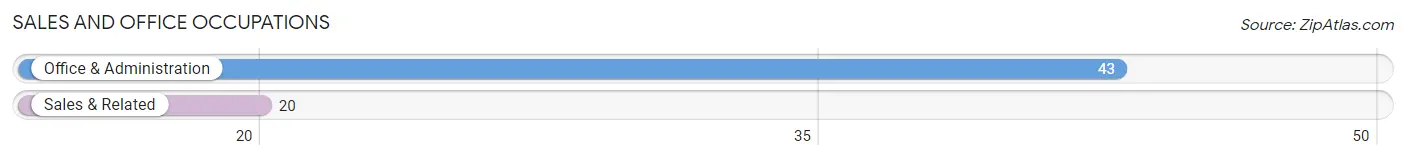
Sales and Office Occupations
The most common Sales and Office occupations in Oak Grove are Office & Administration (43 | 7.6%), and Sales & Related (20 | 3.5%).
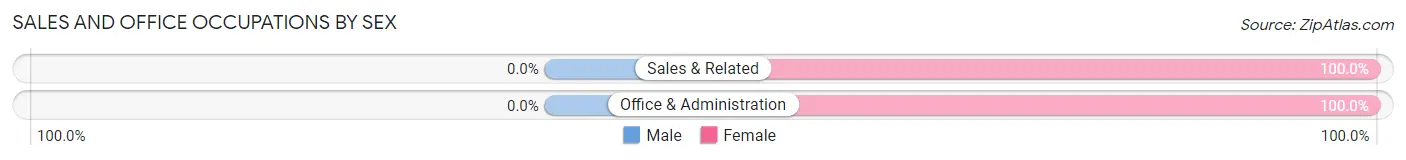
Sales and Office Occupations by Sex
| Occupation | Male | Female |
| Sales & Related | 0 (0.0%) | 20 (100.0%) |
| Office & Administration | 0 (0.0%) | 43 (100.0%) |
| Total (Category) | 0 (0.0%) | 63 (100.0%) |
| Total (Overall) | 294 (52.2%) | 269 (47.8%) |
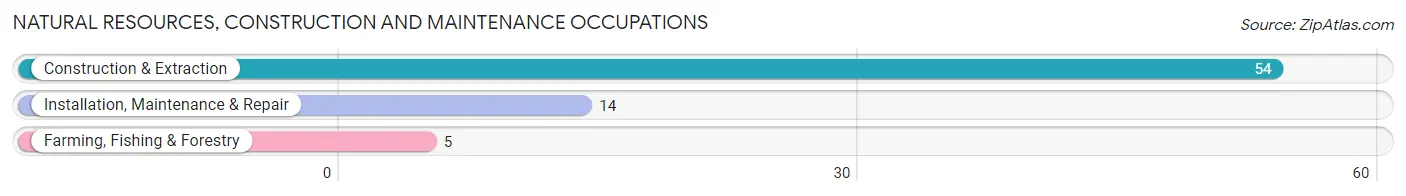
Natural Resources, Construction and Maintenance Occupations
The most common Natural Resources, Construction and Maintenance occupations in Oak Grove are Construction & Extraction (54 | 9.6%), Installation, Maintenance & Repair (14 | 2.5%), and Farming, Fishing & Forestry (5 | 0.9%).
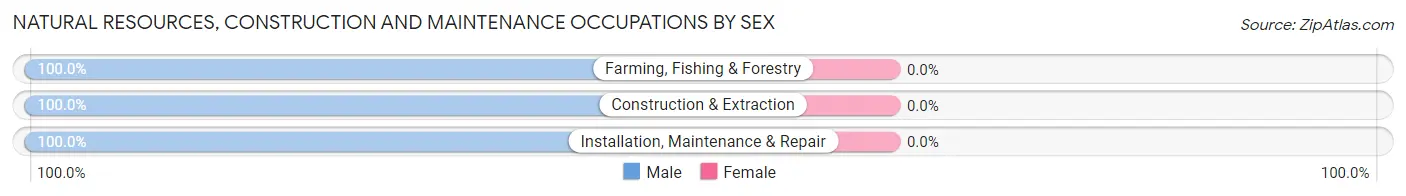
Natural Resources, Construction and Maintenance Occupations by Sex
| Occupation | Male | Female |
| Farming, Fishing & Forestry | 5 (100.0%) | 0 (0.0%) |
| Construction & Extraction | 54 (100.0%) | 0 (0.0%) |
| Installation, Maintenance & Repair | 14 (100.0%) | 0 (0.0%) |
| Total (Category) | 73 (100.0%) | 0 (0.0%) |
| Total (Overall) | 294 (52.2%) | 269 (47.8%) |
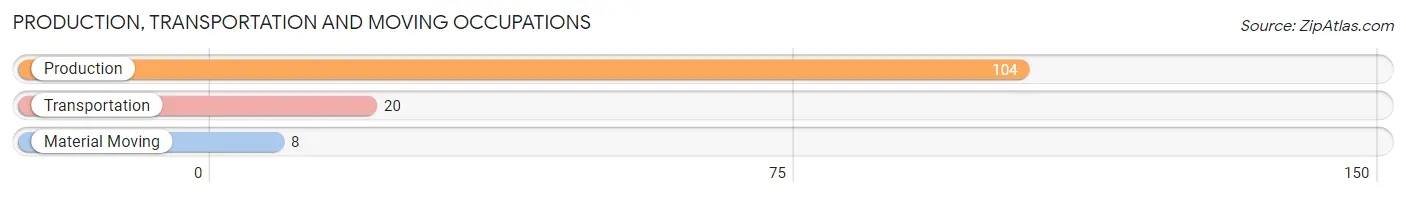
Production, Transportation and Moving Occupations
The most common Production, Transportation and Moving occupations in Oak Grove are Production (104 | 18.5%), Transportation (20 | 3.5%), and Material Moving (8 | 1.4%).
Production, Transportation and Moving Occupations by Sex
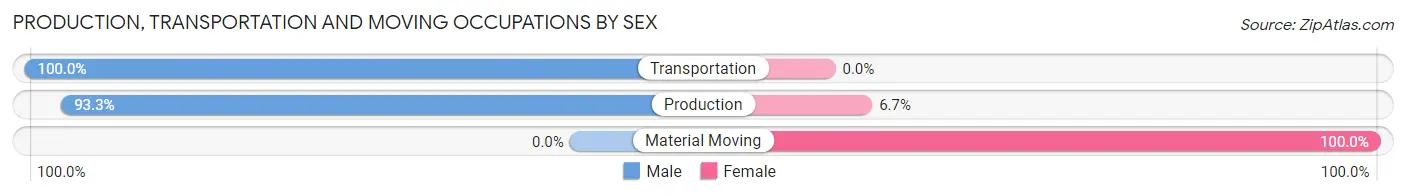
| Occupation | Male | Female |
| Production | 97 (93.3%) | 7 (6.7%) |
| Transportation | 20 (100.0%) | 0 (0.0%) |
| Material Moving | 0 (0.0%) | 8 (100.0%) |
| Total (Category) | 117 (88.6%) | 15 (11.4%) |
| Total (Overall) | 294 (52.2%) | 269 (47.8%) |
Employment Industries by Sex in Oak Grove
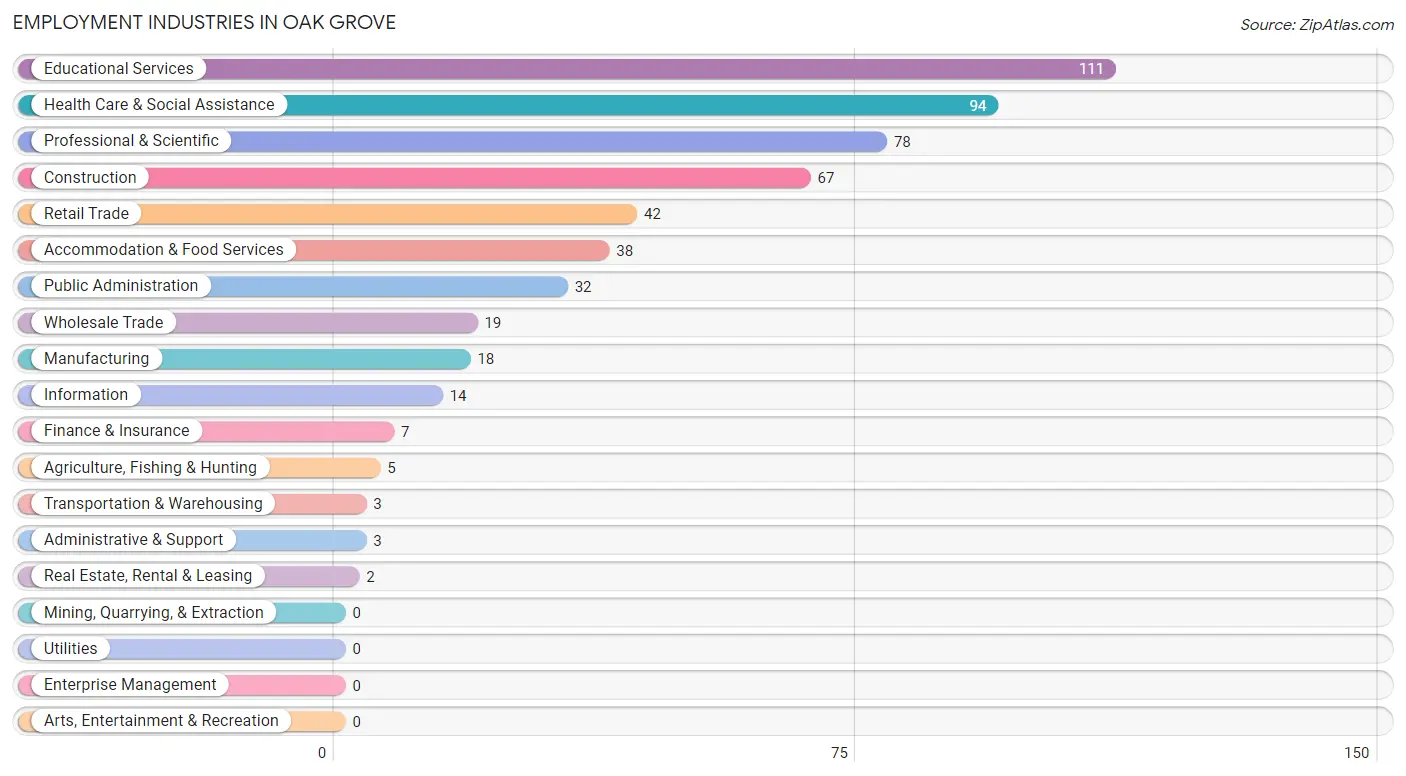
Employment Industries in Oak Grove
The major employment industries in Oak Grove include Educational Services (111 | 19.7%), Health Care & Social Assistance (94 | 16.7%), Professional & Scientific (78 | 13.9%), Construction (67 | 11.9%), and Retail Trade (42 | 7.5%).
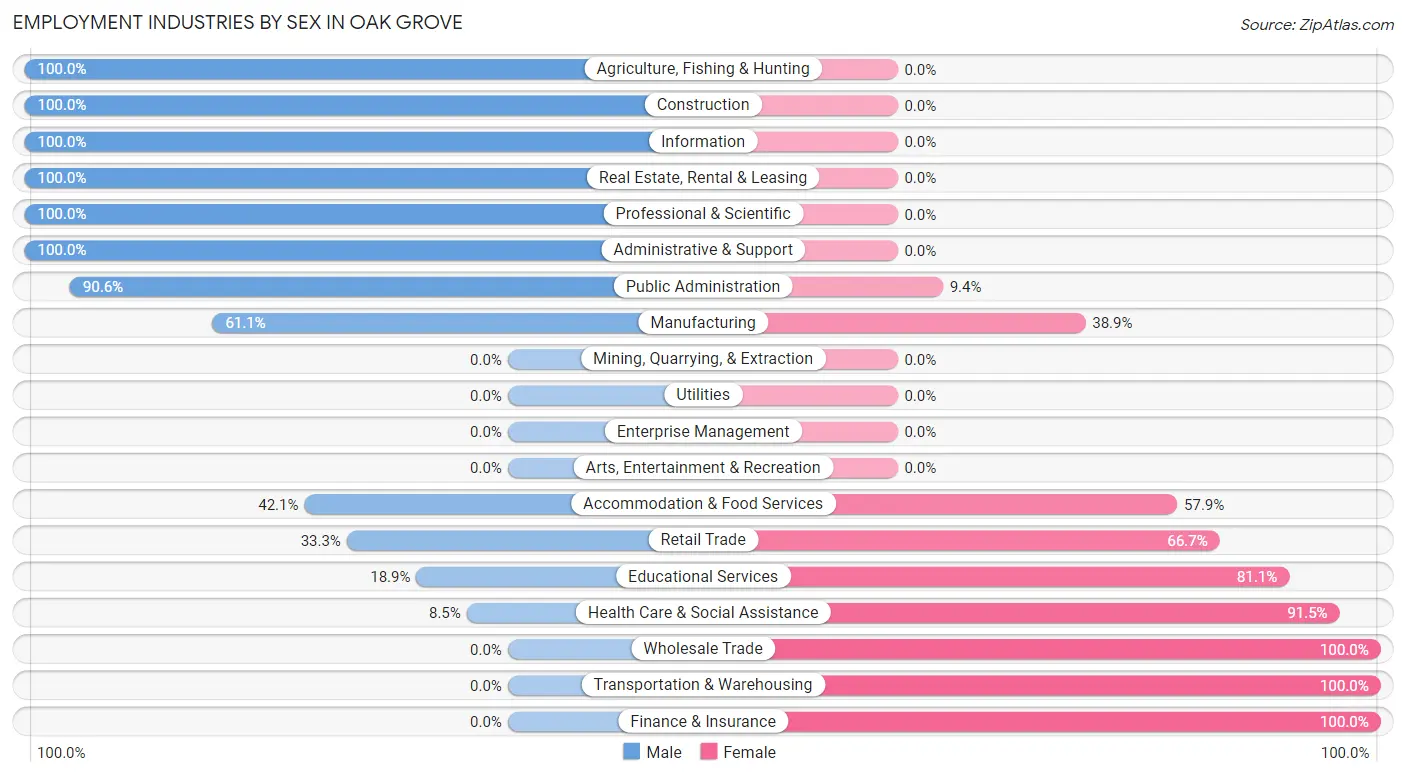
Employment Industries by Sex in Oak Grove
The Oak Grove industries that see more men than women are Agriculture, Fishing & Hunting (100.0%), Construction (100.0%), and Information (100.0%), whereas the industries that tend to have a higher number of women are Wholesale Trade (100.0%), Transportation & Warehousing (100.0%), and Finance & Insurance (100.0%).
| Industry | Male | Female |
| Agriculture, Fishing & Hunting | 5 (100.0%) | 0 (0.0%) |
| Mining, Quarrying, & Extraction | 0 (0.0%) | 0 (0.0%) |
| Construction | 67 (100.0%) | 0 (0.0%) |
| Manufacturing | 11 (61.1%) | 7 (38.9%) |
| Wholesale Trade | 0 (0.0%) | 19 (100.0%) |
| Retail Trade | 14 (33.3%) | 28 (66.7%) |
| Transportation & Warehousing | 0 (0.0%) | 3 (100.0%) |
| Utilities | 0 (0.0%) | 0 (0.0%) |
| Information | 14 (100.0%) | 0 (0.0%) |
| Finance & Insurance | 0 (0.0%) | 7 (100.0%) |
| Real Estate, Rental & Leasing | 2 (100.0%) | 0 (0.0%) |
| Professional & Scientific | 78 (100.0%) | 0 (0.0%) |
| Enterprise Management | 0 (0.0%) | 0 (0.0%) |
| Administrative & Support | 3 (100.0%) | 0 (0.0%) |
| Educational Services | 21 (18.9%) | 90 (81.1%) |
| Health Care & Social Assistance | 8 (8.5%) | 86 (91.5%) |
| Arts, Entertainment & Recreation | 0 (0.0%) | 0 (0.0%) |
| Accommodation & Food Services | 16 (42.1%) | 22 (57.9%) |
| Public Administration | 29 (90.6%) | 3 (9.4%) |
| Total | 294 (52.2%) | 269 (47.8%) |
Education in Oak Grove
School Enrollment in Oak Grove
The most common levels of schooling among the 224 students in Oak Grove are nursery / preschool (68 | 30.4%), high school (52 | 23.2%), and elementary school (38 | 17.0%).
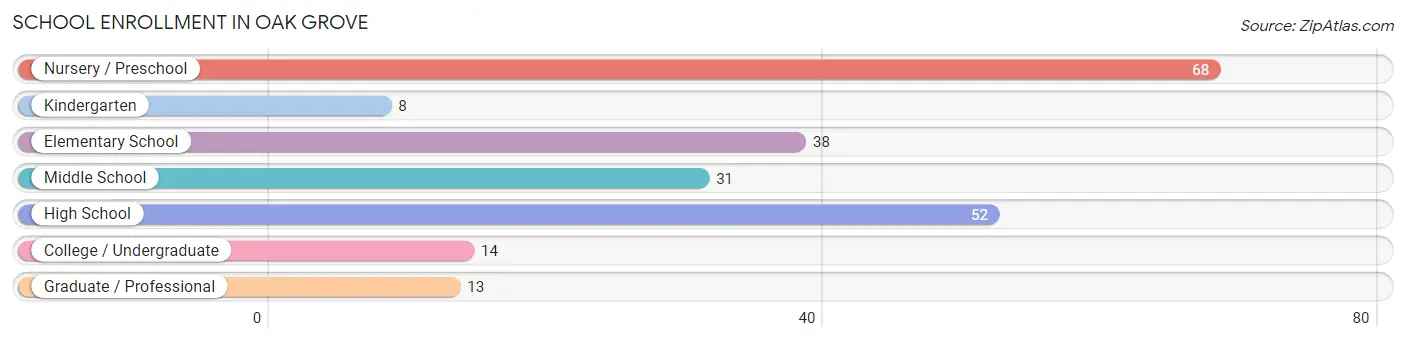
| School Level | # Students | % Students |
| Nursery / Preschool | 68 | 30.4% |
| Kindergarten | 8 | 3.6% |
| Elementary School | 38 | 17.0% |
| Middle School | 31 | 13.8% |
| High School | 52 | 23.2% |
| College / Undergraduate | 14 | 6.2% |
| Graduate / Professional | 13 | 5.8% |
| Total | 224 | 100.0% |
School Enrollment by Age by Funding Source in Oak Grove
Out of a total of 224 students who are enrolled in schools in Oak Grove, 41 (18.3%) attend a private institution, while the remaining 183 (81.7%) are enrolled in public schools. The age group of 3 to 4 year olds has the highest likelihood of being enrolled in private schools, with 40 (95.2% in the age bracket) enrolled. Conversely, the age group of 5 to 9 year old has the lowest likelihood of being enrolled in a private school, with 68 (100.0% in the age bracket) attending a public institution.
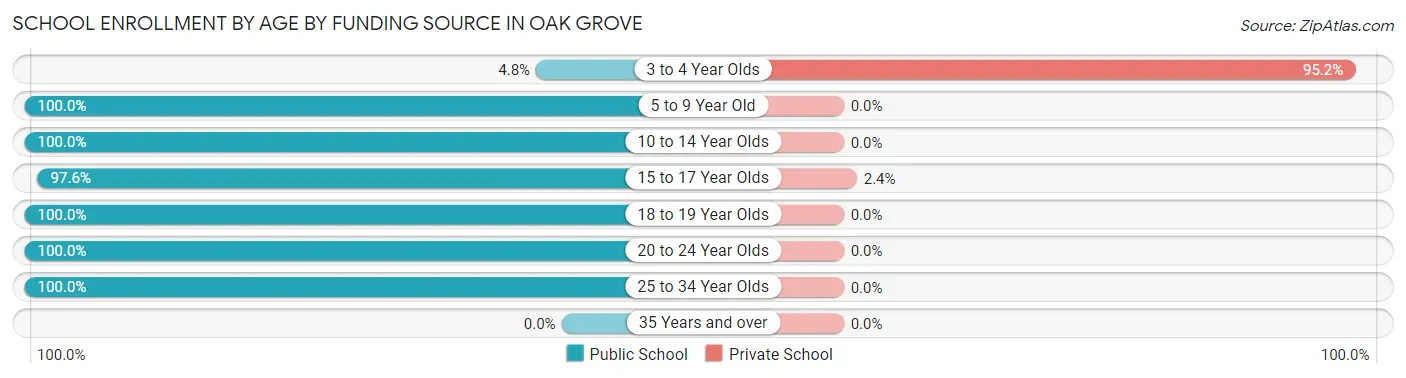
| Age Bracket | Public School | Private School |
| 3 to 4 Year Olds | 2 (4.8%) | 40 (95.2%) |
| 5 to 9 Year Old | 68 (100.0%) | 0 (0.0%) |
| 10 to 14 Year Olds | 40 (100.0%) | 0 (0.0%) |
| 15 to 17 Year Olds | 40 (97.6%) | 1 (2.4%) |
| 18 to 19 Year Olds | 6 (100.0%) | 0 (0.0%) |
| 20 to 24 Year Olds | 3 (100.0%) | 0 (0.0%) |
| 25 to 34 Year Olds | 24 (100.0%) | 0 (0.0%) |
| 35 Years and over | 0 (0.0%) | 0 (0.0%) |
| Total | 183 (81.7%) | 41 (18.3%) |
Educational Attainment by Field of Study in Oak Grove
Education (92 | 53.2%), science & technology (18 | 10.4%), business (17 | 9.8%), visual & performing arts (13 | 7.5%), and arts & humanities (13 | 7.5%) are the most common fields of study among 173 individuals in Oak Grove who have obtained a bachelor's degree or higher.
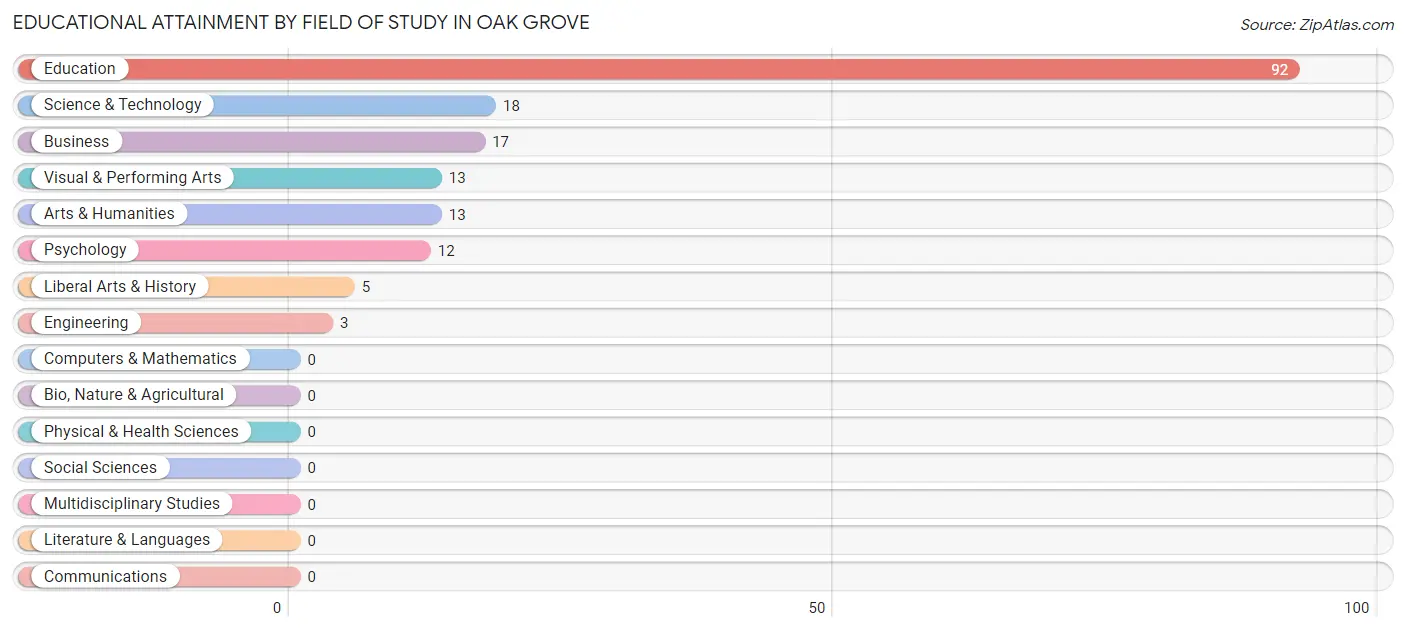
| Field of Study | # Graduates | % Graduates |
| Computers & Mathematics | 0 | 0.0% |
| Bio, Nature & Agricultural | 0 | 0.0% |
| Physical & Health Sciences | 0 | 0.0% |
| Psychology | 12 | 6.9% |
| Social Sciences | 0 | 0.0% |
| Engineering | 3 | 1.7% |
| Multidisciplinary Studies | 0 | 0.0% |
| Science & Technology | 18 | 10.4% |
| Business | 17 | 9.8% |
| Education | 92 | 53.2% |
| Literature & Languages | 0 | 0.0% |
| Liberal Arts & History | 5 | 2.9% |
| Visual & Performing Arts | 13 | 7.5% |
| Communications | 0 | 0.0% |
| Arts & Humanities | 13 | 7.5% |
| Total | 173 | 100.0% |
Transportation & Commute in Oak Grove
Vehicle Availability by Sex in Oak Grove
The most prevalent vehicle ownership categories in Oak Grove are males with 1 vehicle (132, accounting for 44.9%) and females with 1 vehicle (147, making up 49.1%).
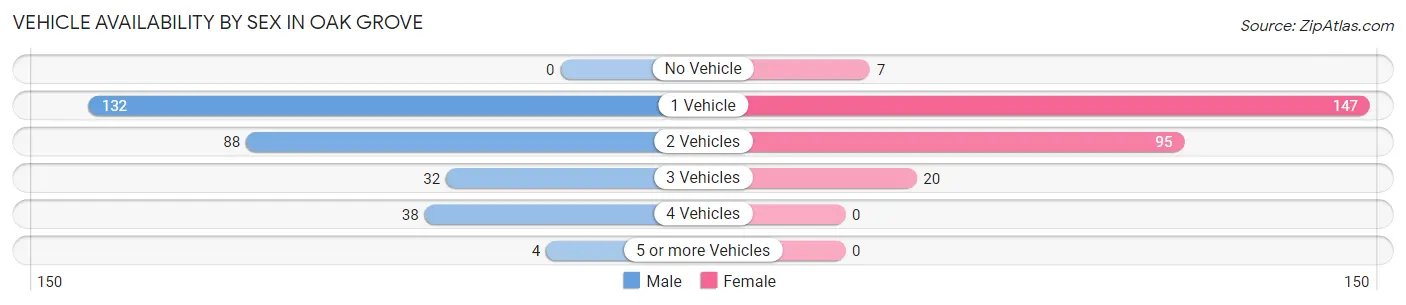
| Vehicles Available | Male | Female |
| No Vehicle | 0 (0.0%) | 7 (2.6%) |
| 1 Vehicle | 132 (44.9%) | 147 (54.6%) |
| 2 Vehicles | 88 (29.9%) | 95 (35.3%) |
| 3 Vehicles | 32 (10.9%) | 20 (7.4%) |
| 4 Vehicles | 38 (12.9%) | 0 (0.0%) |
| 5 or more Vehicles | 4 (1.4%) | 0 (0.0%) |
| Total | 294 (100.0%) | 269 (100.0%) |
Commute Time in Oak Grove
The most frequently occuring commute durations in Oak Grove are 30 to 34 minutes (163 commuters, 29.1%), 5 to 9 minutes (89 commuters, 15.9%), and less than 5 minutes (82 commuters, 14.6%).
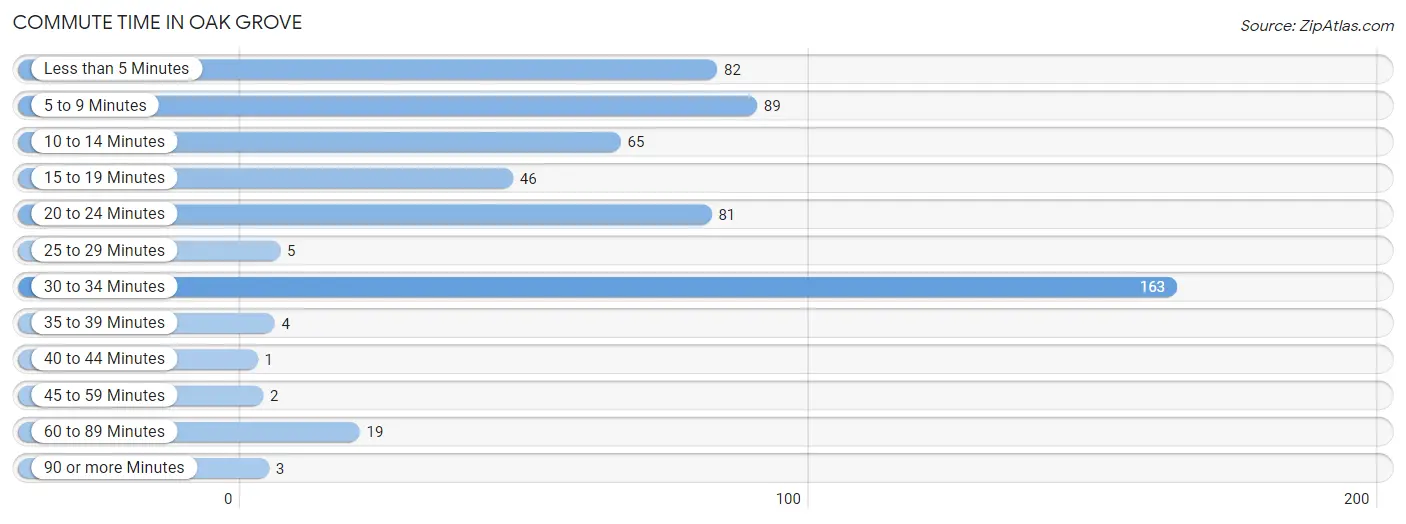
| Commute Time | # Commuters | % Commuters |
| Less than 5 Minutes | 82 | 14.6% |
| 5 to 9 Minutes | 89 | 15.9% |
| 10 to 14 Minutes | 65 | 11.6% |
| 15 to 19 Minutes | 46 | 8.2% |
| 20 to 24 Minutes | 81 | 14.5% |
| 25 to 29 Minutes | 5 | 0.9% |
| 30 to 34 Minutes | 163 | 29.1% |
| 35 to 39 Minutes | 4 | 0.7% |
| 40 to 44 Minutes | 1 | 0.2% |
| 45 to 59 Minutes | 2 | 0.4% |
| 60 to 89 Minutes | 19 | 3.4% |
| 90 or more Minutes | 3 | 0.5% |
Commute Time by Sex in Oak Grove
The most common commute times in Oak Grove are 30 to 34 minutes (98 commuters, 33.3%) for males and 30 to 34 minutes (65 commuters, 24.4%) for females.
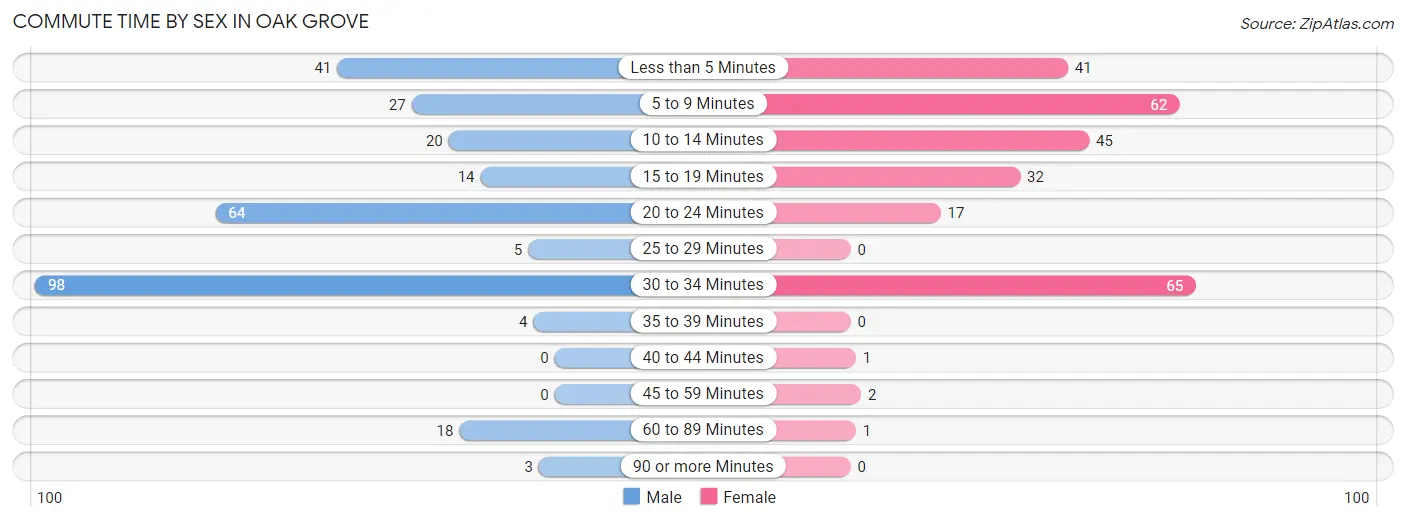
| Commute Time | Male | Female |
| Less than 5 Minutes | 41 (14.0%) | 41 (15.4%) |
| 5 to 9 Minutes | 27 (9.2%) | 62 (23.3%) |
| 10 to 14 Minutes | 20 (6.8%) | 45 (16.9%) |
| 15 to 19 Minutes | 14 (4.8%) | 32 (12.0%) |
| 20 to 24 Minutes | 64 (21.8%) | 17 (6.4%) |
| 25 to 29 Minutes | 5 (1.7%) | 0 (0.0%) |
| 30 to 34 Minutes | 98 (33.3%) | 65 (24.4%) |
| 35 to 39 Minutes | 4 (1.4%) | 0 (0.0%) |
| 40 to 44 Minutes | 0 (0.0%) | 1 (0.4%) |
| 45 to 59 Minutes | 0 (0.0%) | 2 (0.7%) |
| 60 to 89 Minutes | 18 (6.1%) | 1 (0.4%) |
| 90 or more Minutes | 3 (1.0%) | 0 (0.0%) |
Time of Departure to Work by Sex in Oak Grove
The most frequent times of departure to work in Oak Grove are 7:00 AM to 7:29 AM (103, 35.0%) for males and 7:30 AM to 7:59 AM (105, 39.5%) for females.
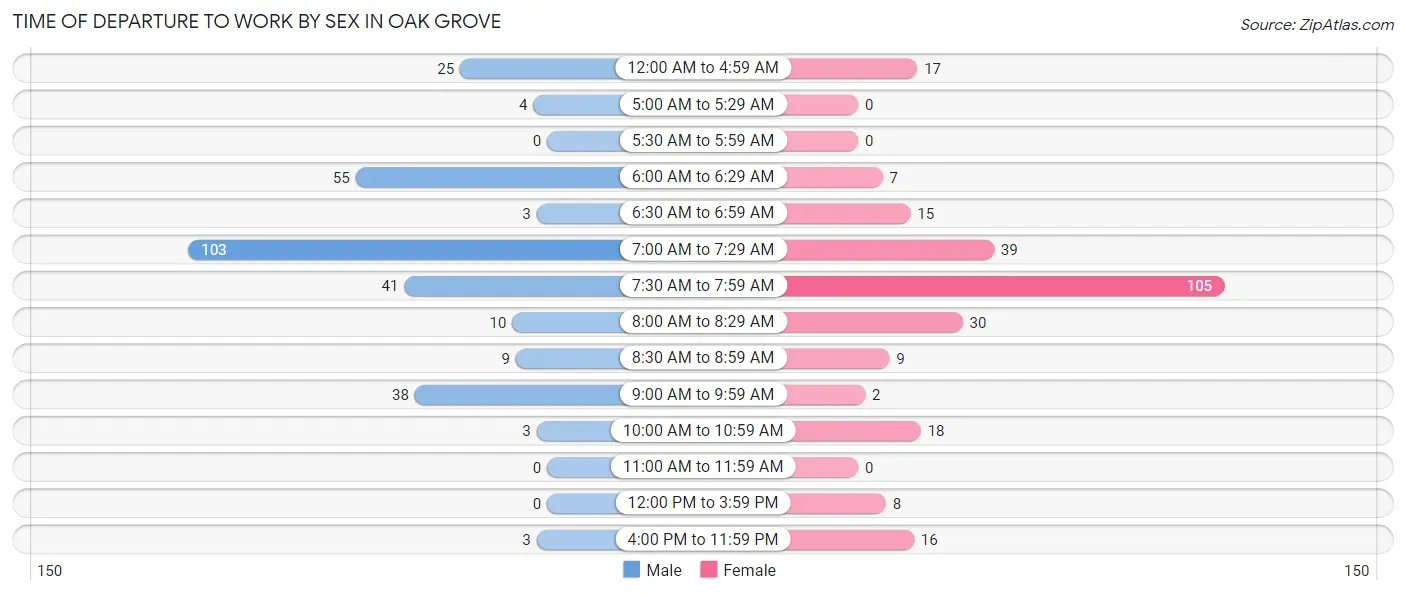
| Time of Departure | Male | Female |
| 12:00 AM to 4:59 AM | 25 (8.5%) | 17 (6.4%) |
| 5:00 AM to 5:29 AM | 4 (1.4%) | 0 (0.0%) |
| 5:30 AM to 5:59 AM | 0 (0.0%) | 0 (0.0%) |
| 6:00 AM to 6:29 AM | 55 (18.7%) | 7 (2.6%) |
| 6:30 AM to 6:59 AM | 3 (1.0%) | 15 (5.6%) |
| 7:00 AM to 7:29 AM | 103 (35.0%) | 39 (14.7%) |
| 7:30 AM to 7:59 AM | 41 (14.0%) | 105 (39.5%) |
| 8:00 AM to 8:29 AM | 10 (3.4%) | 30 (11.3%) |
| 8:30 AM to 8:59 AM | 9 (3.1%) | 9 (3.4%) |
| 9:00 AM to 9:59 AM | 38 (12.9%) | 2 (0.7%) |
| 10:00 AM to 10:59 AM | 3 (1.0%) | 18 (6.8%) |
| 11:00 AM to 11:59 AM | 0 (0.0%) | 0 (0.0%) |
| 12:00 PM to 3:59 PM | 0 (0.0%) | 8 (3.0%) |
| 4:00 PM to 11:59 PM | 3 (1.0%) | 16 (6.0%) |
| Total | 294 (100.0%) | 266 (100.0%) |
Housing Occupancy in Oak Grove
Occupancy by Ownership in Oak Grove
Of the total 587 dwellings in Oak Grove, owner-occupied units account for 347 (59.1%), while renter-occupied units make up 240 (40.9%).
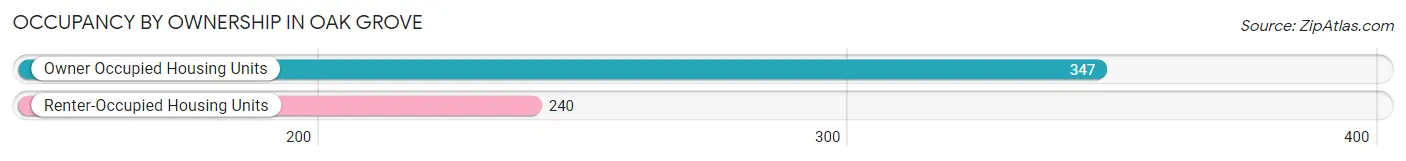
| Occupancy | # Housing Units | % Housing Units |
| Owner Occupied Housing Units | 347 | 59.1% |
| Renter-Occupied Housing Units | 240 | 40.9% |
| Total Occupied Housing Units | 587 | 100.0% |
Occupancy by Household Size in Oak Grove
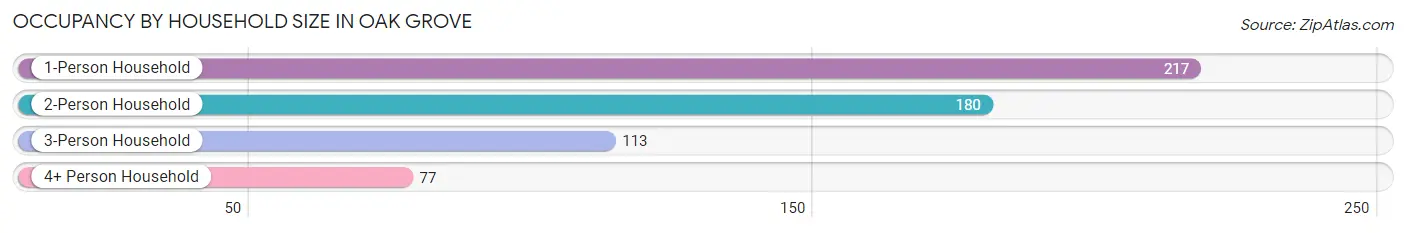
| Household Size | # Housing Units | % Housing Units |
| 1-Person Household | 217 | 37.0% |
| 2-Person Household | 180 | 30.7% |
| 3-Person Household | 113 | 19.3% |
| 4+ Person Household | 77 | 13.1% |
| Total Housing Units | 587 | 100.0% |
Occupancy by Ownership by Household Size in Oak Grove
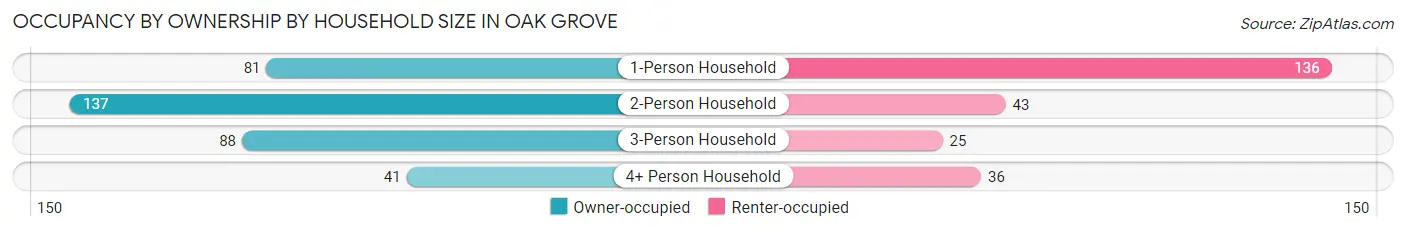
| Household Size | Owner-occupied | Renter-occupied |
| 1-Person Household | 81 (37.3%) | 136 (62.7%) |
| 2-Person Household | 137 (76.1%) | 43 (23.9%) |
| 3-Person Household | 88 (77.9%) | 25 (22.1%) |
| 4+ Person Household | 41 (53.2%) | 36 (46.8%) |
| Total Housing Units | 347 (59.1%) | 240 (40.9%) |
Occupancy by Educational Attainment in Oak Grove
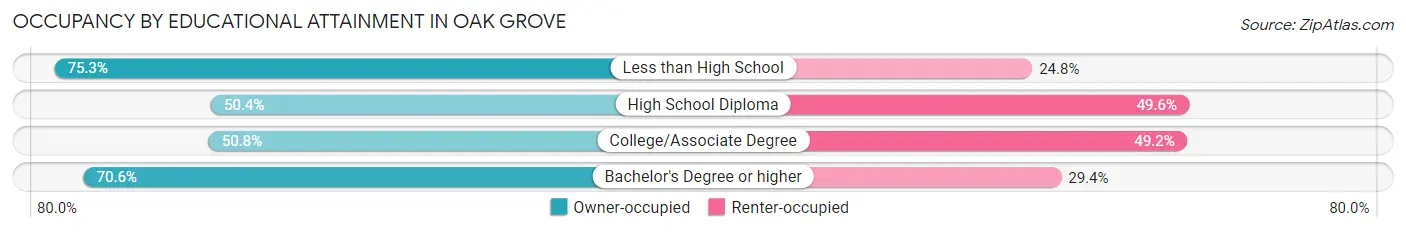
| Household Size | Owner-occupied | Renter-occupied |
| Less than High School | 76 (75.2%) | 25 (24.7%) |
| High School Diploma | 117 (50.4%) | 115 (49.6%) |
| College/Associate Degree | 65 (50.8%) | 63 (49.2%) |
| Bachelor's Degree or higher | 89 (70.6%) | 37 (29.4%) |
Occupancy by Age of Householder in Oak Grove
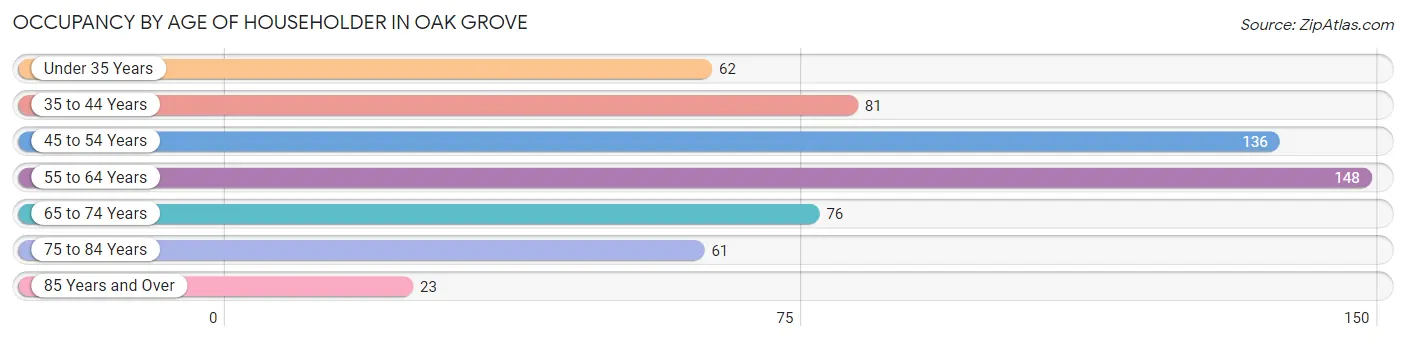
| Age Bracket | # Households | % Households |
| Under 35 Years | 62 | 10.6% |
| 35 to 44 Years | 81 | 13.8% |
| 45 to 54 Years | 136 | 23.2% |
| 55 to 64 Years | 148 | 25.2% |
| 65 to 74 Years | 76 | 13.0% |
| 75 to 84 Years | 61 | 10.4% |
| 85 Years and Over | 23 | 3.9% |
| Total | 587 | 100.0% |
Housing Finances in Oak Grove
Median Income by Occupancy in Oak Grove
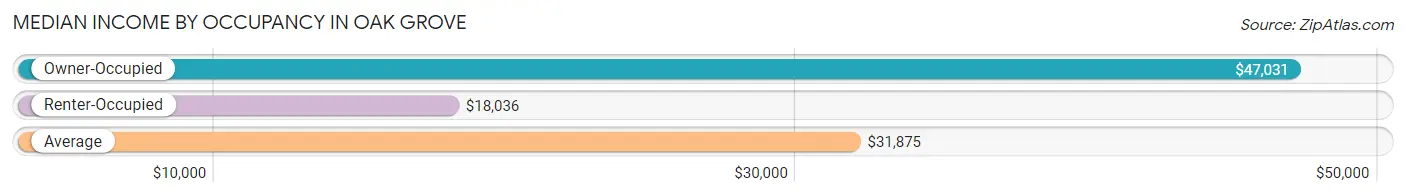
| Occupancy Type | # Households | Median Income |
| Owner-Occupied | 347 (59.1%) | $47,031 |
| Renter-Occupied | 240 (40.9%) | $18,036 |
| Average | 587 (100.0%) | $31,875 |
Occupancy by Householder Income Bracket in Oak Grove
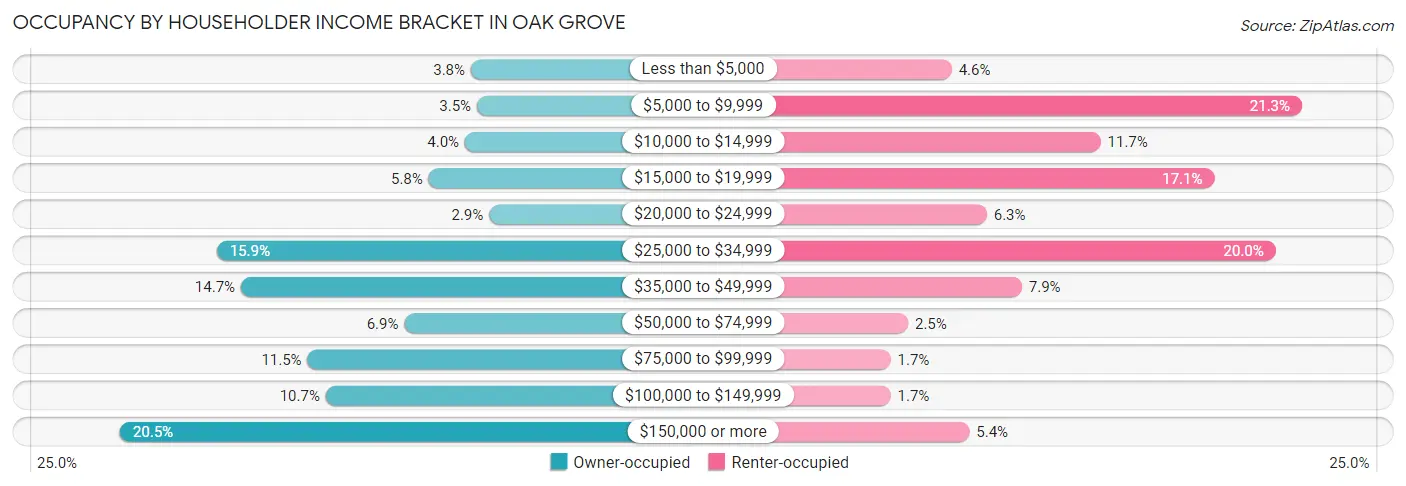
| Income Bracket | Owner-occupied | Renter-occupied |
| Less than $5,000 | 13 (3.7%) | 11 (4.6%) |
| $5,000 to $9,999 | 12 (3.5%) | 51 (21.2%) |
| $10,000 to $14,999 | 14 (4.0%) | 28 (11.7%) |
| $15,000 to $19,999 | 20 (5.8%) | 41 (17.1%) |
| $20,000 to $24,999 | 10 (2.9%) | 15 (6.2%) |
| $25,000 to $34,999 | 55 (15.9%) | 48 (20.0%) |
| $35,000 to $49,999 | 51 (14.7%) | 19 (7.9%) |
| $50,000 to $74,999 | 24 (6.9%) | 6 (2.5%) |
| $75,000 to $99,999 | 40 (11.5%) | 4 (1.7%) |
| $100,000 to $149,999 | 37 (10.7%) | 4 (1.7%) |
| $150,000 or more | 71 (20.5%) | 13 (5.4%) |
| Total | 347 (100.0%) | 240 (100.0%) |
Monthly Housing Cost Tiers in Oak Grove
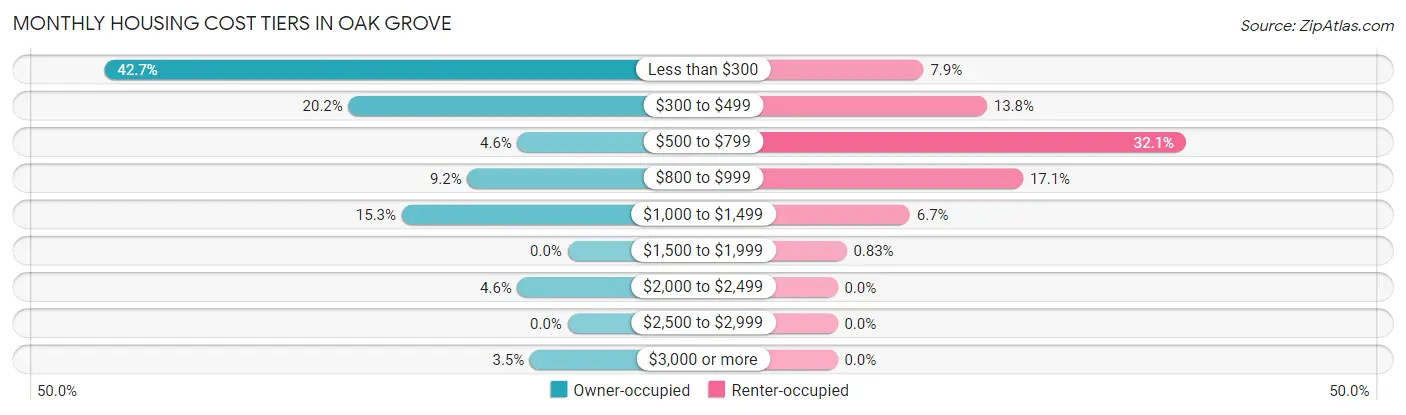
| Monthly Cost | Owner-occupied | Renter-occupied |
| Less than $300 | 148 (42.6%) | 19 (7.9%) |
| $300 to $499 | 70 (20.2%) | 33 (13.8%) |
| $500 to $799 | 16 (4.6%) | 77 (32.1%) |
| $800 to $999 | 32 (9.2%) | 41 (17.1%) |
| $1,000 to $1,499 | 53 (15.3%) | 16 (6.7%) |
| $1,500 to $1,999 | 0 (0.0%) | 2 (0.8%) |
| $2,000 to $2,499 | 16 (4.6%) | 0 (0.0%) |
| $2,500 to $2,999 | 0 (0.0%) | 0 (0.0%) |
| $3,000 or more | 12 (3.5%) | 0 (0.0%) |
| Total | 347 (100.0%) | 240 (100.0%) |
Physical Housing Characteristics in Oak Grove
Housing Structures in Oak Grove
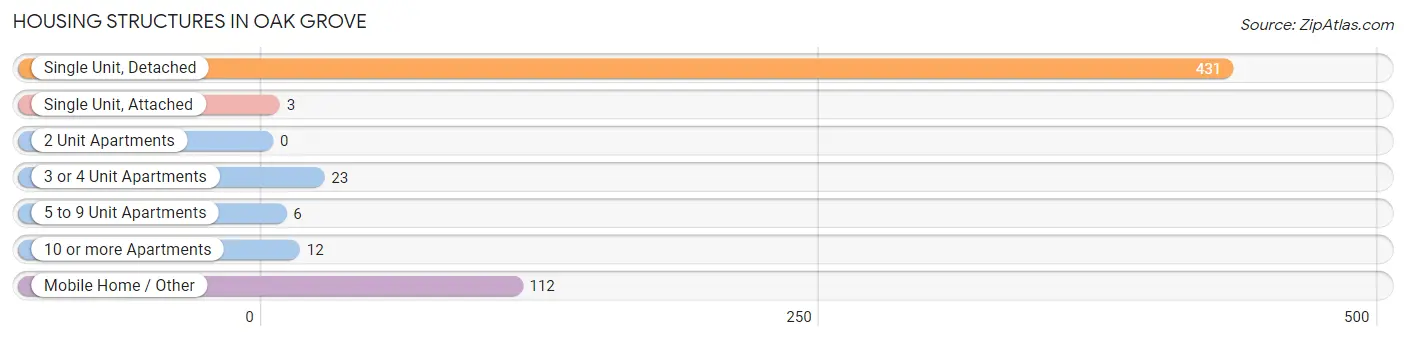
| Structure Type | # Housing Units | % Housing Units |
| Single Unit, Detached | 431 | 73.4% |
| Single Unit, Attached | 3 | 0.5% |
| 2 Unit Apartments | 0 | 0.0% |
| 3 or 4 Unit Apartments | 23 | 3.9% |
| 5 to 9 Unit Apartments | 6 | 1.0% |
| 10 or more Apartments | 12 | 2.0% |
| Mobile Home / Other | 112 | 19.1% |
| Total | 587 | 100.0% |
Housing Structures by Occupancy in Oak Grove
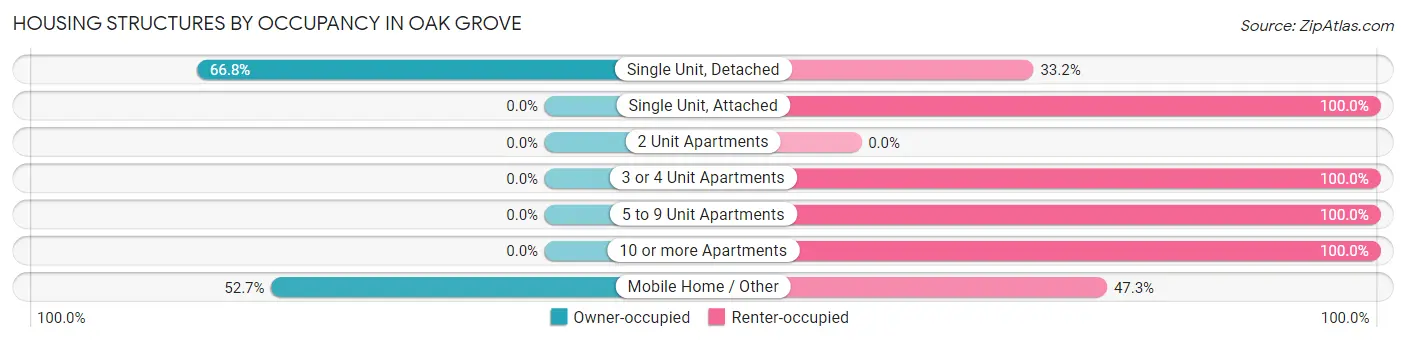
| Structure Type | Owner-occupied | Renter-occupied |
| Single Unit, Detached | 288 (66.8%) | 143 (33.2%) |
| Single Unit, Attached | 0 (0.0%) | 3 (100.0%) |
| 2 Unit Apartments | 0 (0.0%) | 0 (0.0%) |
| 3 or 4 Unit Apartments | 0 (0.0%) | 23 (100.0%) |
| 5 to 9 Unit Apartments | 0 (0.0%) | 6 (100.0%) |
| 10 or more Apartments | 0 (0.0%) | 12 (100.0%) |
| Mobile Home / Other | 59 (52.7%) | 53 (47.3%) |
| Total | 347 (59.1%) | 240 (40.9%) |
Housing Structures by Number of Rooms in Oak Grove
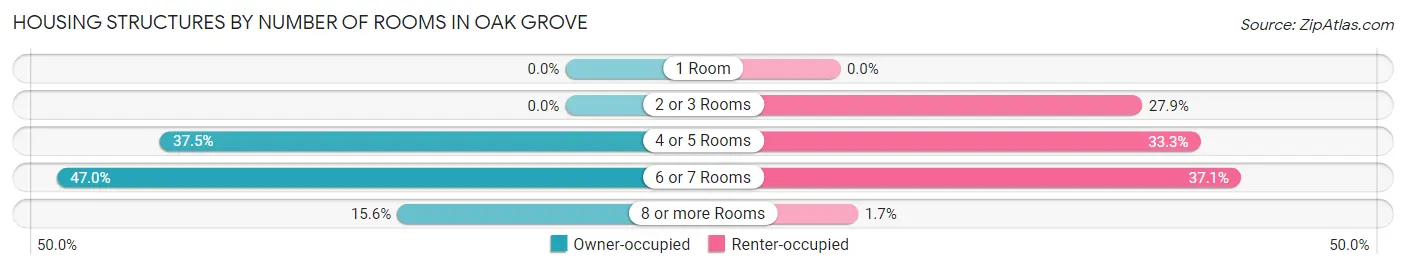
| Number of Rooms | Owner-occupied | Renter-occupied |
| 1 Room | 0 (0.0%) | 0 (0.0%) |
| 2 or 3 Rooms | 0 (0.0%) | 67 (27.9%) |
| 4 or 5 Rooms | 130 (37.5%) | 80 (33.3%) |
| 6 or 7 Rooms | 163 (47.0%) | 89 (37.1%) |
| 8 or more Rooms | 54 (15.6%) | 4 (1.7%) |
| Total | 347 (100.0%) | 240 (100.0%) |
Housing Structure by Heating Type in Oak Grove
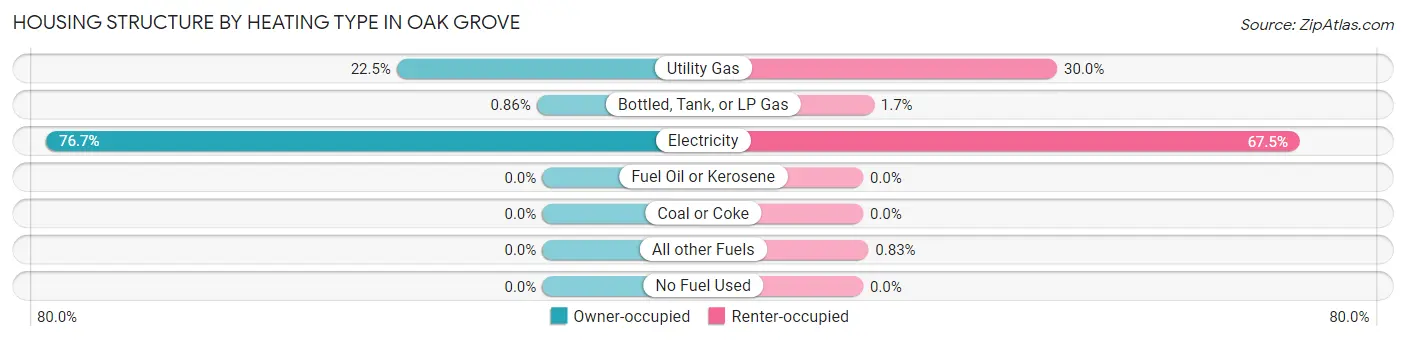
| Heating Type | Owner-occupied | Renter-occupied |
| Utility Gas | 78 (22.5%) | 72 (30.0%) |
| Bottled, Tank, or LP Gas | 3 (0.9%) | 4 (1.7%) |
| Electricity | 266 (76.7%) | 162 (67.5%) |
| Fuel Oil or Kerosene | 0 (0.0%) | 0 (0.0%) |
| Coal or Coke | 0 (0.0%) | 0 (0.0%) |
| All other Fuels | 0 (0.0%) | 2 (0.8%) |
| No Fuel Used | 0 (0.0%) | 0 (0.0%) |
| Total | 347 (100.0%) | 240 (100.0%) |
Household Vehicle Usage in Oak Grove
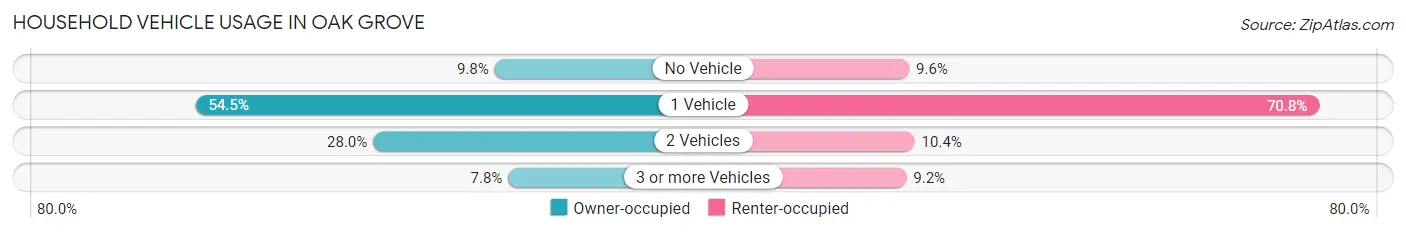
| Vehicles per Household | Owner-occupied | Renter-occupied |
| No Vehicle | 34 (9.8%) | 23 (9.6%) |
| 1 Vehicle | 189 (54.5%) | 170 (70.8%) |
| 2 Vehicles | 97 (28.0%) | 25 (10.4%) |
| 3 or more Vehicles | 27 (7.8%) | 22 (9.2%) |
| Total | 347 (100.0%) | 240 (100.0%) |
Real Estate & Mortgages in Oak Grove
Real Estate and Mortgage Overview in Oak Grove
| Characteristic | Without Mortgage | With Mortgage |
| Housing Units | 246 | 101 |
| Median Property Value | $74,300 | $128,100 |
| Median Household Income | $36,316 | $4 |
| Monthly Housing Costs | $284 | $8 |
| Real Estate Taxes | $199 | $25 |
Property Value by Mortgage Status in Oak Grove
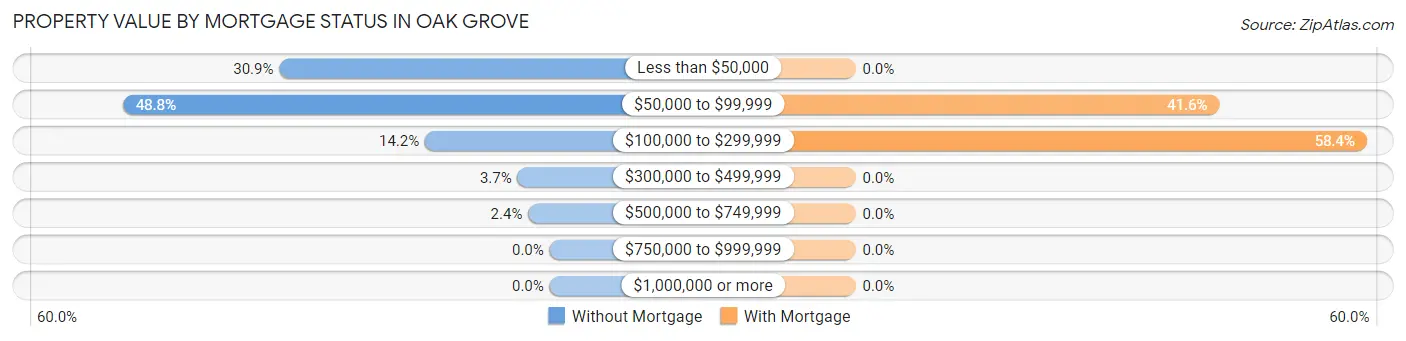
| Property Value | Without Mortgage | With Mortgage |
| Less than $50,000 | 76 (30.9%) | 0 (0.0%) |
| $50,000 to $99,999 | 120 (48.8%) | 42 (41.6%) |
| $100,000 to $299,999 | 35 (14.2%) | 59 (58.4%) |
| $300,000 to $499,999 | 9 (3.7%) | 0 (0.0%) |
| $500,000 to $749,999 | 6 (2.4%) | 0 (0.0%) |
| $750,000 to $999,999 | 0 (0.0%) | 0 (0.0%) |
| $1,000,000 or more | 0 (0.0%) | 0 (0.0%) |
| Total | 246 (100.0%) | 101 (100.0%) |
Household Income by Mortgage Status in Oak Grove
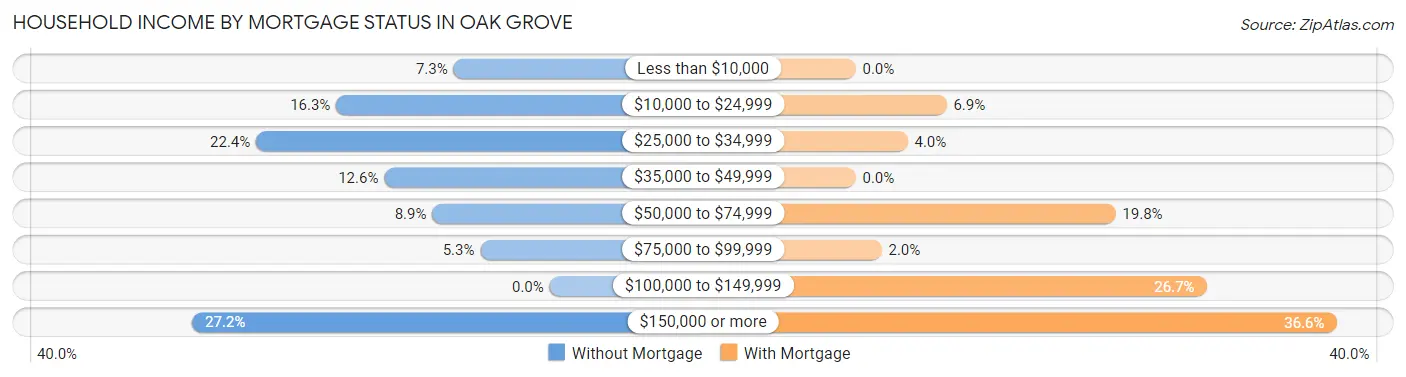
| Household Income | Without Mortgage | With Mortgage |
| Less than $10,000 | 18 (7.3%) | 0 (0.0%) |
| $10,000 to $24,999 | 40 (16.3%) | 7 (6.9%) |
| $25,000 to $34,999 | 55 (22.4%) | 4 (4.0%) |
| $35,000 to $49,999 | 31 (12.6%) | 0 (0.0%) |
| $50,000 to $74,999 | 22 (8.9%) | 20 (19.8%) |
| $75,000 to $99,999 | 13 (5.3%) | 2 (2.0%) |
| $100,000 to $149,999 | 0 (0.0%) | 27 (26.7%) |
| $150,000 or more | 67 (27.2%) | 37 (36.6%) |
| Total | 246 (100.0%) | 101 (100.0%) |
Property Value to Household Income Ratio in Oak Grove
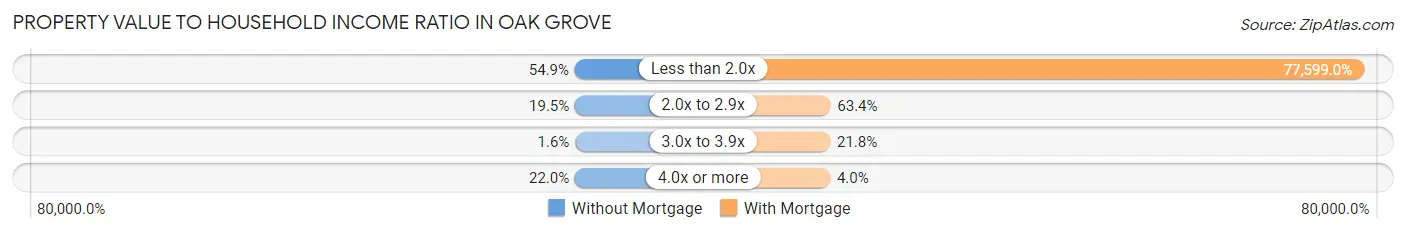
| Value-to-Income Ratio | Without Mortgage | With Mortgage |
| Less than 2.0x | 135 (54.9%) | 78,375 (77,599.0%) |
| 2.0x to 2.9x | 48 (19.5%) | 64 (63.4%) |
| 3.0x to 3.9x | 4 (1.6%) | 22 (21.8%) |
| 4.0x or more | 54 (22.0%) | 4 (4.0%) |
| Total | 246 (100.0%) | 101 (100.0%) |
Real Estate Taxes by Mortgage Status in Oak Grove
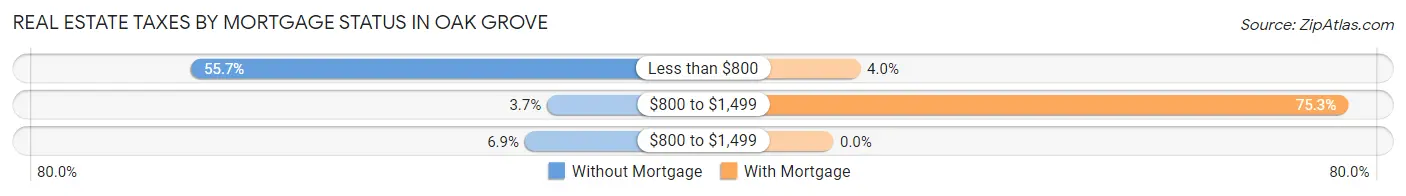
| Property Taxes | Without Mortgage | With Mortgage |
| Less than $800 | 137 (55.7%) | 4 (4.0%) |
| $800 to $1,499 | 9 (3.7%) | 76 (75.2%) |
| $800 to $1,499 | 17 (6.9%) | 0 (0.0%) |
| Total | 246 (100.0%) | 101 (100.0%) |
Health & Disability in Oak Grove
Health Insurance Coverage by Age in Oak Grove
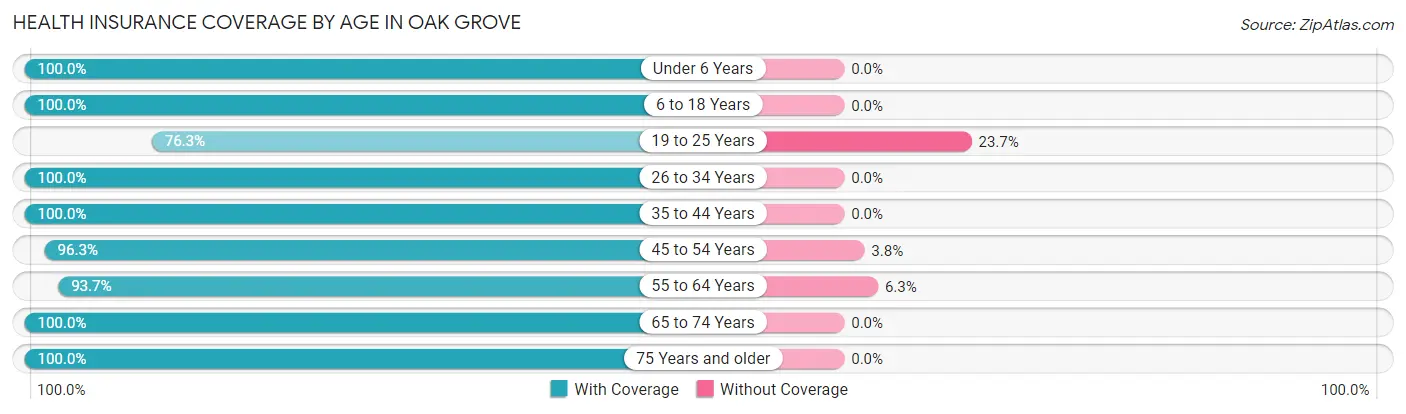
| Age Bracket | With Coverage | Without Coverage |
| Under 6 Years | 109 (100.0%) | 0 (0.0%) |
| 6 to 18 Years | 156 (100.0%) | 0 (0.0%) |
| 19 to 25 Years | 135 (76.3%) | 42 (23.7%) |
| 26 to 34 Years | 114 (100.0%) | 0 (0.0%) |
| 35 to 44 Years | 147 (100.0%) | 0 (0.0%) |
| 45 to 54 Years | 282 (96.3%) | 11 (3.7%) |
| 55 to 64 Years | 194 (93.7%) | 13 (6.3%) |
| 65 to 74 Years | 133 (100.0%) | 0 (0.0%) |
| 75 Years and older | 138 (100.0%) | 0 (0.0%) |
| Total | 1,408 (95.5%) | 66 (4.5%) |
Health Insurance Coverage by Citizenship Status in Oak Grove

| Citizenship Status | With Coverage | Without Coverage |
| Native Born | 109 (100.0%) | 0 (0.0%) |
| Foreign Born, Citizen | 156 (100.0%) | 0 (0.0%) |
| Foreign Born, not a Citizen | 135 (76.3%) | 42 (23.7%) |
Health Insurance Coverage by Household Income in Oak Grove
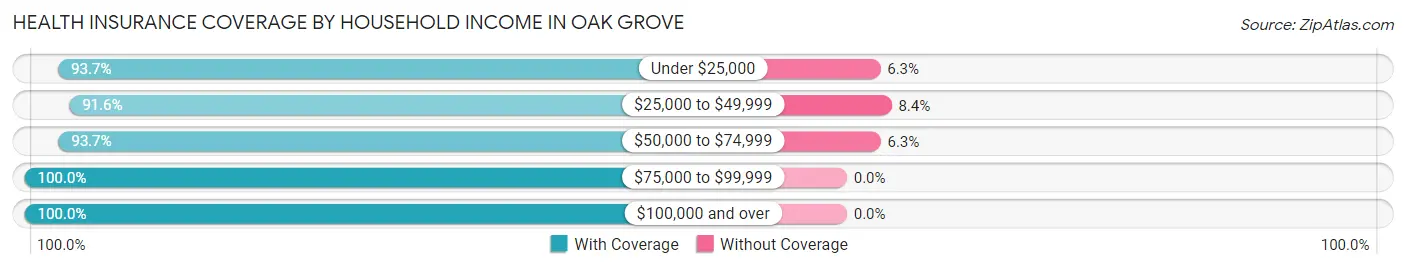
| Household Income | With Coverage | Without Coverage |
| Under $25,000 | 299 (93.7%) | 20 (6.3%) |
| $25,000 to $49,999 | 438 (91.6%) | 40 (8.4%) |
| $50,000 to $74,999 | 89 (93.7%) | 6 (6.3%) |
| $75,000 to $99,999 | 118 (100.0%) | 0 (0.0%) |
| $100,000 and over | 464 (100.0%) | 0 (0.0%) |
Public vs Private Health Insurance Coverage by Age in Oak Grove
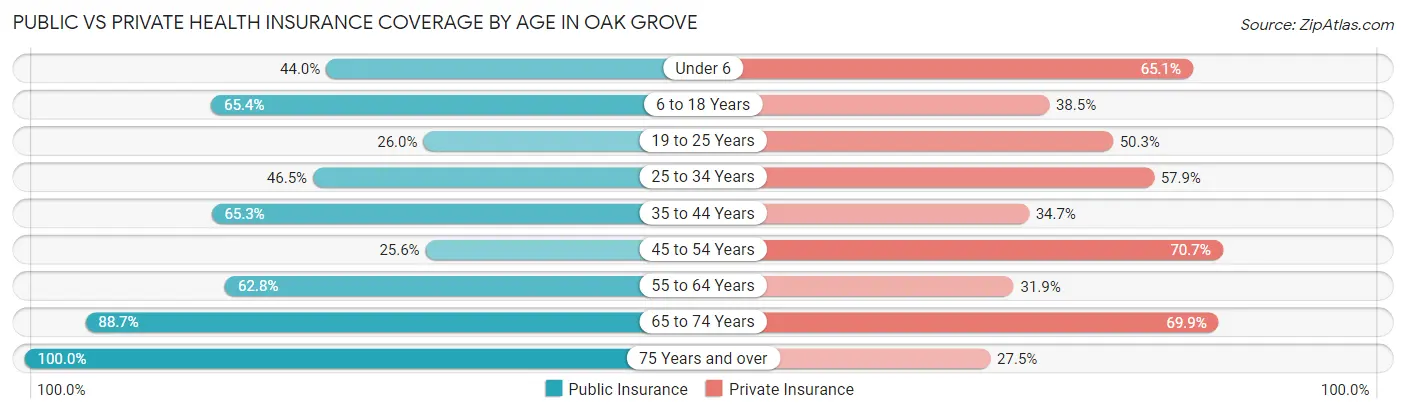
| Age Bracket | Public Insurance | Private Insurance |
| Under 6 | 48 (44.0%) | 71 (65.1%) |
| 6 to 18 Years | 102 (65.4%) | 60 (38.5%) |
| 19 to 25 Years | 46 (26.0%) | 89 (50.3%) |
| 25 to 34 Years | 53 (46.5%) | 66 (57.9%) |
| 35 to 44 Years | 96 (65.3%) | 51 (34.7%) |
| 45 to 54 Years | 75 (25.6%) | 207 (70.7%) |
| 55 to 64 Years | 130 (62.8%) | 66 (31.9%) |
| 65 to 74 Years | 118 (88.7%) | 93 (69.9%) |
| 75 Years and over | 138 (100.0%) | 38 (27.5%) |
| Total | 806 (54.7%) | 741 (50.3%) |
Disability Status by Sex by Age in Oak Grove
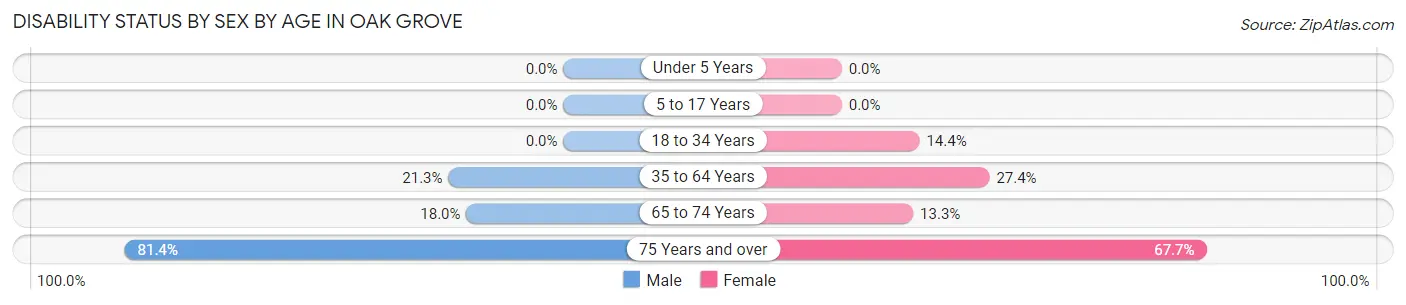
| Age Bracket | Male | Female |
| Under 5 Years | 0 (0.0%) | 0 (0.0%) |
| 5 to 17 Years | 0 (0.0%) | 0 (0.0%) |
| 18 to 34 Years | 0 (0.0%) | 15 (14.4%) |
| 35 to 64 Years | 54 (21.3%) | 108 (27.4%) |
| 65 to 74 Years | 9 (18.0%) | 11 (13.3%) |
| 75 Years and over | 57 (81.4%) | 46 (67.6%) |
Disability Class by Sex by Age in Oak Grove
Disability Class: Hearing Difficulty
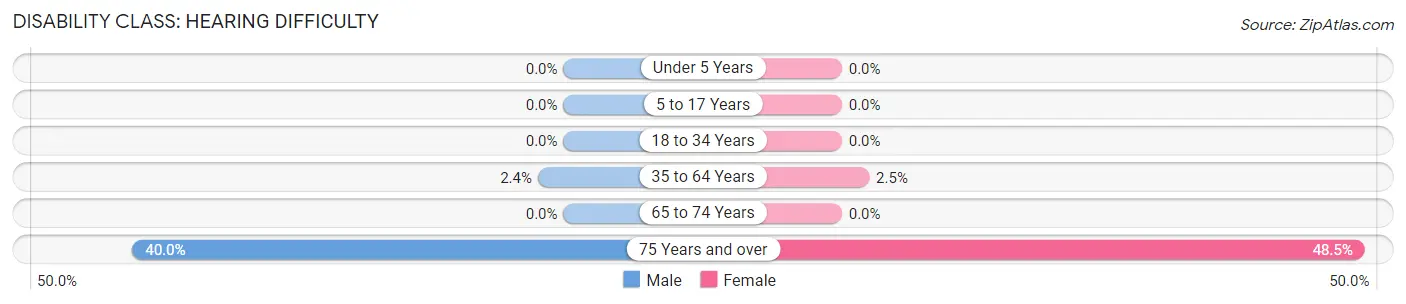
| Age Bracket | Male | Female |
| Under 5 Years | 0 (0.0%) | 0 (0.0%) |
| 5 to 17 Years | 0 (0.0%) | 0 (0.0%) |
| 18 to 34 Years | 0 (0.0%) | 0 (0.0%) |
| 35 to 64 Years | 6 (2.4%) | 10 (2.5%) |
| 65 to 74 Years | 0 (0.0%) | 0 (0.0%) |
| 75 Years and over | 28 (40.0%) | 33 (48.5%) |
Disability Class: Vision Difficulty
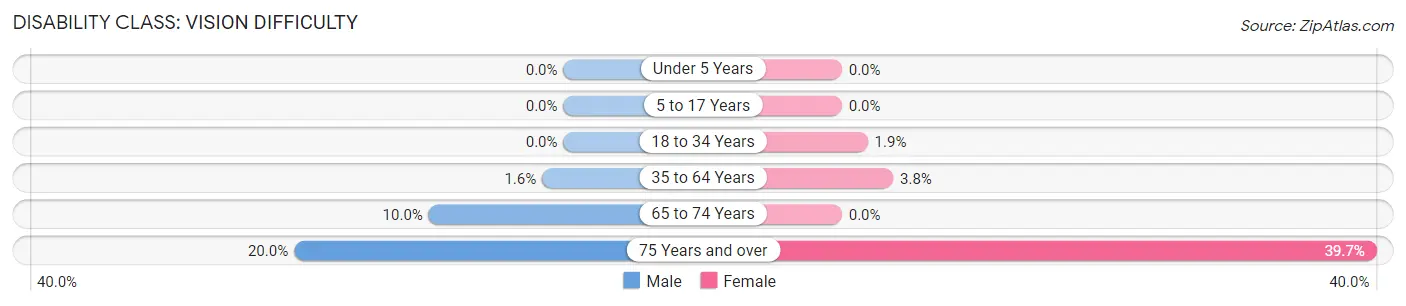
| Age Bracket | Male | Female |
| Under 5 Years | 0 (0.0%) | 0 (0.0%) |
| 5 to 17 Years | 0 (0.0%) | 0 (0.0%) |
| 18 to 34 Years | 0 (0.0%) | 2 (1.9%) |
| 35 to 64 Years | 4 (1.6%) | 15 (3.8%) |
| 65 to 74 Years | 5 (10.0%) | 0 (0.0%) |
| 75 Years and over | 14 (20.0%) | 27 (39.7%) |
Disability Class: Cognitive Difficulty
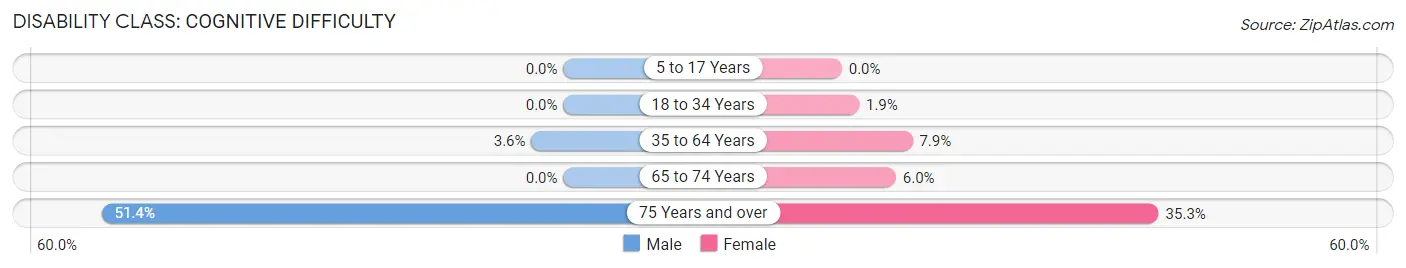
| Age Bracket | Male | Female |
| 5 to 17 Years | 0 (0.0%) | 0 (0.0%) |
| 18 to 34 Years | 0 (0.0%) | 2 (1.9%) |
| 35 to 64 Years | 9 (3.6%) | 31 (7.9%) |
| 65 to 74 Years | 0 (0.0%) | 5 (6.0%) |
| 75 Years and over | 36 (51.4%) | 24 (35.3%) |
Disability Class: Ambulatory Difficulty
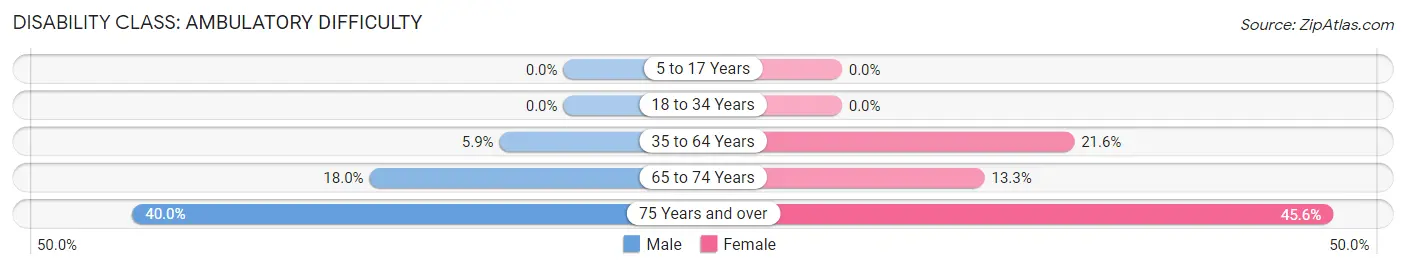
| Age Bracket | Male | Female |
| 5 to 17 Years | 0 (0.0%) | 0 (0.0%) |
| 18 to 34 Years | 0 (0.0%) | 0 (0.0%) |
| 35 to 64 Years | 15 (5.9%) | 85 (21.6%) |
| 65 to 74 Years | 9 (18.0%) | 11 (13.3%) |
| 75 Years and over | 28 (40.0%) | 31 (45.6%) |
Disability Class: Self-Care Difficulty
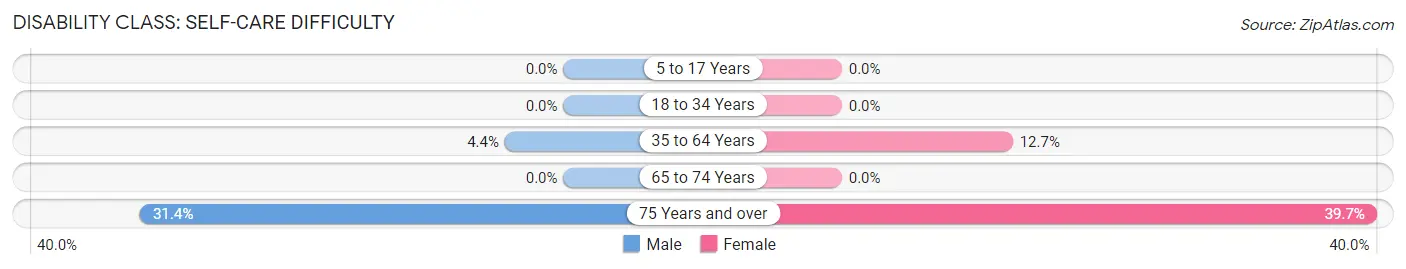
| Age Bracket | Male | Female |
| 5 to 17 Years | 0 (0.0%) | 0 (0.0%) |
| 18 to 34 Years | 0 (0.0%) | 0 (0.0%) |
| 35 to 64 Years | 11 (4.3%) | 50 (12.7%) |
| 65 to 74 Years | 0 (0.0%) | 0 (0.0%) |
| 75 Years and over | 22 (31.4%) | 27 (39.7%) |
Technology Access in Oak Grove
Computing Device Access in Oak Grove
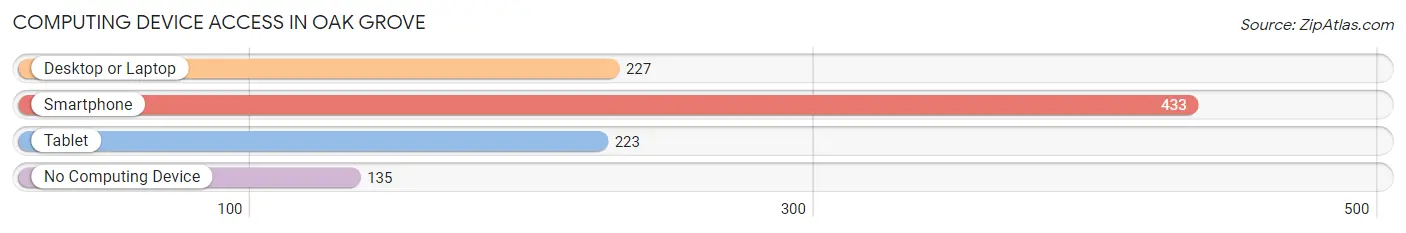
| Device Type | # Households | % Households |
| Desktop or Laptop | 227 | 38.7% |
| Smartphone | 433 | 73.8% |
| Tablet | 223 | 38.0% |
| No Computing Device | 135 | 23.0% |
| Total | 587 | 100.0% |
Internet Access in Oak Grove
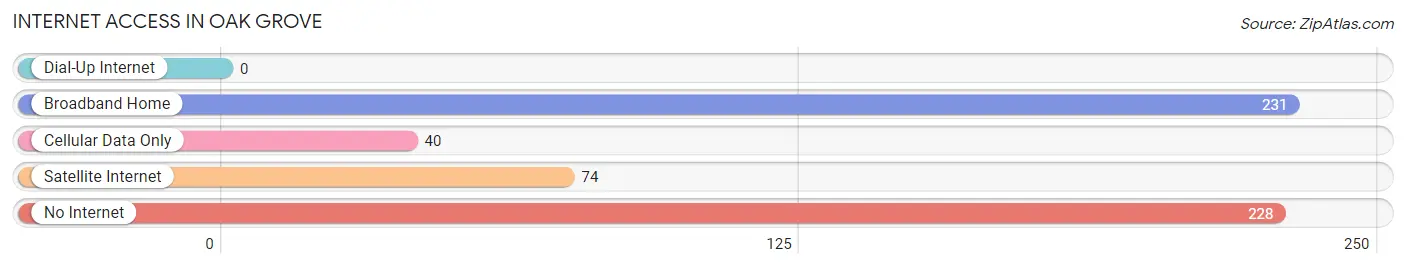
| Internet Type | # Households | % Households |
| Dial-Up Internet | 0 | 0.0% |
| Broadband Home | 231 | 39.4% |
| Cellular Data Only | 40 | 6.8% |
| Satellite Internet | 74 | 12.6% |
| No Internet | 228 | 38.8% |
| Total | 587 | 100.0% |
Oak Grove Summary
Oak Grove is a small town located in West Carroll Parish, Louisiana. It is situated on the banks of the Ouachita River, approximately 20 miles south of the Arkansas border. The town has a population of approximately 1,500 people and is the county seat of West Carroll Parish.
History
Oak Grove was founded in 1845 by a group of settlers from the nearby town of Oak Ridge. The town was originally known as Oak Ridge, but the name was changed to Oak Grove in 1848. The town was incorporated in 1851 and was the first town in West Carroll Parish.
The town was an important stop on the Ouachita River, as it was the only port between Monroe and Vicksburg. During the Civil War, the town was occupied by Union forces and served as a supply depot. After the war, the town experienced a period of growth and prosperity.
In the late 19th century, the town was home to several sawmills, a cotton gin, and a grist mill. The town also had a hotel, a bank, and several stores. The town was also home to a number of churches, including the First Baptist Church, which was founded in 1867.
Geography
Oak Grove is located in West Carroll Parish, Louisiana. It is situated on the banks of the Ouachita River, approximately 20 miles south of the Arkansas border. The town is located in a rural area and is surrounded by farmland and forests. The town is located at an elevation of approximately 200 feet above sea level.
The climate in Oak Grove is humid subtropical, with hot, humid summers and mild winters. The average annual temperature is around 70 degrees Fahrenheit. The average annual precipitation is around 50 inches.
Economy
The economy of Oak Grove is largely based on agriculture. The town is home to several farms, which produce a variety of crops, including cotton, soybeans, corn, and wheat. The town is also home to several timber companies, which harvest timber from the surrounding forests.
The town is also home to several small businesses, including restaurants, stores, and service providers. The town is also home to a number of manufacturing companies, which produce a variety of products, including furniture, clothing, and paper products.
Demographics
As of the 2010 census, the population of Oak Grove was 1,500. The racial makeup of the town was 79.2% White, 17.3% African American, 0.7% Native American, 0.3% Asian, and 2.5% from other races. The median household income was $30,000, and the median family income was $35,000.
The town is home to a number of churches, including the First Baptist Church, which was founded in 1867. The town is also home to a number of schools, including Oak Grove Elementary School, Oak Grove High School, and Oak Grove Middle School. The town is served by the West Carroll Parish School District.
Common Questions
What is Per Capita Income in Oak Grove?
Per Capita income in Oak Grove is $27,743.
What is the Median Family Income in Oak Grove?
Median Family Income in Oak Grove is $52,917.
What is the Median Household income in Oak Grove?
Median Household Income in Oak Grove is $31,875.
What is Income or Wage Gap in Oak Grove?
Income or Wage Gap in Oak Grove is 20.3%.
Women in Oak Grove earn 79.7 cents for every dollar earned by a man.
What is Inequality or Gini Index in Oak Grove?
Inequality or Gini Index in Oak Grove is 0.57.
What is the Total Population of Oak Grove?
Total Population of Oak Grove is 1,531.
What is the Total Male Population of Oak Grove?
Total Male Population of Oak Grove is 803.
What is the Total Female Population of Oak Grove?
Total Female Population of Oak Grove is 728.
What is the Ratio of Males per 100 Females in Oak Grove?
There are 110.30 Males per 100 Females in Oak Grove.
What is the Ratio of Females per 100 Males in Oak Grove?
There are 90.66 Females per 100 Males in Oak Grove.
What is the Median Population Age in Oak Grove?
Median Population Age in Oak Grove is 49.2 Years.
What is the Average Family Size in Oak Grove
Average Family Size in Oak Grove is 3.4 People.
What is the Average Household Size in Oak Grove
Average Household Size in Oak Grove is 2.5 People.
How Large is the Labor Force in Oak Grove?
There are 569 People in the Labor Forcein in Oak Grove.
What is the Percentage of People in the Labor Force in Oak Grove?
43.7% of People are in the Labor Force in Oak Grove.
What is the Unemployment Rate in Oak Grove?
Unemployment Rate in Oak Grove is 1.1%.