New Roads, LA Map & Demographics
New Roads Map
New Roads Overview
$32,721
PER CAPITA INCOME
$65,082
AVG FAMILY INCOME
$47,792
AVG HOUSEHOLD INCOME
41.5%
WAGE / INCOME GAP [ % ]
58.5¢/ $1
WAGE / INCOME GAP [ $ ]
0.48
INEQUALITY / GINI INDEX
4,508
TOTAL POPULATION
2,294
MALE POPULATION
2,214
FEMALE POPULATION
103.61
MALES / 100 FEMALES
96.51
FEMALES / 100 MALES
46.5
MEDIAN AGE
3.6
AVG FAMILY SIZE
2.5
AVG HOUSEHOLD SIZE
2,001
LABOR FORCE [ PEOPLE ]
52.5%
PERCENT IN LABOR FORCE
8.0%
UNEMPLOYMENT RATE
New Roads Zip Codes
New Roads Area Codes
Income in New Roads
Income Overview in New Roads
Per Capita Income in New Roads is $32,721, while median incomes of families and households are $65,082 and $47,792 respectively.
| Characteristic | Number | Measure |
| Per Capita Income | 4,508 | $32,721 |
| Median Family Income | 881 | $65,082 |
| Mean Family Income | 881 | $95,695 |
| Median Household Income | 1,774 | $47,792 |
| Mean Household Income | 1,774 | $74,050 |
| Income Deficit | 881 | $0 |
| Wage / Income Gap (%) | 4,508 | 41.49% |
| Wage / Income Gap ($) | 4,508 | 58.51¢ per $1 |
| Gini / Inequality Index | 4,508 | 0.48 |
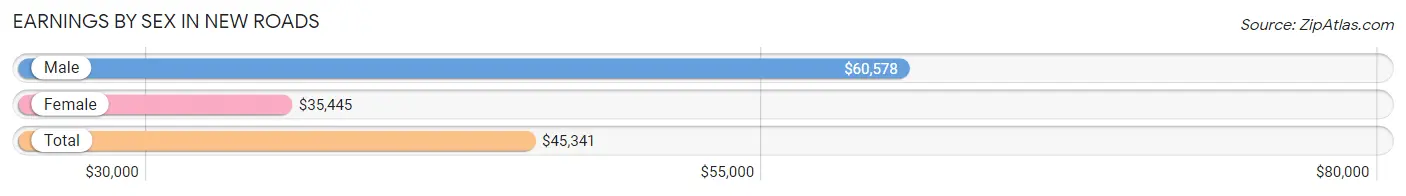
Earnings by Sex in New Roads
Average Earnings in New Roads are $45,341, $60,578 for men and $35,445 for women, a difference of 41.5%.
| Sex | Number | Average Earnings |
| Male | 1,021 (50.9%) | $60,578 |
| Female | 985 (49.1%) | $35,445 |
| Total | 2,006 (100.0%) | $45,341 |
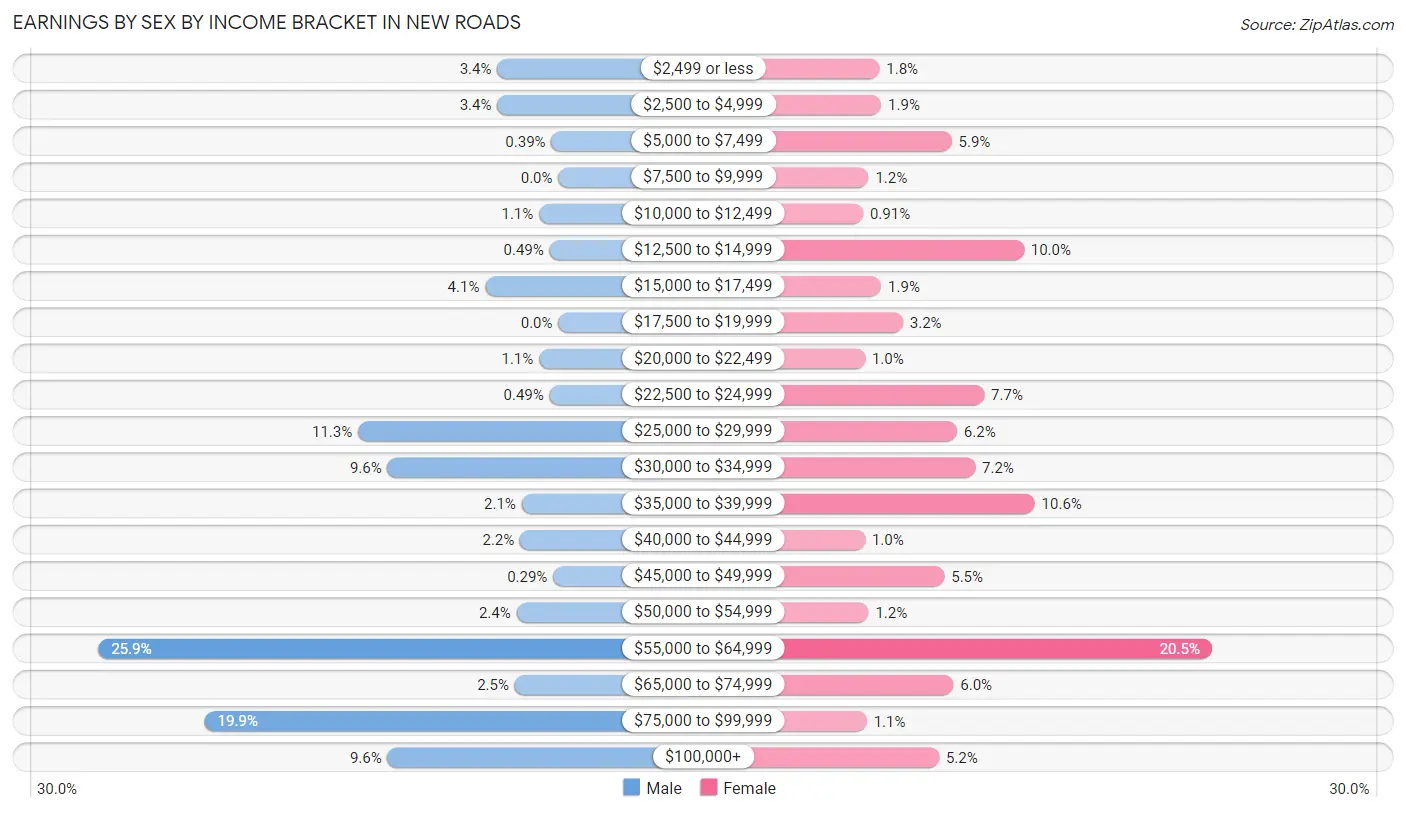
Earnings by Sex by Income Bracket in New Roads
The most common earnings brackets in New Roads are $55,000 to $64,999 for men (264 | 25.9%) and $55,000 to $64,999 for women (202 | 20.5%).
| Income | Male | Female |
| $2,499 or less | 35 (3.4%) | 18 (1.8%) |
| $2,500 to $4,999 | 35 (3.4%) | 19 (1.9%) |
| $5,000 to $7,499 | 4 (0.4%) | 58 (5.9%) |
| $7,500 to $9,999 | 0 (0.0%) | 12 (1.2%) |
| $10,000 to $12,499 | 11 (1.1%) | 9 (0.9%) |
| $12,500 to $14,999 | 5 (0.5%) | 98 (10.0%) |
| $15,000 to $17,499 | 42 (4.1%) | 19 (1.9%) |
| $17,500 to $19,999 | 0 (0.0%) | 31 (3.2%) |
| $20,000 to $22,499 | 11 (1.1%) | 10 (1.0%) |
| $22,500 to $24,999 | 5 (0.5%) | 76 (7.7%) |
| $25,000 to $29,999 | 115 (11.3%) | 61 (6.2%) |
| $30,000 to $34,999 | 98 (9.6%) | 71 (7.2%) |
| $35,000 to $39,999 | 21 (2.1%) | 104 (10.6%) |
| $40,000 to $44,999 | 22 (2.1%) | 10 (1.0%) |
| $45,000 to $49,999 | 3 (0.3%) | 54 (5.5%) |
| $50,000 to $54,999 | 24 (2.4%) | 12 (1.2%) |
| $55,000 to $64,999 | 264 (25.9%) | 202 (20.5%) |
| $65,000 to $74,999 | 25 (2.5%) | 59 (6.0%) |
| $75,000 to $99,999 | 203 (19.9%) | 11 (1.1%) |
| $100,000+ | 98 (9.6%) | 51 (5.2%) |
| Total | 1,021 (100.0%) | 985 (100.0%) |
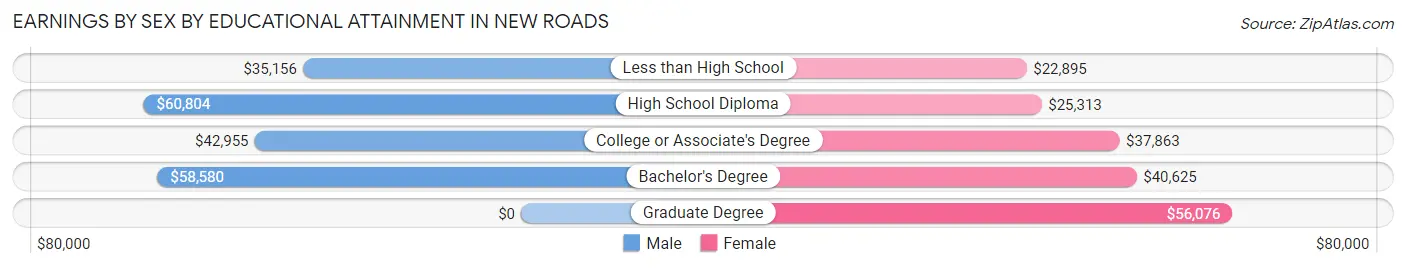
Earnings by Sex by Educational Attainment in New Roads
Average earnings in New Roads are $60,451 for men and $36,165 for women, a difference of 40.2%. Men with an educational attainment of high school diploma enjoy the highest average annual earnings of $60,804, while those with less than high school education earn the least with $35,156. Women with an educational attainment of graduate degree earn the most with the average annual earnings of $56,076, while those with less than high school education have the smallest earnings of $22,895.
| Educational Attainment | Male Income | Female Income |
| Less than High School | $35,156 | $22,895 |
| High School Diploma | $60,804 | $25,313 |
| College or Associate's Degree | $42,955 | $37,863 |
| Bachelor's Degree | $58,580 | $40,625 |
| Graduate Degree | - | - |
| Total | $60,451 | $36,165 |
Family Income in New Roads
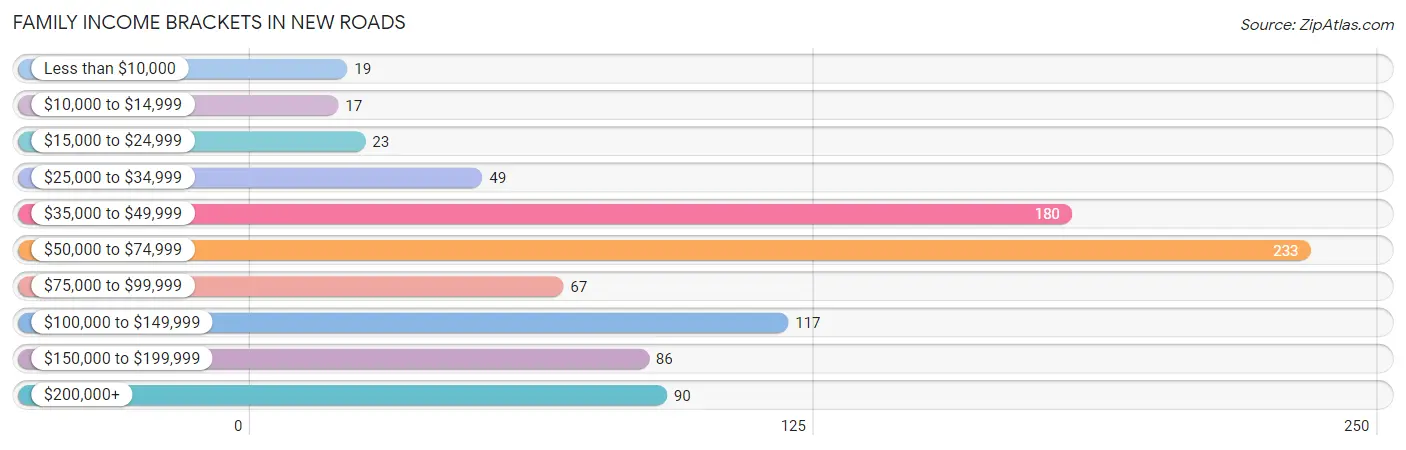
Family Income Brackets in New Roads
According to the New Roads family income data, there are 233 families falling into the $50,000 to $74,999 income range, which is the most common income bracket and makes up 26.5% of all families. Conversely, the $10,000 to $14,999 income bracket is the least frequent group with only 17 families (1.9%) belonging to this category.
| Income Bracket | # Families | % Families |
| Less than $10,000 | 19 | 2.2% |
| $10,000 to $14,999 | 17 | 1.9% |
| $15,000 to $24,999 | 23 | 2.6% |
| $25,000 to $34,999 | 49 | 5.6% |
| $35,000 to $49,999 | 180 | 20.4% |
| $50,000 to $74,999 | 233 | 26.4% |
| $75,000 to $99,999 | 67 | 7.6% |
| $100,000 to $149,999 | 117 | 13.3% |
| $150,000 to $199,999 | 86 | 9.8% |
| $200,000+ | 90 | 10.2% |
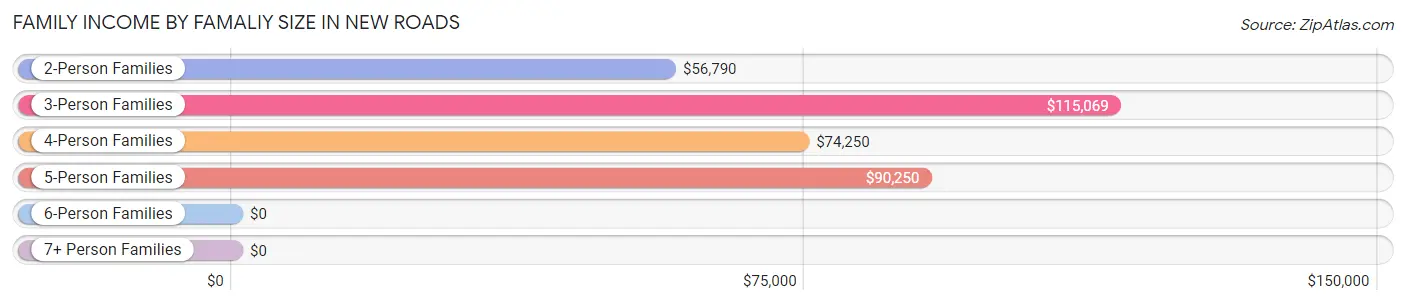
Family Income by Famaliy Size in New Roads
3-person families (257 | 29.2%) account for the highest median family income in New Roads with $115,069 per family, while 3-person families (257 | 29.2%) have the highest median income of $38,356 per family member.
| Income Bracket | # Families | Median Income |
| 2-Person Families | 519 (58.9%) | $56,790 |
| 3-Person Families | 257 (29.2%) | $115,069 |
| 4-Person Families | 73 (8.3%) | $74,250 |
| 5-Person Families | 25 (2.8%) | $90,250 |
| 6-Person Families | 2 (0.2%) | $0 |
| 7+ Person Families | 5 (0.6%) | $0 |
| Total | 881 (100.0%) | $65,082 |
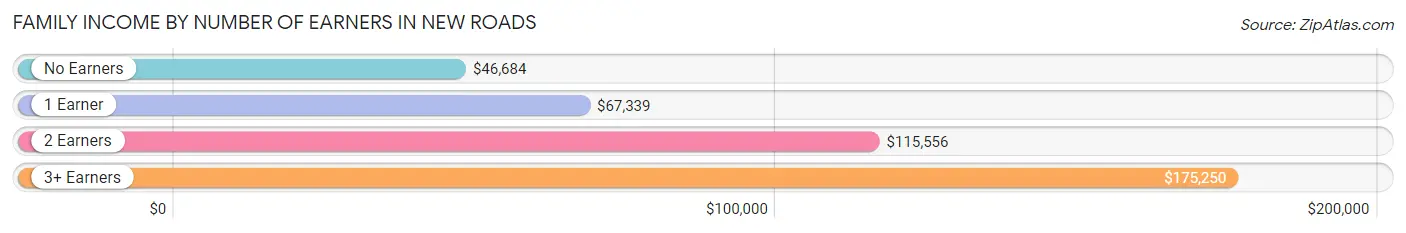
Family Income by Number of Earners in New Roads
The median family income in New Roads is $65,082, with families comprising 3+ earners (55) having the highest median family income of $175,250, while families with no earners (232) have the lowest median family income of $46,684, accounting for 6.2% and 26.3% of families, respectively.
| Number of Earners | # Families | Median Income |
| No Earners | 232 (26.3%) | $46,684 |
| 1 Earner | 322 (36.5%) | $67,339 |
| 2 Earners | 272 (30.9%) | $115,556 |
| 3+ Earners | 55 (6.2%) | $175,250 |
| Total | 881 (100.0%) | $65,082 |
Household Income in New Roads
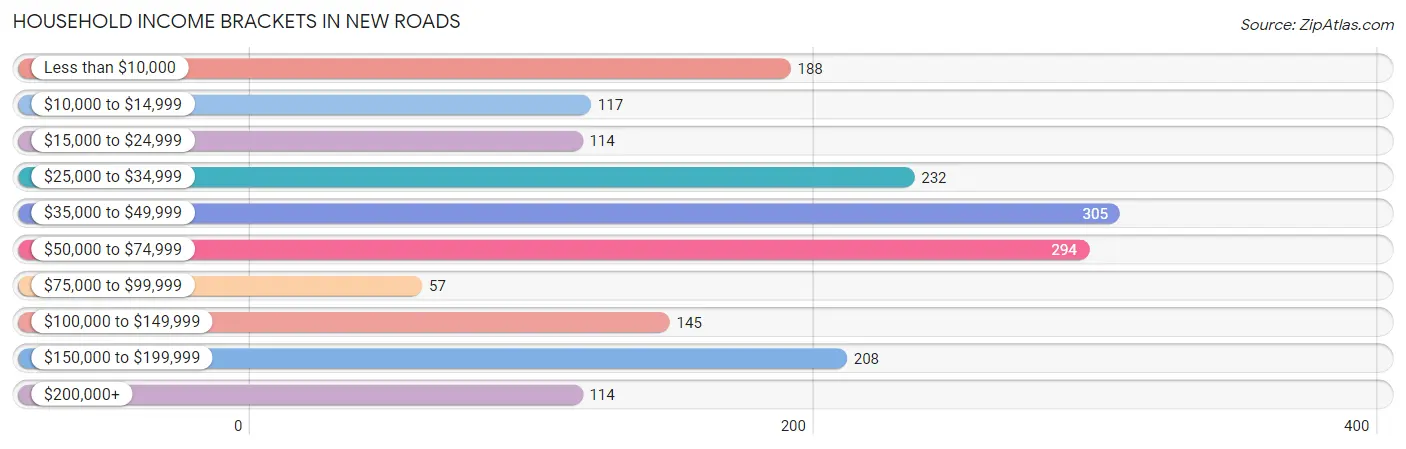
Household Income Brackets in New Roads
With 305 households falling in the category, the $35,000 to $49,999 income range is the most frequent in New Roads, accounting for 17.2% of all households. In contrast, only 57 households (3.2%) fall into the $75,000 to $99,999 income bracket, making it the least populous group.
| Income Bracket | # Households | % Households |
| Less than $10,000 | 188 | 10.6% |
| $10,000 to $14,999 | 117 | 6.6% |
| $15,000 to $24,999 | 114 | 6.4% |
| $25,000 to $34,999 | 232 | 13.1% |
| $35,000 to $49,999 | 305 | 17.2% |
| $50,000 to $74,999 | 294 | 16.6% |
| $75,000 to $99,999 | 57 | 3.2% |
| $100,000 to $149,999 | 145 | 8.2% |
| $150,000 to $199,999 | 208 | 11.7% |
| $200,000+ | 114 | 6.4% |
Household Income by Householder Age in New Roads
The median household income in New Roads is $47,792, with the highest median household income of $250,001 found in the 15 to 24 years age bracket for the primary householder. A total of 39 households (2.2%) fall into this category. Meanwhile, the 25 to 44 years age bracket for the primary householder has the lowest median household income of $0, with 406 households (22.9%) in this group.
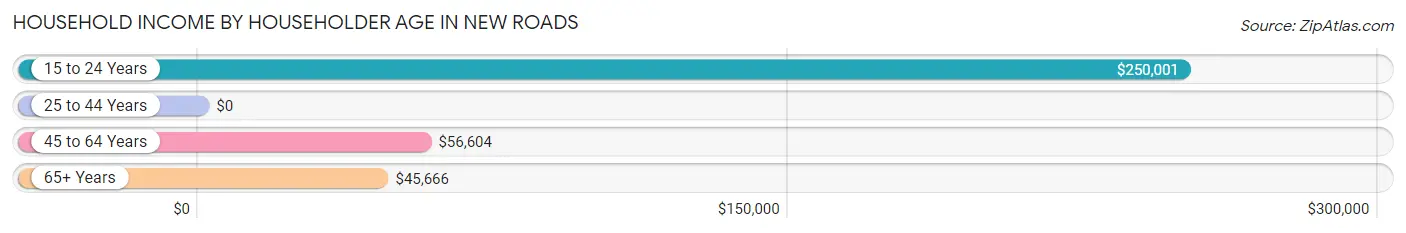
| Income Bracket | # Households | Median Income |
| 15 to 24 Years | 39 (2.2%) | $250,001 |
| 25 to 44 Years | 406 (22.9%) | $0 |
| 45 to 64 Years | 610 (34.4%) | $56,604 |
| 65+ Years | 719 (40.5%) | $45,666 |
| Total | 1,774 (100.0%) | $47,792 |
Poverty in New Roads
Income Below Poverty by Sex and Age in New Roads
With 12.5% poverty level for males and 24.6% for females among the residents of New Roads, 5 year old males and 12 to 14 year old females are the most vulnerable to poverty, with 13 males (76.5%) and 71 females (91.0%) in their respective age groups living below the poverty level.
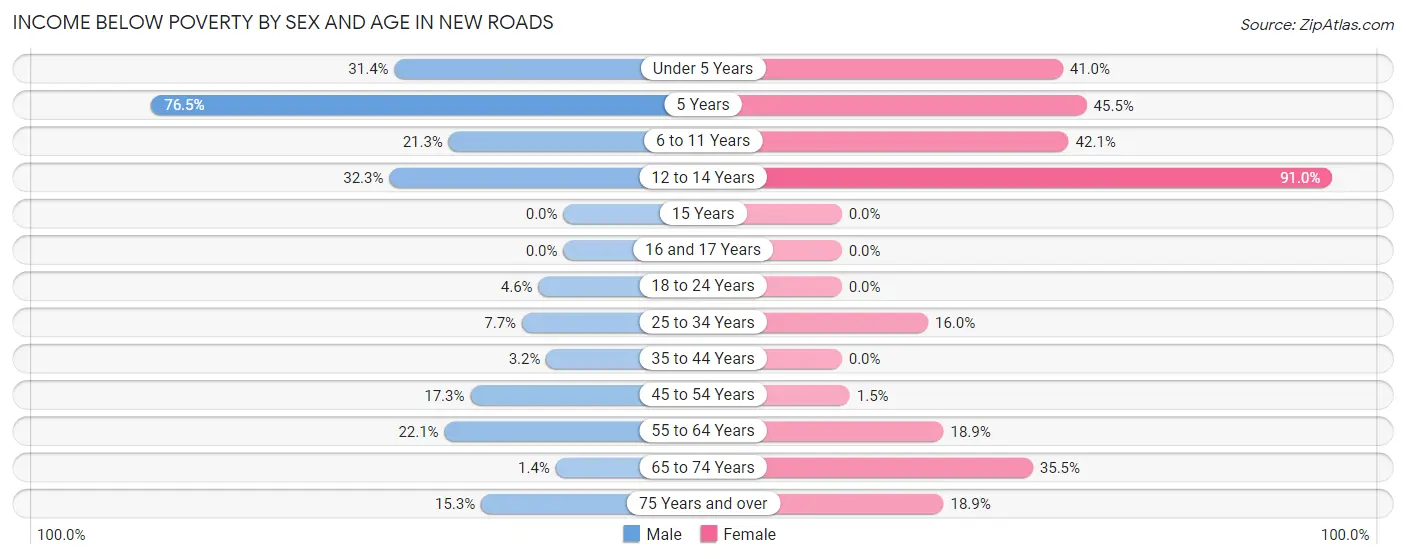
| Age Bracket | Male | Female |
| Under 5 Years | 37 (31.4%) | 16 (41.0%) |
| 5 Years | 13 (76.5%) | 15 (45.5%) |
| 6 to 11 Years | 20 (21.3%) | 104 (42.1%) |
| 12 to 14 Years | 21 (32.3%) | 71 (91.0%) |
| 15 Years | 0 (0.0%) | 0 (0.0%) |
| 16 and 17 Years | 0 (0.0%) | 0 (0.0%) |
| 18 to 24 Years | 8 (4.6%) | 0 (0.0%) |
| 25 to 34 Years | 29 (7.7%) | 61 (16.0%) |
| 35 to 44 Years | 13 (3.2%) | 0 (0.0%) |
| 45 to 54 Years | 38 (17.3%) | 3 (1.5%) |
| 55 to 64 Years | 81 (22.1%) | 78 (18.9%) |
| 65 to 74 Years | 4 (1.4%) | 139 (35.5%) |
| 75 Years and over | 20 (15.3%) | 34 (18.9%) |
| Total | 284 (12.5%) | 521 (24.6%) |
Income Above Poverty by Sex and Age in New Roads
According to the poverty statistics in New Roads, males aged 16 and 17 years and females aged 15 years are the age groups that are most secure financially, with 100.0% of males and 100.0% of females in these age groups living above the poverty line.
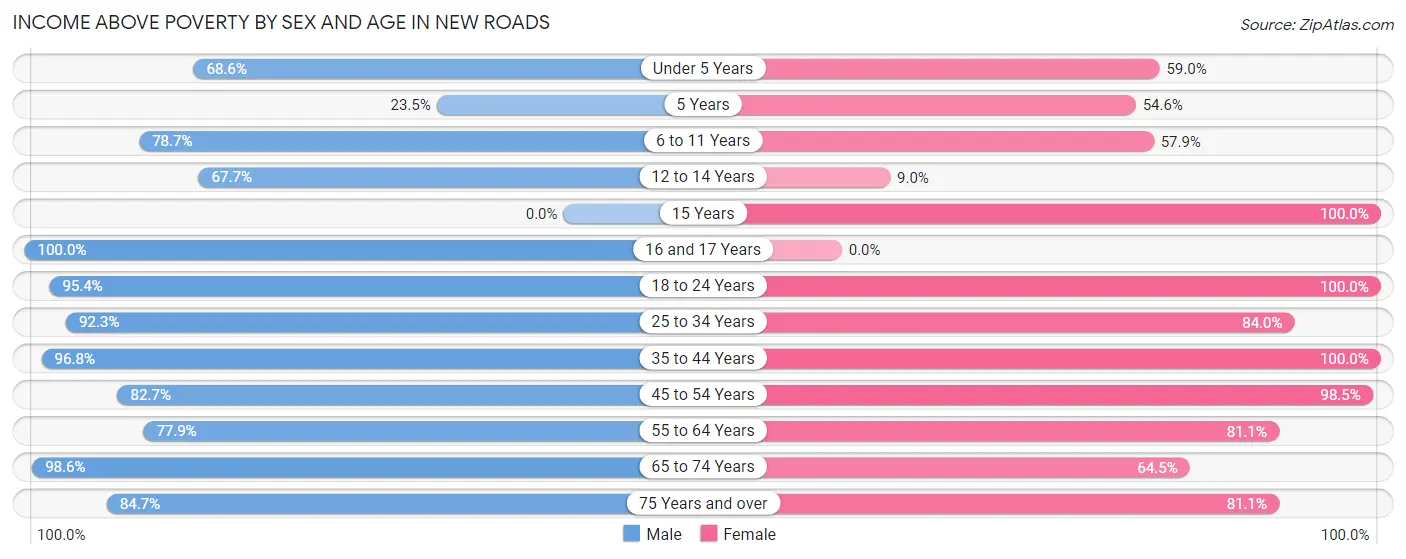
| Age Bracket | Male | Female |
| Under 5 Years | 81 (68.6%) | 23 (59.0%) |
| 5 Years | 4 (23.5%) | 18 (54.5%) |
| 6 to 11 Years | 74 (78.7%) | 143 (57.9%) |
| 12 to 14 Years | 44 (67.7%) | 7 (9.0%) |
| 15 Years | 0 (0.0%) | 6 (100.0%) |
| 16 and 17 Years | 17 (100.0%) | 0 (0.0%) |
| 18 to 24 Years | 165 (95.4%) | 34 (100.0%) |
| 25 to 34 Years | 348 (92.3%) | 320 (84.0%) |
| 35 to 44 Years | 397 (96.8%) | 113 (100.0%) |
| 45 to 54 Years | 182 (82.7%) | 199 (98.5%) |
| 55 to 64 Years | 286 (77.9%) | 335 (81.1%) |
| 65 to 74 Years | 277 (98.6%) | 253 (64.5%) |
| 75 Years and over | 111 (84.7%) | 146 (81.1%) |
| Total | 1,986 (87.5%) | 1,597 (75.4%) |
Income Below Poverty Among Married-Couple Families in New Roads
The poverty statistics for married-couple families in New Roads show that 5.5% or 36 of the total 653 families live below the poverty line. Families with 1 or 2 children have the highest poverty rate of 30.6%, comprising of 19 families. On the other hand, families with 3 or 4 children have the lowest poverty rate of 0.0%, which includes 0 families.
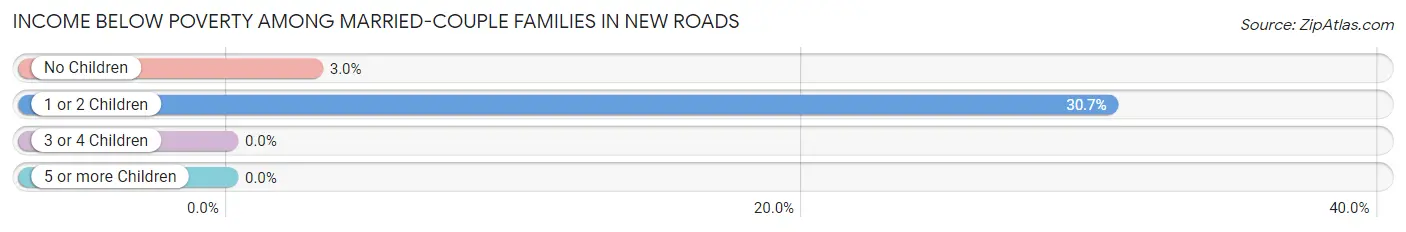
| Children | Above Poverty | Below Poverty |
| No Children | 559 (97.1%) | 17 (2.9%) |
| 1 or 2 Children | 43 (69.4%) | 19 (30.6%) |
| 3 or 4 Children | 10 (100.0%) | 0 (0.0%) |
| 5 or more Children | 5 (100.0%) | 0 (0.0%) |
| Total | 617 (94.5%) | 36 (5.5%) |
Income Below Poverty Among Single-Parent Households in New Roads
According to the poverty data in New Roads, 22.2% or 6 single-father households and 4.5% or 9 single-mother households are living below the poverty line. Among single-father households, those with 3 or 4 children have the highest poverty rate, with 6 households (100.0%) experiencing poverty. Likewise, among single-mother households, those with 3 or 4 children have the highest poverty rate, with 9 households (100.0%) falling below the poverty line.
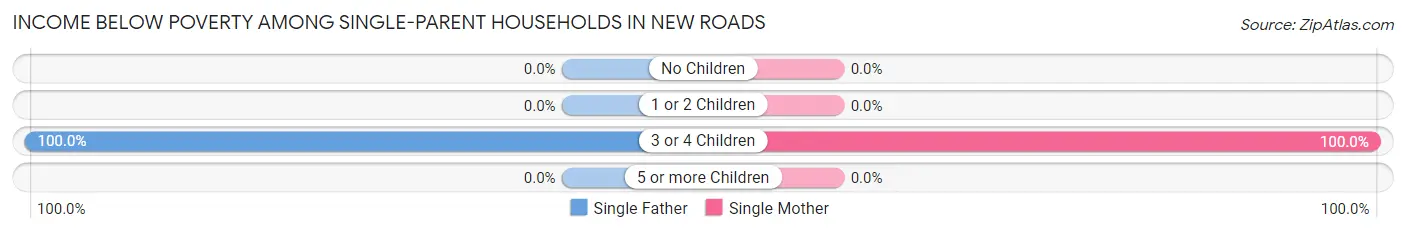
| Children | Single Father | Single Mother |
| No Children | 0 (0.0%) | 0 (0.0%) |
| 1 or 2 Children | 0 (0.0%) | 0 (0.0%) |
| 3 or 4 Children | 6 (100.0%) | 9 (100.0%) |
| 5 or more Children | 0 (0.0%) | 0 (0.0%) |
| Total | 6 (22.2%) | 9 (4.5%) |
Income Below Poverty Among Married-Couple vs Single-Parent Households in New Roads
The poverty data for New Roads shows that 36 of the married-couple family households (5.5%) and 15 of the single-parent households (6.6%) are living below the poverty level. Within the married-couple family households, those with 1 or 2 children have the highest poverty rate, with 19 households (30.6%) falling below the poverty line. Among the single-parent households, those with 3 or 4 children have the highest poverty rate, with 15 household (100.0%) living below poverty.
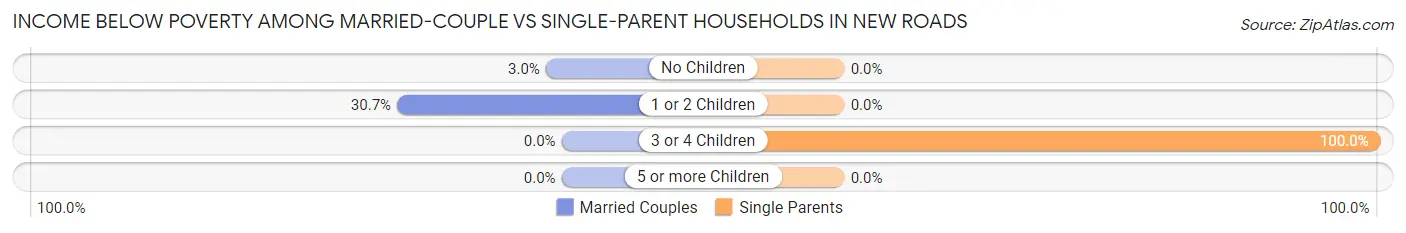
| Children | Married-Couple Families | Single-Parent Households |
| No Children | 17 (2.9%) | 0 (0.0%) |
| 1 or 2 Children | 19 (30.6%) | 0 (0.0%) |
| 3 or 4 Children | 0 (0.0%) | 15 (100.0%) |
| 5 or more Children | 0 (0.0%) | 0 (0.0%) |
| Total | 36 (5.5%) | 15 (6.6%) |
Race in New Roads
The most populous races in New Roads are Black / African American (2,305 | 51.1%), White / Caucasian (2,007 | 44.5%), and Two or more Races (160 | 3.5%).
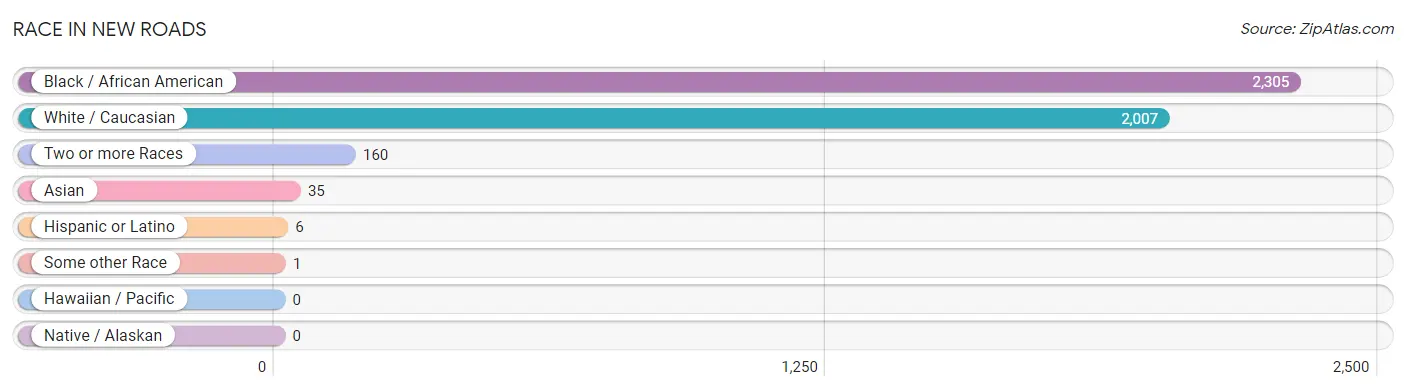
| Race | # Population | % Population |
| Asian | 35 | 0.8% |
| Black / African American | 2,305 | 51.1% |
| Hawaiian / Pacific | 0 | 0.0% |
| Hispanic or Latino | 6 | 0.1% |
| Native / Alaskan | 0 | 0.0% |
| White / Caucasian | 2,007 | 44.5% |
| Two or more Races | 160 | 3.5% |
| Some other Race | 1 | 0.0% |
| Total | 4,508 | 100.0% |
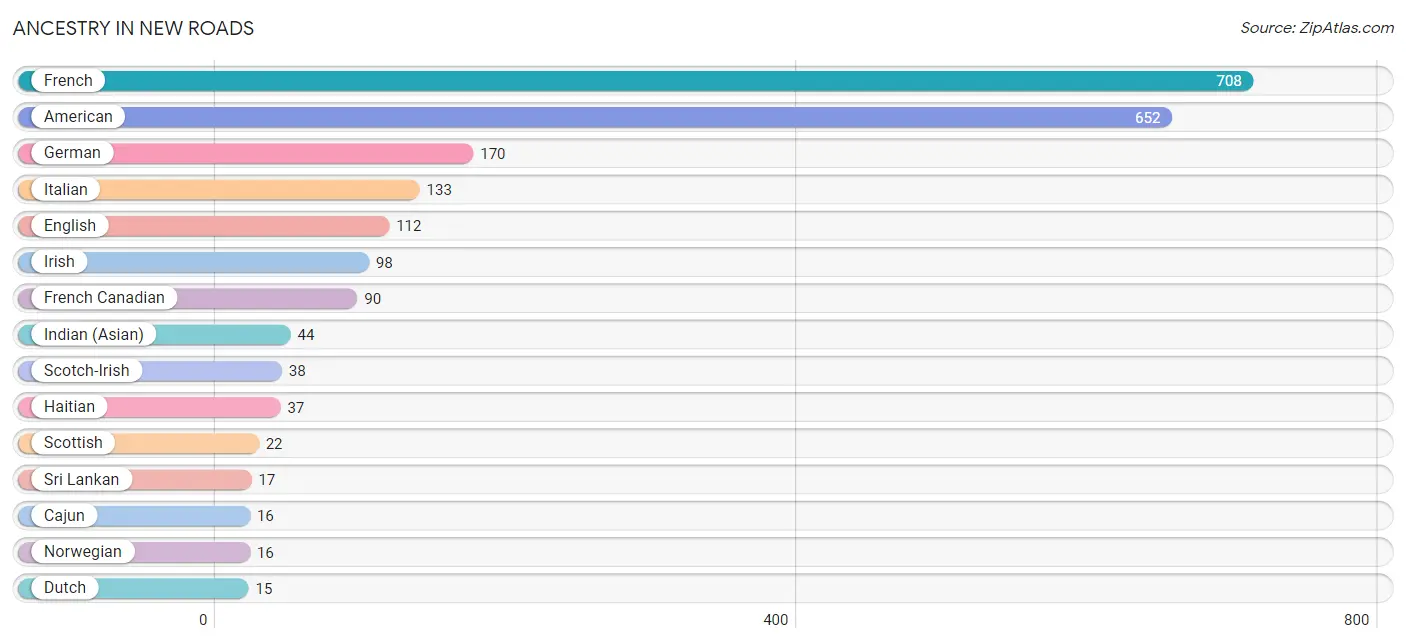
Ancestry in New Roads
The most populous ancestries reported in New Roads are French (708 | 15.7%), American (652 | 14.5%), German (170 | 3.8%), Italian (133 | 2.9%), and English (112 | 2.5%), together accounting for 39.4% of all New Roads residents.
| Ancestry | # Population | % Population |
| American | 652 | 14.5% |
| Arab | 4 | 0.1% |
| British | 5 | 0.1% |
| Cajun | 16 | 0.4% |
| Cherokee | 5 | 0.1% |
| Dutch | 15 | 0.3% |
| Eastern European | 7 | 0.2% |
| English | 112 | 2.5% |
| European | 4 | 0.1% |
| French | 708 | 15.7% |
| French Canadian | 90 | 2.0% |
| German | 170 | 3.8% |
| Haitian | 37 | 0.8% |
| Indian (Asian) | 44 | 1.0% |
| Irish | 98 | 2.2% |
| Italian | 133 | 2.9% |
| Lebanese | 4 | 0.1% |
| Nigerian | 6 | 0.1% |
| Norwegian | 16 | 0.4% |
| Polish | 9 | 0.2% |
| Scotch-Irish | 38 | 0.8% |
| Scottish | 22 | 0.5% |
| Spaniard | 1 | 0.0% |
| Spanish | 5 | 0.1% |
| Sri Lankan | 17 | 0.4% |
| Subsaharan African | 6 | 0.1% |
| Welsh | 14 | 0.3% | View All 27 Rows |
Immigrants in New Roads
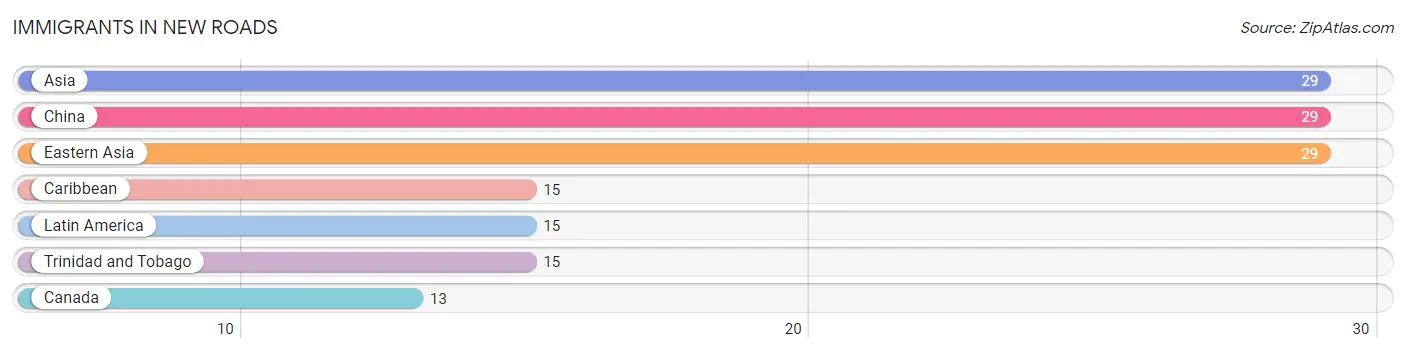
The most numerous immigrant groups reported in New Roads came from Asia (29 | 0.6%), China (29 | 0.6%), Eastern Asia (29 | 0.6%), Caribbean (15 | 0.3%), and Latin America (15 | 0.3%), together accounting for 2.6% of all New Roads residents.
| Immigration Origin | # Population | % Population |
| Asia | 29 | 0.6% |
| Canada | 13 | 0.3% |
| Caribbean | 15 | 0.3% |
| China | 29 | 0.6% |
| Eastern Asia | 29 | 0.6% |
| Latin America | 15 | 0.3% |
| Trinidad and Tobago | 15 | 0.3% | View All 7 Rows |
Sex and Age in New Roads
Sex and Age in New Roads
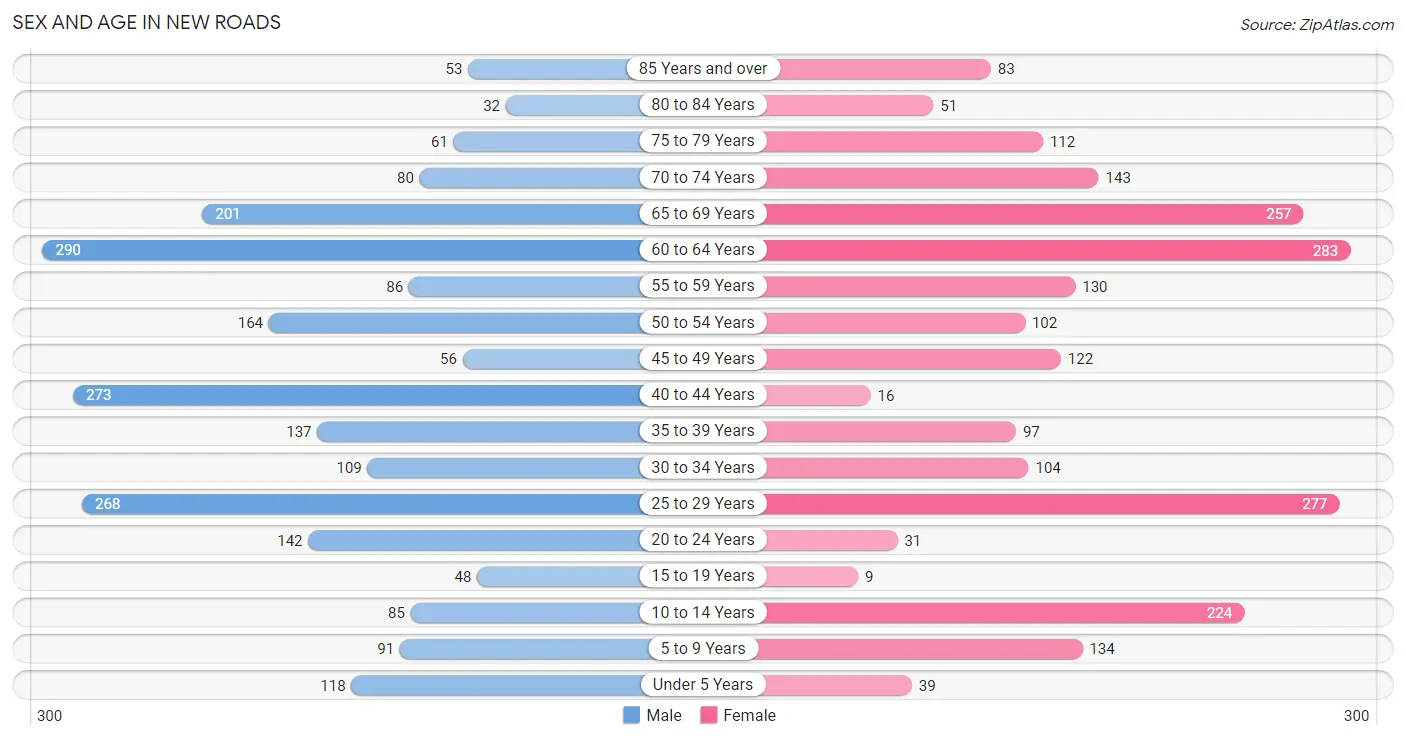
The most populous age groups in New Roads are 60 to 64 Years (290 | 12.6%) for men and 60 to 64 Years (283 | 12.8%) for women.
| Age Bracket | Male | Female |
| Under 5 Years | 118 (5.1%) | 39 (1.8%) |
| 5 to 9 Years | 91 (4.0%) | 134 (6.0%) |
| 10 to 14 Years | 85 (3.7%) | 224 (10.1%) |
| 15 to 19 Years | 48 (2.1%) | 9 (0.4%) |
| 20 to 24 Years | 142 (6.2%) | 31 (1.4%) |
| 25 to 29 Years | 268 (11.7%) | 277 (12.5%) |
| 30 to 34 Years | 109 (4.8%) | 104 (4.7%) |
| 35 to 39 Years | 137 (6.0%) | 97 (4.4%) |
| 40 to 44 Years | 273 (11.9%) | 16 (0.7%) |
| 45 to 49 Years | 56 (2.4%) | 122 (5.5%) |
| 50 to 54 Years | 164 (7.1%) | 102 (4.6%) |
| 55 to 59 Years | 86 (3.7%) | 130 (5.9%) |
| 60 to 64 Years | 290 (12.6%) | 283 (12.8%) |
| 65 to 69 Years | 201 (8.8%) | 257 (11.6%) |
| 70 to 74 Years | 80 (3.5%) | 143 (6.5%) |
| 75 to 79 Years | 61 (2.7%) | 112 (5.1%) |
| 80 to 84 Years | 32 (1.4%) | 51 (2.3%) |
| 85 Years and over | 53 (2.3%) | 83 (3.7%) |
| Total | 2,294 (100.0%) | 2,214 (100.0%) |
Families and Households in New Roads
Median Family Size in New Roads
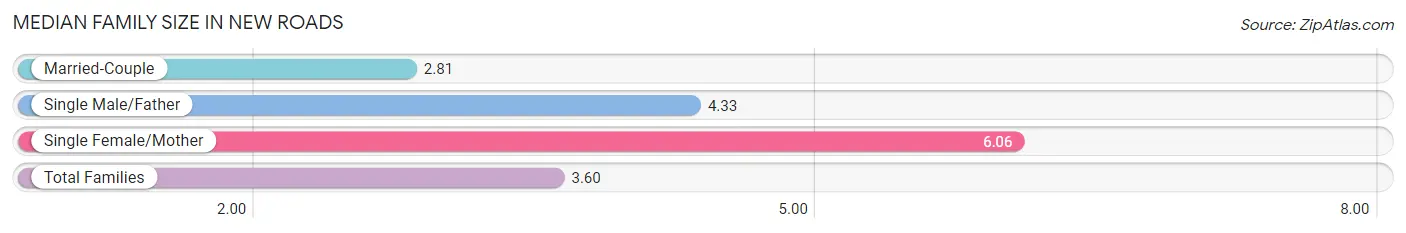
The median family size in New Roads is 3.60 persons per family, with single female/mother families (201 | 22.8%) accounting for the largest median family size of 6.06 persons per family. On the other hand, married-couple families (653 | 74.1%) represent the smallest median family size with 2.81 persons per family.
| Family Type | # Families | Family Size |
| Married-Couple | 653 (74.1%) | 2.81 |
| Single Male/Father | 27 (3.1%) | 4.33 |
| Single Female/Mother | 201 (22.8%) | 6.06 |
| Total Families | 881 (100.0%) | 3.60 |
Median Household Size in New Roads
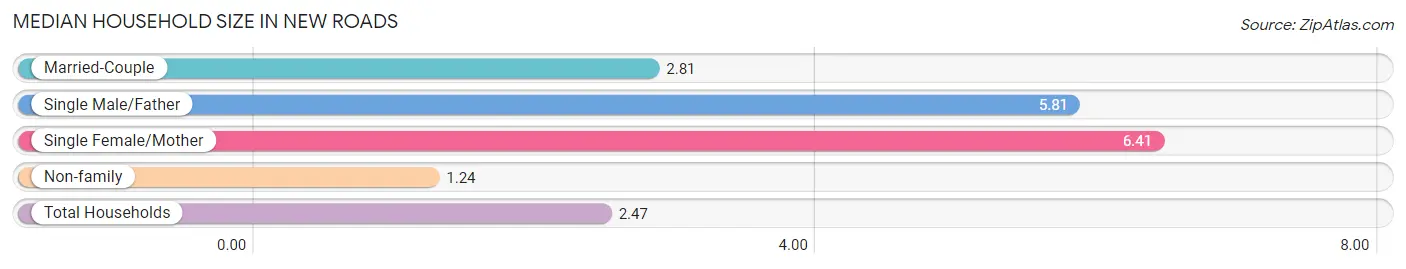
The median household size in New Roads is 2.47 persons per household, with single female/mother households (201 | 11.3%) accounting for the largest median household size of 6.41 persons per household. non-family households (893 | 50.3%) represent the smallest median household size with 1.24 persons per household.
| Household Type | # Households | Household Size |
| Married-Couple | 653 (36.8%) | 2.81 |
| Single Male/Father | 27 (1.5%) | 5.81 |
| Single Female/Mother | 201 (11.3%) | 6.41 |
| Non-family | 893 (50.3%) | 1.24 |
| Total Households | 1,774 (100.0%) | 2.47 |
Household Size by Marriage Status in New Roads
Out of a total of 1,774 households in New Roads, 881 (49.7%) are family households, while 893 (50.3%) are nonfamily households. The most numerous type of family households are 2-person households, comprising 497, and the most common type of nonfamily households are 1-person households, comprising 656.
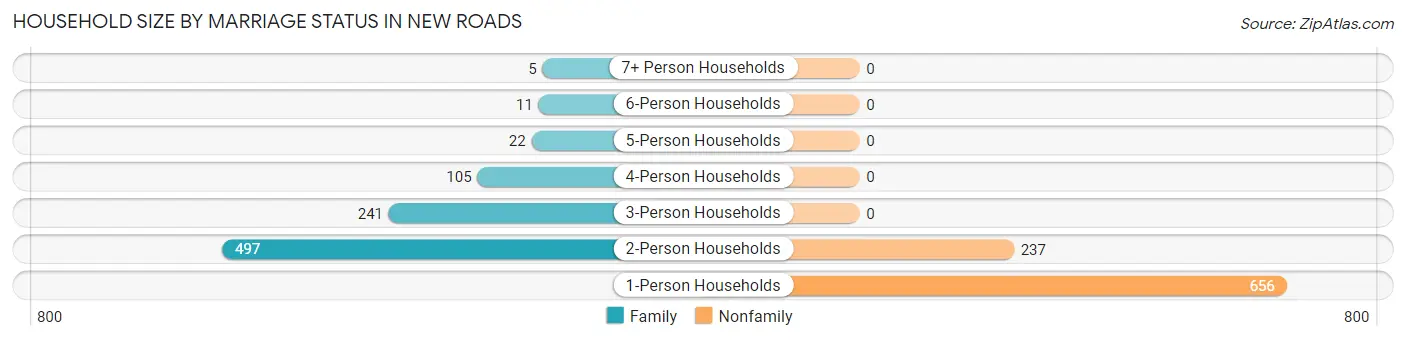
| Household Size | Family Households | Nonfamily Households |
| 1-Person Households | - | 656 (37.0%) |
| 2-Person Households | 497 (28.0%) | 237 (13.4%) |
| 3-Person Households | 241 (13.6%) | 0 (0.0%) |
| 4-Person Households | 105 (5.9%) | 0 (0.0%) |
| 5-Person Households | 22 (1.2%) | 0 (0.0%) |
| 6-Person Households | 11 (0.6%) | 0 (0.0%) |
| 7+ Person Households | 5 (0.3%) | 0 (0.0%) |
| Total | 881 (49.7%) | 893 (50.3%) |
Female Fertility in New Roads
Fertility by Age in New Roads
Average fertility rate in New Roads is 36.0 births per 1,000 women. Women in the age bracket of 15 to 19 years have the highest fertility rate with 333.0 births per 1,000 women. Women in the age bracket of 20 to 34 years acount for 75.0% of all women with births.
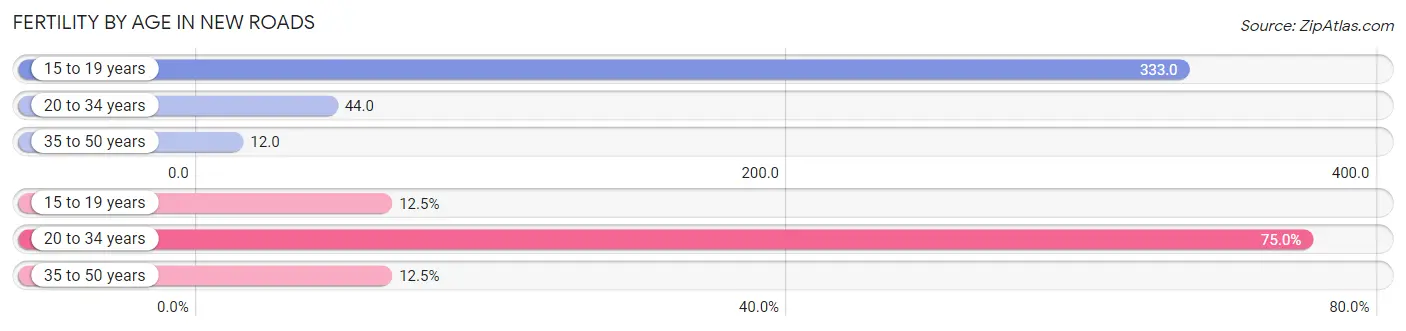
| Age Bracket | Women with Births | Births / 1,000 Women |
| 15 to 19 years | 3 (12.5%) | 333.0 |
| 20 to 34 years | 18 (75.0%) | 44.0 |
| 35 to 50 years | 3 (12.5%) | 12.0 |
| Total | 24 (100.0%) | 36.0 |
Fertility by Age by Marriage Status in New Roads
87.5% of women with births (24) in New Roads are married. The highest percentage of unmarried women with births falls into 15 to 19 years age bracket with 100.0% of them unmarried at the time of birth, while the lowest percentage of unmarried women with births belong to 20 to 34 years age bracket with 0.0% of them unmarried.
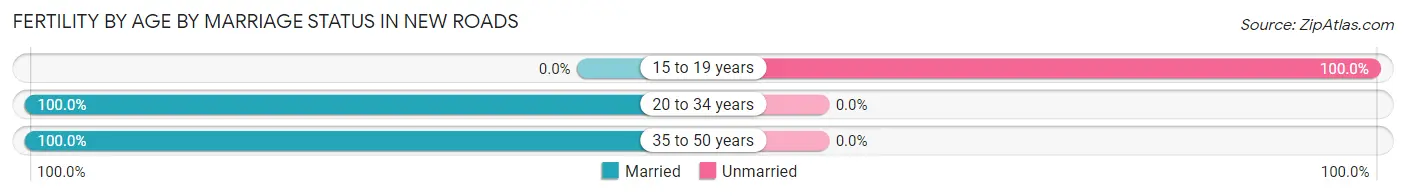
| Age Bracket | Married | Unmarried |
| 15 to 19 years | 0 (0.0%) | 3 (100.0%) |
| 20 to 34 years | 18 (100.0%) | 0 (0.0%) |
| 35 to 50 years | 3 (100.0%) | 0 (0.0%) |
| Total | 21 (87.5%) | 3 (12.5%) |
Fertility by Education in New Roads
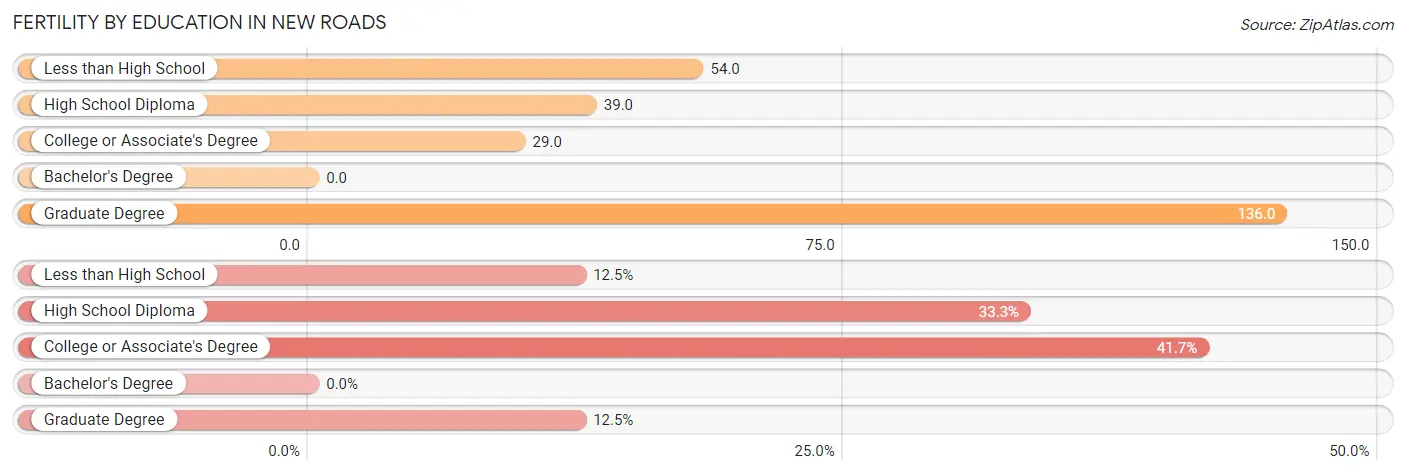
| Educational Attainment | Women with Births | Births / 1,000 Women |
| Less than High School | 3 (12.5%) | 54.0 |
| High School Diploma | 8 (33.3%) | 39.0 |
| College or Associate's Degree | 10 (41.7%) | 29.0 |
| Bachelor's Degree | 0 (0.0%) | 0.0 |
| Graduate Degree | 3 (12.5%) | 136.0 |
| Total | 24 (100.0%) | 36.0 |
Fertility by Education by Marriage Status in New Roads
12.5% of women with births in New Roads are unmarried. Women with the educational attainment of less than high school are most likely to be married with 100.0% of them married at childbirth, while women with the educational attainment of high school diploma are least likely to be married with 37.5% of them unmarried at childbirth.
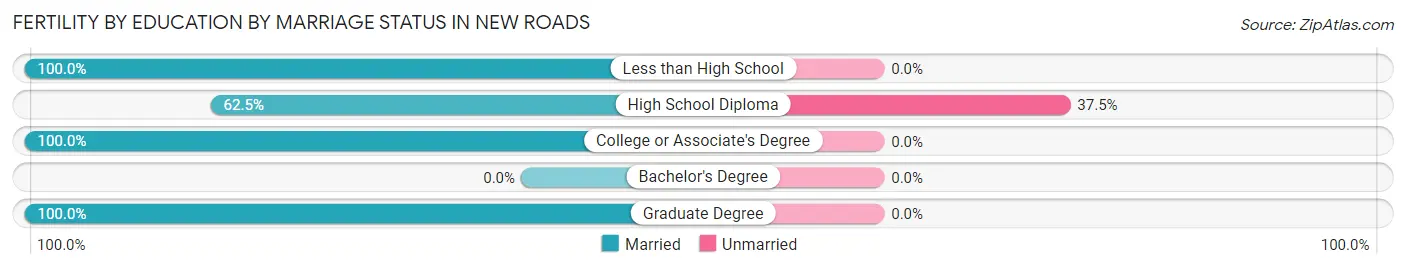
| Educational Attainment | Married | Unmarried |
| Less than High School | 3 (100.0%) | 0 (0.0%) |
| High School Diploma | 5 (62.5%) | 3 (37.5%) |
| College or Associate's Degree | 10 (100.0%) | 0 (0.0%) |
| Bachelor's Degree | 0 (0.0%) | 0 (0.0%) |
| Graduate Degree | 3 (100.0%) | 0 (0.0%) |
| Total | 21 (87.5%) | 3 (12.5%) |
Employment Characteristics in New Roads
Employment by Class of Employer in New Roads
Among the 1,835 employed individuals in New Roads, private company employees (1,284 | 70.0%), local government employees (266 | 14.5%), and state government employees (120 | 6.5%) make up the most common classes of employment.
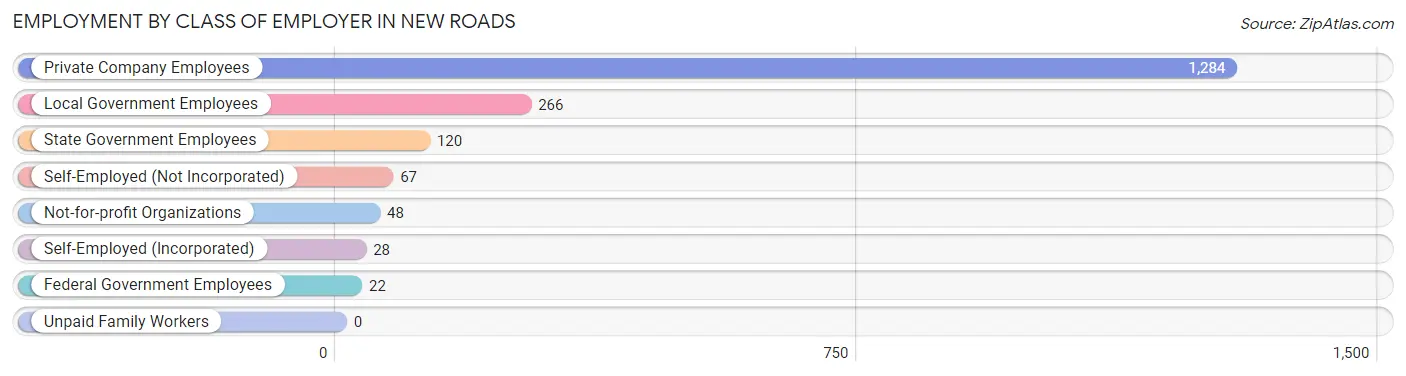
| Employer Class | # Employees | % Employees |
| Private Company Employees | 1,284 | 70.0% |
| Self-Employed (Incorporated) | 28 | 1.5% |
| Self-Employed (Not Incorporated) | 67 | 3.6% |
| Not-for-profit Organizations | 48 | 2.6% |
| Local Government Employees | 266 | 14.5% |
| State Government Employees | 120 | 6.5% |
| Federal Government Employees | 22 | 1.2% |
| Unpaid Family Workers | 0 | 0.0% |
| Total | 1,835 | 100.0% |
Employment Status by Age in New Roads
According to the labor force statistics for New Roads, out of the total population over 16 years of age (3,811), 52.5% or 2,001 individuals are in the labor force, with 8.0% or 160 of them unemployed. The age group with the highest labor force participation rate is 25 to 29 years, with 81.3% or 443 individuals in the labor force. Within the labor force, the 60 to 64 years age range has the highest percentage of unemployed individuals, with 22.4% or 58 of them being unemployed.
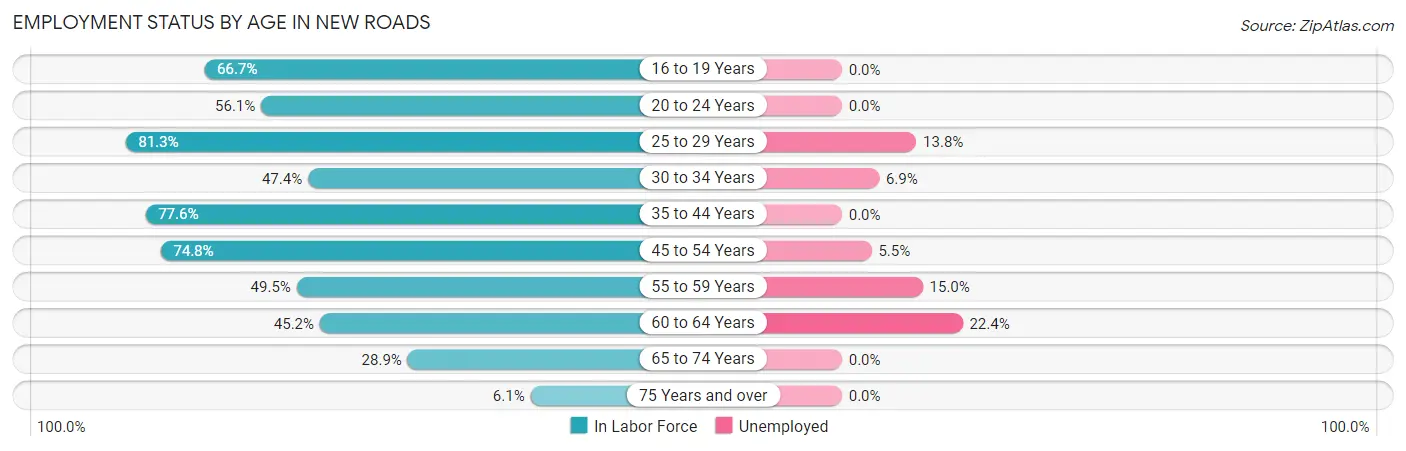
| Age Bracket | In Labor Force | Unemployed |
| 16 to 19 Years | 34 (66.7%) | 0 (0.0%) |
| 20 to 24 Years | 97 (56.1%) | 0 (0.0%) |
| 25 to 29 Years | 443 (81.3%) | 61 (13.8%) |
| 30 to 34 Years | 101 (47.4%) | 7 (6.9%) |
| 35 to 44 Years | 406 (77.6%) | 0 (0.0%) |
| 45 to 54 Years | 332 (74.8%) | 18 (5.5%) |
| 55 to 59 Years | 107 (49.5%) | 16 (15.0%) |
| 60 to 64 Years | 259 (45.2%) | 58 (22.4%) |
| 65 to 74 Years | 197 (28.9%) | 0 (0.0%) |
| 75 Years and over | 24 (6.1%) | 0 (0.0%) |
| Total | 2,001 (52.5%) | 160 (8.0%) |
Employment Status by Educational Attainment in New Roads
According to labor force statistics for New Roads, 65.6% of individuals (1,649) out of the total population between 25 and 64 years of age (2,514) are in the labor force, with 9.7% or 160 of them being unemployed. The group with the highest labor force participation rate are those with the educational attainment of bachelor's degree or higher, with 84.1% or 322 individuals in the labor force. Within the labor force, individuals with less than high school education have the highest percentage of unemployment, with 18.8% or 18 of them being unemployed.
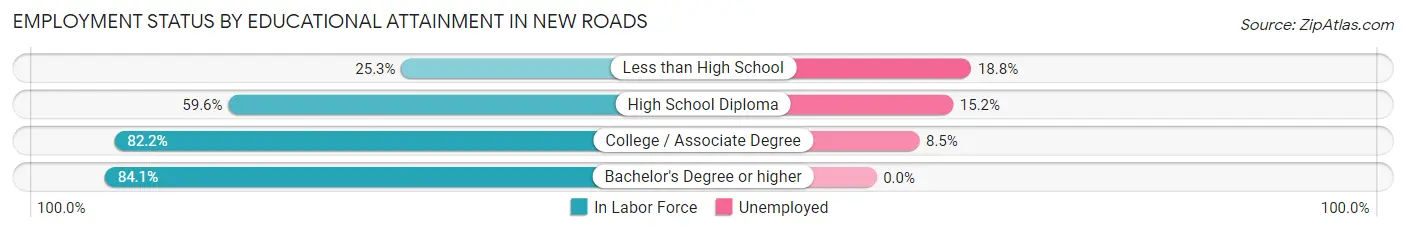
| Educational Attainment | In Labor Force | Unemployed |
| Less than High School | 96 (25.3%) | 71 (18.8%) |
| High School Diploma | 551 (59.6%) | 141 (15.2%) |
| College / Associate Degree | 679 (82.2%) | 70 (8.5%) |
| Bachelor's Degree or higher | 322 (84.1%) | 0 (0.0%) |
| Total | 1,649 (65.6%) | 244 (9.7%) |
Employment Occupations by Sex in New Roads
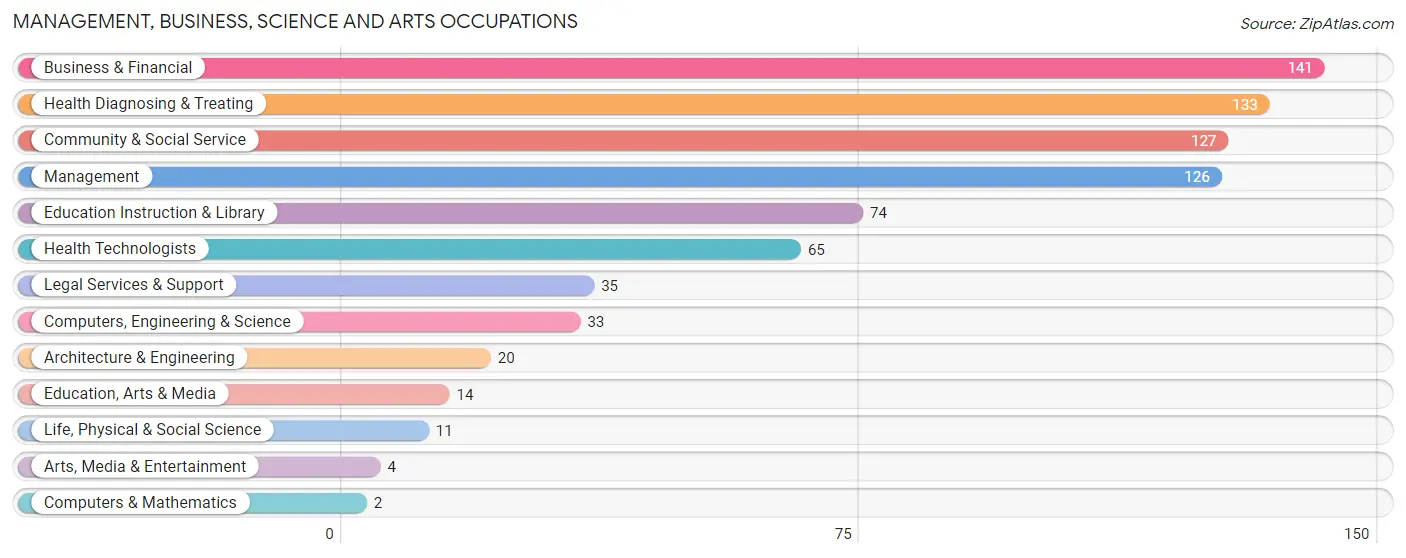
Management, Business, Science and Arts Occupations
The most common Management, Business, Science and Arts occupations in New Roads are Business & Financial (141 | 7.7%), Health Diagnosing & Treating (133 | 7.2%), Community & Social Service (127 | 6.9%), Management (126 | 6.9%), and Education Instruction & Library (74 | 4.0%).
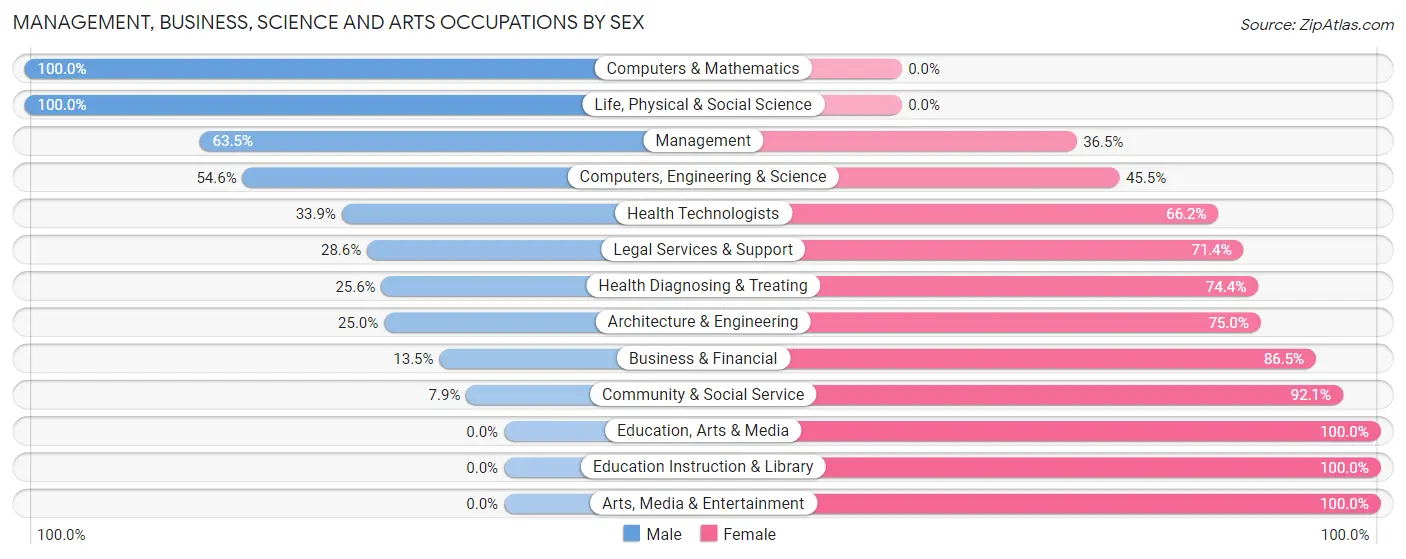
Management, Business, Science and Arts Occupations by Sex
Within the Management, Business, Science and Arts occupations in New Roads, the most male-oriented occupations are Computers & Mathematics (100.0%), Life, Physical & Social Science (100.0%), and Management (63.5%), while the most female-oriented occupations are Education, Arts & Media (100.0%), Education Instruction & Library (100.0%), and Arts, Media & Entertainment (100.0%).
| Occupation | Male | Female |
| Management | 80 (63.5%) | 46 (36.5%) |
| Business & Financial | 19 (13.5%) | 122 (86.5%) |
| Computers, Engineering & Science | 18 (54.5%) | 15 (45.5%) |
| Computers & Mathematics | 2 (100.0%) | 0 (0.0%) |
| Architecture & Engineering | 5 (25.0%) | 15 (75.0%) |
| Life, Physical & Social Science | 11 (100.0%) | 0 (0.0%) |
| Community & Social Service | 10 (7.9%) | 117 (92.1%) |
| Education, Arts & Media | 0 (0.0%) | 14 (100.0%) |
| Legal Services & Support | 10 (28.6%) | 25 (71.4%) |
| Education Instruction & Library | 0 (0.0%) | 74 (100.0%) |
| Arts, Media & Entertainment | 0 (0.0%) | 4 (100.0%) |
| Health Diagnosing & Treating | 34 (25.6%) | 99 (74.4%) |
| Health Technologists | 22 (33.9%) | 43 (66.1%) |
| Total (Category) | 161 (28.7%) | 399 (71.3%) |
| Total (Overall) | 952 (51.9%) | 882 (48.1%) |
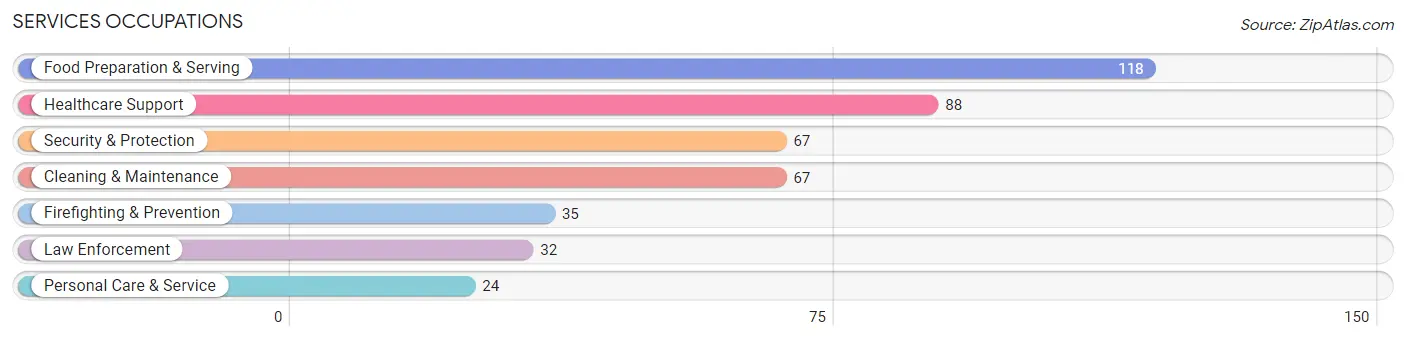
Services Occupations
The most common Services occupations in New Roads are Food Preparation & Serving (118 | 6.4%), Healthcare Support (88 | 4.8%), Security & Protection (67 | 3.6%), Cleaning & Maintenance (67 | 3.6%), and Firefighting & Prevention (35 | 1.9%).
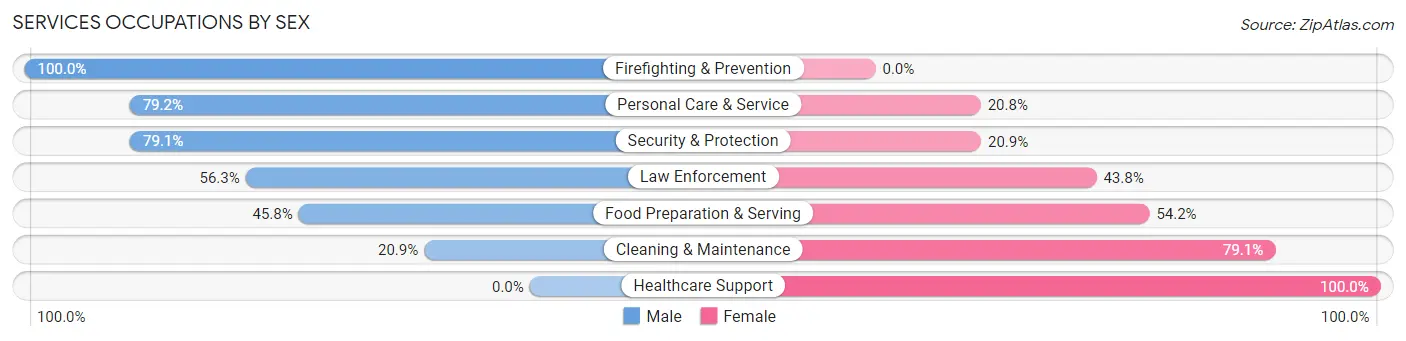
Services Occupations by Sex
Within the Services occupations in New Roads, the most male-oriented occupations are Firefighting & Prevention (100.0%), Personal Care & Service (79.2%), and Security & Protection (79.1%), while the most female-oriented occupations are Healthcare Support (100.0%), Cleaning & Maintenance (79.1%), and Food Preparation & Serving (54.2%).
| Occupation | Male | Female |
| Healthcare Support | 0 (0.0%) | 88 (100.0%) |
| Security & Protection | 53 (79.1%) | 14 (20.9%) |
| Firefighting & Prevention | 35 (100.0%) | 0 (0.0%) |
| Law Enforcement | 18 (56.2%) | 14 (43.8%) |
| Food Preparation & Serving | 54 (45.8%) | 64 (54.2%) |
| Cleaning & Maintenance | 14 (20.9%) | 53 (79.1%) |
| Personal Care & Service | 19 (79.2%) | 5 (20.8%) |
| Total (Category) | 140 (38.5%) | 224 (61.5%) |
| Total (Overall) | 952 (51.9%) | 882 (48.1%) |
Sales and Office Occupations
The most common Sales and Office occupations in New Roads are Office & Administration (178 | 9.7%), and Sales & Related (135 | 7.4%).
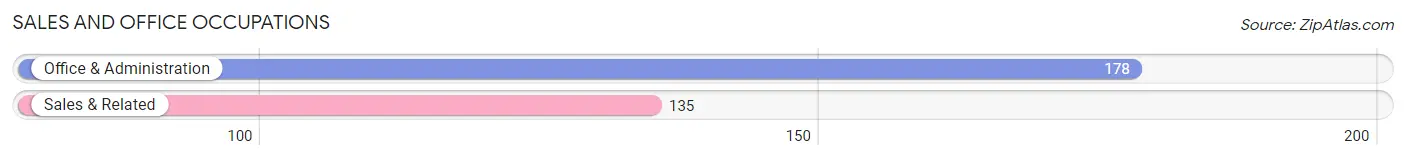
Sales and Office Occupations by Sex

| Occupation | Male | Female |
| Sales & Related | 48 (35.6%) | 87 (64.4%) |
| Office & Administration | 6 (3.4%) | 172 (96.6%) |
| Total (Category) | 54 (17.2%) | 259 (82.8%) |
| Total (Overall) | 952 (51.9%) | 882 (48.1%) |
Natural Resources, Construction and Maintenance Occupations
The most common Natural Resources, Construction and Maintenance occupations in New Roads are Installation, Maintenance & Repair (119 | 6.5%), and Construction & Extraction (24 | 1.3%).

Natural Resources, Construction and Maintenance Occupations by Sex

| Occupation | Male | Female |
| Farming, Fishing & Forestry | 0 (0.0%) | 0 (0.0%) |
| Construction & Extraction | 24 (100.0%) | 0 (0.0%) |
| Installation, Maintenance & Repair | 119 (100.0%) | 0 (0.0%) |
| Total (Category) | 143 (100.0%) | 0 (0.0%) |
| Total (Overall) | 952 (51.9%) | 882 (48.1%) |
Production, Transportation and Moving Occupations
The most common Production, Transportation and Moving occupations in New Roads are Material Moving (277 | 15.1%), Production (170 | 9.3%), and Transportation (7 | 0.4%).
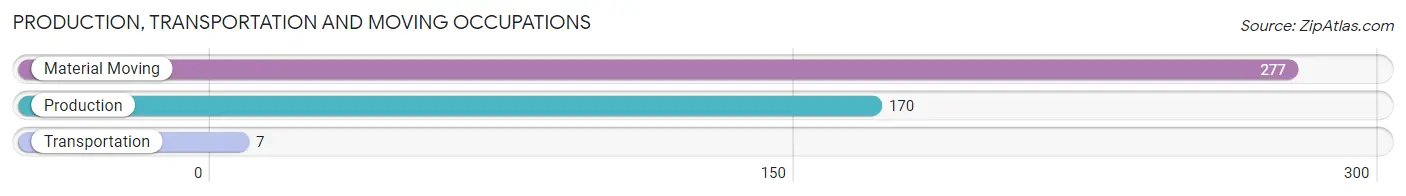
Production, Transportation and Moving Occupations by Sex
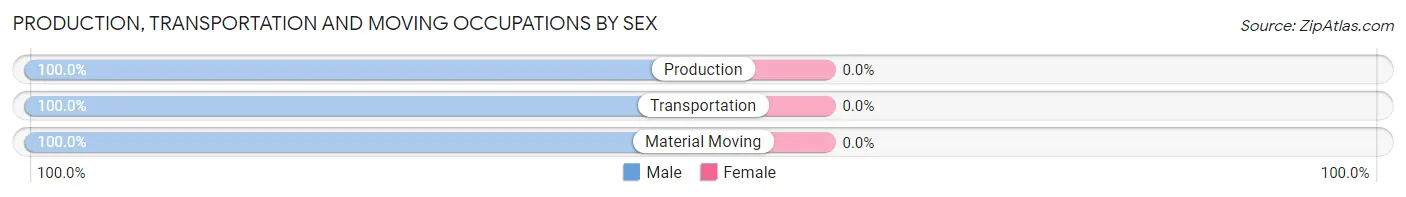
| Occupation | Male | Female |
| Production | 170 (100.0%) | 0 (0.0%) |
| Transportation | 7 (100.0%) | 0 (0.0%) |
| Material Moving | 277 (100.0%) | 0 (0.0%) |
| Total (Category) | 454 (100.0%) | 0 (0.0%) |
| Total (Overall) | 952 (51.9%) | 882 (48.1%) |
Employment Industries by Sex in New Roads
Employment Industries in New Roads
The major employment industries in New Roads include Manufacturing (429 | 23.4%), Health Care & Social Assistance (246 | 13.4%), Retail Trade (224 | 12.2%), Public Administration (165 | 9.0%), and Construction (152 | 8.3%).
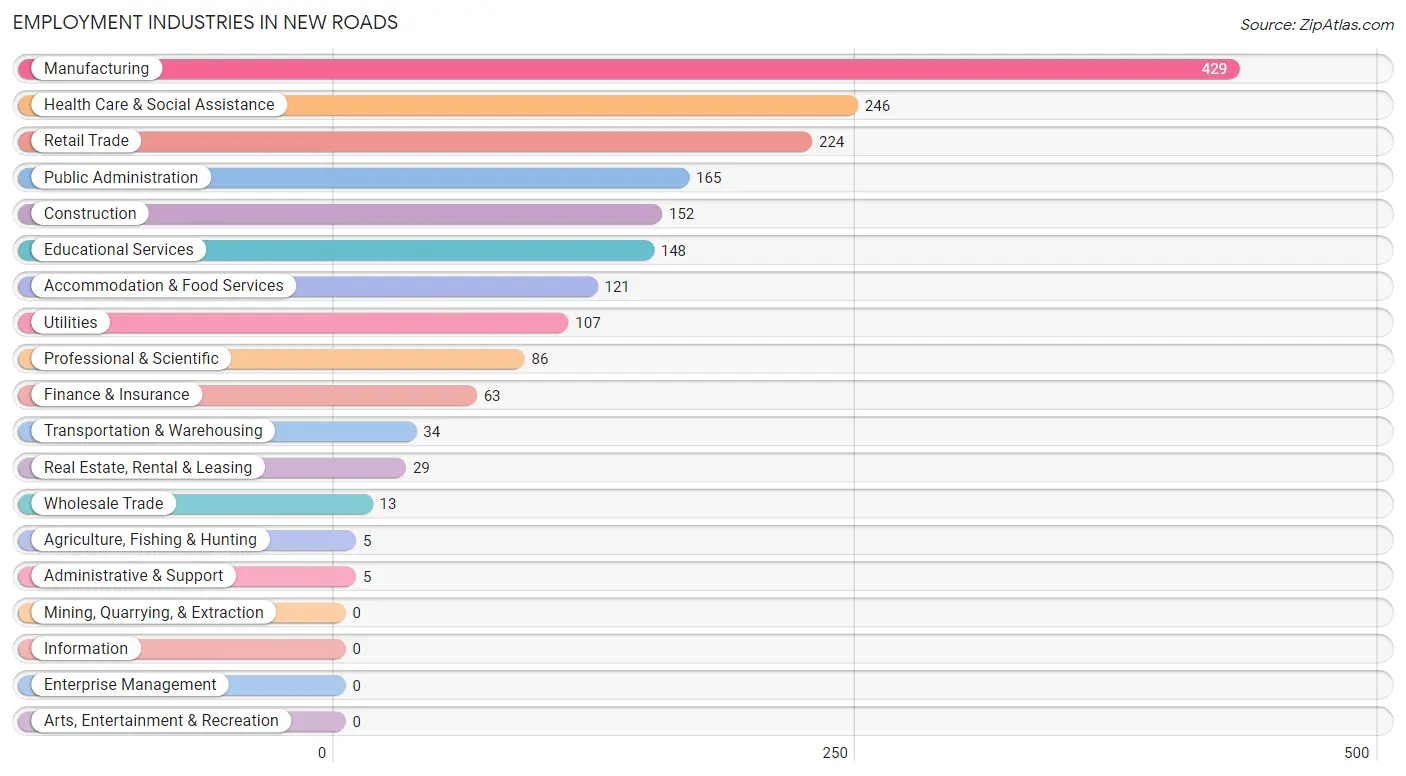
Employment Industries by Sex in New Roads
The New Roads industries that see more men than women are Utilities (100.0%), Administrative & Support (100.0%), and Manufacturing (97.0%), whereas the industries that tend to have a higher number of women are Agriculture, Fishing & Hunting (100.0%), Educational Services (100.0%), and Real Estate, Rental & Leasing (86.2%).
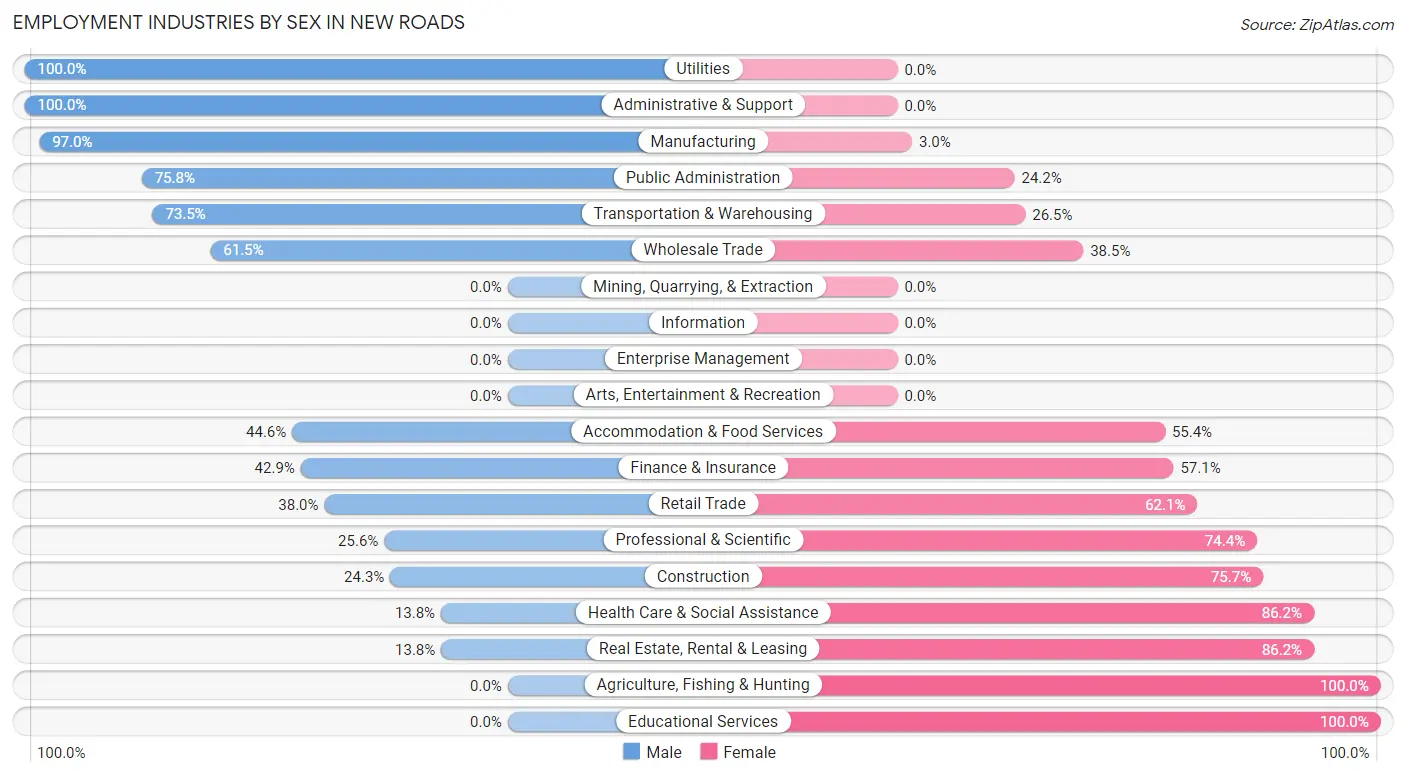
| Industry | Male | Female |
| Agriculture, Fishing & Hunting | 0 (0.0%) | 5 (100.0%) |
| Mining, Quarrying, & Extraction | 0 (0.0%) | 0 (0.0%) |
| Construction | 37 (24.3%) | 115 (75.7%) |
| Manufacturing | 416 (97.0%) | 13 (3.0%) |
| Wholesale Trade | 8 (61.5%) | 5 (38.5%) |
| Retail Trade | 85 (38.0%) | 139 (62.1%) |
| Transportation & Warehousing | 25 (73.5%) | 9 (26.5%) |
| Utilities | 107 (100.0%) | 0 (0.0%) |
| Information | 0 (0.0%) | 0 (0.0%) |
| Finance & Insurance | 27 (42.9%) | 36 (57.1%) |
| Real Estate, Rental & Leasing | 4 (13.8%) | 25 (86.2%) |
| Professional & Scientific | 22 (25.6%) | 64 (74.4%) |
| Enterprise Management | 0 (0.0%) | 0 (0.0%) |
| Administrative & Support | 5 (100.0%) | 0 (0.0%) |
| Educational Services | 0 (0.0%) | 148 (100.0%) |
| Health Care & Social Assistance | 34 (13.8%) | 212 (86.2%) |
| Arts, Entertainment & Recreation | 0 (0.0%) | 0 (0.0%) |
| Accommodation & Food Services | 54 (44.6%) | 67 (55.4%) |
| Public Administration | 125 (75.8%) | 40 (24.2%) |
| Total | 952 (51.9%) | 882 (48.1%) |
Education in New Roads
School Enrollment in New Roads
The most common levels of schooling among the 769 students in New Roads are middle school (277 | 36.0%), elementary school (179 | 23.3%), and college / undergraduate (170 | 22.1%).
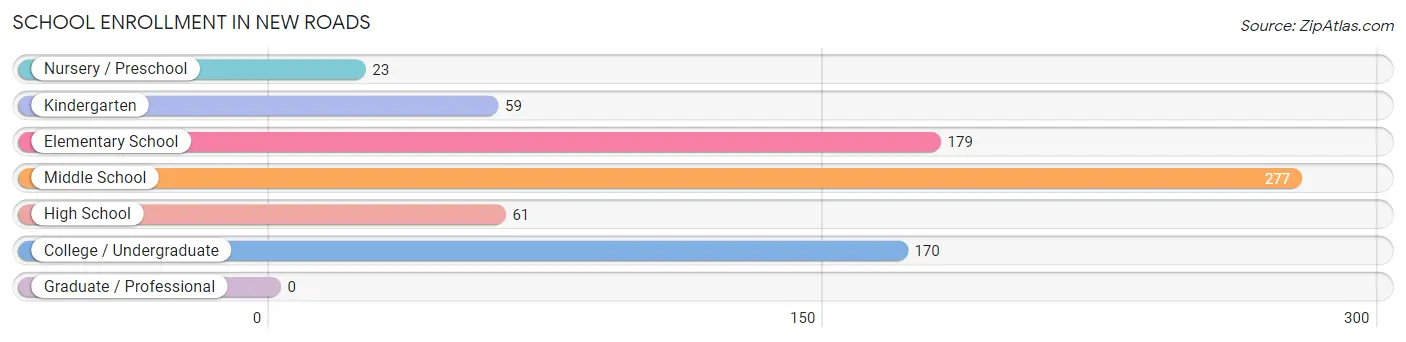
| School Level | # Students | % Students |
| Nursery / Preschool | 23 | 3.0% |
| Kindergarten | 59 | 7.7% |
| Elementary School | 179 | 23.3% |
| Middle School | 277 | 36.0% |
| High School | 61 | 7.9% |
| College / Undergraduate | 170 | 22.1% |
| Graduate / Professional | 0 | 0.0% |
| Total | 769 | 100.0% |
School Enrollment by Age by Funding Source in New Roads
Out of a total of 769 students who are enrolled in schools in New Roads, 226 (29.4%) attend a private institution, while the remaining 543 (70.6%) are enrolled in public schools. The age group of 18 to 19 year olds has the highest likelihood of being enrolled in private schools, with 31 (100.0% in the age bracket) enrolled. Conversely, the age group of 10 to 14 year olds has the lowest likelihood of being enrolled in a private school, with 294 (95.2% in the age bracket) attending a public institution.
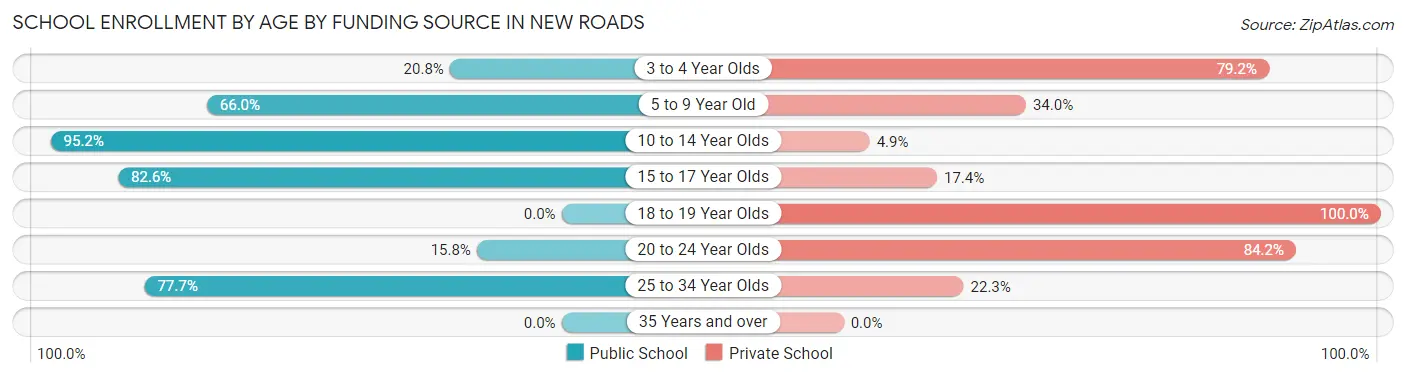
| Age Bracket | Public School | Private School |
| 3 to 4 Year Olds | 5 (20.8%) | 19 (79.2%) |
| 5 to 9 Year Old | 140 (66.0%) | 72 (34.0%) |
| 10 to 14 Year Olds | 294 (95.2%) | 15 (4.9%) |
| 15 to 17 Year Olds | 19 (82.6%) | 4 (17.4%) |
| 18 to 19 Year Olds | 0 (0.0%) | 31 (100.0%) |
| 20 to 24 Year Olds | 12 (15.8%) | 64 (84.2%) |
| 25 to 34 Year Olds | 73 (77.7%) | 21 (22.3%) |
| 35 Years and over | 0 (0.0%) | 0 (0.0%) |
| Total | 543 (70.6%) | 226 (29.4%) |
Educational Attainment by Field of Study in New Roads
Education (114 | 19.2%), business (106 | 17.9%), arts & humanities (86 | 14.5%), computers & mathematics (65 | 11.0%), and engineering (47 | 7.9%) are the most common fields of study among 593 individuals in New Roads who have obtained a bachelor's degree or higher.
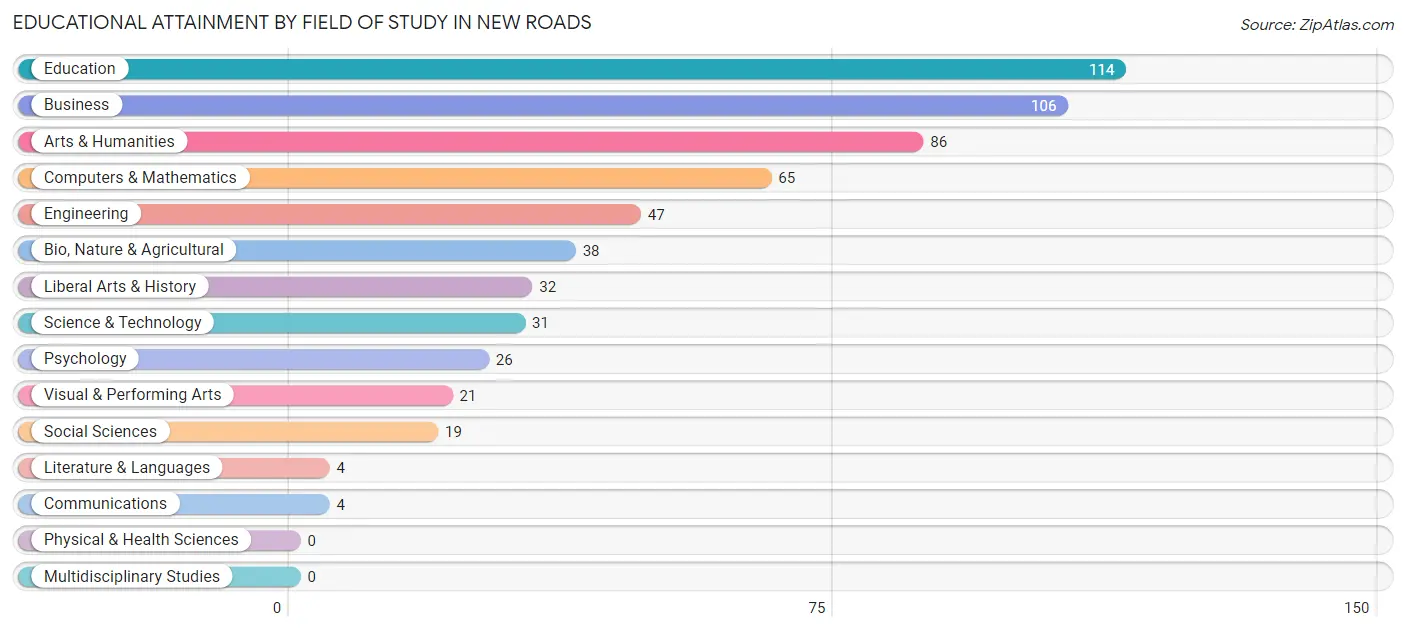
| Field of Study | # Graduates | % Graduates |
| Computers & Mathematics | 65 | 11.0% |
| Bio, Nature & Agricultural | 38 | 6.4% |
| Physical & Health Sciences | 0 | 0.0% |
| Psychology | 26 | 4.4% |
| Social Sciences | 19 | 3.2% |
| Engineering | 47 | 7.9% |
| Multidisciplinary Studies | 0 | 0.0% |
| Science & Technology | 31 | 5.2% |
| Business | 106 | 17.9% |
| Education | 114 | 19.2% |
| Literature & Languages | 4 | 0.7% |
| Liberal Arts & History | 32 | 5.4% |
| Visual & Performing Arts | 21 | 3.5% |
| Communications | 4 | 0.7% |
| Arts & Humanities | 86 | 14.5% |
| Total | 593 | 100.0% |
Transportation & Commute in New Roads
Vehicle Availability by Sex in New Roads
The most prevalent vehicle ownership categories in New Roads are males with 2 vehicles (761, accounting for 79.4%) and females with 2 vehicles (435, making up 86.8%).
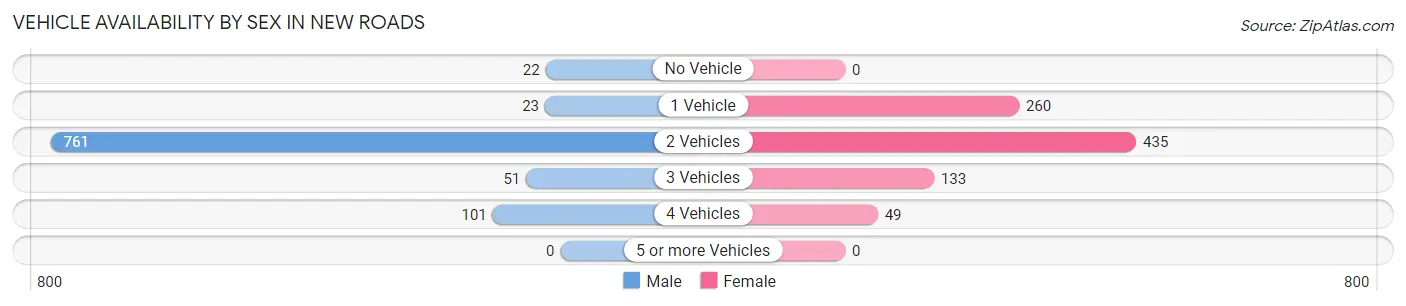
| Vehicles Available | Male | Female |
| No Vehicle | 22 (2.3%) | 0 (0.0%) |
| 1 Vehicle | 23 (2.4%) | 260 (29.6%) |
| 2 Vehicles | 761 (79.4%) | 435 (49.6%) |
| 3 Vehicles | 51 (5.3%) | 133 (15.2%) |
| 4 Vehicles | 101 (10.5%) | 49 (5.6%) |
| 5 or more Vehicles | 0 (0.0%) | 0 (0.0%) |
| Total | 958 (100.0%) | 877 (100.0%) |
Commute Time in New Roads
The most frequently occuring commute durations in New Roads are 15 to 19 minutes (386 commuters, 21.5%), 45 to 59 minutes (250 commuters, 13.9%), and 10 to 14 minutes (200 commuters, 11.1%).
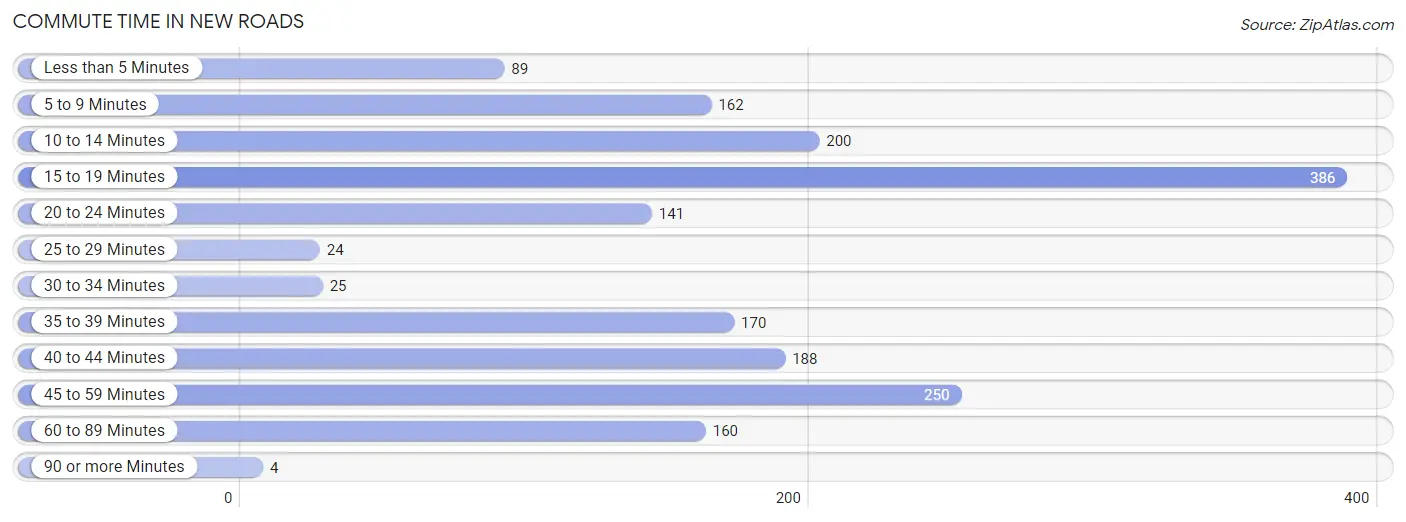
| Commute Time | # Commuters | % Commuters |
| Less than 5 Minutes | 89 | 5.0% |
| 5 to 9 Minutes | 162 | 9.0% |
| 10 to 14 Minutes | 200 | 11.1% |
| 15 to 19 Minutes | 386 | 21.5% |
| 20 to 24 Minutes | 141 | 7.8% |
| 25 to 29 Minutes | 24 | 1.3% |
| 30 to 34 Minutes | 25 | 1.4% |
| 35 to 39 Minutes | 170 | 9.5% |
| 40 to 44 Minutes | 188 | 10.4% |
| 45 to 59 Minutes | 250 | 13.9% |
| 60 to 89 Minutes | 160 | 8.9% |
| 90 or more Minutes | 4 | 0.2% |
Commute Time by Sex in New Roads
The most common commute times in New Roads are 15 to 19 minutes (289 commuters, 30.9%) for males and 40 to 44 minutes (173 commuters, 20.1%) for females.
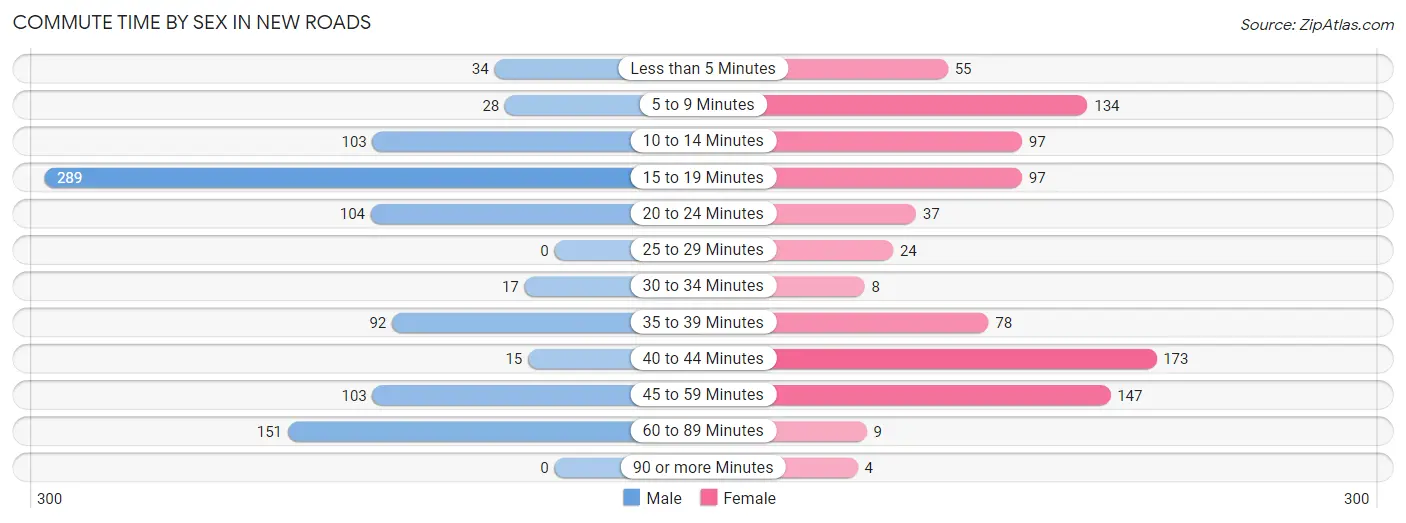
| Commute Time | Male | Female |
| Less than 5 Minutes | 34 (3.6%) | 55 (6.4%) |
| 5 to 9 Minutes | 28 (3.0%) | 134 (15.5%) |
| 10 to 14 Minutes | 103 (11.0%) | 97 (11.2%) |
| 15 to 19 Minutes | 289 (30.9%) | 97 (11.2%) |
| 20 to 24 Minutes | 104 (11.1%) | 37 (4.3%) |
| 25 to 29 Minutes | 0 (0.0%) | 24 (2.8%) |
| 30 to 34 Minutes | 17 (1.8%) | 8 (0.9%) |
| 35 to 39 Minutes | 92 (9.8%) | 78 (9.0%) |
| 40 to 44 Minutes | 15 (1.6%) | 173 (20.1%) |
| 45 to 59 Minutes | 103 (11.0%) | 147 (17.0%) |
| 60 to 89 Minutes | 151 (16.1%) | 9 (1.0%) |
| 90 or more Minutes | 0 (0.0%) | 4 (0.5%) |
Time of Departure to Work by Sex in New Roads
The most frequent times of departure to work in New Roads are 6:30 AM to 6:59 AM (269, 28.7%) for males and 6:00 AM to 6:29 AM (158, 18.3%) for females.
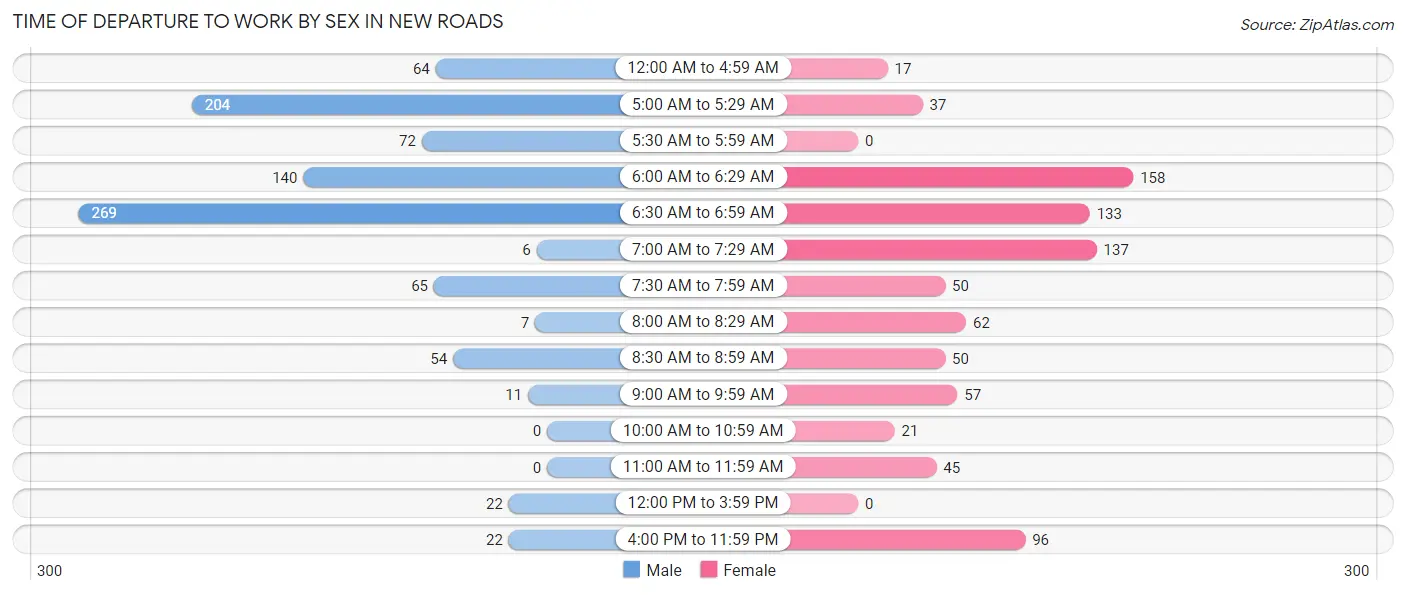
| Time of Departure | Male | Female |
| 12:00 AM to 4:59 AM | 64 (6.8%) | 17 (2.0%) |
| 5:00 AM to 5:29 AM | 204 (21.8%) | 37 (4.3%) |
| 5:30 AM to 5:59 AM | 72 (7.7%) | 0 (0.0%) |
| 6:00 AM to 6:29 AM | 140 (15.0%) | 158 (18.3%) |
| 6:30 AM to 6:59 AM | 269 (28.7%) | 133 (15.4%) |
| 7:00 AM to 7:29 AM | 6 (0.6%) | 137 (15.9%) |
| 7:30 AM to 7:59 AM | 65 (6.9%) | 50 (5.8%) |
| 8:00 AM to 8:29 AM | 7 (0.7%) | 62 (7.2%) |
| 8:30 AM to 8:59 AM | 54 (5.8%) | 50 (5.8%) |
| 9:00 AM to 9:59 AM | 11 (1.2%) | 57 (6.6%) |
| 10:00 AM to 10:59 AM | 0 (0.0%) | 21 (2.4%) |
| 11:00 AM to 11:59 AM | 0 (0.0%) | 45 (5.2%) |
| 12:00 PM to 3:59 PM | 22 (2.4%) | 0 (0.0%) |
| 4:00 PM to 11:59 PM | 22 (2.4%) | 96 (11.1%) |
| Total | 936 (100.0%) | 863 (100.0%) |
Housing Occupancy in New Roads
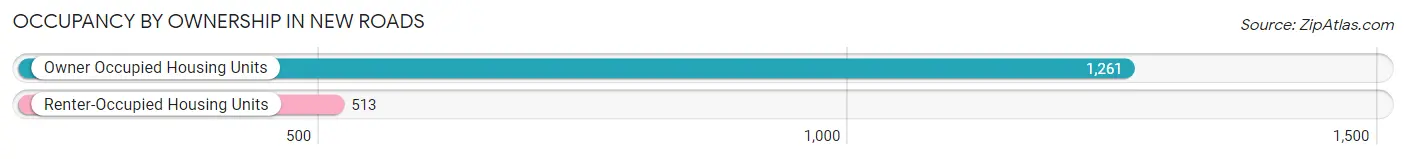
Occupancy by Ownership in New Roads
Of the total 1,774 dwellings in New Roads, owner-occupied units account for 1,261 (71.1%), while renter-occupied units make up 513 (28.9%).
| Occupancy | # Housing Units | % Housing Units |
| Owner Occupied Housing Units | 1,261 | 71.1% |
| Renter-Occupied Housing Units | 513 | 28.9% |
| Total Occupied Housing Units | 1,774 | 100.0% |
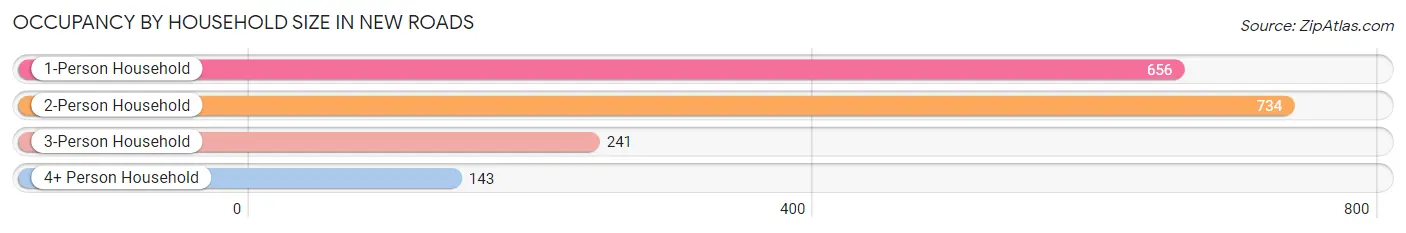
Occupancy by Household Size in New Roads
| Household Size | # Housing Units | % Housing Units |
| 1-Person Household | 656 | 37.0% |
| 2-Person Household | 734 | 41.4% |
| 3-Person Household | 241 | 13.6% |
| 4+ Person Household | 143 | 8.1% |
| Total Housing Units | 1,774 | 100.0% |
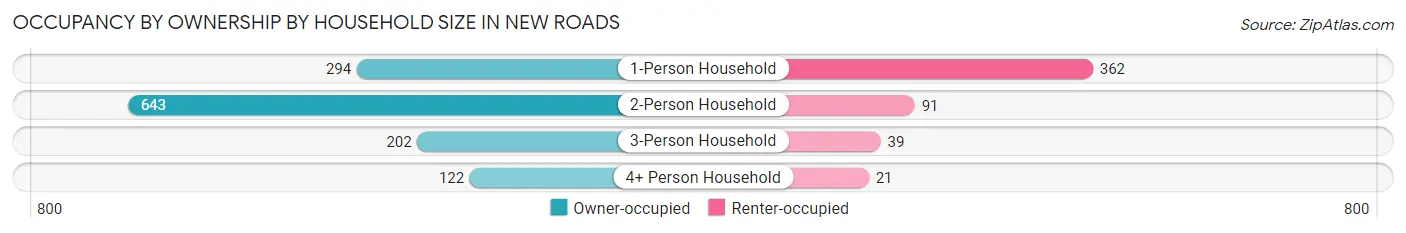
Occupancy by Ownership by Household Size in New Roads
| Household Size | Owner-occupied | Renter-occupied |
| 1-Person Household | 294 (44.8%) | 362 (55.2%) |
| 2-Person Household | 643 (87.6%) | 91 (12.4%) |
| 3-Person Household | 202 (83.8%) | 39 (16.2%) |
| 4+ Person Household | 122 (85.3%) | 21 (14.7%) |
| Total Housing Units | 1,261 (71.1%) | 513 (28.9%) |
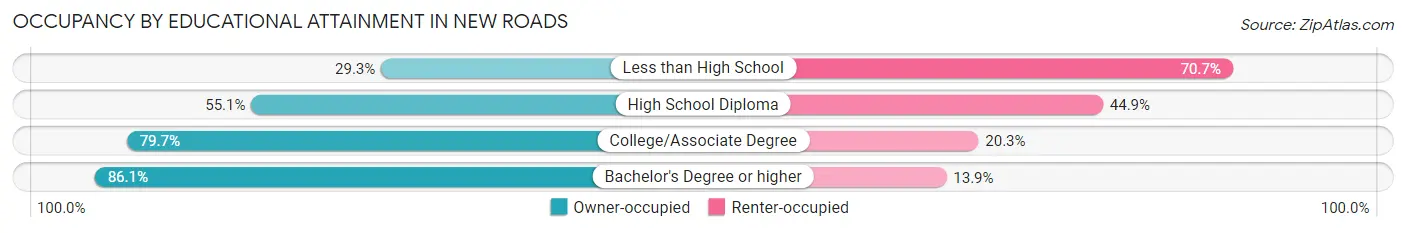
Occupancy by Educational Attainment in New Roads
| Household Size | Owner-occupied | Renter-occupied |
| Less than High School | 34 (29.3%) | 82 (70.7%) |
| High School Diploma | 261 (55.1%) | 213 (44.9%) |
| College/Associate Degree | 669 (79.7%) | 170 (20.3%) |
| Bachelor's Degree or higher | 297 (86.1%) | 48 (13.9%) |
Occupancy by Age of Householder in New Roads
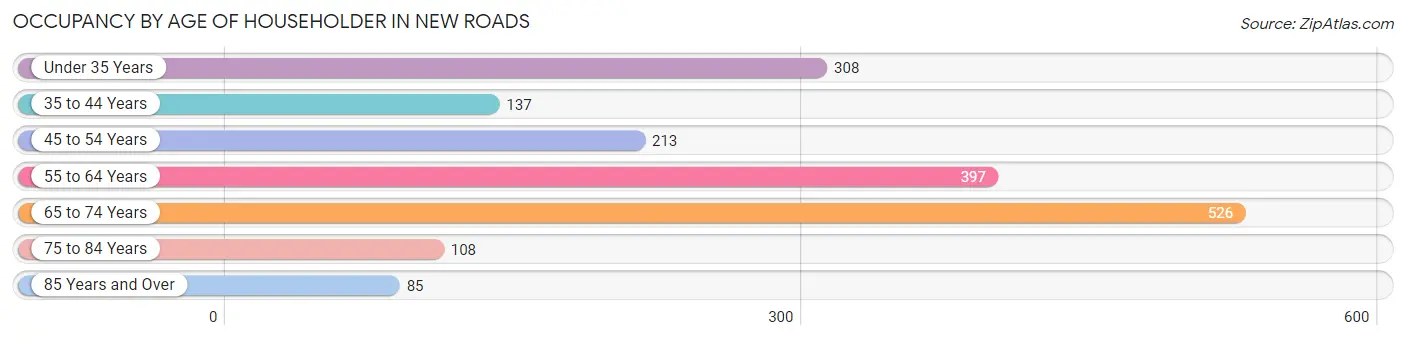
| Age Bracket | # Households | % Households |
| Under 35 Years | 308 | 17.4% |
| 35 to 44 Years | 137 | 7.7% |
| 45 to 54 Years | 213 | 12.0% |
| 55 to 64 Years | 397 | 22.4% |
| 65 to 74 Years | 526 | 29.6% |
| 75 to 84 Years | 108 | 6.1% |
| 85 Years and Over | 85 | 4.8% |
| Total | 1,774 | 100.0% |
Housing Finances in New Roads
Median Income by Occupancy in New Roads
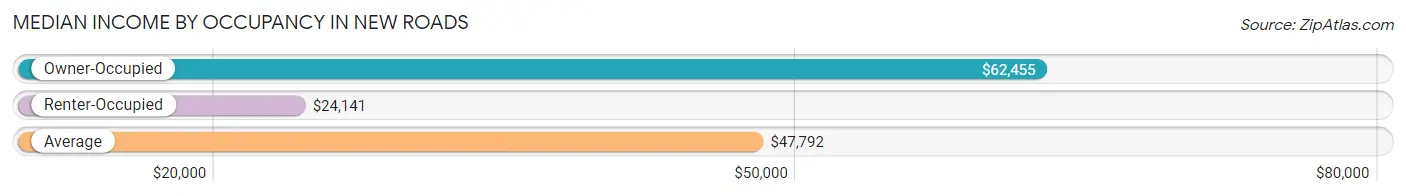
| Occupancy Type | # Households | Median Income |
| Owner-Occupied | 1,261 (71.1%) | $62,455 |
| Renter-Occupied | 513 (28.9%) | $24,141 |
| Average | 1,774 (100.0%) | $47,792 |
Occupancy by Householder Income Bracket in New Roads
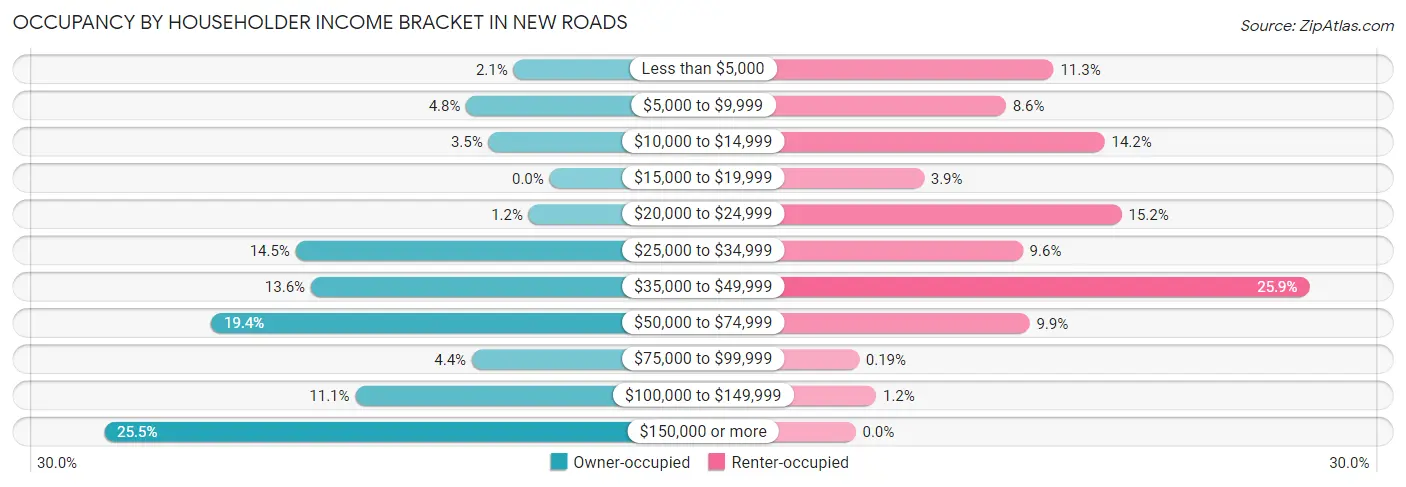
| Income Bracket | Owner-occupied | Renter-occupied |
| Less than $5,000 | 26 (2.1%) | 58 (11.3%) |
| $5,000 to $9,999 | 60 (4.8%) | 44 (8.6%) |
| $10,000 to $14,999 | 44 (3.5%) | 73 (14.2%) |
| $15,000 to $19,999 | 0 (0.0%) | 20 (3.9%) |
| $20,000 to $24,999 | 15 (1.2%) | 78 (15.2%) |
| $25,000 to $34,999 | 183 (14.5%) | 49 (9.6%) |
| $35,000 to $49,999 | 172 (13.6%) | 133 (25.9%) |
| $50,000 to $74,999 | 244 (19.4%) | 51 (9.9%) |
| $75,000 to $99,999 | 56 (4.4%) | 1 (0.2%) |
| $100,000 to $149,999 | 140 (11.1%) | 6 (1.2%) |
| $150,000 or more | 321 (25.5%) | 0 (0.0%) |
| Total | 1,261 (100.0%) | 513 (100.0%) |
Monthly Housing Cost Tiers in New Roads
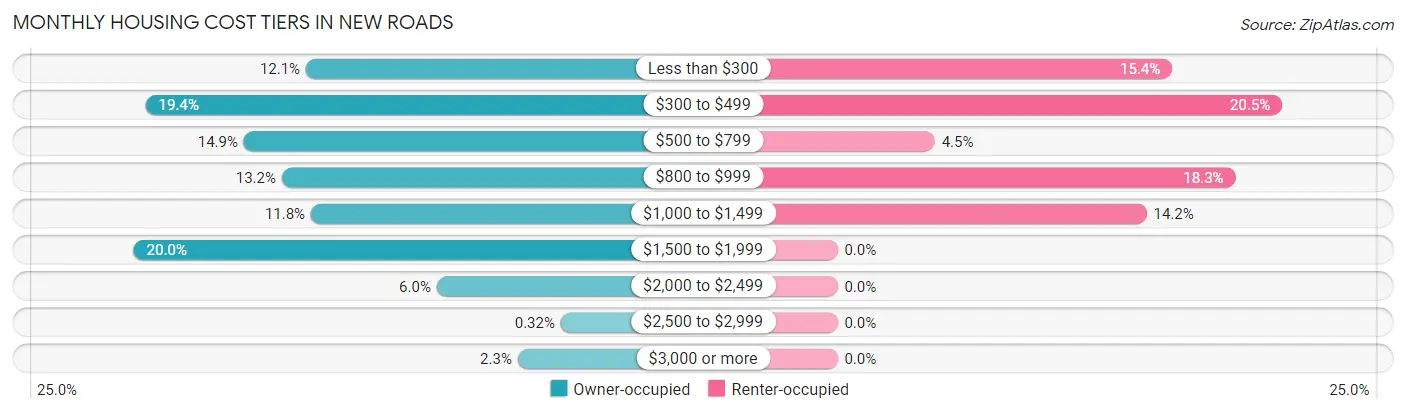
| Monthly Cost | Owner-occupied | Renter-occupied |
| Less than $300 | 152 (12.0%) | 79 (15.4%) |
| $300 to $499 | 245 (19.4%) | 105 (20.5%) |
| $500 to $799 | 188 (14.9%) | 23 (4.5%) |
| $800 to $999 | 166 (13.2%) | 94 (18.3%) |
| $1,000 to $1,499 | 149 (11.8%) | 73 (14.2%) |
| $1,500 to $1,999 | 252 (20.0%) | 0 (0.0%) |
| $2,000 to $2,499 | 76 (6.0%) | 0 (0.0%) |
| $2,500 to $2,999 | 4 (0.3%) | 0 (0.0%) |
| $3,000 or more | 29 (2.3%) | 0 (0.0%) |
| Total | 1,261 (100.0%) | 513 (100.0%) |
Physical Housing Characteristics in New Roads
Housing Structures in New Roads
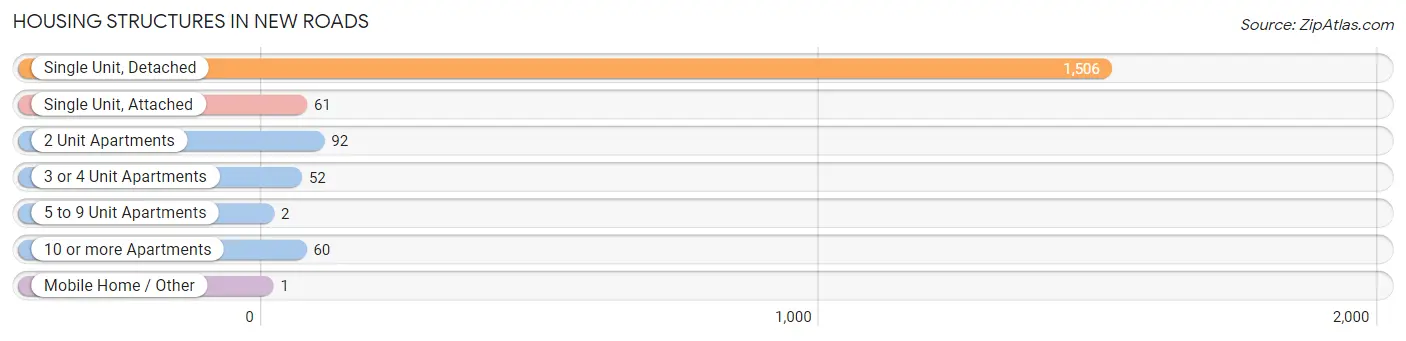
| Structure Type | # Housing Units | % Housing Units |
| Single Unit, Detached | 1,506 | 84.9% |
| Single Unit, Attached | 61 | 3.4% |
| 2 Unit Apartments | 92 | 5.2% |
| 3 or 4 Unit Apartments | 52 | 2.9% |
| 5 to 9 Unit Apartments | 2 | 0.1% |
| 10 or more Apartments | 60 | 3.4% |
| Mobile Home / Other | 1 | 0.1% |
| Total | 1,774 | 100.0% |
Housing Structures by Occupancy in New Roads
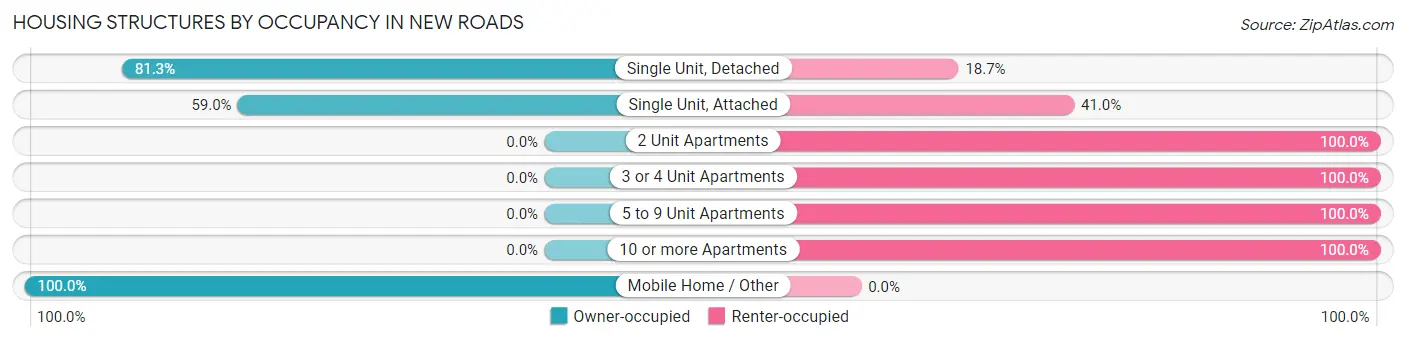
| Structure Type | Owner-occupied | Renter-occupied |
| Single Unit, Detached | 1,224 (81.3%) | 282 (18.7%) |
| Single Unit, Attached | 36 (59.0%) | 25 (41.0%) |
| 2 Unit Apartments | 0 (0.0%) | 92 (100.0%) |
| 3 or 4 Unit Apartments | 0 (0.0%) | 52 (100.0%) |
| 5 to 9 Unit Apartments | 0 (0.0%) | 2 (100.0%) |
| 10 or more Apartments | 0 (0.0%) | 60 (100.0%) |
| Mobile Home / Other | 1 (100.0%) | 0 (0.0%) |
| Total | 1,261 (71.1%) | 513 (28.9%) |
Housing Structures by Number of Rooms in New Roads
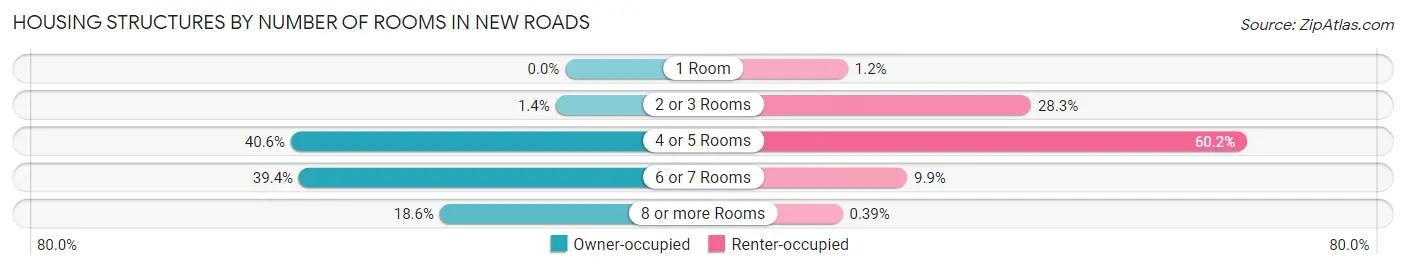
| Number of Rooms | Owner-occupied | Renter-occupied |
| 1 Room | 0 (0.0%) | 6 (1.2%) |
| 2 or 3 Rooms | 18 (1.4%) | 145 (28.3%) |
| 4 or 5 Rooms | 512 (40.6%) | 309 (60.2%) |
| 6 or 7 Rooms | 497 (39.4%) | 51 (9.9%) |
| 8 or more Rooms | 234 (18.6%) | 2 (0.4%) |
| Total | 1,261 (100.0%) | 513 (100.0%) |
Housing Structure by Heating Type in New Roads
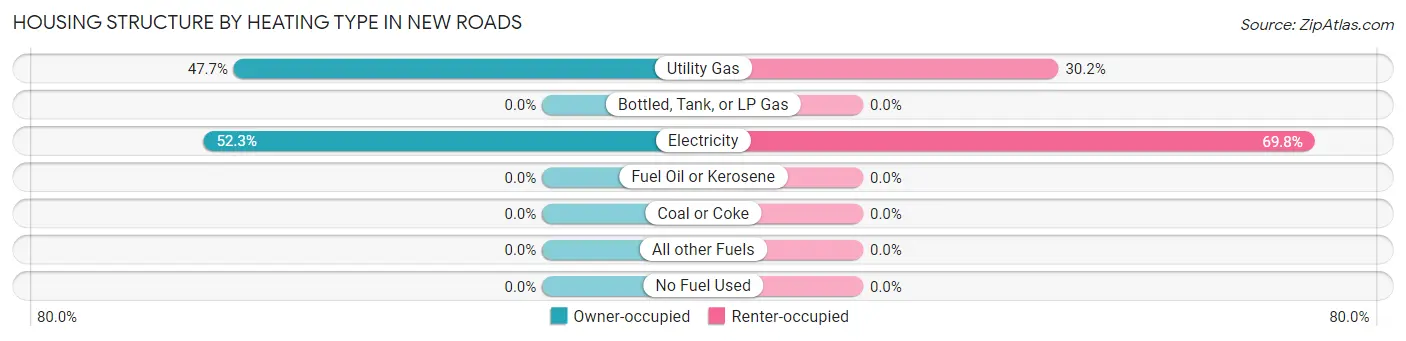
| Heating Type | Owner-occupied | Renter-occupied |
| Utility Gas | 601 (47.7%) | 155 (30.2%) |
| Bottled, Tank, or LP Gas | 0 (0.0%) | 0 (0.0%) |
| Electricity | 660 (52.3%) | 358 (69.8%) |
| Fuel Oil or Kerosene | 0 (0.0%) | 0 (0.0%) |
| Coal or Coke | 0 (0.0%) | 0 (0.0%) |
| All other Fuels | 0 (0.0%) | 0 (0.0%) |
| No Fuel Used | 0 (0.0%) | 0 (0.0%) |
| Total | 1,261 (100.0%) | 513 (100.0%) |
Household Vehicle Usage in New Roads
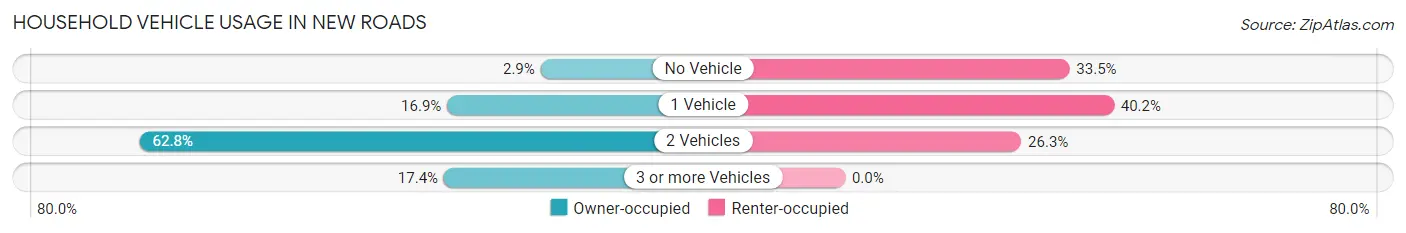
| Vehicles per Household | Owner-occupied | Renter-occupied |
| No Vehicle | 37 (2.9%) | 172 (33.5%) |
| 1 Vehicle | 213 (16.9%) | 206 (40.2%) |
| 2 Vehicles | 792 (62.8%) | 135 (26.3%) |
| 3 or more Vehicles | 219 (17.4%) | 0 (0.0%) |
| Total | 1,261 (100.0%) | 513 (100.0%) |
Real Estate & Mortgages in New Roads
Real Estate and Mortgage Overview in New Roads
| Characteristic | Without Mortgage | With Mortgage |
| Housing Units | 653 | 608 |
| Median Property Value | $142,700 | $173,600 |
| Median Household Income | $49,705 | $277 |
| Monthly Housing Costs | $451 | $19 |
| Real Estate Taxes | $298 | $5 |
Property Value by Mortgage Status in New Roads
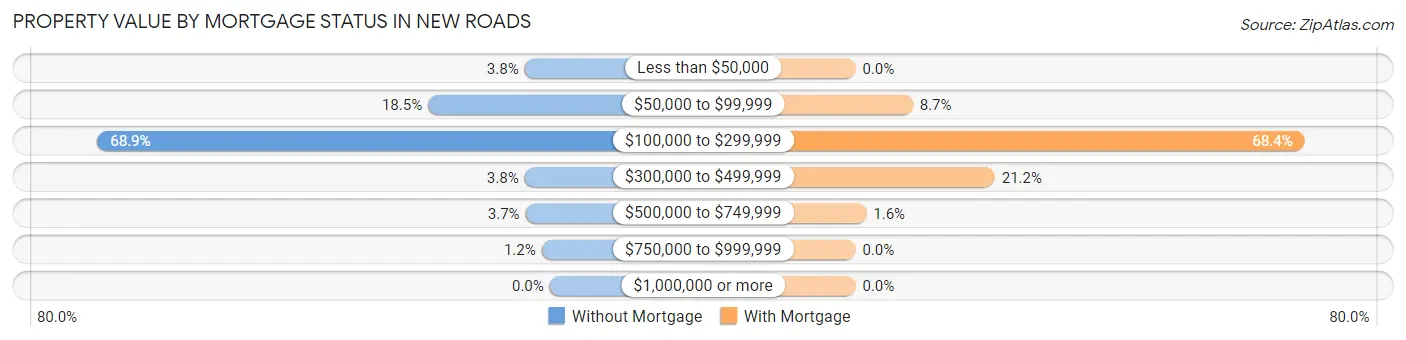
| Property Value | Without Mortgage | With Mortgage |
| Less than $50,000 | 25 (3.8%) | 0 (0.0%) |
| $50,000 to $99,999 | 121 (18.5%) | 53 (8.7%) |
| $100,000 to $299,999 | 450 (68.9%) | 416 (68.4%) |
| $300,000 to $499,999 | 25 (3.8%) | 129 (21.2%) |
| $500,000 to $749,999 | 24 (3.7%) | 10 (1.6%) |
| $750,000 to $999,999 | 8 (1.2%) | 0 (0.0%) |
| $1,000,000 or more | 0 (0.0%) | 0 (0.0%) |
| Total | 653 (100.0%) | 608 (100.0%) |
Household Income by Mortgage Status in New Roads
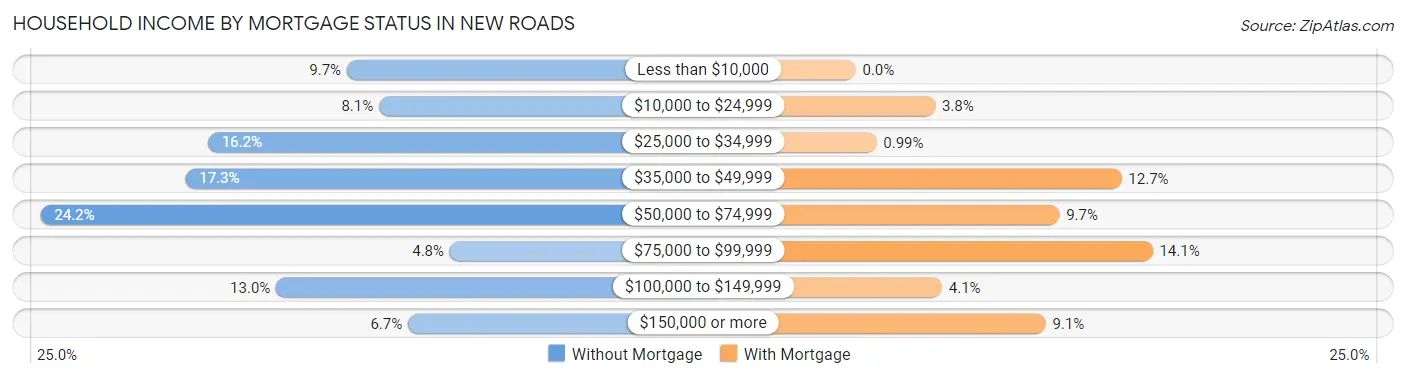
| Household Income | Without Mortgage | With Mortgage |
| Less than $10,000 | 63 (9.7%) | 0 (0.0%) |
| $10,000 to $24,999 | 53 (8.1%) | 23 (3.8%) |
| $25,000 to $34,999 | 106 (16.2%) | 6 (1.0%) |
| $35,000 to $49,999 | 113 (17.3%) | 77 (12.7%) |
| $50,000 to $74,999 | 158 (24.2%) | 59 (9.7%) |
| $75,000 to $99,999 | 31 (4.8%) | 86 (14.1%) |
| $100,000 to $149,999 | 85 (13.0%) | 25 (4.1%) |
| $150,000 or more | 44 (6.7%) | 55 (9.0%) |
| Total | 653 (100.0%) | 608 (100.0%) |
Property Value to Household Income Ratio in New Roads
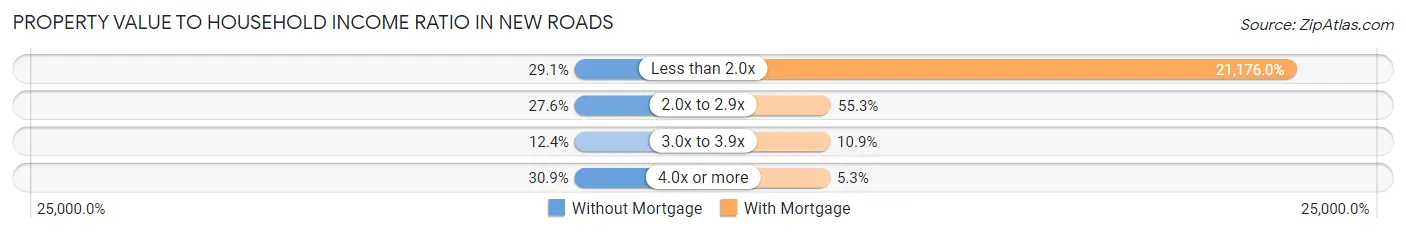
| Value-to-Income Ratio | Without Mortgage | With Mortgage |
| Less than 2.0x | 190 (29.1%) | 128,750 (21,176.0%) |
| 2.0x to 2.9x | 180 (27.6%) | 336 (55.3%) |
| 3.0x to 3.9x | 81 (12.4%) | 66 (10.9%) |
| 4.0x or more | 202 (30.9%) | 32 (5.3%) |
| Total | 653 (100.0%) | 608 (100.0%) |
Real Estate Taxes by Mortgage Status in New Roads
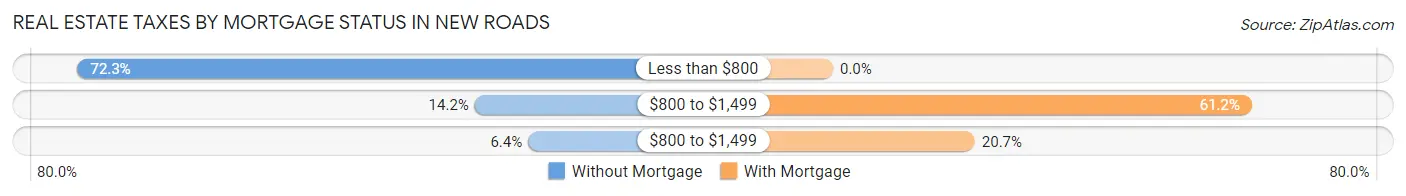
| Property Taxes | Without Mortgage | With Mortgage |
| Less than $800 | 472 (72.3%) | 0 (0.0%) |
| $800 to $1,499 | 93 (14.2%) | 372 (61.2%) |
| $800 to $1,499 | 42 (6.4%) | 126 (20.7%) |
| Total | 653 (100.0%) | 608 (100.0%) |
Health & Disability in New Roads
Health Insurance Coverage by Age in New Roads
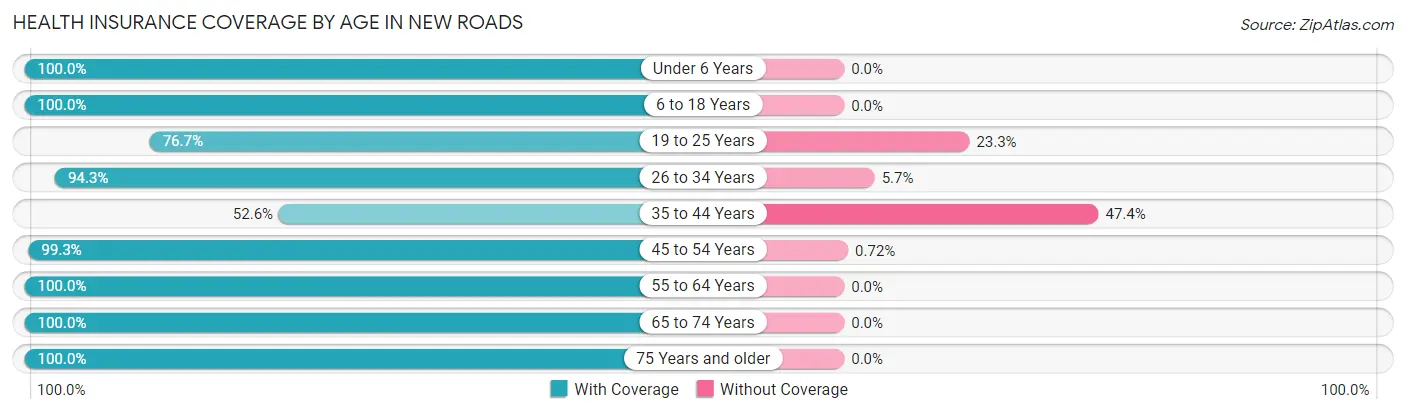
| Age Bracket | With Coverage | Without Coverage |
| Under 6 Years | 207 (100.0%) | 0 (0.0%) |
| 6 to 18 Years | 538 (100.0%) | 0 (0.0%) |
| 19 to 25 Years | 243 (76.7%) | 74 (23.3%) |
| 26 to 34 Years | 582 (94.3%) | 35 (5.7%) |
| 35 to 44 Years | 275 (52.6%) | 248 (47.4%) |
| 45 to 54 Years | 413 (99.3%) | 3 (0.7%) |
| 55 to 64 Years | 780 (100.0%) | 0 (0.0%) |
| 65 to 74 Years | 673 (100.0%) | 0 (0.0%) |
| 75 Years and older | 311 (100.0%) | 0 (0.0%) |
| Total | 4,022 (91.8%) | 360 (8.2%) |
Health Insurance Coverage by Citizenship Status in New Roads
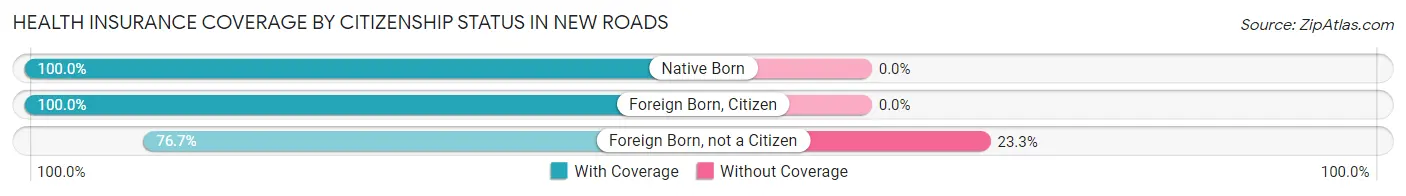
| Citizenship Status | With Coverage | Without Coverage |
| Native Born | 207 (100.0%) | 0 (0.0%) |
| Foreign Born, Citizen | 538 (100.0%) | 0 (0.0%) |
| Foreign Born, not a Citizen | 243 (76.7%) | 74 (23.3%) |
Health Insurance Coverage by Household Income in New Roads
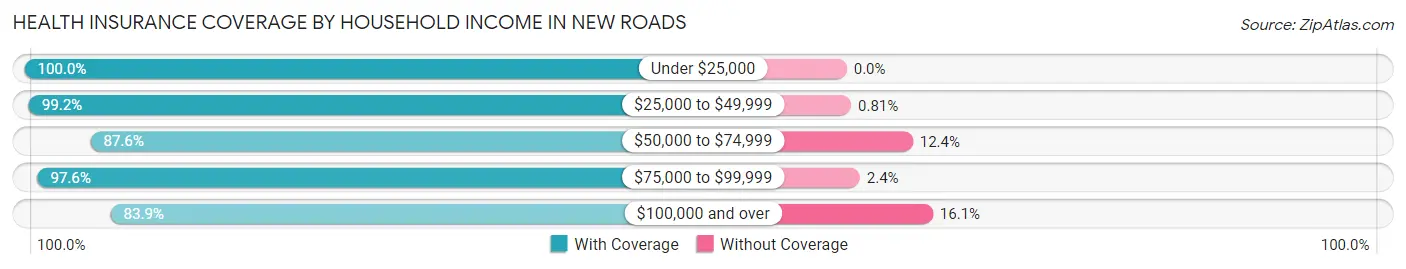
| Household Income | With Coverage | Without Coverage |
| Under $25,000 | 527 (100.0%) | 0 (0.0%) |
| $25,000 to $49,999 | 1,225 (99.2%) | 10 (0.8%) |
| $50,000 to $74,999 | 773 (87.6%) | 109 (12.4%) |
| $75,000 to $99,999 | 280 (97.6%) | 7 (2.4%) |
| $100,000 and over | 1,217 (83.9%) | 234 (16.1%) |
Public vs Private Health Insurance Coverage by Age in New Roads
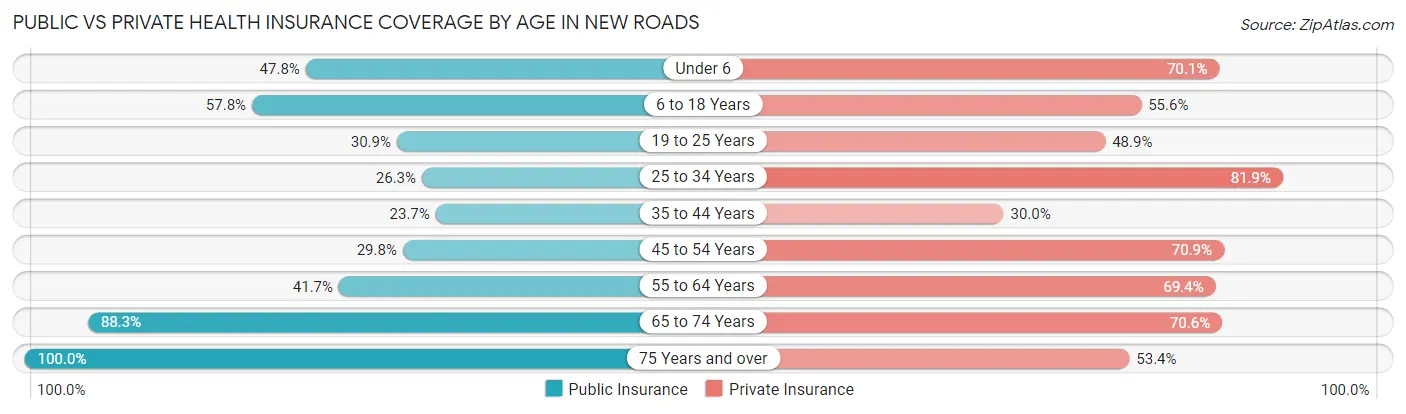
| Age Bracket | Public Insurance | Private Insurance |
| Under 6 | 99 (47.8%) | 145 (70.1%) |
| 6 to 18 Years | 311 (57.8%) | 299 (55.6%) |
| 19 to 25 Years | 98 (30.9%) | 155 (48.9%) |
| 25 to 34 Years | 162 (26.3%) | 505 (81.9%) |
| 35 to 44 Years | 124 (23.7%) | 157 (30.0%) |
| 45 to 54 Years | 124 (29.8%) | 295 (70.9%) |
| 55 to 64 Years | 325 (41.7%) | 541 (69.4%) |
| 65 to 74 Years | 594 (88.3%) | 475 (70.6%) |
| 75 Years and over | 311 (100.0%) | 166 (53.4%) |
| Total | 2,148 (49.0%) | 2,738 (62.5%) |
Disability Status by Sex by Age in New Roads
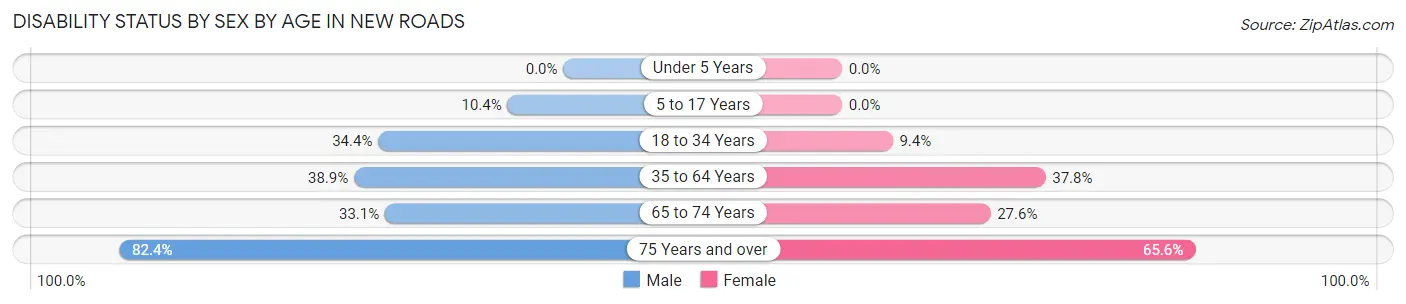
| Age Bracket | Male | Female |
| Under 5 Years | 0 (0.0%) | 0 (0.0%) |
| 5 to 17 Years | 20 (10.4%) | 0 (0.0%) |
| 18 to 34 Years | 189 (34.4%) | 39 (9.4%) |
| 35 to 64 Years | 385 (38.9%) | 275 (37.8%) |
| 65 to 74 Years | 93 (33.1%) | 108 (27.6%) |
| 75 Years and over | 108 (82.4%) | 118 (65.6%) |
Disability Class by Sex by Age in New Roads
Disability Class: Hearing Difficulty
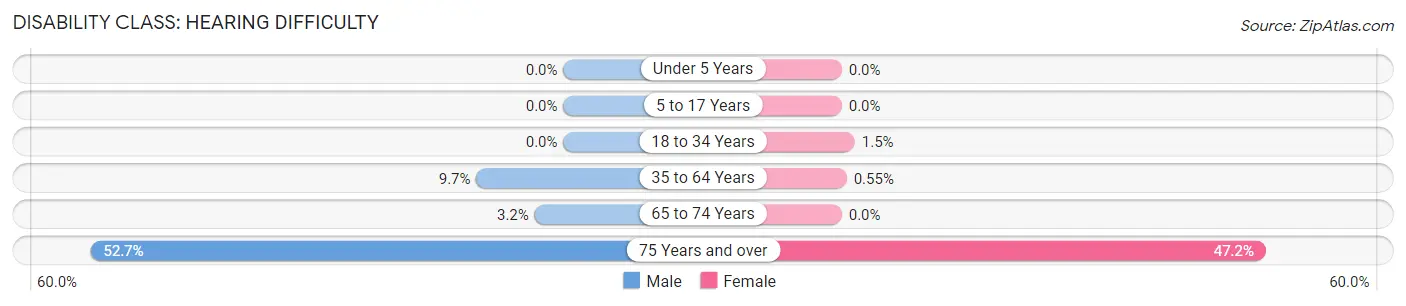
| Age Bracket | Male | Female |
| Under 5 Years | 0 (0.0%) | 0 (0.0%) |
| 5 to 17 Years | 0 (0.0%) | 0 (0.0%) |
| 18 to 34 Years | 0 (0.0%) | 6 (1.5%) |
| 35 to 64 Years | 96 (9.7%) | 4 (0.5%) |
| 65 to 74 Years | 9 (3.2%) | 0 (0.0%) |
| 75 Years and over | 69 (52.7%) | 85 (47.2%) |
Disability Class: Vision Difficulty
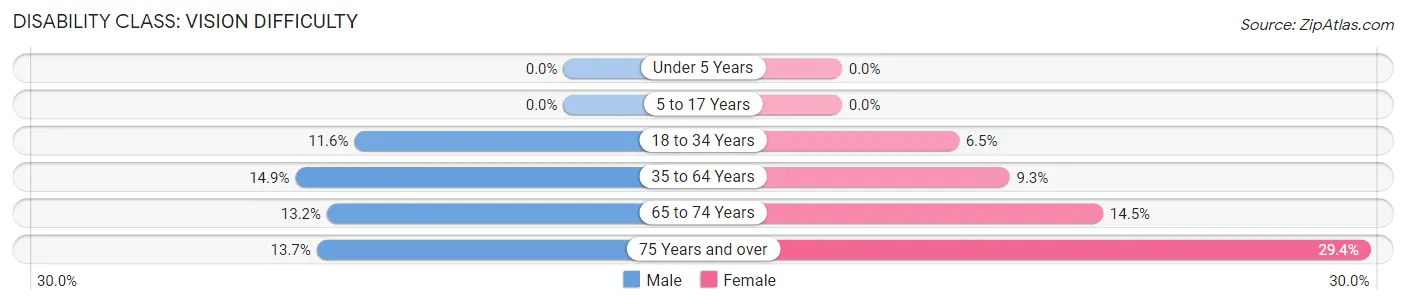
| Age Bracket | Male | Female |
| Under 5 Years | 0 (0.0%) | 0 (0.0%) |
| 5 to 17 Years | 0 (0.0%) | 0 (0.0%) |
| 18 to 34 Years | 64 (11.6%) | 27 (6.5%) |
| 35 to 64 Years | 148 (14.9%) | 68 (9.3%) |
| 65 to 74 Years | 37 (13.2%) | 57 (14.5%) |
| 75 Years and over | 18 (13.7%) | 53 (29.4%) |
Disability Class: Cognitive Difficulty
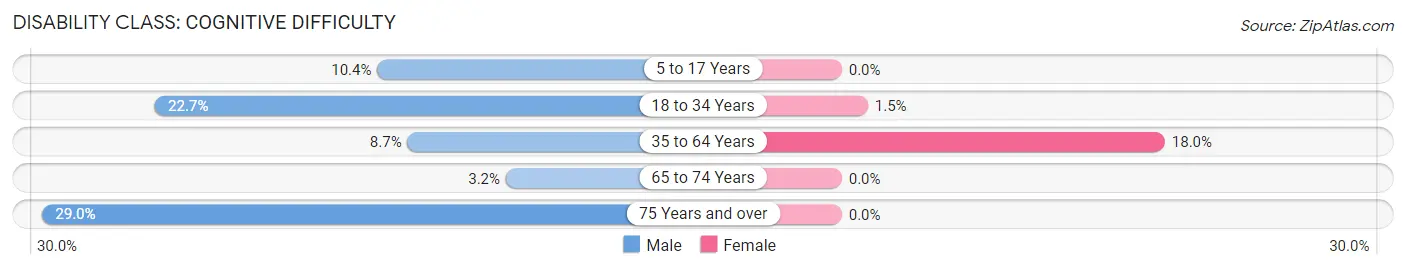
| Age Bracket | Male | Female |
| 5 to 17 Years | 20 (10.4%) | 0 (0.0%) |
| 18 to 34 Years | 125 (22.7%) | 6 (1.5%) |
| 35 to 64 Years | 86 (8.7%) | 131 (18.0%) |
| 65 to 74 Years | 9 (3.2%) | 0 (0.0%) |
| 75 Years and over | 38 (29.0%) | 0 (0.0%) |
Disability Class: Ambulatory Difficulty
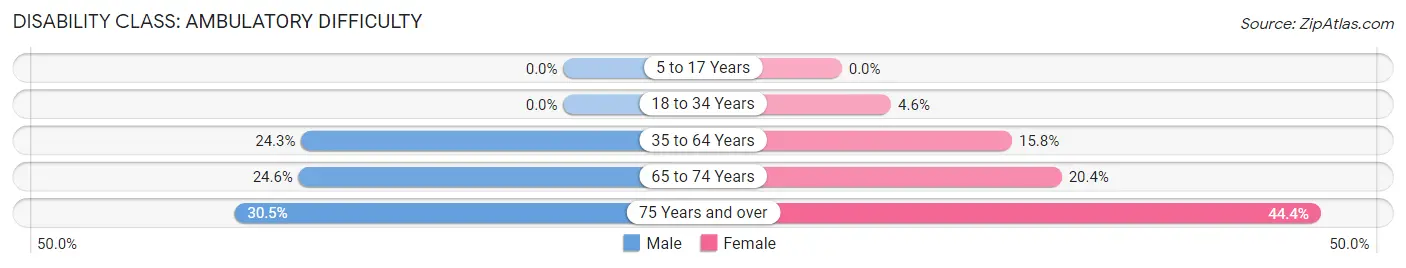
| Age Bracket | Male | Female |
| 5 to 17 Years | 0 (0.0%) | 0 (0.0%) |
| 18 to 34 Years | 0 (0.0%) | 19 (4.6%) |
| 35 to 64 Years | 241 (24.3%) | 115 (15.8%) |
| 65 to 74 Years | 69 (24.6%) | 80 (20.4%) |
| 75 Years and over | 40 (30.5%) | 80 (44.4%) |
Disability Class: Self-Care Difficulty

| Age Bracket | Male | Female |
| 5 to 17 Years | 0 (0.0%) | 0 (0.0%) |
| 18 to 34 Years | 0 (0.0%) | 19 (4.6%) |
| 35 to 64 Years | 73 (7.4%) | 52 (7.1%) |
| 65 to 74 Years | 5 (1.8%) | 0 (0.0%) |
| 75 Years and over | 1 (0.8%) | 21 (11.7%) |
Technology Access in New Roads
Computing Device Access in New Roads
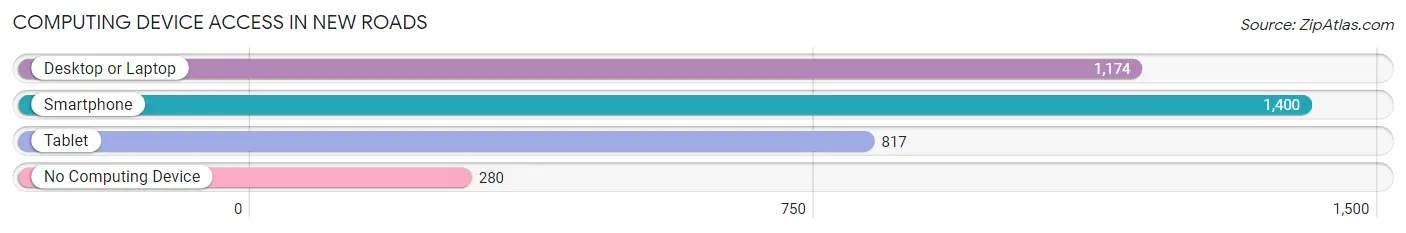
| Device Type | # Households | % Households |
| Desktop or Laptop | 1,174 | 66.2% |
| Smartphone | 1,400 | 78.9% |
| Tablet | 817 | 46.1% |
| No Computing Device | 280 | 15.8% |
| Total | 1,774 | 100.0% |
Internet Access in New Roads
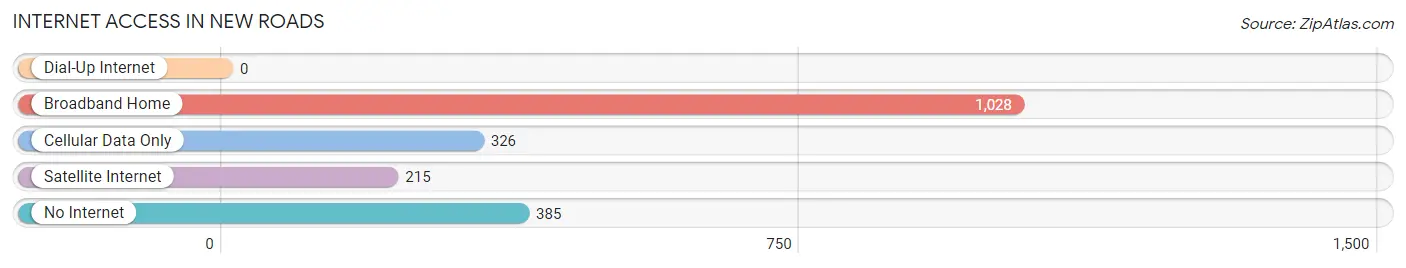
| Internet Type | # Households | % Households |
| Dial-Up Internet | 0 | 0.0% |
| Broadband Home | 1,028 | 58.0% |
| Cellular Data Only | 326 | 18.4% |
| Satellite Internet | 215 | 12.1% |
| No Internet | 385 | 21.7% |
| Total | 1,774 | 100.0% |
New Roads Summary
New Roads is a city located in Pointe Coupee Parish, Louisiana. It is situated on the banks of False River, a former oxbow lake of the Mississippi River. The city is the parish seat of Pointe Coupee Parish and has a population of 5,300 as of the 2010 census.
History
The area that is now New Roads was first settled by French colonists in the late 1700s. The town was originally known as “Poste de Pointe Coupee” and was established as a trading post for the local Native American tribes. The town was later renamed “New Roads” in 1821, after the construction of a new road connecting the town to the nearby city of Baton Rouge.
In the early 1800s, New Roads was a bustling port town, with steamboats regularly docking at the town’s wharf. The town was also home to a number of businesses, including a cotton gin, a sawmill, and a gristmill.
In the late 1800s, the town began to decline in population as the nearby city of Baton Rouge grew in size and importance. The decline was further exacerbated by the Great Mississippi Flood of 1927, which caused extensive damage to the town.
Geography
New Roads is located in Pointe Coupee Parish, Louisiana, on the banks of False River. The city is situated at an elevation of 28 feet (8.5 m) above sea level. The city has a total area of 2.3 square miles (6.0 km2), all of which is land.
The city is located approximately 25 miles (40 km) northwest of Baton Rouge and 80 miles (130 km) northwest of New Orleans. The nearest major cities are Baton Rouge, Louisiana (25 miles/40 km) and Jackson, Mississippi (90 miles/145 km).
Economy
New Roads’ economy is largely based on agriculture and tourism. The city is home to a number of agricultural businesses, including a cotton gin, a sawmill, and a gristmill. The city is also home to a number of tourist attractions, including the False River Museum and the False River Regional Park.
The city is also home to a number of manufacturing businesses, including a furniture factory, a boat manufacturing plant, and a plastics factory.
Demographics
As of the 2010 census, the population of New Roads was 5,300. The racial makeup of the city was 70.3% White, 25.2% African American, 0.3% Native American, 0.2% Asian, 0.1% Pacific Islander, and 3.9% from two or more races. Hispanic or Latino of any race were 2.2% of the population.
The median income for a household in the city was $30,938, and the median income for a family was $37,917. The per capita income for the city was $17,845. About 19.2% of families and 22.2% of the population were below the poverty line, including 28.3% of those under age 18 and 16.2% of those age 65 or over.
Common Questions
What is Per Capita Income in New Roads?
Per Capita income in New Roads is $32,721.
What is the Median Family Income in New Roads?
Median Family Income in New Roads is $65,082.
What is the Median Household income in New Roads?
Median Household Income in New Roads is $47,792.
What is Income or Wage Gap in New Roads?
Income or Wage Gap in New Roads is 41.5%.
Women in New Roads earn 58.5 cents for every dollar earned by a man.
What is Inequality or Gini Index in New Roads?
Inequality or Gini Index in New Roads is 0.48.
What is the Total Population of New Roads?
Total Population of New Roads is 4,508.
What is the Total Male Population of New Roads?
Total Male Population of New Roads is 2,294.
What is the Total Female Population of New Roads?
Total Female Population of New Roads is 2,214.
What is the Ratio of Males per 100 Females in New Roads?
There are 103.61 Males per 100 Females in New Roads.
What is the Ratio of Females per 100 Males in New Roads?
There are 96.51 Females per 100 Males in New Roads.
What is the Median Population Age in New Roads?
Median Population Age in New Roads is 46.5 Years.
What is the Average Family Size in New Roads
Average Family Size in New Roads is 3.6 People.
What is the Average Household Size in New Roads
Average Household Size in New Roads is 2.5 People.
How Large is the Labor Force in New Roads?
There are 2,001 People in the Labor Forcein in New Roads.
What is the Percentage of People in the Labor Force in New Roads?
52.5% of People are in the Labor Force in New Roads.
What is the Unemployment Rate in New Roads?
Unemployment Rate in New Roads is 8.0%.