Natchez, LA Map & Demographics
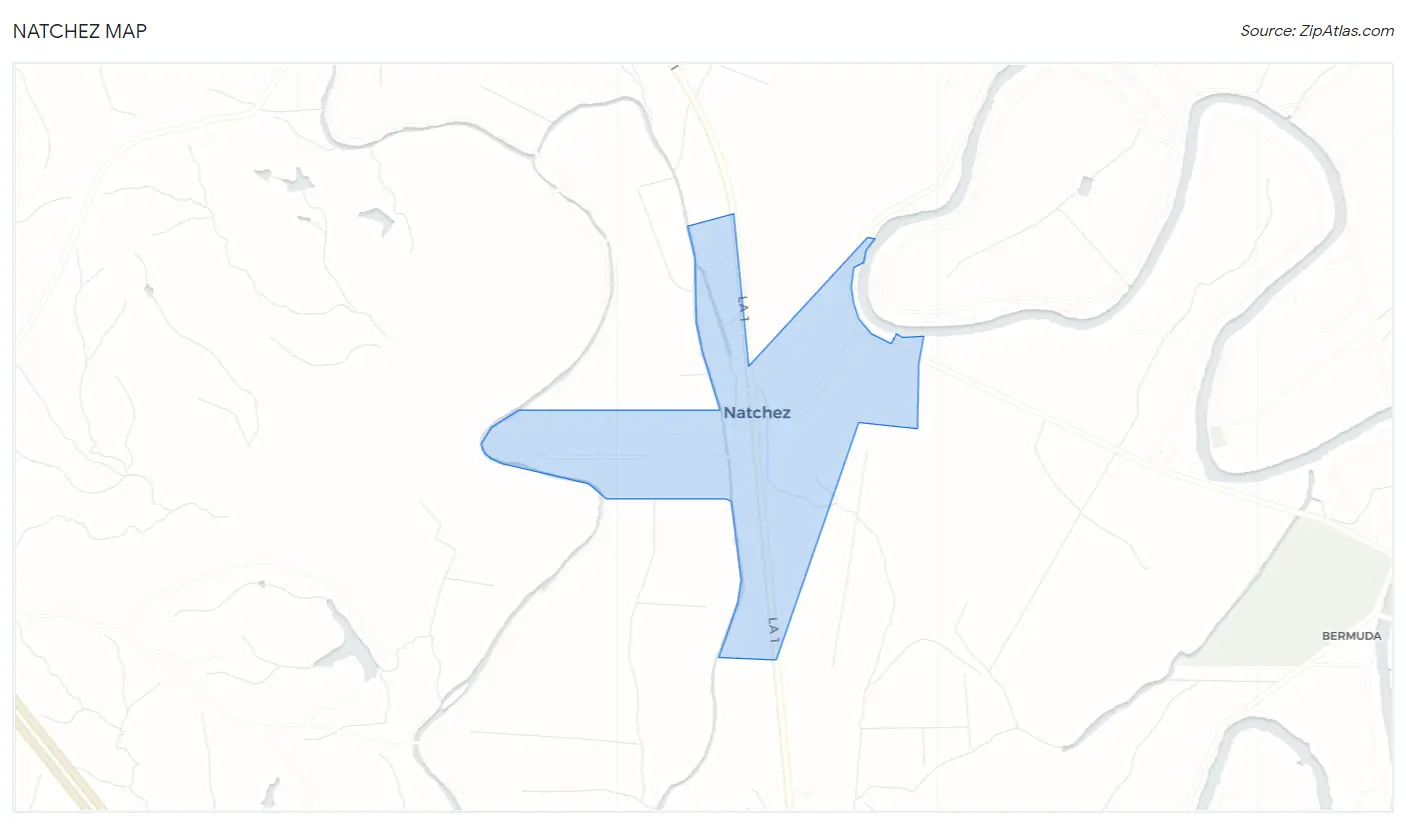
Natchez Map
Natchez Overview
$21,829
PER CAPITA INCOME
$22,031
AVG HOUSEHOLD INCOME
57.8%
WAGE / INCOME GAP [ % ]
42.2¢/ $1
WAGE / INCOME GAP [ $ ]
0.46
INEQUALITY / GINI INDEX
304
TOTAL POPULATION
166
MALE POPULATION
138
FEMALE POPULATION
120.29
MALES / 100 FEMALES
83.13
FEMALES / 100 MALES
59.3
MEDIAN AGE
2.1
AVG FAMILY SIZE
1.5
AVG HOUSEHOLD SIZE
159
LABOR FORCE [ PEOPLE ]
54.1%
PERCENT IN LABOR FORCE
4.4%
UNEMPLOYMENT RATE
Natchez Zip Codes
Natchez Area Codes
Income in Natchez
Income Overview in Natchez
| Characteristic | Number | Measure |
| Per Capita Income | 304 | $21,829 |
| Median Family Income | 86 | $0 |
| Mean Family Income | 86 | $42,016 |
| Median Household Income | 199 | $22,031 |
| Mean Household Income | 199 | $32,534 |
| Income Deficit | 86 | $0 |
| Wage / Income Gap (%) | 304 | 57.85% |
| Wage / Income Gap ($) | 304 | 42.15¢ per $1 |
| Gini / Inequality Index | 304 | 0.46 |
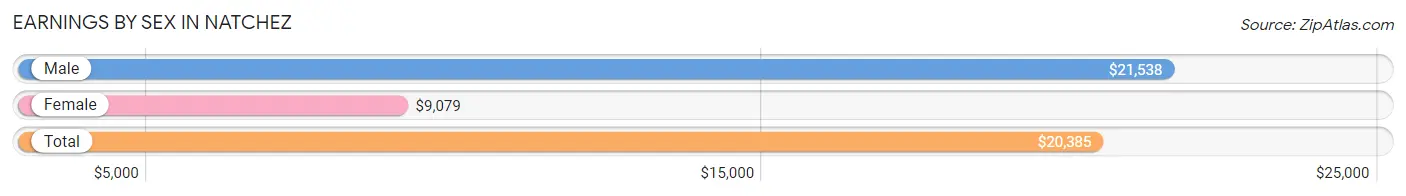
Earnings by Sex in Natchez
Average Earnings in Natchez are $20,385, $21,538 for men and $9,079 for women, a difference of 57.9%.
| Sex | Number | Average Earnings |
| Male | 80 (52.6%) | $21,538 |
| Female | 72 (47.4%) | $9,079 |
| Total | 152 (100.0%) | $20,385 |
Earnings by Sex by Income Bracket in Natchez
The most common earnings brackets in Natchez are $20,000 to $22,499 for men (52 | 65.0%) and $7,500 to $9,999 for women (57 | 79.2%).
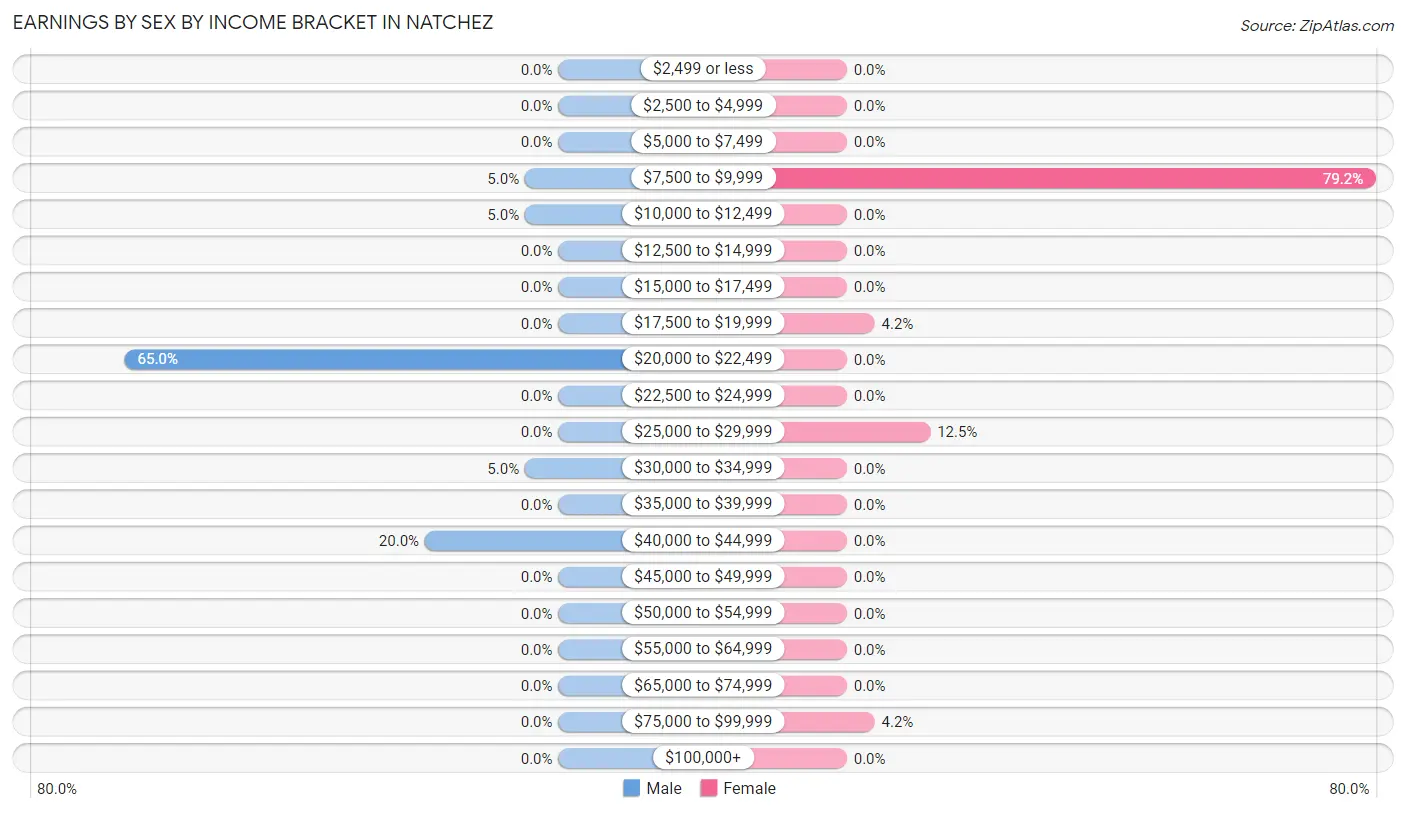
| Income | Male | Female |
| $2,499 or less | 0 (0.0%) | 0 (0.0%) |
| $2,500 to $4,999 | 0 (0.0%) | 0 (0.0%) |
| $5,000 to $7,499 | 0 (0.0%) | 0 (0.0%) |
| $7,500 to $9,999 | 4 (5.0%) | 57 (79.2%) |
| $10,000 to $12,499 | 4 (5.0%) | 0 (0.0%) |
| $12,500 to $14,999 | 0 (0.0%) | 0 (0.0%) |
| $15,000 to $17,499 | 0 (0.0%) | 0 (0.0%) |
| $17,500 to $19,999 | 0 (0.0%) | 3 (4.2%) |
| $20,000 to $22,499 | 52 (65.0%) | 0 (0.0%) |
| $22,500 to $24,999 | 0 (0.0%) | 0 (0.0%) |
| $25,000 to $29,999 | 0 (0.0%) | 9 (12.5%) |
| $30,000 to $34,999 | 4 (5.0%) | 0 (0.0%) |
| $35,000 to $39,999 | 0 (0.0%) | 0 (0.0%) |
| $40,000 to $44,999 | 16 (20.0%) | 0 (0.0%) |
| $45,000 to $49,999 | 0 (0.0%) | 0 (0.0%) |
| $50,000 to $54,999 | 0 (0.0%) | 0 (0.0%) |
| $55,000 to $64,999 | 0 (0.0%) | 0 (0.0%) |
| $65,000 to $74,999 | 0 (0.0%) | 0 (0.0%) |
| $75,000 to $99,999 | 0 (0.0%) | 3 (4.2%) |
| $100,000+ | 0 (0.0%) | 0 (0.0%) |
| Total | 80 (100.0%) | 72 (100.0%) |
Earnings by Sex by Educational Attainment in Natchez
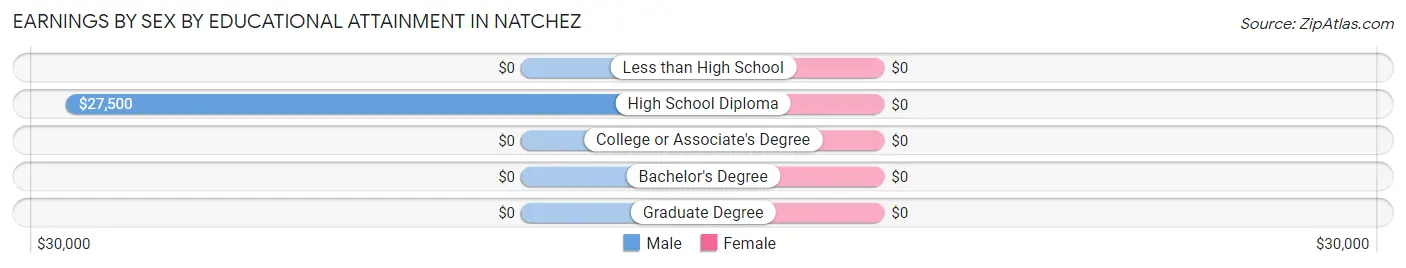
| Educational Attainment | Male Income | Female Income |
| Less than High School | - | - |
| High School Diploma | $27,500 | $0 |
| College or Associate's Degree | - | - |
| Bachelor's Degree | - | - |
| Graduate Degree | - | - |
| Total | $21,538 | $9,079 |
Family Income in Natchez
Family Income Brackets in Natchez
According to the Natchez family income data, there are 35 families falling into the $50,000 to $74,999 income range, which is the most common income bracket and makes up 40.7% of all families.
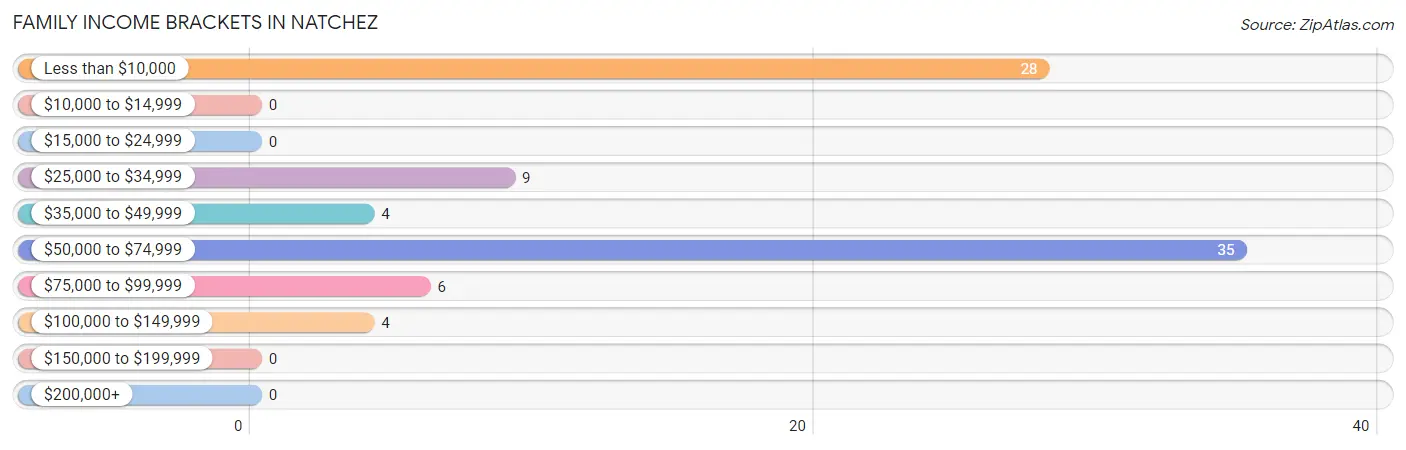
| Income Bracket | # Families | % Families |
| Less than $10,000 | 28 | 32.6% |
| $10,000 to $14,999 | 0 | 0.0% |
| $15,000 to $24,999 | 0 | 0.0% |
| $25,000 to $34,999 | 9 | 10.5% |
| $35,000 to $49,999 | 4 | 4.7% |
| $50,000 to $74,999 | 35 | 40.7% |
| $75,000 to $99,999 | 6 | 7.0% |
| $100,000 to $149,999 | 4 | 4.7% |
| $150,000 to $199,999 | 0 | 0.0% |
| $200,000+ | 0 | 0.0% |
Family Income by Famaliy Size in Natchez
| Income Bracket | # Families | Median Income |
| 2-Person Families | 81 (94.2%) | $0 |
| 3-Person Families | 5 (5.8%) | $0 |
| 4-Person Families | 0 (0.0%) | $0 |
| 5-Person Families | 0 (0.0%) | $0 |
| 6-Person Families | 0 (0.0%) | $0 |
| 7+ Person Families | 0 (0.0%) | $0 |
| Total | 86 (100.0%) | $0 |
Family Income by Number of Earners in Natchez
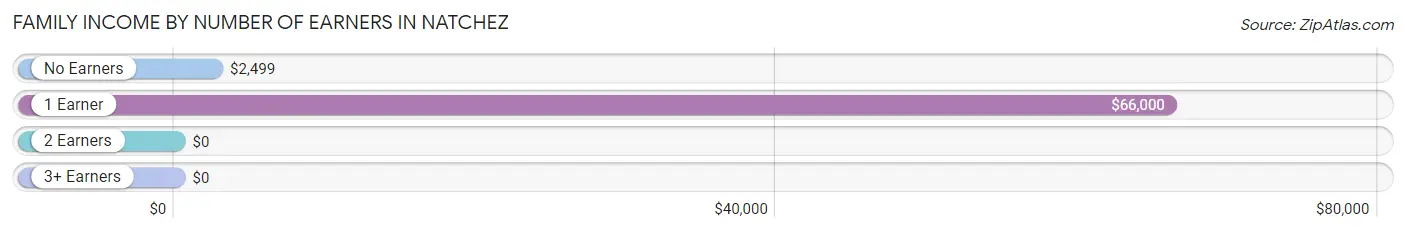
| Number of Earners | # Families | Median Income |
| No Earners | 40 (46.5%) | $2,499 |
| 1 Earner | 42 (48.8%) | $66,000 |
| 2 Earners | 4 (4.6%) | $0 |
| 3+ Earners | 0 (0.0%) | $0 |
| Total | 86 (100.0%) | $0 |
Household Income in Natchez
Household Income Brackets in Natchez
With 53 households falling in the category, the less than $10,000 income range is the most frequent in Natchez, accounting for 26.6% of all households.
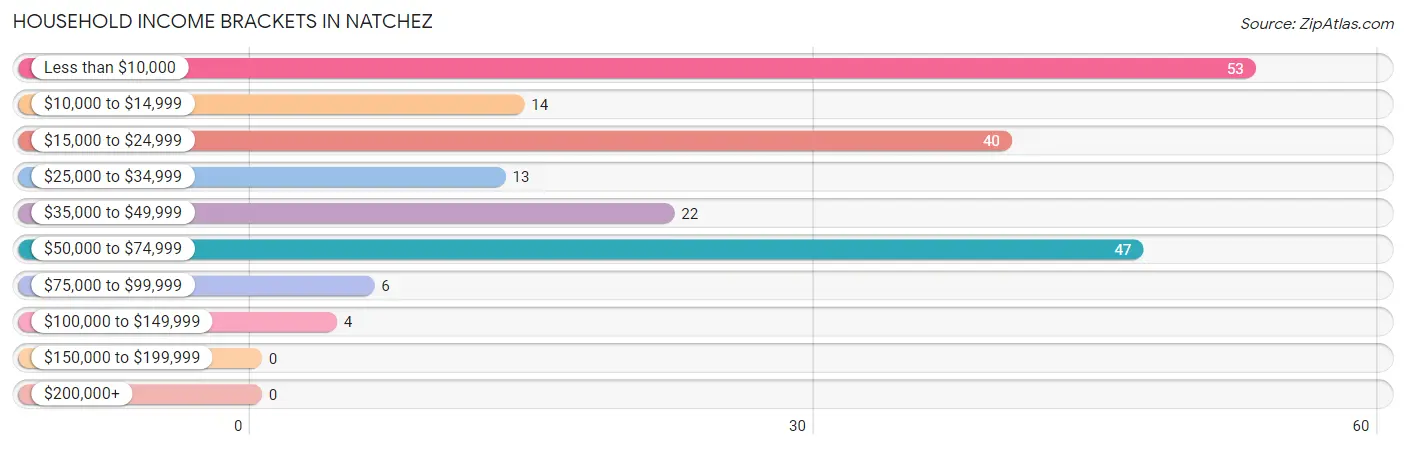
| Income Bracket | # Households | % Households |
| Less than $10,000 | 53 | 26.6% |
| $10,000 to $14,999 | 14 | 7.0% |
| $15,000 to $24,999 | 40 | 20.1% |
| $25,000 to $34,999 | 13 | 6.5% |
| $35,000 to $49,999 | 22 | 11.1% |
| $50,000 to $74,999 | 47 | 23.6% |
| $75,000 to $99,999 | 6 | 3.0% |
| $100,000 to $149,999 | 4 | 2.0% |
| $150,000 to $199,999 | 0 | 0.0% |
| $200,000+ | 0 | 0.0% |
Household Income by Householder Age in Natchez
The median household income in Natchez is $22,031, with the highest median household income of $47,813 found in the 45 to 64 years age bracket for the primary householder. A total of 115 households (57.8%) fall into this category.
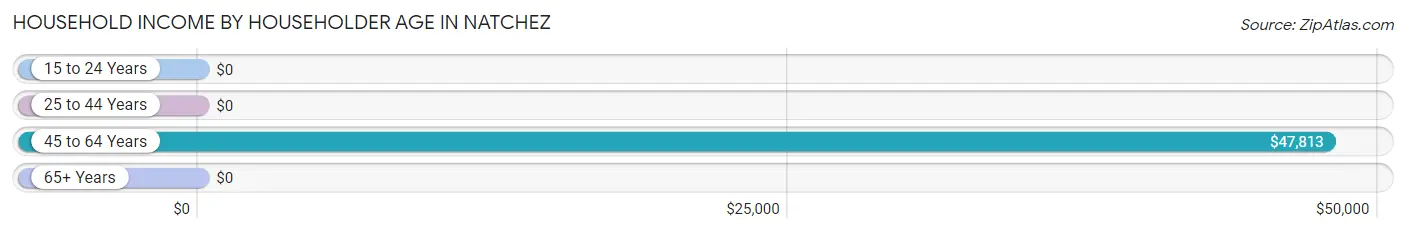
| Income Bracket | # Households | Median Income |
| 15 to 24 Years | 0 (0.0%) | $0 |
| 25 to 44 Years | 71 (35.7%) | $0 |
| 45 to 64 Years | 115 (57.8%) | $47,813 |
| 65+ Years | 13 (6.5%) | $0 |
| Total | 199 (100.0%) | $22,031 |
Poverty in Natchez
Income Below Poverty by Sex and Age in Natchez
With 18.1% poverty level for males and 35.5% for females among the residents of Natchez, 5 year old males and 35 to 44 year old females are the most vulnerable to poverty, with 5 males (100.0%) and 24 females (88.9%) in their respective age groups living below the poverty level.
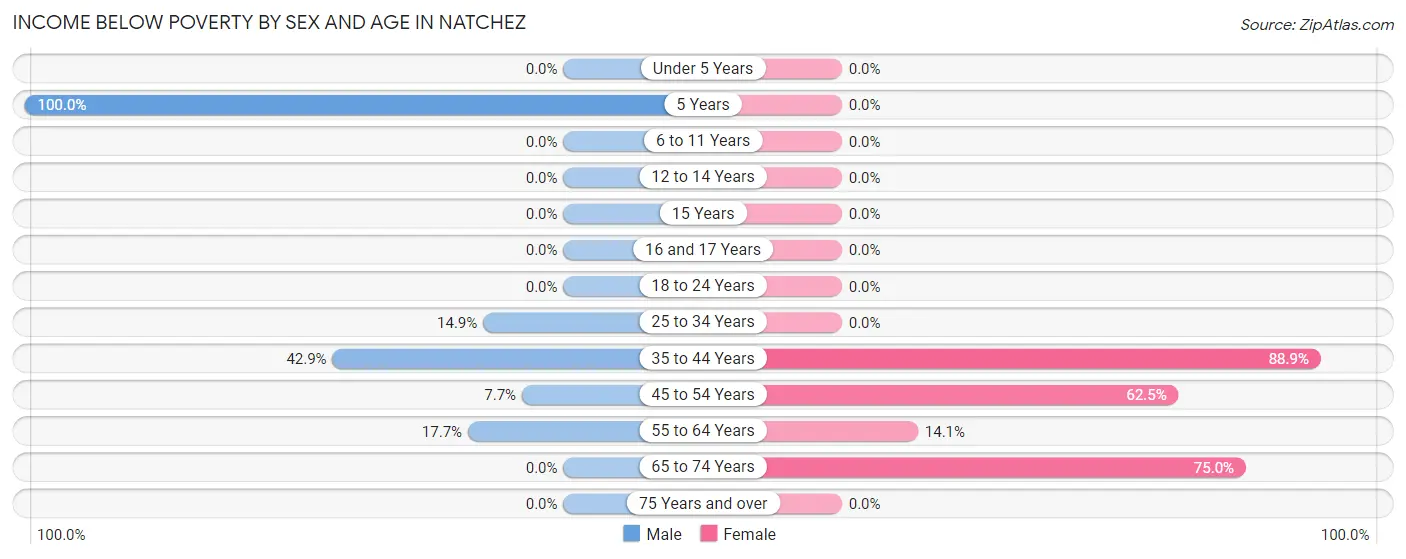
| Age Bracket | Male | Female |
| Under 5 Years | 0 (0.0%) | 0 (0.0%) |
| 5 Years | 5 (100.0%) | 0 (0.0%) |
| 6 to 11 Years | 0 (0.0%) | 0 (0.0%) |
| 12 to 14 Years | 0 (0.0%) | 0 (0.0%) |
| 15 Years | 0 (0.0%) | 0 (0.0%) |
| 16 and 17 Years | 0 (0.0%) | 0 (0.0%) |
| 18 to 24 Years | 0 (0.0%) | 0 (0.0%) |
| 25 to 34 Years | 7 (14.9%) | 0 (0.0%) |
| 35 to 44 Years | 3 (42.9%) | 24 (88.9%) |
| 45 to 54 Years | 1 (7.7%) | 10 (62.5%) |
| 55 to 64 Years | 14 (17.7%) | 12 (14.1%) |
| 65 to 74 Years | 0 (0.0%) | 3 (75.0%) |
| 75 Years and over | 0 (0.0%) | 0 (0.0%) |
| Total | 30 (18.1%) | 49 (35.5%) |
Income Above Poverty by Sex and Age in Natchez
According to the poverty statistics in Natchez, males aged 12 to 14 years and females aged 75 years and over are the age groups that are most secure financially, with 100.0% of males and 100.0% of females in these age groups living above the poverty line.
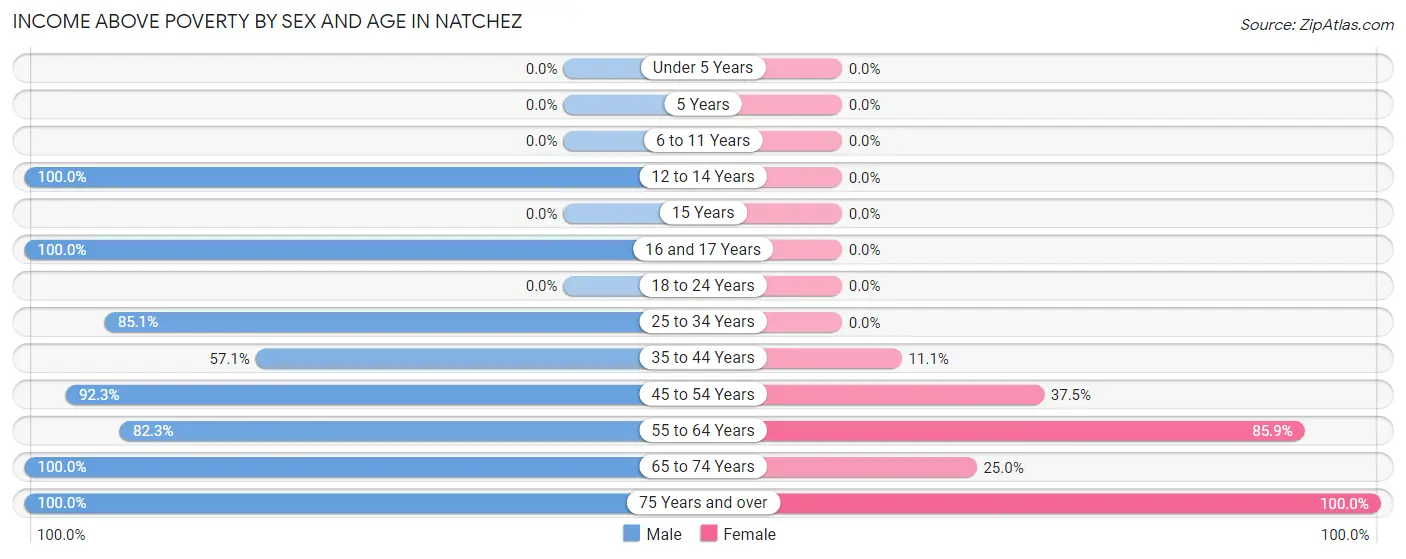
| Age Bracket | Male | Female |
| Under 5 Years | 0 (0.0%) | 0 (0.0%) |
| 5 Years | 0 (0.0%) | 0 (0.0%) |
| 6 to 11 Years | 0 (0.0%) | 0 (0.0%) |
| 12 to 14 Years | 5 (100.0%) | 0 (0.0%) |
| 15 Years | 0 (0.0%) | 0 (0.0%) |
| 16 and 17 Years | 4 (100.0%) | 0 (0.0%) |
| 18 to 24 Years | 0 (0.0%) | 0 (0.0%) |
| 25 to 34 Years | 40 (85.1%) | 0 (0.0%) |
| 35 to 44 Years | 4 (57.1%) | 3 (11.1%) |
| 45 to 54 Years | 12 (92.3%) | 6 (37.5%) |
| 55 to 64 Years | 65 (82.3%) | 73 (85.9%) |
| 65 to 74 Years | 5 (100.0%) | 1 (25.0%) |
| 75 Years and over | 1 (100.0%) | 6 (100.0%) |
| Total | 136 (81.9%) | 89 (64.5%) |
Income Below Poverty Among Married-Couple Families in Natchez
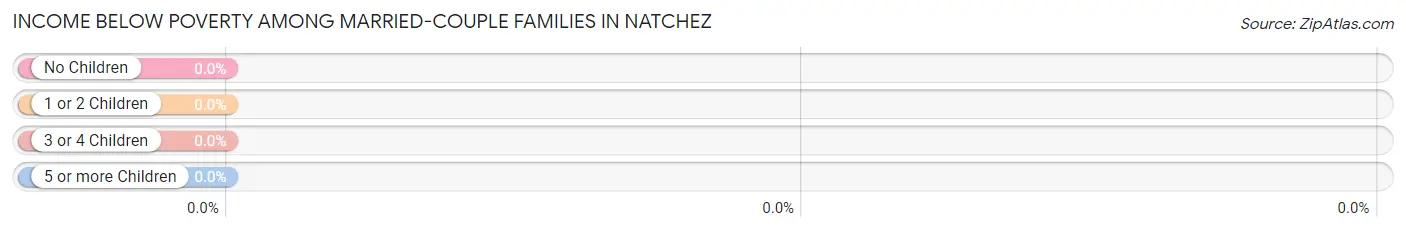
| Children | Above Poverty | Below Poverty |
| No Children | 47 (100.0%) | 0 (0.0%) |
| 1 or 2 Children | 4 (100.0%) | 0 (0.0%) |
| 3 or 4 Children | 0 (0.0%) | 0 (0.0%) |
| 5 or more Children | 0 (0.0%) | 0 (0.0%) |
| Total | 51 (100.0%) | 0 (0.0%) |
Income Below Poverty Among Single-Parent Households in Natchez
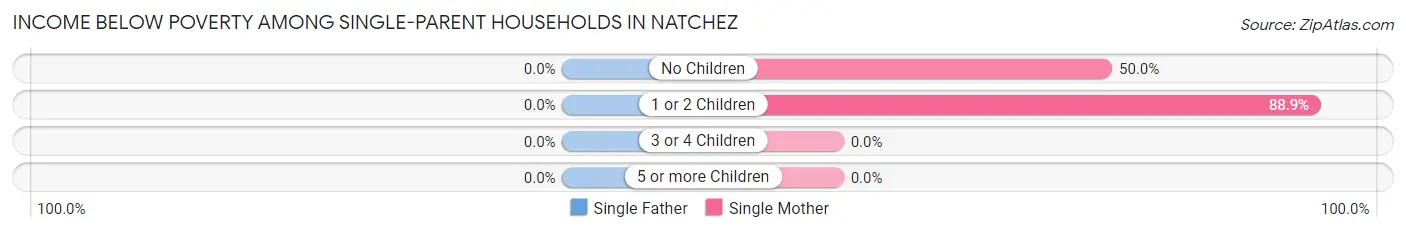
| Children | Single Father | Single Mother |
| No Children | 0 (0.0%) | 4 (50.0%) |
| 1 or 2 Children | 0 (0.0%) | 24 (88.9%) |
| 3 or 4 Children | 0 (0.0%) | 0 (0.0%) |
| 5 or more Children | 0 (0.0%) | 0 (0.0%) |
| Total | 0 (0.0%) | 28 (80.0%) |
Income Below Poverty Among Married-Couple vs Single-Parent Households in Natchez
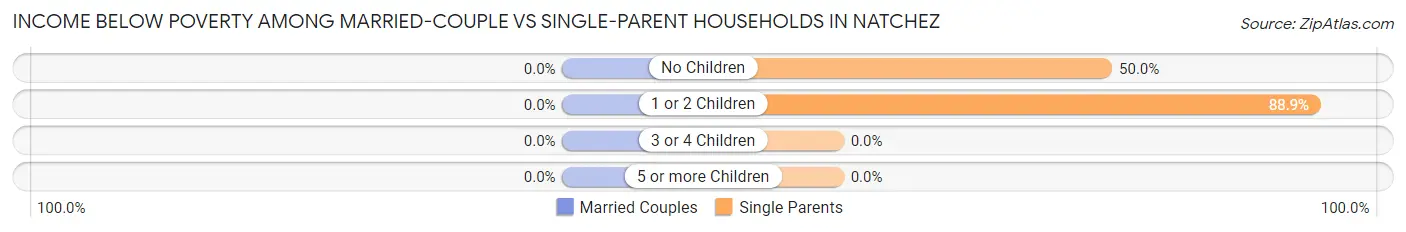
| Children | Married-Couple Families | Single-Parent Households |
| No Children | 0 (0.0%) | 4 (50.0%) |
| 1 or 2 Children | 0 (0.0%) | 24 (88.9%) |
| 3 or 4 Children | 0 (0.0%) | 0 (0.0%) |
| 5 or more Children | 0 (0.0%) | 0 (0.0%) |
| Total | 0 (0.0%) | 28 (80.0%) |
Race in Natchez
The most populous races in Natchez are Black / African American (254 | 83.6%), and White / Caucasian (50 | 16.5%).
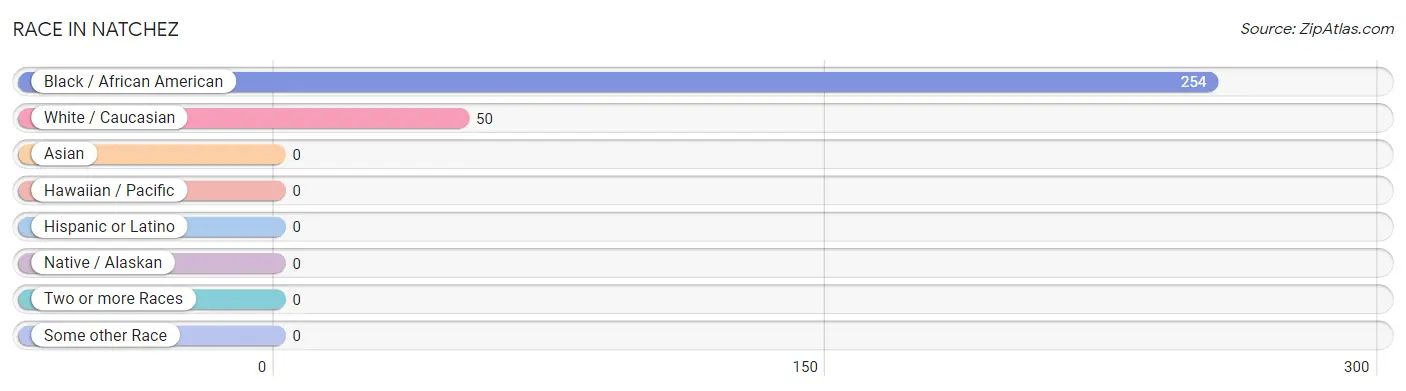
| Race | # Population | % Population |
| Asian | 0 | 0.0% |
| Black / African American | 254 | 83.6% |
| Hawaiian / Pacific | 0 | 0.0% |
| Hispanic or Latino | 0 | 0.0% |
| Native / Alaskan | 0 | 0.0% |
| White / Caucasian | 50 | 16.5% |
| Two or more Races | 0 | 0.0% |
| Some other Race | 0 | 0.0% |
| Total | 304 | 100.0% |
Ancestry in Natchez
The most populous ancestries reported in Natchez are French (46 | 15.1%), American (10 | 3.3%), African (1 | 0.3%), and Subsaharan African (1 | 0.3%), together accounting for 19.1% of all Natchez residents.
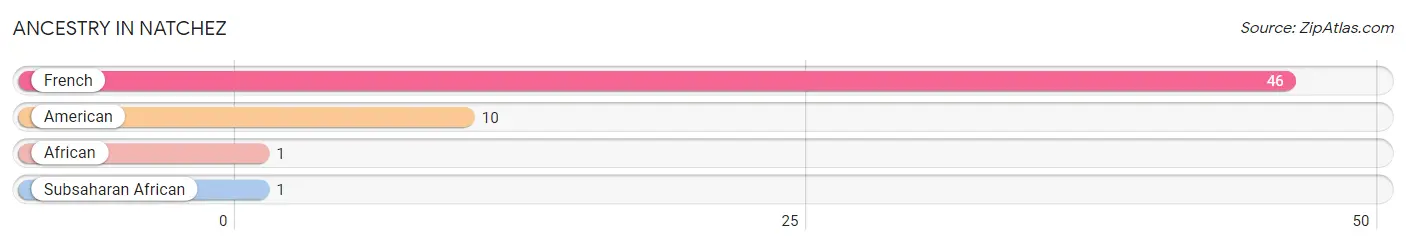
| Ancestry | # Population | % Population |
| African | 1 | 0.3% |
| American | 10 | 3.3% |
| French | 46 | 15.1% |
| Subsaharan African | 1 | 0.3% | View All 4 Rows |
Immigrants in Natchez

| Immigration Origin | # Population | % Population | View All 0 Rows |
Sex and Age in Natchez
Sex and Age in Natchez
The most populous age groups in Natchez are 60 to 64 Years (49 | 29.5%) for men and 60 to 64 Years (68 | 49.3%) for women.
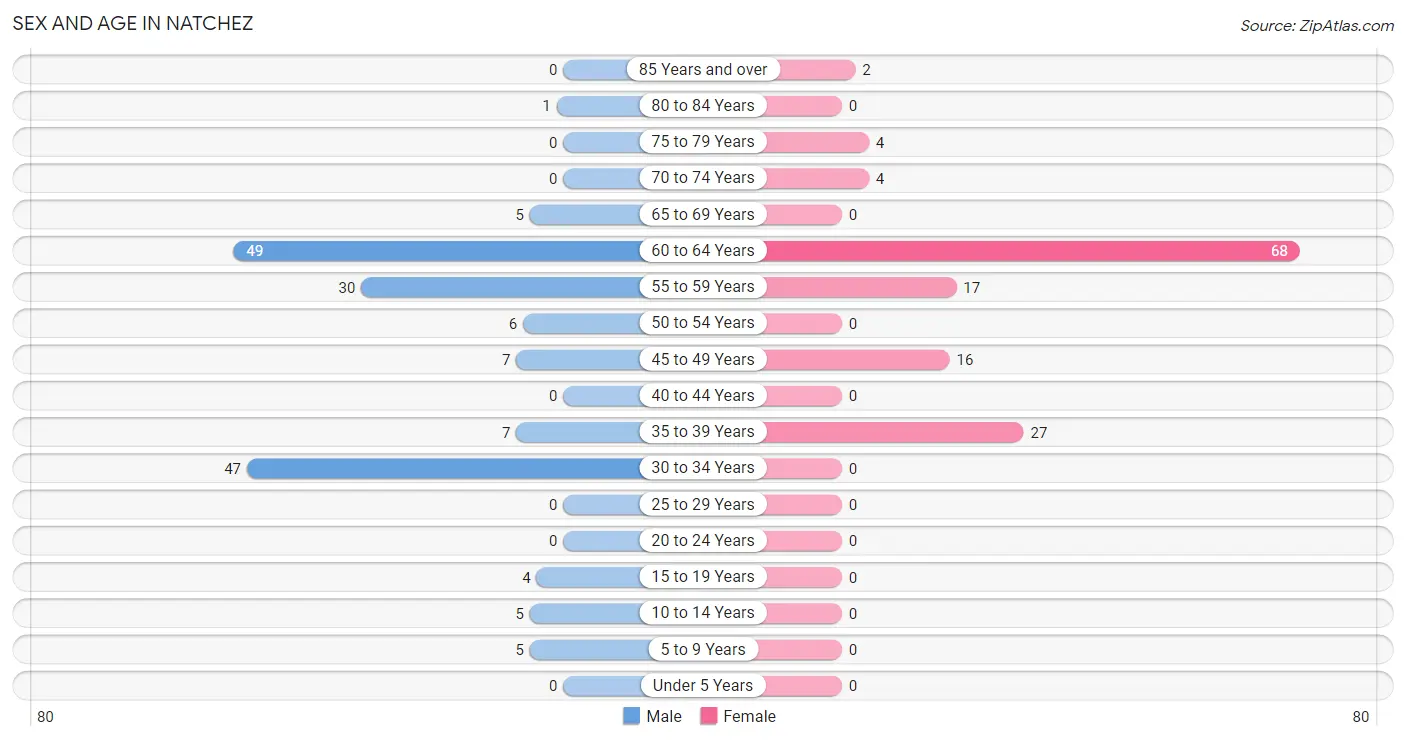
| Age Bracket | Male | Female |
| Under 5 Years | 0 (0.0%) | 0 (0.0%) |
| 5 to 9 Years | 5 (3.0%) | 0 (0.0%) |
| 10 to 14 Years | 5 (3.0%) | 0 (0.0%) |
| 15 to 19 Years | 4 (2.4%) | 0 (0.0%) |
| 20 to 24 Years | 0 (0.0%) | 0 (0.0%) |
| 25 to 29 Years | 0 (0.0%) | 0 (0.0%) |
| 30 to 34 Years | 47 (28.3%) | 0 (0.0%) |
| 35 to 39 Years | 7 (4.2%) | 27 (19.6%) |
| 40 to 44 Years | 0 (0.0%) | 0 (0.0%) |
| 45 to 49 Years | 7 (4.2%) | 16 (11.6%) |
| 50 to 54 Years | 6 (3.6%) | 0 (0.0%) |
| 55 to 59 Years | 30 (18.1%) | 17 (12.3%) |
| 60 to 64 Years | 49 (29.5%) | 68 (49.3%) |
| 65 to 69 Years | 5 (3.0%) | 0 (0.0%) |
| 70 to 74 Years | 0 (0.0%) | 4 (2.9%) |
| 75 to 79 Years | 0 (0.0%) | 4 (2.9%) |
| 80 to 84 Years | 1 (0.6%) | 0 (0.0%) |
| 85 Years and over | 0 (0.0%) | 2 (1.5%) |
| Total | 166 (100.0%) | 138 (100.0%) |
Families and Households in Natchez
Median Family Size in Natchez
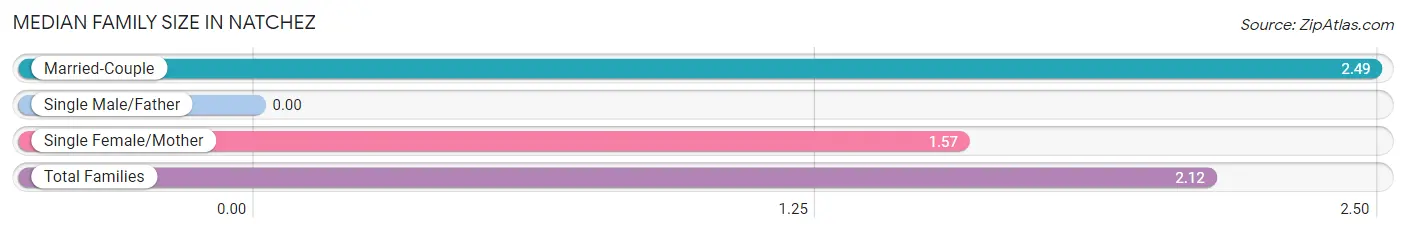
| Family Type | # Families | Family Size |
| Married-Couple | 51 (59.3%) | 2.49 |
| Single Male/Father | 0 (0.0%) | - |
| Single Female/Mother | 35 (40.7%) | 1.57 |
| Total Families | 86 (100.0%) | 2.12 |
Median Household Size in Natchez
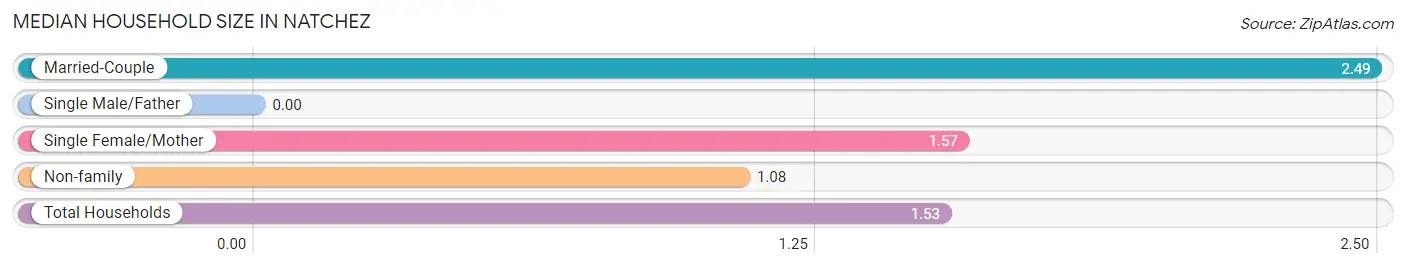
| Household Type | # Households | Household Size |
| Married-Couple | 51 (25.6%) | 2.49 |
| Single Male/Father | 0 (0.0%) | - |
| Single Female/Mother | 35 (17.6%) | 1.57 |
| Non-family | 113 (56.8%) | 1.08 |
| Total Households | 199 (100.0%) | 1.53 |
Household Size by Marriage Status in Natchez
Out of a total of 199 households in Natchez, 86 (43.2%) are family households, while 113 (56.8%) are nonfamily households. The most numerous type of family households are 2-person households, comprising 81, and the most common type of nonfamily households are 1-person households, comprising 101.
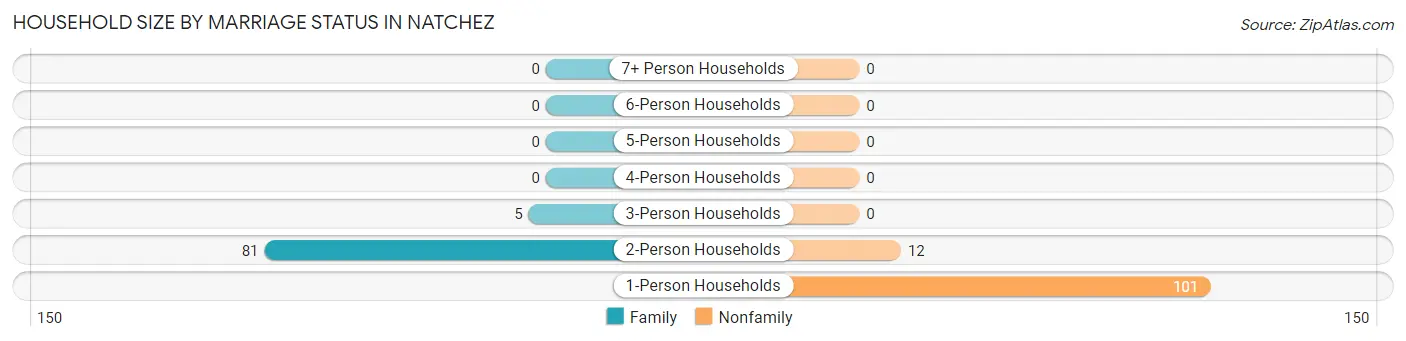
| Household Size | Family Households | Nonfamily Households |
| 1-Person Households | - | 101 (50.7%) |
| 2-Person Households | 81 (40.7%) | 12 (6.0%) |
| 3-Person Households | 5 (2.5%) | 0 (0.0%) |
| 4-Person Households | 0 (0.0%) | 0 (0.0%) |
| 5-Person Households | 0 (0.0%) | 0 (0.0%) |
| 6-Person Households | 0 (0.0%) | 0 (0.0%) |
| 7+ Person Households | 0 (0.0%) | 0 (0.0%) |
| Total | 86 (43.2%) | 113 (56.8%) |
Female Fertility in Natchez
Fertility by Age in Natchez
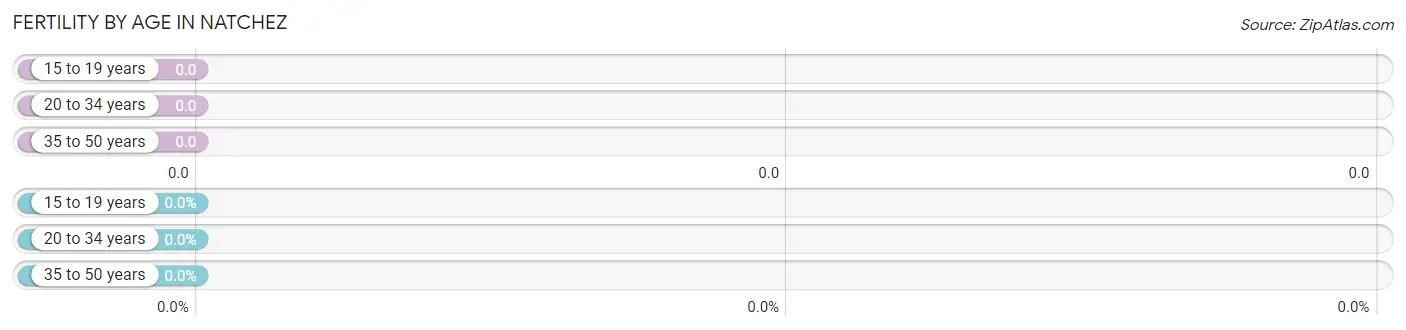
| Age Bracket | Women with Births | Births / 1,000 Women |
| 15 to 19 years | 0 (0.0%) | 0.0 |
| 20 to 34 years | 0 (0.0%) | 0.0 |
| 35 to 50 years | 0 (0.0%) | 0.0 |
| Total | 0 (0.0%) | 0.0 |
Fertility by Age by Marriage Status in Natchez
| Age Bracket | Married | Unmarried |
| 15 to 19 years | 0 (0.0%) | 0 (0.0%) |
| 20 to 34 years | 0 (0.0%) | 0 (0.0%) |
| 35 to 50 years | 0 (0.0%) | 0 (0.0%) |
| Total | 0 (0.0%) | 0 (0.0%) |
Fertility by Education in Natchez
| Educational Attainment | Women with Births | Births / 1,000 Women |
| Less than High School | 0 (0.0%) | 0.0 |
| High School Diploma | 0 (0.0%) | 0.0 |
| College or Associate's Degree | 0 (0.0%) | 0.0 |
| Bachelor's Degree | 0 (0.0%) | 0.0 |
| Graduate Degree | 0 (0.0%) | 0.0 |
| Total | 0 (0.0%) | 0.0 |
Fertility by Education by Marriage Status in Natchez
| Educational Attainment | Married | Unmarried |
| Less than High School | 0 (0.0%) | 0 (0.0%) |
| High School Diploma | 0 (0.0%) | 0 (0.0%) |
| College or Associate's Degree | 0 (0.0%) | 0 (0.0%) |
| Bachelor's Degree | 0 (0.0%) | 0 (0.0%) |
| Graduate Degree | 0 (0.0%) | 0 (0.0%) |
| Total | 0 (0.0%) | 0 (0.0%) |
Employment Characteristics in Natchez
Employment by Class of Employer in Natchez
Among the 152 employed individuals in Natchez, self-employed (not incorporated) (97 | 63.8%), private company employees (52 | 34.2%), and local government employees (3 | 2.0%) make up the most common classes of employment.
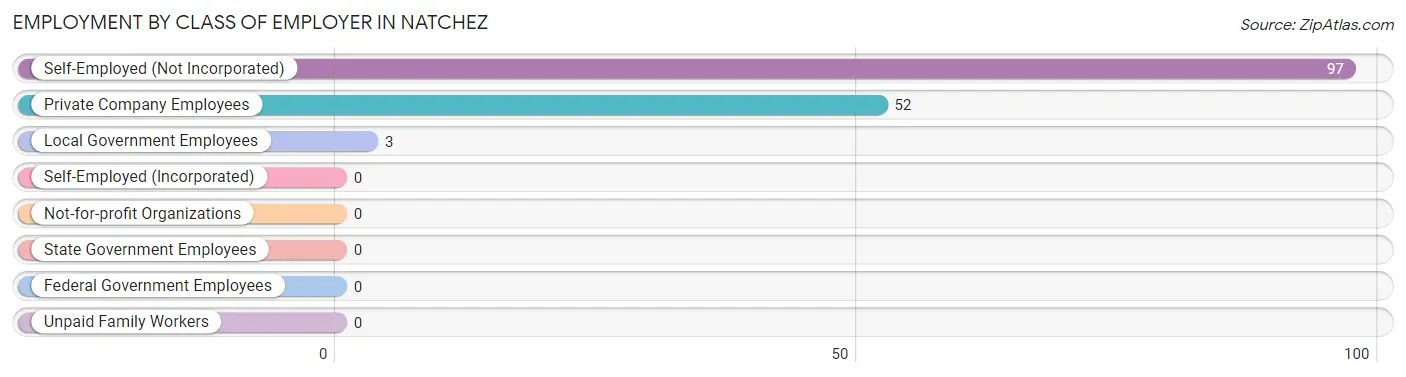
| Employer Class | # Employees | % Employees |
| Private Company Employees | 52 | 34.2% |
| Self-Employed (Incorporated) | 0 | 0.0% |
| Self-Employed (Not Incorporated) | 97 | 63.8% |
| Not-for-profit Organizations | 0 | 0.0% |
| Local Government Employees | 3 | 2.0% |
| State Government Employees | 0 | 0.0% |
| Federal Government Employees | 0 | 0.0% |
| Unpaid Family Workers | 0 | 0.0% |
| Total | 152 | 100.0% |
Employment Status by Age in Natchez
According to the labor force statistics for Natchez, out of the total population over 16 years of age (294), 54.1% or 159 individuals are in the labor force, with 4.4% or 7 of them unemployed. The age group with the highest labor force participation rate is 30 to 34 years, with 85.1% or 40 individuals in the labor force. Within the labor force, the 45 to 54 years age range has the highest percentage of unemployed individuals, with 53.8% or 7 of them being unemployed.
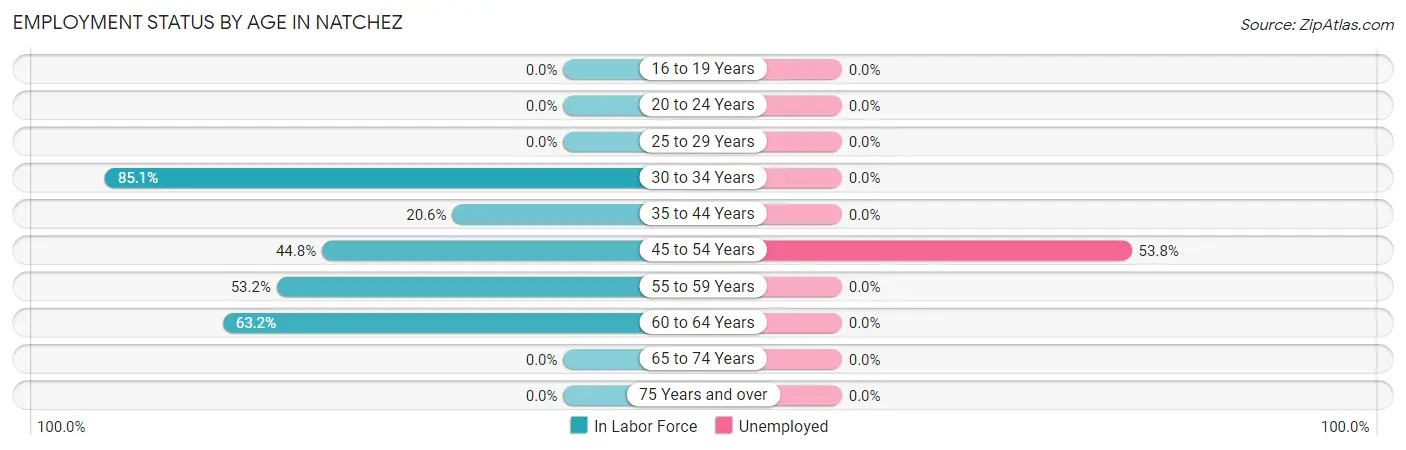
| Age Bracket | In Labor Force | Unemployed |
| 16 to 19 Years | 0 (0.0%) | 0 (0.0%) |
| 20 to 24 Years | 0 (0.0%) | 0 (0.0%) |
| 25 to 29 Years | 0 (0.0%) | 0 (0.0%) |
| 30 to 34 Years | 40 (85.1%) | 0 (0.0%) |
| 35 to 44 Years | 7 (20.6%) | 0 (0.0%) |
| 45 to 54 Years | 13 (44.8%) | 7 (53.8%) |
| 55 to 59 Years | 25 (53.2%) | 0 (0.0%) |
| 60 to 64 Years | 74 (63.2%) | 0 (0.0%) |
| 65 to 74 Years | 0 (0.0%) | 0 (0.0%) |
| 75 Years and over | 0 (0.0%) | 0 (0.0%) |
| Total | 159 (54.1%) | 7 (4.4%) |
Employment Status by Educational Attainment in Natchez
According to labor force statistics for Natchez, 58.0% of individuals (159) out of the total population between 25 and 64 years of age (274) are in the labor force, with 4.4% or 7 of them being unemployed. The group with the highest labor force participation rate are those with the educational attainment of college / associate degree, with 94.2% or 97 individuals in the labor force. Within the labor force, individuals with high school diploma education have the highest percentage of unemployment, with 11.3% or 7 of them being unemployed.
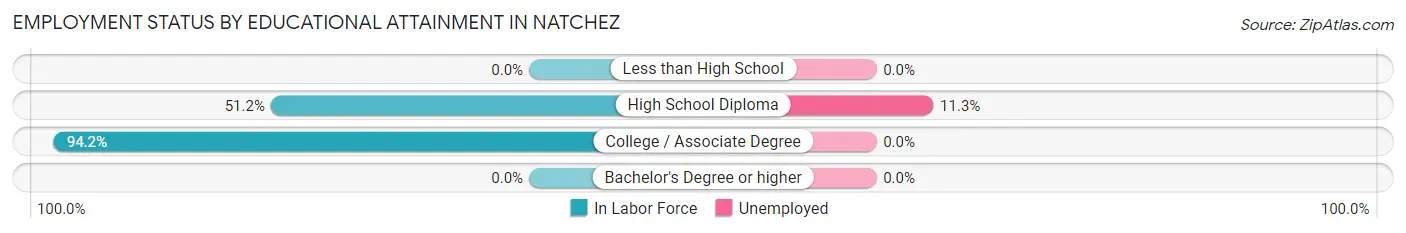
| Educational Attainment | In Labor Force | Unemployed |
| Less than High School | 0 (0.0%) | 0 (0.0%) |
| High School Diploma | 62 (51.2%) | 14 (11.3%) |
| College / Associate Degree | 97 (94.2%) | 0 (0.0%) |
| Bachelor's Degree or higher | 0 (0.0%) | 0 (0.0%) |
| Total | 159 (58.0%) | 12 (4.4%) |
Employment Occupations by Sex in Natchez
Management, Business, Science and Arts Occupations
The most common Management, Business, Science and Arts occupations in Natchez are , and Management (40 | 26.3%).
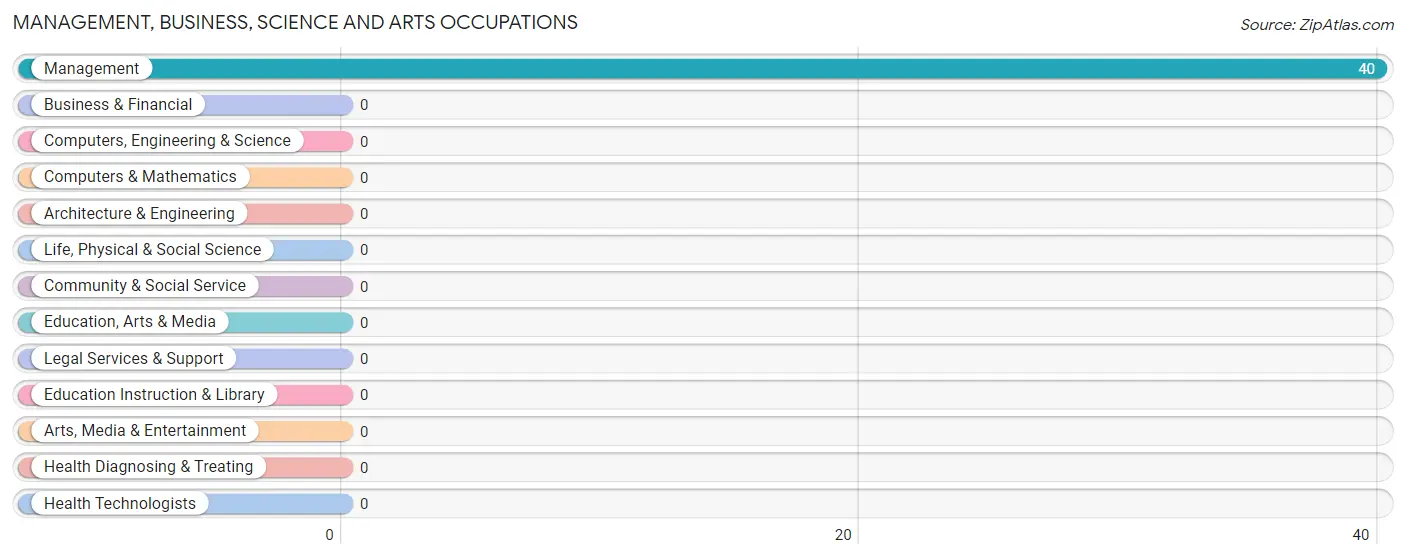
Management, Business, Science and Arts Occupations by Sex
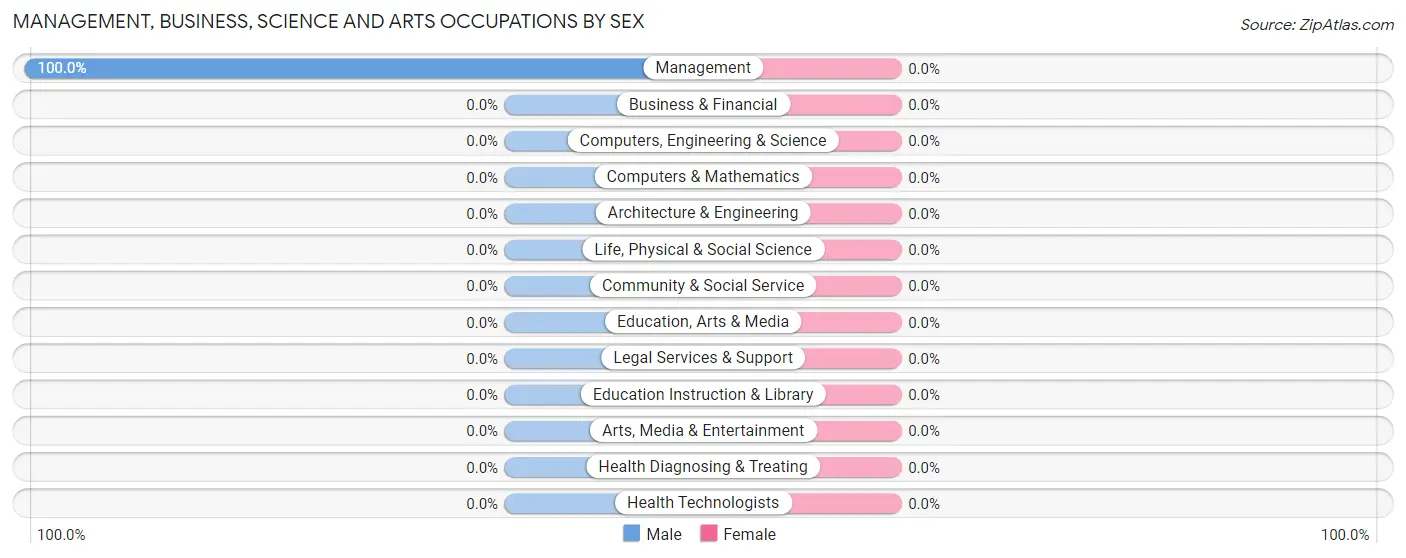
| Occupation | Male | Female |
| Management | 40 (100.0%) | 0 (0.0%) |
| Business & Financial | 0 (0.0%) | 0 (0.0%) |
| Computers, Engineering & Science | 0 (0.0%) | 0 (0.0%) |
| Computers & Mathematics | 0 (0.0%) | 0 (0.0%) |
| Architecture & Engineering | 0 (0.0%) | 0 (0.0%) |
| Life, Physical & Social Science | 0 (0.0%) | 0 (0.0%) |
| Community & Social Service | 0 (0.0%) | 0 (0.0%) |
| Education, Arts & Media | 0 (0.0%) | 0 (0.0%) |
| Legal Services & Support | 0 (0.0%) | 0 (0.0%) |
| Education Instruction & Library | 0 (0.0%) | 0 (0.0%) |
| Arts, Media & Entertainment | 0 (0.0%) | 0 (0.0%) |
| Health Diagnosing & Treating | 0 (0.0%) | 0 (0.0%) |
| Health Technologists | 0 (0.0%) | 0 (0.0%) |
| Total (Category) | 40 (100.0%) | 0 (0.0%) |
| Total (Overall) | 80 (52.6%) | 72 (47.4%) |
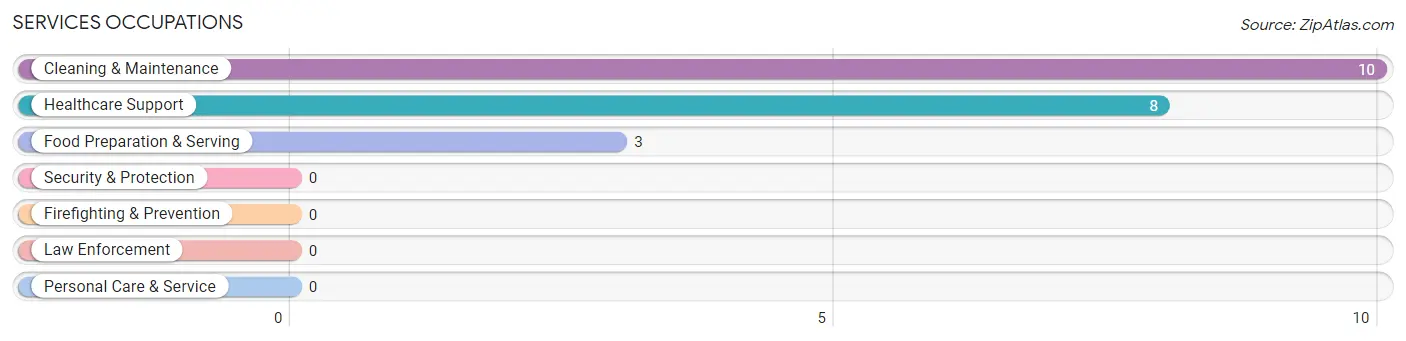
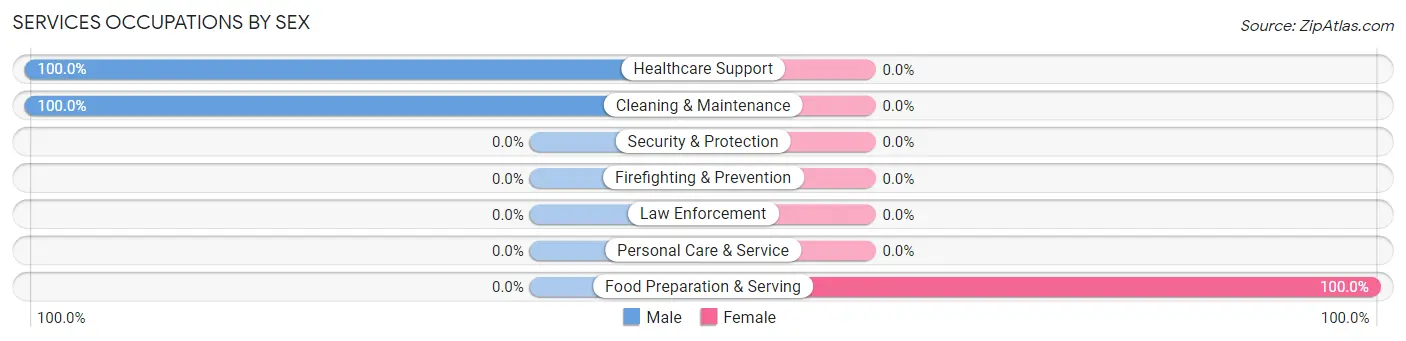
Services Occupations
The most common Services occupations in Natchez are Cleaning & Maintenance (10 | 6.6%), Healthcare Support (8 | 5.3%), and Food Preparation & Serving (3 | 2.0%).
Services Occupations by Sex
| Occupation | Male | Female |
| Healthcare Support | 8 (100.0%) | 0 (0.0%) |
| Security & Protection | 0 (0.0%) | 0 (0.0%) |
| Firefighting & Prevention | 0 (0.0%) | 0 (0.0%) |
| Law Enforcement | 0 (0.0%) | 0 (0.0%) |
| Food Preparation & Serving | 0 (0.0%) | 3 (100.0%) |
| Cleaning & Maintenance | 10 (100.0%) | 0 (0.0%) |
| Personal Care & Service | 0 (0.0%) | 0 (0.0%) |
| Total (Category) | 18 (85.7%) | 3 (14.3%) |
| Total (Overall) | 80 (52.6%) | 72 (47.4%) |
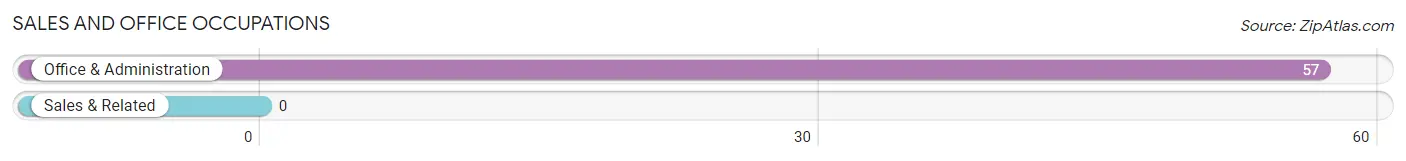
Sales and Office Occupations
The most common Sales and Office occupations in Natchez are , and Office & Administration (57 | 37.5%).
Sales and Office Occupations by Sex
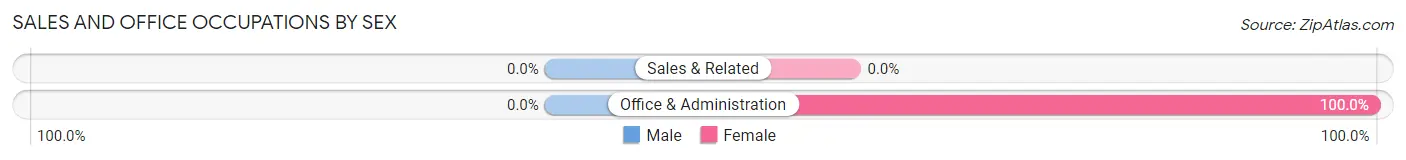
| Occupation | Male | Female |
| Sales & Related | 0 (0.0%) | 0 (0.0%) |
| Office & Administration | 0 (0.0%) | 57 (100.0%) |
| Total (Category) | 0 (0.0%) | 57 (100.0%) |
| Total (Overall) | 80 (52.6%) | 72 (47.4%) |
Natural Resources, Construction and Maintenance Occupations
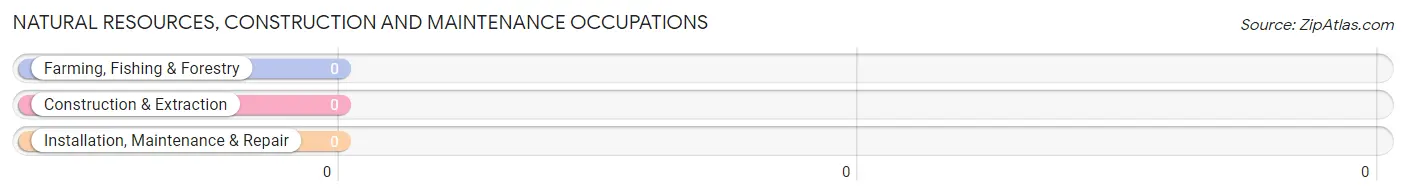
Natural Resources, Construction and Maintenance Occupations by Sex
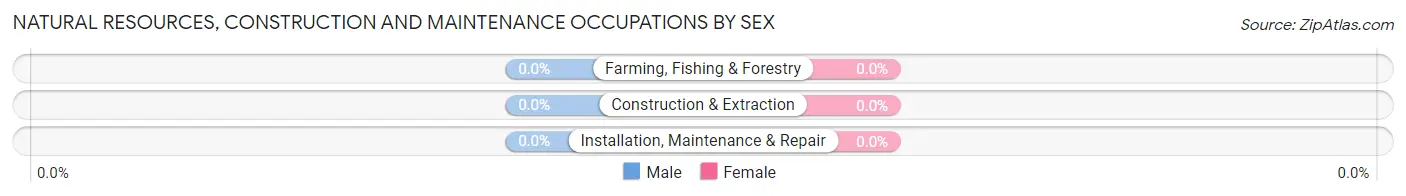
| Occupation | Male | Female |
| Farming, Fishing & Forestry | 0 (0.0%) | 0 (0.0%) |
| Construction & Extraction | 0 (0.0%) | 0 (0.0%) |
| Installation, Maintenance & Repair | 0 (0.0%) | 0 (0.0%) |
| Total (Category) | 0 (0.0%) | 0 (0.0%) |
| Total (Overall) | 80 (52.6%) | 72 (47.4%) |
Production, Transportation and Moving Occupations
The most common Production, Transportation and Moving occupations in Natchez are Production (22 | 14.5%), and Transportation (12 | 7.9%).
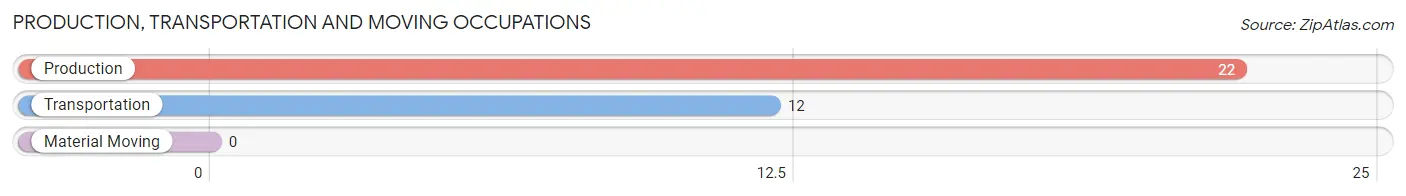
Production, Transportation and Moving Occupations by Sex
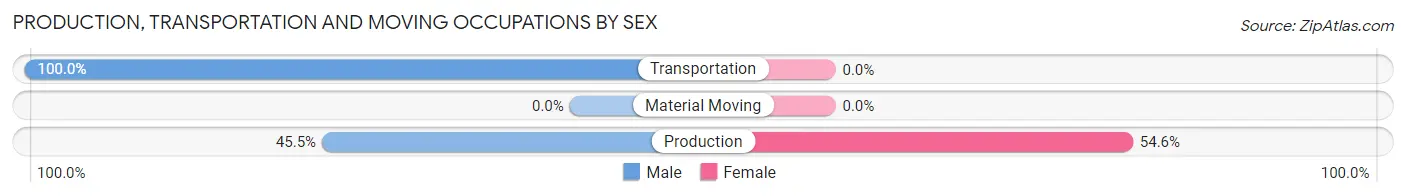
| Occupation | Male | Female |
| Production | 10 (45.5%) | 12 (54.5%) |
| Transportation | 12 (100.0%) | 0 (0.0%) |
| Material Moving | 0 (0.0%) | 0 (0.0%) |
| Total (Category) | 22 (64.7%) | 12 (35.3%) |
| Total (Overall) | 80 (52.6%) | 72 (47.4%) |
Employment Industries by Sex in Natchez
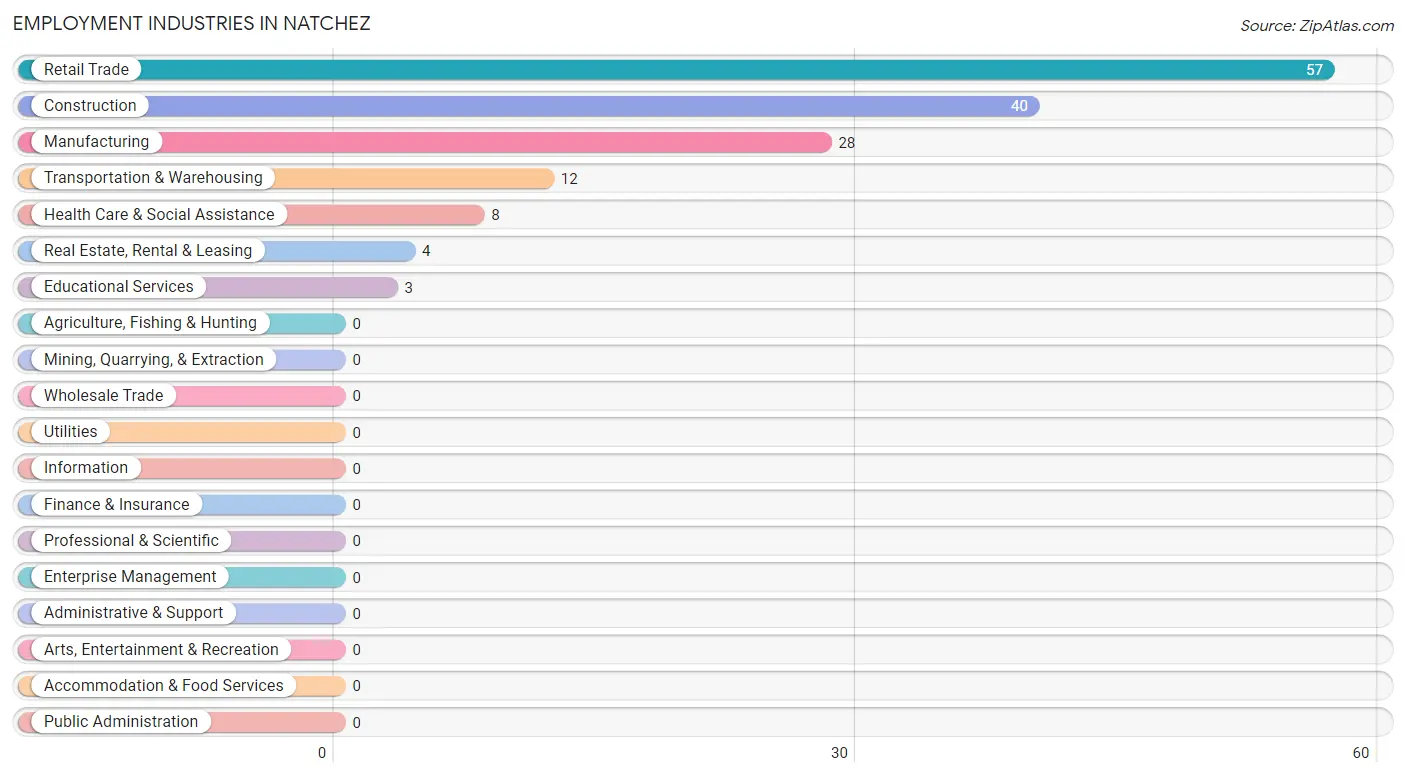
Employment Industries in Natchez
The major employment industries in Natchez include Retail Trade (57 | 37.5%), Construction (40 | 26.3%), Manufacturing (28 | 18.4%), Transportation & Warehousing (12 | 7.9%), and Health Care & Social Assistance (8 | 5.3%).
Employment Industries by Sex in Natchez
The Natchez industries that see more men than women are Construction (100.0%), Transportation & Warehousing (100.0%), and Real Estate, Rental & Leasing (100.0%), whereas the industries that tend to have a higher number of women are Retail Trade (100.0%), Educational Services (100.0%), and Manufacturing (42.9%).
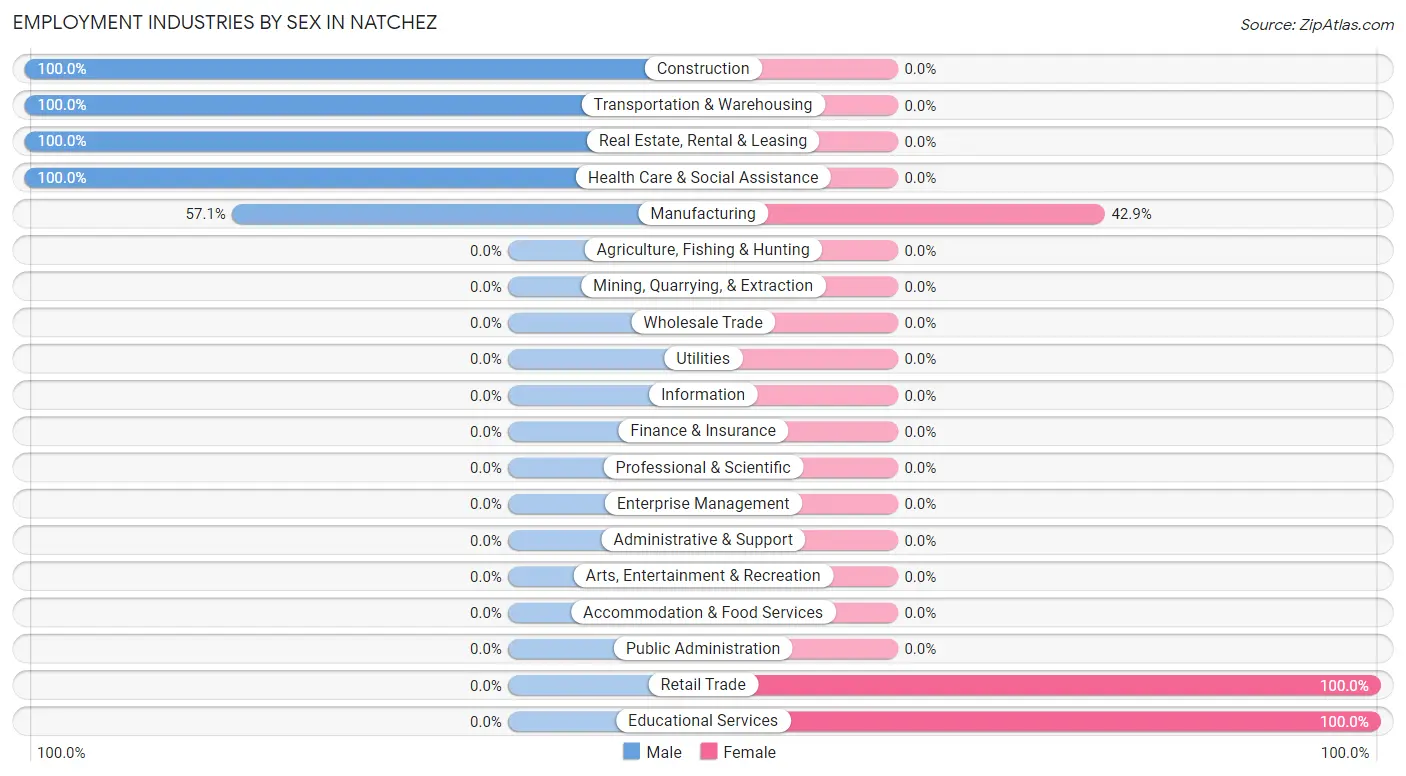
| Industry | Male | Female |
| Agriculture, Fishing & Hunting | 0 (0.0%) | 0 (0.0%) |
| Mining, Quarrying, & Extraction | 0 (0.0%) | 0 (0.0%) |
| Construction | 40 (100.0%) | 0 (0.0%) |
| Manufacturing | 16 (57.1%) | 12 (42.9%) |
| Wholesale Trade | 0 (0.0%) | 0 (0.0%) |
| Retail Trade | 0 (0.0%) | 57 (100.0%) |
| Transportation & Warehousing | 12 (100.0%) | 0 (0.0%) |
| Utilities | 0 (0.0%) | 0 (0.0%) |
| Information | 0 (0.0%) | 0 (0.0%) |
| Finance & Insurance | 0 (0.0%) | 0 (0.0%) |
| Real Estate, Rental & Leasing | 4 (100.0%) | 0 (0.0%) |
| Professional & Scientific | 0 (0.0%) | 0 (0.0%) |
| Enterprise Management | 0 (0.0%) | 0 (0.0%) |
| Administrative & Support | 0 (0.0%) | 0 (0.0%) |
| Educational Services | 0 (0.0%) | 3 (100.0%) |
| Health Care & Social Assistance | 8 (100.0%) | 0 (0.0%) |
| Arts, Entertainment & Recreation | 0 (0.0%) | 0 (0.0%) |
| Accommodation & Food Services | 0 (0.0%) | 0 (0.0%) |
| Public Administration | 0 (0.0%) | 0 (0.0%) |
| Total | 80 (52.6%) | 72 (47.4%) |
Education in Natchez
School Enrollment in Natchez
The most common levels of schooling among the 14 students in Natchez are high school (9 | 64.3%), and nursery / preschool (5 | 35.7%).
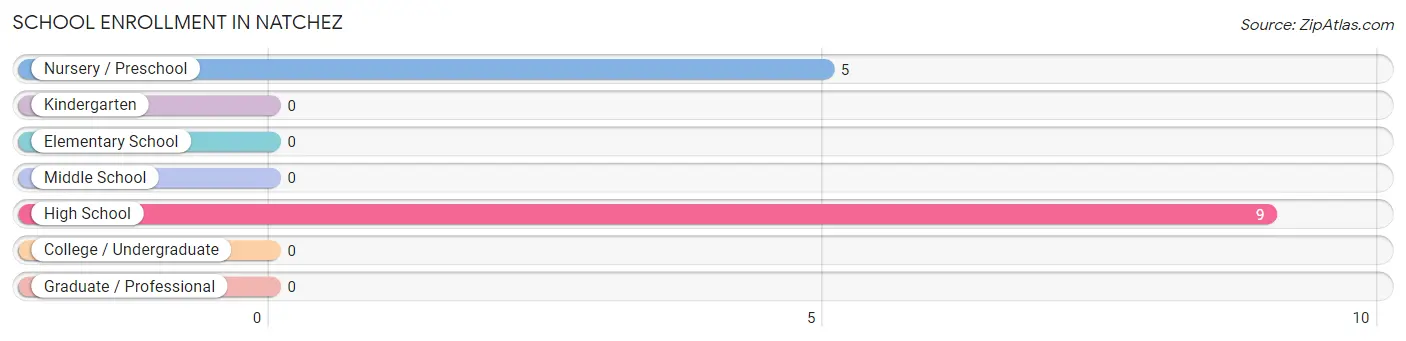
| School Level | # Students | % Students |
| Nursery / Preschool | 5 | 35.7% |
| Kindergarten | 0 | 0.0% |
| Elementary School | 0 | 0.0% |
| Middle School | 0 | 0.0% |
| High School | 9 | 64.3% |
| College / Undergraduate | 0 | 0.0% |
| Graduate / Professional | 0 | 0.0% |
| Total | 14 | 100.0% |
School Enrollment by Age by Funding Source in Natchez
Out of a total of 14 students who are enrolled in schools in Natchez, 5 (35.7%) attend a private institution, while the remaining 9 (64.3%) are enrolled in public schools. The age group of 10 to 14 year olds has the highest likelihood of being enrolled in private schools, with 5 (100.0% in the age bracket) enrolled. Conversely, the age group of 5 to 9 year old has the lowest likelihood of being enrolled in a private school, with 5 (100.0% in the age bracket) attending a public institution.
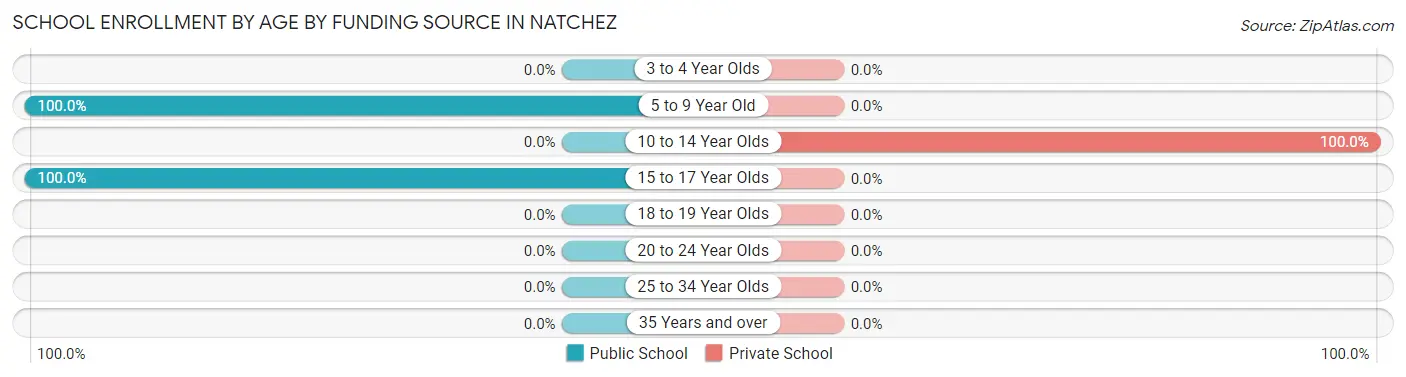
| Age Bracket | Public School | Private School |
| 3 to 4 Year Olds | 0 (0.0%) | 0 (0.0%) |
| 5 to 9 Year Old | 5 (100.0%) | 0 (0.0%) |
| 10 to 14 Year Olds | 0 (0.0%) | 5 (100.0%) |
| 15 to 17 Year Olds | 4 (100.0%) | 0 (0.0%) |
| 18 to 19 Year Olds | 0 (0.0%) | 0 (0.0%) |
| 20 to 24 Year Olds | 0 (0.0%) | 0 (0.0%) |
| 25 to 34 Year Olds | 0 (0.0%) | 0 (0.0%) |
| 35 Years and over | 0 (0.0%) | 0 (0.0%) |
| Total | 9 (64.3%) | 5 (35.7%) |
Educational Attainment by Field of Study in Natchez
Business (1 | 50.0%), and education (1 | 50.0%) are the most common fields of study among 2 individuals in Natchez who have obtained a bachelor's degree or higher.
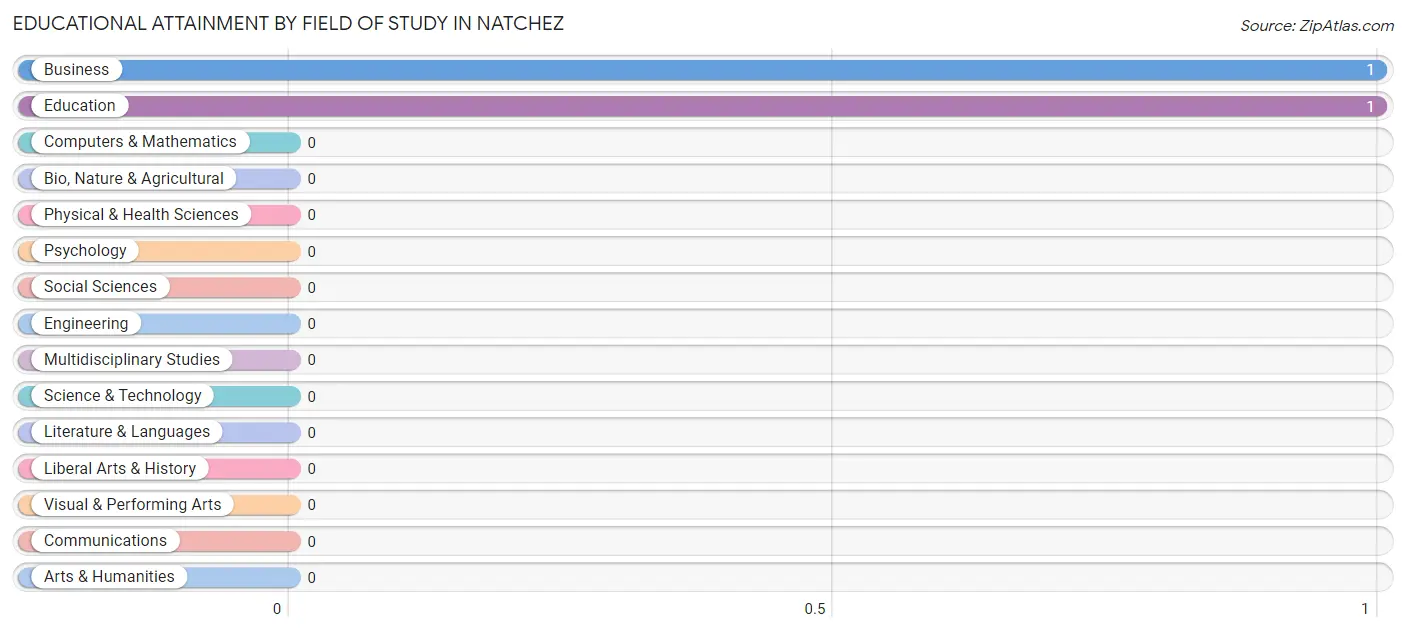
| Field of Study | # Graduates | % Graduates |
| Computers & Mathematics | 0 | 0.0% |
| Bio, Nature & Agricultural | 0 | 0.0% |
| Physical & Health Sciences | 0 | 0.0% |
| Psychology | 0 | 0.0% |
| Social Sciences | 0 | 0.0% |
| Engineering | 0 | 0.0% |
| Multidisciplinary Studies | 0 | 0.0% |
| Science & Technology | 0 | 0.0% |
| Business | 1 | 50.0% |
| Education | 1 | 50.0% |
| Literature & Languages | 0 | 0.0% |
| Liberal Arts & History | 0 | 0.0% |
| Visual & Performing Arts | 0 | 0.0% |
| Communications | 0 | 0.0% |
| Arts & Humanities | 0 | 0.0% |
| Total | 2 | 100.0% |
Transportation & Commute in Natchez
Vehicle Availability by Sex in Natchez
The most prevalent vehicle ownership categories in Natchez are males with 3 vehicles (40, accounting for 50.0%) and females with 3 vehicles (3, making up 55.6%).
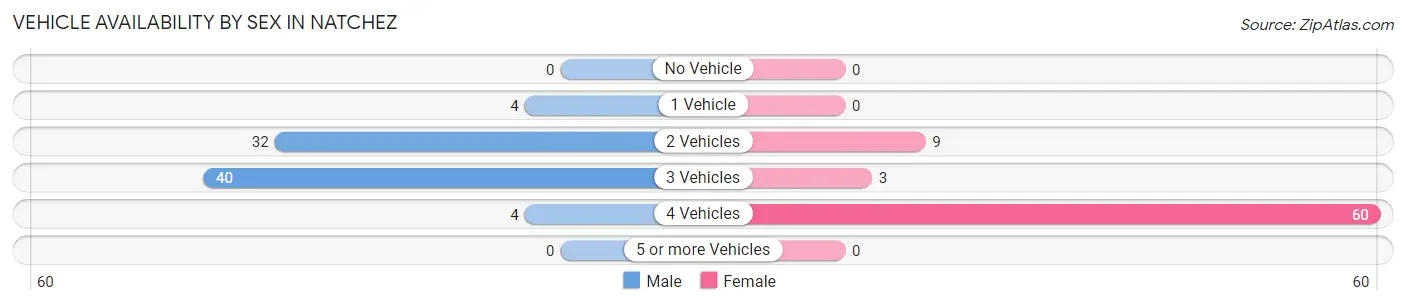
| Vehicles Available | Male | Female |
| No Vehicle | 0 (0.0%) | 0 (0.0%) |
| 1 Vehicle | 4 (5.0%) | 0 (0.0%) |
| 2 Vehicles | 32 (40.0%) | 9 (12.5%) |
| 3 Vehicles | 40 (50.0%) | 3 (4.2%) |
| 4 Vehicles | 4 (5.0%) | 60 (83.3%) |
| 5 or more Vehicles | 0 (0.0%) | 0 (0.0%) |
| Total | 80 (100.0%) | 72 (100.0%) |
Commute Time in Natchez
The most frequently occuring commute durations in Natchez are 5 to 9 minutes (61 commuters, 40.1%), 20 to 24 minutes (40 commuters, 26.3%), and 15 to 19 minutes (20 commuters, 13.2%).
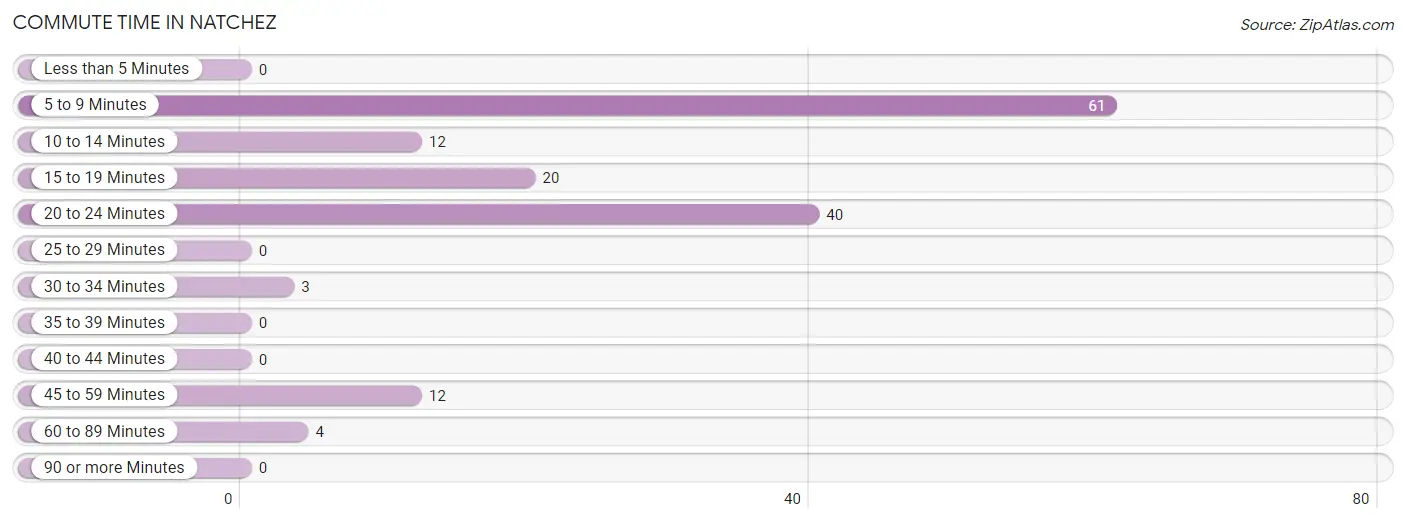
| Commute Time | # Commuters | % Commuters |
| Less than 5 Minutes | 0 | 0.0% |
| 5 to 9 Minutes | 61 | 40.1% |
| 10 to 14 Minutes | 12 | 7.9% |
| 15 to 19 Minutes | 20 | 13.2% |
| 20 to 24 Minutes | 40 | 26.3% |
| 25 to 29 Minutes | 0 | 0.0% |
| 30 to 34 Minutes | 3 | 2.0% |
| 35 to 39 Minutes | 0 | 0.0% |
| 40 to 44 Minutes | 0 | 0.0% |
| 45 to 59 Minutes | 12 | 7.9% |
| 60 to 89 Minutes | 4 | 2.6% |
| 90 or more Minutes | 0 | 0.0% |
Commute Time by Sex in Natchez
The most common commute times in Natchez are 20 to 24 minutes (40 commuters, 50.0%) for males and 5 to 9 minutes (57 commuters, 79.2%) for females.
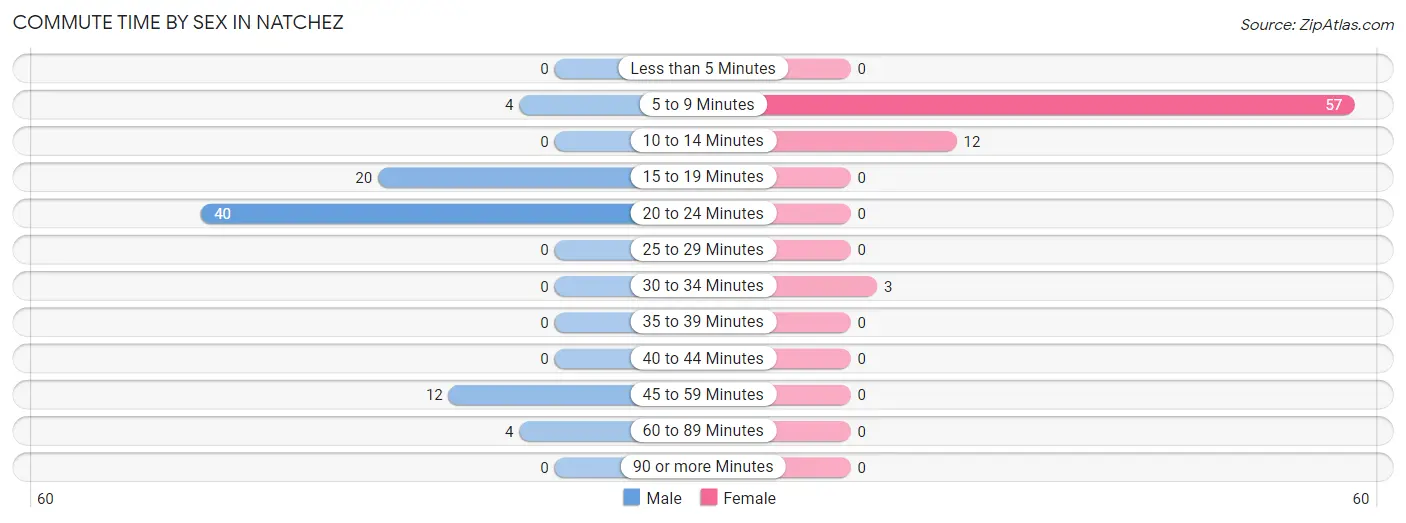
| Commute Time | Male | Female |
| Less than 5 Minutes | 0 (0.0%) | 0 (0.0%) |
| 5 to 9 Minutes | 4 (5.0%) | 57 (79.2%) |
| 10 to 14 Minutes | 0 (0.0%) | 12 (16.7%) |
| 15 to 19 Minutes | 20 (25.0%) | 0 (0.0%) |
| 20 to 24 Minutes | 40 (50.0%) | 0 (0.0%) |
| 25 to 29 Minutes | 0 (0.0%) | 0 (0.0%) |
| 30 to 34 Minutes | 0 (0.0%) | 3 (4.2%) |
| 35 to 39 Minutes | 0 (0.0%) | 0 (0.0%) |
| 40 to 44 Minutes | 0 (0.0%) | 0 (0.0%) |
| 45 to 59 Minutes | 12 (15.0%) | 0 (0.0%) |
| 60 to 89 Minutes | 4 (5.0%) | 0 (0.0%) |
| 90 or more Minutes | 0 (0.0%) | 0 (0.0%) |
Time of Departure to Work by Sex in Natchez
The most frequent times of departure to work in Natchez are 7:30 AM to 7:59 AM (40, 50.0%) for males and 10:00 AM to 10:59 AM (57, 79.2%) for females.
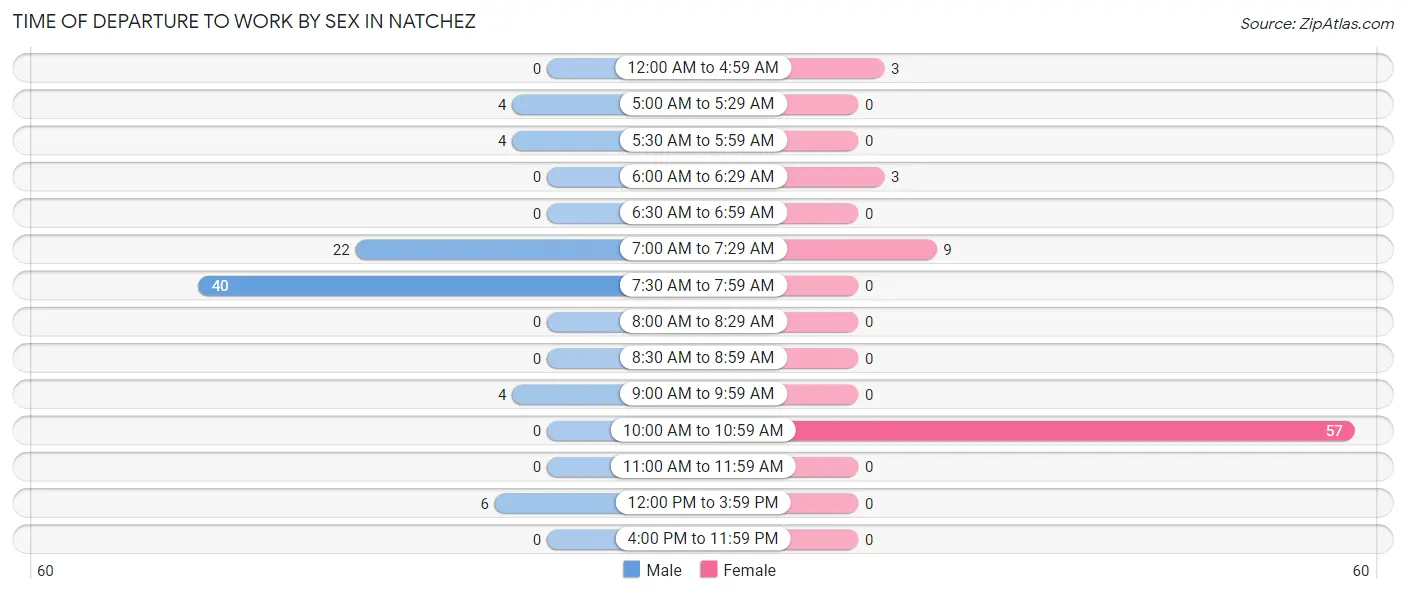
| Time of Departure | Male | Female |
| 12:00 AM to 4:59 AM | 0 (0.0%) | 3 (4.2%) |
| 5:00 AM to 5:29 AM | 4 (5.0%) | 0 (0.0%) |
| 5:30 AM to 5:59 AM | 4 (5.0%) | 0 (0.0%) |
| 6:00 AM to 6:29 AM | 0 (0.0%) | 3 (4.2%) |
| 6:30 AM to 6:59 AM | 0 (0.0%) | 0 (0.0%) |
| 7:00 AM to 7:29 AM | 22 (27.5%) | 9 (12.5%) |
| 7:30 AM to 7:59 AM | 40 (50.0%) | 0 (0.0%) |
| 8:00 AM to 8:29 AM | 0 (0.0%) | 0 (0.0%) |
| 8:30 AM to 8:59 AM | 0 (0.0%) | 0 (0.0%) |
| 9:00 AM to 9:59 AM | 4 (5.0%) | 0 (0.0%) |
| 10:00 AM to 10:59 AM | 0 (0.0%) | 57 (79.2%) |
| 11:00 AM to 11:59 AM | 0 (0.0%) | 0 (0.0%) |
| 12:00 PM to 3:59 PM | 6 (7.5%) | 0 (0.0%) |
| 4:00 PM to 11:59 PM | 0 (0.0%) | 0 (0.0%) |
| Total | 80 (100.0%) | 72 (100.0%) |
Housing Occupancy in Natchez
Occupancy by Ownership in Natchez
Of the total 199 dwellings in Natchez, owner-occupied units account for 135 (67.8%), while renter-occupied units make up 64 (32.2%).
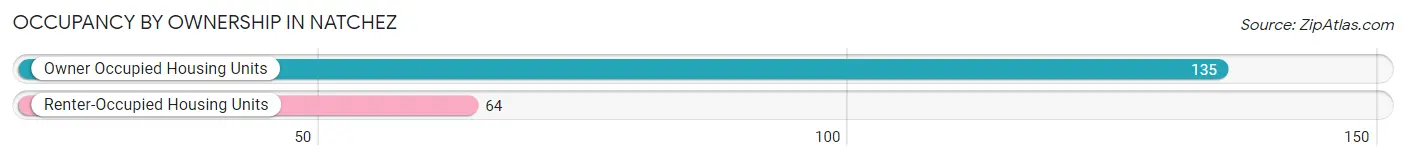
| Occupancy | # Housing Units | % Housing Units |
| Owner Occupied Housing Units | 135 | 67.8% |
| Renter-Occupied Housing Units | 64 | 32.2% |
| Total Occupied Housing Units | 199 | 100.0% |
Occupancy by Household Size in Natchez
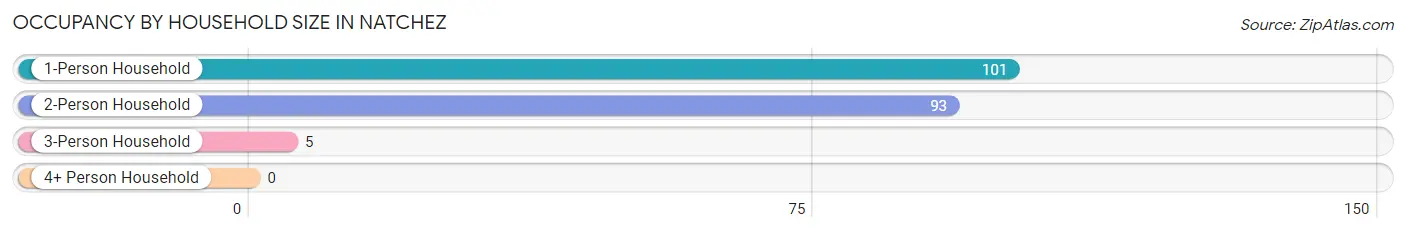
| Household Size | # Housing Units | % Housing Units |
| 1-Person Household | 101 | 50.7% |
| 2-Person Household | 93 | 46.7% |
| 3-Person Household | 5 | 2.5% |
| 4+ Person Household | 0 | 0.0% |
| Total Housing Units | 199 | 100.0% |
Occupancy by Ownership by Household Size in Natchez
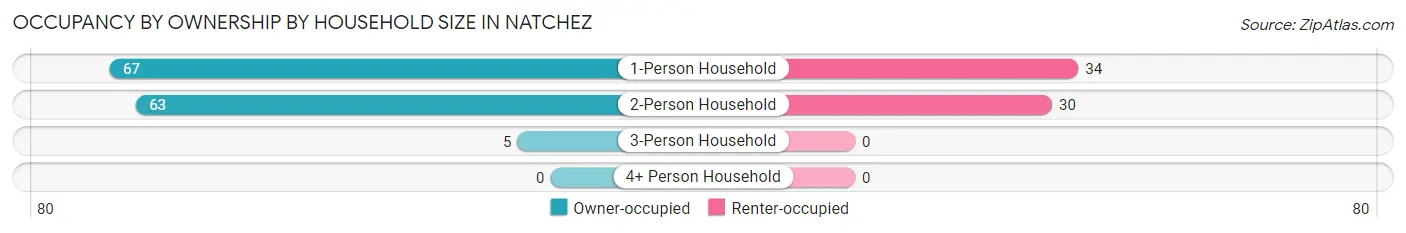
| Household Size | Owner-occupied | Renter-occupied |
| 1-Person Household | 67 (66.3%) | 34 (33.7%) |
| 2-Person Household | 63 (67.7%) | 30 (32.3%) |
| 3-Person Household | 5 (100.0%) | 0 (0.0%) |
| 4+ Person Household | 0 (0.0%) | 0 (0.0%) |
| Total Housing Units | 135 (67.8%) | 64 (32.2%) |
Occupancy by Educational Attainment in Natchez
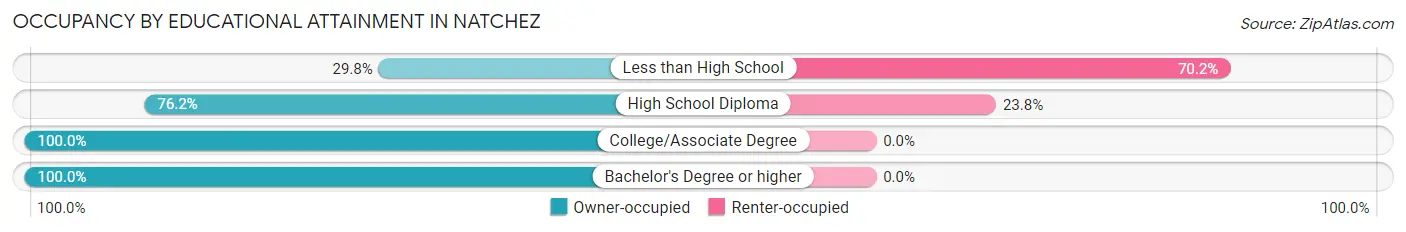
| Household Size | Owner-occupied | Renter-occupied |
| Less than High School | 17 (29.8%) | 40 (70.2%) |
| High School Diploma | 77 (76.2%) | 24 (23.8%) |
| College/Associate Degree | 40 (100.0%) | 0 (0.0%) |
| Bachelor's Degree or higher | 1 (100.0%) | 0 (0.0%) |
Occupancy by Age of Householder in Natchez
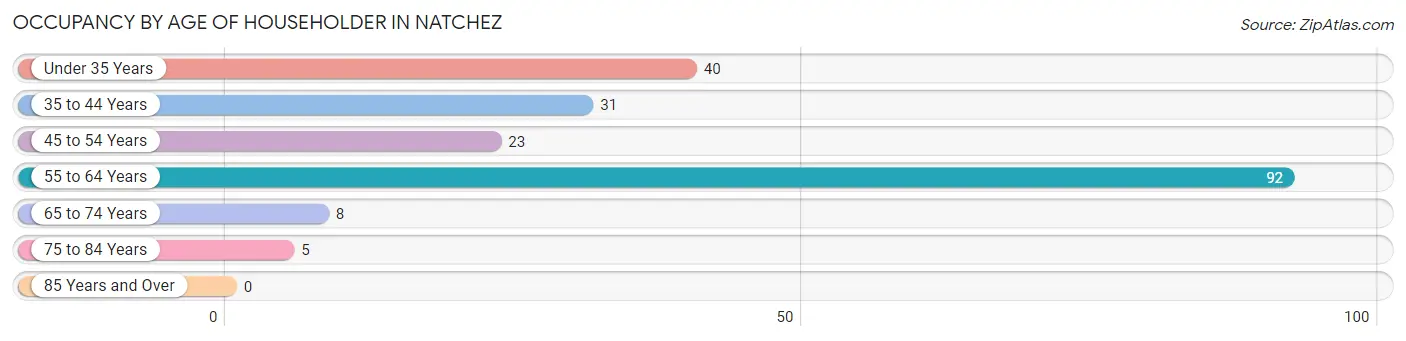
| Age Bracket | # Households | % Households |
| Under 35 Years | 40 | 20.1% |
| 35 to 44 Years | 31 | 15.6% |
| 45 to 54 Years | 23 | 11.6% |
| 55 to 64 Years | 92 | 46.2% |
| 65 to 74 Years | 8 | 4.0% |
| 75 to 84 Years | 5 | 2.5% |
| 85 Years and Over | 0 | 0.0% |
| Total | 199 | 100.0% |
Housing Finances in Natchez
Median Income by Occupancy in Natchez
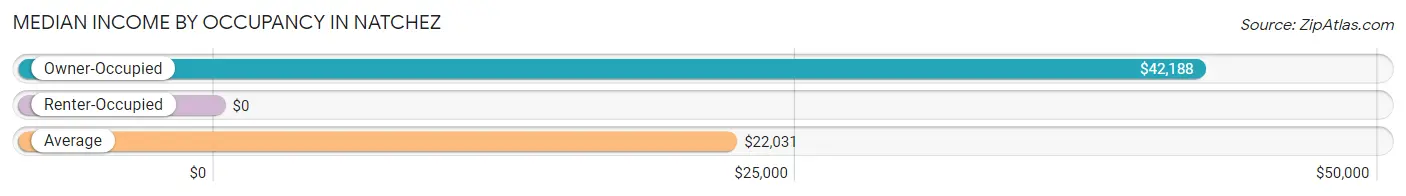
| Occupancy Type | # Households | Median Income |
| Owner-Occupied | 135 (67.8%) | $42,188 |
| Renter-Occupied | 64 (32.2%) | $0 |
| Average | 199 (100.0%) | $22,031 |
Occupancy by Householder Income Bracket in Natchez
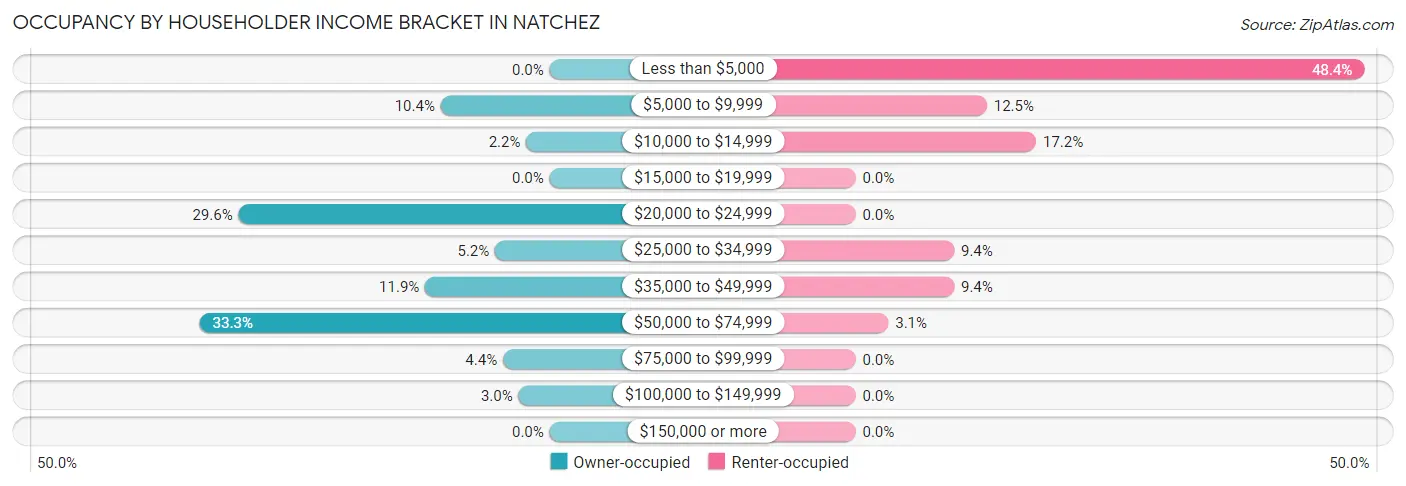
| Income Bracket | Owner-occupied | Renter-occupied |
| Less than $5,000 | 0 (0.0%) | 31 (48.4%) |
| $5,000 to $9,999 | 14 (10.4%) | 8 (12.5%) |
| $10,000 to $14,999 | 3 (2.2%) | 11 (17.2%) |
| $15,000 to $19,999 | 0 (0.0%) | 0 (0.0%) |
| $20,000 to $24,999 | 40 (29.6%) | 0 (0.0%) |
| $25,000 to $34,999 | 7 (5.2%) | 6 (9.4%) |
| $35,000 to $49,999 | 16 (11.8%) | 6 (9.4%) |
| $50,000 to $74,999 | 45 (33.3%) | 2 (3.1%) |
| $75,000 to $99,999 | 6 (4.4%) | 0 (0.0%) |
| $100,000 to $149,999 | 4 (3.0%) | 0 (0.0%) |
| $150,000 or more | 0 (0.0%) | 0 (0.0%) |
| Total | 135 (100.0%) | 64 (100.0%) |
Monthly Housing Cost Tiers in Natchez
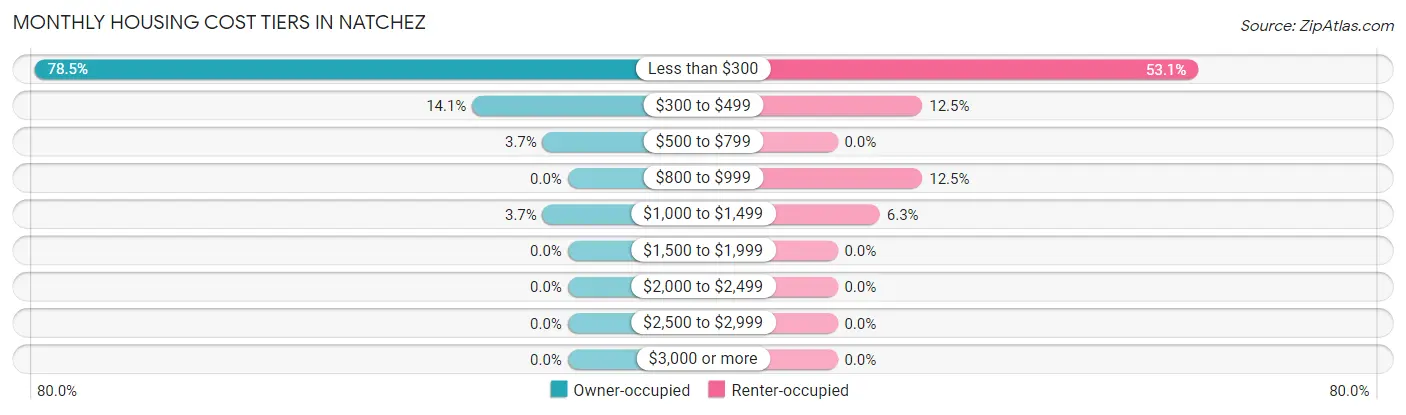
| Monthly Cost | Owner-occupied | Renter-occupied |
| Less than $300 | 106 (78.5%) | 34 (53.1%) |
| $300 to $499 | 19 (14.1%) | 8 (12.5%) |
| $500 to $799 | 5 (3.7%) | 0 (0.0%) |
| $800 to $999 | 0 (0.0%) | 8 (12.5%) |
| $1,000 to $1,499 | 5 (3.7%) | 4 (6.2%) |
| $1,500 to $1,999 | 0 (0.0%) | 0 (0.0%) |
| $2,000 to $2,499 | 0 (0.0%) | 0 (0.0%) |
| $2,500 to $2,999 | 0 (0.0%) | 0 (0.0%) |
| $3,000 or more | 0 (0.0%) | 0 (0.0%) |
| Total | 135 (100.0%) | 64 (100.0%) |
Physical Housing Characteristics in Natchez
Housing Structures in Natchez
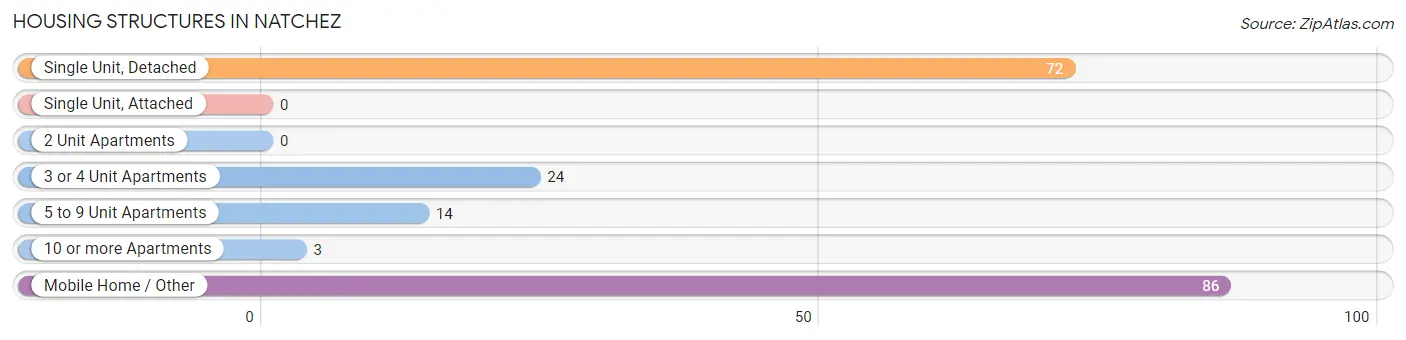
| Structure Type | # Housing Units | % Housing Units |
| Single Unit, Detached | 72 | 36.2% |
| Single Unit, Attached | 0 | 0.0% |
| 2 Unit Apartments | 0 | 0.0% |
| 3 or 4 Unit Apartments | 24 | 12.1% |
| 5 to 9 Unit Apartments | 14 | 7.0% |
| 10 or more Apartments | 3 | 1.5% |
| Mobile Home / Other | 86 | 43.2% |
| Total | 199 | 100.0% |
Housing Structures by Occupancy in Natchez
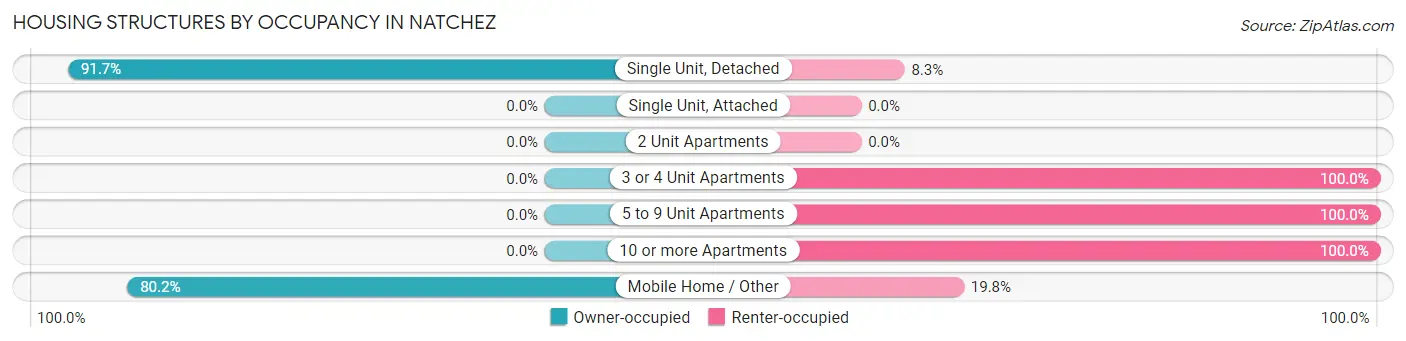
| Structure Type | Owner-occupied | Renter-occupied |
| Single Unit, Detached | 66 (91.7%) | 6 (8.3%) |
| Single Unit, Attached | 0 (0.0%) | 0 (0.0%) |
| 2 Unit Apartments | 0 (0.0%) | 0 (0.0%) |
| 3 or 4 Unit Apartments | 0 (0.0%) | 24 (100.0%) |
| 5 to 9 Unit Apartments | 0 (0.0%) | 14 (100.0%) |
| 10 or more Apartments | 0 (0.0%) | 3 (100.0%) |
| Mobile Home / Other | 69 (80.2%) | 17 (19.8%) |
| Total | 135 (67.8%) | 64 (32.2%) |
Housing Structures by Number of Rooms in Natchez
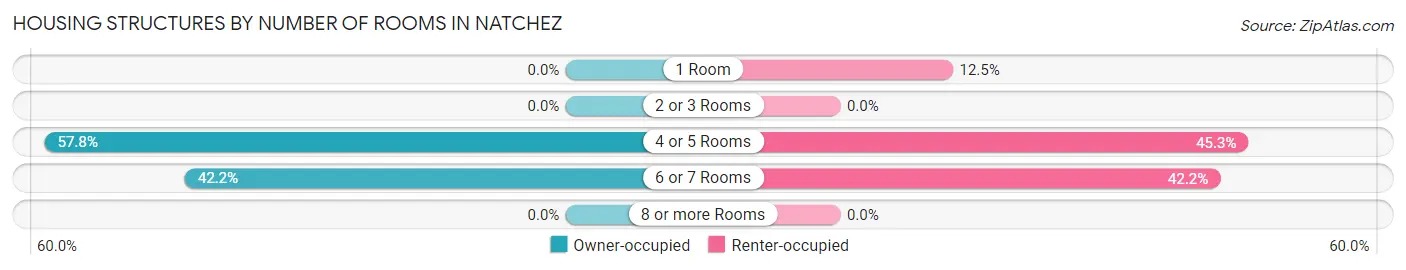
| Number of Rooms | Owner-occupied | Renter-occupied |
| 1 Room | 0 (0.0%) | 8 (12.5%) |
| 2 or 3 Rooms | 0 (0.0%) | 0 (0.0%) |
| 4 or 5 Rooms | 78 (57.8%) | 29 (45.3%) |
| 6 or 7 Rooms | 57 (42.2%) | 27 (42.2%) |
| 8 or more Rooms | 0 (0.0%) | 0 (0.0%) |
| Total | 135 (100.0%) | 64 (100.0%) |
Housing Structure by Heating Type in Natchez
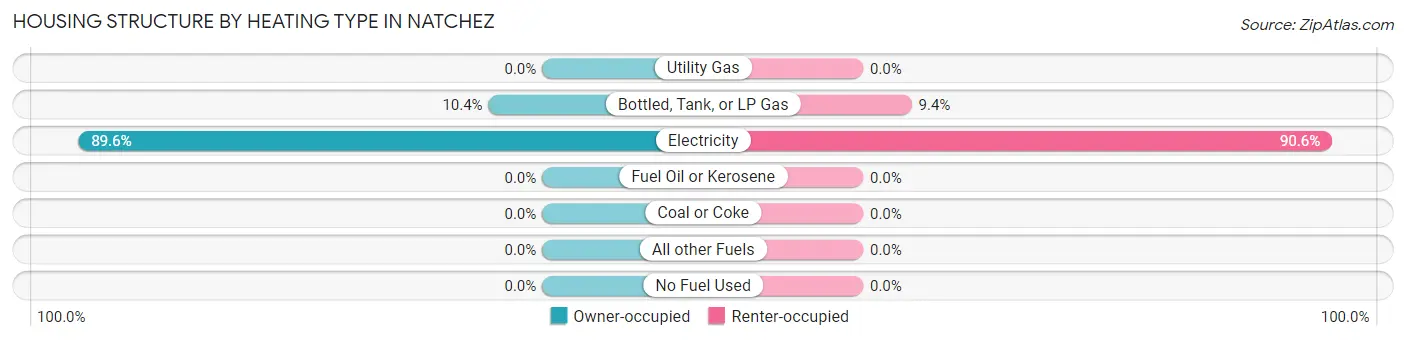
| Heating Type | Owner-occupied | Renter-occupied |
| Utility Gas | 0 (0.0%) | 0 (0.0%) |
| Bottled, Tank, or LP Gas | 14 (10.4%) | 6 (9.4%) |
| Electricity | 121 (89.6%) | 58 (90.6%) |
| Fuel Oil or Kerosene | 0 (0.0%) | 0 (0.0%) |
| Coal or Coke | 0 (0.0%) | 0 (0.0%) |
| All other Fuels | 0 (0.0%) | 0 (0.0%) |
| No Fuel Used | 0 (0.0%) | 0 (0.0%) |
| Total | 135 (100.0%) | 64 (100.0%) |
Household Vehicle Usage in Natchez
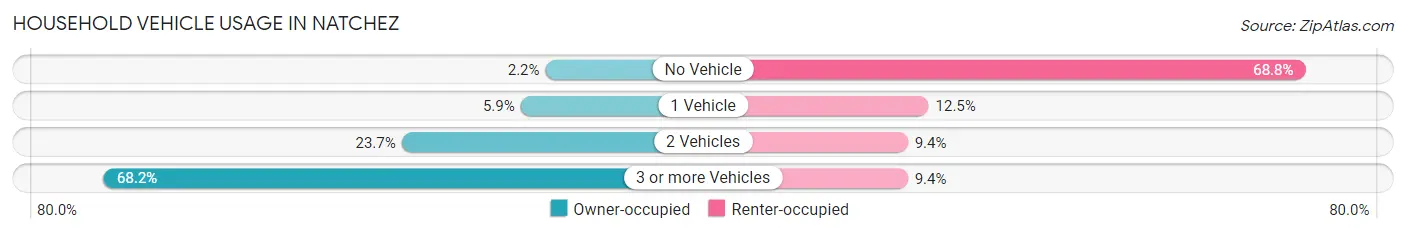
| Vehicles per Household | Owner-occupied | Renter-occupied |
| No Vehicle | 3 (2.2%) | 44 (68.8%) |
| 1 Vehicle | 8 (5.9%) | 8 (12.5%) |
| 2 Vehicles | 32 (23.7%) | 6 (9.4%) |
| 3 or more Vehicles | 92 (68.1%) | 6 (9.4%) |
| Total | 135 (100.0%) | 64 (100.0%) |
Real Estate & Mortgages in Natchez
Real Estate and Mortgage Overview in Natchez
| Characteristic | Without Mortgage | With Mortgage |
| Housing Units | 131 | 4 |
| Median Property Value | - | - |
| Median Household Income | - | - |
| Monthly Housing Costs | $274 | $0 |
| Real Estate Taxes | - | - |
Property Value by Mortgage Status in Natchez
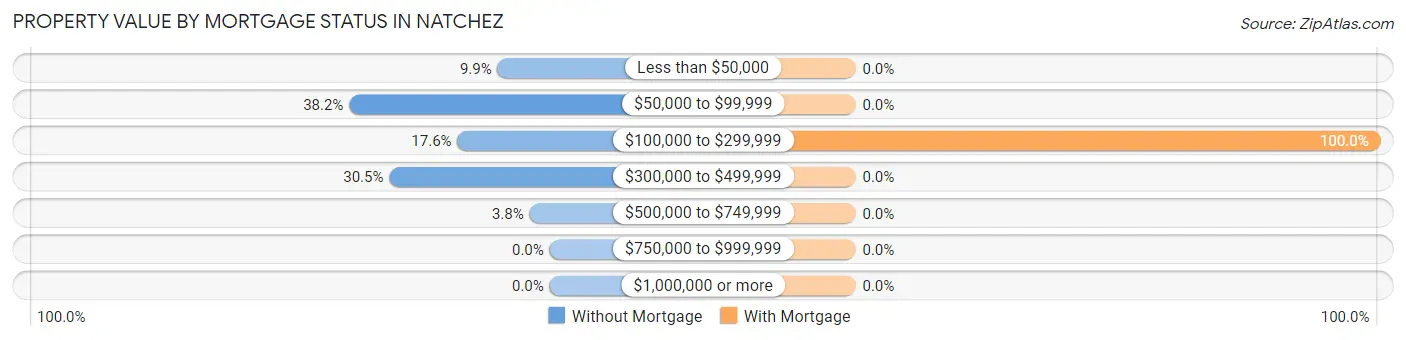
| Property Value | Without Mortgage | With Mortgage |
| Less than $50,000 | 13 (9.9%) | 0 (0.0%) |
| $50,000 to $99,999 | 50 (38.2%) | 0 (0.0%) |
| $100,000 to $299,999 | 23 (17.6%) | 4 (100.0%) |
| $300,000 to $499,999 | 40 (30.5%) | 0 (0.0%) |
| $500,000 to $749,999 | 5 (3.8%) | 0 (0.0%) |
| $750,000 to $999,999 | 0 (0.0%) | 0 (0.0%) |
| $1,000,000 or more | 0 (0.0%) | 0 (0.0%) |
| Total | 131 (100.0%) | 4 (100.0%) |
Household Income by Mortgage Status in Natchez
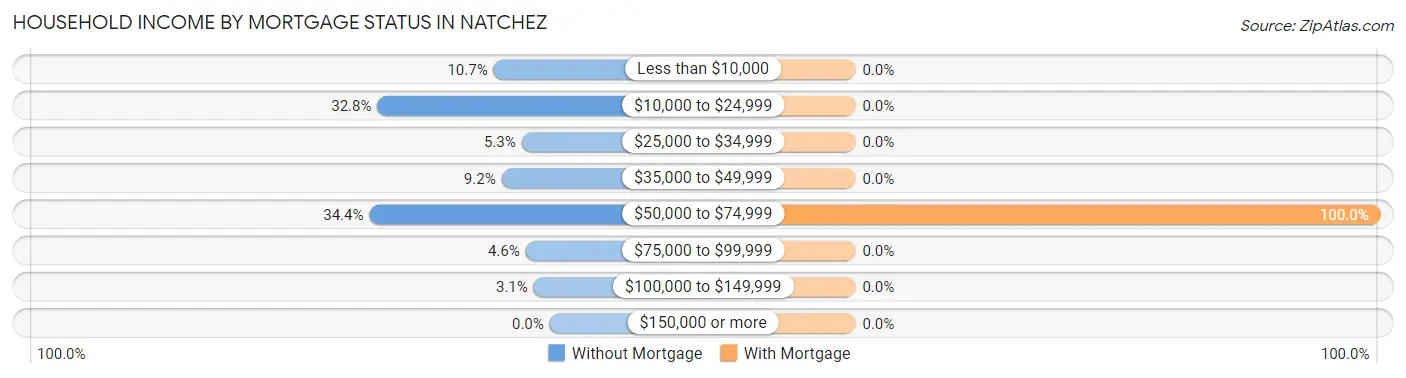
| Household Income | Without Mortgage | With Mortgage |
| Less than $10,000 | 14 (10.7%) | 0 (0.0%) |
| $10,000 to $24,999 | 43 (32.8%) | 0 (0.0%) |
| $25,000 to $34,999 | 7 (5.3%) | 0 (0.0%) |
| $35,000 to $49,999 | 12 (9.2%) | 0 (0.0%) |
| $50,000 to $74,999 | 45 (34.4%) | 4 (100.0%) |
| $75,000 to $99,999 | 6 (4.6%) | 0 (0.0%) |
| $100,000 to $149,999 | 4 (3.0%) | 0 (0.0%) |
| $150,000 or more | 0 (0.0%) | 0 (0.0%) |
| Total | 131 (100.0%) | 4 (100.0%) |
Property Value to Household Income Ratio in Natchez
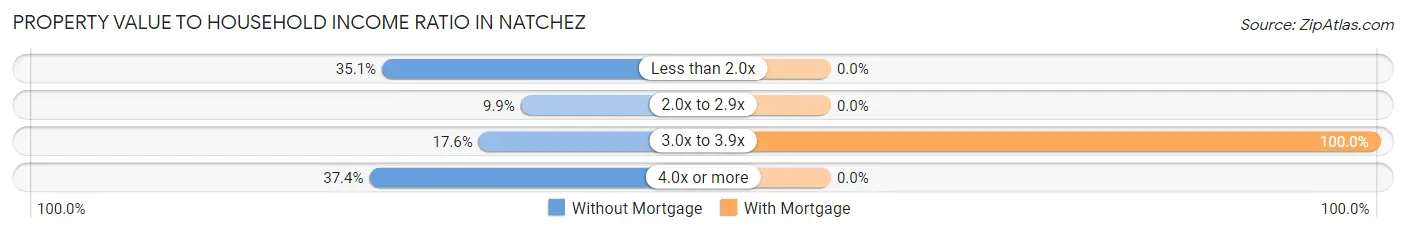
| Value-to-Income Ratio | Without Mortgage | With Mortgage |
| Less than 2.0x | 46 (35.1%) | 0 (0.0%) |
| 2.0x to 2.9x | 13 (9.9%) | 0 (0.0%) |
| 3.0x to 3.9x | 23 (17.6%) | 4 (100.0%) |
| 4.0x or more | 49 (37.4%) | 0 (0.0%) |
| Total | 131 (100.0%) | 4 (100.0%) |
Real Estate Taxes by Mortgage Status in Natchez
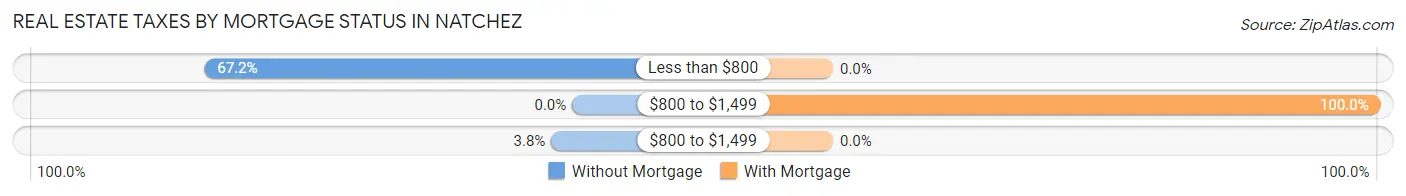
| Property Taxes | Without Mortgage | With Mortgage |
| Less than $800 | 88 (67.2%) | 0 (0.0%) |
| $800 to $1,499 | 0 (0.0%) | 4 (100.0%) |
| $800 to $1,499 | 5 (3.8%) | 0 (0.0%) |
| Total | 131 (100.0%) | 4 (100.0%) |
Health & Disability in Natchez
Health Insurance Coverage by Age in Natchez
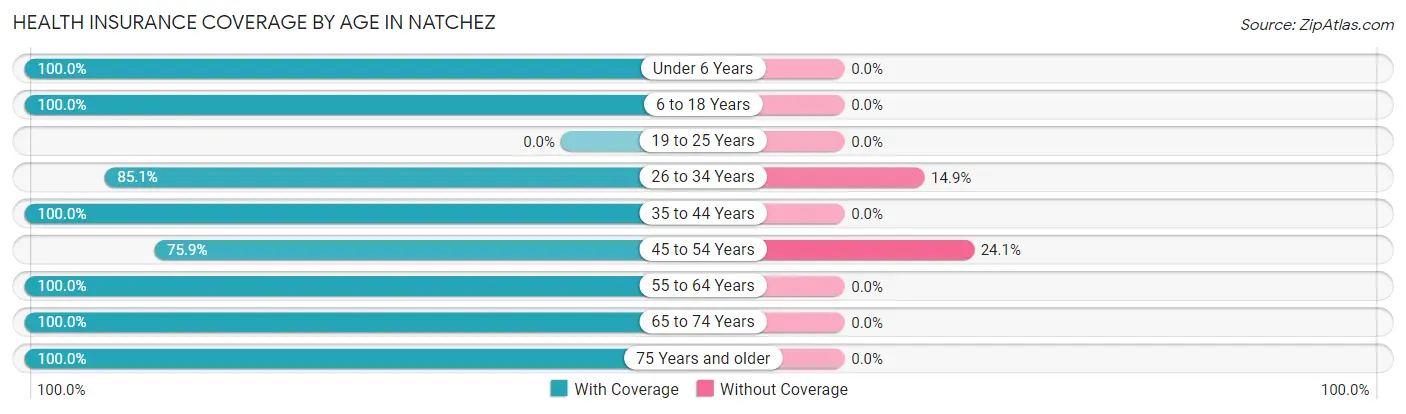
| Age Bracket | With Coverage | Without Coverage |
| Under 6 Years | 5 (100.0%) | 0 (0.0%) |
| 6 to 18 Years | 9 (100.0%) | 0 (0.0%) |
| 19 to 25 Years | 0 (0.0%) | 0 (0.0%) |
| 26 to 34 Years | 40 (85.1%) | 7 (14.9%) |
| 35 to 44 Years | 34 (100.0%) | 0 (0.0%) |
| 45 to 54 Years | 22 (75.9%) | 7 (24.1%) |
| 55 to 64 Years | 164 (100.0%) | 0 (0.0%) |
| 65 to 74 Years | 9 (100.0%) | 0 (0.0%) |
| 75 Years and older | 7 (100.0%) | 0 (0.0%) |
| Total | 290 (95.4%) | 14 (4.6%) |
Health Insurance Coverage by Citizenship Status in Natchez
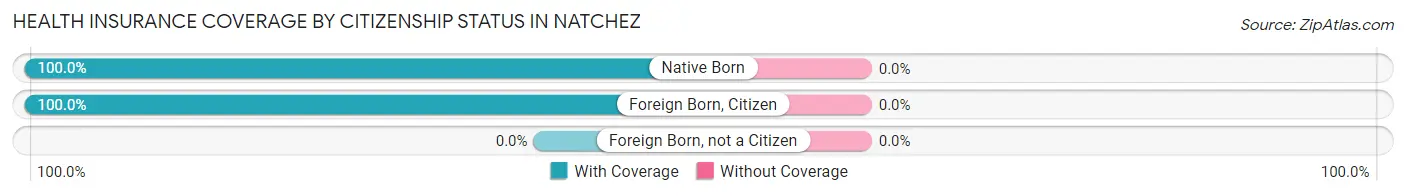
| Citizenship Status | With Coverage | Without Coverage |
| Native Born | 5 (100.0%) | 0 (0.0%) |
| Foreign Born, Citizen | 9 (100.0%) | 0 (0.0%) |
| Foreign Born, not a Citizen | 0 (0.0%) | 0 (0.0%) |
Health Insurance Coverage by Household Income in Natchez
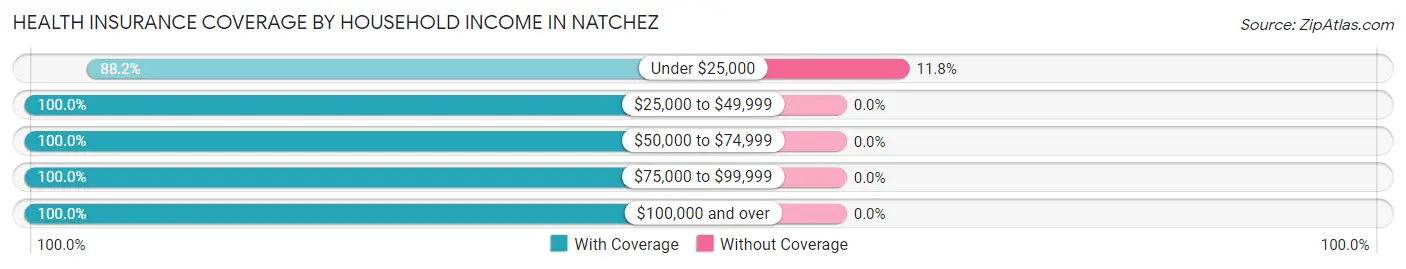
| Household Income | With Coverage | Without Coverage |
| Under $25,000 | 105 (88.2%) | 14 (11.8%) |
| $25,000 to $49,999 | 58 (100.0%) | 0 (0.0%) |
| $50,000 to $74,999 | 104 (100.0%) | 0 (0.0%) |
| $75,000 to $99,999 | 11 (100.0%) | 0 (0.0%) |
| $100,000 and over | 12 (100.0%) | 0 (0.0%) |
Public vs Private Health Insurance Coverage by Age in Natchez
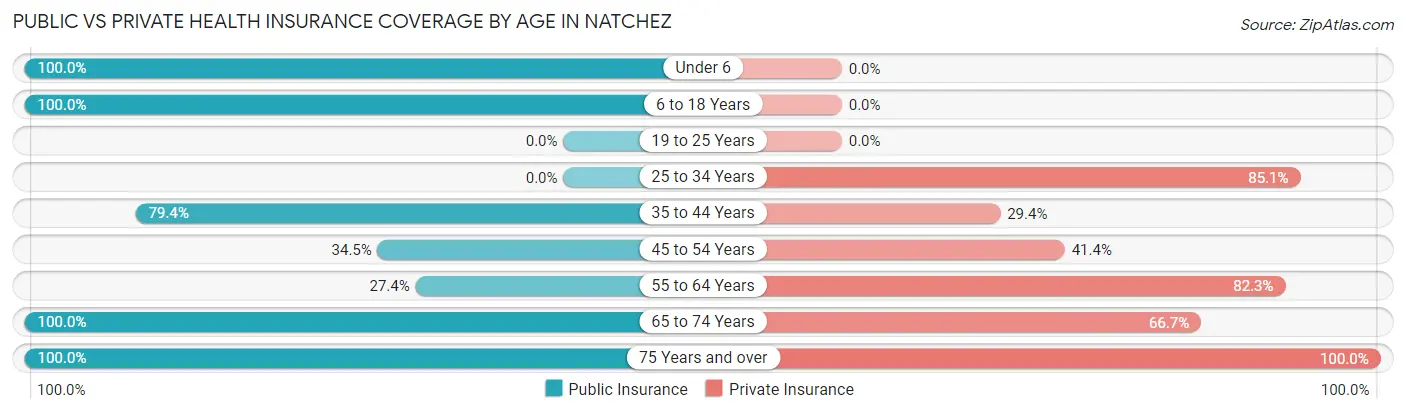
| Age Bracket | Public Insurance | Private Insurance |
| Under 6 | 5 (100.0%) | 0 (0.0%) |
| 6 to 18 Years | 9 (100.0%) | 0 (0.0%) |
| 19 to 25 Years | 0 (0.0%) | 0 (0.0%) |
| 25 to 34 Years | 0 (0.0%) | 40 (85.1%) |
| 35 to 44 Years | 27 (79.4%) | 10 (29.4%) |
| 45 to 54 Years | 10 (34.5%) | 12 (41.4%) |
| 55 to 64 Years | 45 (27.4%) | 135 (82.3%) |
| 65 to 74 Years | 9 (100.0%) | 6 (66.7%) |
| 75 Years and over | 7 (100.0%) | 7 (100.0%) |
| Total | 112 (36.8%) | 210 (69.1%) |
Disability Status by Sex by Age in Natchez
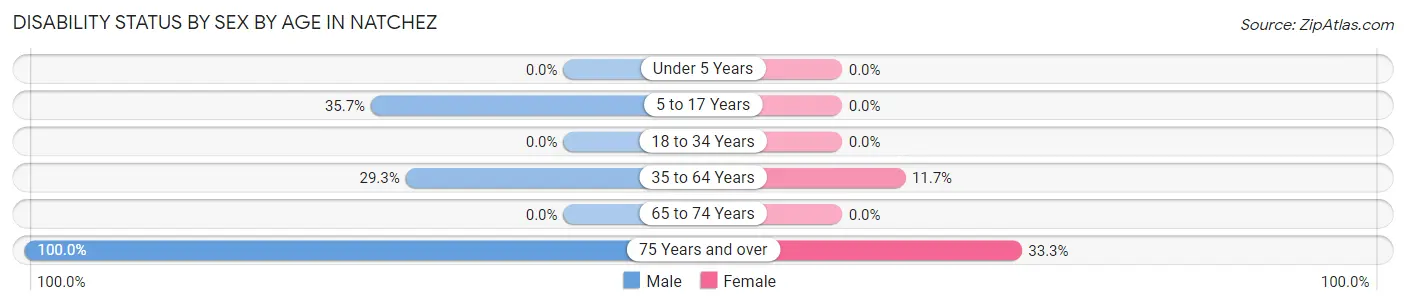
| Age Bracket | Male | Female |
| Under 5 Years | 0 (0.0%) | 0 (0.0%) |
| 5 to 17 Years | 5 (35.7%) | 0 (0.0%) |
| 18 to 34 Years | 0 (0.0%) | 0 (0.0%) |
| 35 to 64 Years | 29 (29.3%) | 15 (11.7%) |
| 65 to 74 Years | 0 (0.0%) | 0 (0.0%) |
| 75 Years and over | 1 (100.0%) | 2 (33.3%) |
Disability Class by Sex by Age in Natchez
Disability Class: Hearing Difficulty
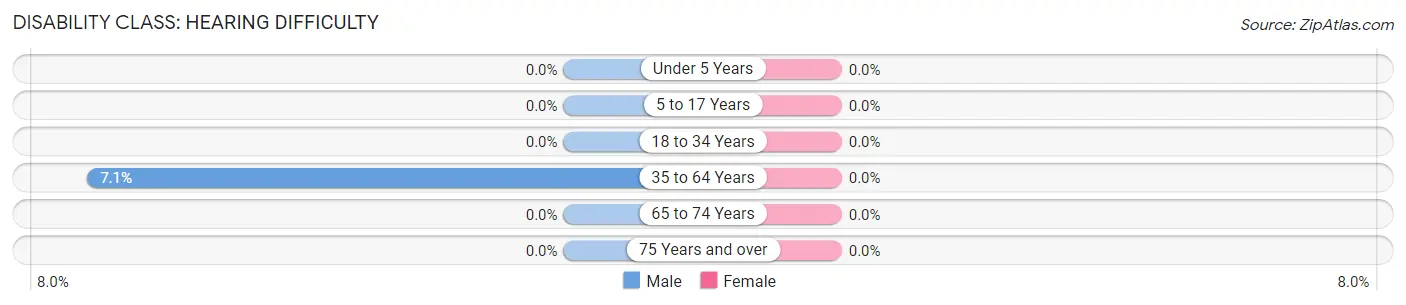
| Age Bracket | Male | Female |
| Under 5 Years | 0 (0.0%) | 0 (0.0%) |
| 5 to 17 Years | 0 (0.0%) | 0 (0.0%) |
| 18 to 34 Years | 0 (0.0%) | 0 (0.0%) |
| 35 to 64 Years | 7 (7.1%) | 0 (0.0%) |
| 65 to 74 Years | 0 (0.0%) | 0 (0.0%) |
| 75 Years and over | 0 (0.0%) | 0 (0.0%) |
Disability Class: Vision Difficulty
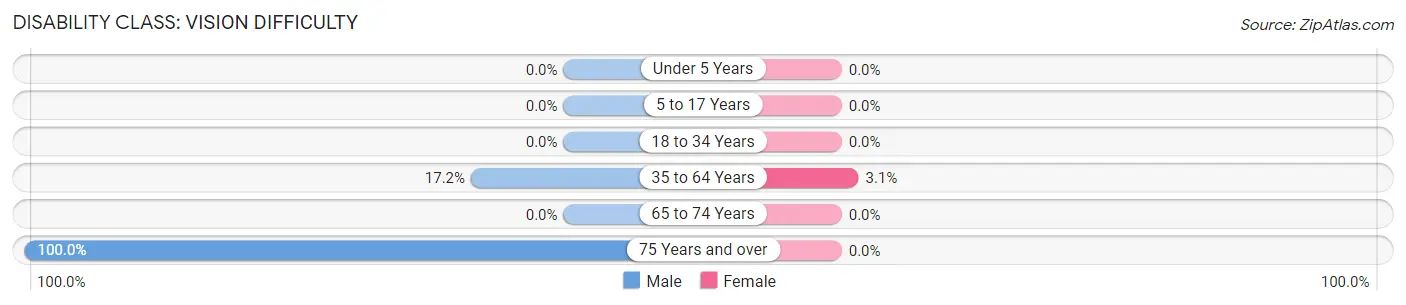
| Age Bracket | Male | Female |
| Under 5 Years | 0 (0.0%) | 0 (0.0%) |
| 5 to 17 Years | 0 (0.0%) | 0 (0.0%) |
| 18 to 34 Years | 0 (0.0%) | 0 (0.0%) |
| 35 to 64 Years | 17 (17.2%) | 4 (3.1%) |
| 65 to 74 Years | 0 (0.0%) | 0 (0.0%) |
| 75 Years and over | 1 (100.0%) | 0 (0.0%) |
Disability Class: Cognitive Difficulty
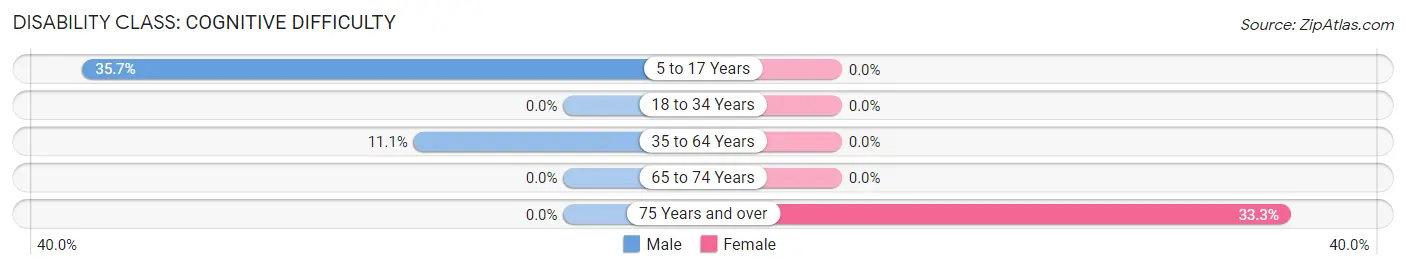
| Age Bracket | Male | Female |
| 5 to 17 Years | 5 (35.7%) | 0 (0.0%) |
| 18 to 34 Years | 0 (0.0%) | 0 (0.0%) |
| 35 to 64 Years | 11 (11.1%) | 0 (0.0%) |
| 65 to 74 Years | 0 (0.0%) | 0 (0.0%) |
| 75 Years and over | 0 (0.0%) | 2 (33.3%) |
Disability Class: Ambulatory Difficulty
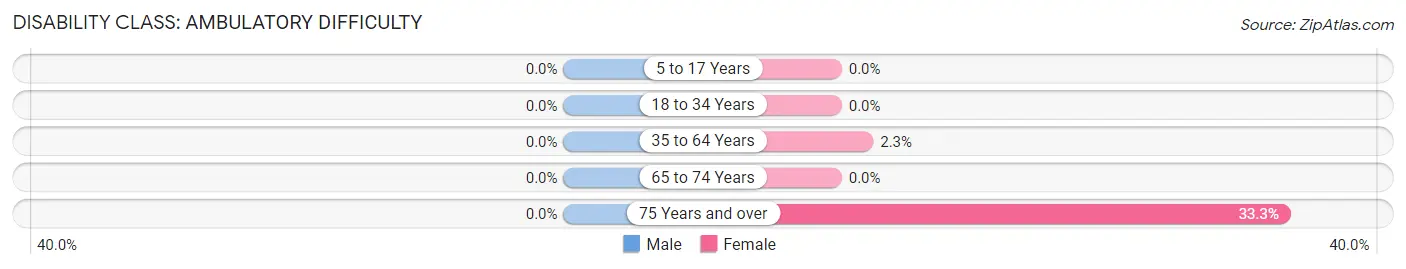
| Age Bracket | Male | Female |
| 5 to 17 Years | 0 (0.0%) | 0 (0.0%) |
| 18 to 34 Years | 0 (0.0%) | 0 (0.0%) |
| 35 to 64 Years | 0 (0.0%) | 3 (2.3%) |
| 65 to 74 Years | 0 (0.0%) | 0 (0.0%) |
| 75 Years and over | 0 (0.0%) | 2 (33.3%) |
Disability Class: Self-Care Difficulty
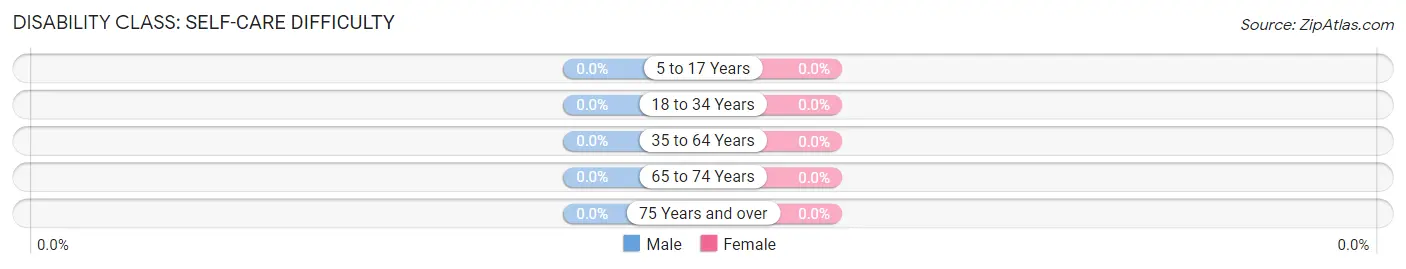
| Age Bracket | Male | Female |
| 5 to 17 Years | 0 (0.0%) | 0 (0.0%) |
| 18 to 34 Years | 0 (0.0%) | 0 (0.0%) |
| 35 to 64 Years | 0 (0.0%) | 0 (0.0%) |
| 65 to 74 Years | 0 (0.0%) | 0 (0.0%) |
| 75 Years and over | 0 (0.0%) | 0 (0.0%) |
Technology Access in Natchez
Computing Device Access in Natchez
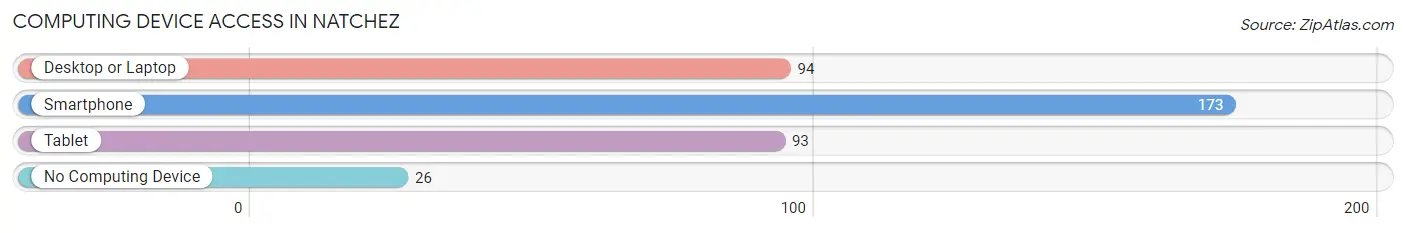
| Device Type | # Households | % Households |
| Desktop or Laptop | 94 | 47.2% |
| Smartphone | 173 | 86.9% |
| Tablet | 93 | 46.7% |
| No Computing Device | 26 | 13.1% |
| Total | 199 | 100.0% |
Internet Access in Natchez
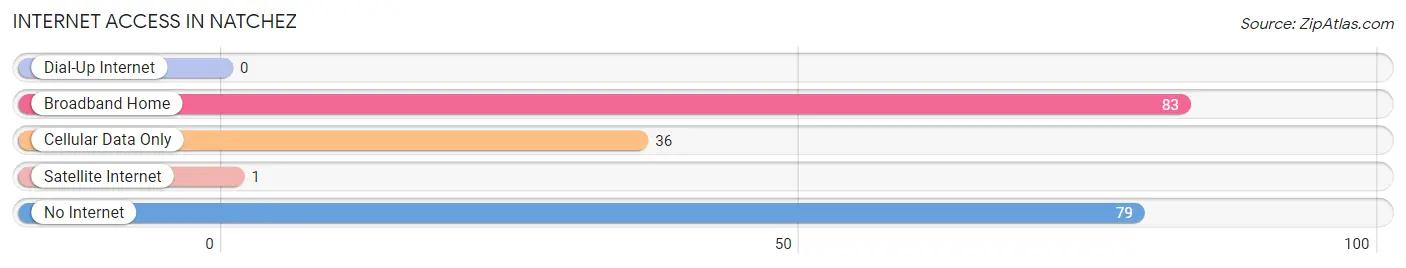
| Internet Type | # Households | % Households |
| Dial-Up Internet | 0 | 0.0% |
| Broadband Home | 83 | 41.7% |
| Cellular Data Only | 36 | 18.1% |
| Satellite Internet | 1 | 0.5% |
| No Internet | 79 | 39.7% |
| Total | 199 | 100.0% |
Natchez Summary
Natchez, Louisiana is a small city located in the southwestern corner of the state, near the Mississippi River. It is the county seat of Adams County and has a population of approximately 11,000 people. The city is known for its rich history, beautiful scenery, and vibrant economy.
History
Natchez was founded in 1716 by French settlers, who named it after the Natchez Native American tribe. The city was an important trading post for the French and Spanish, and it was the site of several battles during the American Revolution. During the 19th century, Natchez was a major port city and a center of the cotton trade. It was also the site of the Natchez Race Riot of 1835, which was one of the first race riots in the United States.
Geography
Natchez is located in the southwestern corner of Louisiana, near the Mississippi River. The city is situated on a bluff overlooking the river, and it is surrounded by rolling hills and forests. The climate is humid subtropical, with hot, humid summers and mild winters.
Economy
Natchez has a diverse economy, with a mix of manufacturing, tourism, and agriculture. The city is home to several manufacturing plants, including a paper mill and a chemical plant. Tourism is a major industry in Natchez, with visitors coming to see the city’s historic sites and enjoy its natural beauty. Agriculture is also important to the local economy, with cotton, soybeans, and corn being the main crops.
Demographics
As of the 2010 census, Natchez had a population of 11,077 people. The racial makeup of the city was 57.3% African American, 37.2% White, 1.2% Asian, 0.3% Native American, and 4.0% from other races. The median household income was $30,945, and the median age was 36.7 years.
Natchez is a small city with a rich history and a vibrant economy. It is home to a diverse population and offers visitors a unique blend of culture, history, and natural beauty. With its beautiful scenery and friendly people, Natchez is a great place to live and visit.
Common Questions
What is Per Capita Income in Natchez?
Per Capita income in Natchez is $21,829.
What is the Median Household income in Natchez?
Median Household Income in Natchez is $22,031.
What is Income or Wage Gap in Natchez?
Income or Wage Gap in Natchez is 57.8%.
Women in Natchez earn 42.2 cents for every dollar earned by a man.
What is Inequality or Gini Index in Natchez?
Inequality or Gini Index in Natchez is 0.46.
What is the Total Population of Natchez?
Total Population of Natchez is 304.
What is the Total Male Population of Natchez?
Total Male Population of Natchez is 166.
What is the Total Female Population of Natchez?
Total Female Population of Natchez is 138.
What is the Ratio of Males per 100 Females in Natchez?
There are 120.29 Males per 100 Females in Natchez.
What is the Ratio of Females per 100 Males in Natchez?
There are 83.13 Females per 100 Males in Natchez.
What is the Median Population Age in Natchez?
Median Population Age in Natchez is 59.3 Years.
What is the Average Family Size in Natchez
Average Family Size in Natchez is 2.1 People.
What is the Average Household Size in Natchez
Average Household Size in Natchez is 1.5 People.
How Large is the Labor Force in Natchez?
There are 159 People in the Labor Forcein in Natchez.
What is the Percentage of People in the Labor Force in Natchez?
54.1% of People are in the Labor Force in Natchez.
What is the Unemployment Rate in Natchez?
Unemployment Rate in Natchez is 4.4%.