Mooringsport, LA Map & Demographics
Mooringsport Map
Mooringsport Overview
$19,854
PER CAPITA INCOME
$58,750
AVG FAMILY INCOME
$19,461
AVG HOUSEHOLD INCOME
32.5%
WAGE / INCOME GAP [ % ]
67.5¢/ $1
WAGE / INCOME GAP [ $ ]
0.43
INEQUALITY / GINI INDEX
596
TOTAL POPULATION
237
MALE POPULATION
359
FEMALE POPULATION
66.02
MALES / 100 FEMALES
151.48
FEMALES / 100 MALES
49.4
MEDIAN AGE
3.5
AVG FAMILY SIZE
1.8
AVG HOUSEHOLD SIZE
185
LABOR FORCE [ PEOPLE ]
36.8%
PERCENT IN LABOR FORCE
8.6%
UNEMPLOYMENT RATE
Mooringsport Zip Codes
Mooringsport Area Codes
Income in Mooringsport
Income Overview in Mooringsport
Per Capita Income in Mooringsport is $19,854, while median incomes of families and households are $58,750 and $19,461 respectively.
| Characteristic | Number | Measure |
| Per Capita Income | 596 | $19,854 |
| Median Family Income | 93 | $58,750 |
| Mean Family Income | 93 | $61,331 |
| Median Household Income | 335 | $19,461 |
| Mean Household Income | 335 | $34,843 |
| Income Deficit | 93 | $0 |
| Wage / Income Gap (%) | 596 | 32.46% |
| Wage / Income Gap ($) | 596 | 67.54¢ per $1 |
| Gini / Inequality Index | 596 | 0.43 |
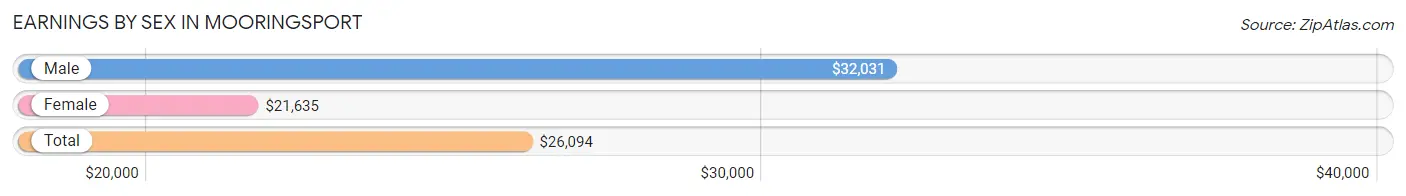
Earnings by Sex in Mooringsport
Average Earnings in Mooringsport are $26,094, $32,031 for men and $21,635 for women, a difference of 32.5%.
| Sex | Number | Average Earnings |
| Male | 101 (50.5%) | $32,031 |
| Female | 99 (49.5%) | $21,635 |
| Total | 200 (100.0%) | $26,094 |
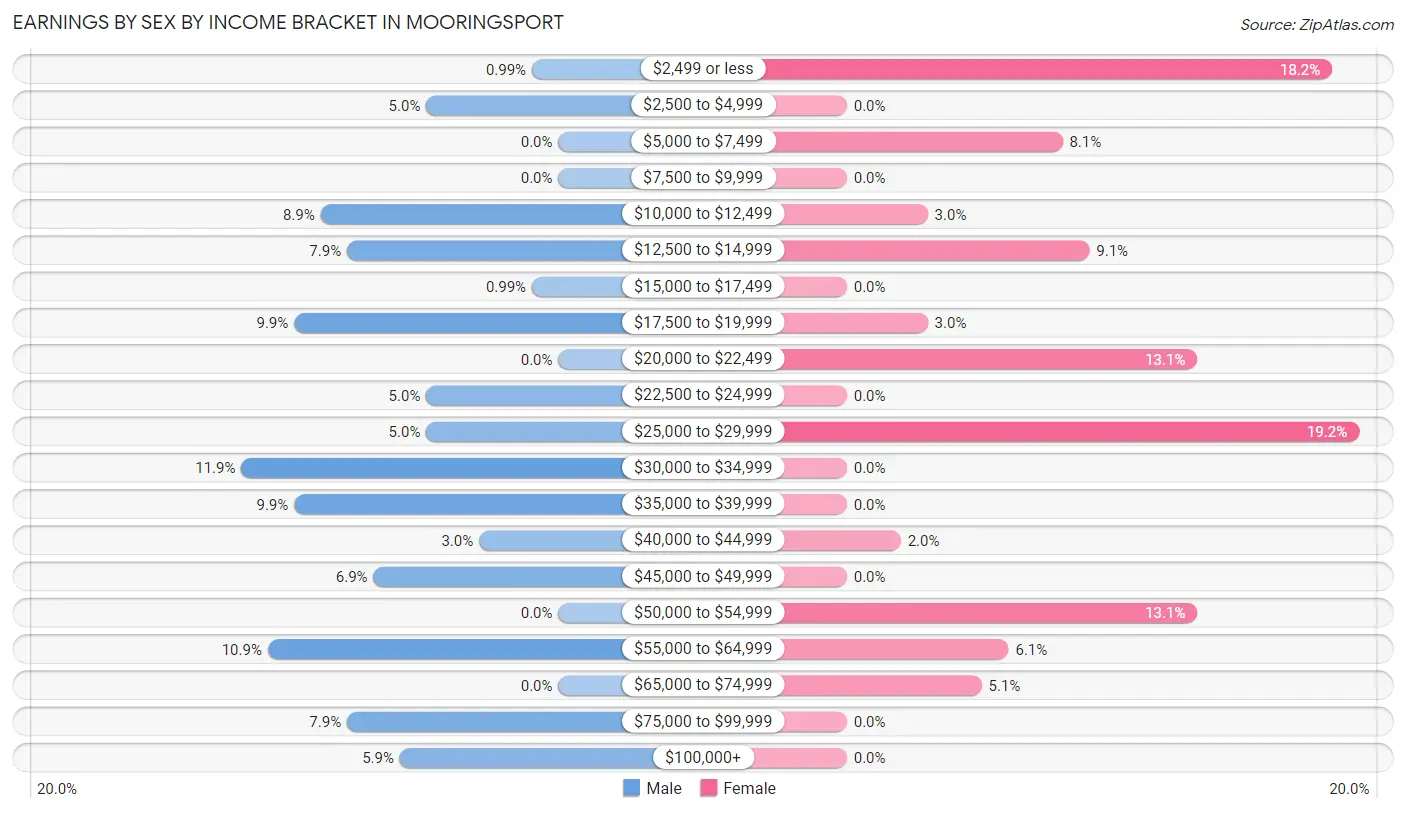
Earnings by Sex by Income Bracket in Mooringsport
The most common earnings brackets in Mooringsport are $30,000 to $34,999 for men (12 | 11.9%) and $25,000 to $29,999 for women (19 | 19.2%).
| Income | Male | Female |
| $2,499 or less | 1 (1.0%) | 18 (18.2%) |
| $2,500 to $4,999 | 5 (5.0%) | 0 (0.0%) |
| $5,000 to $7,499 | 0 (0.0%) | 8 (8.1%) |
| $7,500 to $9,999 | 0 (0.0%) | 0 (0.0%) |
| $10,000 to $12,499 | 9 (8.9%) | 3 (3.0%) |
| $12,500 to $14,999 | 8 (7.9%) | 9 (9.1%) |
| $15,000 to $17,499 | 1 (1.0%) | 0 (0.0%) |
| $17,500 to $19,999 | 10 (9.9%) | 3 (3.0%) |
| $20,000 to $22,499 | 0 (0.0%) | 13 (13.1%) |
| $22,500 to $24,999 | 5 (5.0%) | 0 (0.0%) |
| $25,000 to $29,999 | 5 (5.0%) | 19 (19.2%) |
| $30,000 to $34,999 | 12 (11.9%) | 0 (0.0%) |
| $35,000 to $39,999 | 10 (9.9%) | 0 (0.0%) |
| $40,000 to $44,999 | 3 (3.0%) | 2 (2.0%) |
| $45,000 to $49,999 | 7 (6.9%) | 0 (0.0%) |
| $50,000 to $54,999 | 0 (0.0%) | 13 (13.1%) |
| $55,000 to $64,999 | 11 (10.9%) | 6 (6.1%) |
| $65,000 to $74,999 | 0 (0.0%) | 5 (5.1%) |
| $75,000 to $99,999 | 8 (7.9%) | 0 (0.0%) |
| $100,000+ | 6 (5.9%) | 0 (0.0%) |
| Total | 101 (100.0%) | 99 (100.0%) |
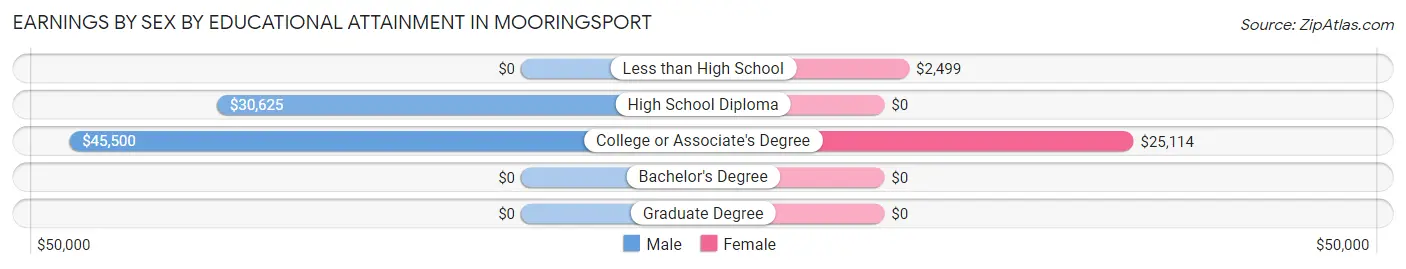
Earnings by Sex by Educational Attainment in Mooringsport
Average earnings in Mooringsport are $36,458 for men and $25,192 for women, a difference of 30.9%. Men with an educational attainment of college or associate's degree enjoy the highest average annual earnings of $45,500, while those with high school diploma education earn the least with $30,625. Women with an educational attainment of college or associate's degree earn the most with the average annual earnings of $25,114, while those with less than high school education have the smallest earnings of $2,499.
| Educational Attainment | Male Income | Female Income |
| Less than High School | - | - |
| High School Diploma | $30,625 | $0 |
| College or Associate's Degree | $45,500 | $25,114 |
| Bachelor's Degree | - | - |
| Graduate Degree | - | - |
| Total | $36,458 | $25,192 |
Family Income in Mooringsport
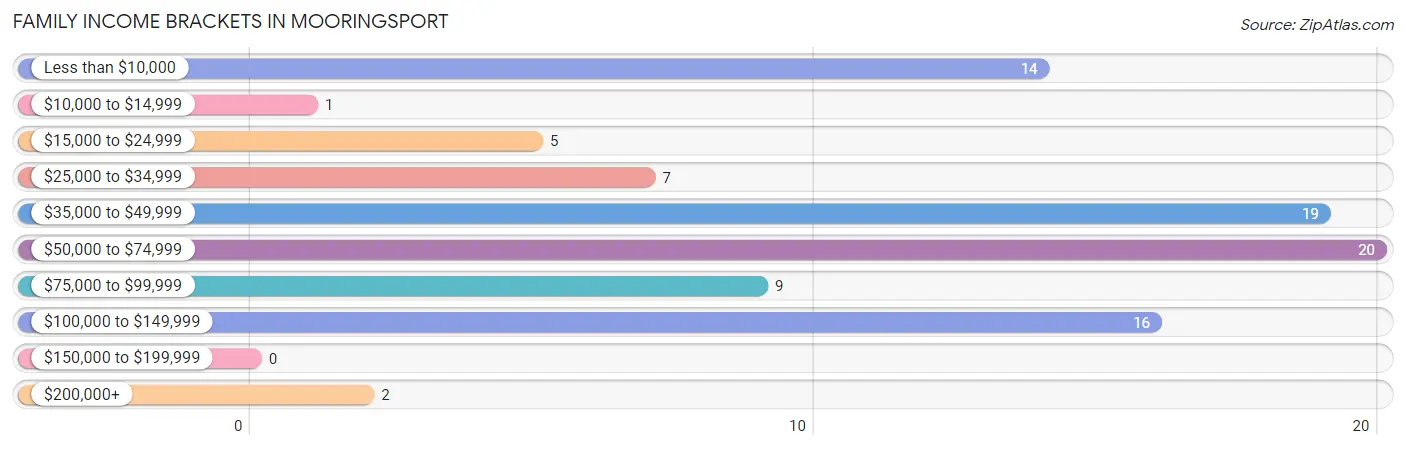
Family Income Brackets in Mooringsport
According to the Mooringsport family income data, there are 20 families falling into the $50,000 to $74,999 income range, which is the most common income bracket and makes up 21.5% of all families.
| Income Bracket | # Families | % Families |
| Less than $10,000 | 14 | 15.1% |
| $10,000 to $14,999 | 1 | 1.1% |
| $15,000 to $24,999 | 5 | 5.4% |
| $25,000 to $34,999 | 7 | 7.5% |
| $35,000 to $49,999 | 19 | 20.4% |
| $50,000 to $74,999 | 20 | 21.5% |
| $75,000 to $99,999 | 9 | 9.7% |
| $100,000 to $149,999 | 16 | 17.2% |
| $150,000 to $199,999 | 0 | 0.0% |
| $200,000+ | 2 | 2.2% |
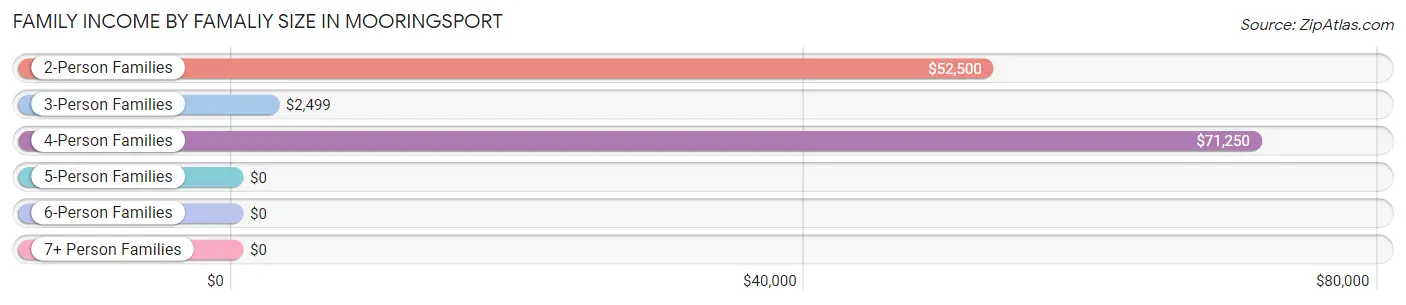
Family Income by Famaliy Size in Mooringsport
4-person families (28 | 30.1%) account for the highest median family income in Mooringsport with $71,250 per family, while 2-person families (50 | 53.8%) have the highest median income of $26,250 per family member.
| Income Bracket | # Families | Median Income |
| 2-Person Families | 50 (53.8%) | $52,500 |
| 3-Person Families | 7 (7.5%) | $2,499 |
| 4-Person Families | 28 (30.1%) | $71,250 |
| 5-Person Families | 2 (2.1%) | $0 |
| 6-Person Families | 2 (2.1%) | $0 |
| 7+ Person Families | 4 (4.3%) | $0 |
| Total | 93 (100.0%) | $58,750 |
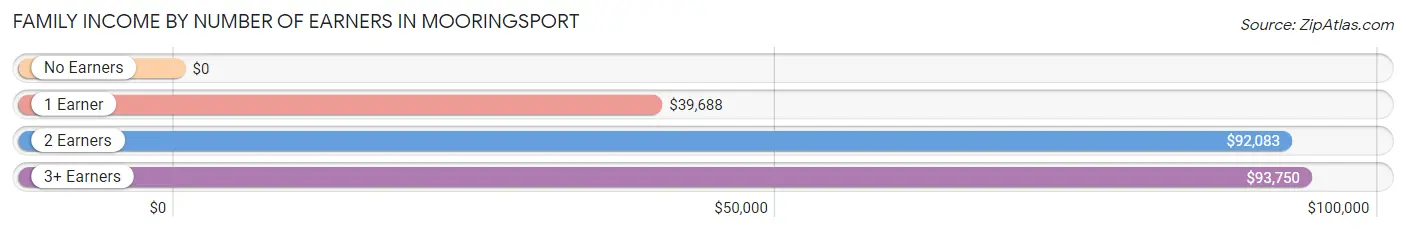
Family Income by Number of Earners in Mooringsport
| Number of Earners | # Families | Median Income |
| No Earners | 15 (16.1%) | $0 |
| 1 Earner | 47 (50.5%) | $39,688 |
| 2 Earners | 23 (24.7%) | $92,083 |
| 3+ Earners | 8 (8.6%) | $93,750 |
| Total | 93 (100.0%) | $58,750 |
Household Income in Mooringsport
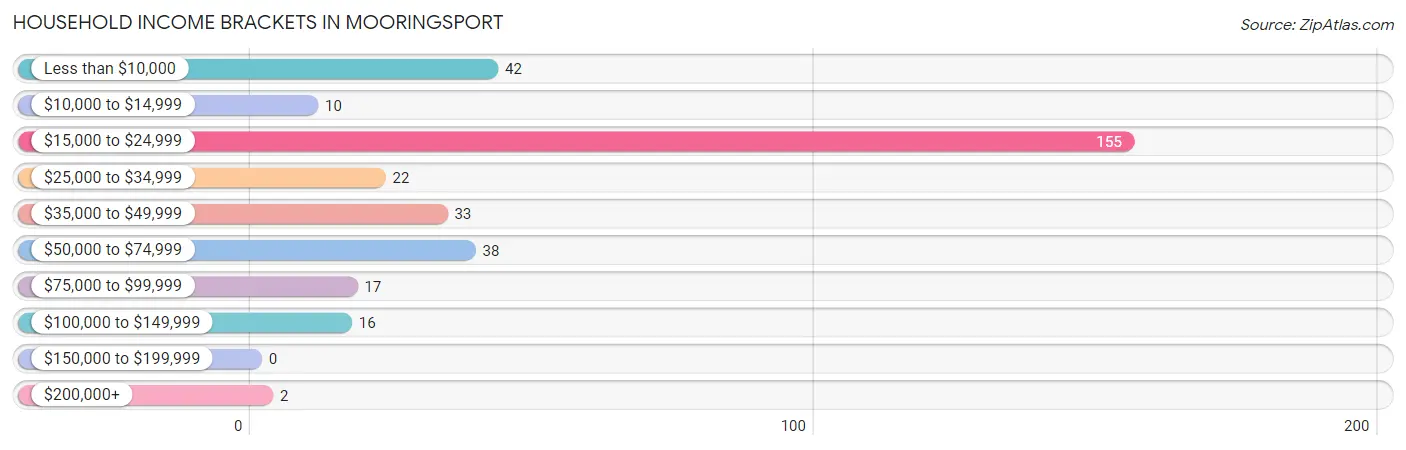
Household Income Brackets in Mooringsport
With 155 households falling in the category, the $15,000 to $24,999 income range is the most frequent in Mooringsport, accounting for 46.3% of all households.
| Income Bracket | # Households | % Households |
| Less than $10,000 | 42 | 12.5% |
| $10,000 to $14,999 | 10 | 3.0% |
| $15,000 to $24,999 | 155 | 46.3% |
| $25,000 to $34,999 | 22 | 6.6% |
| $35,000 to $49,999 | 33 | 9.9% |
| $50,000 to $74,999 | 38 | 11.3% |
| $75,000 to $99,999 | 17 | 5.1% |
| $100,000 to $149,999 | 16 | 4.8% |
| $150,000 to $199,999 | 0 | 0.0% |
| $200,000+ | 2 | 0.6% |
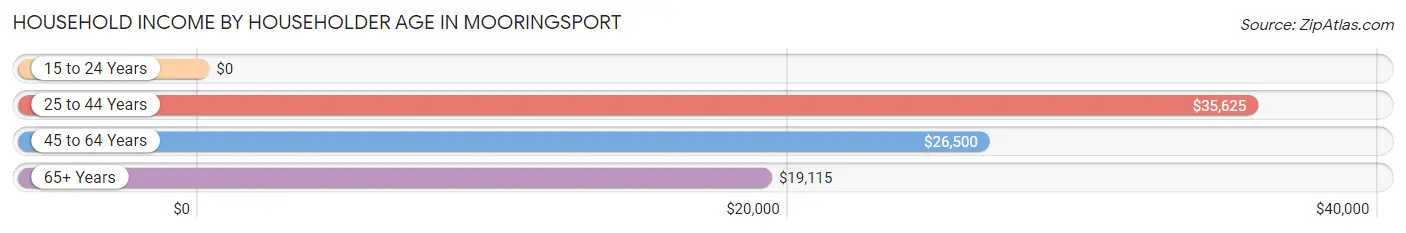
Household Income by Householder Age in Mooringsport
The median household income in Mooringsport is $19,461, with the highest median household income of $35,625 found in the 25 to 44 years age bracket for the primary householder. A total of 67 households (20.0%) fall into this category. Meanwhile, the 15 to 24 years age bracket for the primary householder has the lowest median household income of $0, with 9 households (2.7%) in this group.
| Income Bracket | # Households | Median Income |
| 15 to 24 Years | 9 (2.7%) | $0 |
| 25 to 44 Years | 67 (20.0%) | $35,625 |
| 45 to 64 Years | 78 (23.3%) | $26,500 |
| 65+ Years | 181 (54.0%) | $19,115 |
| Total | 335 (100.0%) | $19,461 |
Poverty in Mooringsport
Income Below Poverty by Sex and Age in Mooringsport
With 35.0% poverty level for males and 24.5% for females among the residents of Mooringsport, 6 to 11 year old males and 12 to 14 year old females are the most vulnerable to poverty, with 7 males (100.0%) and 6 females (100.0%) in their respective age groups living below the poverty level.
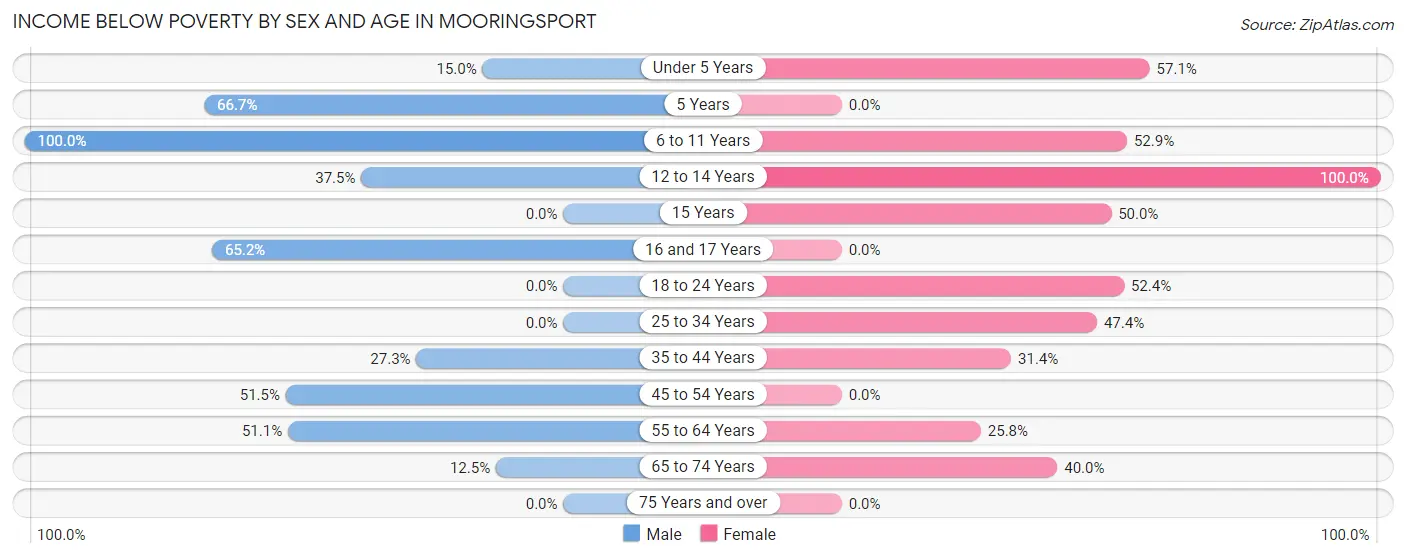
| Age Bracket | Male | Female |
| Under 5 Years | 3 (15.0%) | 8 (57.1%) |
| 5 Years | 4 (66.7%) | 0 (0.0%) |
| 6 to 11 Years | 7 (100.0%) | 9 (52.9%) |
| 12 to 14 Years | 6 (37.5%) | 6 (100.0%) |
| 15 Years | 0 (0.0%) | 3 (50.0%) |
| 16 and 17 Years | 15 (65.2%) | 0 (0.0%) |
| 18 to 24 Years | 0 (0.0%) | 11 (52.4%) |
| 25 to 34 Years | 0 (0.0%) | 18 (47.4%) |
| 35 to 44 Years | 6 (27.3%) | 11 (31.4%) |
| 45 to 54 Years | 17 (51.5%) | 0 (0.0%) |
| 55 to 64 Years | 23 (51.1%) | 8 (25.8%) |
| 65 to 74 Years | 2 (12.5%) | 14 (40.0%) |
| 75 Years and over | 0 (0.0%) | 0 (0.0%) |
| Total | 83 (35.0%) | 88 (24.5%) |
Income Above Poverty by Sex and Age in Mooringsport
According to the poverty statistics in Mooringsport, males aged 15 years and females aged 45 to 54 years are the age groups that are most secure financially, with 100.0% of males and 100.0% of females in these age groups living above the poverty line.
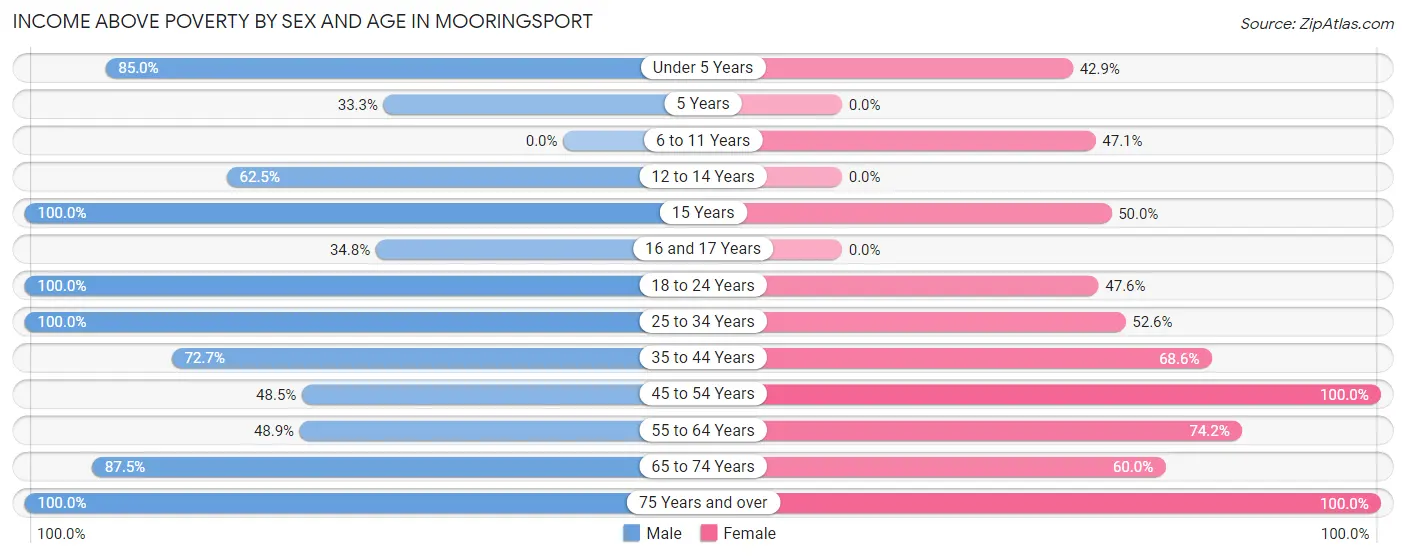
| Age Bracket | Male | Female |
| Under 5 Years | 17 (85.0%) | 6 (42.9%) |
| 5 Years | 2 (33.3%) | 0 (0.0%) |
| 6 to 11 Years | 0 (0.0%) | 8 (47.1%) |
| 12 to 14 Years | 10 (62.5%) | 0 (0.0%) |
| 15 Years | 1 (100.0%) | 3 (50.0%) |
| 16 and 17 Years | 8 (34.8%) | 0 (0.0%) |
| 18 to 24 Years | 22 (100.0%) | 10 (47.6%) |
| 25 to 34 Years | 24 (100.0%) | 20 (52.6%) |
| 35 to 44 Years | 16 (72.7%) | 24 (68.6%) |
| 45 to 54 Years | 16 (48.5%) | 10 (100.0%) |
| 55 to 64 Years | 22 (48.9%) | 23 (74.2%) |
| 65 to 74 Years | 14 (87.5%) | 21 (60.0%) |
| 75 Years and over | 2 (100.0%) | 146 (100.0%) |
| Total | 154 (65.0%) | 271 (75.5%) |
Income Below Poverty Among Married-Couple Families in Mooringsport
The poverty statistics for married-couple families in Mooringsport show that 18.6% or 8 of the total 43 families live below the poverty line. Families with 3 or 4 children have the highest poverty rate of 100.0%, comprising of 2 families. On the other hand, families with 1 or 2 children have the lowest poverty rate of 0.0%, which includes 0 families.
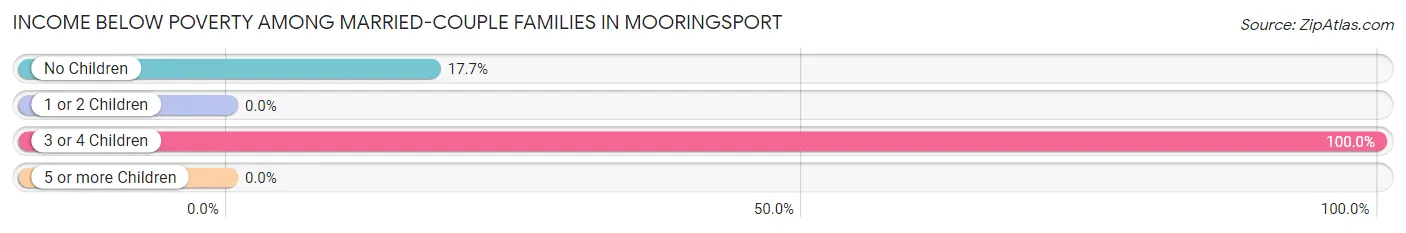
| Children | Above Poverty | Below Poverty |
| No Children | 28 (82.4%) | 6 (17.6%) |
| 1 or 2 Children | 7 (100.0%) | 0 (0.0%) |
| 3 or 4 Children | 0 (0.0%) | 2 (100.0%) |
| 5 or more Children | 0 (0.0%) | 0 (0.0%) |
| Total | 35 (81.4%) | 8 (18.6%) |
Income Below Poverty Among Single-Parent Households in Mooringsport
According to the poverty data in Mooringsport, 14.3% or 2 single-father households and 44.4% or 16 single-mother households are living below the poverty line. Among single-father households, those with 1 or 2 children have the highest poverty rate, with 2 households (25.0%) experiencing poverty. Likewise, among single-mother households, those with 3 or 4 children have the highest poverty rate, with 7 households (100.0%) falling below the poverty line.
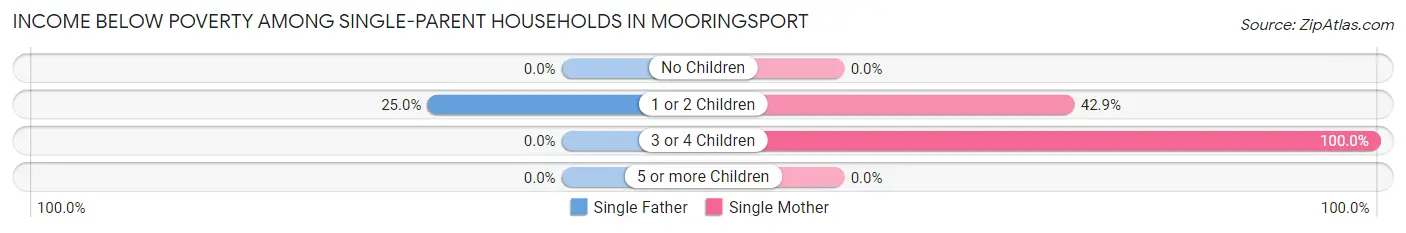
| Children | Single Father | Single Mother |
| No Children | 0 (0.0%) | 0 (0.0%) |
| 1 or 2 Children | 2 (25.0%) | 9 (42.9%) |
| 3 or 4 Children | 0 (0.0%) | 7 (100.0%) |
| 5 or more Children | 0 (0.0%) | 0 (0.0%) |
| Total | 2 (14.3%) | 16 (44.4%) |
Income Below Poverty Among Married-Couple vs Single-Parent Households in Mooringsport
The poverty data for Mooringsport shows that 8 of the married-couple family households (18.6%) and 18 of the single-parent households (36.0%) are living below the poverty level. Within the married-couple family households, those with 3 or 4 children have the highest poverty rate, with 2 households (100.0%) falling below the poverty line. Among the single-parent households, those with 3 or 4 children have the highest poverty rate, with 7 household (63.6%) living below poverty.
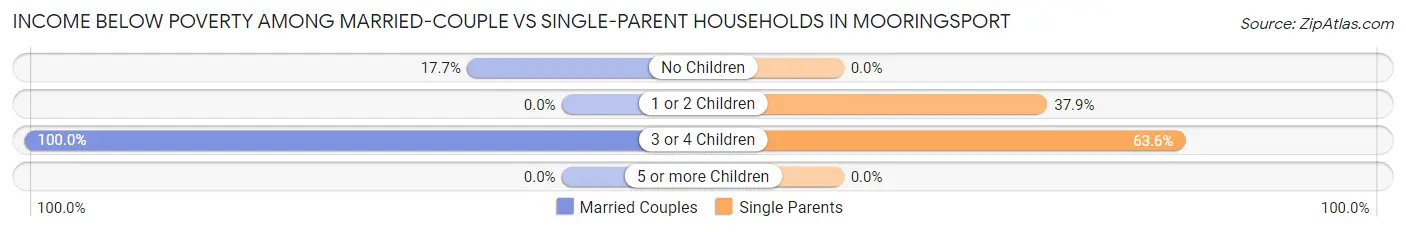
| Children | Married-Couple Families | Single-Parent Households |
| No Children | 6 (17.6%) | 0 (0.0%) |
| 1 or 2 Children | 0 (0.0%) | 11 (37.9%) |
| 3 or 4 Children | 2 (100.0%) | 7 (63.6%) |
| 5 or more Children | 0 (0.0%) | 0 (0.0%) |
| Total | 8 (18.6%) | 18 (36.0%) |
Race in Mooringsport
The most populous races in Mooringsport are White / Caucasian (362 | 60.7%), Black / African American (189 | 31.7%), and Two or more Races (34 | 5.7%).
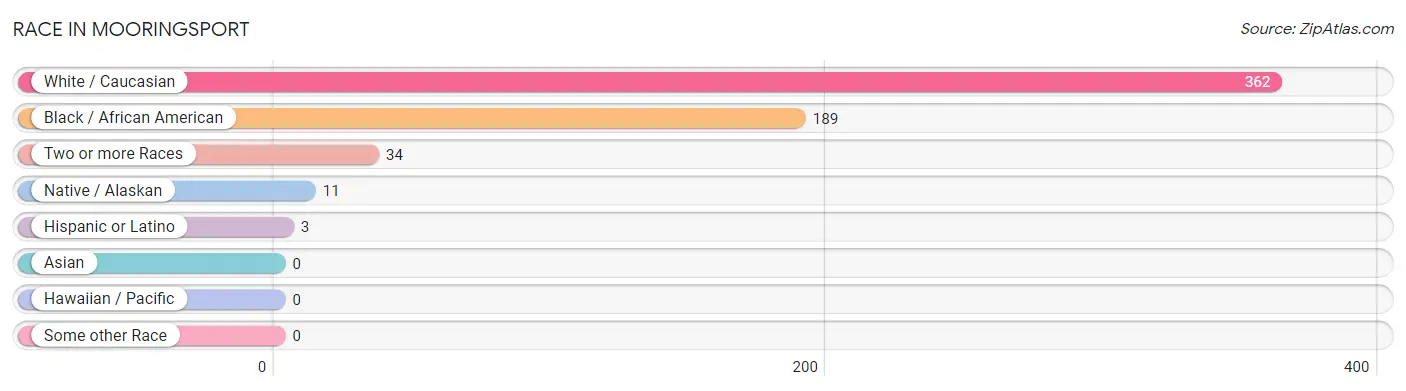
| Race | # Population | % Population |
| Asian | 0 | 0.0% |
| Black / African American | 189 | 31.7% |
| Hawaiian / Pacific | 0 | 0.0% |
| Hispanic or Latino | 3 | 0.5% |
| Native / Alaskan | 11 | 1.8% |
| White / Caucasian | 362 | 60.7% |
| Two or more Races | 34 | 5.7% |
| Some other Race | 0 | 0.0% |
| Total | 596 | 100.0% |
Ancestry in Mooringsport
The most populous ancestries reported in Mooringsport are American (66 | 11.1%), Irish (41 | 6.9%), French (39 | 6.5%), Cherokee (27 | 4.5%), and Italian (27 | 4.5%), together accounting for 33.6% of all Mooringsport residents.
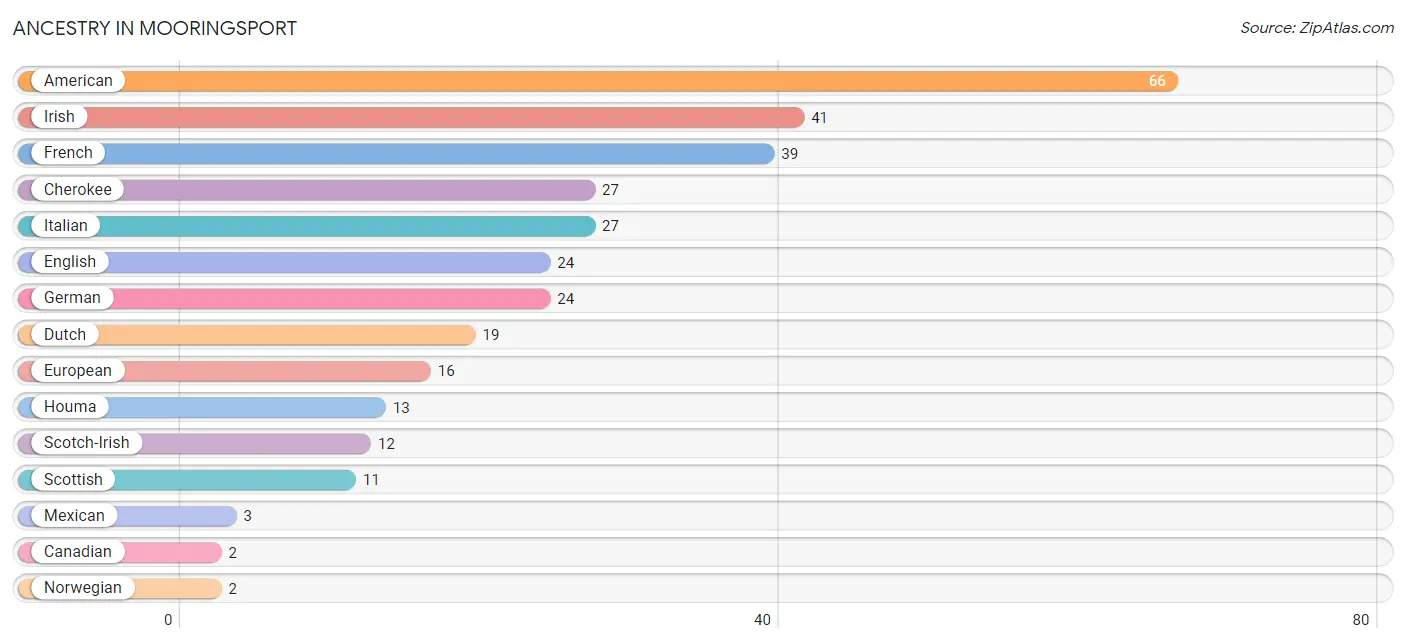
| Ancestry | # Population | % Population |
| American | 66 | 11.1% |
| Canadian | 2 | 0.3% |
| Cherokee | 27 | 4.5% |
| Dutch | 19 | 3.2% |
| English | 24 | 4.0% |
| European | 16 | 2.7% |
| French | 39 | 6.5% |
| German | 24 | 4.0% |
| Houma | 13 | 2.2% |
| Irish | 41 | 6.9% |
| Italian | 27 | 4.5% |
| Mexican | 3 | 0.5% |
| Norwegian | 2 | 0.3% |
| Polish | 1 | 0.2% |
| Russian | 2 | 0.3% |
| Scotch-Irish | 12 | 2.0% |
| Scottish | 11 | 1.8% |
| Swedish | 1 | 0.2% | View All 18 Rows |
Immigrants in Mooringsport

| Immigration Origin | # Population | % Population | View All 0 Rows |
Sex and Age in Mooringsport
Sex and Age in Mooringsport
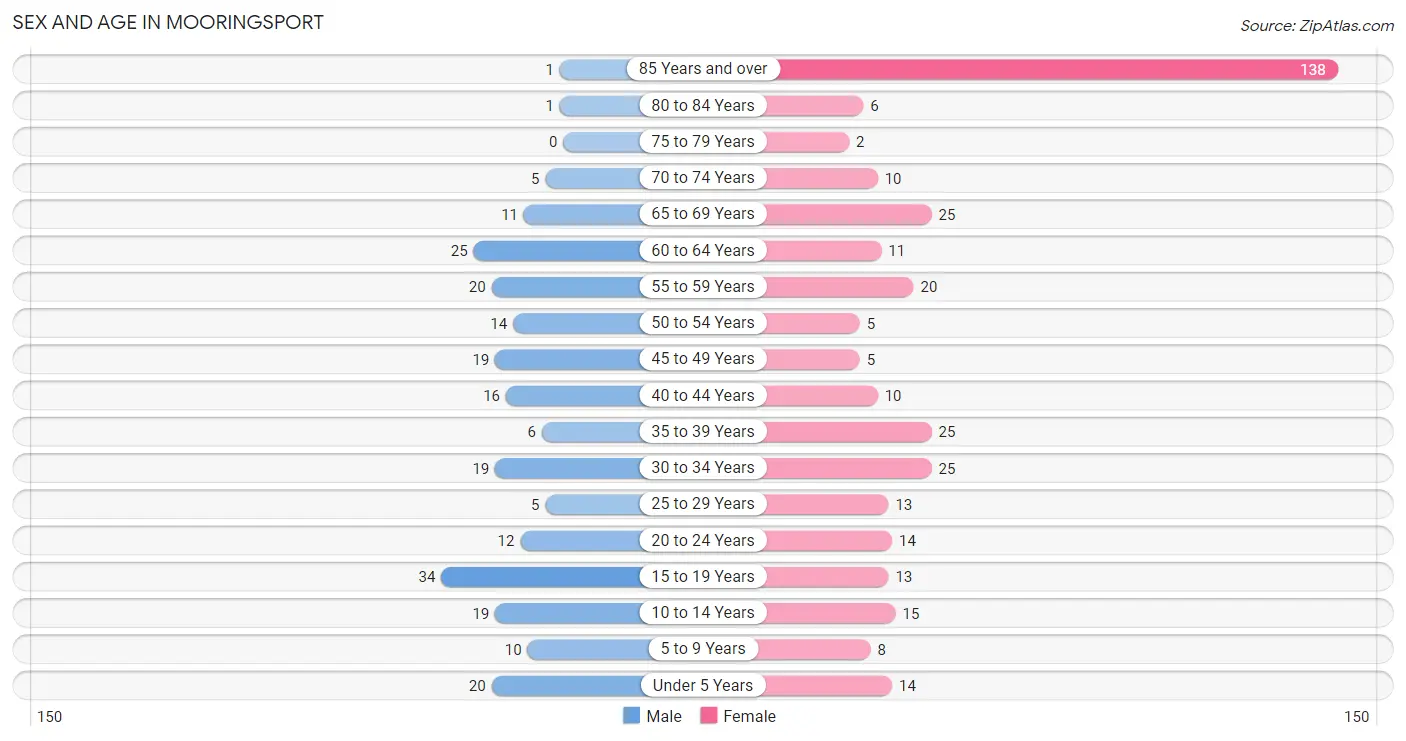
The most populous age groups in Mooringsport are 15 to 19 Years (34 | 14.3%) for men and 85 Years and over (138 | 38.4%) for women.
| Age Bracket | Male | Female |
| Under 5 Years | 20 (8.4%) | 14 (3.9%) |
| 5 to 9 Years | 10 (4.2%) | 8 (2.2%) |
| 10 to 14 Years | 19 (8.0%) | 15 (4.2%) |
| 15 to 19 Years | 34 (14.3%) | 13 (3.6%) |
| 20 to 24 Years | 12 (5.1%) | 14 (3.9%) |
| 25 to 29 Years | 5 (2.1%) | 13 (3.6%) |
| 30 to 34 Years | 19 (8.0%) | 25 (7.0%) |
| 35 to 39 Years | 6 (2.5%) | 25 (7.0%) |
| 40 to 44 Years | 16 (6.8%) | 10 (2.8%) |
| 45 to 49 Years | 19 (8.0%) | 5 (1.4%) |
| 50 to 54 Years | 14 (5.9%) | 5 (1.4%) |
| 55 to 59 Years | 20 (8.4%) | 20 (5.6%) |
| 60 to 64 Years | 25 (10.5%) | 11 (3.1%) |
| 65 to 69 Years | 11 (4.6%) | 25 (7.0%) |
| 70 to 74 Years | 5 (2.1%) | 10 (2.8%) |
| 75 to 79 Years | 0 (0.0%) | 2 (0.6%) |
| 80 to 84 Years | 1 (0.4%) | 6 (1.7%) |
| 85 Years and over | 1 (0.4%) | 138 (38.4%) |
| Total | 237 (100.0%) | 359 (100.0%) |
Families and Households in Mooringsport
Median Family Size in Mooringsport
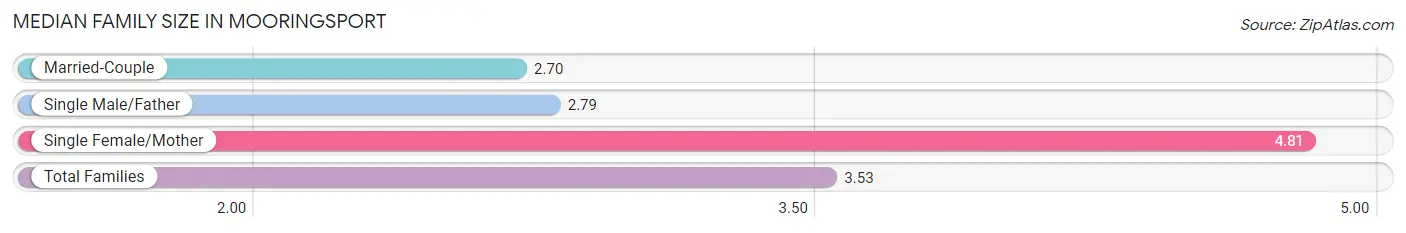
The median family size in Mooringsport is 3.53 persons per family, with single female/mother families (36 | 38.7%) accounting for the largest median family size of 4.81 persons per family. On the other hand, married-couple families (43 | 46.2%) represent the smallest median family size with 2.70 persons per family.
| Family Type | # Families | Family Size |
| Married-Couple | 43 (46.2%) | 2.70 |
| Single Male/Father | 14 (15.0%) | 2.79 |
| Single Female/Mother | 36 (38.7%) | 4.81 |
| Total Families | 93 (100.0%) | 3.53 |
Median Household Size in Mooringsport
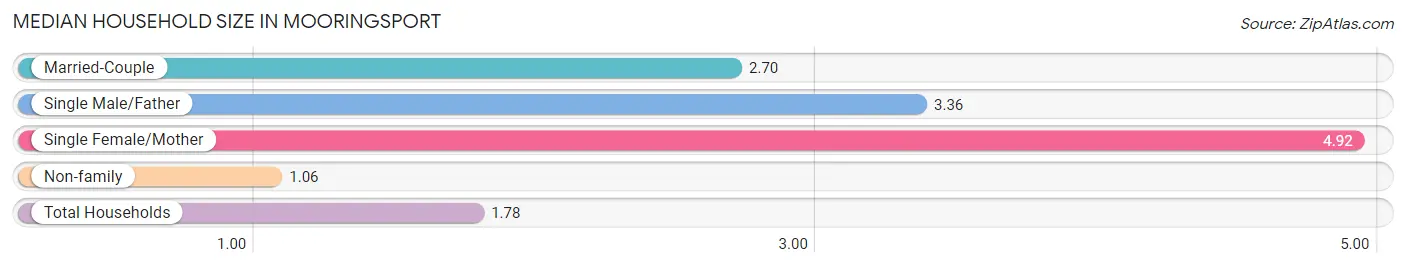
The median household size in Mooringsport is 1.78 persons per household, with single female/mother households (36 | 10.7%) accounting for the largest median household size of 4.92 persons per household. non-family households (242 | 72.2%) represent the smallest median household size with 1.06 persons per household.
| Household Type | # Households | Household Size |
| Married-Couple | 43 (12.8%) | 2.70 |
| Single Male/Father | 14 (4.2%) | 3.36 |
| Single Female/Mother | 36 (10.7%) | 4.92 |
| Non-family | 242 (72.2%) | 1.06 |
| Total Households | 335 (100.0%) | 1.78 |
Household Size by Marriage Status in Mooringsport
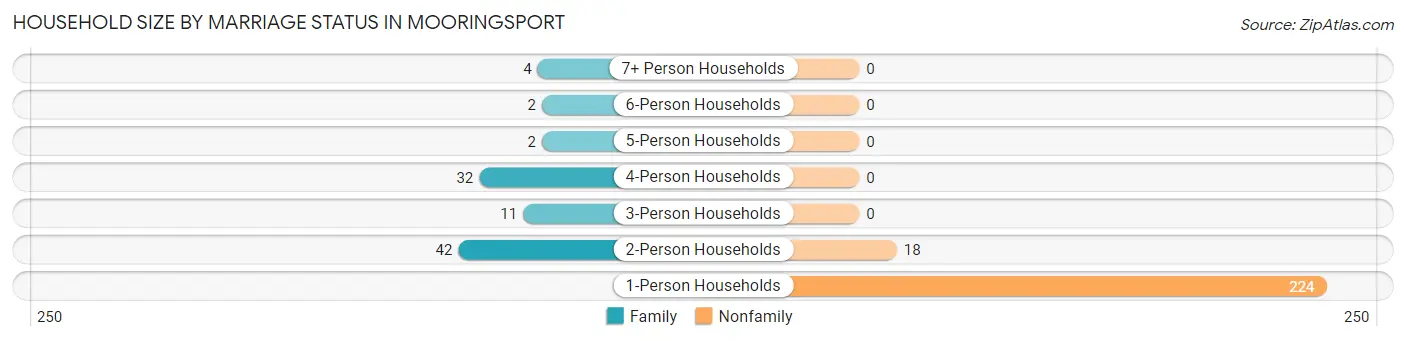
Out of a total of 335 households in Mooringsport, 93 (27.8%) are family households, while 242 (72.2%) are nonfamily households. The most numerous type of family households are 2-person households, comprising 42, and the most common type of nonfamily households are 1-person households, comprising 224.
| Household Size | Family Households | Nonfamily Households |
| 1-Person Households | - | 224 (66.9%) |
| 2-Person Households | 42 (12.5%) | 18 (5.4%) |
| 3-Person Households | 11 (3.3%) | 0 (0.0%) |
| 4-Person Households | 32 (9.6%) | 0 (0.0%) |
| 5-Person Households | 2 (0.6%) | 0 (0.0%) |
| 6-Person Households | 2 (0.6%) | 0 (0.0%) |
| 7+ Person Households | 4 (1.2%) | 0 (0.0%) |
| Total | 93 (27.8%) | 242 (72.2%) |
Female Fertility in Mooringsport
Fertility by Age in Mooringsport
Average fertility rate in Mooringsport is 57.0 births per 1,000 women. Women in the age bracket of 20 to 34 years have the highest fertility rate with 115.0 births per 1,000 women. Women in the age bracket of 20 to 34 years acount for 100.0% of all women with births.
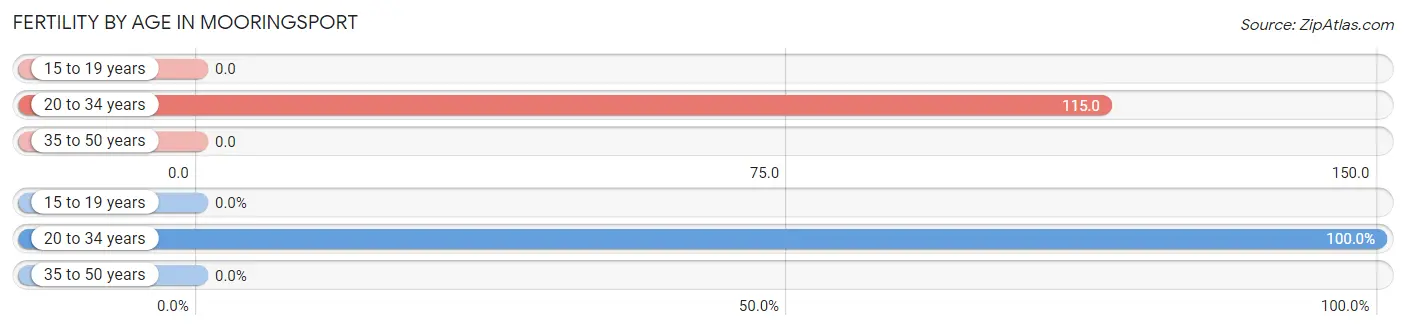
| Age Bracket | Women with Births | Births / 1,000 Women |
| 15 to 19 years | 0 (0.0%) | 0.0 |
| 20 to 34 years | 6 (100.0%) | 115.0 |
| 35 to 50 years | 0 (0.0%) | 0.0 |
| Total | 6 (100.0%) | 57.0 |
Fertility by Age by Marriage Status in Mooringsport
50.0% of women with births (6) in Mooringsport are married. The highest percentage of unmarried women with births falls into 20 to 34 years age bracket with 50.0% of them unmarried at the time of birth, while the lowest percentage of unmarried women with births belong to 20 to 34 years age bracket with 50.0% of them unmarried.
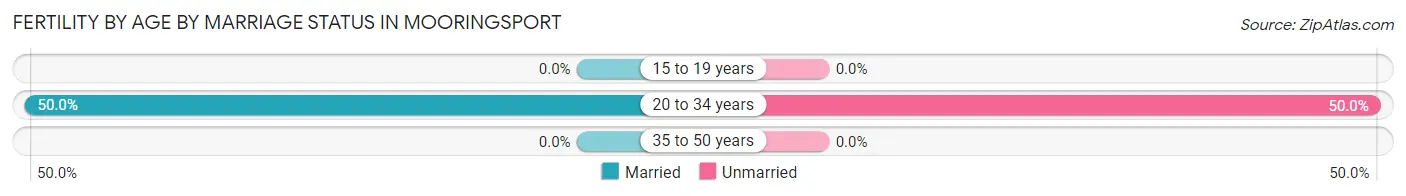
| Age Bracket | Married | Unmarried |
| 15 to 19 years | 0 (0.0%) | 0 (0.0%) |
| 20 to 34 years | 3 (50.0%) | 3 (50.0%) |
| 35 to 50 years | 0 (0.0%) | 0 (0.0%) |
| Total | 3 (50.0%) | 3 (50.0%) |
Fertility by Education in Mooringsport
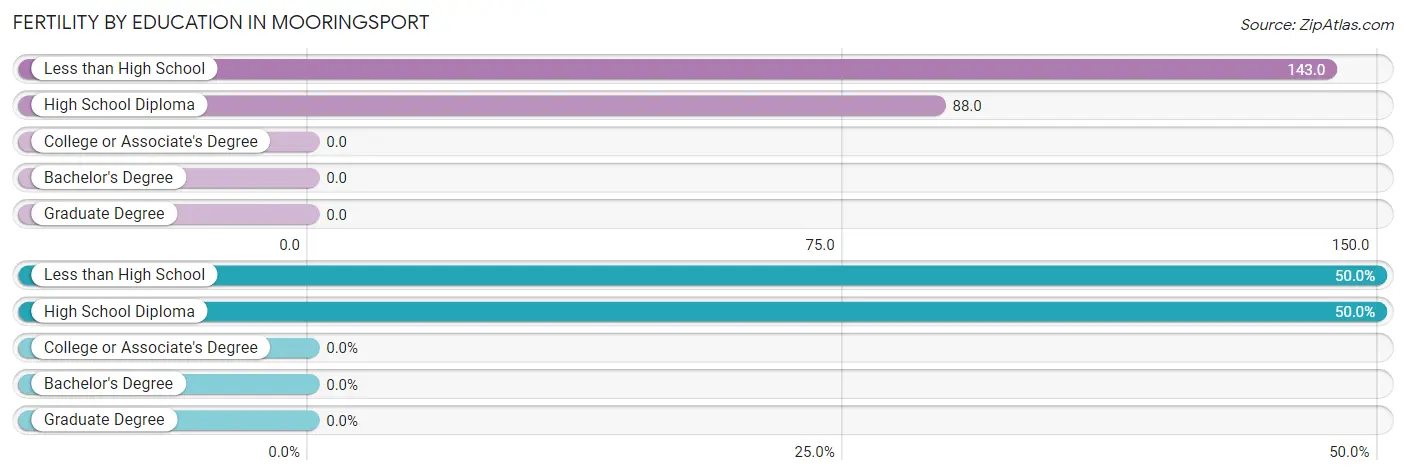
| Educational Attainment | Women with Births | Births / 1,000 Women |
| Less than High School | 3 (50.0%) | 143.0 |
| High School Diploma | 3 (50.0%) | 88.0 |
| College or Associate's Degree | 0 (0.0%) | 0.0 |
| Bachelor's Degree | 0 (0.0%) | 0.0 |
| Graduate Degree | 0 (0.0%) | 0.0 |
| Total | 6 (100.0%) | 57.0 |
Fertility by Education by Marriage Status in Mooringsport
50.0% of women with births in Mooringsport are unmarried. Women with the educational attainment of high school diploma are most likely to be married with 100.0% of them married at childbirth, while women with the educational attainment of less than high school are least likely to be married with 100.0% of them unmarried at childbirth.
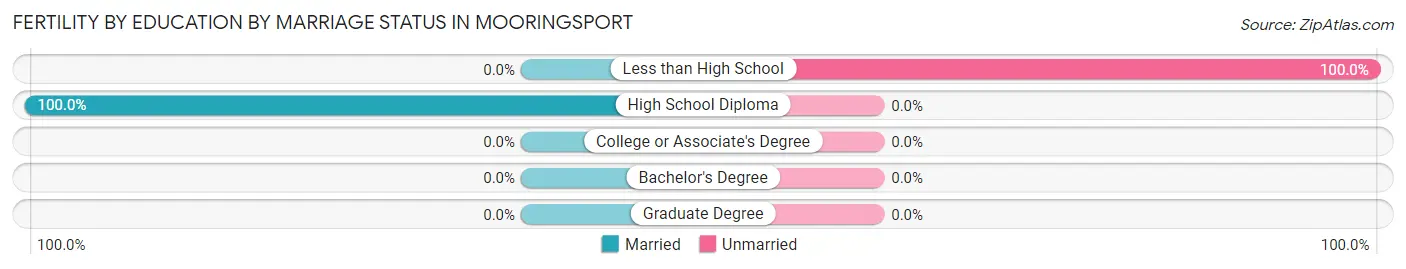
| Educational Attainment | Married | Unmarried |
| Less than High School | 0 (0.0%) | 3 (100.0%) |
| High School Diploma | 3 (100.0%) | 0 (0.0%) |
| College or Associate's Degree | 0 (0.0%) | 0 (0.0%) |
| Bachelor's Degree | 0 (0.0%) | 0 (0.0%) |
| Graduate Degree | 0 (0.0%) | 0 (0.0%) |
| Total | 3 (50.0%) | 3 (50.0%) |
Employment Characteristics in Mooringsport
Employment by Class of Employer in Mooringsport
Among the 158 employed individuals in Mooringsport, private company employees (111 | 70.3%), state government employees (17 | 10.8%), and local government employees (12 | 7.6%) make up the most common classes of employment.
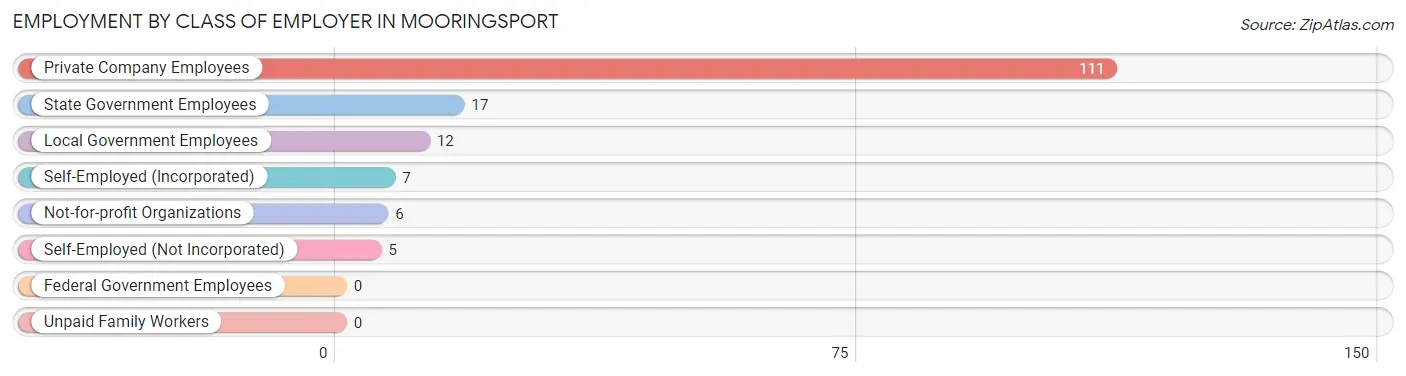
| Employer Class | # Employees | % Employees |
| Private Company Employees | 111 | 70.3% |
| Self-Employed (Incorporated) | 7 | 4.4% |
| Self-Employed (Not Incorporated) | 5 | 3.2% |
| Not-for-profit Organizations | 6 | 3.8% |
| Local Government Employees | 12 | 7.6% |
| State Government Employees | 17 | 10.8% |
| Federal Government Employees | 0 | 0.0% |
| Unpaid Family Workers | 0 | 0.0% |
| Total | 158 | 100.0% |
Employment Status by Age in Mooringsport
According to the labor force statistics for Mooringsport, out of the total population over 16 years of age (503), 36.8% or 185 individuals are in the labor force, with 8.6% or 16 of them unemployed. The age group with the highest labor force participation rate is 25 to 29 years, with 100.0% or 18 individuals in the labor force. Within the labor force, the 20 to 24 years age range has the highest percentage of unemployed individuals, with 30.8% or 4 of them being unemployed.
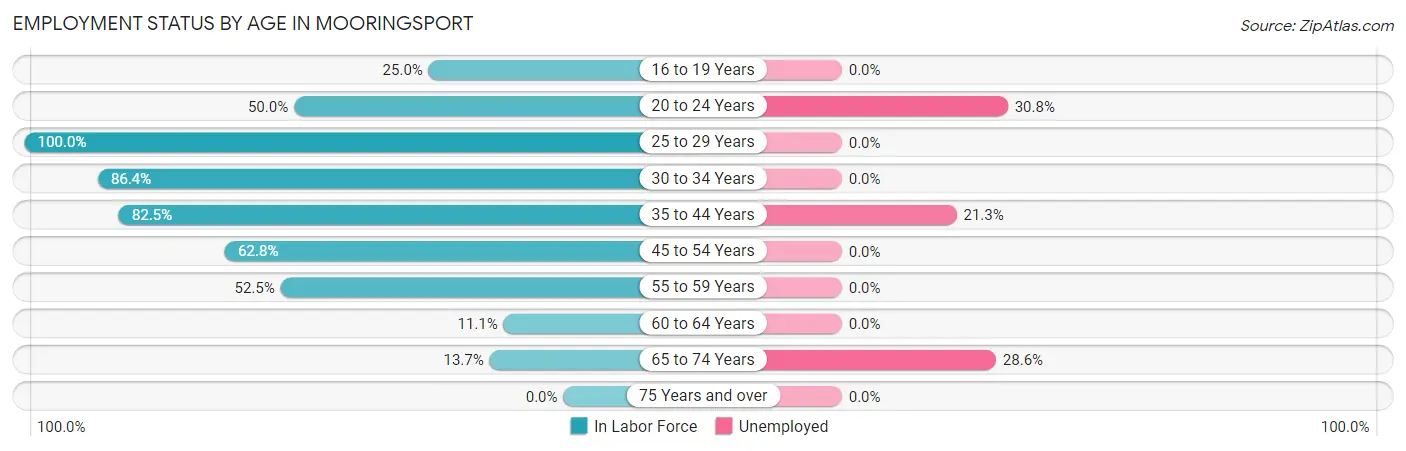
| Age Bracket | In Labor Force | Unemployed |
| 16 to 19 Years | 10 (25.0%) | 0 (0.0%) |
| 20 to 24 Years | 13 (50.0%) | 4 (30.8%) |
| 25 to 29 Years | 18 (100.0%) | 0 (0.0%) |
| 30 to 34 Years | 38 (86.4%) | 0 (0.0%) |
| 35 to 44 Years | 47 (82.5%) | 10 (21.3%) |
| 45 to 54 Years | 27 (62.8%) | 0 (0.0%) |
| 55 to 59 Years | 21 (52.5%) | 0 (0.0%) |
| 60 to 64 Years | 4 (11.1%) | 0 (0.0%) |
| 65 to 74 Years | 7 (13.7%) | 2 (28.6%) |
| 75 Years and over | 0 (0.0%) | 0 (0.0%) |
| Total | 185 (36.8%) | 16 (8.6%) |
Employment Status by Educational Attainment in Mooringsport
According to labor force statistics for Mooringsport, 65.1% of individuals (155) out of the total population between 25 and 64 years of age (238) are in the labor force, with 6.5% or 10 of them being unemployed. The group with the highest labor force participation rate are those with the educational attainment of bachelor's degree or higher, with 100.0% or 20 individuals in the labor force. Within the labor force, individuals with bachelor's degree or higher education have the highest percentage of unemployment, with 40.0% or 8 of them being unemployed.
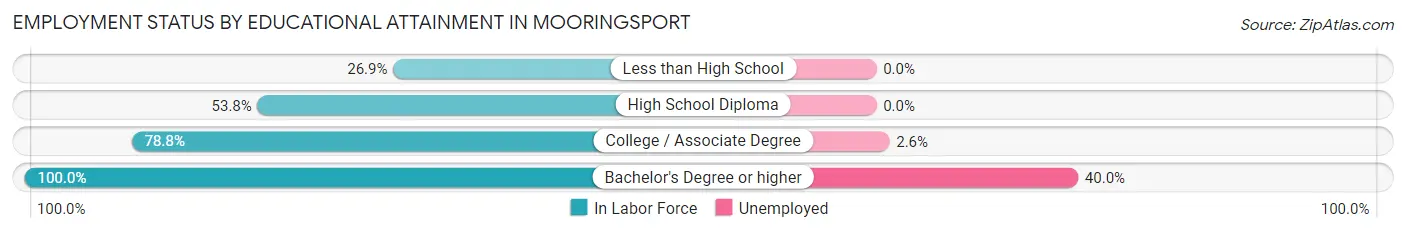
| Educational Attainment | In Labor Force | Unemployed |
| Less than High School | 7 (26.9%) | 0 (0.0%) |
| High School Diploma | 50 (53.8%) | 0 (0.0%) |
| College / Associate Degree | 78 (78.8%) | 3 (2.6%) |
| Bachelor's Degree or higher | 20 (100.0%) | 8 (40.0%) |
| Total | 155 (65.1%) | 15 (6.5%) |
Employment Occupations by Sex in Mooringsport
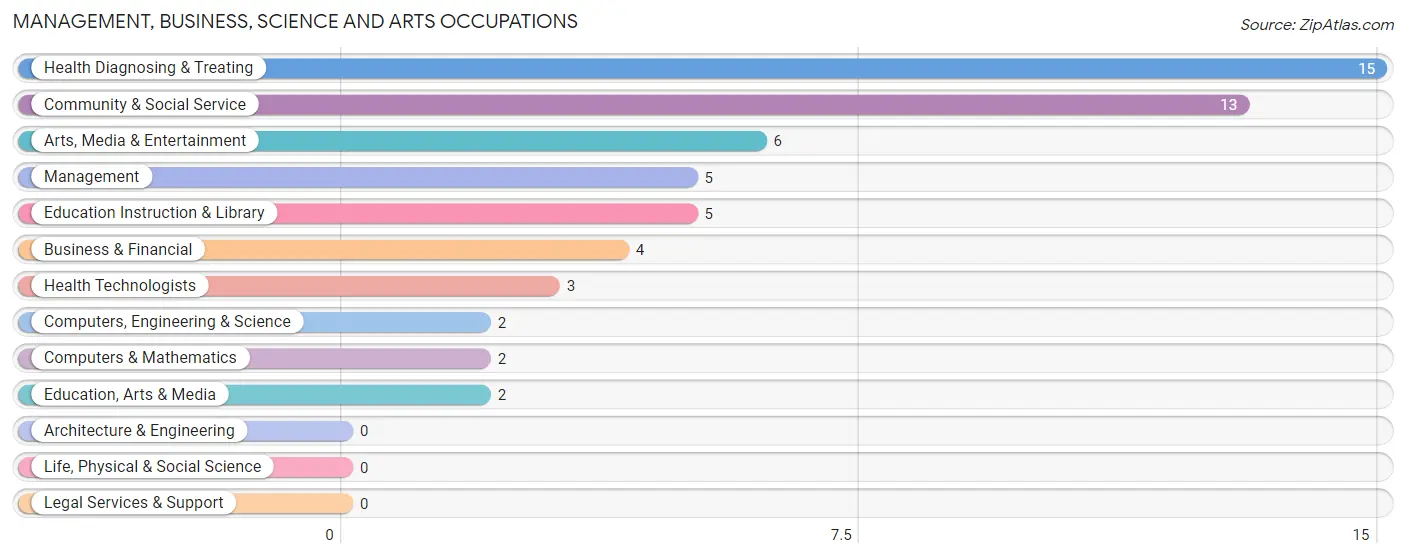
Management, Business, Science and Arts Occupations
The most common Management, Business, Science and Arts occupations in Mooringsport are Health Diagnosing & Treating (15 | 8.9%), Community & Social Service (13 | 7.7%), Arts, Media & Entertainment (6 | 3.5%), Management (5 | 3.0%), and Education Instruction & Library (5 | 3.0%).
Management, Business, Science and Arts Occupations by Sex
Within the Management, Business, Science and Arts occupations in Mooringsport, the most male-oriented occupations are Computers, Engineering & Science (100.0%), Computers & Mathematics (100.0%), and Arts, Media & Entertainment (100.0%), while the most female-oriented occupations are Business & Financial (100.0%), Education, Arts & Media (100.0%), and Education Instruction & Library (100.0%).
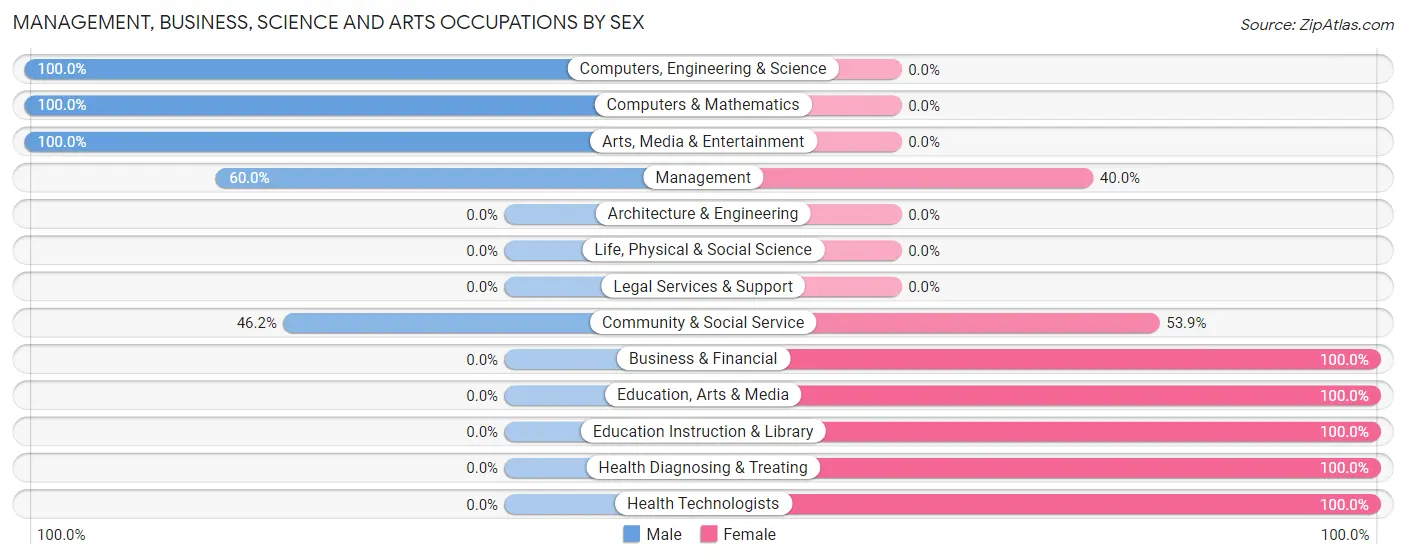
| Occupation | Male | Female |
| Management | 3 (60.0%) | 2 (40.0%) |
| Business & Financial | 0 (0.0%) | 4 (100.0%) |
| Computers, Engineering & Science | 2 (100.0%) | 0 (0.0%) |
| Computers & Mathematics | 2 (100.0%) | 0 (0.0%) |
| Architecture & Engineering | 0 (0.0%) | 0 (0.0%) |
| Life, Physical & Social Science | 0 (0.0%) | 0 (0.0%) |
| Community & Social Service | 6 (46.2%) | 7 (53.8%) |
| Education, Arts & Media | 0 (0.0%) | 2 (100.0%) |
| Legal Services & Support | 0 (0.0%) | 0 (0.0%) |
| Education Instruction & Library | 0 (0.0%) | 5 (100.0%) |
| Arts, Media & Entertainment | 6 (100.0%) | 0 (0.0%) |
| Health Diagnosing & Treating | 0 (0.0%) | 15 (100.0%) |
| Health Technologists | 0 (0.0%) | 3 (100.0%) |
| Total (Category) | 11 (28.2%) | 28 (71.8%) |
| Total (Overall) | 82 (48.5%) | 87 (51.5%) |
Services Occupations
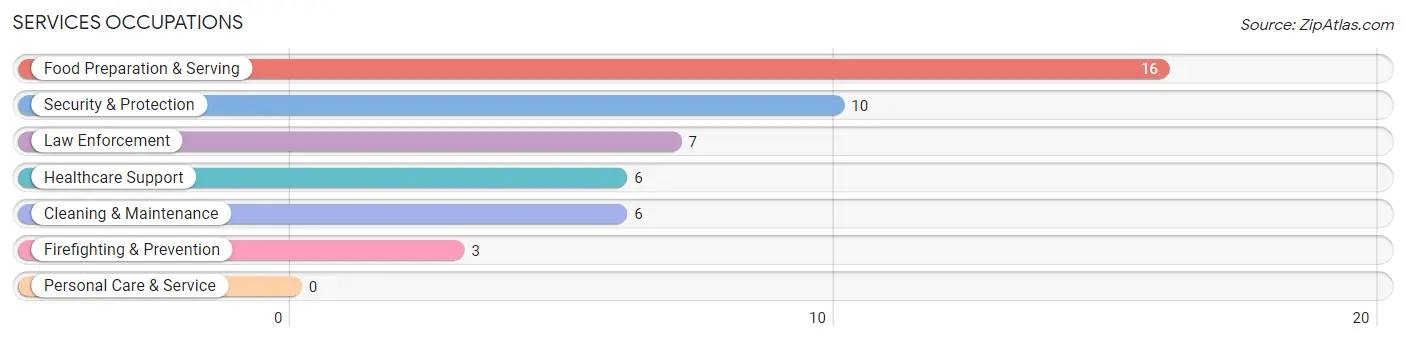
The most common Services occupations in Mooringsport are Food Preparation & Serving (16 | 9.5%), Security & Protection (10 | 5.9%), Law Enforcement (7 | 4.1%), Healthcare Support (6 | 3.5%), and Cleaning & Maintenance (6 | 3.5%).
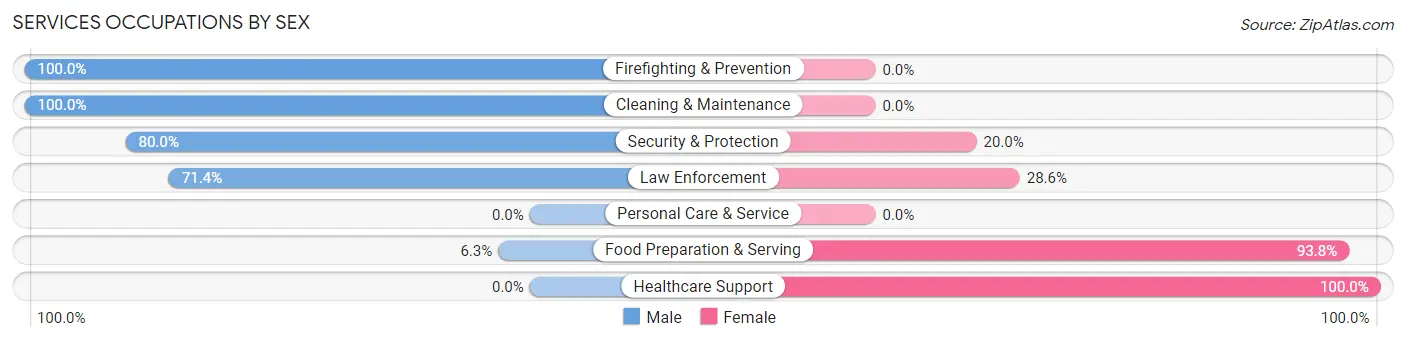
Services Occupations by Sex
Within the Services occupations in Mooringsport, the most male-oriented occupations are Firefighting & Prevention (100.0%), Cleaning & Maintenance (100.0%), and Security & Protection (80.0%), while the most female-oriented occupations are Healthcare Support (100.0%), Food Preparation & Serving (93.8%), and Law Enforcement (28.6%).
| Occupation | Male | Female |
| Healthcare Support | 0 (0.0%) | 6 (100.0%) |
| Security & Protection | 8 (80.0%) | 2 (20.0%) |
| Firefighting & Prevention | 3 (100.0%) | 0 (0.0%) |
| Law Enforcement | 5 (71.4%) | 2 (28.6%) |
| Food Preparation & Serving | 1 (6.2%) | 15 (93.8%) |
| Cleaning & Maintenance | 6 (100.0%) | 0 (0.0%) |
| Personal Care & Service | 0 (0.0%) | 0 (0.0%) |
| Total (Category) | 15 (39.5%) | 23 (60.5%) |
| Total (Overall) | 82 (48.5%) | 87 (51.5%) |
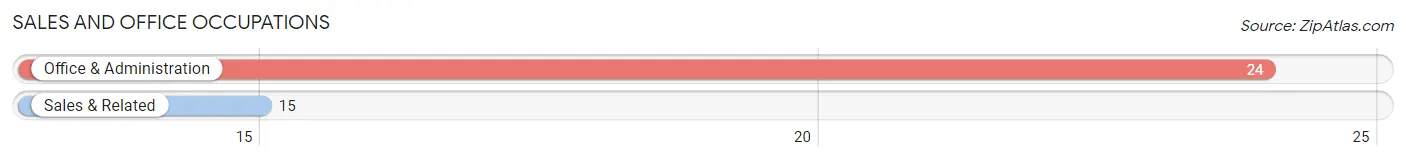
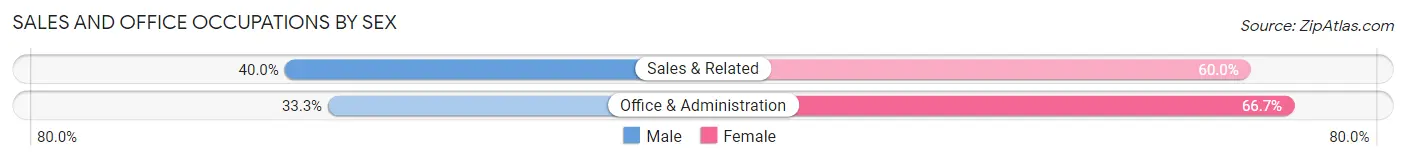
Sales and Office Occupations
The most common Sales and Office occupations in Mooringsport are Office & Administration (24 | 14.2%), and Sales & Related (15 | 8.9%).
Sales and Office Occupations by Sex
| Occupation | Male | Female |
| Sales & Related | 6 (40.0%) | 9 (60.0%) |
| Office & Administration | 8 (33.3%) | 16 (66.7%) |
| Total (Category) | 14 (35.9%) | 25 (64.1%) |
| Total (Overall) | 82 (48.5%) | 87 (51.5%) |
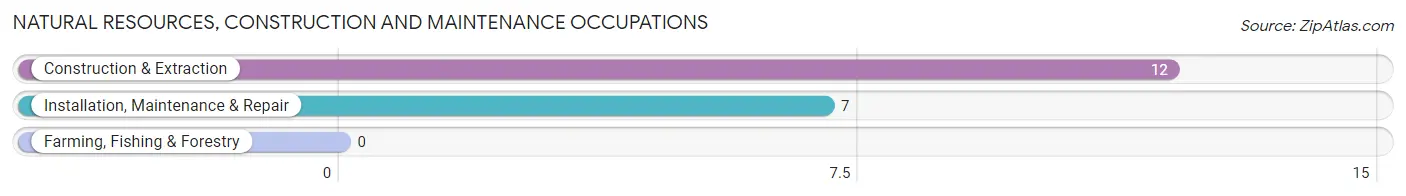
Natural Resources, Construction and Maintenance Occupations
The most common Natural Resources, Construction and Maintenance occupations in Mooringsport are Construction & Extraction (12 | 7.1%), and Installation, Maintenance & Repair (7 | 4.1%).
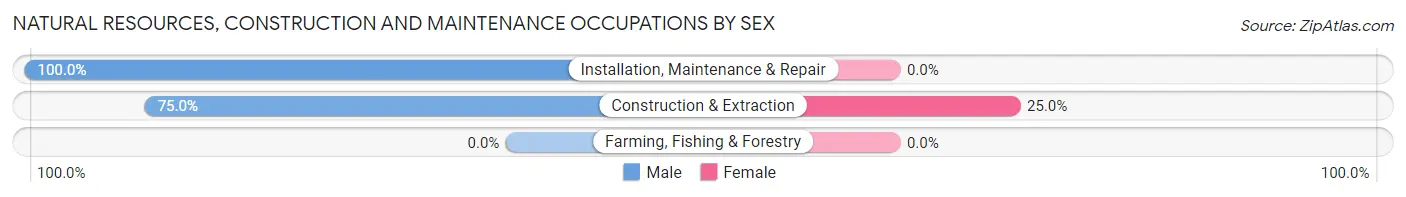
Natural Resources, Construction and Maintenance Occupations by Sex
| Occupation | Male | Female |
| Farming, Fishing & Forestry | 0 (0.0%) | 0 (0.0%) |
| Construction & Extraction | 9 (75.0%) | 3 (25.0%) |
| Installation, Maintenance & Repair | 7 (100.0%) | 0 (0.0%) |
| Total (Category) | 16 (84.2%) | 3 (15.8%) |
| Total (Overall) | 82 (48.5%) | 87 (51.5%) |
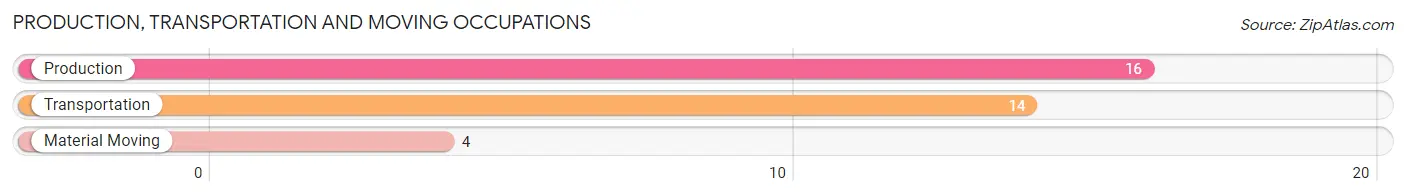
Production, Transportation and Moving Occupations
The most common Production, Transportation and Moving occupations in Mooringsport are Production (16 | 9.5%), Transportation (14 | 8.3%), and Material Moving (4 | 2.4%).
Production, Transportation and Moving Occupations by Sex
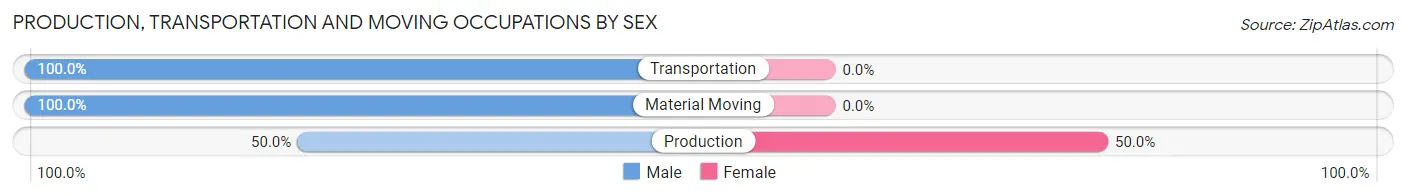
| Occupation | Male | Female |
| Production | 8 (50.0%) | 8 (50.0%) |
| Transportation | 14 (100.0%) | 0 (0.0%) |
| Material Moving | 4 (100.0%) | 0 (0.0%) |
| Total (Category) | 26 (76.5%) | 8 (23.5%) |
| Total (Overall) | 82 (48.5%) | 87 (51.5%) |
Employment Industries by Sex in Mooringsport
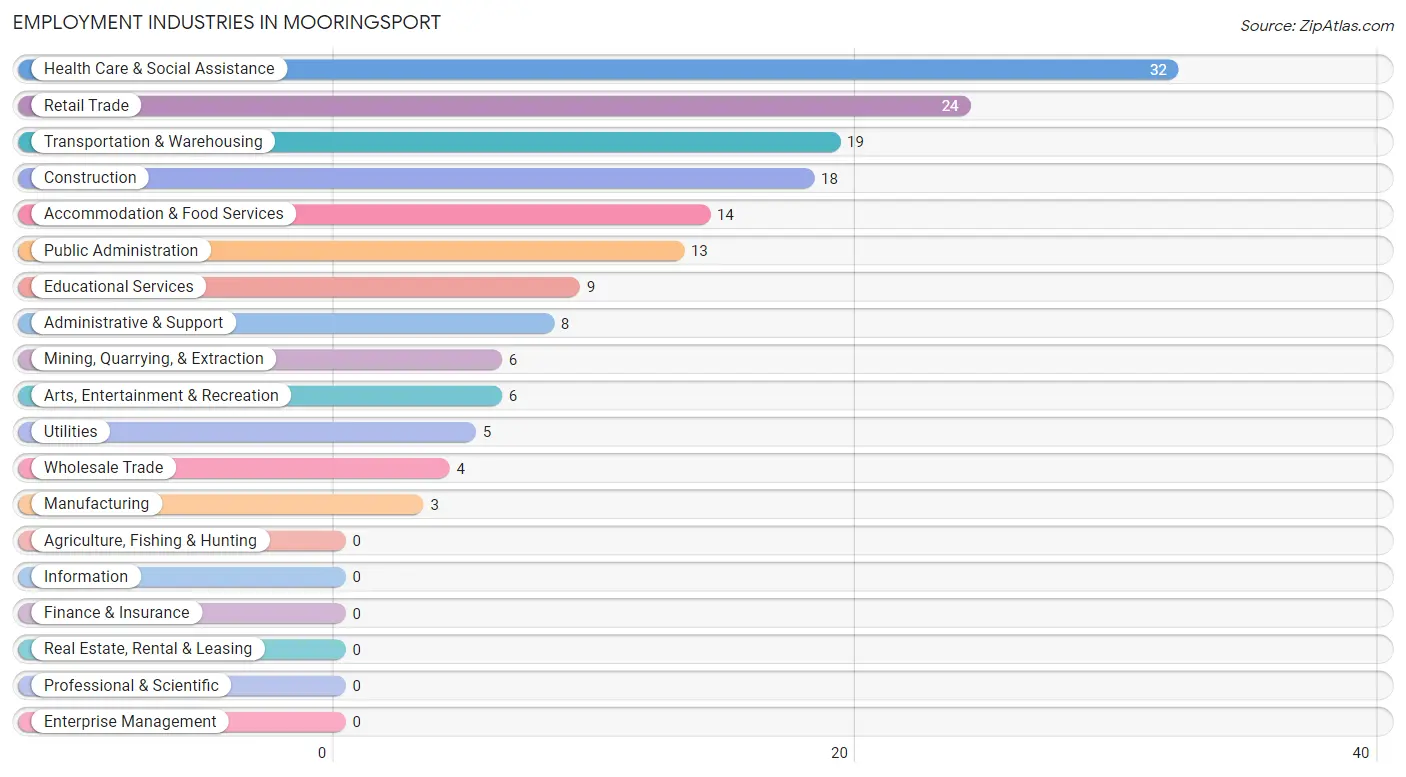
Employment Industries in Mooringsport
The major employment industries in Mooringsport include Health Care & Social Assistance (32 | 18.9%), Retail Trade (24 | 14.2%), Transportation & Warehousing (19 | 11.2%), Construction (18 | 10.6%), and Accommodation & Food Services (14 | 8.3%).
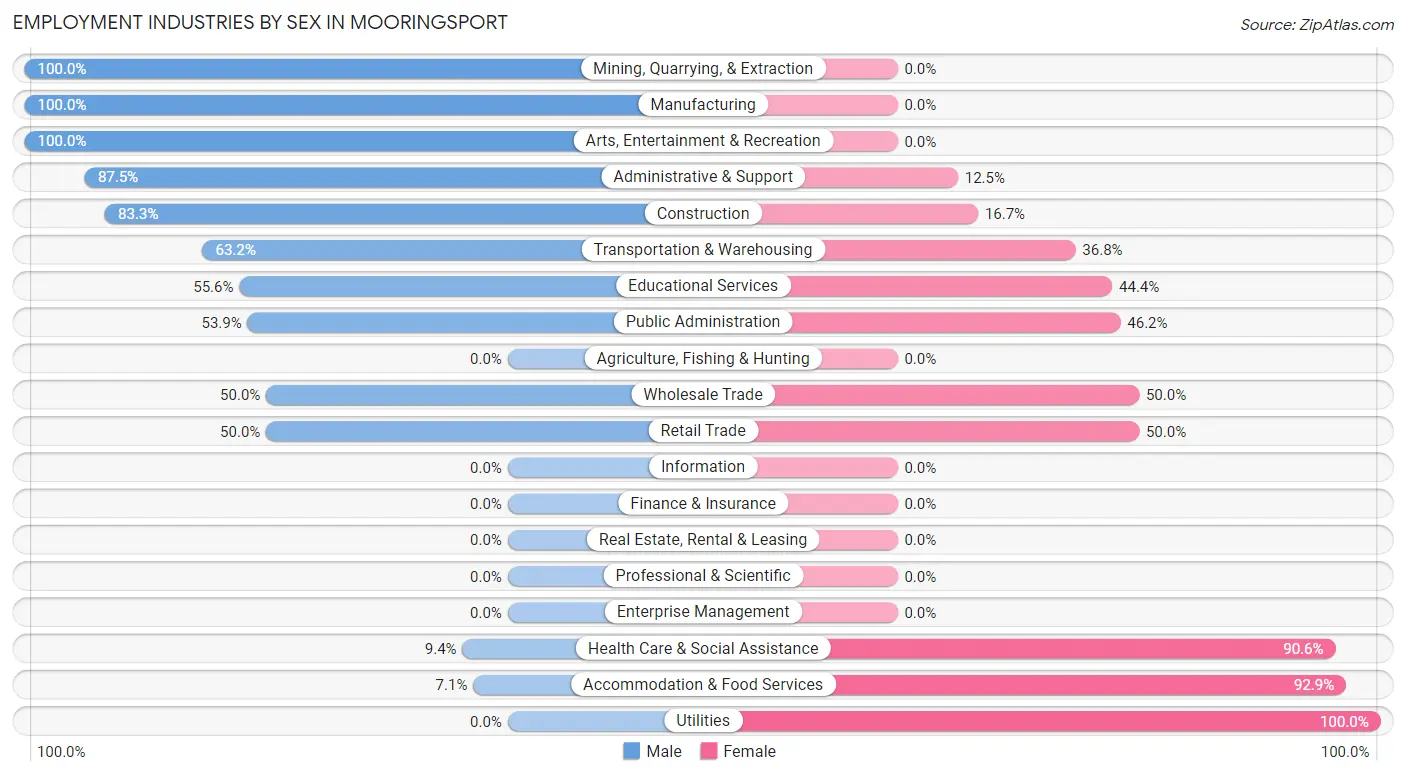
Employment Industries by Sex in Mooringsport
The Mooringsport industries that see more men than women are Mining, Quarrying, & Extraction (100.0%), Manufacturing (100.0%), and Arts, Entertainment & Recreation (100.0%), whereas the industries that tend to have a higher number of women are Utilities (100.0%), Accommodation & Food Services (92.9%), and Health Care & Social Assistance (90.6%).
| Industry | Male | Female |
| Agriculture, Fishing & Hunting | 0 (0.0%) | 0 (0.0%) |
| Mining, Quarrying, & Extraction | 6 (100.0%) | 0 (0.0%) |
| Construction | 15 (83.3%) | 3 (16.7%) |
| Manufacturing | 3 (100.0%) | 0 (0.0%) |
| Wholesale Trade | 2 (50.0%) | 2 (50.0%) |
| Retail Trade | 12 (50.0%) | 12 (50.0%) |
| Transportation & Warehousing | 12 (63.2%) | 7 (36.8%) |
| Utilities | 0 (0.0%) | 5 (100.0%) |
| Information | 0 (0.0%) | 0 (0.0%) |
| Finance & Insurance | 0 (0.0%) | 0 (0.0%) |
| Real Estate, Rental & Leasing | 0 (0.0%) | 0 (0.0%) |
| Professional & Scientific | 0 (0.0%) | 0 (0.0%) |
| Enterprise Management | 0 (0.0%) | 0 (0.0%) |
| Administrative & Support | 7 (87.5%) | 1 (12.5%) |
| Educational Services | 5 (55.6%) | 4 (44.4%) |
| Health Care & Social Assistance | 3 (9.4%) | 29 (90.6%) |
| Arts, Entertainment & Recreation | 6 (100.0%) | 0 (0.0%) |
| Accommodation & Food Services | 1 (7.1%) | 13 (92.9%) |
| Public Administration | 7 (53.8%) | 6 (46.2%) |
| Total | 82 (48.5%) | 87 (51.5%) |
Education in Mooringsport
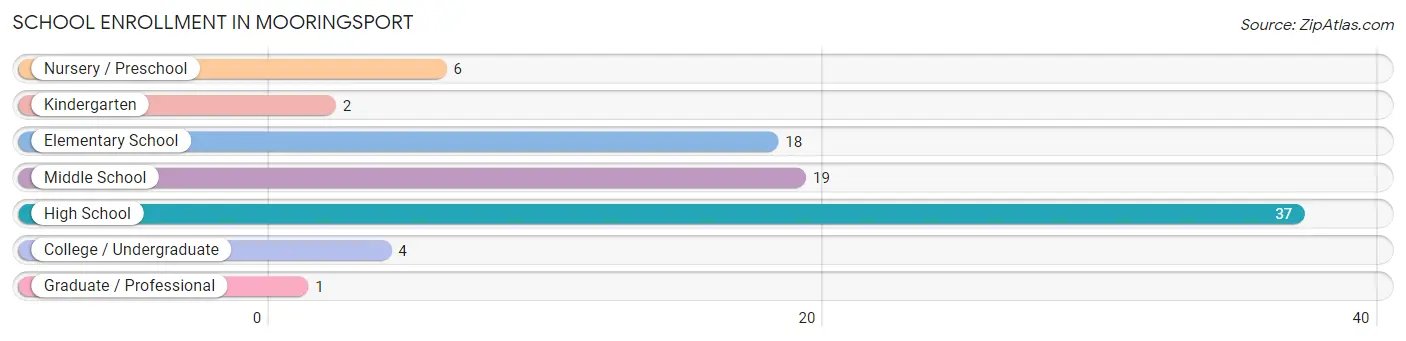
School Enrollment in Mooringsport
The most common levels of schooling among the 87 students in Mooringsport are high school (37 | 42.5%), middle school (19 | 21.8%), and elementary school (18 | 20.7%).
| School Level | # Students | % Students |
| Nursery / Preschool | 6 | 6.9% |
| Kindergarten | 2 | 2.3% |
| Elementary School | 18 | 20.7% |
| Middle School | 19 | 21.8% |
| High School | 37 | 42.5% |
| College / Undergraduate | 4 | 4.6% |
| Graduate / Professional | 1 | 1.1% |
| Total | 87 | 100.0% |
School Enrollment by Age by Funding Source in Mooringsport
Out of a total of 87 students who are enrolled in schools in Mooringsport, 3 (3.4%) attend a private institution, while the remaining 84 (96.6%) are enrolled in public schools. The age group of 18 to 19 year olds has the highest likelihood of being enrolled in private schools, with 3 (42.9% in the age bracket) enrolled. Conversely, the age group of 3 to 4 year olds has the lowest likelihood of being enrolled in a private school, with 6 (100.0% in the age bracket) attending a public institution.
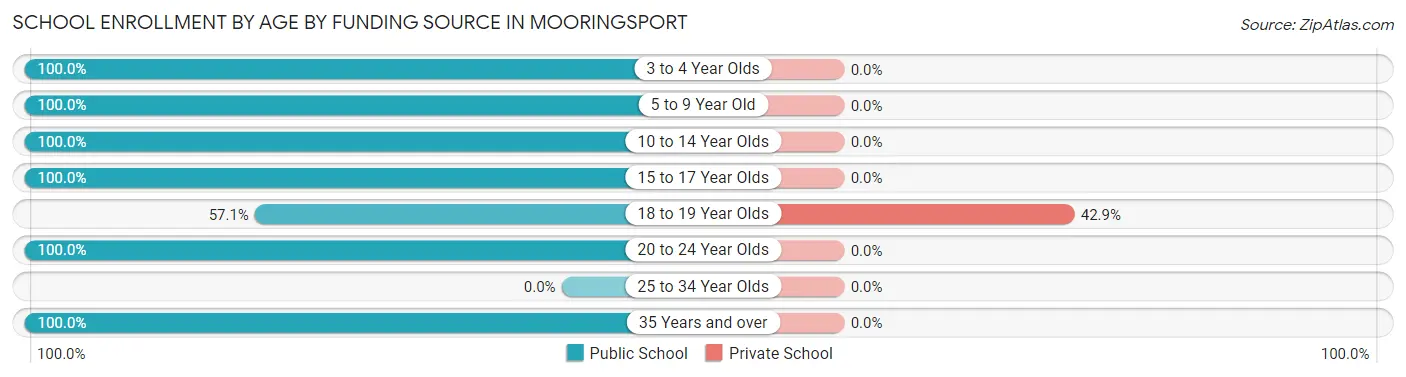
| Age Bracket | Public School | Private School |
| 3 to 4 Year Olds | 6 (100.0%) | 0 (0.0%) |
| 5 to 9 Year Old | 14 (100.0%) | 0 (0.0%) |
| 10 to 14 Year Olds | 32 (100.0%) | 0 (0.0%) |
| 15 to 17 Year Olds | 23 (100.0%) | 0 (0.0%) |
| 18 to 19 Year Olds | 4 (57.1%) | 3 (42.9%) |
| 20 to 24 Year Olds | 3 (100.0%) | 0 (0.0%) |
| 25 to 34 Year Olds | 0 (0.0%) | 0 (0.0%) |
| 35 Years and over | 2 (100.0%) | 0 (0.0%) |
| Total | 84 (96.6%) | 3 (3.4%) |
Educational Attainment by Field of Study in Mooringsport
Business (8 | 22.2%), science & technology (7 | 19.4%), education (6 | 16.7%), liberal arts & history (4 | 11.1%), and bio, nature & agricultural (3 | 8.3%) are the most common fields of study among 36 individuals in Mooringsport who have obtained a bachelor's degree or higher.
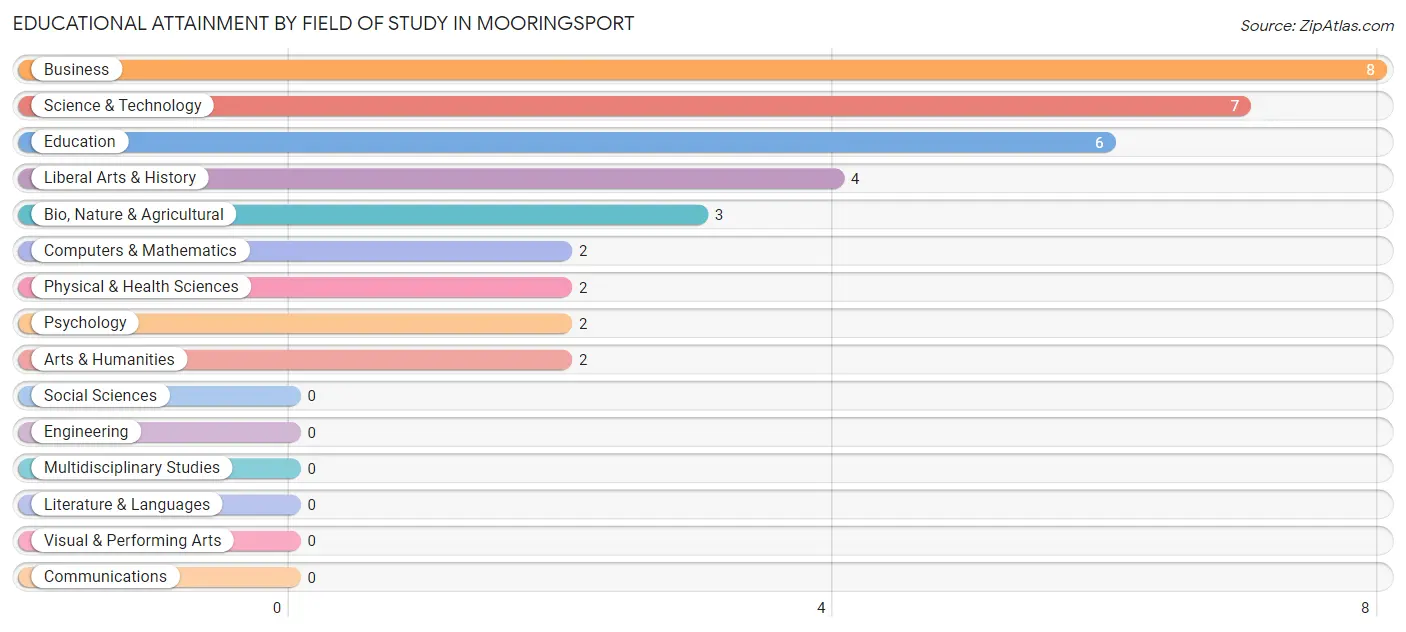
| Field of Study | # Graduates | % Graduates |
| Computers & Mathematics | 2 | 5.6% |
| Bio, Nature & Agricultural | 3 | 8.3% |
| Physical & Health Sciences | 2 | 5.6% |
| Psychology | 2 | 5.6% |
| Social Sciences | 0 | 0.0% |
| Engineering | 0 | 0.0% |
| Multidisciplinary Studies | 0 | 0.0% |
| Science & Technology | 7 | 19.4% |
| Business | 8 | 22.2% |
| Education | 6 | 16.7% |
| Literature & Languages | 0 | 0.0% |
| Liberal Arts & History | 4 | 11.1% |
| Visual & Performing Arts | 0 | 0.0% |
| Communications | 0 | 0.0% |
| Arts & Humanities | 2 | 5.6% |
| Total | 36 | 100.0% |
Transportation & Commute in Mooringsport
Vehicle Availability by Sex in Mooringsport
The most prevalent vehicle ownership categories in Mooringsport are males with 2 vehicles (24, accounting for 33.8%) and females with 2 vehicles (27, making up 27.6%).
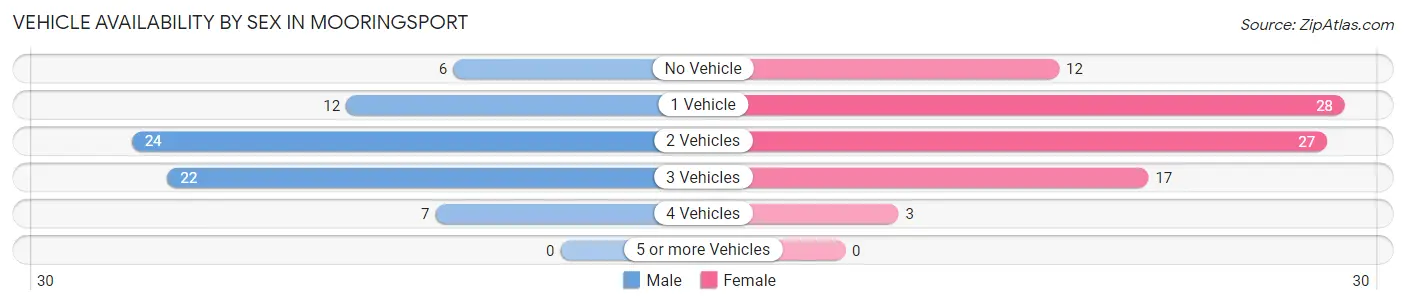
| Vehicles Available | Male | Female |
| No Vehicle | 6 (8.5%) | 12 (13.8%) |
| 1 Vehicle | 12 (16.9%) | 28 (32.2%) |
| 2 Vehicles | 24 (33.8%) | 27 (31.0%) |
| 3 Vehicles | 22 (31.0%) | 17 (19.5%) |
| 4 Vehicles | 7 (9.9%) | 3 (3.5%) |
| 5 or more Vehicles | 0 (0.0%) | 0 (0.0%) |
| Total | 71 (100.0%) | 87 (100.0%) |
Commute Time in Mooringsport
The most frequently occuring commute durations in Mooringsport are 30 to 34 minutes (36 commuters, 24.2%), 20 to 24 minutes (22 commuters, 14.8%), and 25 to 29 minutes (19 commuters, 12.8%).
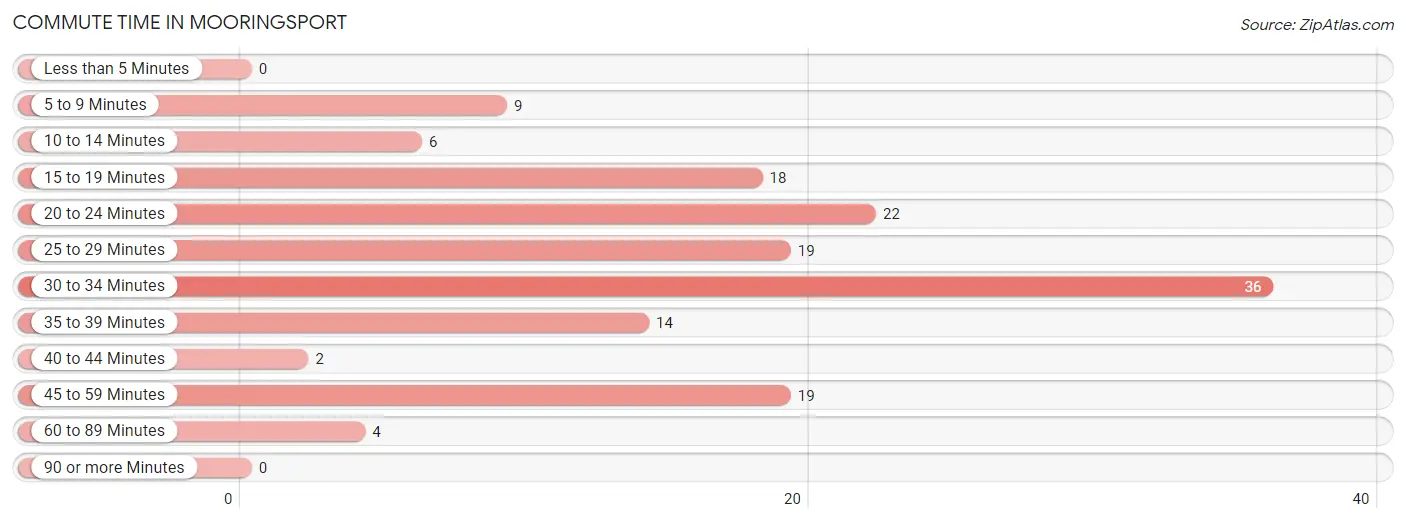
| Commute Time | # Commuters | % Commuters |
| Less than 5 Minutes | 0 | 0.0% |
| 5 to 9 Minutes | 9 | 6.0% |
| 10 to 14 Minutes | 6 | 4.0% |
| 15 to 19 Minutes | 18 | 12.1% |
| 20 to 24 Minutes | 22 | 14.8% |
| 25 to 29 Minutes | 19 | 12.8% |
| 30 to 34 Minutes | 36 | 24.2% |
| 35 to 39 Minutes | 14 | 9.4% |
| 40 to 44 Minutes | 2 | 1.3% |
| 45 to 59 Minutes | 19 | 12.8% |
| 60 to 89 Minutes | 4 | 2.7% |
| 90 or more Minutes | 0 | 0.0% |
Commute Time by Sex in Mooringsport
The most common commute times in Mooringsport are 25 to 29 minutes (19 commuters, 26.8%) for males and 30 to 34 minutes (30 commuters, 38.5%) for females.
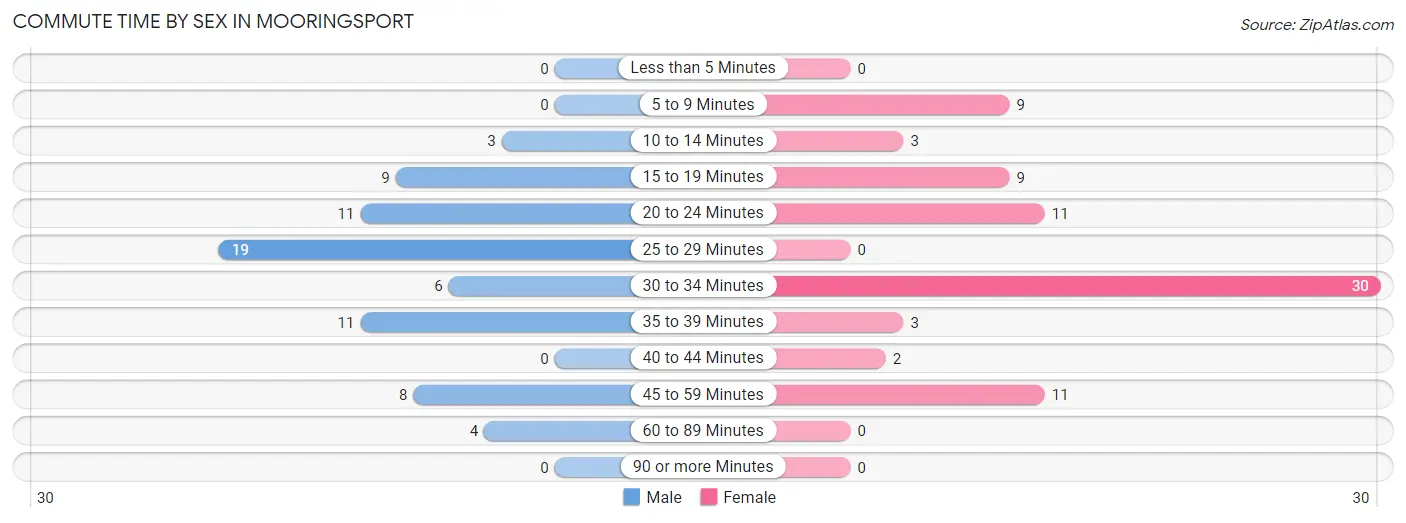
| Commute Time | Male | Female |
| Less than 5 Minutes | 0 (0.0%) | 0 (0.0%) |
| 5 to 9 Minutes | 0 (0.0%) | 9 (11.5%) |
| 10 to 14 Minutes | 3 (4.2%) | 3 (3.8%) |
| 15 to 19 Minutes | 9 (12.7%) | 9 (11.5%) |
| 20 to 24 Minutes | 11 (15.5%) | 11 (14.1%) |
| 25 to 29 Minutes | 19 (26.8%) | 0 (0.0%) |
| 30 to 34 Minutes | 6 (8.5%) | 30 (38.5%) |
| 35 to 39 Minutes | 11 (15.5%) | 3 (3.8%) |
| 40 to 44 Minutes | 0 (0.0%) | 2 (2.6%) |
| 45 to 59 Minutes | 8 (11.3%) | 11 (14.1%) |
| 60 to 89 Minutes | 4 (5.6%) | 0 (0.0%) |
| 90 or more Minutes | 0 (0.0%) | 0 (0.0%) |
Time of Departure to Work by Sex in Mooringsport
The most frequent times of departure to work in Mooringsport are 6:00 AM to 6:29 AM (16, 22.5%) for males and 7:30 AM to 7:59 AM (21, 26.9%) for females.
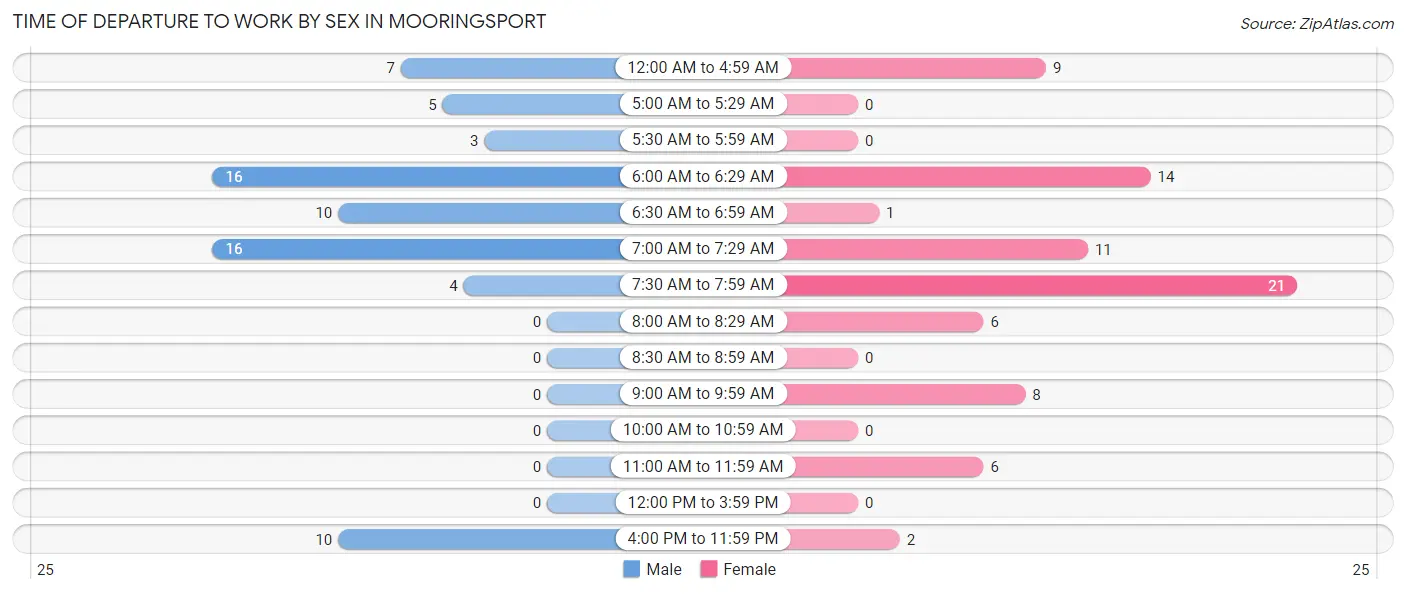
| Time of Departure | Male | Female |
| 12:00 AM to 4:59 AM | 7 (9.9%) | 9 (11.5%) |
| 5:00 AM to 5:29 AM | 5 (7.0%) | 0 (0.0%) |
| 5:30 AM to 5:59 AM | 3 (4.2%) | 0 (0.0%) |
| 6:00 AM to 6:29 AM | 16 (22.5%) | 14 (17.9%) |
| 6:30 AM to 6:59 AM | 10 (14.1%) | 1 (1.3%) |
| 7:00 AM to 7:29 AM | 16 (22.5%) | 11 (14.1%) |
| 7:30 AM to 7:59 AM | 4 (5.6%) | 21 (26.9%) |
| 8:00 AM to 8:29 AM | 0 (0.0%) | 6 (7.7%) |
| 8:30 AM to 8:59 AM | 0 (0.0%) | 0 (0.0%) |
| 9:00 AM to 9:59 AM | 0 (0.0%) | 8 (10.3%) |
| 10:00 AM to 10:59 AM | 0 (0.0%) | 0 (0.0%) |
| 11:00 AM to 11:59 AM | 0 (0.0%) | 6 (7.7%) |
| 12:00 PM to 3:59 PM | 0 (0.0%) | 0 (0.0%) |
| 4:00 PM to 11:59 PM | 10 (14.1%) | 2 (2.6%) |
| Total | 71 (100.0%) | 78 (100.0%) |
Housing Occupancy in Mooringsport
Occupancy by Ownership in Mooringsport
Of the total 335 dwellings in Mooringsport, owner-occupied units account for 263 (78.5%), while renter-occupied units make up 72 (21.5%).
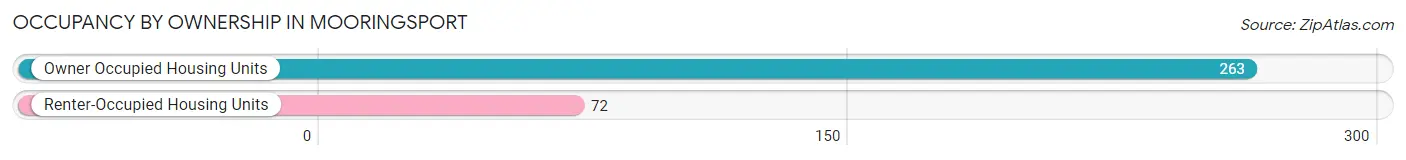
| Occupancy | # Housing Units | % Housing Units |
| Owner Occupied Housing Units | 263 | 78.5% |
| Renter-Occupied Housing Units | 72 | 21.5% |
| Total Occupied Housing Units | 335 | 100.0% |
Occupancy by Household Size in Mooringsport
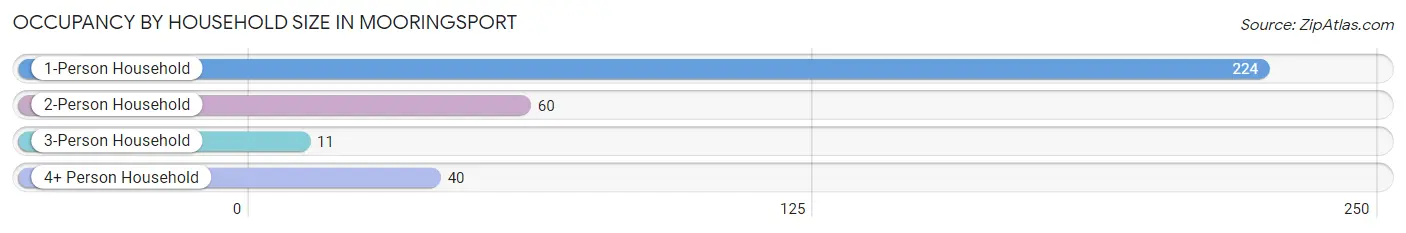
| Household Size | # Housing Units | % Housing Units |
| 1-Person Household | 224 | 66.9% |
| 2-Person Household | 60 | 17.9% |
| 3-Person Household | 11 | 3.3% |
| 4+ Person Household | 40 | 11.9% |
| Total Housing Units | 335 | 100.0% |
Occupancy by Ownership by Household Size in Mooringsport
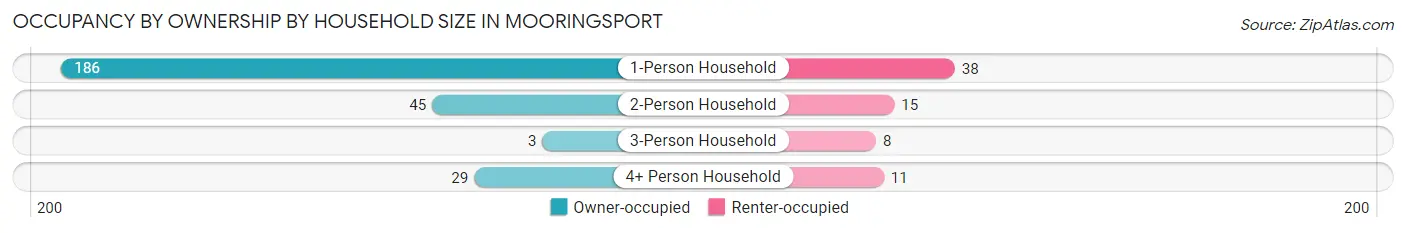
| Household Size | Owner-occupied | Renter-occupied |
| 1-Person Household | 186 (83.0%) | 38 (17.0%) |
| 2-Person Household | 45 (75.0%) | 15 (25.0%) |
| 3-Person Household | 3 (27.3%) | 8 (72.7%) |
| 4+ Person Household | 29 (72.5%) | 11 (27.5%) |
| Total Housing Units | 263 (78.5%) | 72 (21.5%) |
Occupancy by Educational Attainment in Mooringsport
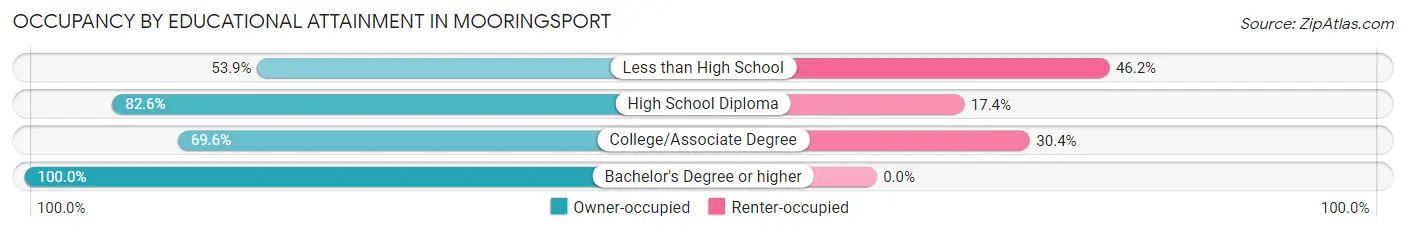
| Household Size | Owner-occupied | Renter-occupied |
| Less than High School | 14 (53.8%) | 12 (46.2%) |
| High School Diploma | 171 (82.6%) | 36 (17.4%) |
| College/Associate Degree | 55 (69.6%) | 24 (30.4%) |
| Bachelor's Degree or higher | 23 (100.0%) | 0 (0.0%) |
Occupancy by Age of Householder in Mooringsport
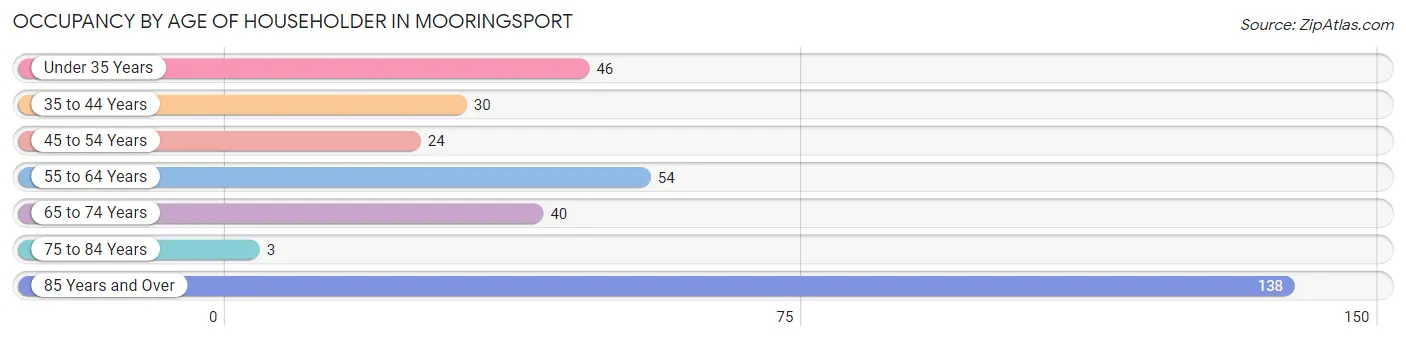
| Age Bracket | # Households | % Households |
| Under 35 Years | 46 | 13.7% |
| 35 to 44 Years | 30 | 9.0% |
| 45 to 54 Years | 24 | 7.2% |
| 55 to 64 Years | 54 | 16.1% |
| 65 to 74 Years | 40 | 11.9% |
| 75 to 84 Years | 3 | 0.9% |
| 85 Years and Over | 138 | 41.2% |
| Total | 335 | 100.0% |
Housing Finances in Mooringsport
Median Income by Occupancy in Mooringsport
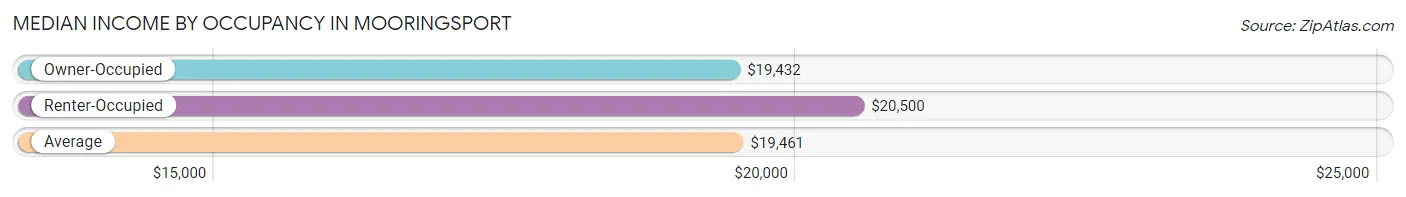
| Occupancy Type | # Households | Median Income |
| Owner-Occupied | 263 (78.5%) | $19,432 |
| Renter-Occupied | 72 (21.5%) | $20,500 |
| Average | 335 (100.0%) | $19,461 |
Occupancy by Householder Income Bracket in Mooringsport
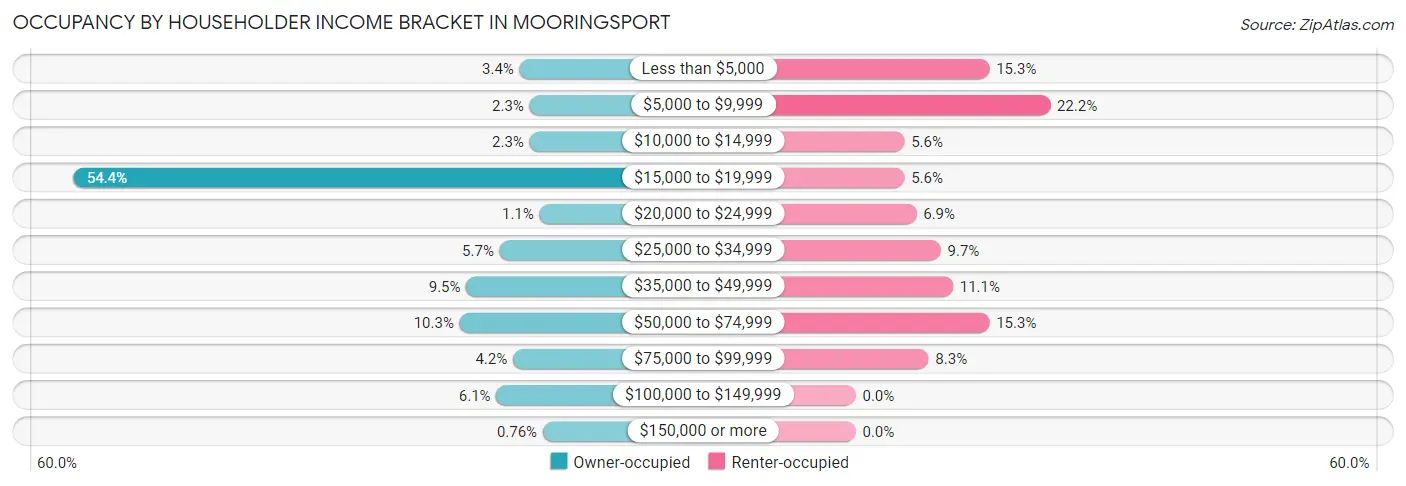
| Income Bracket | Owner-occupied | Renter-occupied |
| Less than $5,000 | 9 (3.4%) | 11 (15.3%) |
| $5,000 to $9,999 | 6 (2.3%) | 16 (22.2%) |
| $10,000 to $14,999 | 6 (2.3%) | 4 (5.6%) |
| $15,000 to $19,999 | 143 (54.4%) | 4 (5.6%) |
| $20,000 to $24,999 | 3 (1.1%) | 5 (6.9%) |
| $25,000 to $34,999 | 15 (5.7%) | 7 (9.7%) |
| $35,000 to $49,999 | 25 (9.5%) | 8 (11.1%) |
| $50,000 to $74,999 | 27 (10.3%) | 11 (15.3%) |
| $75,000 to $99,999 | 11 (4.2%) | 6 (8.3%) |
| $100,000 to $149,999 | 16 (6.1%) | 0 (0.0%) |
| $150,000 or more | 2 (0.8%) | 0 (0.0%) |
| Total | 263 (100.0%) | 72 (100.0%) |
Monthly Housing Cost Tiers in Mooringsport
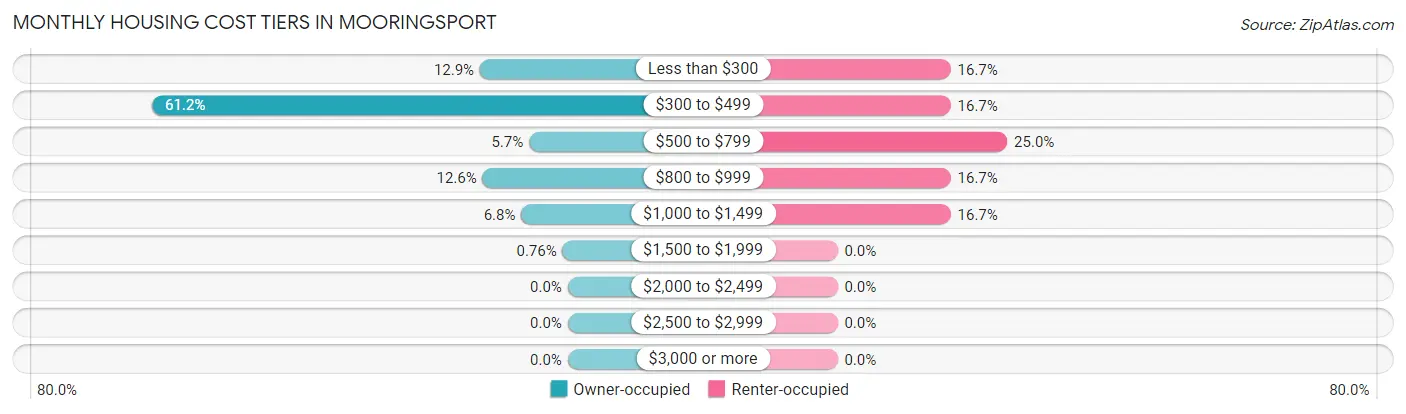
| Monthly Cost | Owner-occupied | Renter-occupied |
| Less than $300 | 34 (12.9%) | 12 (16.7%) |
| $300 to $499 | 161 (61.2%) | 12 (16.7%) |
| $500 to $799 | 15 (5.7%) | 18 (25.0%) |
| $800 to $999 | 33 (12.6%) | 12 (16.7%) |
| $1,000 to $1,499 | 18 (6.8%) | 12 (16.7%) |
| $1,500 to $1,999 | 2 (0.8%) | 0 (0.0%) |
| $2,000 to $2,499 | 0 (0.0%) | 0 (0.0%) |
| $2,500 to $2,999 | 0 (0.0%) | 0 (0.0%) |
| $3,000 or more | 0 (0.0%) | 0 (0.0%) |
| Total | 263 (100.0%) | 72 (100.0%) |
Physical Housing Characteristics in Mooringsport
Housing Structures in Mooringsport
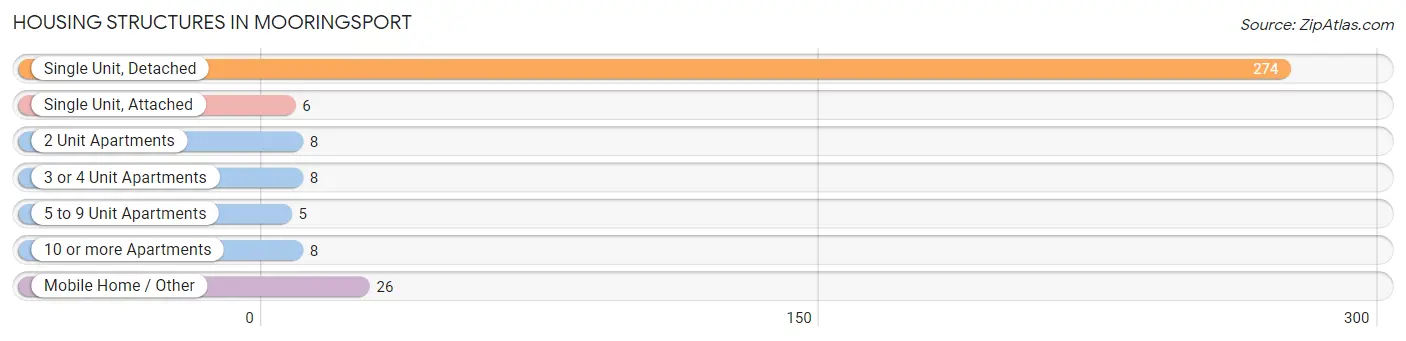
| Structure Type | # Housing Units | % Housing Units |
| Single Unit, Detached | 274 | 81.8% |
| Single Unit, Attached | 6 | 1.8% |
| 2 Unit Apartments | 8 | 2.4% |
| 3 or 4 Unit Apartments | 8 | 2.4% |
| 5 to 9 Unit Apartments | 5 | 1.5% |
| 10 or more Apartments | 8 | 2.4% |
| Mobile Home / Other | 26 | 7.8% |
| Total | 335 | 100.0% |
Housing Structures by Occupancy in Mooringsport
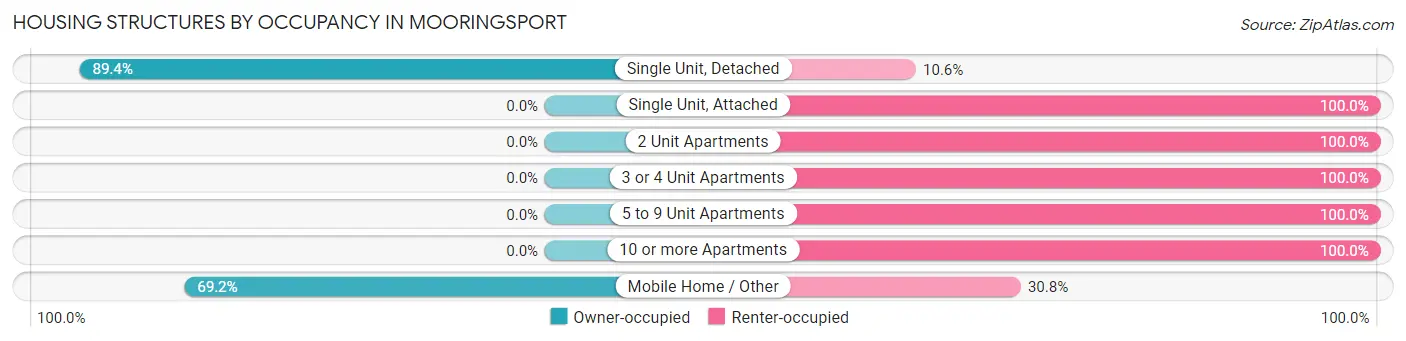
| Structure Type | Owner-occupied | Renter-occupied |
| Single Unit, Detached | 245 (89.4%) | 29 (10.6%) |
| Single Unit, Attached | 0 (0.0%) | 6 (100.0%) |
| 2 Unit Apartments | 0 (0.0%) | 8 (100.0%) |
| 3 or 4 Unit Apartments | 0 (0.0%) | 8 (100.0%) |
| 5 to 9 Unit Apartments | 0 (0.0%) | 5 (100.0%) |
| 10 or more Apartments | 0 (0.0%) | 8 (100.0%) |
| Mobile Home / Other | 18 (69.2%) | 8 (30.8%) |
| Total | 263 (78.5%) | 72 (21.5%) |
Housing Structures by Number of Rooms in Mooringsport
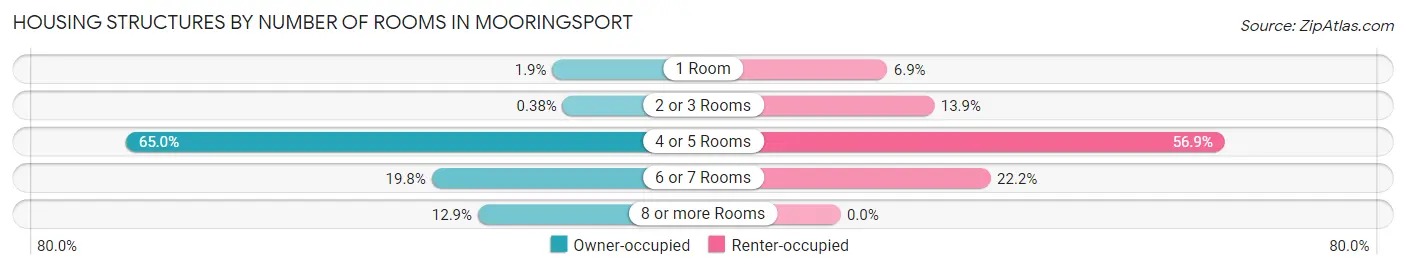
| Number of Rooms | Owner-occupied | Renter-occupied |
| 1 Room | 5 (1.9%) | 5 (6.9%) |
| 2 or 3 Rooms | 1 (0.4%) | 10 (13.9%) |
| 4 or 5 Rooms | 171 (65.0%) | 41 (56.9%) |
| 6 or 7 Rooms | 52 (19.8%) | 16 (22.2%) |
| 8 or more Rooms | 34 (12.9%) | 0 (0.0%) |
| Total | 263 (100.0%) | 72 (100.0%) |
Housing Structure by Heating Type in Mooringsport
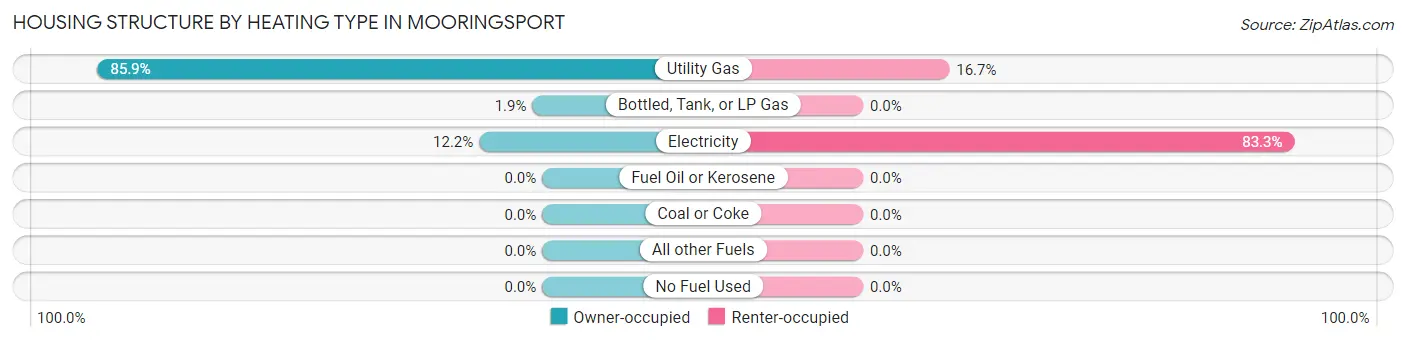
| Heating Type | Owner-occupied | Renter-occupied |
| Utility Gas | 226 (85.9%) | 12 (16.7%) |
| Bottled, Tank, or LP Gas | 5 (1.9%) | 0 (0.0%) |
| Electricity | 32 (12.2%) | 60 (83.3%) |
| Fuel Oil or Kerosene | 0 (0.0%) | 0 (0.0%) |
| Coal or Coke | 0 (0.0%) | 0 (0.0%) |
| All other Fuels | 0 (0.0%) | 0 (0.0%) |
| No Fuel Used | 0 (0.0%) | 0 (0.0%) |
| Total | 263 (100.0%) | 72 (100.0%) |
Household Vehicle Usage in Mooringsport
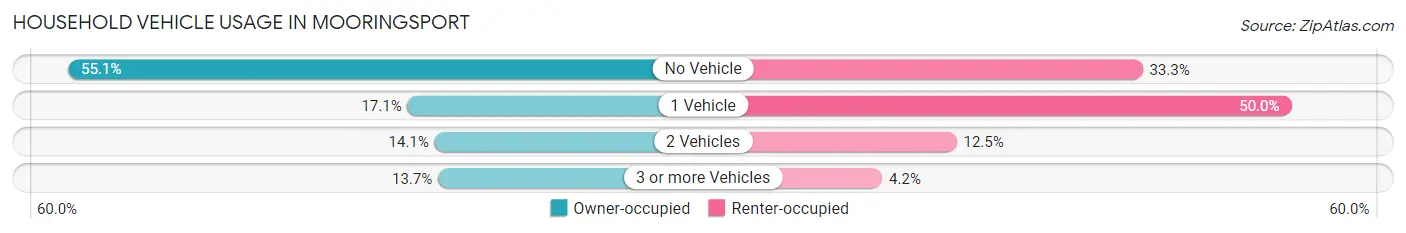
| Vehicles per Household | Owner-occupied | Renter-occupied |
| No Vehicle | 145 (55.1%) | 24 (33.3%) |
| 1 Vehicle | 45 (17.1%) | 36 (50.0%) |
| 2 Vehicles | 37 (14.1%) | 9 (12.5%) |
| 3 or more Vehicles | 36 (13.7%) | 3 (4.2%) |
| Total | 263 (100.0%) | 72 (100.0%) |
Real Estate & Mortgages in Mooringsport
Real Estate and Mortgage Overview in Mooringsport
| Characteristic | Without Mortgage | With Mortgage |
| Housing Units | 203 | 60 |
| Median Property Value | $65,100 | $91,700 |
| Median Household Income | $18,977 | $2 |
| Monthly Housing Costs | $324 | $0 |
| Real Estate Taxes | $199 | $12 |
Property Value by Mortgage Status in Mooringsport
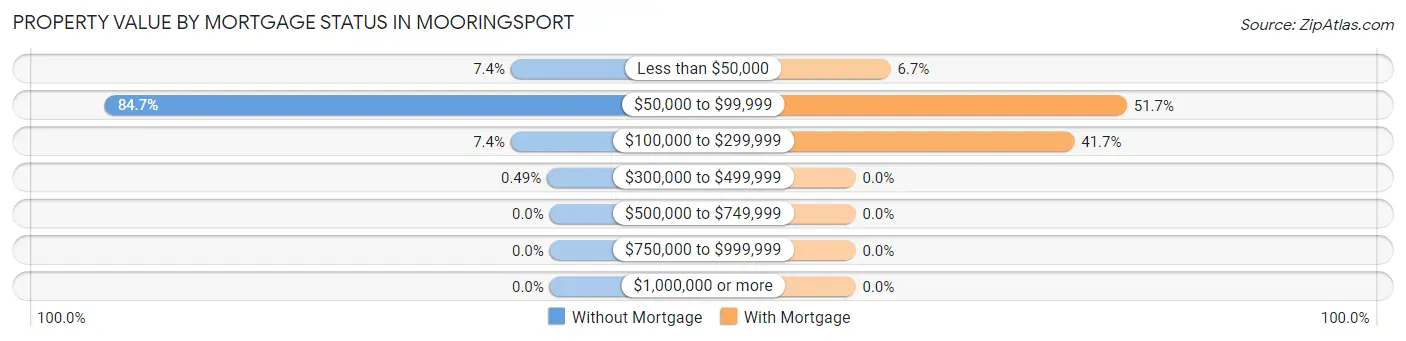
| Property Value | Without Mortgage | With Mortgage |
| Less than $50,000 | 15 (7.4%) | 4 (6.7%) |
| $50,000 to $99,999 | 172 (84.7%) | 31 (51.7%) |
| $100,000 to $299,999 | 15 (7.4%) | 25 (41.7%) |
| $300,000 to $499,999 | 1 (0.5%) | 0 (0.0%) |
| $500,000 to $749,999 | 0 (0.0%) | 0 (0.0%) |
| $750,000 to $999,999 | 0 (0.0%) | 0 (0.0%) |
| $1,000,000 or more | 0 (0.0%) | 0 (0.0%) |
| Total | 203 (100.0%) | 60 (100.0%) |
Household Income by Mortgage Status in Mooringsport
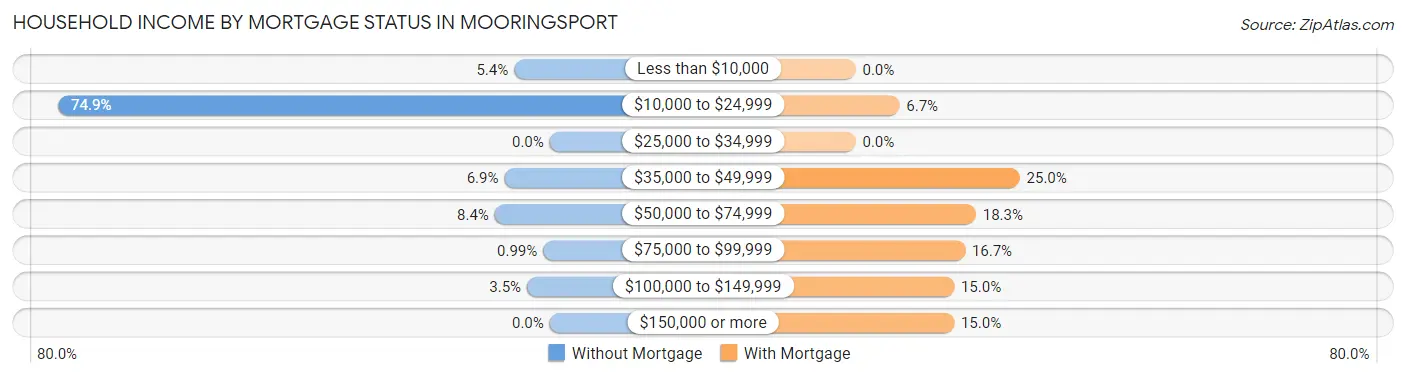
| Household Income | Without Mortgage | With Mortgage |
| Less than $10,000 | 11 (5.4%) | 0 (0.0%) |
| $10,000 to $24,999 | 152 (74.9%) | 4 (6.7%) |
| $25,000 to $34,999 | 0 (0.0%) | 0 (0.0%) |
| $35,000 to $49,999 | 14 (6.9%) | 15 (25.0%) |
| $50,000 to $74,999 | 17 (8.4%) | 11 (18.3%) |
| $75,000 to $99,999 | 2 (1.0%) | 10 (16.7%) |
| $100,000 to $149,999 | 7 (3.5%) | 9 (15.0%) |
| $150,000 or more | 0 (0.0%) | 9 (15.0%) |
| Total | 203 (100.0%) | 60 (100.0%) |
Property Value to Household Income Ratio in Mooringsport
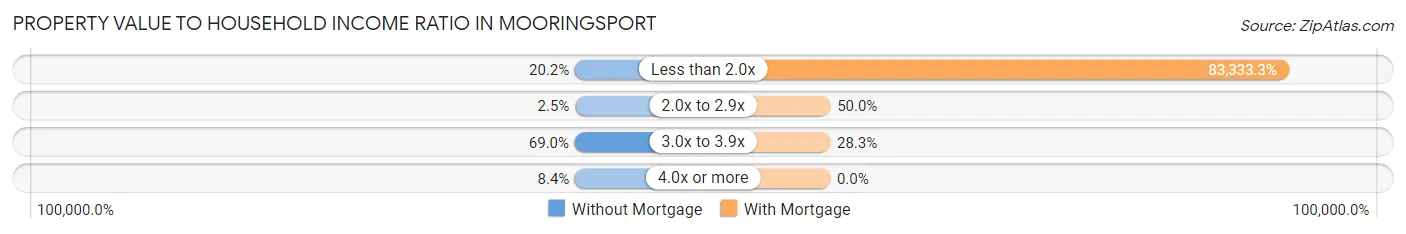
| Value-to-Income Ratio | Without Mortgage | With Mortgage |
| Less than 2.0x | 41 (20.2%) | 50,000 (83,333.3%) |
| 2.0x to 2.9x | 5 (2.5%) | 30 (50.0%) |
| 3.0x to 3.9x | 140 (69.0%) | 17 (28.3%) |
| 4.0x or more | 17 (8.4%) | 0 (0.0%) |
| Total | 203 (100.0%) | 60 (100.0%) |
Real Estate Taxes by Mortgage Status in Mooringsport
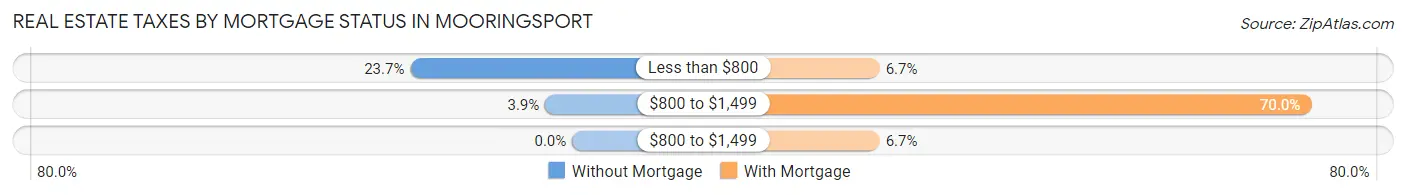
| Property Taxes | Without Mortgage | With Mortgage |
| Less than $800 | 48 (23.6%) | 4 (6.7%) |
| $800 to $1,499 | 8 (3.9%) | 42 (70.0%) |
| $800 to $1,499 | 0 (0.0%) | 4 (6.7%) |
| Total | 203 (100.0%) | 60 (100.0%) |
Health & Disability in Mooringsport
Health Insurance Coverage by Age in Mooringsport
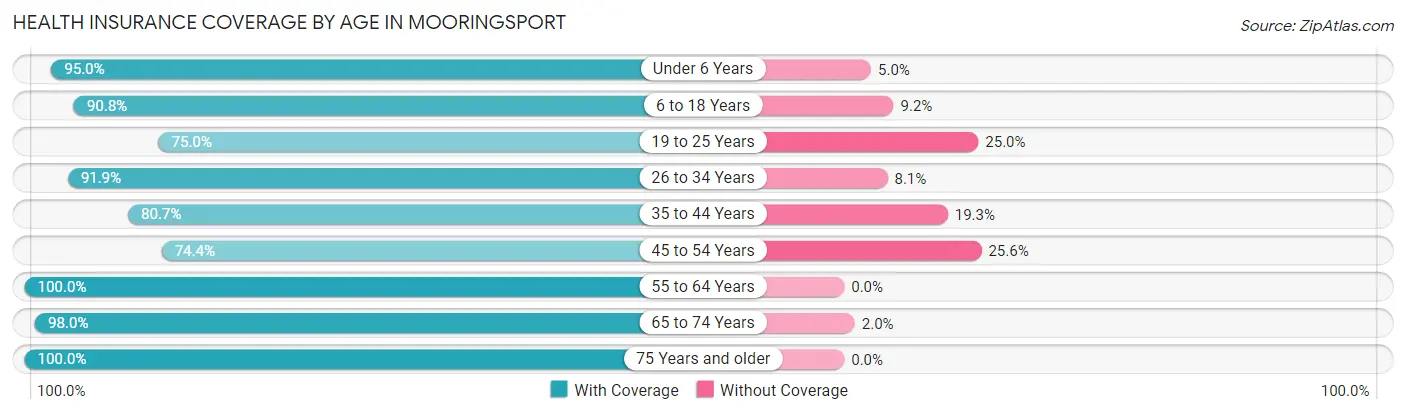
| Age Bracket | With Coverage | Without Coverage |
| Under 6 Years | 38 (95.0%) | 2 (5.0%) |
| 6 to 18 Years | 79 (90.8%) | 8 (9.2%) |
| 19 to 25 Years | 24 (75.0%) | 8 (25.0%) |
| 26 to 34 Years | 57 (91.9%) | 5 (8.1%) |
| 35 to 44 Years | 46 (80.7%) | 11 (19.3%) |
| 45 to 54 Years | 32 (74.4%) | 11 (25.6%) |
| 55 to 64 Years | 76 (100.0%) | 0 (0.0%) |
| 65 to 74 Years | 50 (98.0%) | 1 (2.0%) |
| 75 Years and older | 148 (100.0%) | 0 (0.0%) |
| Total | 550 (92.3%) | 46 (7.7%) |
Health Insurance Coverage by Citizenship Status in Mooringsport
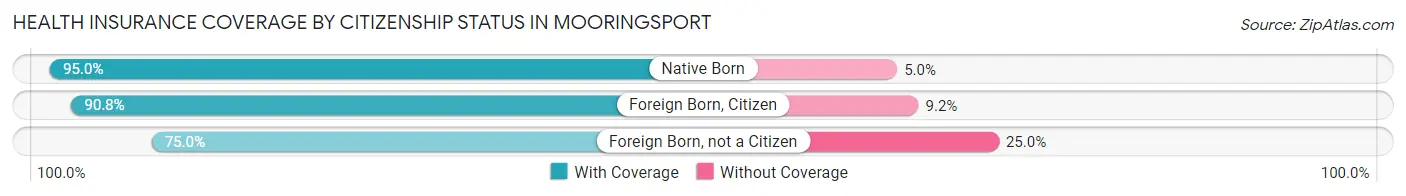
| Citizenship Status | With Coverage | Without Coverage |
| Native Born | 38 (95.0%) | 2 (5.0%) |
| Foreign Born, Citizen | 79 (90.8%) | 8 (9.2%) |
| Foreign Born, not a Citizen | 24 (75.0%) | 8 (25.0%) |
Health Insurance Coverage by Household Income in Mooringsport
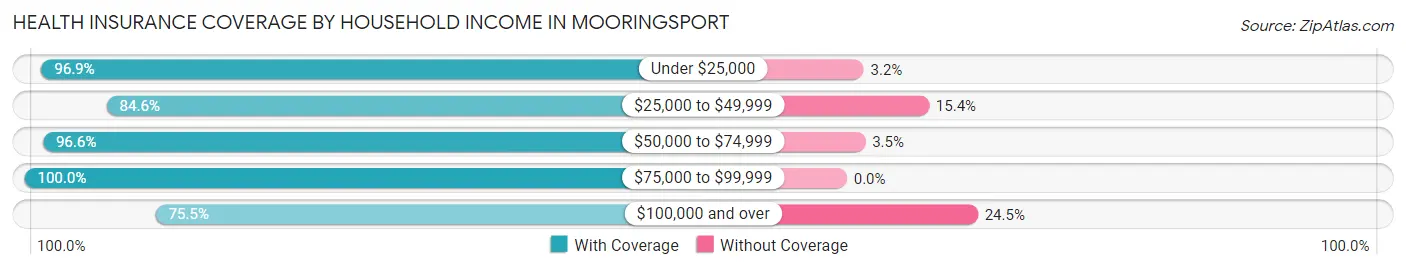
| Household Income | With Coverage | Without Coverage |
| Under $25,000 | 246 (96.9%) | 8 (3.2%) |
| $25,000 to $49,999 | 121 (84.6%) | 22 (15.4%) |
| $50,000 to $74,999 | 84 (96.6%) | 3 (3.5%) |
| $75,000 to $99,999 | 59 (100.0%) | 0 (0.0%) |
| $100,000 and over | 40 (75.5%) | 13 (24.5%) |
Public vs Private Health Insurance Coverage by Age in Mooringsport
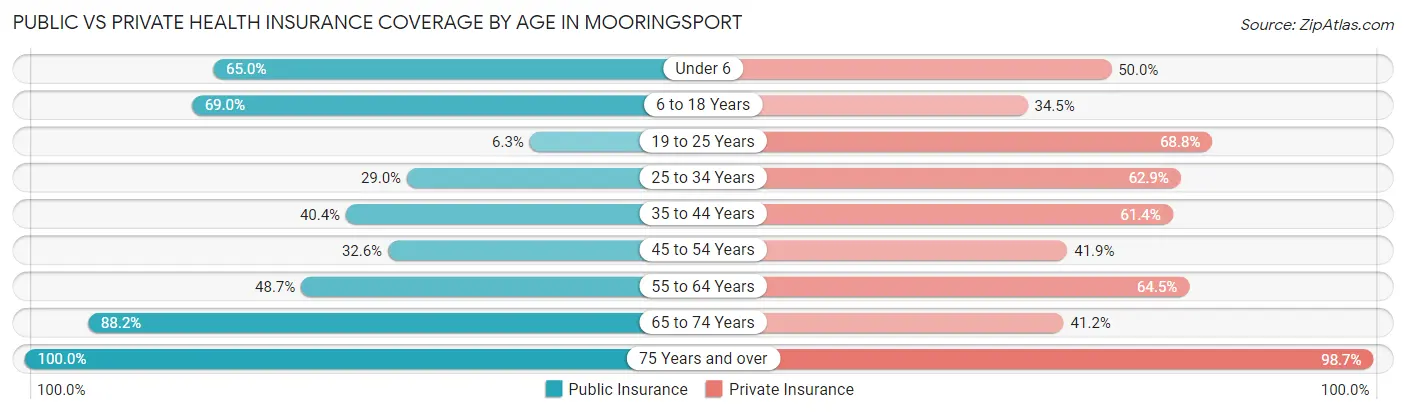
| Age Bracket | Public Insurance | Private Insurance |
| Under 6 | 26 (65.0%) | 20 (50.0%) |
| 6 to 18 Years | 60 (69.0%) | 30 (34.5%) |
| 19 to 25 Years | 2 (6.2%) | 22 (68.8%) |
| 25 to 34 Years | 18 (29.0%) | 39 (62.9%) |
| 35 to 44 Years | 23 (40.4%) | 35 (61.4%) |
| 45 to 54 Years | 14 (32.6%) | 18 (41.9%) |
| 55 to 64 Years | 37 (48.7%) | 49 (64.5%) |
| 65 to 74 Years | 45 (88.2%) | 21 (41.2%) |
| 75 Years and over | 148 (100.0%) | 146 (98.7%) |
| Total | 373 (62.6%) | 380 (63.8%) |
Disability Status by Sex by Age in Mooringsport
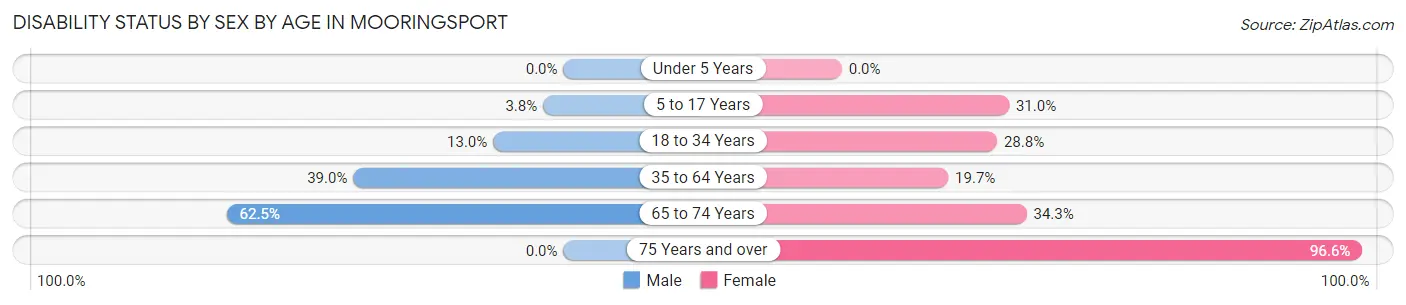
| Age Bracket | Male | Female |
| Under 5 Years | 0 (0.0%) | 0 (0.0%) |
| 5 to 17 Years | 2 (3.8%) | 9 (31.0%) |
| 18 to 34 Years | 6 (13.0%) | 17 (28.8%) |
| 35 to 64 Years | 39 (39.0%) | 15 (19.7%) |
| 65 to 74 Years | 10 (62.5%) | 12 (34.3%) |
| 75 Years and over | 0 (0.0%) | 141 (96.6%) |
Disability Class by Sex by Age in Mooringsport
Disability Class: Hearing Difficulty
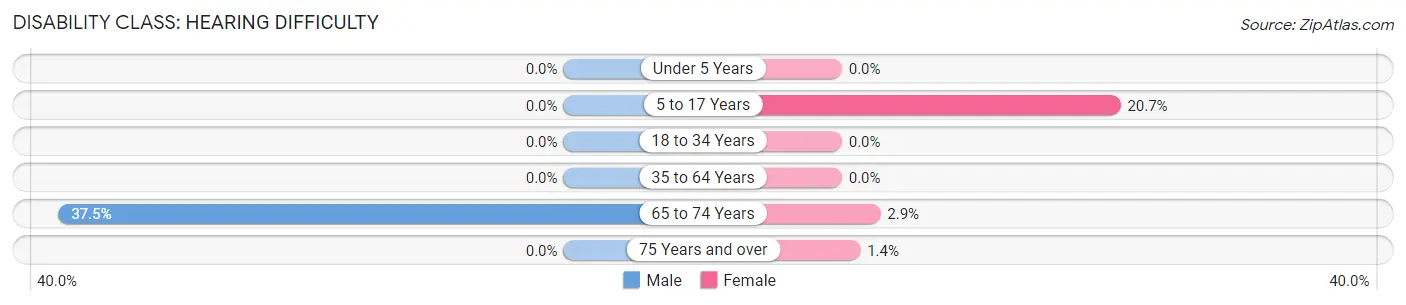
| Age Bracket | Male | Female |
| Under 5 Years | 0 (0.0%) | 0 (0.0%) |
| 5 to 17 Years | 0 (0.0%) | 6 (20.7%) |
| 18 to 34 Years | 0 (0.0%) | 0 (0.0%) |
| 35 to 64 Years | 0 (0.0%) | 0 (0.0%) |
| 65 to 74 Years | 6 (37.5%) | 1 (2.9%) |
| 75 Years and over | 0 (0.0%) | 2 (1.4%) |
Disability Class: Vision Difficulty
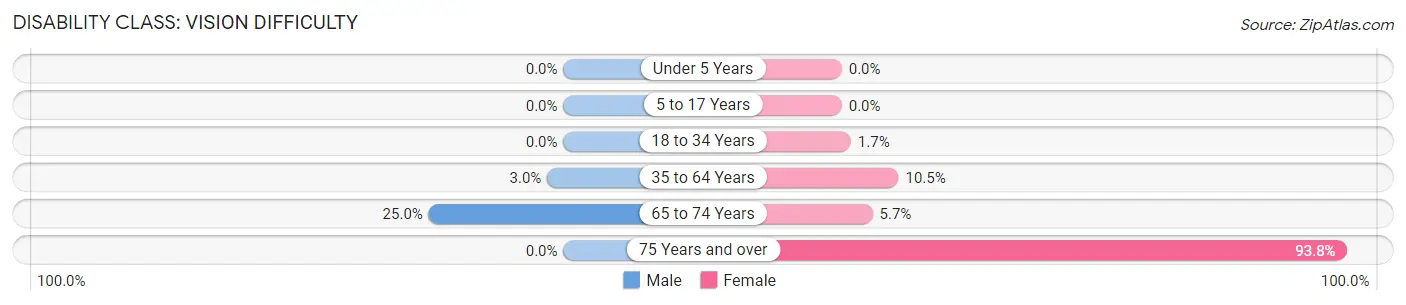
| Age Bracket | Male | Female |
| Under 5 Years | 0 (0.0%) | 0 (0.0%) |
| 5 to 17 Years | 0 (0.0%) | 0 (0.0%) |
| 18 to 34 Years | 0 (0.0%) | 1 (1.7%) |
| 35 to 64 Years | 3 (3.0%) | 8 (10.5%) |
| 65 to 74 Years | 4 (25.0%) | 2 (5.7%) |
| 75 Years and over | 0 (0.0%) | 137 (93.8%) |
Disability Class: Cognitive Difficulty
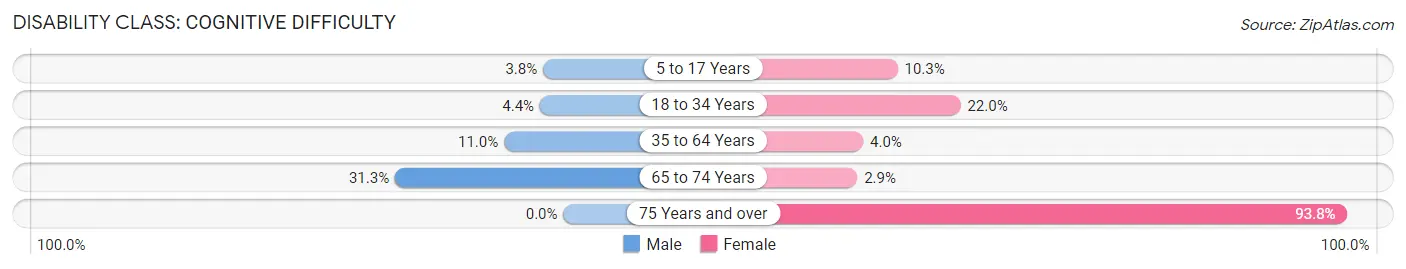
| Age Bracket | Male | Female |
| 5 to 17 Years | 2 (3.8%) | 3 (10.3%) |
| 18 to 34 Years | 2 (4.3%) | 13 (22.0%) |
| 35 to 64 Years | 11 (11.0%) | 3 (4.0%) |
| 65 to 74 Years | 5 (31.2%) | 1 (2.9%) |
| 75 Years and over | 0 (0.0%) | 137 (93.8%) |
Disability Class: Ambulatory Difficulty
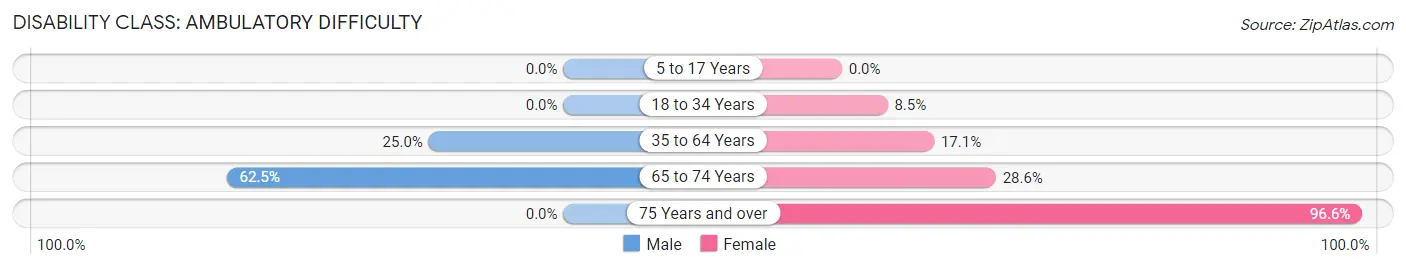
| Age Bracket | Male | Female |
| 5 to 17 Years | 0 (0.0%) | 0 (0.0%) |
| 18 to 34 Years | 0 (0.0%) | 5 (8.5%) |
| 35 to 64 Years | 25 (25.0%) | 13 (17.1%) |
| 65 to 74 Years | 10 (62.5%) | 10 (28.6%) |
| 75 Years and over | 0 (0.0%) | 141 (96.6%) |
Disability Class: Self-Care Difficulty
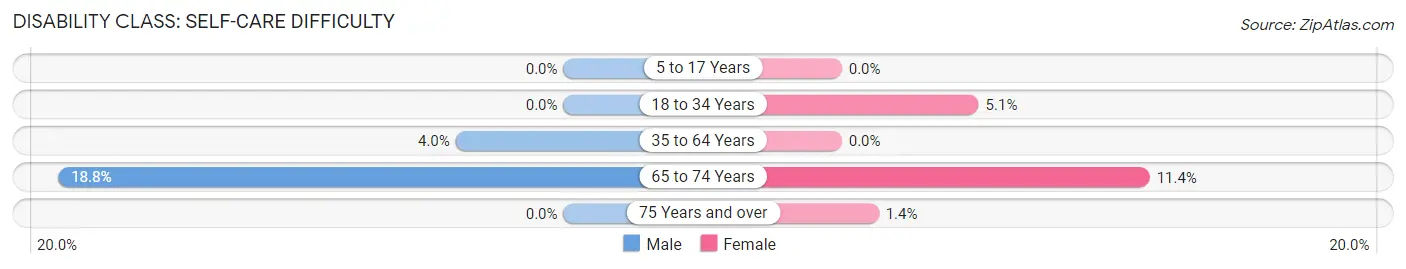
| Age Bracket | Male | Female |
| 5 to 17 Years | 0 (0.0%) | 0 (0.0%) |
| 18 to 34 Years | 0 (0.0%) | 3 (5.1%) |
| 35 to 64 Years | 4 (4.0%) | 0 (0.0%) |
| 65 to 74 Years | 3 (18.8%) | 4 (11.4%) |
| 75 Years and over | 0 (0.0%) | 2 (1.4%) |
Technology Access in Mooringsport
Computing Device Access in Mooringsport
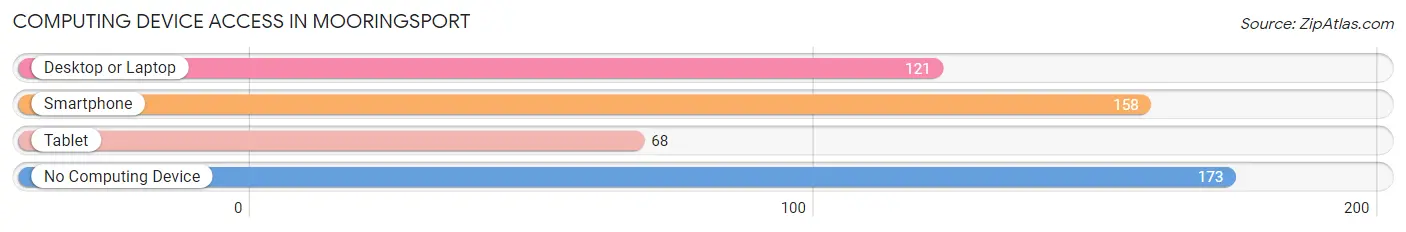
| Device Type | # Households | % Households |
| Desktop or Laptop | 121 | 36.1% |
| Smartphone | 158 | 47.2% |
| Tablet | 68 | 20.3% |
| No Computing Device | 173 | 51.6% |
| Total | 335 | 100.0% |
Internet Access in Mooringsport
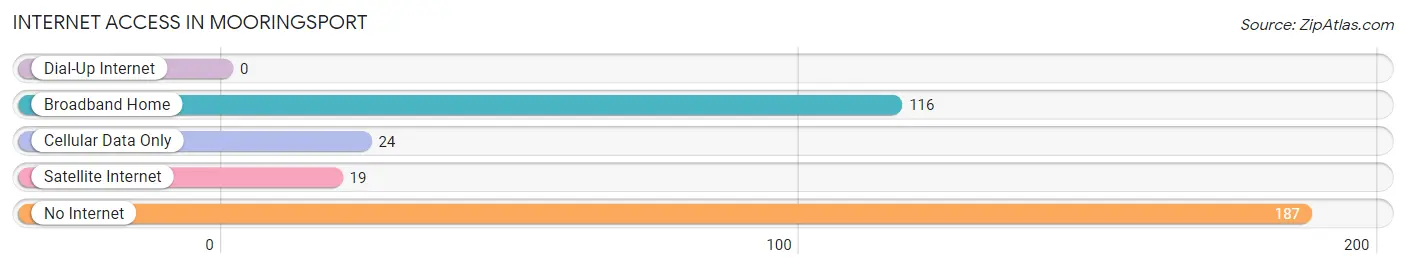
| Internet Type | # Households | % Households |
| Dial-Up Internet | 0 | 0.0% |
| Broadband Home | 116 | 34.6% |
| Cellular Data Only | 24 | 7.2% |
| Satellite Internet | 19 | 5.7% |
| No Internet | 187 | 55.8% |
| Total | 335 | 100.0% |
Mooringsport Summary
Mooringsport is a small town located in Caddo Parish, Louisiana, United States. It is situated on the banks of the Red River, approximately 20 miles northwest of Shreveport. The town has a population of approximately 1,000 people and is part of the Shreveport-Bossier City metropolitan area.
History
Mooringsport was founded in 1845 by a group of settlers from the nearby town of Grand Ecore. The town was named after the nearby Mooringsport Landing, which was a popular spot for steamboats to dock. The town was incorporated in 1876 and was home to a variety of businesses, including a cotton gin, a sawmill, and a gristmill.
In the late 19th century, Mooringsport was a popular destination for steamboat travel. The town was also home to a number of saloons and gambling halls, which attracted visitors from all over the region.
In the early 20th century, Mooringsport experienced a period of growth and prosperity. The town was home to a number of businesses, including a bank, a hotel, a movie theater, and a variety of stores.
Geography
Mooringsport is located in Caddo Parish, Louisiana, approximately 20 miles northwest of Shreveport. The town is situated on the banks of the Red River and is surrounded by a number of small lakes and ponds. The town is located in a rural area and is surrounded by farmland and wooded areas.
Economy
Mooringsport’s economy is largely based on agriculture and tourism. The town is home to a number of farms, which produce a variety of crops, including cotton, corn, soybeans, and wheat. The town is also home to a number of tourist attractions, including the Red River National Wildlife Refuge and the Caddo Lake State Park.
Demographics
As of the 2010 census, Mooringsport had a population of 1,000 people. The town is predominantly white, with approximately 85% of the population identifying as white. The remaining 15% of the population is made up of African Americans, Hispanics, and other ethnicities. The median household income in Mooringsport is $37,000, and the median home value is $90,000.
Conclusion
Mooringsport is a small town located in Caddo Parish, Louisiana, United States. It is situated on the banks of the Red River, approximately 20 miles northwest of Shreveport. The town has a population of approximately 1,000 people and is part of the Shreveport-Bossier City metropolitan area. The town’s economy is largely based on agriculture and tourism, and the town is home to a number of tourist attractions, including the Red River National Wildlife Refuge and the Caddo Lake State Park. The town is predominantly white, with approximately 85% of the population identifying as white. The median household income in Mooringsport is $37,000, and the median home value is $90,000.
Common Questions
What is Per Capita Income in Mooringsport?
Per Capita income in Mooringsport is $19,854.
What is the Median Family Income in Mooringsport?
Median Family Income in Mooringsport is $58,750.
What is the Median Household income in Mooringsport?
Median Household Income in Mooringsport is $19,461.
What is Income or Wage Gap in Mooringsport?
Income or Wage Gap in Mooringsport is 32.5%.
Women in Mooringsport earn 67.5 cents for every dollar earned by a man.
What is Inequality or Gini Index in Mooringsport?
Inequality or Gini Index in Mooringsport is 0.43.
What is the Total Population of Mooringsport?
Total Population of Mooringsport is 596.
What is the Total Male Population of Mooringsport?
Total Male Population of Mooringsport is 237.
What is the Total Female Population of Mooringsport?
Total Female Population of Mooringsport is 359.
What is the Ratio of Males per 100 Females in Mooringsport?
There are 66.02 Males per 100 Females in Mooringsport.
What is the Ratio of Females per 100 Males in Mooringsport?
There are 151.48 Females per 100 Males in Mooringsport.
What is the Median Population Age in Mooringsport?
Median Population Age in Mooringsport is 49.4 Years.
What is the Average Family Size in Mooringsport
Average Family Size in Mooringsport is 3.5 People.
What is the Average Household Size in Mooringsport
Average Household Size in Mooringsport is 1.8 People.
How Large is the Labor Force in Mooringsport?
There are 185 People in the Labor Forcein in Mooringsport.
What is the Percentage of People in the Labor Force in Mooringsport?
36.8% of People are in the Labor Force in Mooringsport.
What is the Unemployment Rate in Mooringsport?
Unemployment Rate in Mooringsport is 8.6%.