Monterey, LA Map & Demographics
Monterey Map
Monterey Overview
$53,279
PER CAPITA INCOME
0.54
INEQUALITY / GINI INDEX
238
TOTAL POPULATION
109
MALE POPULATION
129
FEMALE POPULATION
84.50
MALES / 100 FEMALES
118.35
FEMALES / 100 MALES
50.0
MEDIAN AGE
2.9
AVG FAMILY SIZE
2.0
AVG HOUSEHOLD SIZE
55
LABOR FORCE [ PEOPLE ]
25.2%
PERCENT IN LABOR FORCE
12.7%
UNEMPLOYMENT RATE
Monterey Zip Codes
Monterey Area Codes
Income in Monterey
Income Overview in Monterey
| Characteristic | Number | Measure |
| Per Capita Income | 238 | $53,279 |
| Median Family Income | 55 | $0 |
| Mean Family Income | 55 | $130,747 |
| Median Household Income | 117 | $0 |
| Mean Household Income | 117 | $98,014 |
| Income Deficit | 55 | $0 |
| Wage / Income Gap (%) | 238 | 0.00% |
| Wage / Income Gap ($) | 238 | 100.00¢ per $1 |
| Gini / Inequality Index | 238 | 0.54 |
Earnings by Sex in Monterey
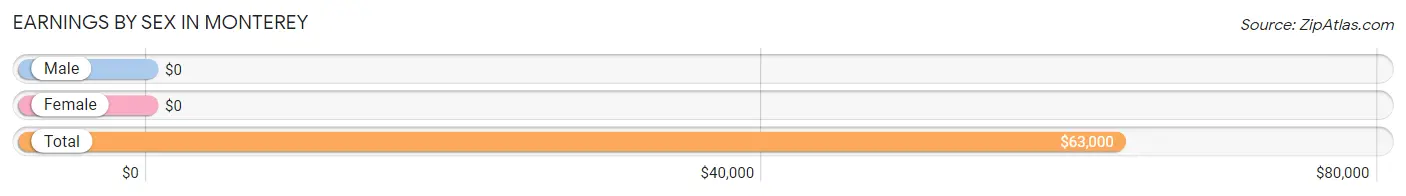
| Sex | Number | Average Earnings |
| Male | 42 (65.6%) | $0 |
| Female | 22 (34.4%) | $0 |
| Total | 64 (100.0%) | $63,000 |
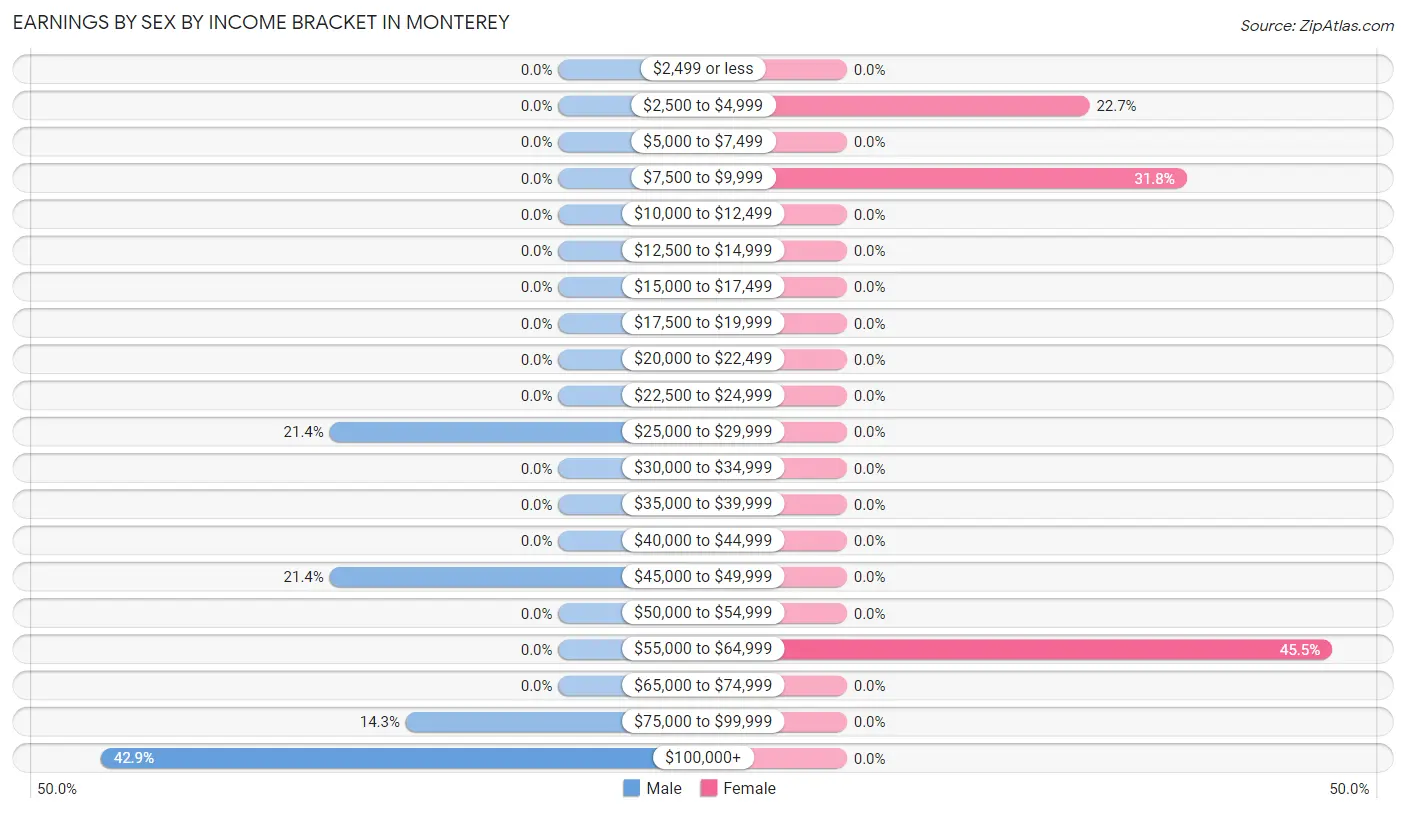
Earnings by Sex by Income Bracket in Monterey
The most common earnings brackets in Monterey are $100,000+ for men (18 | 42.9%) and $55,000 to $64,999 for women (10 | 45.5%).
| Income | Male | Female |
| $2,499 or less | 0 (0.0%) | 0 (0.0%) |
| $2,500 to $4,999 | 0 (0.0%) | 5 (22.7%) |
| $5,000 to $7,499 | 0 (0.0%) | 0 (0.0%) |
| $7,500 to $9,999 | 0 (0.0%) | 7 (31.8%) |
| $10,000 to $12,499 | 0 (0.0%) | 0 (0.0%) |
| $12,500 to $14,999 | 0 (0.0%) | 0 (0.0%) |
| $15,000 to $17,499 | 0 (0.0%) | 0 (0.0%) |
| $17,500 to $19,999 | 0 (0.0%) | 0 (0.0%) |
| $20,000 to $22,499 | 0 (0.0%) | 0 (0.0%) |
| $22,500 to $24,999 | 0 (0.0%) | 0 (0.0%) |
| $25,000 to $29,999 | 9 (21.4%) | 0 (0.0%) |
| $30,000 to $34,999 | 0 (0.0%) | 0 (0.0%) |
| $35,000 to $39,999 | 0 (0.0%) | 0 (0.0%) |
| $40,000 to $44,999 | 0 (0.0%) | 0 (0.0%) |
| $45,000 to $49,999 | 9 (21.4%) | 0 (0.0%) |
| $50,000 to $54,999 | 0 (0.0%) | 0 (0.0%) |
| $55,000 to $64,999 | 0 (0.0%) | 10 (45.5%) |
| $65,000 to $74,999 | 0 (0.0%) | 0 (0.0%) |
| $75,000 to $99,999 | 6 (14.3%) | 0 (0.0%) |
| $100,000+ | 18 (42.9%) | 0 (0.0%) |
| Total | 42 (100.0%) | 22 (100.0%) |
Earnings by Sex by Educational Attainment in Monterey
| Educational Attainment | Male Income | Female Income |
| Less than High School | - | - |
| High School Diploma | - | - |
| College or Associate's Degree | - | - |
| Bachelor's Degree | - | - |
| Graduate Degree | - | - |
| Total | $176,125 | $0 |
Family Income in Monterey
Family Income Brackets in Monterey
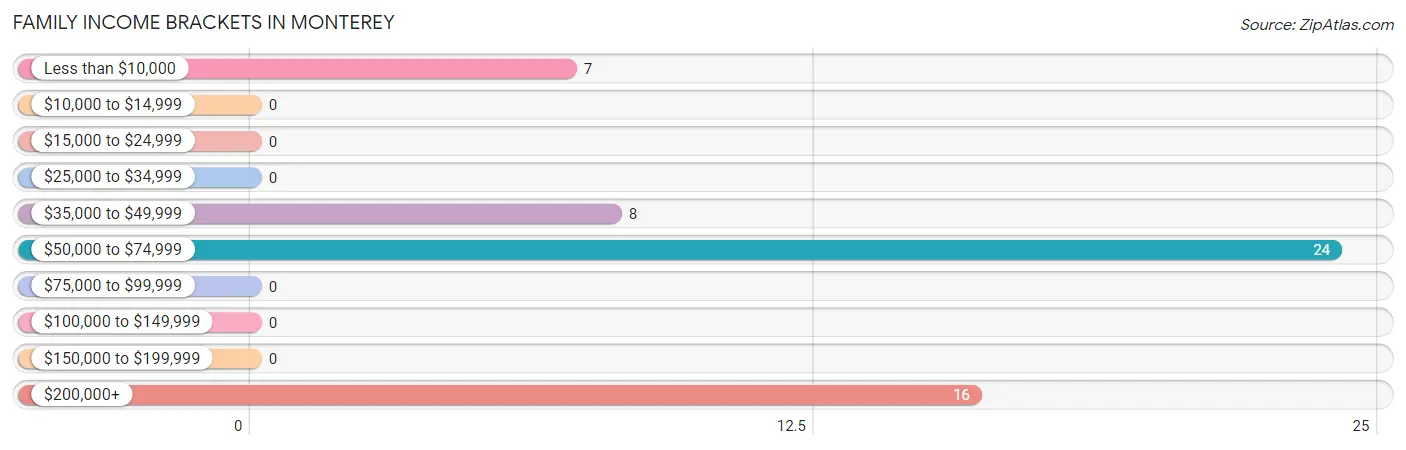
According to the Monterey family income data, there are 24 families falling into the $50,000 to $74,999 income range, which is the most common income bracket and makes up 43.6% of all families.
| Income Bracket | # Families | % Families |
| Less than $10,000 | 7 | 12.7% |
| $10,000 to $14,999 | 0 | 0.0% |
| $15,000 to $24,999 | 0 | 0.0% |
| $25,000 to $34,999 | 0 | 0.0% |
| $35,000 to $49,999 | 8 | 14.5% |
| $50,000 to $74,999 | 24 | 43.6% |
| $75,000 to $99,999 | 0 | 0.0% |
| $100,000 to $149,999 | 0 | 0.0% |
| $150,000 to $199,999 | 0 | 0.0% |
| $200,000+ | 16 | 29.1% |
Family Income by Famaliy Size in Monterey
| Income Bracket | # Families | Median Income |
| 2-Person Families | 42 (76.4%) | $0 |
| 3-Person Families | 0 (0.0%) | $0 |
| 4-Person Families | 0 (0.0%) | $0 |
| 5-Person Families | 6 (10.9%) | $0 |
| 6-Person Families | 0 (0.0%) | $0 |
| 7+ Person Families | 7 (12.7%) | $0 |
| Total | 55 (100.0%) | $0 |
Family Income by Number of Earners in Monterey
| Number of Earners | # Families | Median Income |
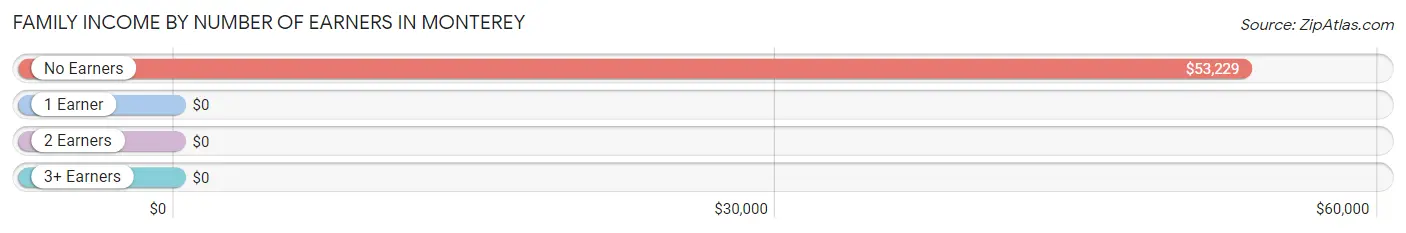
| No Earners | 34 (61.8%) | $53,229 |
| 1 Earner | 5 (9.1%) | $0 |
| 2 Earners | 10 (18.2%) | $0 |
| 3+ Earners | 6 (10.9%) | $0 |
| Total | 55 (100.0%) | $0 |
Household Income in Monterey
Household Income Brackets in Monterey
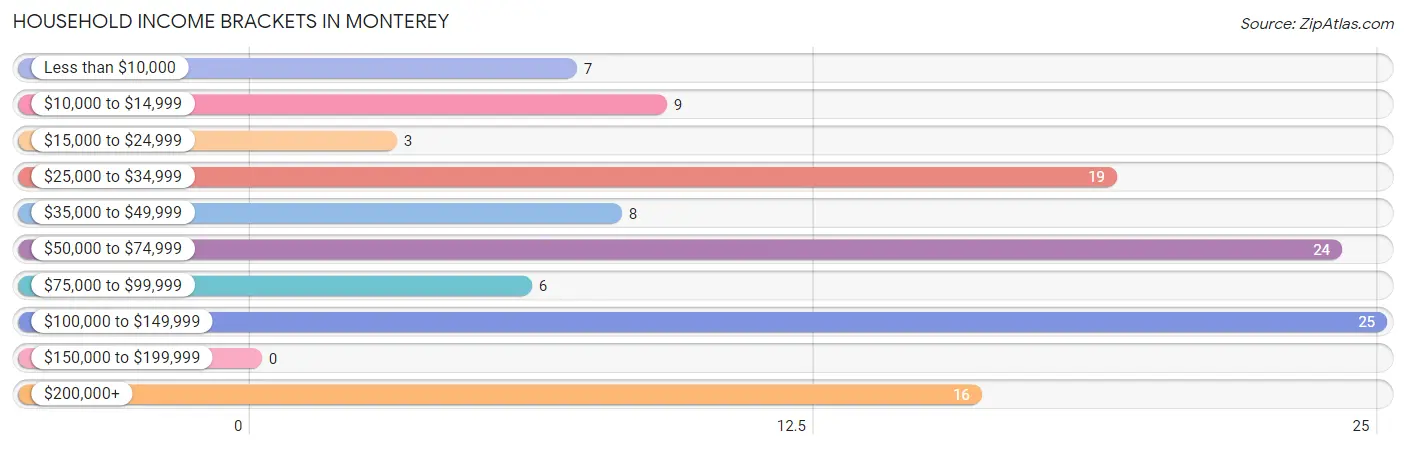
With 25 households falling in the category, the $100,000 to $149,999 income range is the most frequent in Monterey, accounting for 21.4% of all households.
| Income Bracket | # Households | % Households |
| Less than $10,000 | 7 | 6.0% |
| $10,000 to $14,999 | 9 | 7.7% |
| $15,000 to $24,999 | 3 | 2.6% |
| $25,000 to $34,999 | 19 | 16.2% |
| $35,000 to $49,999 | 8 | 6.8% |
| $50,000 to $74,999 | 24 | 20.5% |
| $75,000 to $99,999 | 6 | 5.1% |
| $100,000 to $149,999 | 25 | 21.4% |
| $150,000 to $199,999 | 0 | 0.0% |
| $200,000+ | 16 | 13.7% |
Household Income by Householder Age in Monterey
The median household income in Monterey is $0, with the highest median household income of $26,484 found in the 65+ years age bracket for the primary householder. A total of 25 households (21.4%) fall into this category. Meanwhile, the 15 to 24 years age bracket for the primary householder has the lowest median household income of $0, with 6 households (5.1%) in this group.
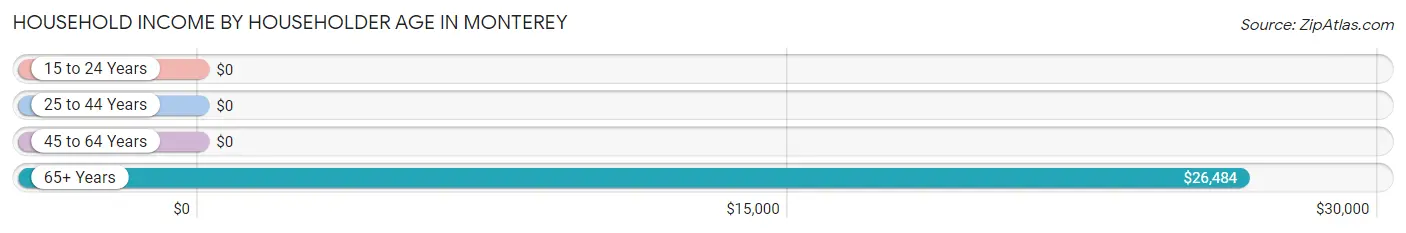
| Income Bracket | # Households | Median Income |
| 15 to 24 Years | 6 (5.1%) | $0 |
| 25 to 44 Years | 17 (14.5%) | $0 |
| 45 to 64 Years | 69 (59.0%) | $0 |
| 65+ Years | 25 (21.4%) | $26,484 |
| Total | 117 (100.0%) | $0 |
Poverty in Monterey
Income Below Poverty by Sex and Age in Monterey
With 8.3% poverty level for males and 34.9% for females among the residents of Monterey, under 5 year old males and under 5 year old females are the most vulnerable to poverty, with 9 males (100.0%) and 2 females (100.0%) in their respective age groups living below the poverty level.
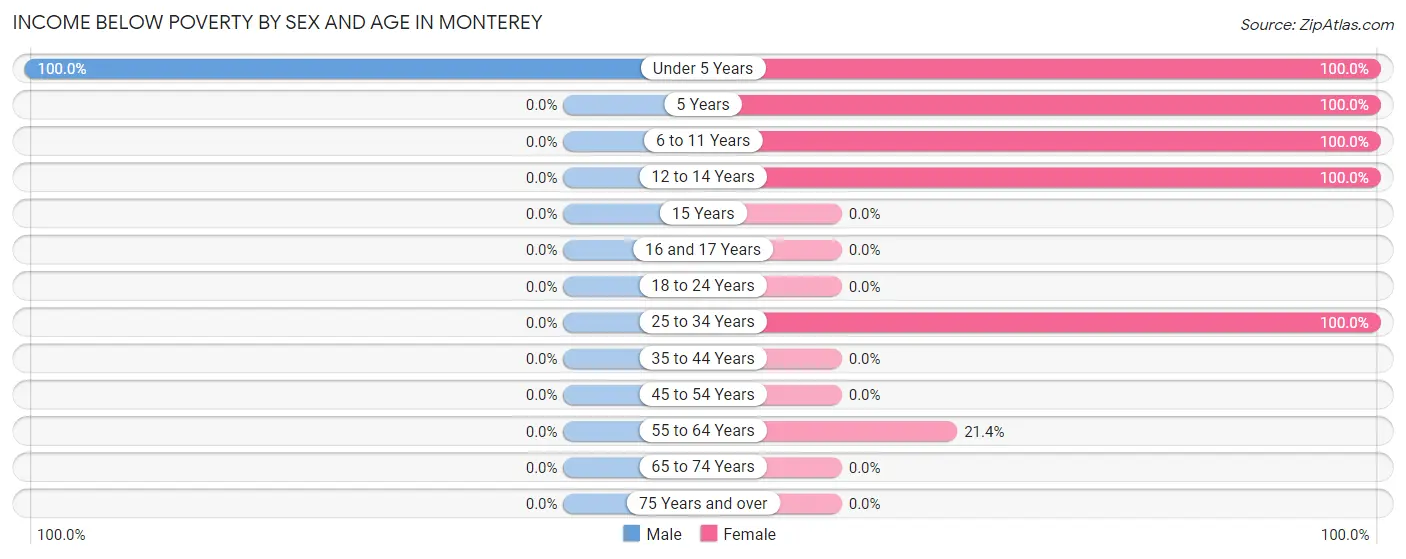
| Age Bracket | Male | Female |
| Under 5 Years | 9 (100.0%) | 2 (100.0%) |
| 5 Years | 0 (0.0%) | 3 (100.0%) |
| 6 to 11 Years | 0 (0.0%) | 3 (100.0%) |
| 12 to 14 Years | 0 (0.0%) | 3 (100.0%) |
| 15 Years | 0 (0.0%) | 0 (0.0%) |
| 16 and 17 Years | 0 (0.0%) | 0 (0.0%) |
| 18 to 24 Years | 0 (0.0%) | 0 (0.0%) |
| 25 to 34 Years | 0 (0.0%) | 25 (100.0%) |
| 35 to 44 Years | 0 (0.0%) | 0 (0.0%) |
| 45 to 54 Years | 0 (0.0%) | 0 (0.0%) |
| 55 to 64 Years | 0 (0.0%) | 9 (21.4%) |
| 65 to 74 Years | 0 (0.0%) | 0 (0.0%) |
| 75 Years and over | 0 (0.0%) | 0 (0.0%) |
| Total | 9 (8.3%) | 45 (34.9%) |
Income Above Poverty by Sex and Age in Monterey
According to the poverty statistics in Monterey, males aged 18 to 24 years and females aged 18 to 24 years are the age groups that are most secure financially, with 100.0% of males and 100.0% of females in these age groups living above the poverty line.
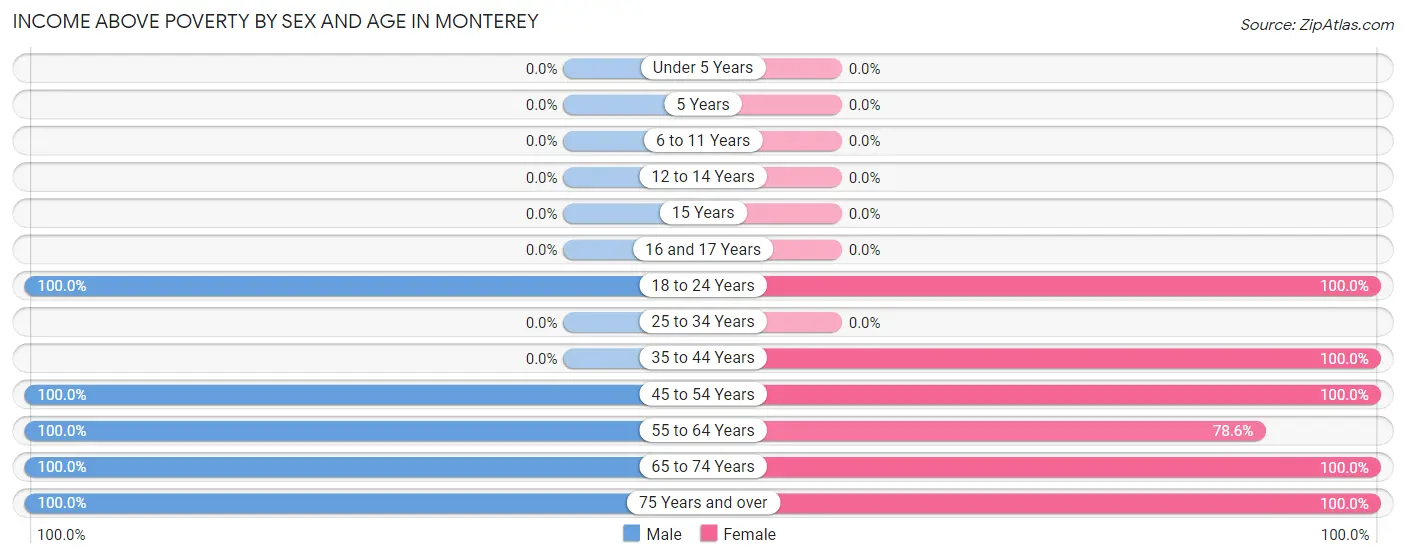
| Age Bracket | Male | Female |
| Under 5 Years | 0 (0.0%) | 0 (0.0%) |
| 5 Years | 0 (0.0%) | 0 (0.0%) |
| 6 to 11 Years | 0 (0.0%) | 0 (0.0%) |
| 12 to 14 Years | 0 (0.0%) | 0 (0.0%) |
| 15 Years | 0 (0.0%) | 0 (0.0%) |
| 16 and 17 Years | 0 (0.0%) | 0 (0.0%) |
| 18 to 24 Years | 25 (100.0%) | 7 (100.0%) |
| 25 to 34 Years | 0 (0.0%) | 0 (0.0%) |
| 35 to 44 Years | 0 (0.0%) | 10 (100.0%) |
| 45 to 54 Years | 34 (100.0%) | 6 (100.0%) |
| 55 to 64 Years | 33 (100.0%) | 33 (78.6%) |
| 65 to 74 Years | 5 (100.0%) | 22 (100.0%) |
| 75 Years and over | 3 (100.0%) | 6 (100.0%) |
| Total | 100 (91.7%) | 84 (65.1%) |
Income Below Poverty Among Married-Couple Families in Monterey
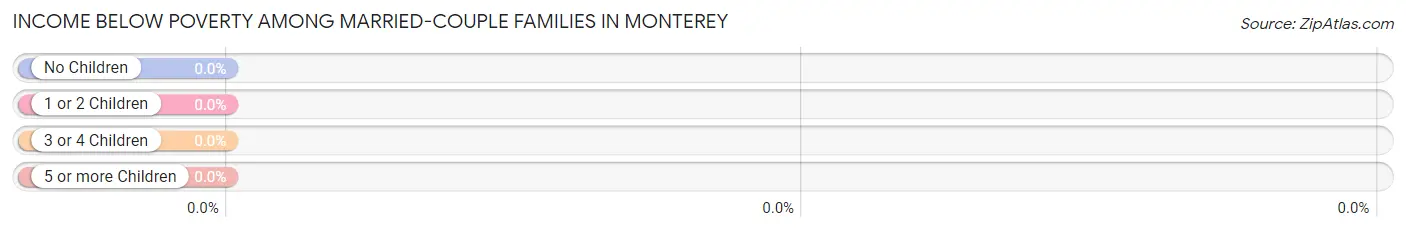
| Children | Above Poverty | Below Poverty |
| No Children | 43 (100.0%) | 0 (0.0%) |
| 1 or 2 Children | 0 (0.0%) | 0 (0.0%) |
| 3 or 4 Children | 0 (0.0%) | 0 (0.0%) |
| 5 or more Children | 0 (0.0%) | 0 (0.0%) |
| Total | 43 (100.0%) | 0 (0.0%) |
Income Below Poverty Among Single-Parent Households in Monterey
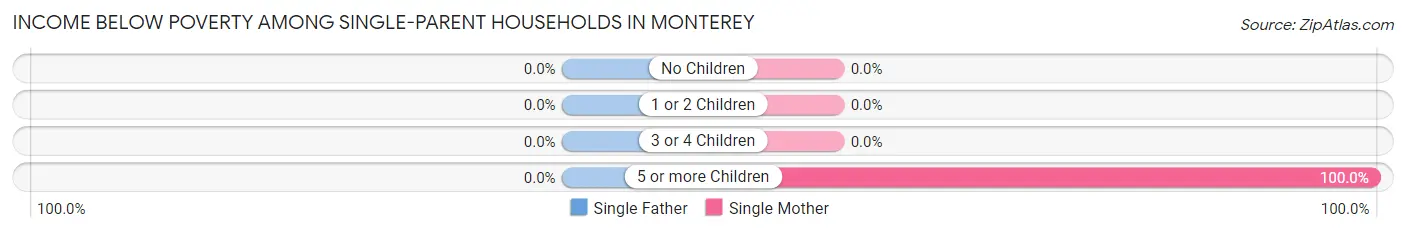
| Children | Single Father | Single Mother |
| No Children | 0 (0.0%) | 0 (0.0%) |
| 1 or 2 Children | 0 (0.0%) | 0 (0.0%) |
| 3 or 4 Children | 0 (0.0%) | 0 (0.0%) |
| 5 or more Children | 0 (0.0%) | 7 (100.0%) |
| Total | 0 (0.0%) | 7 (58.3%) |
Income Below Poverty Among Married-Couple vs Single-Parent Households in Monterey
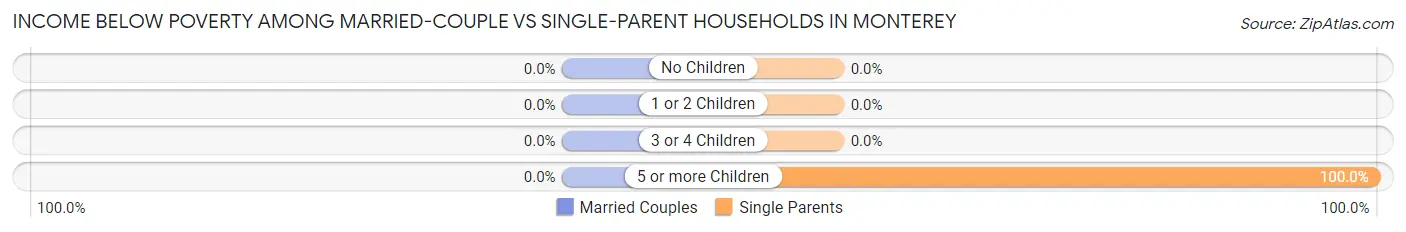
| Children | Married-Couple Families | Single-Parent Households |
| No Children | 0 (0.0%) | 0 (0.0%) |
| 1 or 2 Children | 0 (0.0%) | 0 (0.0%) |
| 3 or 4 Children | 0 (0.0%) | 0 (0.0%) |
| 5 or more Children | 0 (0.0%) | 7 (100.0%) |
| Total | 0 (0.0%) | 7 (58.3%) |
Race in Monterey
The most populous races in Monterey are White / Caucasian (222 | 93.3%), and Native / Alaskan (16 | 6.7%).
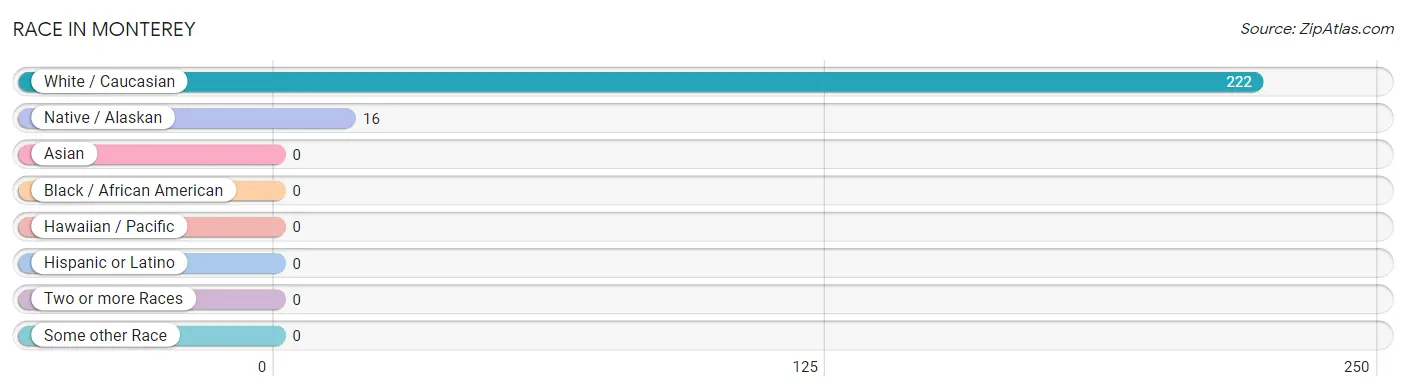
| Race | # Population | % Population |
| Asian | 0 | 0.0% |
| Black / African American | 0 | 0.0% |
| Hawaiian / Pacific | 0 | 0.0% |
| Hispanic or Latino | 0 | 0.0% |
| Native / Alaskan | 16 | 6.7% |
| White / Caucasian | 222 | 93.3% |
| Two or more Races | 0 | 0.0% |
| Some other Race | 0 | 0.0% |
| Total | 238 | 100.0% |
Ancestry in Monterey
The most populous ancestries reported in Monterey are American (69 | 29.0%), Sioux (16 | 6.7%), English (3 | 1.3%), and Irish (3 | 1.3%), together accounting for 38.2% of all Monterey residents.
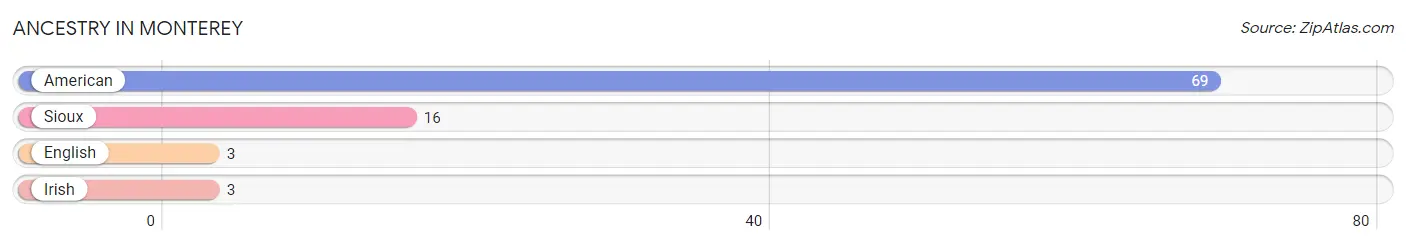
| Ancestry | # Population | % Population |
| American | 69 | 29.0% |
| English | 3 | 1.3% |
| Irish | 3 | 1.3% |
| Sioux | 16 | 6.7% | View All 4 Rows |
Immigrants in Monterey

| Immigration Origin | # Population | % Population | View All 0 Rows |
Sex and Age in Monterey
Sex and Age in Monterey
The most populous age groups in Monterey are 60 to 64 Years (33 | 30.3%) for men and 60 to 64 Years (33 | 25.6%) for women.
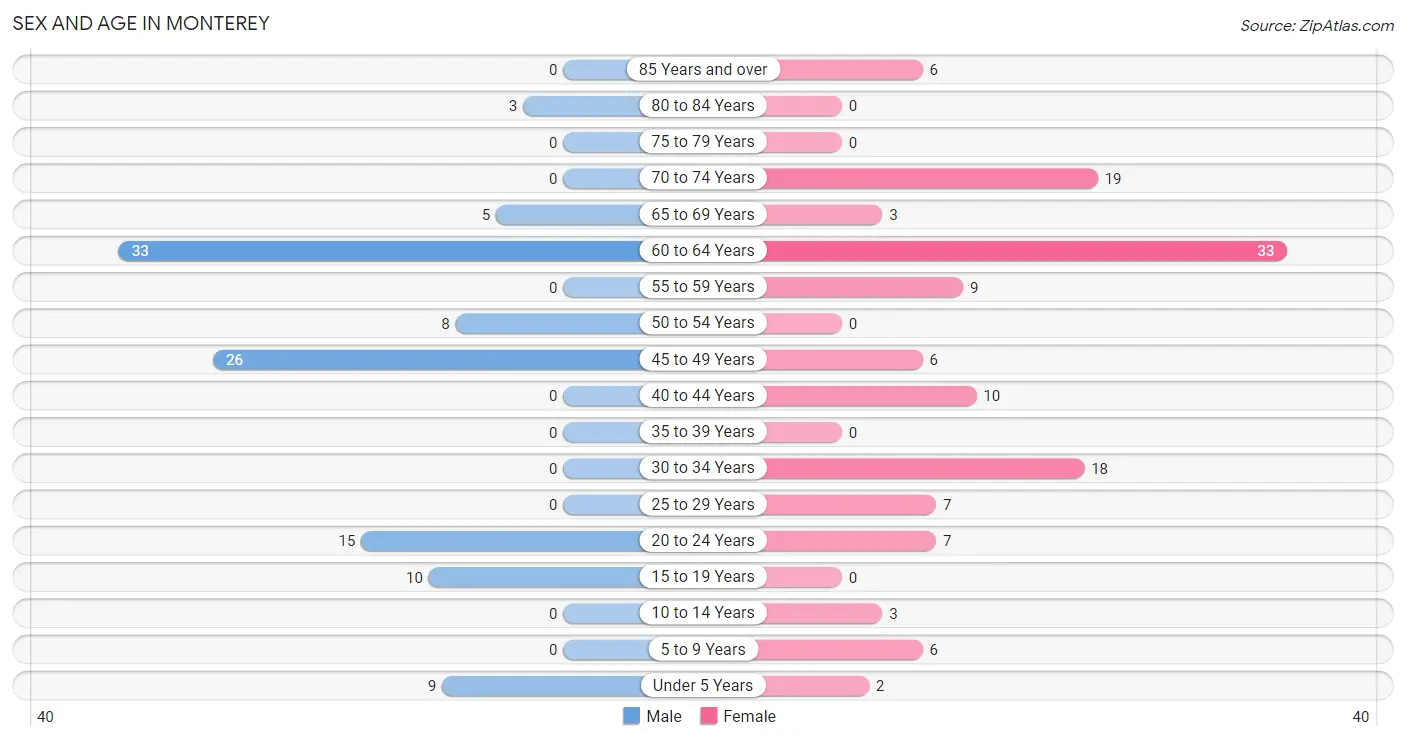
| Age Bracket | Male | Female |
| Under 5 Years | 9 (8.3%) | 2 (1.5%) |
| 5 to 9 Years | 0 (0.0%) | 6 (4.6%) |
| 10 to 14 Years | 0 (0.0%) | 3 (2.3%) |
| 15 to 19 Years | 10 (9.2%) | 0 (0.0%) |
| 20 to 24 Years | 15 (13.8%) | 7 (5.4%) |
| 25 to 29 Years | 0 (0.0%) | 7 (5.4%) |
| 30 to 34 Years | 0 (0.0%) | 18 (14.0%) |
| 35 to 39 Years | 0 (0.0%) | 0 (0.0%) |
| 40 to 44 Years | 0 (0.0%) | 10 (7.7%) |
| 45 to 49 Years | 26 (23.8%) | 6 (4.6%) |
| 50 to 54 Years | 8 (7.3%) | 0 (0.0%) |
| 55 to 59 Years | 0 (0.0%) | 9 (7.0%) |
| 60 to 64 Years | 33 (30.3%) | 33 (25.6%) |
| 65 to 69 Years | 5 (4.6%) | 3 (2.3%) |
| 70 to 74 Years | 0 (0.0%) | 19 (14.7%) |
| 75 to 79 Years | 0 (0.0%) | 0 (0.0%) |
| 80 to 84 Years | 3 (2.8%) | 0 (0.0%) |
| 85 Years and over | 0 (0.0%) | 6 (4.6%) |
| Total | 109 (100.0%) | 129 (100.0%) |
Families and Households in Monterey
Median Family Size in Monterey
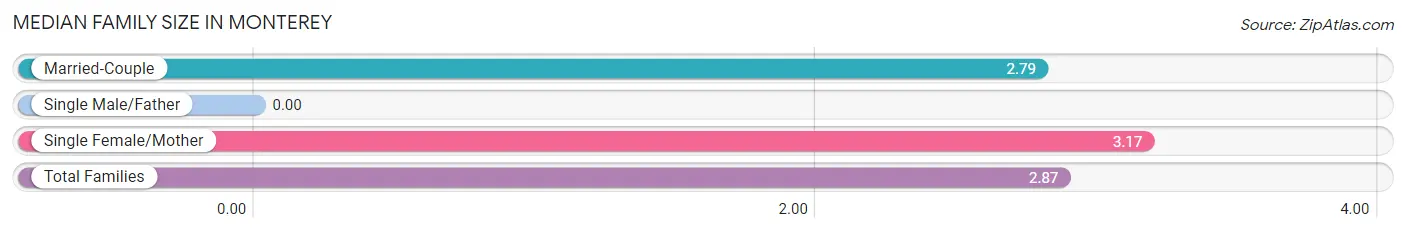
| Family Type | # Families | Family Size |
| Married-Couple | 43 (78.2%) | 2.79 |
| Single Male/Father | 0 (0.0%) | - |
| Single Female/Mother | 12 (21.8%) | 3.17 |
| Total Families | 55 (100.0%) | 2.87 |
Median Household Size in Monterey
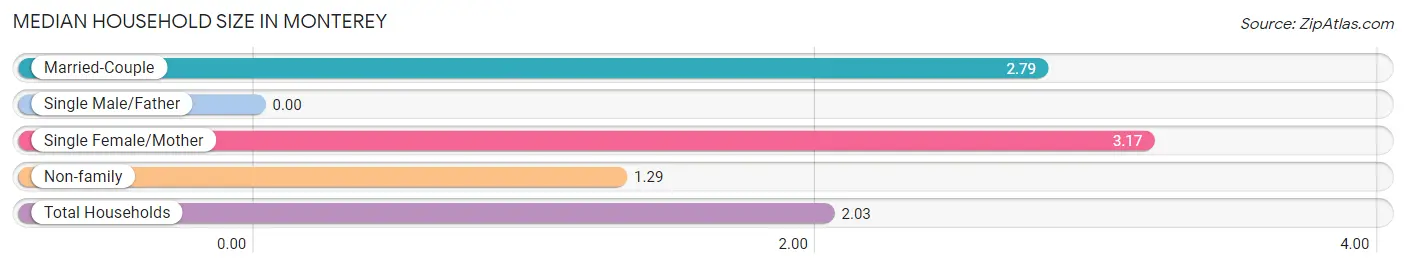
| Household Type | # Households | Household Size |
| Married-Couple | 43 (36.7%) | 2.79 |
| Single Male/Father | 0 (0.0%) | - |
| Single Female/Mother | 12 (10.3%) | 3.17 |
| Non-family | 62 (53.0%) | 1.29 |
| Total Households | 117 (100.0%) | 2.03 |
Household Size by Marriage Status in Monterey
Out of a total of 117 households in Monterey, 55 (47.0%) are family households, while 62 (53.0%) are nonfamily households. The most numerous type of family households are 2-person households, comprising 42, and the most common type of nonfamily households are 1-person households, comprising 46.
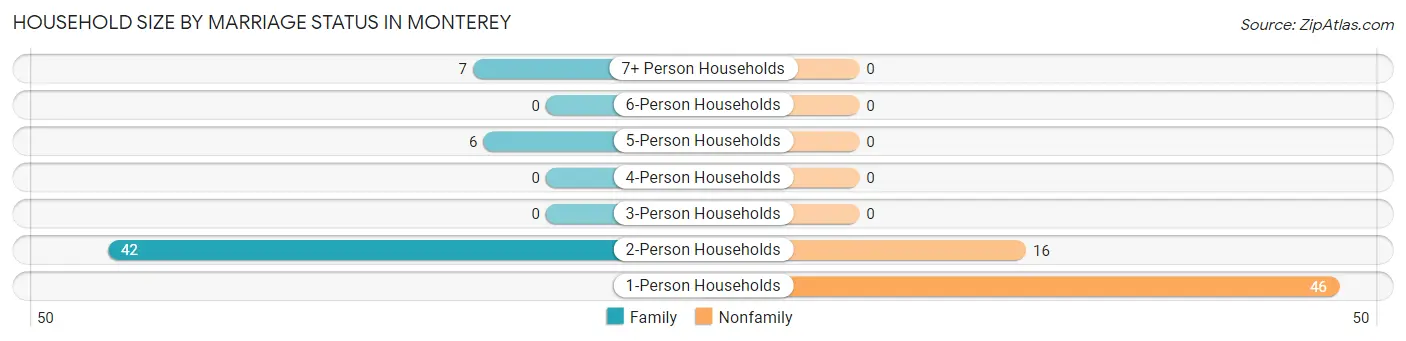
| Household Size | Family Households | Nonfamily Households |
| 1-Person Households | - | 46 (39.3%) |
| 2-Person Households | 42 (35.9%) | 16 (13.7%) |
| 3-Person Households | 0 (0.0%) | 0 (0.0%) |
| 4-Person Households | 0 (0.0%) | 0 (0.0%) |
| 5-Person Households | 6 (5.1%) | 0 (0.0%) |
| 6-Person Households | 0 (0.0%) | 0 (0.0%) |
| 7+ Person Households | 7 (6.0%) | 0 (0.0%) |
| Total | 55 (47.0%) | 62 (53.0%) |
Female Fertility in Monterey
Fertility by Age in Monterey
Average fertility rate in Monterey is 146.0 births per 1,000 women. Women in the age bracket of 20 to 34 years have the highest fertility rate with 219.0 births per 1,000 women. Women in the age bracket of 20 to 34 years acount for 100.0% of all women with births.
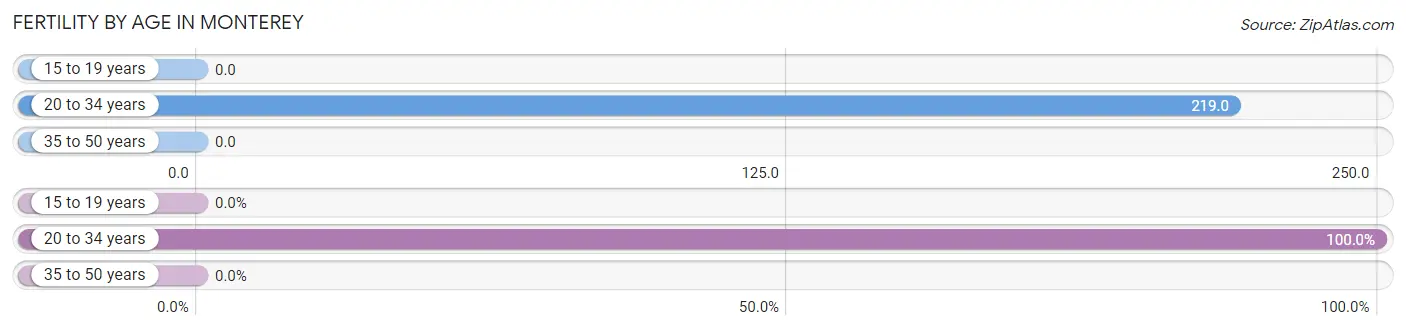
| Age Bracket | Women with Births | Births / 1,000 Women |
| 15 to 19 years | 0 (0.0%) | 0.0 |
| 20 to 34 years | 7 (100.0%) | 219.0 |
| 35 to 50 years | 0 (0.0%) | 0.0 |
| Total | 7 (100.0%) | 146.0 |
Fertility by Age by Marriage Status in Monterey
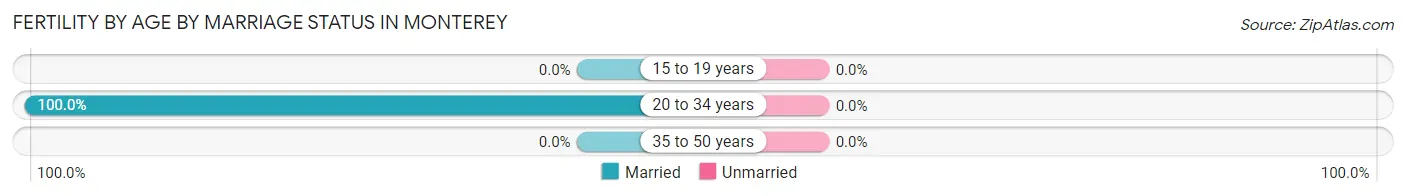
| Age Bracket | Married | Unmarried |
| 15 to 19 years | 0 (0.0%) | 0 (0.0%) |
| 20 to 34 years | 7 (100.0%) | 0 (0.0%) |
| 35 to 50 years | 0 (0.0%) | 0 (0.0%) |
| Total | 7 (100.0%) | 0 (0.0%) |
Fertility by Education in Monterey
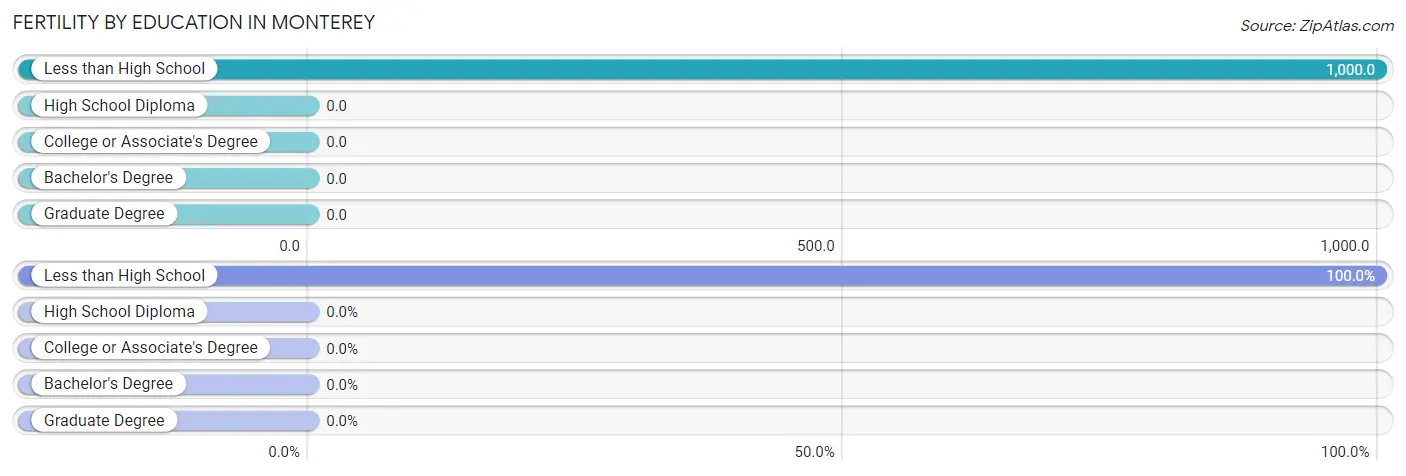
| Educational Attainment | Women with Births | Births / 1,000 Women |
| Less than High School | 7 (100.0%) | 1,000.0 |
| High School Diploma | 0 (0.0%) | 0.0 |
| College or Associate's Degree | 0 (0.0%) | 0.0 |
| Bachelor's Degree | 0 (0.0%) | 0.0 |
| Graduate Degree | 0 (0.0%) | 0.0 |
| Total | 7 (100.0%) | 146.0 |
Fertility by Education by Marriage Status in Monterey
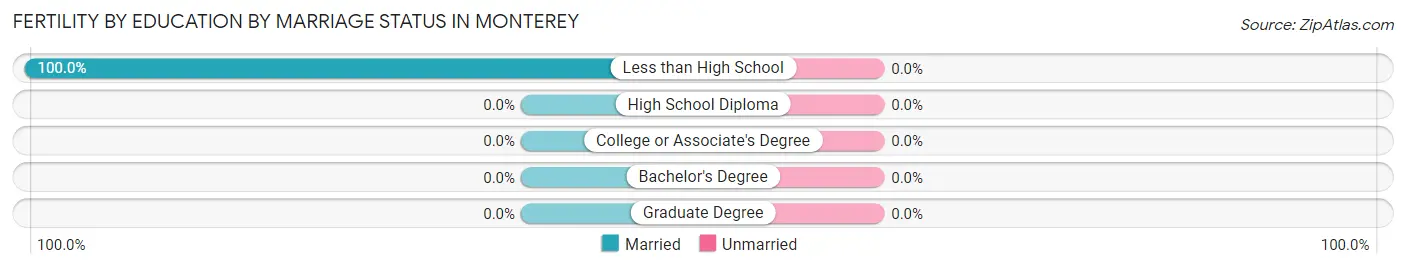
| Educational Attainment | Married | Unmarried |
| Less than High School | 7 (100.0%) | 0 (0.0%) |
| High School Diploma | 0 (0.0%) | 0 (0.0%) |
| College or Associate's Degree | 0 (0.0%) | 0 (0.0%) |
| Bachelor's Degree | 0 (0.0%) | 0 (0.0%) |
| Graduate Degree | 0 (0.0%) | 0 (0.0%) |
| Total | 7 (100.0%) | 0 (0.0%) |
Employment Characteristics in Monterey
Employment by Class of Employer in Monterey
Among the 48 employed individuals in Monterey, private company employees (39 | 81.2%), and local government employees (9 | 18.8%) make up the most common classes of employment.
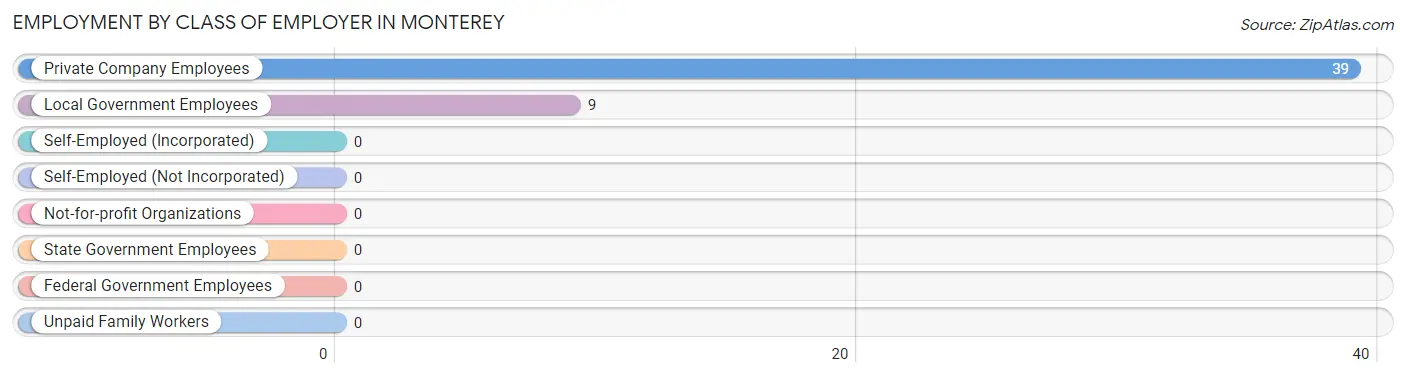
| Employer Class | # Employees | % Employees |
| Private Company Employees | 39 | 81.2% |
| Self-Employed (Incorporated) | 0 | 0.0% |
| Self-Employed (Not Incorporated) | 0 | 0.0% |
| Not-for-profit Organizations | 0 | 0.0% |
| Local Government Employees | 9 | 18.8% |
| State Government Employees | 0 | 0.0% |
| Federal Government Employees | 0 | 0.0% |
| Unpaid Family Workers | 0 | 0.0% |
| Total | 48 | 100.0% |
Employment Status by Age in Monterey
According to the labor force statistics for Monterey, out of the total population over 16 years of age (218), 25.2% or 55 individuals are in the labor force, with 12.7% or 7 of them unemployed. The age group with the highest labor force participation rate is 35 to 44 years, with 100.0% or 10 individuals in the labor force. Within the labor force, the 20 to 24 years age range has the highest percentage of unemployed individuals, with 53.8% or 7 of them being unemployed.
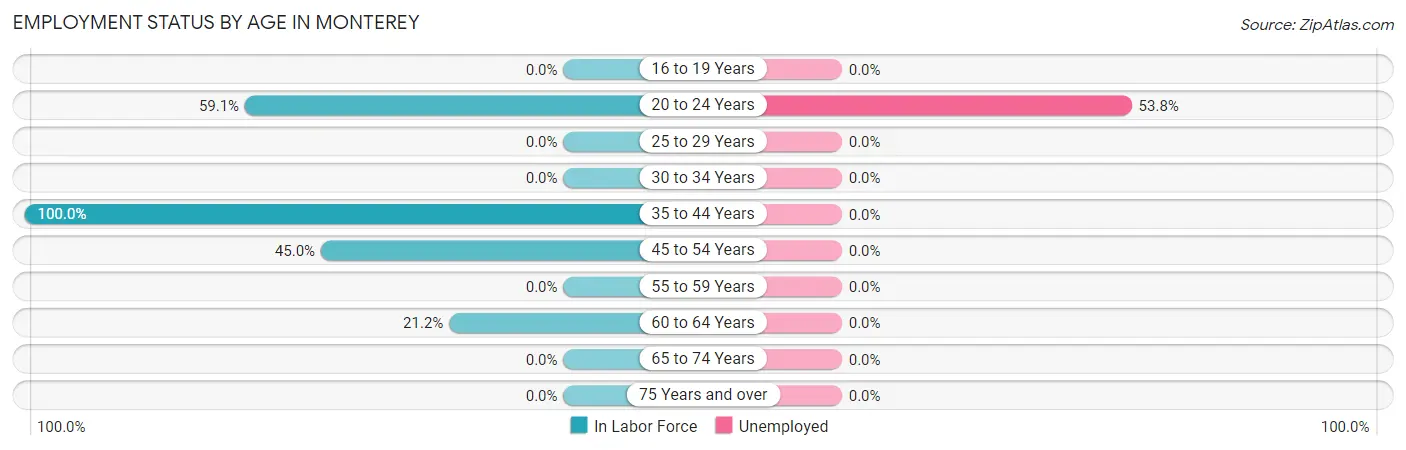
| Age Bracket | In Labor Force | Unemployed |
| 16 to 19 Years | 0 (0.0%) | 0 (0.0%) |
| 20 to 24 Years | 13 (59.1%) | 7 (53.8%) |
| 25 to 29 Years | 0 (0.0%) | 0 (0.0%) |
| 30 to 34 Years | 0 (0.0%) | 0 (0.0%) |
| 35 to 44 Years | 10 (100.0%) | 0 (0.0%) |
| 45 to 54 Years | 18 (45.0%) | 0 (0.0%) |
| 55 to 59 Years | 0 (0.0%) | 0 (0.0%) |
| 60 to 64 Years | 14 (21.2%) | 0 (0.0%) |
| 65 to 74 Years | 0 (0.0%) | 0 (0.0%) |
| 75 Years and over | 0 (0.0%) | 0 (0.0%) |
| Total | 55 (25.2%) | 7 (12.7%) |
Employment Status by Educational Attainment in Monterey
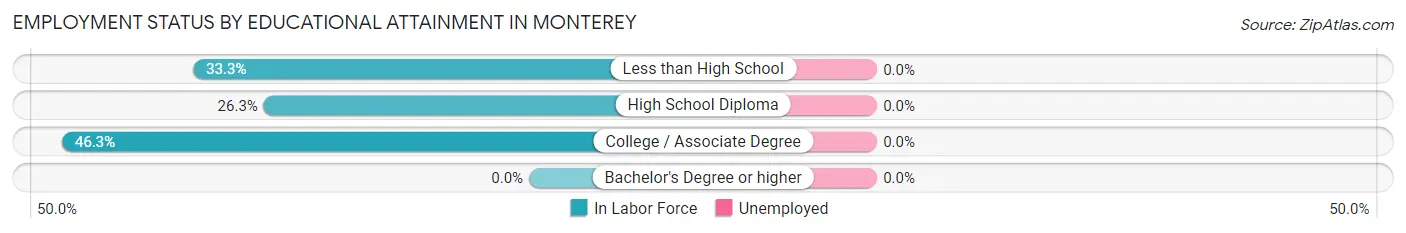
| Educational Attainment | In Labor Force | Unemployed |
| Less than High School | 8 (33.3%) | 0 (0.0%) |
| High School Diploma | 15 (26.3%) | 0 (0.0%) |
| College / Associate Degree | 19 (46.3%) | 0 (0.0%) |
| Bachelor's Degree or higher | 0 (0.0%) | 0 (0.0%) |
| Total | 42 (28.0%) | 0 (0.0%) |
Employment Occupations by Sex in Monterey
Management, Business, Science and Arts Occupations
The most common Management, Business, Science and Arts occupations in Monterey are , and Health Diagnosing & Treating (10 | 20.8%).
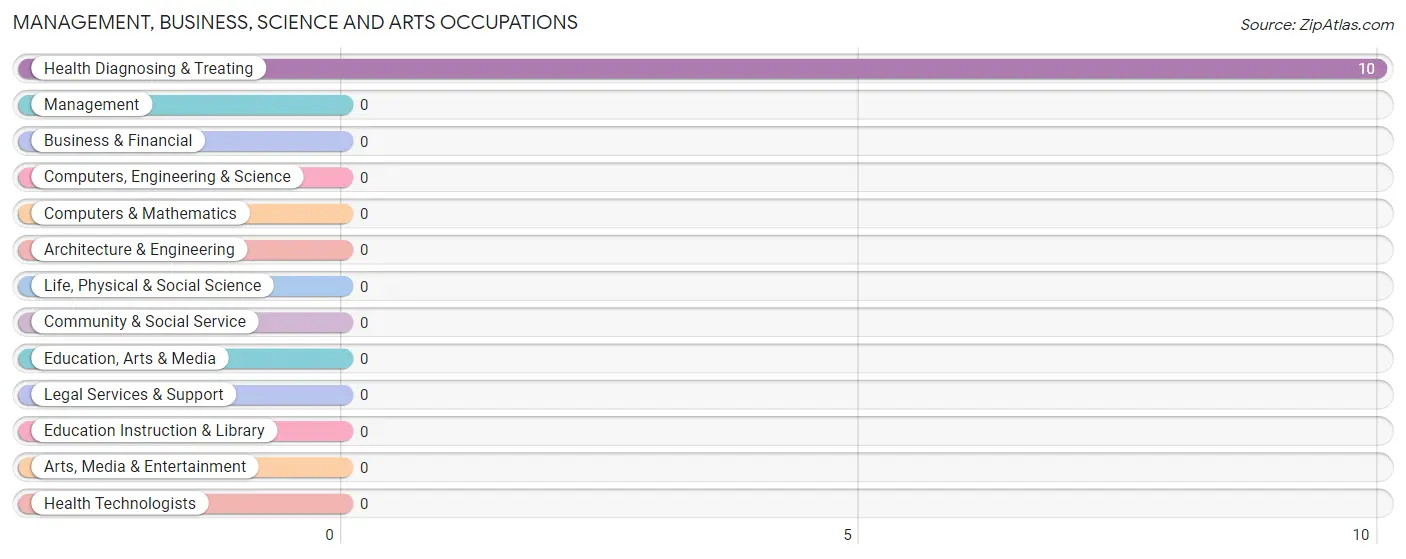
Management, Business, Science and Arts Occupations by Sex
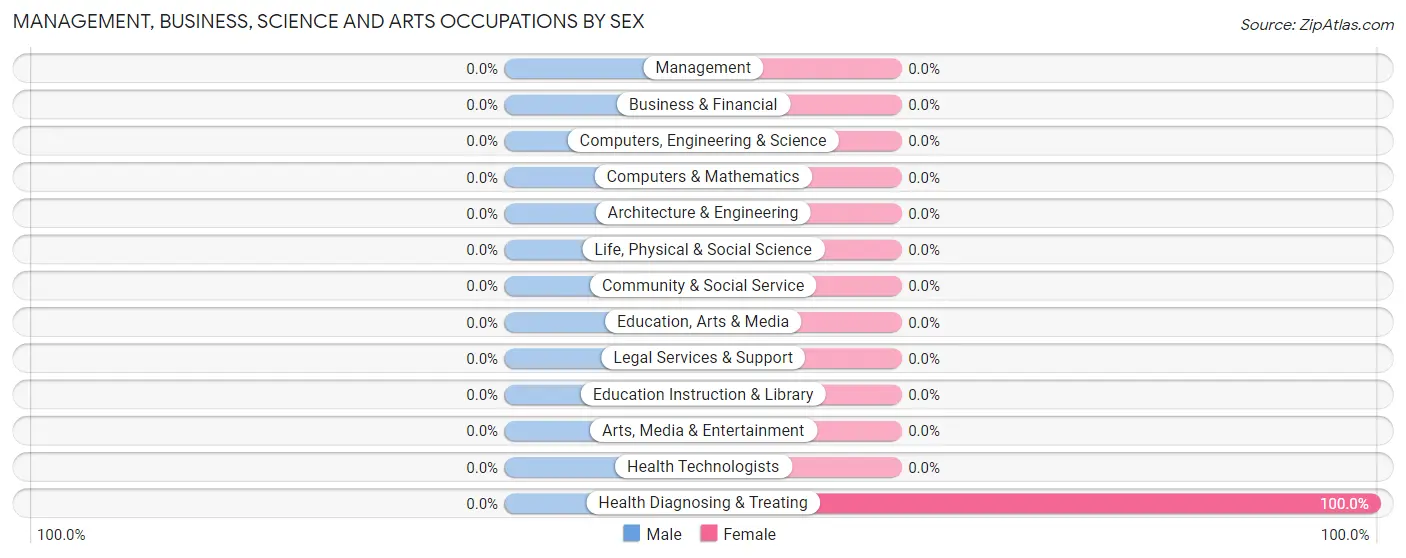
| Occupation | Male | Female |
| Management | 0 (0.0%) | 0 (0.0%) |
| Business & Financial | 0 (0.0%) | 0 (0.0%) |
| Computers, Engineering & Science | 0 (0.0%) | 0 (0.0%) |
| Computers & Mathematics | 0 (0.0%) | 0 (0.0%) |
| Architecture & Engineering | 0 (0.0%) | 0 (0.0%) |
| Life, Physical & Social Science | 0 (0.0%) | 0 (0.0%) |
| Community & Social Service | 0 (0.0%) | 0 (0.0%) |
| Education, Arts & Media | 0 (0.0%) | 0 (0.0%) |
| Legal Services & Support | 0 (0.0%) | 0 (0.0%) |
| Education Instruction & Library | 0 (0.0%) | 0 (0.0%) |
| Arts, Media & Entertainment | 0 (0.0%) | 0 (0.0%) |
| Health Diagnosing & Treating | 0 (0.0%) | 10 (100.0%) |
| Health Technologists | 0 (0.0%) | 0 (0.0%) |
| Total (Category) | 0 (0.0%) | 10 (100.0%) |
| Total (Overall) | 33 (68.8%) | 15 (31.2%) |
Services Occupations
The most common Services occupations in Monterey are Security & Protection (9 | 18.8%), Law Enforcement (9 | 18.8%), and Food Preparation & Serving (5 | 10.4%).
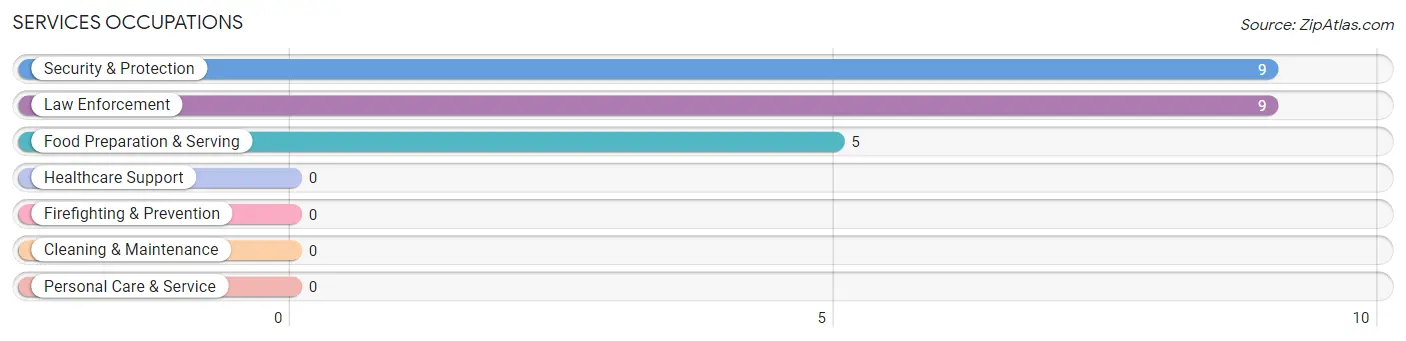
Services Occupations by Sex
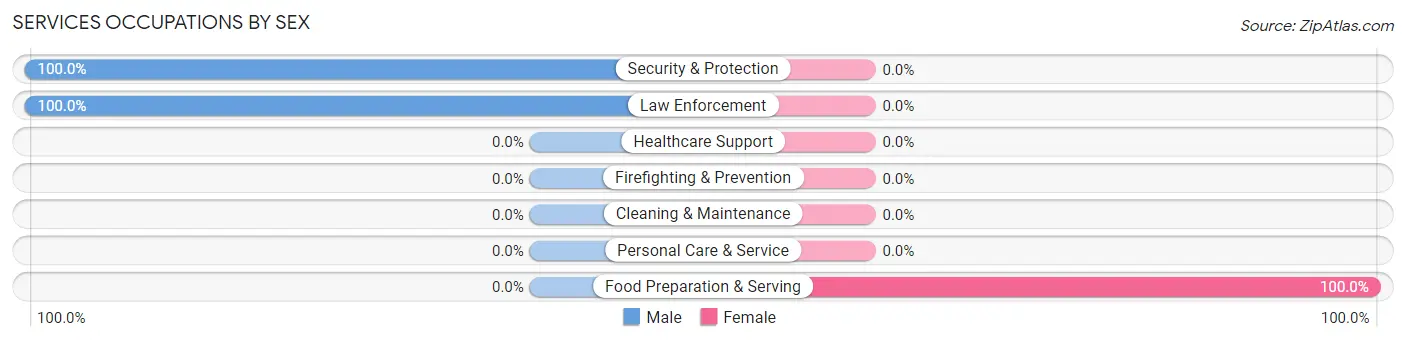
| Occupation | Male | Female |
| Healthcare Support | 0 (0.0%) | 0 (0.0%) |
| Security & Protection | 9 (100.0%) | 0 (0.0%) |
| Firefighting & Prevention | 0 (0.0%) | 0 (0.0%) |
| Law Enforcement | 9 (100.0%) | 0 (0.0%) |
| Food Preparation & Serving | 0 (0.0%) | 5 (100.0%) |
| Cleaning & Maintenance | 0 (0.0%) | 0 (0.0%) |
| Personal Care & Service | 0 (0.0%) | 0 (0.0%) |
| Total (Category) | 9 (64.3%) | 5 (35.7%) |
| Total (Overall) | 33 (68.8%) | 15 (31.2%) |
Sales and Office Occupations
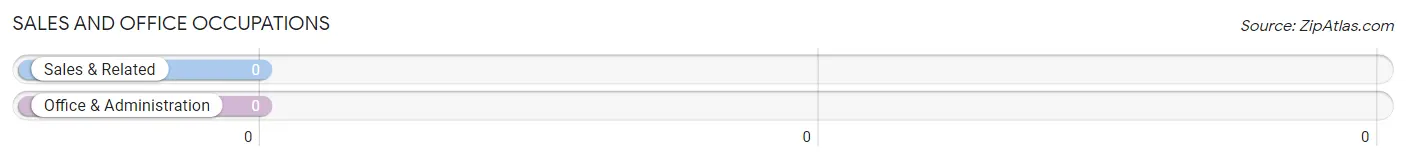
Sales and Office Occupations by Sex
| Occupation | Male | Female |
| Sales & Related | 0 (0.0%) | 0 (0.0%) |
| Office & Administration | 0 (0.0%) | 0 (0.0%) |
| Total (Category) | 0 (0.0%) | 0 (0.0%) |
| Total (Overall) | 33 (68.8%) | 15 (31.2%) |
Natural Resources, Construction and Maintenance Occupations
The most common Natural Resources, Construction and Maintenance occupations in Monterey are , and Construction & Extraction (14 | 29.2%).
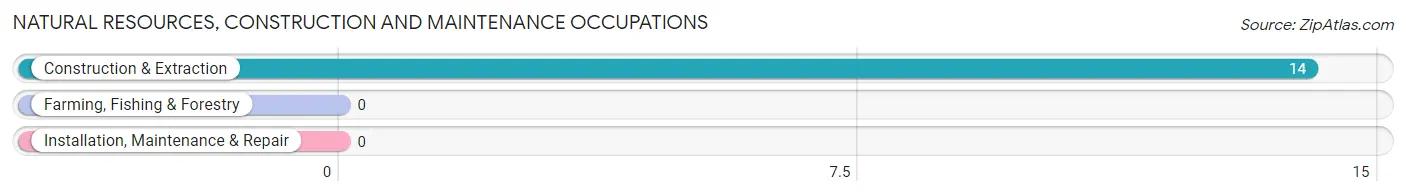
Natural Resources, Construction and Maintenance Occupations by Sex
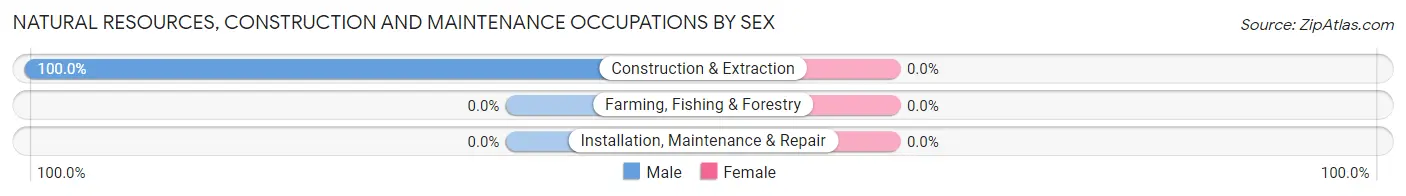
| Occupation | Male | Female |
| Farming, Fishing & Forestry | 0 (0.0%) | 0 (0.0%) |
| Construction & Extraction | 14 (100.0%) | 0 (0.0%) |
| Installation, Maintenance & Repair | 0 (0.0%) | 0 (0.0%) |
| Total (Category) | 14 (100.0%) | 0 (0.0%) |
| Total (Overall) | 33 (68.8%) | 15 (31.2%) |
Production, Transportation and Moving Occupations
The most common Production, Transportation and Moving occupations in Monterey are , and Production (10 | 20.8%).
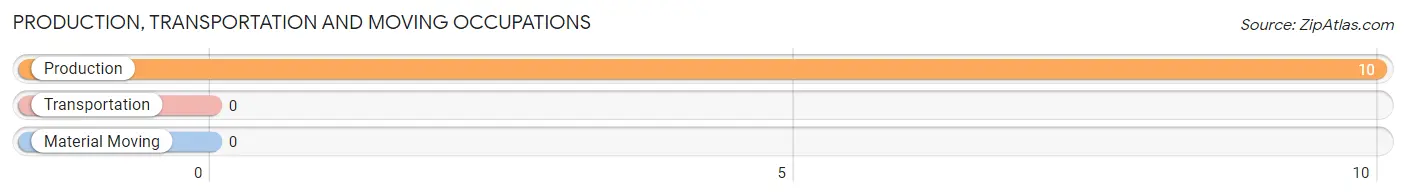
Production, Transportation and Moving Occupations by Sex
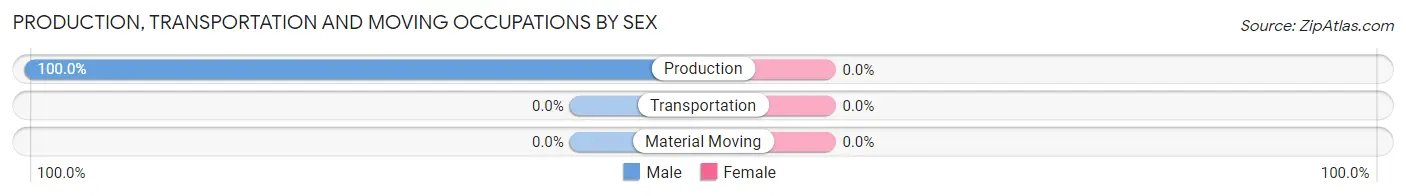
| Occupation | Male | Female |
| Production | 10 (100.0%) | 0 (0.0%) |
| Transportation | 0 (0.0%) | 0 (0.0%) |
| Material Moving | 0 (0.0%) | 0 (0.0%) |
| Total (Category) | 10 (100.0%) | 0 (0.0%) |
| Total (Overall) | 33 (68.8%) | 15 (31.2%) |
Employment Industries by Sex in Monterey
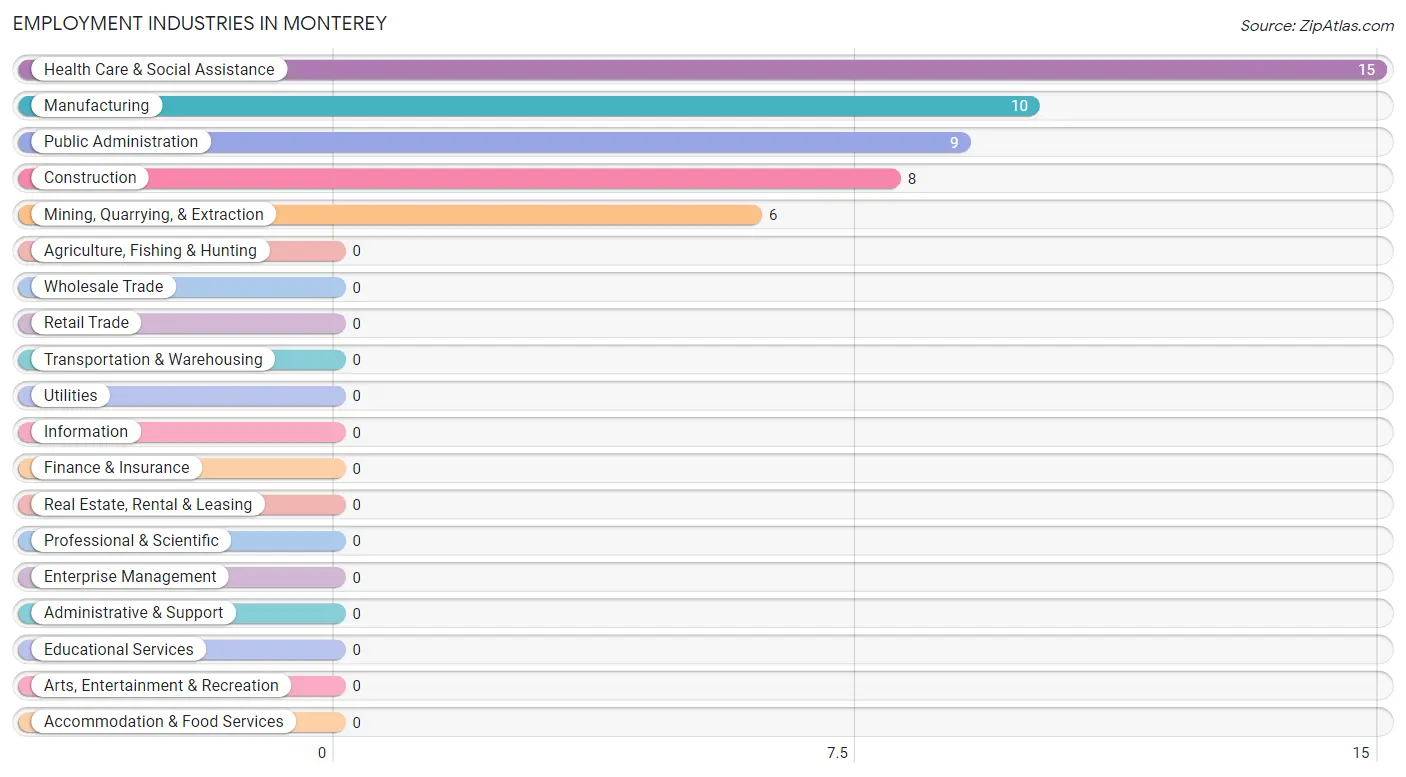
Employment Industries in Monterey
The major employment industries in Monterey include Health Care & Social Assistance (15 | 31.2%), Manufacturing (10 | 20.8%), Public Administration (9 | 18.8%), Construction (8 | 16.7%), and Mining, Quarrying, & Extraction (6 | 12.5%).
Employment Industries by Sex in Monterey
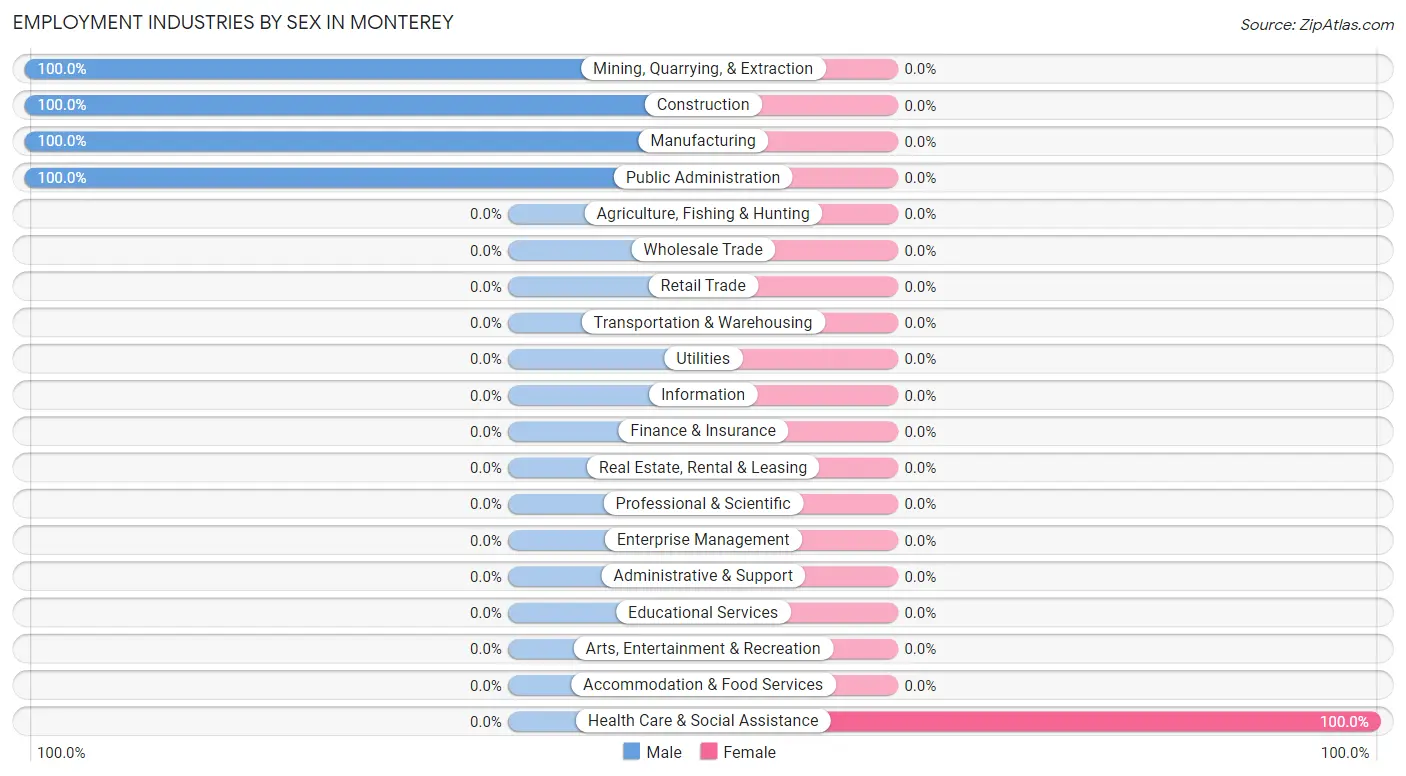
| Industry | Male | Female |
| Agriculture, Fishing & Hunting | 0 (0.0%) | 0 (0.0%) |
| Mining, Quarrying, & Extraction | 6 (100.0%) | 0 (0.0%) |
| Construction | 8 (100.0%) | 0 (0.0%) |
| Manufacturing | 10 (100.0%) | 0 (0.0%) |
| Wholesale Trade | 0 (0.0%) | 0 (0.0%) |
| Retail Trade | 0 (0.0%) | 0 (0.0%) |
| Transportation & Warehousing | 0 (0.0%) | 0 (0.0%) |
| Utilities | 0 (0.0%) | 0 (0.0%) |
| Information | 0 (0.0%) | 0 (0.0%) |
| Finance & Insurance | 0 (0.0%) | 0 (0.0%) |
| Real Estate, Rental & Leasing | 0 (0.0%) | 0 (0.0%) |
| Professional & Scientific | 0 (0.0%) | 0 (0.0%) |
| Enterprise Management | 0 (0.0%) | 0 (0.0%) |
| Administrative & Support | 0 (0.0%) | 0 (0.0%) |
| Educational Services | 0 (0.0%) | 0 (0.0%) |
| Health Care & Social Assistance | 0 (0.0%) | 15 (100.0%) |
| Arts, Entertainment & Recreation | 0 (0.0%) | 0 (0.0%) |
| Accommodation & Food Services | 0 (0.0%) | 0 (0.0%) |
| Public Administration | 9 (100.0%) | 0 (0.0%) |
| Total | 33 (68.8%) | 15 (31.2%) |
Education in Monterey
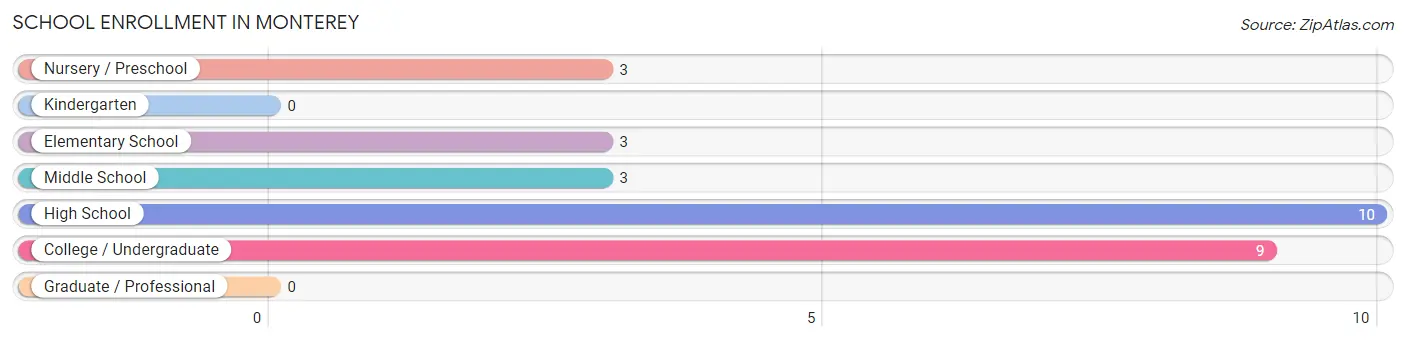
School Enrollment in Monterey
The most common levels of schooling among the 28 students in Monterey are high school (10 | 35.7%), college / undergraduate (9 | 32.1%), and nursery / preschool (3 | 10.7%).
| School Level | # Students | % Students |
| Nursery / Preschool | 3 | 10.7% |
| Kindergarten | 0 | 0.0% |
| Elementary School | 3 | 10.7% |
| Middle School | 3 | 10.7% |
| High School | 10 | 35.7% |
| College / Undergraduate | 9 | 32.1% |
| Graduate / Professional | 0 | 0.0% |
| Total | 28 | 100.0% |
School Enrollment by Age by Funding Source in Monterey
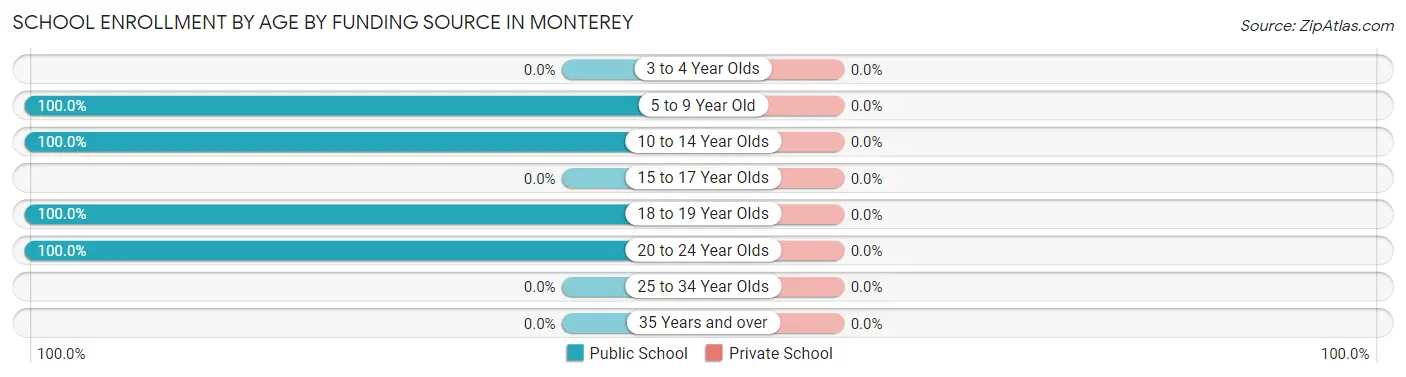
| Age Bracket | Public School | Private School |
| 3 to 4 Year Olds | 0 (0.0%) | 0 (0.0%) |
| 5 to 9 Year Old | 6 (100.0%) | 0 (0.0%) |
| 10 to 14 Year Olds | 3 (100.0%) | 0 (0.0%) |
| 15 to 17 Year Olds | 0 (0.0%) | 0 (0.0%) |
| 18 to 19 Year Olds | 10 (100.0%) | 0 (0.0%) |
| 20 to 24 Year Olds | 9 (100.0%) | 0 (0.0%) |
| 25 to 34 Year Olds | 0 (0.0%) | 0 (0.0%) |
| 35 Years and over | 0 (0.0%) | 0 (0.0%) |
| Total | 28 (100.0%) | 0 (0.0%) |
Educational Attainment by Field of Study in Monterey
Education (28 | 59.6%), and business (19 | 40.4%) are the most common fields of study among 47 individuals in Monterey who have obtained a bachelor's degree or higher.
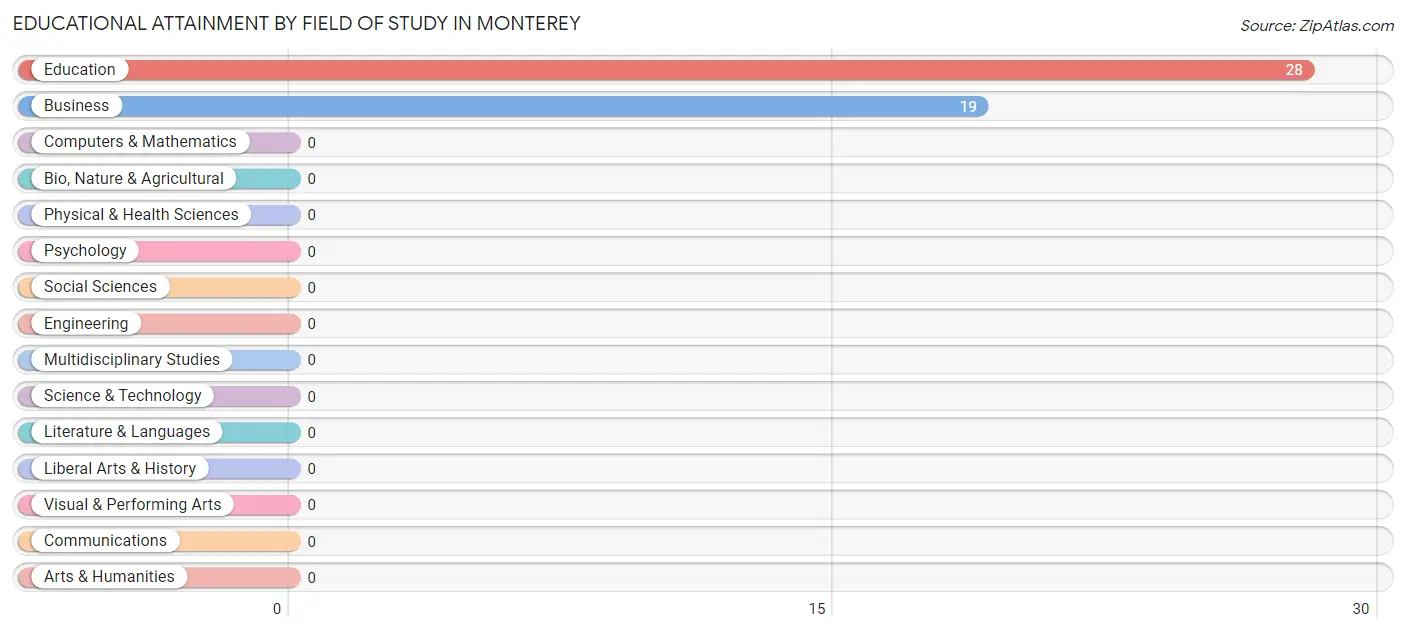
| Field of Study | # Graduates | % Graduates |
| Computers & Mathematics | 0 | 0.0% |
| Bio, Nature & Agricultural | 0 | 0.0% |
| Physical & Health Sciences | 0 | 0.0% |
| Psychology | 0 | 0.0% |
| Social Sciences | 0 | 0.0% |
| Engineering | 0 | 0.0% |
| Multidisciplinary Studies | 0 | 0.0% |
| Science & Technology | 0 | 0.0% |
| Business | 19 | 40.4% |
| Education | 28 | 59.6% |
| Literature & Languages | 0 | 0.0% |
| Liberal Arts & History | 0 | 0.0% |
| Visual & Performing Arts | 0 | 0.0% |
| Communications | 0 | 0.0% |
| Arts & Humanities | 0 | 0.0% |
| Total | 47 | 100.0% |
Transportation & Commute in Monterey
Vehicle Availability by Sex in Monterey
The most prevalent vehicle ownership categories in Monterey are males with 3 vehicles (10, accounting for 30.3%) and females with 3 vehicles (10, making up 66.7%).
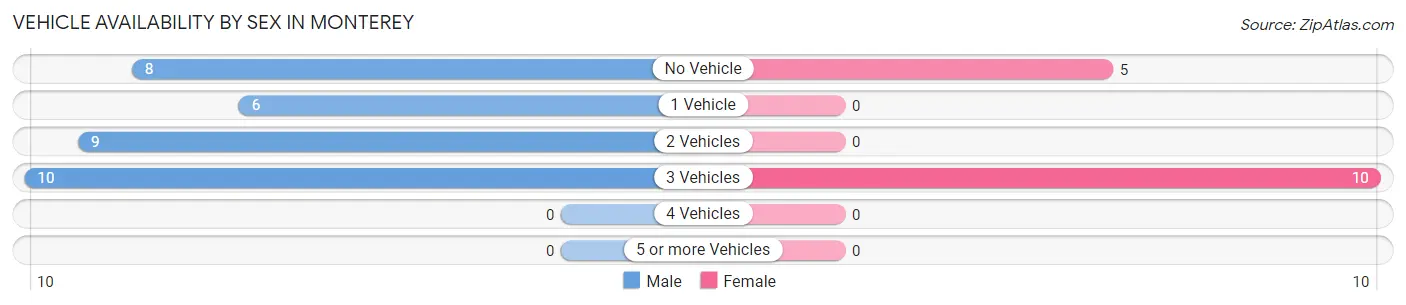
| Vehicles Available | Male | Female |
| No Vehicle | 8 (24.2%) | 5 (33.3%) |
| 1 Vehicle | 6 (18.2%) | 0 (0.0%) |
| 2 Vehicles | 9 (27.3%) | 0 (0.0%) |
| 3 Vehicles | 10 (30.3%) | 10 (66.7%) |
| 4 Vehicles | 0 (0.0%) | 0 (0.0%) |
| 5 or more Vehicles | 0 (0.0%) | 0 (0.0%) |
| Total | 33 (100.0%) | 15 (100.0%) |
Commute Time in Monterey
The most frequently occuring commute durations in Monterey are 30 to 34 minutes (19 commuters, 39.6%), 90 or more minutes (16 commuters, 33.3%), and 10 to 14 minutes (8 commuters, 16.7%).
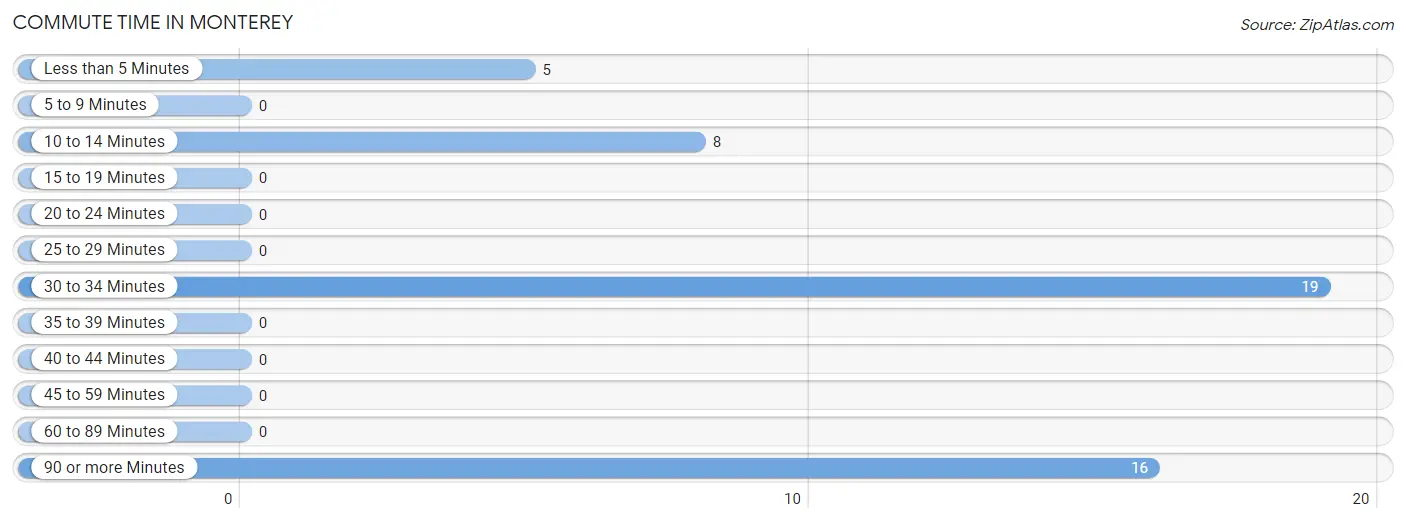
| Commute Time | # Commuters | % Commuters |
| Less than 5 Minutes | 5 | 10.4% |
| 5 to 9 Minutes | 0 | 0.0% |
| 10 to 14 Minutes | 8 | 16.7% |
| 15 to 19 Minutes | 0 | 0.0% |
| 20 to 24 Minutes | 0 | 0.0% |
| 25 to 29 Minutes | 0 | 0.0% |
| 30 to 34 Minutes | 19 | 39.6% |
| 35 to 39 Minutes | 0 | 0.0% |
| 40 to 44 Minutes | 0 | 0.0% |
| 45 to 59 Minutes | 0 | 0.0% |
| 60 to 89 Minutes | 0 | 0.0% |
| 90 or more Minutes | 16 | 33.3% |
Commute Time by Sex in Monterey
The most common commute times in Monterey are 90 or more minutes (16 commuters, 48.5%) for males and 30 to 34 minutes (10 commuters, 66.7%) for females.
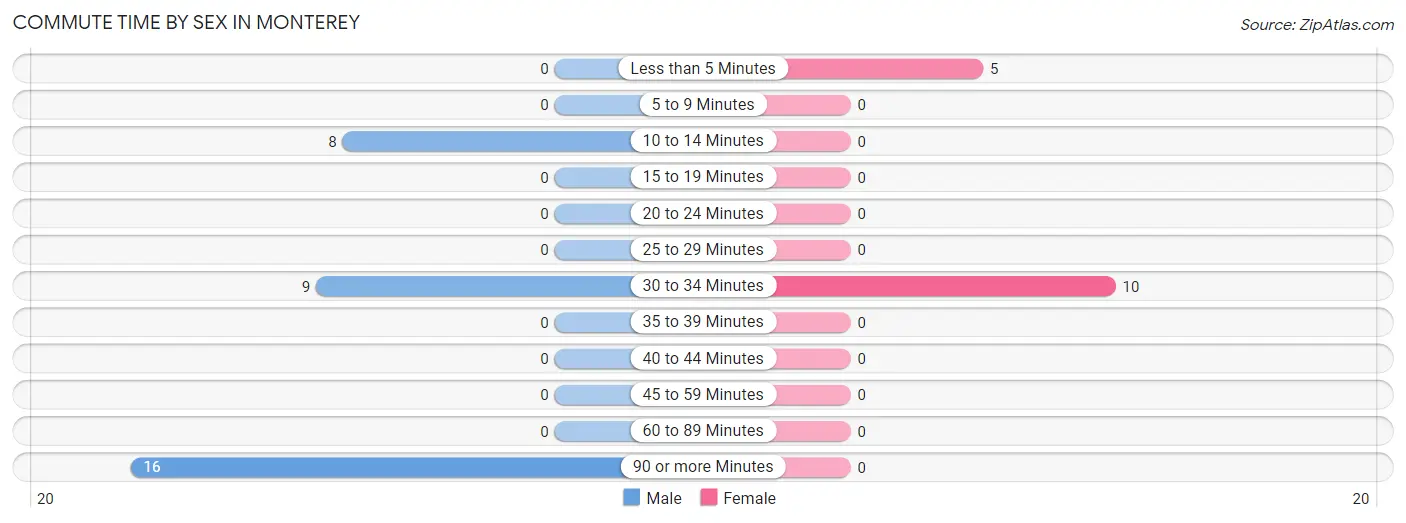
| Commute Time | Male | Female |
| Less than 5 Minutes | 0 (0.0%) | 5 (33.3%) |
| 5 to 9 Minutes | 0 (0.0%) | 0 (0.0%) |
| 10 to 14 Minutes | 8 (24.2%) | 0 (0.0%) |
| 15 to 19 Minutes | 0 (0.0%) | 0 (0.0%) |
| 20 to 24 Minutes | 0 (0.0%) | 0 (0.0%) |
| 25 to 29 Minutes | 0 (0.0%) | 0 (0.0%) |
| 30 to 34 Minutes | 9 (27.3%) | 10 (66.7%) |
| 35 to 39 Minutes | 0 (0.0%) | 0 (0.0%) |
| 40 to 44 Minutes | 0 (0.0%) | 0 (0.0%) |
| 45 to 59 Minutes | 0 (0.0%) | 0 (0.0%) |
| 60 to 89 Minutes | 0 (0.0%) | 0 (0.0%) |
| 90 or more Minutes | 16 (48.5%) | 0 (0.0%) |
Time of Departure to Work by Sex in Monterey
The most frequent times of departure to work in Monterey are 12:00 AM to 4:59 AM (10, 30.3%) for males and 8:00 AM to 8:29 AM (10, 66.7%) for females.
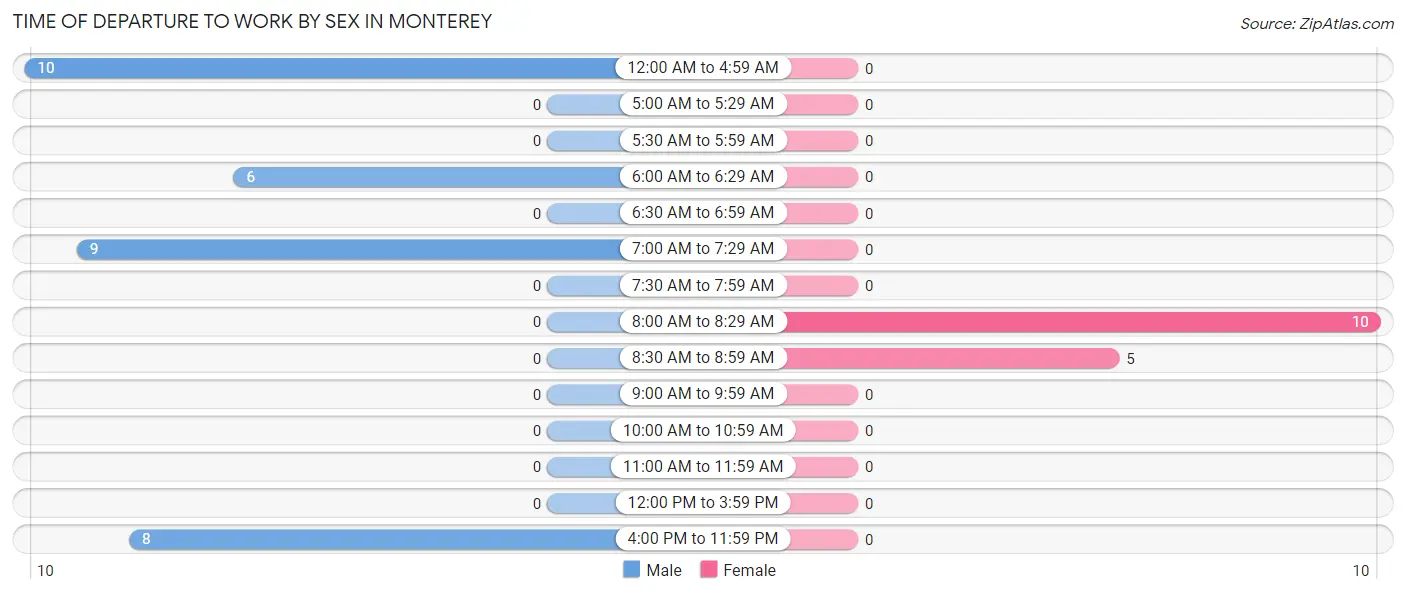
| Time of Departure | Male | Female |
| 12:00 AM to 4:59 AM | 10 (30.3%) | 0 (0.0%) |
| 5:00 AM to 5:29 AM | 0 (0.0%) | 0 (0.0%) |
| 5:30 AM to 5:59 AM | 0 (0.0%) | 0 (0.0%) |
| 6:00 AM to 6:29 AM | 6 (18.2%) | 0 (0.0%) |
| 6:30 AM to 6:59 AM | 0 (0.0%) | 0 (0.0%) |
| 7:00 AM to 7:29 AM | 9 (27.3%) | 0 (0.0%) |
| 7:30 AM to 7:59 AM | 0 (0.0%) | 0 (0.0%) |
| 8:00 AM to 8:29 AM | 0 (0.0%) | 10 (66.7%) |
| 8:30 AM to 8:59 AM | 0 (0.0%) | 5 (33.3%) |
| 9:00 AM to 9:59 AM | 0 (0.0%) | 0 (0.0%) |
| 10:00 AM to 10:59 AM | 0 (0.0%) | 0 (0.0%) |
| 11:00 AM to 11:59 AM | 0 (0.0%) | 0 (0.0%) |
| 12:00 PM to 3:59 PM | 0 (0.0%) | 0 (0.0%) |
| 4:00 PM to 11:59 PM | 8 (24.2%) | 0 (0.0%) |
| Total | 33 (100.0%) | 15 (100.0%) |
Housing Occupancy in Monterey
Occupancy by Ownership in Monterey
Of the total 117 dwellings in Monterey, owner-occupied units account for 101 (86.3%), while renter-occupied units make up 16 (13.7%).
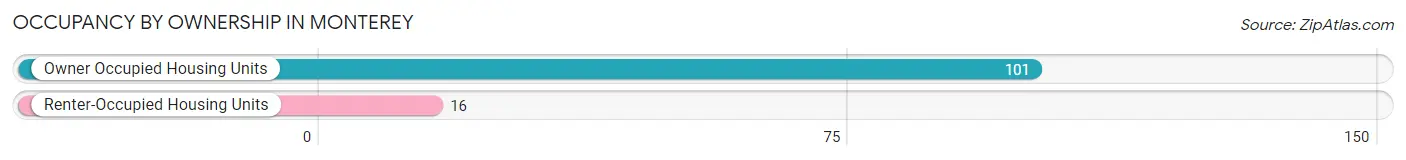
| Occupancy | # Housing Units | % Housing Units |
| Owner Occupied Housing Units | 101 | 86.3% |
| Renter-Occupied Housing Units | 16 | 13.7% |
| Total Occupied Housing Units | 117 | 100.0% |
Occupancy by Household Size in Monterey
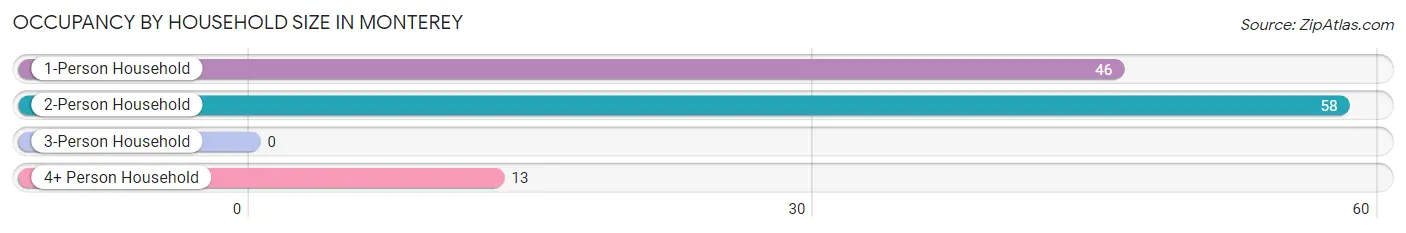
| Household Size | # Housing Units | % Housing Units |
| 1-Person Household | 46 | 39.3% |
| 2-Person Household | 58 | 49.6% |
| 3-Person Household | 0 | 0.0% |
| 4+ Person Household | 13 | 11.1% |
| Total Housing Units | 117 | 100.0% |
Occupancy by Ownership by Household Size in Monterey
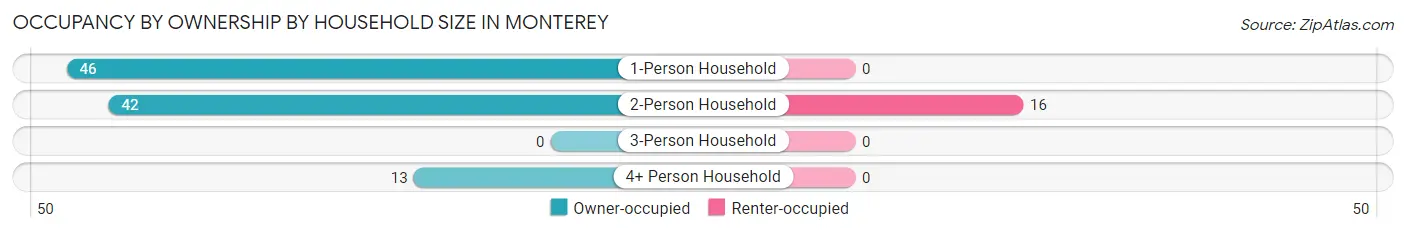
| Household Size | Owner-occupied | Renter-occupied |
| 1-Person Household | 46 (100.0%) | 0 (0.0%) |
| 2-Person Household | 42 (72.4%) | 16 (27.6%) |
| 3-Person Household | 0 (0.0%) | 0 (0.0%) |
| 4+ Person Household | 13 (100.0%) | 0 (0.0%) |
| Total Housing Units | 101 (86.3%) | 16 (13.7%) |
Occupancy by Educational Attainment in Monterey
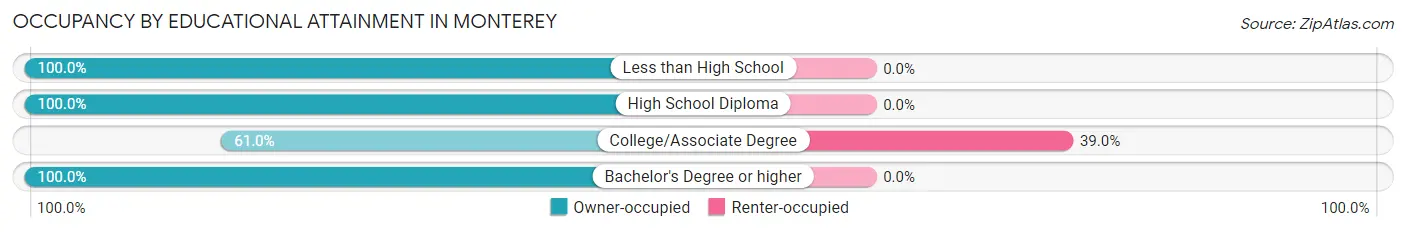
| Household Size | Owner-occupied | Renter-occupied |
| Less than High School | 16 (100.0%) | 0 (0.0%) |
| High School Diploma | 41 (100.0%) | 0 (0.0%) |
| College/Associate Degree | 25 (61.0%) | 16 (39.0%) |
| Bachelor's Degree or higher | 19 (100.0%) | 0 (0.0%) |
Occupancy by Age of Householder in Monterey
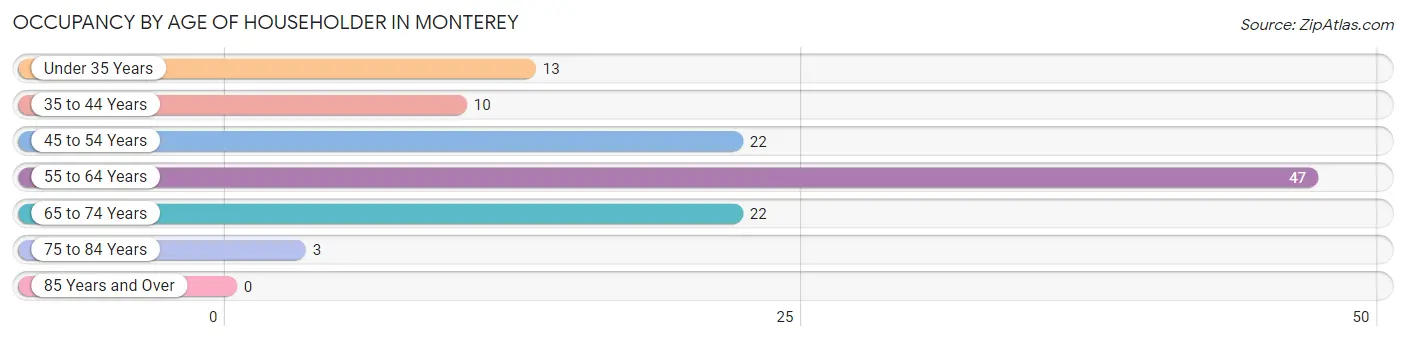
| Age Bracket | # Households | % Households |
| Under 35 Years | 13 | 11.1% |
| 35 to 44 Years | 10 | 8.6% |
| 45 to 54 Years | 22 | 18.8% |
| 55 to 64 Years | 47 | 40.2% |
| 65 to 74 Years | 22 | 18.8% |
| 75 to 84 Years | 3 | 2.6% |
| 85 Years and Over | 0 | 0.0% |
| Total | 117 | 100.0% |
Housing Finances in Monterey
Median Income by Occupancy in Monterey
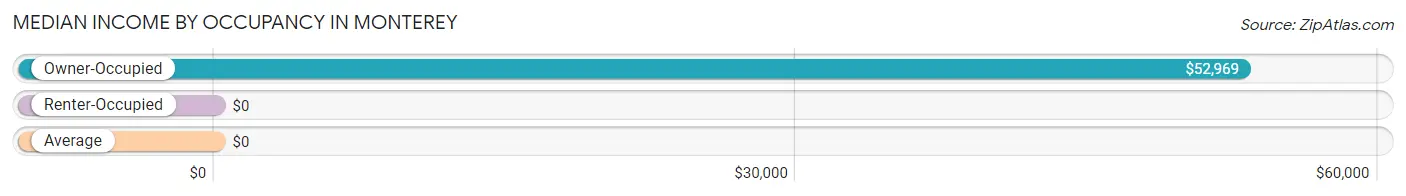
| Occupancy Type | # Households | Median Income |
| Owner-Occupied | 101 (86.3%) | $52,969 |
| Renter-Occupied | 16 (13.7%) | $0 |
| Average | 117 (100.0%) | $0 |
Occupancy by Householder Income Bracket in Monterey
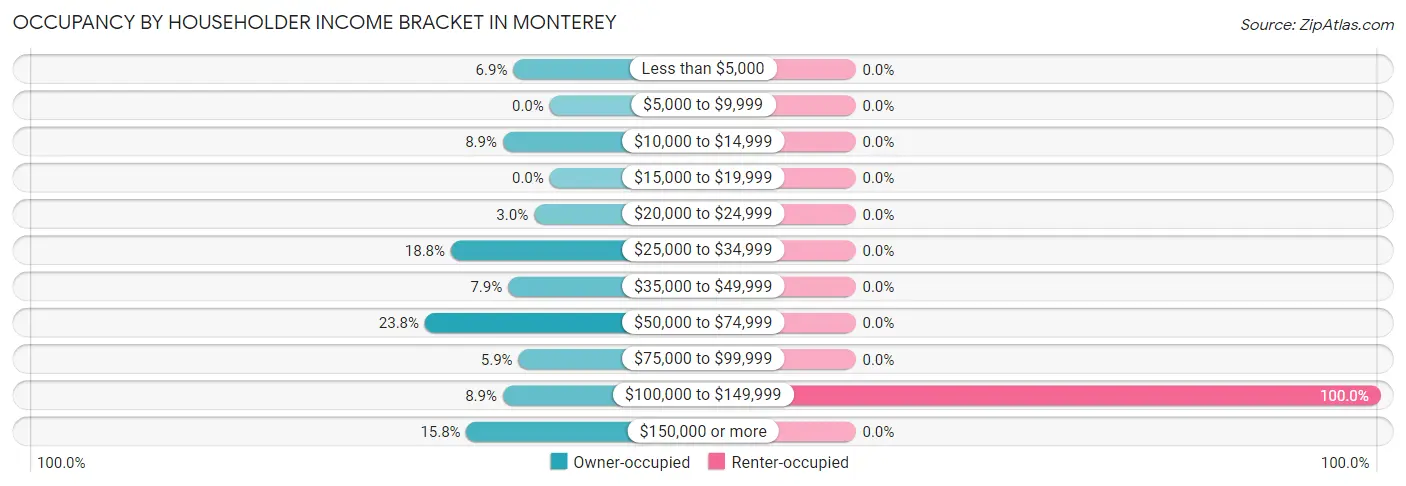
| Income Bracket | Owner-occupied | Renter-occupied |
| Less than $5,000 | 7 (6.9%) | 0 (0.0%) |
| $5,000 to $9,999 | 0 (0.0%) | 0 (0.0%) |
| $10,000 to $14,999 | 9 (8.9%) | 0 (0.0%) |
| $15,000 to $19,999 | 0 (0.0%) | 0 (0.0%) |
| $20,000 to $24,999 | 3 (3.0%) | 0 (0.0%) |
| $25,000 to $34,999 | 19 (18.8%) | 0 (0.0%) |
| $35,000 to $49,999 | 8 (7.9%) | 0 (0.0%) |
| $50,000 to $74,999 | 24 (23.8%) | 0 (0.0%) |
| $75,000 to $99,999 | 6 (5.9%) | 0 (0.0%) |
| $100,000 to $149,999 | 9 (8.9%) | 16 (100.0%) |
| $150,000 or more | 16 (15.8%) | 0 (0.0%) |
| Total | 101 (100.0%) | 16 (100.0%) |
Monthly Housing Cost Tiers in Monterey
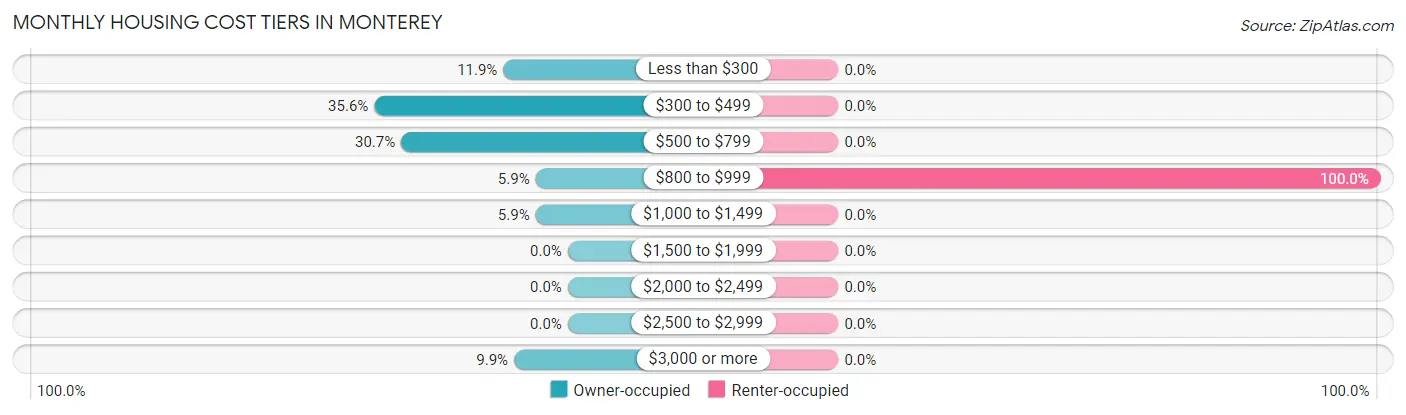
| Monthly Cost | Owner-occupied | Renter-occupied |
| Less than $300 | 12 (11.9%) | 0 (0.0%) |
| $300 to $499 | 36 (35.6%) | 0 (0.0%) |
| $500 to $799 | 31 (30.7%) | 0 (0.0%) |
| $800 to $999 | 6 (5.9%) | 16 (100.0%) |
| $1,000 to $1,499 | 6 (5.9%) | 0 (0.0%) |
| $1,500 to $1,999 | 0 (0.0%) | 0 (0.0%) |
| $2,000 to $2,499 | 0 (0.0%) | 0 (0.0%) |
| $2,500 to $2,999 | 0 (0.0%) | 0 (0.0%) |
| $3,000 or more | 10 (9.9%) | 0 (0.0%) |
| Total | 101 (100.0%) | 16 (100.0%) |
Physical Housing Characteristics in Monterey
Housing Structures in Monterey
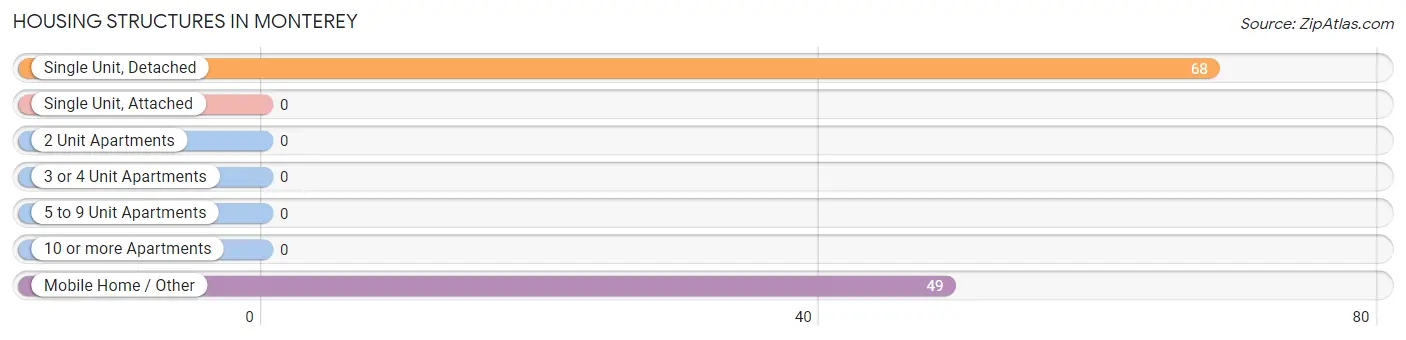
| Structure Type | # Housing Units | % Housing Units |
| Single Unit, Detached | 68 | 58.1% |
| Single Unit, Attached | 0 | 0.0% |
| 2 Unit Apartments | 0 | 0.0% |
| 3 or 4 Unit Apartments | 0 | 0.0% |
| 5 to 9 Unit Apartments | 0 | 0.0% |
| 10 or more Apartments | 0 | 0.0% |
| Mobile Home / Other | 49 | 41.9% |
| Total | 117 | 100.0% |
Housing Structures by Occupancy in Monterey
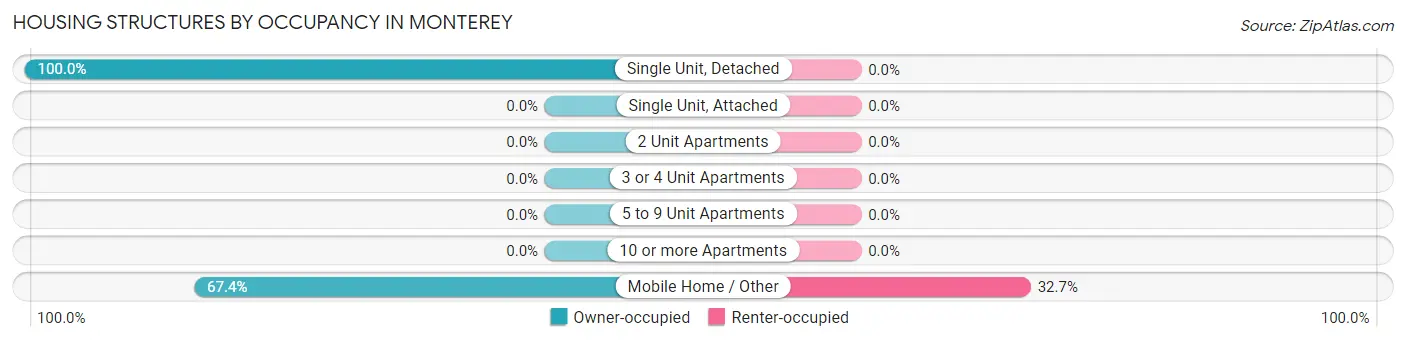
| Structure Type | Owner-occupied | Renter-occupied |
| Single Unit, Detached | 68 (100.0%) | 0 (0.0%) |
| Single Unit, Attached | 0 (0.0%) | 0 (0.0%) |
| 2 Unit Apartments | 0 (0.0%) | 0 (0.0%) |
| 3 or 4 Unit Apartments | 0 (0.0%) | 0 (0.0%) |
| 5 to 9 Unit Apartments | 0 (0.0%) | 0 (0.0%) |
| 10 or more Apartments | 0 (0.0%) | 0 (0.0%) |
| Mobile Home / Other | 33 (67.3%) | 16 (32.7%) |
| Total | 101 (86.3%) | 16 (13.7%) |
Housing Structures by Number of Rooms in Monterey
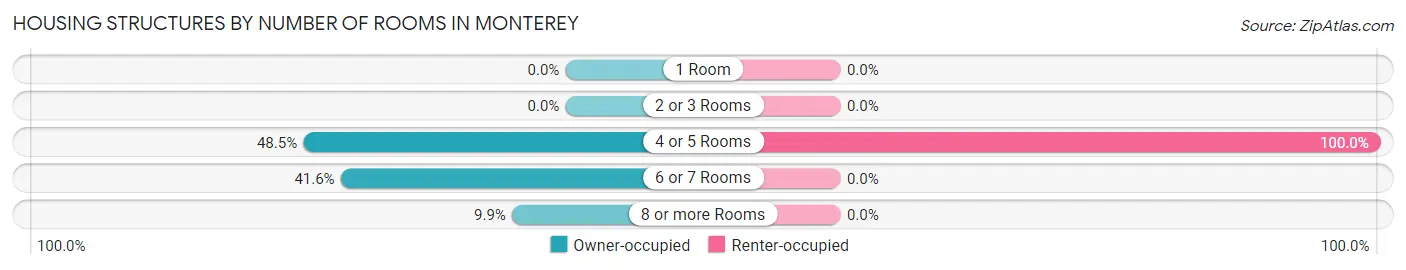
| Number of Rooms | Owner-occupied | Renter-occupied |
| 1 Room | 0 (0.0%) | 0 (0.0%) |
| 2 or 3 Rooms | 0 (0.0%) | 0 (0.0%) |
| 4 or 5 Rooms | 49 (48.5%) | 16 (100.0%) |
| 6 or 7 Rooms | 42 (41.6%) | 0 (0.0%) |
| 8 or more Rooms | 10 (9.9%) | 0 (0.0%) |
| Total | 101 (100.0%) | 16 (100.0%) |
Housing Structure by Heating Type in Monterey
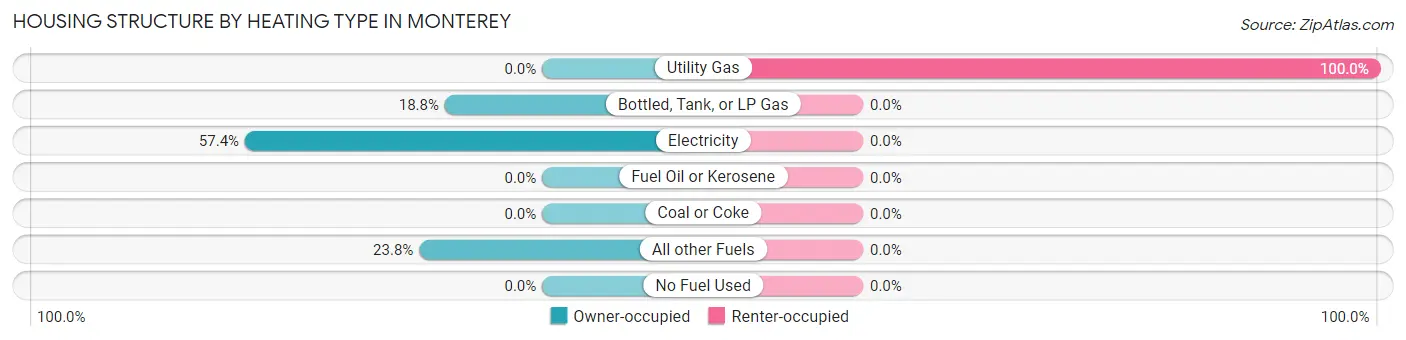
| Heating Type | Owner-occupied | Renter-occupied |
| Utility Gas | 0 (0.0%) | 16 (100.0%) |
| Bottled, Tank, or LP Gas | 19 (18.8%) | 0 (0.0%) |
| Electricity | 58 (57.4%) | 0 (0.0%) |
| Fuel Oil or Kerosene | 0 (0.0%) | 0 (0.0%) |
| Coal or Coke | 0 (0.0%) | 0 (0.0%) |
| All other Fuels | 24 (23.8%) | 0 (0.0%) |
| No Fuel Used | 0 (0.0%) | 0 (0.0%) |
| Total | 101 (100.0%) | 16 (100.0%) |
Household Vehicle Usage in Monterey
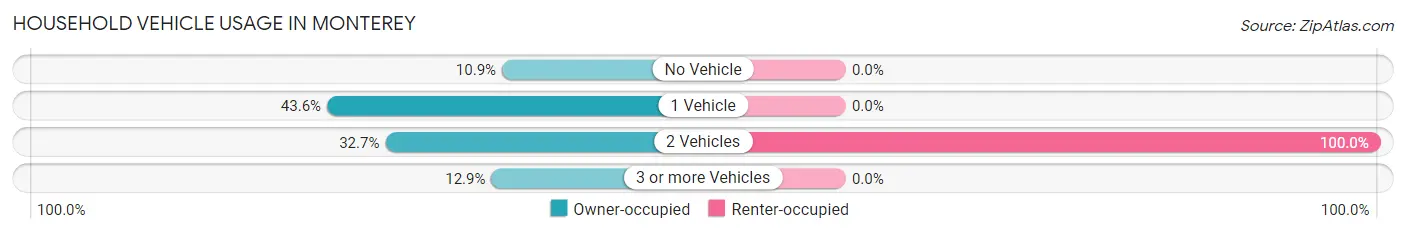
| Vehicles per Household | Owner-occupied | Renter-occupied |
| No Vehicle | 11 (10.9%) | 0 (0.0%) |
| 1 Vehicle | 44 (43.6%) | 0 (0.0%) |
| 2 Vehicles | 33 (32.7%) | 16 (100.0%) |
| 3 or more Vehicles | 13 (12.9%) | 0 (0.0%) |
| Total | 101 (100.0%) | 16 (100.0%) |
Real Estate & Mortgages in Monterey
Real Estate and Mortgage Overview in Monterey
| Characteristic | Without Mortgage | With Mortgage |
| Housing Units | 84 | 17 |
| Median Property Value | $99,200 | $0 |
| Median Household Income | $52,813 | $10 |
| Monthly Housing Costs | $465 | $10 |
| Real Estate Taxes | $433 | $7 |
Property Value by Mortgage Status in Monterey
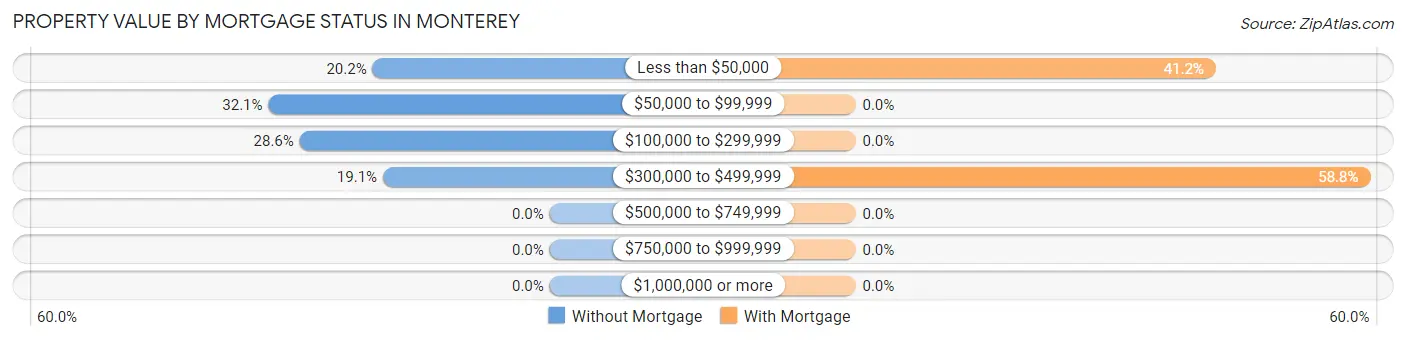
| Property Value | Without Mortgage | With Mortgage |
| Less than $50,000 | 17 (20.2%) | 7 (41.2%) |
| $50,000 to $99,999 | 27 (32.1%) | 0 (0.0%) |
| $100,000 to $299,999 | 24 (28.6%) | 0 (0.0%) |
| $300,000 to $499,999 | 16 (19.1%) | 10 (58.8%) |
| $500,000 to $749,999 | 0 (0.0%) | 0 (0.0%) |
| $750,000 to $999,999 | 0 (0.0%) | 0 (0.0%) |
| $1,000,000 or more | 0 (0.0%) | 0 (0.0%) |
| Total | 84 (100.0%) | 17 (100.0%) |
Household Income by Mortgage Status in Monterey
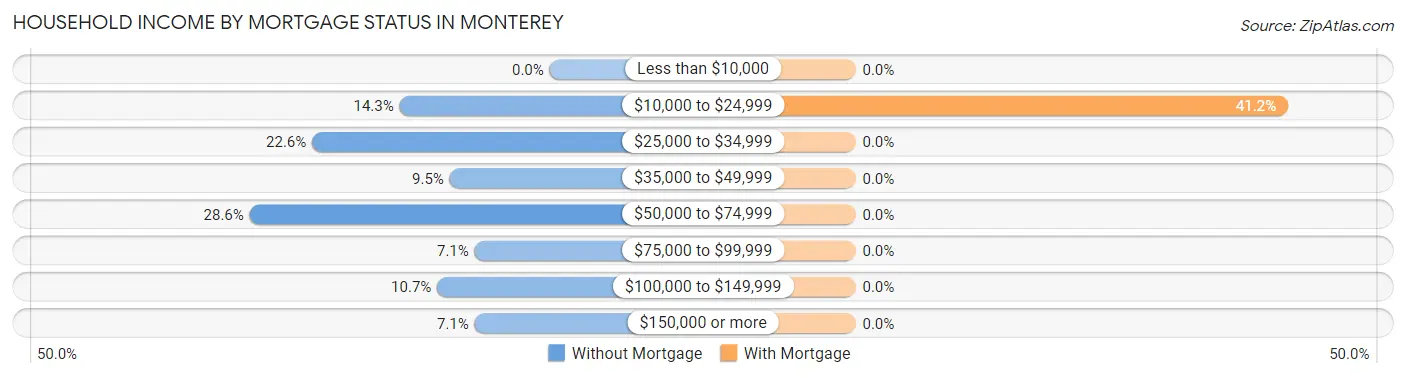
| Household Income | Without Mortgage | With Mortgage |
| Less than $10,000 | 0 (0.0%) | 0 (0.0%) |
| $10,000 to $24,999 | 12 (14.3%) | 7 (41.2%) |
| $25,000 to $34,999 | 19 (22.6%) | 0 (0.0%) |
| $35,000 to $49,999 | 8 (9.5%) | 0 (0.0%) |
| $50,000 to $74,999 | 24 (28.6%) | 0 (0.0%) |
| $75,000 to $99,999 | 6 (7.1%) | 0 (0.0%) |
| $100,000 to $149,999 | 9 (10.7%) | 0 (0.0%) |
| $150,000 or more | 6 (7.1%) | 0 (0.0%) |
| Total | 84 (100.0%) | 17 (100.0%) |
Property Value to Household Income Ratio in Monterey
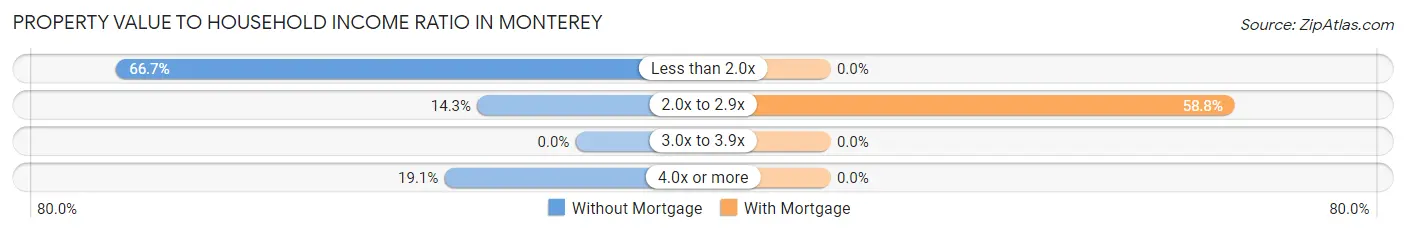
| Value-to-Income Ratio | Without Mortgage | With Mortgage |
| Less than 2.0x | 56 (66.7%) | 0 (0.0%) |
| 2.0x to 2.9x | 12 (14.3%) | 10 (58.8%) |
| 3.0x to 3.9x | 0 (0.0%) | 0 (0.0%) |
| 4.0x or more | 16 (19.1%) | 0 (0.0%) |
| Total | 84 (100.0%) | 17 (100.0%) |
Real Estate Taxes by Mortgage Status in Monterey
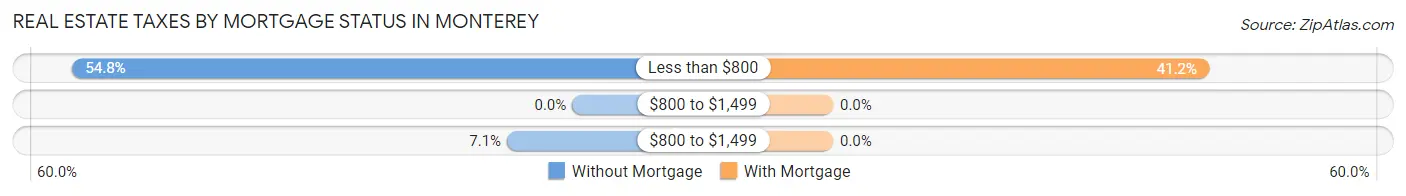
| Property Taxes | Without Mortgage | With Mortgage |
| Less than $800 | 46 (54.8%) | 7 (41.2%) |
| $800 to $1,499 | 0 (0.0%) | 0 (0.0%) |
| $800 to $1,499 | 6 (7.1%) | 0 (0.0%) |
| Total | 84 (100.0%) | 17 (100.0%) |
Health & Disability in Monterey
Health Insurance Coverage by Age in Monterey
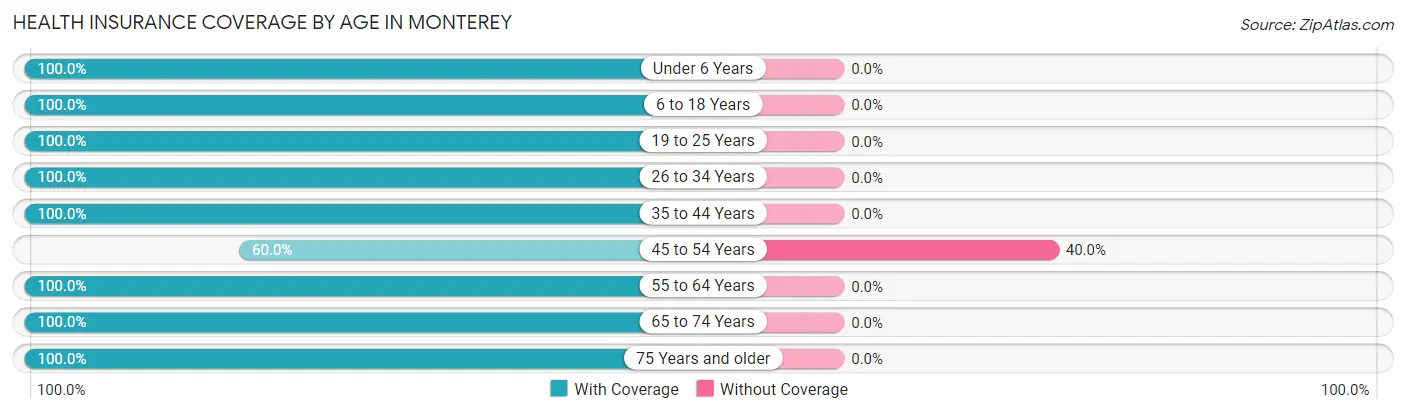
| Age Bracket | With Coverage | Without Coverage |
| Under 6 Years | 14 (100.0%) | 0 (0.0%) |
| 6 to 18 Years | 16 (100.0%) | 0 (0.0%) |
| 19 to 25 Years | 22 (100.0%) | 0 (0.0%) |
| 26 to 34 Years | 25 (100.0%) | 0 (0.0%) |
| 35 to 44 Years | 10 (100.0%) | 0 (0.0%) |
| 45 to 54 Years | 24 (60.0%) | 16 (40.0%) |
| 55 to 64 Years | 75 (100.0%) | 0 (0.0%) |
| 65 to 74 Years | 27 (100.0%) | 0 (0.0%) |
| 75 Years and older | 9 (100.0%) | 0 (0.0%) |
| Total | 222 (93.3%) | 16 (6.7%) |
Health Insurance Coverage by Citizenship Status in Monterey
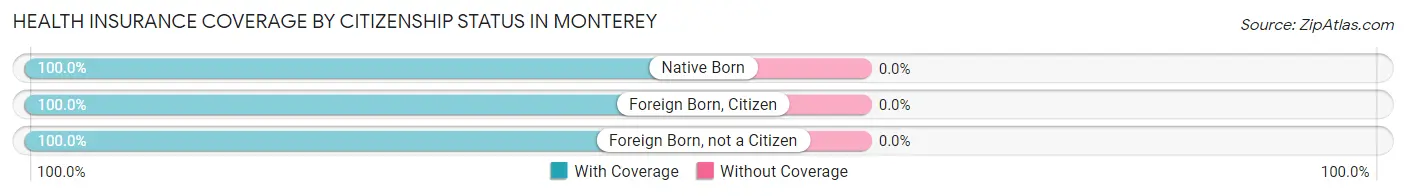
| Citizenship Status | With Coverage | Without Coverage |
| Native Born | 14 (100.0%) | 0 (0.0%) |
| Foreign Born, Citizen | 16 (100.0%) | 0 (0.0%) |
| Foreign Born, not a Citizen | 22 (100.0%) | 0 (0.0%) |
Health Insurance Coverage by Household Income in Monterey
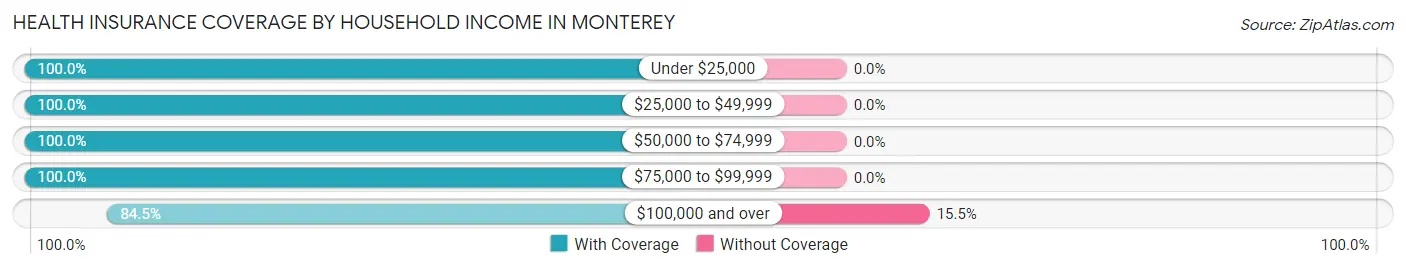
| Household Income | With Coverage | Without Coverage |
| Under $25,000 | 39 (100.0%) | 0 (0.0%) |
| $25,000 to $49,999 | 38 (100.0%) | 0 (0.0%) |
| $50,000 to $74,999 | 52 (100.0%) | 0 (0.0%) |
| $75,000 to $99,999 | 6 (100.0%) | 0 (0.0%) |
| $100,000 and over | 87 (84.5%) | 16 (15.5%) |
Public vs Private Health Insurance Coverage by Age in Monterey
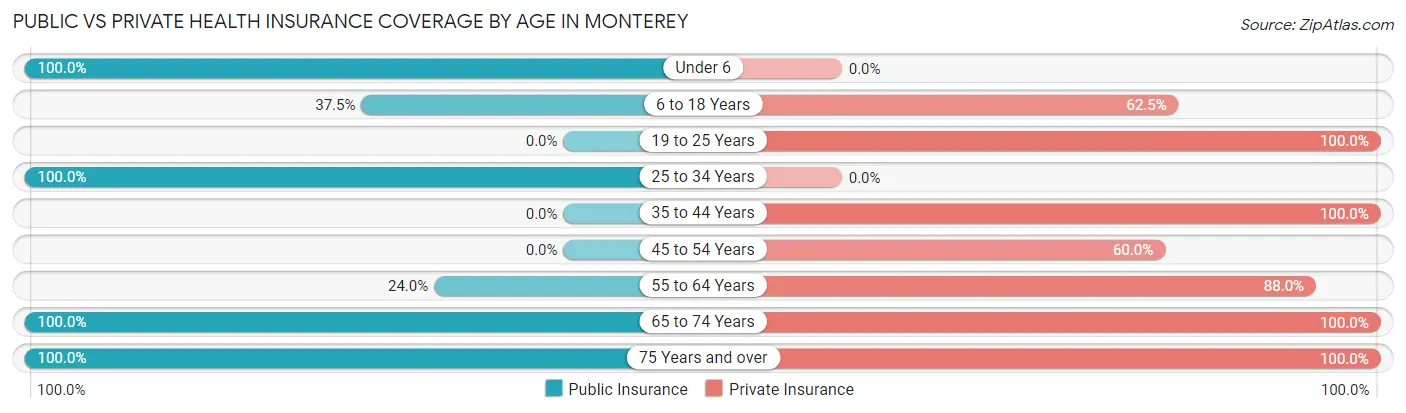
| Age Bracket | Public Insurance | Private Insurance |
| Under 6 | 14 (100.0%) | 0 (0.0%) |
| 6 to 18 Years | 6 (37.5%) | 10 (62.5%) |
| 19 to 25 Years | 0 (0.0%) | 22 (100.0%) |
| 25 to 34 Years | 25 (100.0%) | 0 (0.0%) |
| 35 to 44 Years | 0 (0.0%) | 10 (100.0%) |
| 45 to 54 Years | 0 (0.0%) | 24 (60.0%) |
| 55 to 64 Years | 18 (24.0%) | 66 (88.0%) |
| 65 to 74 Years | 27 (100.0%) | 27 (100.0%) |
| 75 Years and over | 9 (100.0%) | 9 (100.0%) |
| Total | 99 (41.6%) | 168 (70.6%) |
Disability Status by Sex by Age in Monterey
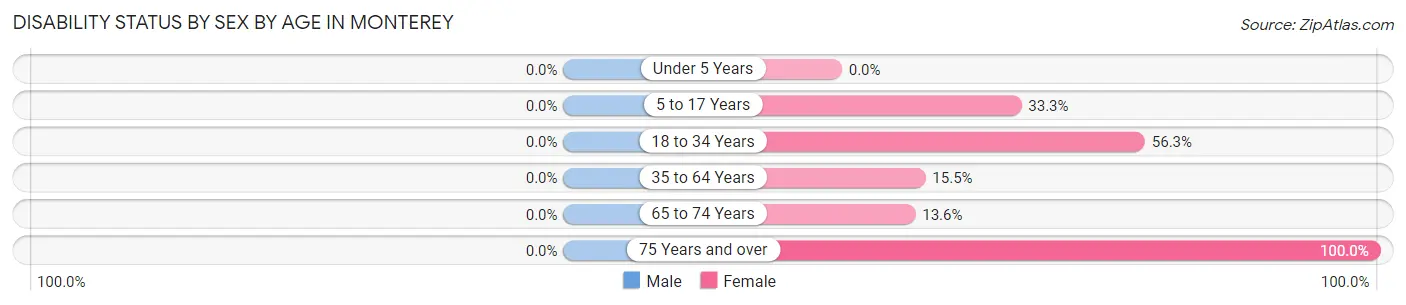
| Age Bracket | Male | Female |
| Under 5 Years | 0 (0.0%) | 0 (0.0%) |
| 5 to 17 Years | 0 (0.0%) | 3 (33.3%) |
| 18 to 34 Years | 0 (0.0%) | 18 (56.2%) |
| 35 to 64 Years | 0 (0.0%) | 9 (15.5%) |
| 65 to 74 Years | 0 (0.0%) | 3 (13.6%) |
| 75 Years and over | 0 (0.0%) | 6 (100.0%) |
Disability Class by Sex by Age in Monterey
Disability Class: Hearing Difficulty
| Age Bracket | Male | Female |
| Under 5 Years | 0 (0.0%) | 0 (0.0%) |
| 5 to 17 Years | 0 (0.0%) | 0 (0.0%) |
| 18 to 34 Years | 0 (0.0%) | 0 (0.0%) |
| 35 to 64 Years | 0 (0.0%) | 0 (0.0%) |
| 65 to 74 Years | 0 (0.0%) | 0 (0.0%) |
| 75 Years and over | 0 (0.0%) | 0 (0.0%) |
Disability Class: Vision Difficulty
| Age Bracket | Male | Female |
| Under 5 Years | 0 (0.0%) | 0 (0.0%) |
| 5 to 17 Years | 0 (0.0%) | 0 (0.0%) |
| 18 to 34 Years | 0 (0.0%) | 0 (0.0%) |
| 35 to 64 Years | 0 (0.0%) | 0 (0.0%) |
| 65 to 74 Years | 0 (0.0%) | 0 (0.0%) |
| 75 Years and over | 0 (0.0%) | 0 (0.0%) |
Disability Class: Cognitive Difficulty
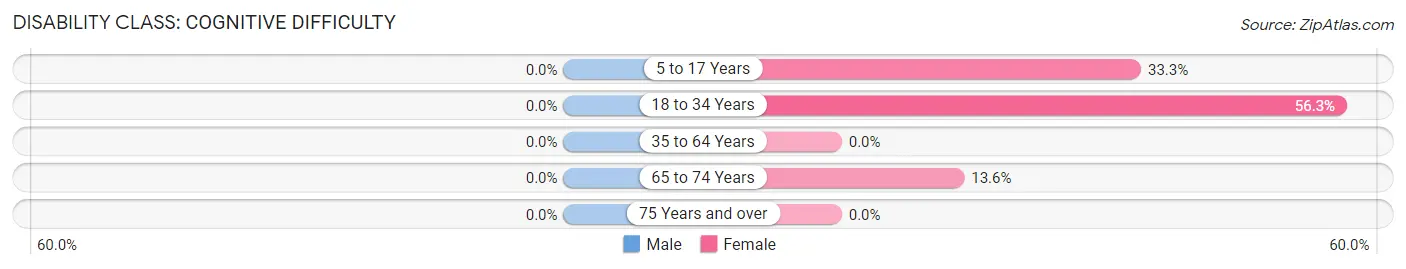
| Age Bracket | Male | Female |
| 5 to 17 Years | 0 (0.0%) | 3 (33.3%) |
| 18 to 34 Years | 0 (0.0%) | 18 (56.2%) |
| 35 to 64 Years | 0 (0.0%) | 0 (0.0%) |
| 65 to 74 Years | 0 (0.0%) | 3 (13.6%) |
| 75 Years and over | 0 (0.0%) | 0 (0.0%) |
Disability Class: Ambulatory Difficulty
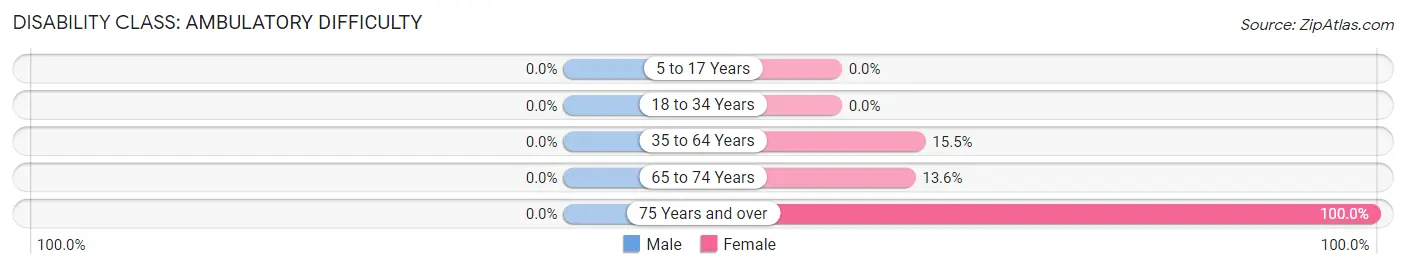
| Age Bracket | Male | Female |
| 5 to 17 Years | 0 (0.0%) | 0 (0.0%) |
| 18 to 34 Years | 0 (0.0%) | 0 (0.0%) |
| 35 to 64 Years | 0 (0.0%) | 9 (15.5%) |
| 65 to 74 Years | 0 (0.0%) | 3 (13.6%) |
| 75 Years and over | 0 (0.0%) | 6 (100.0%) |
Disability Class: Self-Care Difficulty
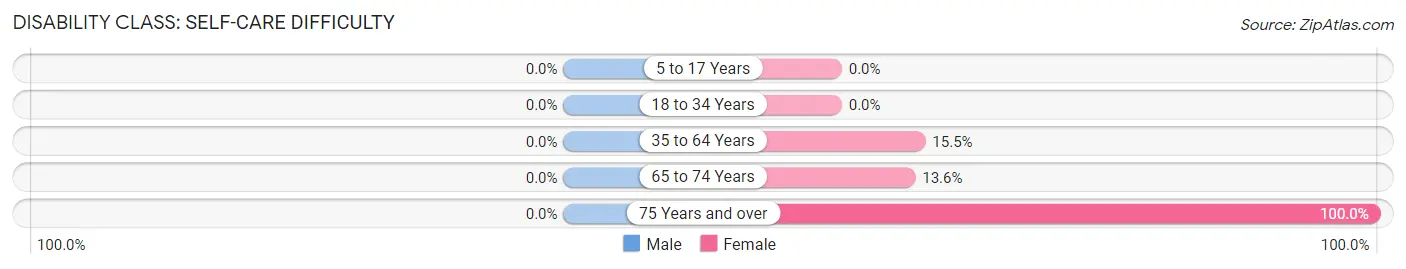
| Age Bracket | Male | Female |
| 5 to 17 Years | 0 (0.0%) | 0 (0.0%) |
| 18 to 34 Years | 0 (0.0%) | 0 (0.0%) |
| 35 to 64 Years | 0 (0.0%) | 9 (15.5%) |
| 65 to 74 Years | 0 (0.0%) | 3 (13.6%) |
| 75 Years and over | 0 (0.0%) | 6 (100.0%) |
Technology Access in Monterey
Computing Device Access in Monterey
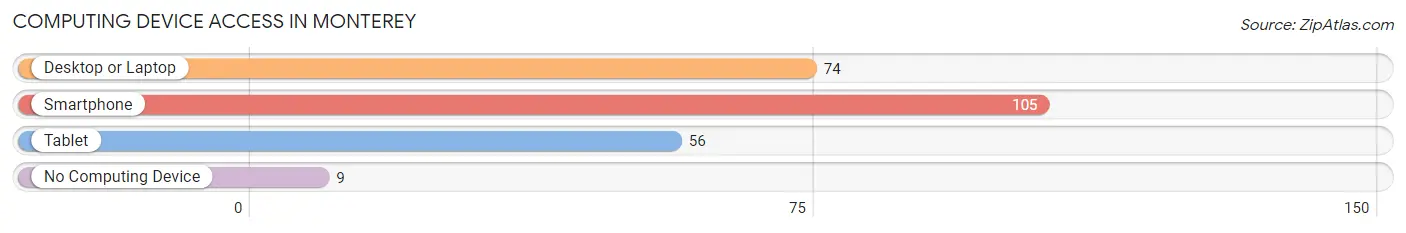
| Device Type | # Households | % Households |
| Desktop or Laptop | 74 | 63.2% |
| Smartphone | 105 | 89.7% |
| Tablet | 56 | 47.9% |
| No Computing Device | 9 | 7.7% |
| Total | 117 | 100.0% |
Internet Access in Monterey
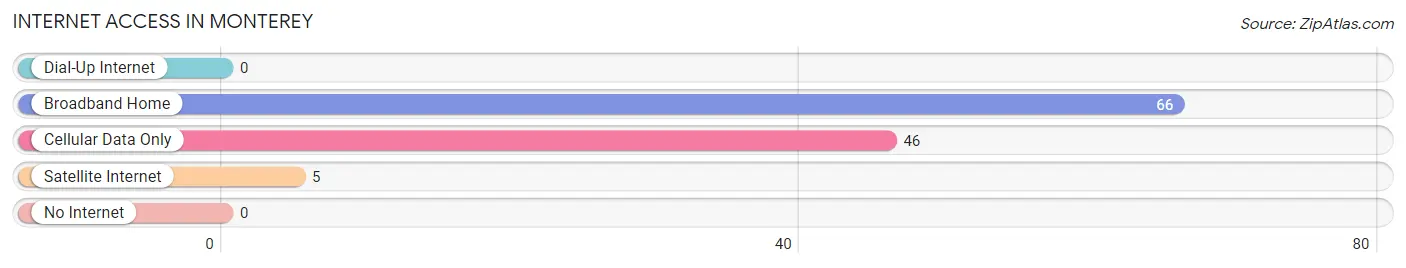
| Internet Type | # Households | % Households |
| Dial-Up Internet | 0 | 0.0% |
| Broadband Home | 66 | 56.4% |
| Cellular Data Only | 46 | 39.3% |
| Satellite Internet | 5 | 4.3% |
| No Internet | 0 | 0.0% |
| Total | 117 | 100.0% |
Monterey Summary
Monterey is a city located in Los Angeles County, California. It is situated in the southwestern corner of the county, and is bordered by the cities of Long Beach, Torrance, and Redondo Beach. The population of Monterey was estimated to be around 33,000 in 2019.
History
Monterey was originally inhabited by the Tongva people, who were the original inhabitants of the Los Angeles Basin. The area was first explored by Spanish explorers in the late 1700s, and the first settlement was established in 1784. The settlement was named El Pueblo de Nuestra Señora de los Angeles de la Monterey, which translates to “The Town of Our Lady of the Angels of Monterey.”
In the early 1800s, the area was part of the Rancho San Pedro, which was granted to Juan Jose Dominguez by the Spanish government. The rancho was later divided into smaller parcels, and the area that is now Monterey was part of the Rancho Sausal Redondo.
In the late 1800s, the area was developed as a resort town, and the first hotel was built in 1887. The town was incorporated in 1911, and the name was changed to Monterey Park in 1916.
Geography
Monterey is located in the southwestern corner of Los Angeles County, and is bordered by the cities of Long Beach, Torrance, and Redondo Beach. The city covers an area of 4.3 square miles, and has a population density of 7,717 people per square mile.
The city is located in the Los Angeles Basin, and is surrounded by hills and mountains. The highest point in the city is the Monterey Hills, which rises to an elevation of 1,000 feet.
The climate in Monterey is classified as a Mediterranean climate, with warm, dry summers and mild, wet winters. The average temperature in the summer is around 75 degrees Fahrenheit, and the average temperature in the winter is around 55 degrees Fahrenheit.
Economy
The economy of Monterey is largely based on tourism and retail. The city is home to several shopping centers, including the Monterey Plaza Shopping Center and the Monterey Marketplace. The city is also home to several restaurants, bars, and entertainment venues.
The city is also home to several major employers, including the Los Angeles County Department of Health Services, the Los Angeles County Sheriff’s Department, and the Los Angeles County Fire Department.
Demographics
As of 2019, the population of Monterey was estimated to be around 33,000. The population is largely Hispanic, with around 70% of the population identifying as Hispanic or Latino. The median household income in the city is around $60,000, and the median home value is around $600,000.
The city is also home to a large number of immigrants, with around 25% of the population being foreign-born. The largest immigrant groups in the city are from Mexico, El Salvador, and Guatemala.
Conclusion
Monterey is a city located in Los Angeles County, California. It is situated in the southwestern corner of the county, and is bordered by the cities of Long Beach, Torrance, and Redondo Beach. The population of Monterey was estimated to be around 33,000 in 2019. The city has a long history, and was originally inhabited by the Tongva people. The economy of Monterey is largely based on tourism and retail, and the city is home to several major employers. The population of Monterey is largely Hispanic, with around 70% of the population identifying as Hispanic or Latino. The city is also home to a large number of immigrants, with around 25% of the population being foreign-born.
Common Questions
What is Per Capita Income in Monterey?
Per Capita income in Monterey is $53,279.
What is Inequality or Gini Index in Monterey?
Inequality or Gini Index in Monterey is 0.54.
What is the Total Population of Monterey?
Total Population of Monterey is 238.
What is the Total Male Population of Monterey?
Total Male Population of Monterey is 109.
What is the Total Female Population of Monterey?
Total Female Population of Monterey is 129.
What is the Ratio of Males per 100 Females in Monterey?
There are 84.50 Males per 100 Females in Monterey.
What is the Ratio of Females per 100 Males in Monterey?
There are 118.35 Females per 100 Males in Monterey.
What is the Median Population Age in Monterey?
Median Population Age in Monterey is 50.0 Years.
What is the Average Family Size in Monterey
Average Family Size in Monterey is 2.9 People.
What is the Average Household Size in Monterey
Average Household Size in Monterey is 2.0 People.
How Large is the Labor Force in Monterey?
There are 55 People in the Labor Forcein in Monterey.
What is the Percentage of People in the Labor Force in Monterey?
25.2% of People are in the Labor Force in Monterey.
What is the Unemployment Rate in Monterey?
Unemployment Rate in Monterey is 12.7%.