Mer Rouge, LA Map & Demographics
Mer Rouge Map
Mer Rouge Overview
$26,924
PER CAPITA INCOME
$54,167
AVG FAMILY INCOME
72.0%
WAGE / INCOME GAP [ % ]
28.0¢/ $1
WAGE / INCOME GAP [ $ ]
0.55
INEQUALITY / GINI INDEX
812
TOTAL POPULATION
364
MALE POPULATION
448
FEMALE POPULATION
81.25
MALES / 100 FEMALES
123.08
FEMALES / 100 MALES
34.7
MEDIAN AGE
3.4
AVG FAMILY SIZE
2.5
AVG HOUSEHOLD SIZE
315
LABOR FORCE [ PEOPLE ]
57.0%
PERCENT IN LABOR FORCE
9.5%
UNEMPLOYMENT RATE
Mer Rouge Zip Codes
Mer Rouge Area Codes
Income in Mer Rouge
Income Overview in Mer Rouge
| Characteristic | Number | Measure |
| Per Capita Income | 812 | $26,924 |
| Median Family Income | 174 | $54,167 |
| Mean Family Income | 174 | $81,618 |
| Median Household Income | 288 | $0 |
| Mean Household Income | 288 | $68,140 |
| Income Deficit | 174 | $0 |
| Wage / Income Gap (%) | 812 | 71.99% |
| Wage / Income Gap ($) | 812 | 28.01¢ per $1 |
| Gini / Inequality Index | 812 | 0.55 |
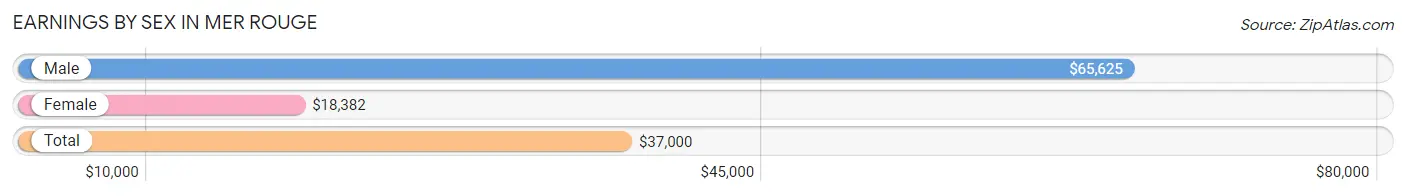
Earnings by Sex in Mer Rouge
Average Earnings in Mer Rouge are $37,000, $65,625 for men and $18,382 for women, a difference of 72.0%.
| Sex | Number | Average Earnings |
| Male | 150 (48.4%) | $65,625 |
| Female | 160 (51.6%) | $18,382 |
| Total | 310 (100.0%) | $37,000 |
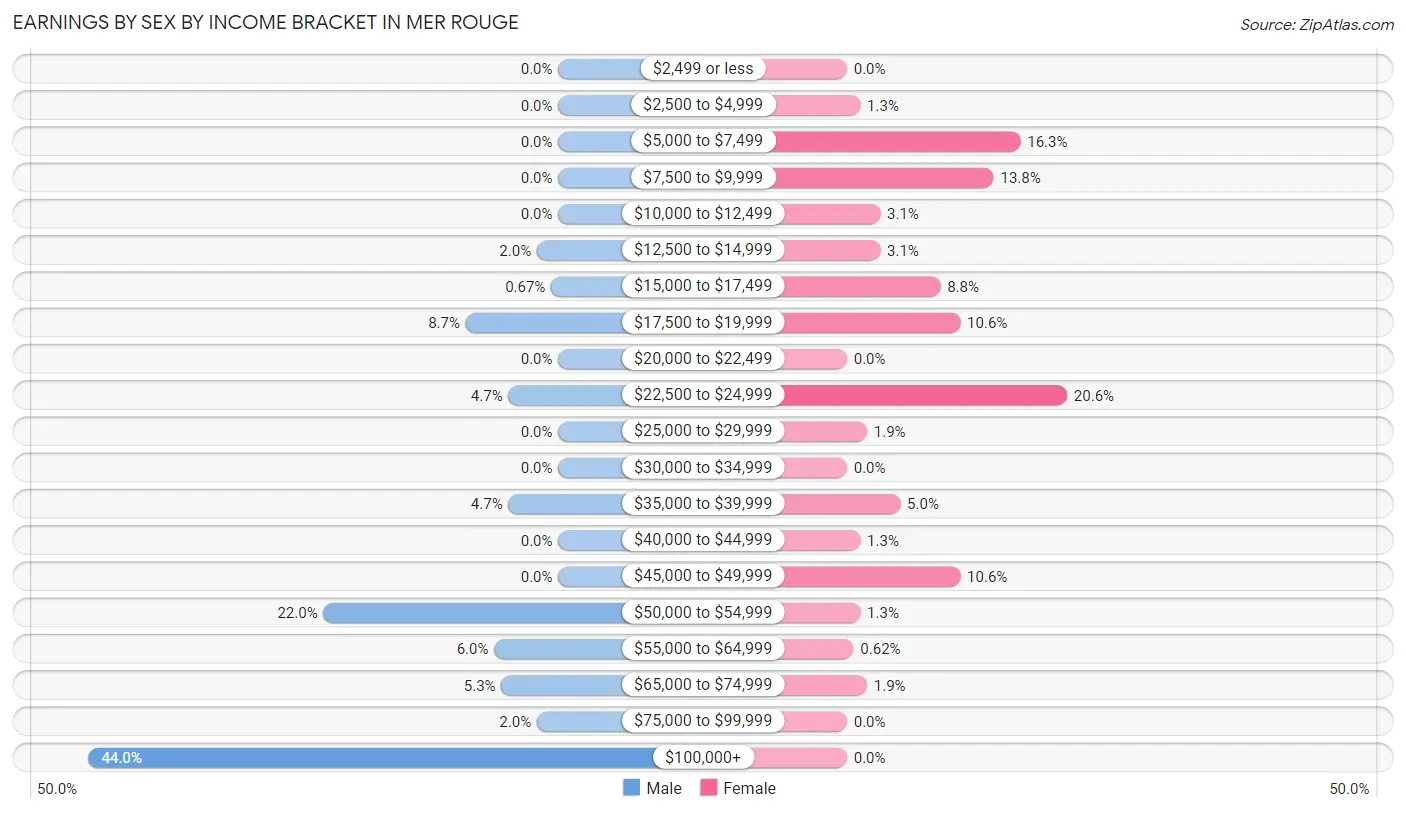
Earnings by Sex by Income Bracket in Mer Rouge
The most common earnings brackets in Mer Rouge are $100,000+ for men (66 | 44.0%) and $22,500 to $24,999 for women (33 | 20.6%).
| Income | Male | Female |
| $2,499 or less | 0 (0.0%) | 0 (0.0%) |
| $2,500 to $4,999 | 0 (0.0%) | 2 (1.3%) |
| $5,000 to $7,499 | 0 (0.0%) | 26 (16.3%) |
| $7,500 to $9,999 | 0 (0.0%) | 22 (13.8%) |
| $10,000 to $12,499 | 0 (0.0%) | 5 (3.1%) |
| $12,500 to $14,999 | 3 (2.0%) | 5 (3.1%) |
| $15,000 to $17,499 | 1 (0.7%) | 14 (8.7%) |
| $17,500 to $19,999 | 13 (8.7%) | 17 (10.6%) |
| $20,000 to $22,499 | 0 (0.0%) | 0 (0.0%) |
| $22,500 to $24,999 | 7 (4.7%) | 33 (20.6%) |
| $25,000 to $29,999 | 0 (0.0%) | 3 (1.9%) |
| $30,000 to $34,999 | 0 (0.0%) | 0 (0.0%) |
| $35,000 to $39,999 | 7 (4.7%) | 8 (5.0%) |
| $40,000 to $44,999 | 0 (0.0%) | 2 (1.3%) |
| $45,000 to $49,999 | 0 (0.0%) | 17 (10.6%) |
| $50,000 to $54,999 | 33 (22.0%) | 2 (1.3%) |
| $55,000 to $64,999 | 9 (6.0%) | 1 (0.6%) |
| $65,000 to $74,999 | 8 (5.3%) | 3 (1.9%) |
| $75,000 to $99,999 | 3 (2.0%) | 0 (0.0%) |
| $100,000+ | 66 (44.0%) | 0 (0.0%) |
| Total | 150 (100.0%) | 160 (100.0%) |
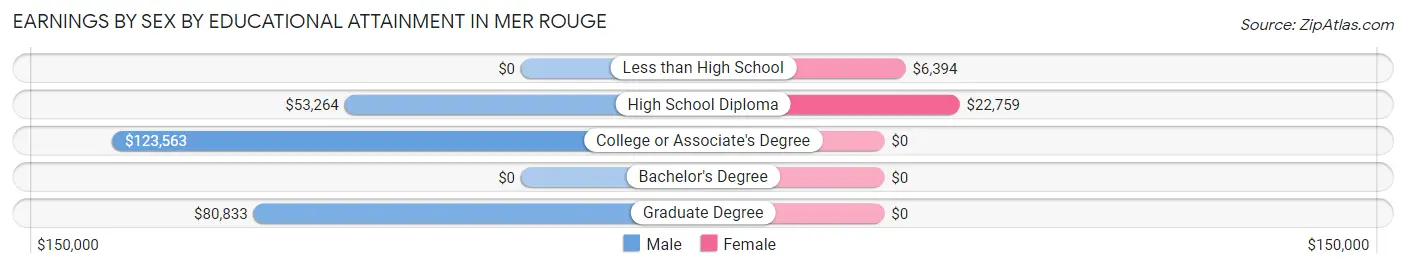
Earnings by Sex by Educational Attainment in Mer Rouge
Average earnings in Mer Rouge are $100,357 for men and $18,603 for women, a difference of 81.5%. Men with an educational attainment of college or associate's degree enjoy the highest average annual earnings of $123,563, while those with high school diploma education earn the least with $53,264. Women with an educational attainment of high school diploma earn the most with the average annual earnings of $22,759, while those with less than high school education have the smallest earnings of $6,394.
| Educational Attainment | Male Income | Female Income |
| Less than High School | - | - |
| High School Diploma | $53,264 | $22,759 |
| College or Associate's Degree | $123,563 | $0 |
| Bachelor's Degree | - | - |
| Graduate Degree | $80,833 | $0 |
| Total | $100,357 | $18,603 |
Family Income in Mer Rouge
Family Income Brackets in Mer Rouge
According to the Mer Rouge family income data, there are 38 families falling into the less than $10,000 income range, which is the most common income bracket and makes up 21.8% of all families.
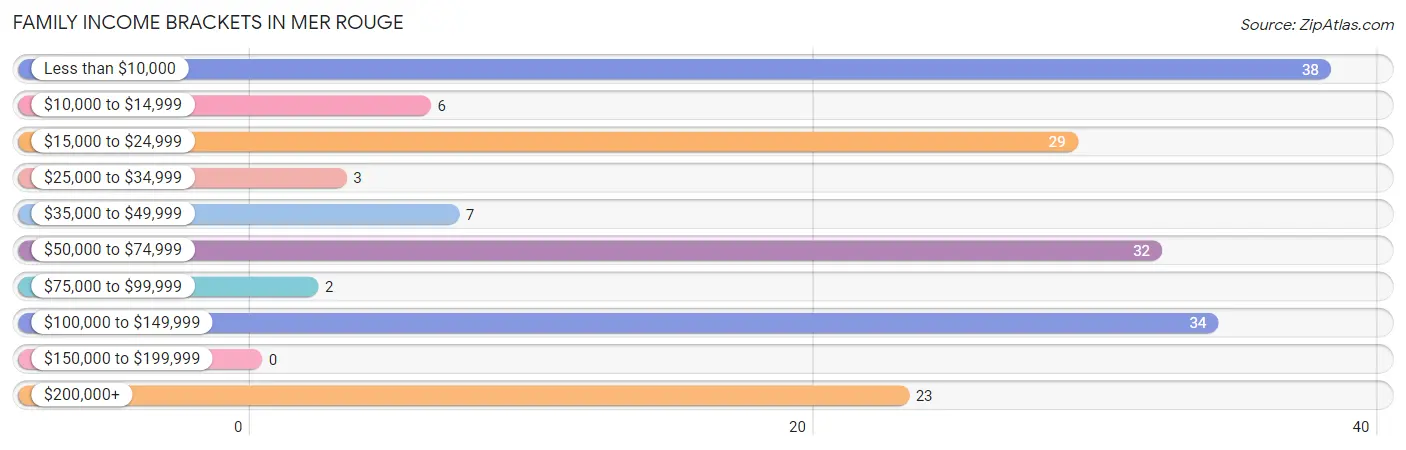
| Income Bracket | # Families | % Families |
| Less than $10,000 | 38 | 21.8% |
| $10,000 to $14,999 | 6 | 3.4% |
| $15,000 to $24,999 | 29 | 16.7% |
| $25,000 to $34,999 | 3 | 1.7% |
| $35,000 to $49,999 | 7 | 4.0% |
| $50,000 to $74,999 | 32 | 18.4% |
| $75,000 to $99,999 | 2 | 1.1% |
| $100,000 to $149,999 | 34 | 19.5% |
| $150,000 to $199,999 | 0 | 0.0% |
| $200,000+ | 23 | 13.2% |
Family Income by Famaliy Size in Mer Rouge
3-person families (12 | 6.9%) account for the highest median family income in Mer Rouge with $65,357 per family, while 3-person families (12 | 6.9%) have the highest median income of $21,786 per family member.
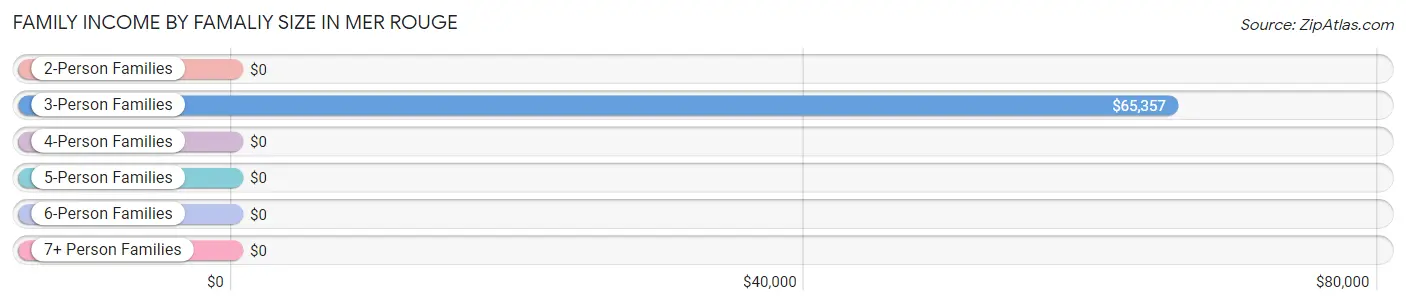
| Income Bracket | # Families | Median Income |
| 2-Person Families | 106 (60.9%) | $0 |
| 3-Person Families | 12 (6.9%) | $65,357 |
| 4-Person Families | 49 (28.2%) | $0 |
| 5-Person Families | 7 (4.0%) | $0 |
| 6-Person Families | 0 (0.0%) | $0 |
| 7+ Person Families | 0 (0.0%) | $0 |
| Total | 174 (100.0%) | $54,167 |
Family Income by Number of Earners in Mer Rouge
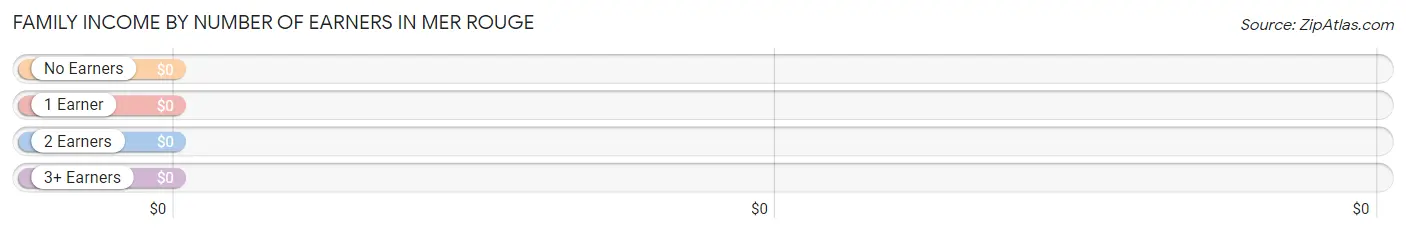
| Number of Earners | # Families | Median Income |
| No Earners | 21 (12.1%) | $0 |
| 1 Earner | 106 (60.9%) | $0 |
| 2 Earners | 40 (23.0%) | $0 |
| 3+ Earners | 7 (4.0%) | $0 |
| Total | 174 (100.0%) | $54,167 |
Household Income in Mer Rouge
Household Income Brackets in Mer Rouge
With 74 households falling in the category, the $15,000 to $24,999 income range is the most frequent in Mer Rouge, accounting for 25.7% of all households.
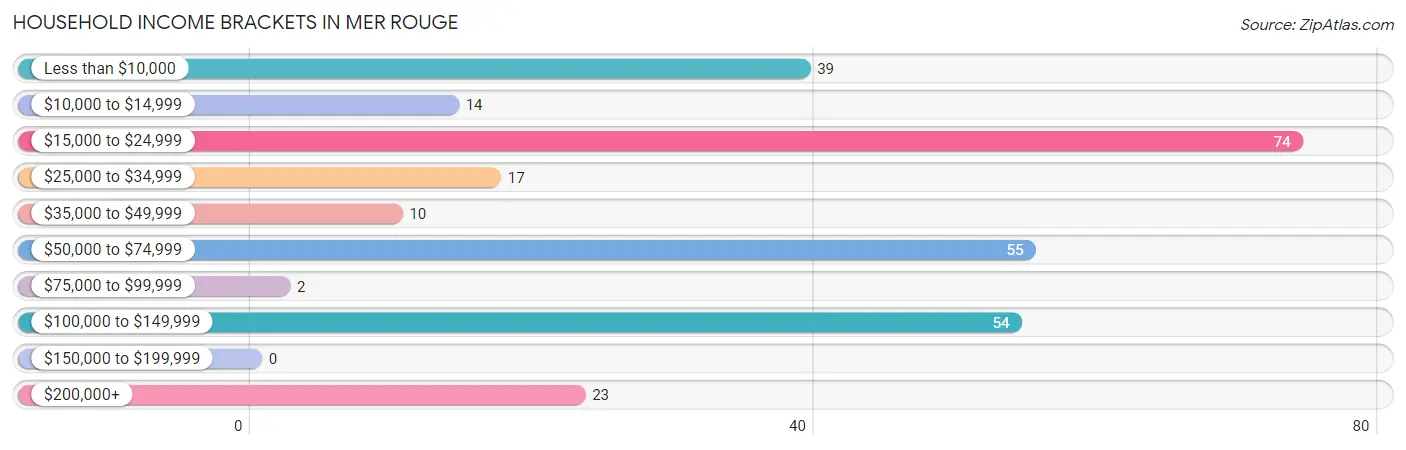
| Income Bracket | # Households | % Households |
| Less than $10,000 | 39 | 13.5% |
| $10,000 to $14,999 | 14 | 4.9% |
| $15,000 to $24,999 | 74 | 25.7% |
| $25,000 to $34,999 | 17 | 5.9% |
| $35,000 to $49,999 | 10 | 3.5% |
| $50,000 to $74,999 | 55 | 19.1% |
| $75,000 to $99,999 | 2 | 0.7% |
| $100,000 to $149,999 | 54 | 18.8% |
| $150,000 to $199,999 | 0 | 0.0% |
| $200,000+ | 23 | 8.0% |
Household Income by Householder Age in Mer Rouge
The median household income in Mer Rouge is $0, with the highest median household income of $38,125 found in the 45 to 64 years age bracket for the primary householder. A total of 82 households (28.5%) fall into this category. Meanwhile, the 15 to 24 years age bracket for the primary householder has the lowest median household income of $0, with 10 households (3.5%) in this group.
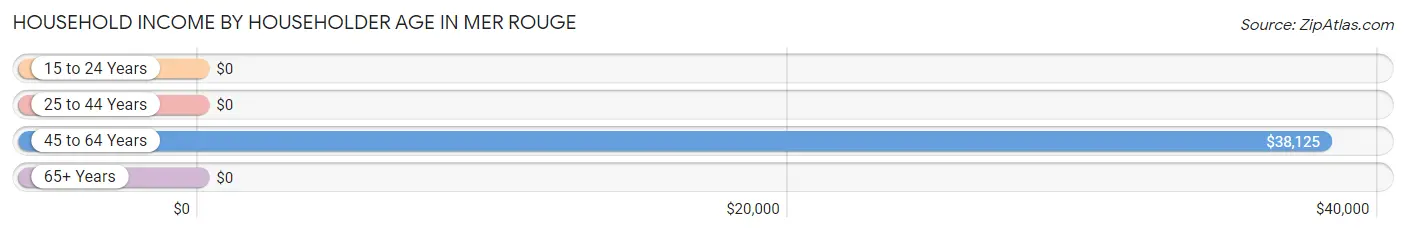
| Income Bracket | # Households | Median Income |
| 15 to 24 Years | 10 (3.5%) | $0 |
| 25 to 44 Years | 145 (50.3%) | $0 |
| 45 to 64 Years | 82 (28.5%) | $38,125 |
| 65+ Years | 51 (17.7%) | $0 |
| Total | 288 (100.0%) | $0 |
Poverty in Mer Rouge
Income Below Poverty by Sex and Age in Mer Rouge
With 27.2% poverty level for males and 56.5% for females among the residents of Mer Rouge, 5 year old males and under 5 year old females are the most vulnerable to poverty, with 3 males (100.0%) and 73 females (100.0%) in their respective age groups living below the poverty level.
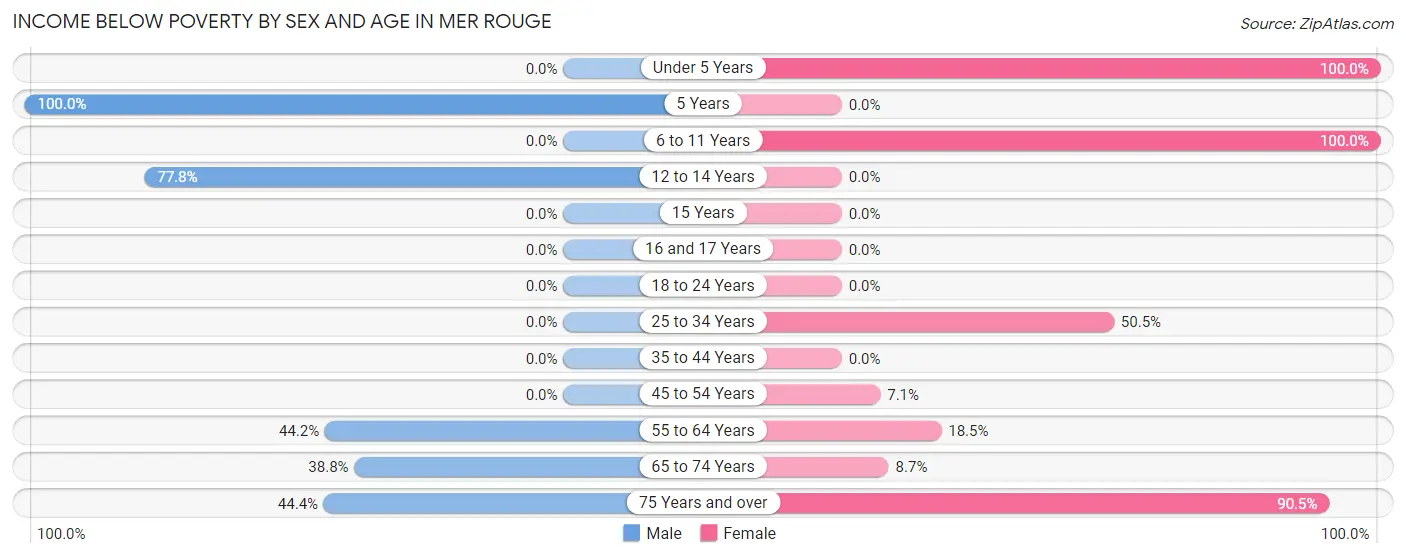
| Age Bracket | Male | Female |
| Under 5 Years | 0 (0.0%) | 73 (100.0%) |
| 5 Years | 3 (100.0%) | 0 (0.0%) |
| 6 to 11 Years | 0 (0.0%) | 70 (100.0%) |
| 12 to 14 Years | 42 (77.8%) | 0 (0.0%) |
| 15 Years | 0 (0.0%) | 0 (0.0%) |
| 16 and 17 Years | 0 (0.0%) | 0 (0.0%) |
| 18 to 24 Years | 0 (0.0%) | 0 (0.0%) |
| 25 to 34 Years | 0 (0.0%) | 50 (50.5%) |
| 35 to 44 Years | 0 (0.0%) | 0 (0.0%) |
| 45 to 54 Years | 0 (0.0%) | 1 (7.1%) |
| 55 to 64 Years | 23 (44.2%) | 12 (18.5%) |
| 65 to 74 Years | 19 (38.8%) | 2 (8.7%) |
| 75 Years and over | 4 (44.4%) | 19 (90.5%) |
| Total | 91 (27.2%) | 227 (56.5%) |
Income Above Poverty by Sex and Age in Mer Rouge
According to the poverty statistics in Mer Rouge, males aged under 5 years and females aged 16 and 17 years are the age groups that are most secure financially, with 100.0% of males and 100.0% of females in these age groups living above the poverty line.
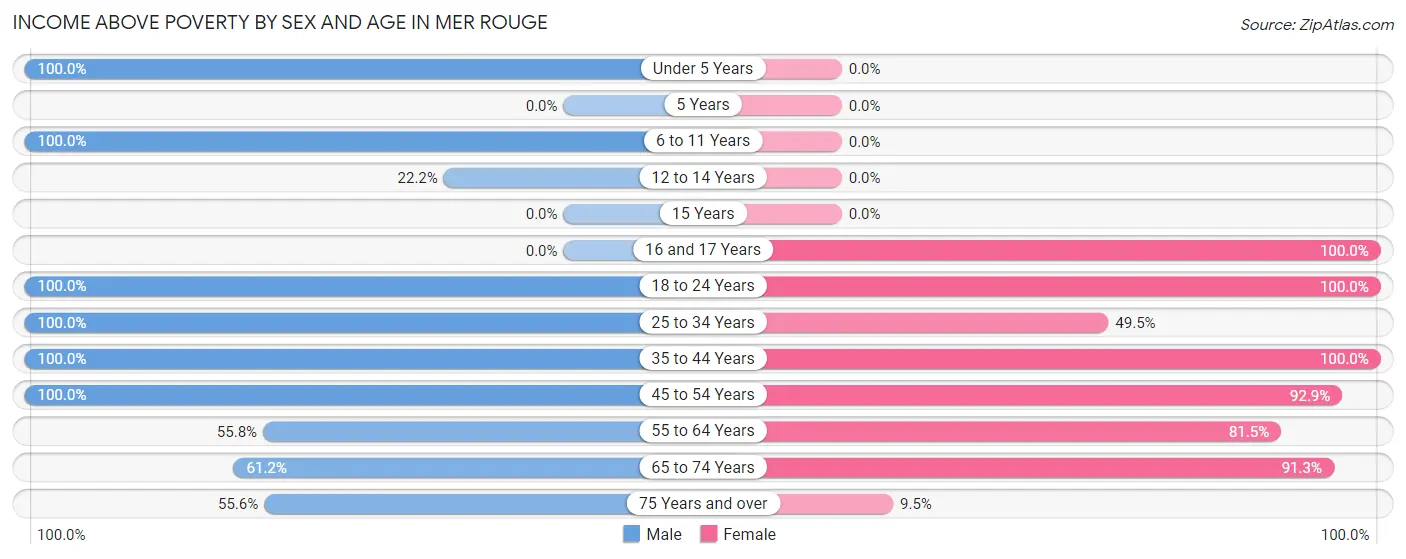
| Age Bracket | Male | Female |
| Under 5 Years | 30 (100.0%) | 0 (0.0%) |
| 5 Years | 0 (0.0%) | 0 (0.0%) |
| 6 to 11 Years | 29 (100.0%) | 0 (0.0%) |
| 12 to 14 Years | 12 (22.2%) | 0 (0.0%) |
| 15 Years | 0 (0.0%) | 0 (0.0%) |
| 16 and 17 Years | 0 (0.0%) | 6 (100.0%) |
| 18 to 24 Years | 20 (100.0%) | 6 (100.0%) |
| 25 to 34 Years | 23 (100.0%) | 49 (49.5%) |
| 35 to 44 Years | 54 (100.0%) | 25 (100.0%) |
| 45 to 54 Years | 12 (100.0%) | 13 (92.9%) |
| 55 to 64 Years | 29 (55.8%) | 53 (81.5%) |
| 65 to 74 Years | 30 (61.2%) | 21 (91.3%) |
| 75 Years and over | 5 (55.6%) | 2 (9.5%) |
| Total | 244 (72.8%) | 175 (43.5%) |
Income Below Poverty Among Married-Couple Families in Mer Rouge
The poverty statistics for married-couple families in Mer Rouge show that 15.3% or 15 of the total 98 families live below the poverty line. Families with no children have the highest poverty rate of 21.7%, comprising of 15 families. On the other hand, families with 1 or 2 children have the lowest poverty rate of 0.0%, which includes 0 families.
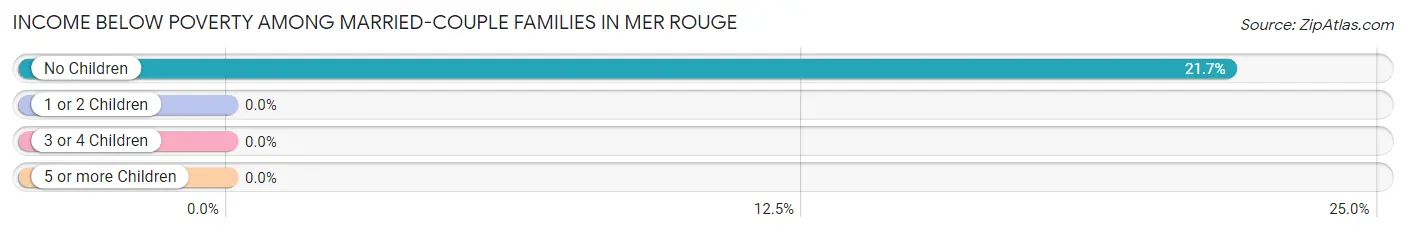
| Children | Above Poverty | Below Poverty |
| No Children | 54 (78.3%) | 15 (21.7%) |
| 1 or 2 Children | 22 (100.0%) | 0 (0.0%) |
| 3 or 4 Children | 7 (100.0%) | 0 (0.0%) |
| 5 or more Children | 0 (0.0%) | 0 (0.0%) |
| Total | 83 (84.7%) | 15 (15.3%) |
Income Below Poverty Among Single-Parent Households in Mer Rouge
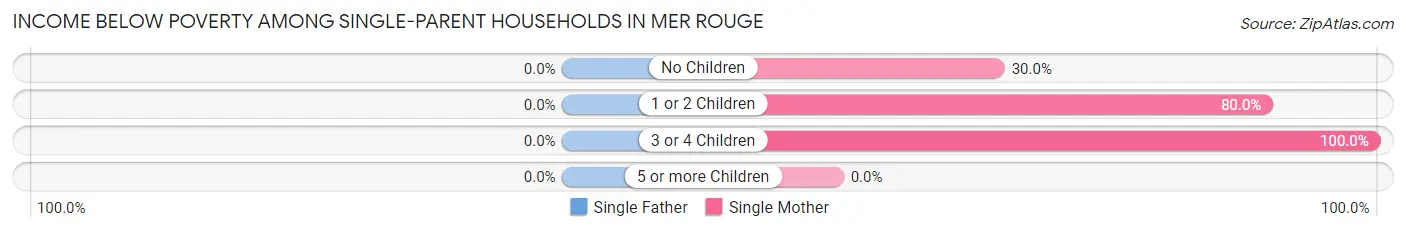
| Children | Single Father | Single Mother |
| No Children | 0 (0.0%) | 6 (30.0%) |
| 1 or 2 Children | 0 (0.0%) | 24 (80.0%) |
| 3 or 4 Children | 0 (0.0%) | 26 (100.0%) |
| 5 or more Children | 0 (0.0%) | 0 (0.0%) |
| Total | 0 (0.0%) | 56 (73.7%) |
Income Below Poverty Among Married-Couple vs Single-Parent Households in Mer Rouge
The poverty data for Mer Rouge shows that 15 of the married-couple family households (15.3%) and 56 of the single-parent households (73.7%) are living below the poverty level. Within the married-couple family households, those with no children have the highest poverty rate, with 15 households (21.7%) falling below the poverty line. Among the single-parent households, those with 3 or 4 children have the highest poverty rate, with 26 household (100.0%) living below poverty.
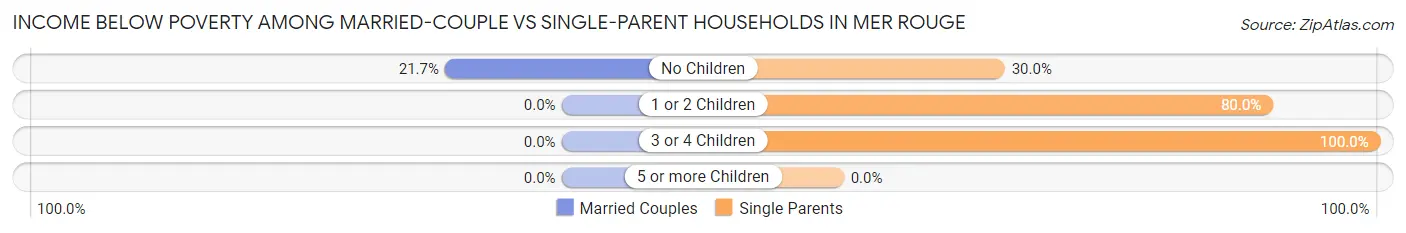
| Children | Married-Couple Families | Single-Parent Households |
| No Children | 15 (21.7%) | 6 (30.0%) |
| 1 or 2 Children | 0 (0.0%) | 24 (80.0%) |
| 3 or 4 Children | 0 (0.0%) | 26 (100.0%) |
| 5 or more Children | 0 (0.0%) | 0 (0.0%) |
| Total | 15 (15.3%) | 56 (73.7%) |
Race in Mer Rouge
The most populous races in Mer Rouge are Black / African American (419 | 51.6%), White / Caucasian (375 | 46.2%), and Two or more Races (17 | 2.1%).
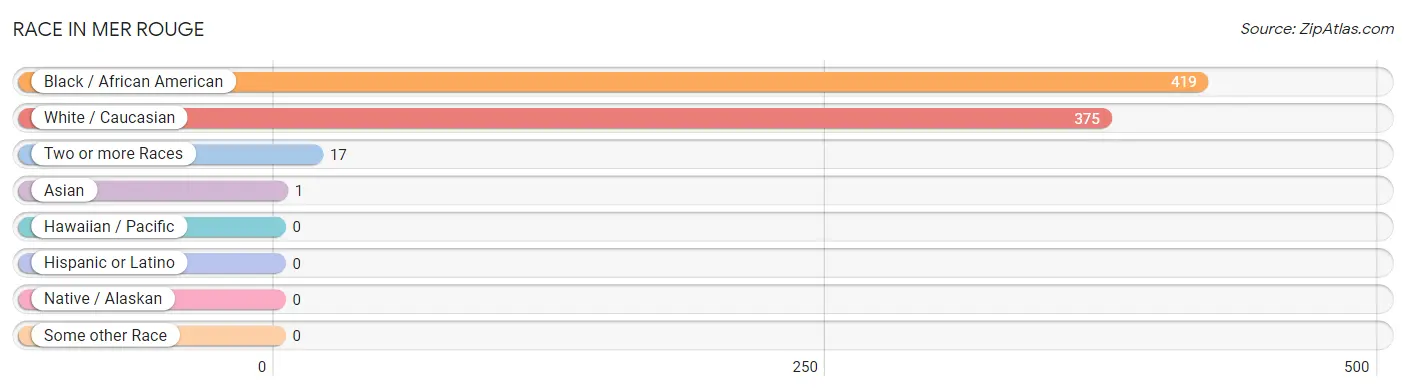
| Race | # Population | % Population |
| Asian | 1 | 0.1% |
| Black / African American | 419 | 51.6% |
| Hawaiian / Pacific | 0 | 0.0% |
| Hispanic or Latino | 0 | 0.0% |
| Native / Alaskan | 0 | 0.0% |
| White / Caucasian | 375 | 46.2% |
| Two or more Races | 17 | 2.1% |
| Some other Race | 0 | 0.0% |
| Total | 812 | 100.0% |
Ancestry in Mer Rouge
The most populous ancestries reported in Mer Rouge are Irish (66 | 8.1%), English (28 | 3.5%), German (24 | 3.0%), American (23 | 2.8%), and European (20 | 2.5%), together accounting for 19.8% of all Mer Rouge residents.
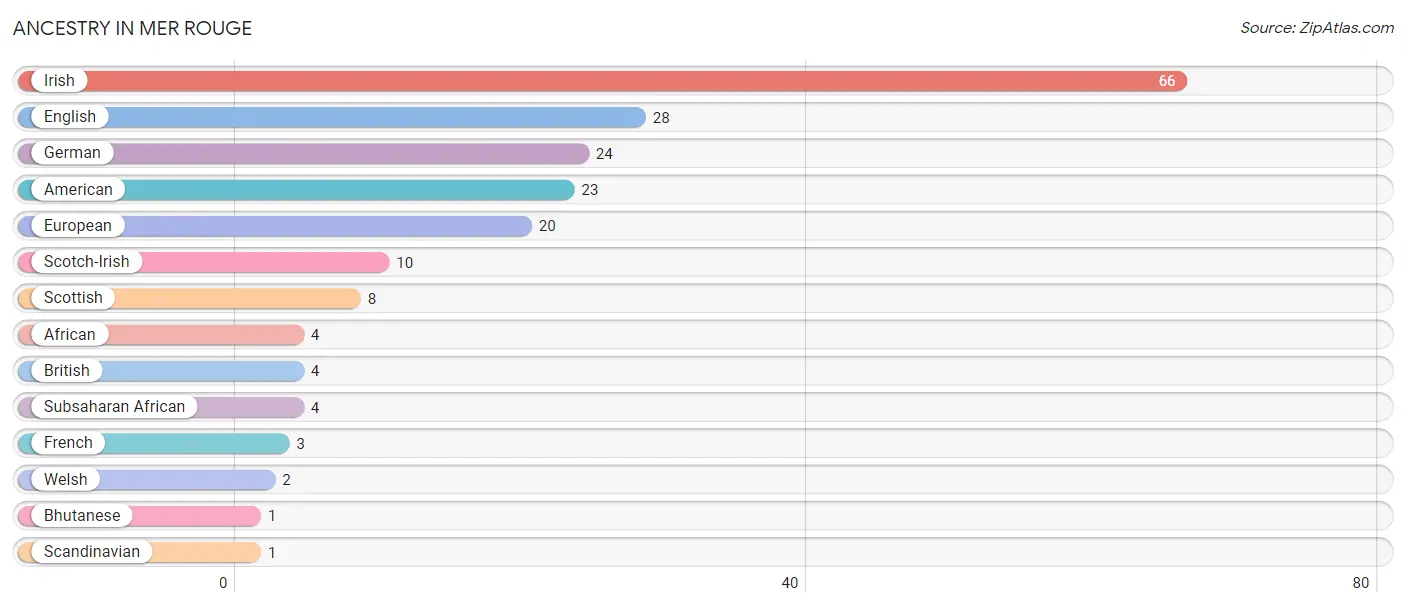
| Ancestry | # Population | % Population |
| African | 4 | 0.5% |
| American | 23 | 2.8% |
| Bhutanese | 1 | 0.1% |
| British | 4 | 0.5% |
| English | 28 | 3.5% |
| European | 20 | 2.5% |
| French | 3 | 0.4% |
| German | 24 | 3.0% |
| Irish | 66 | 8.1% |
| Scandinavian | 1 | 0.1% |
| Scotch-Irish | 10 | 1.2% |
| Scottish | 8 | 1.0% |
| Subsaharan African | 4 | 0.5% |
| Welsh | 2 | 0.3% | View All 14 Rows |
Immigrants in Mer Rouge

| Immigration Origin | # Population | % Population | View All 0 Rows |
Sex and Age in Mer Rouge
Sex and Age in Mer Rouge
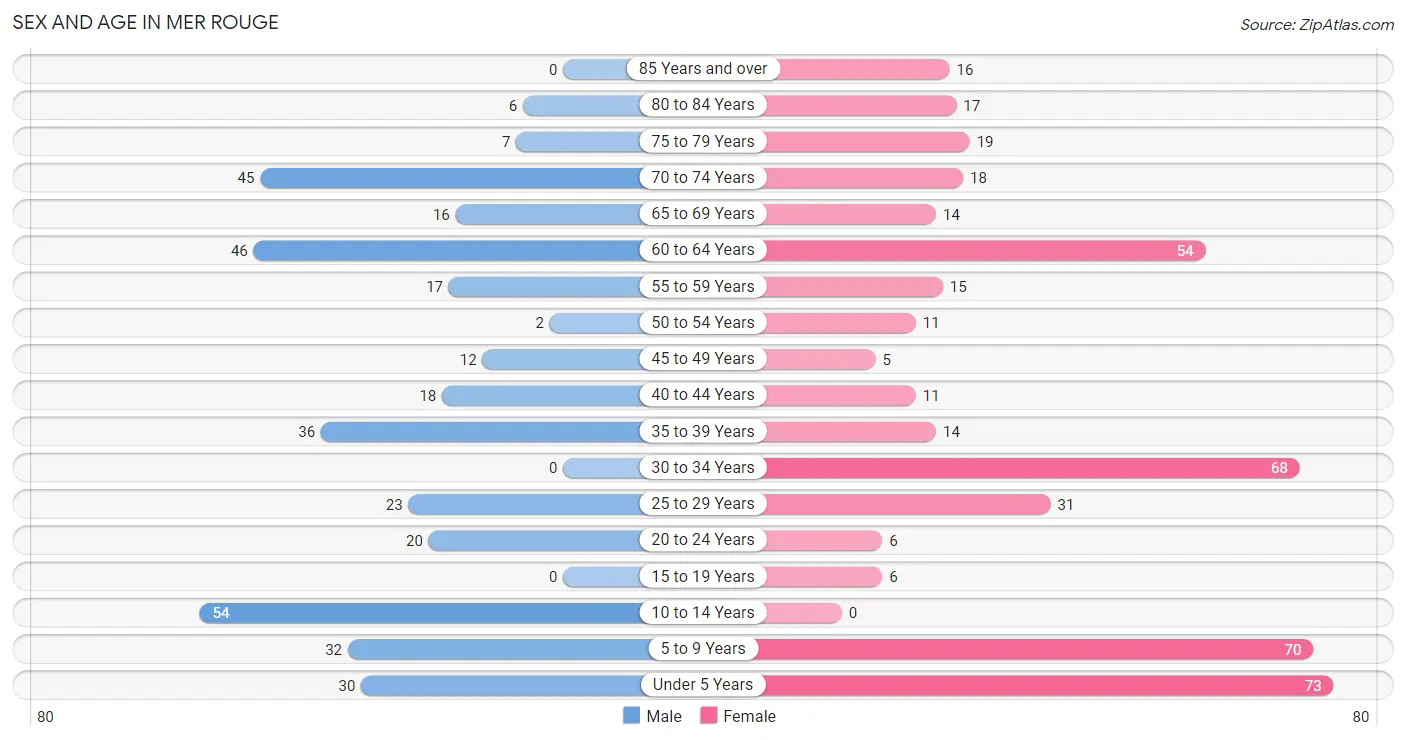
The most populous age groups in Mer Rouge are 10 to 14 Years (54 | 14.8%) for men and Under 5 Years (73 | 16.3%) for women.
| Age Bracket | Male | Female |
| Under 5 Years | 30 (8.2%) | 73 (16.3%) |
| 5 to 9 Years | 32 (8.8%) | 70 (15.6%) |
| 10 to 14 Years | 54 (14.8%) | 0 (0.0%) |
| 15 to 19 Years | 0 (0.0%) | 6 (1.3%) |
| 20 to 24 Years | 20 (5.5%) | 6 (1.3%) |
| 25 to 29 Years | 23 (6.3%) | 31 (6.9%) |
| 30 to 34 Years | 0 (0.0%) | 68 (15.2%) |
| 35 to 39 Years | 36 (9.9%) | 14 (3.1%) |
| 40 to 44 Years | 18 (5.0%) | 11 (2.5%) |
| 45 to 49 Years | 12 (3.3%) | 5 (1.1%) |
| 50 to 54 Years | 2 (0.5%) | 11 (2.5%) |
| 55 to 59 Years | 17 (4.7%) | 15 (3.4%) |
| 60 to 64 Years | 46 (12.6%) | 54 (12.0%) |
| 65 to 69 Years | 16 (4.4%) | 14 (3.1%) |
| 70 to 74 Years | 45 (12.4%) | 18 (4.0%) |
| 75 to 79 Years | 7 (1.9%) | 19 (4.2%) |
| 80 to 84 Years | 6 (1.7%) | 17 (3.8%) |
| 85 Years and over | 0 (0.0%) | 16 (3.6%) |
| Total | 364 (100.0%) | 448 (100.0%) |
Families and Households in Mer Rouge
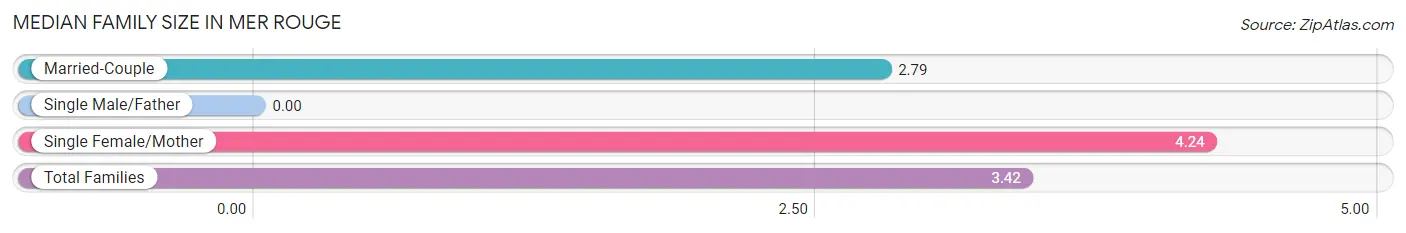
Median Family Size in Mer Rouge
| Family Type | # Families | Family Size |
| Married-Couple | 98 (56.3%) | 2.79 |
| Single Male/Father | 0 (0.0%) | - |
| Single Female/Mother | 76 (43.7%) | 4.24 |
| Total Families | 174 (100.0%) | 3.42 |
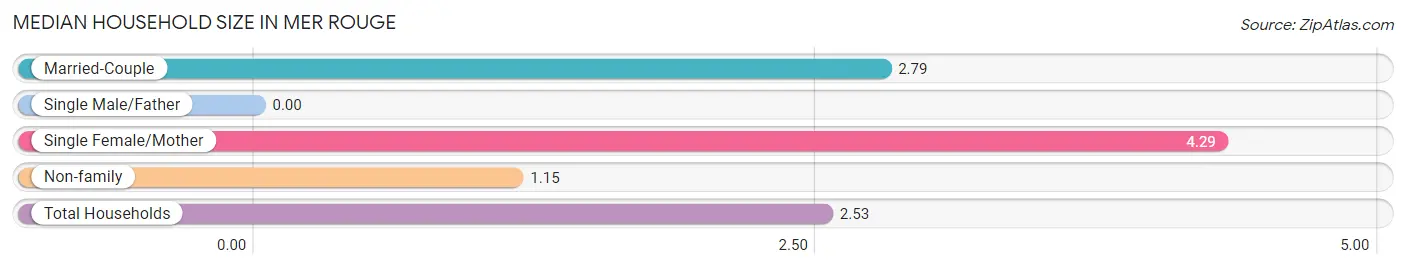
Median Household Size in Mer Rouge
| Household Type | # Households | Household Size |
| Married-Couple | 98 (34.0%) | 2.79 |
| Single Male/Father | 0 (0.0%) | - |
| Single Female/Mother | 76 (26.4%) | 4.29 |
| Non-family | 114 (39.6%) | 1.15 |
| Total Households | 288 (100.0%) | 2.53 |
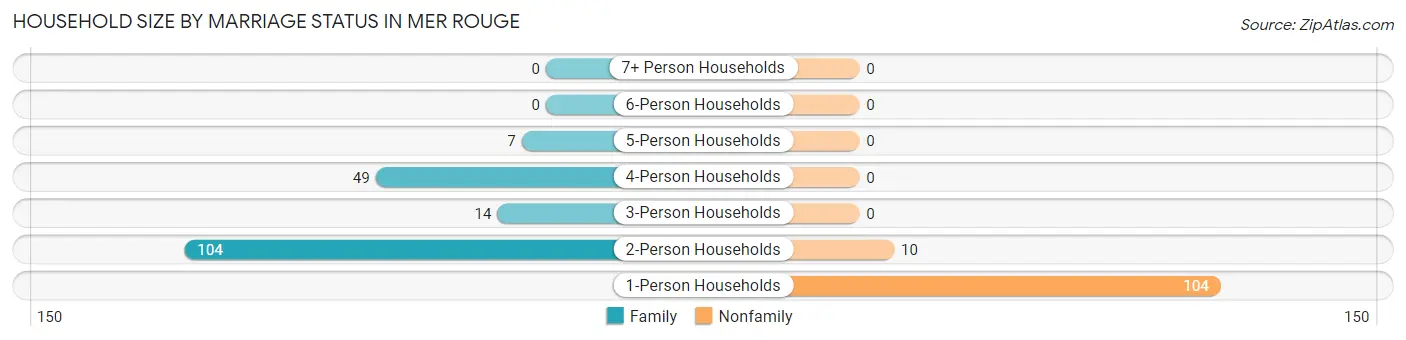
Household Size by Marriage Status in Mer Rouge
Out of a total of 288 households in Mer Rouge, 174 (60.4%) are family households, while 114 (39.6%) are nonfamily households. The most numerous type of family households are 2-person households, comprising 104, and the most common type of nonfamily households are 1-person households, comprising 104.
| Household Size | Family Households | Nonfamily Households |
| 1-Person Households | - | 104 (36.1%) |
| 2-Person Households | 104 (36.1%) | 10 (3.5%) |
| 3-Person Households | 14 (4.9%) | 0 (0.0%) |
| 4-Person Households | 49 (17.0%) | 0 (0.0%) |
| 5-Person Households | 7 (2.4%) | 0 (0.0%) |
| 6-Person Households | 0 (0.0%) | 0 (0.0%) |
| 7+ Person Households | 0 (0.0%) | 0 (0.0%) |
| Total | 174 (60.4%) | 114 (39.6%) |
Female Fertility in Mer Rouge
Fertility by Age in Mer Rouge
Average fertility rate in Mer Rouge is 135.0 births per 1,000 women. Women in the age bracket of 20 to 34 years have the highest fertility rate with 181.0 births per 1,000 women. Women in the age bracket of 20 to 34 years acount for 100.0% of all women with births.
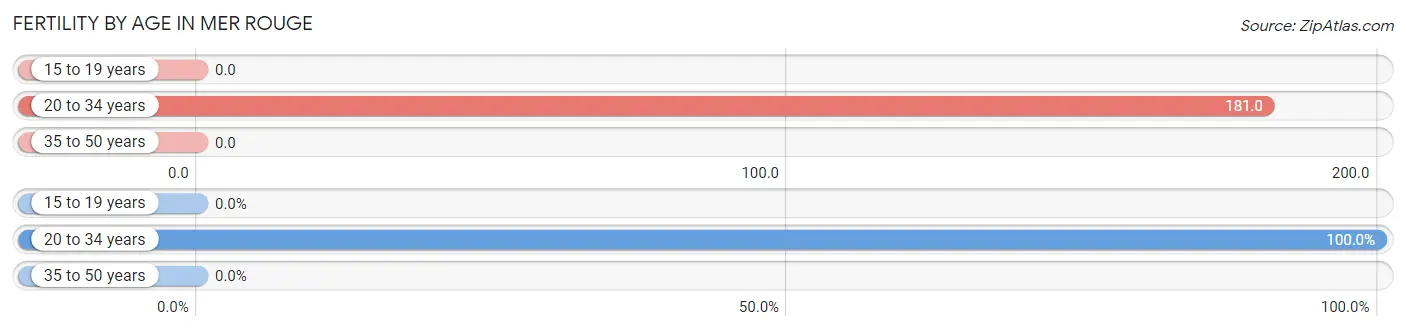
| Age Bracket | Women with Births | Births / 1,000 Women |
| 15 to 19 years | 0 (0.0%) | 0.0 |
| 20 to 34 years | 19 (100.0%) | 181.0 |
| 35 to 50 years | 0 (0.0%) | 0.0 |
| Total | 19 (100.0%) | 135.0 |
Fertility by Age by Marriage Status in Mer Rouge
89.5% of women with births (19) in Mer Rouge are married. The highest percentage of unmarried women with births falls into 20 to 34 years age bracket with 10.5% of them unmarried at the time of birth, while the lowest percentage of unmarried women with births belong to 20 to 34 years age bracket with 10.5% of them unmarried.
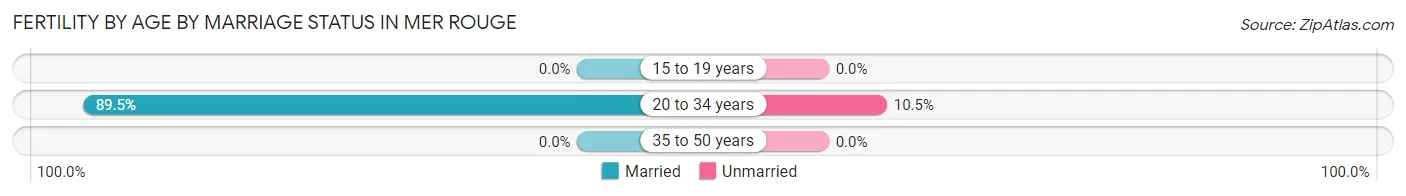
| Age Bracket | Married | Unmarried |
| 15 to 19 years | 0 (0.0%) | 0 (0.0%) |
| 20 to 34 years | 17 (89.5%) | 2 (10.5%) |
| 35 to 50 years | 0 (0.0%) | 0 (0.0%) |
| Total | 17 (89.5%) | 2 (10.5%) |
Fertility by Education in Mer Rouge
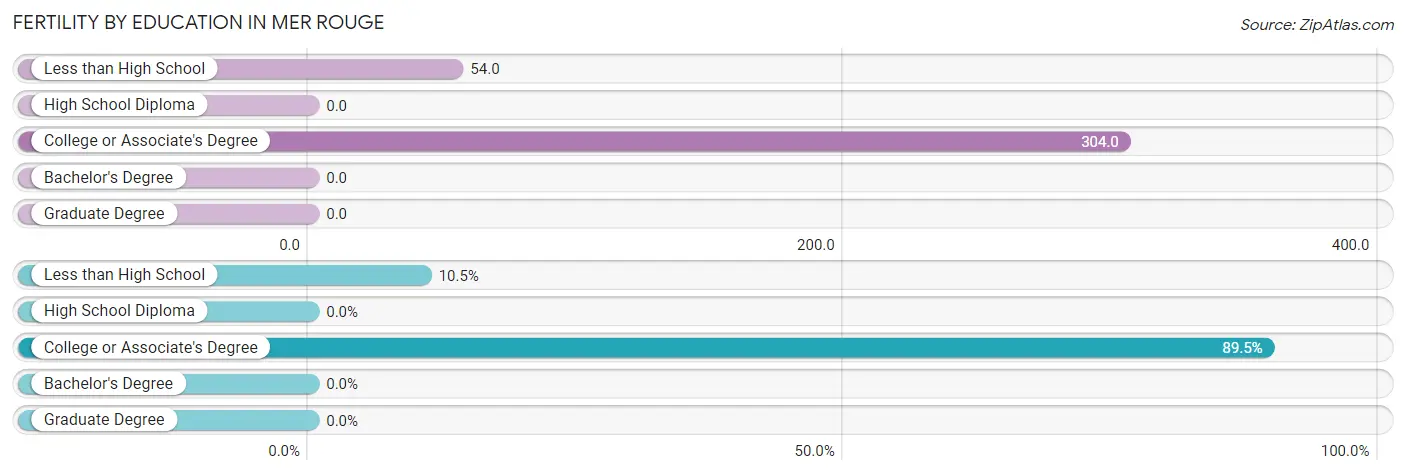
| Educational Attainment | Women with Births | Births / 1,000 Women |
| Less than High School | 2 (10.5%) | 54.0 |
| High School Diploma | 0 (0.0%) | 0.0 |
| College or Associate's Degree | 17 (89.5%) | 304.0 |
| Bachelor's Degree | 0 (0.0%) | 0.0 |
| Graduate Degree | 0 (0.0%) | 0.0 |
| Total | 19 (100.0%) | 135.0 |
Fertility by Education by Marriage Status in Mer Rouge
10.5% of women with births in Mer Rouge are unmarried. Women with the educational attainment of college or associate's degree are most likely to be married with 100.0% of them married at childbirth, while women with the educational attainment of less than high school are least likely to be married with 100.0% of them unmarried at childbirth.
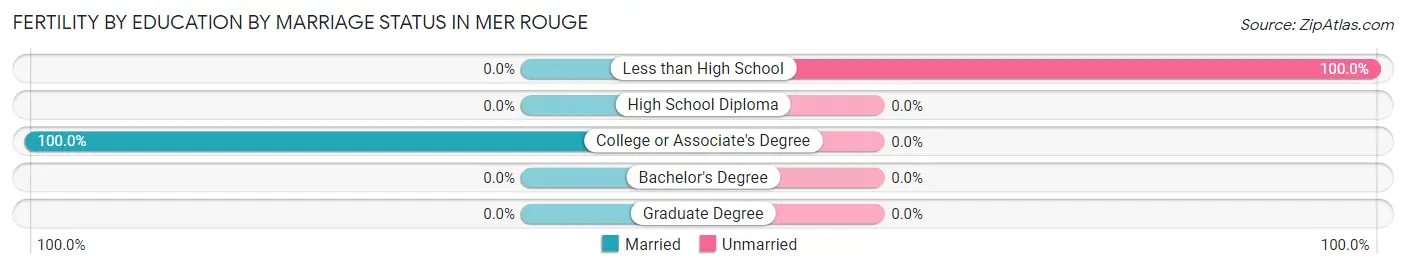
| Educational Attainment | Married | Unmarried |
| Less than High School | 0 (0.0%) | 2 (100.0%) |
| High School Diploma | 0 (0.0%) | 0 (0.0%) |
| College or Associate's Degree | 17 (100.0%) | 0 (0.0%) |
| Bachelor's Degree | 0 (0.0%) | 0 (0.0%) |
| Graduate Degree | 0 (0.0%) | 0 (0.0%) |
| Total | 17 (89.5%) | 2 (10.5%) |
Employment Characteristics in Mer Rouge
Employment by Class of Employer in Mer Rouge
Among the 285 employed individuals in Mer Rouge, private company employees (216 | 75.8%), self-employed (incorporated) (28 | 9.8%), and local government employees (16 | 5.6%) make up the most common classes of employment.
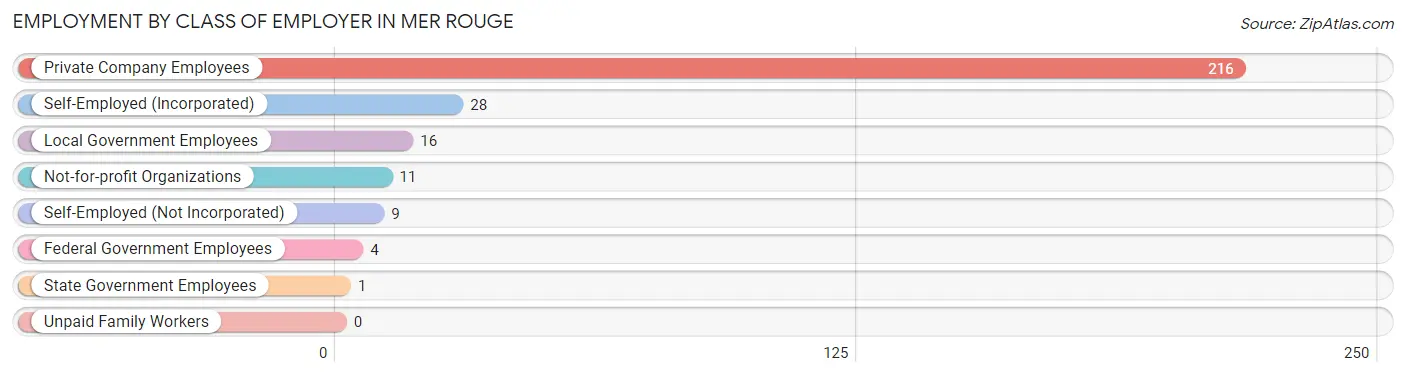
| Employer Class | # Employees | % Employees |
| Private Company Employees | 216 | 75.8% |
| Self-Employed (Incorporated) | 28 | 9.8% |
| Self-Employed (Not Incorporated) | 9 | 3.2% |
| Not-for-profit Organizations | 11 | 3.9% |
| Local Government Employees | 16 | 5.6% |
| State Government Employees | 1 | 0.4% |
| Federal Government Employees | 4 | 1.4% |
| Unpaid Family Workers | 0 | 0.0% |
| Total | 285 | 100.0% |
Employment Status by Age in Mer Rouge
According to the labor force statistics for Mer Rouge, out of the total population over 16 years of age (553), 57.0% or 315 individuals are in the labor force, with 9.5% or 30 of them unemployed. The age group with the highest labor force participation rate is 30 to 34 years, with 100.0% or 68 individuals in the labor force. Within the labor force, the 30 to 34 years age range has the highest percentage of unemployed individuals, with 32.4% or 22 of them being unemployed.
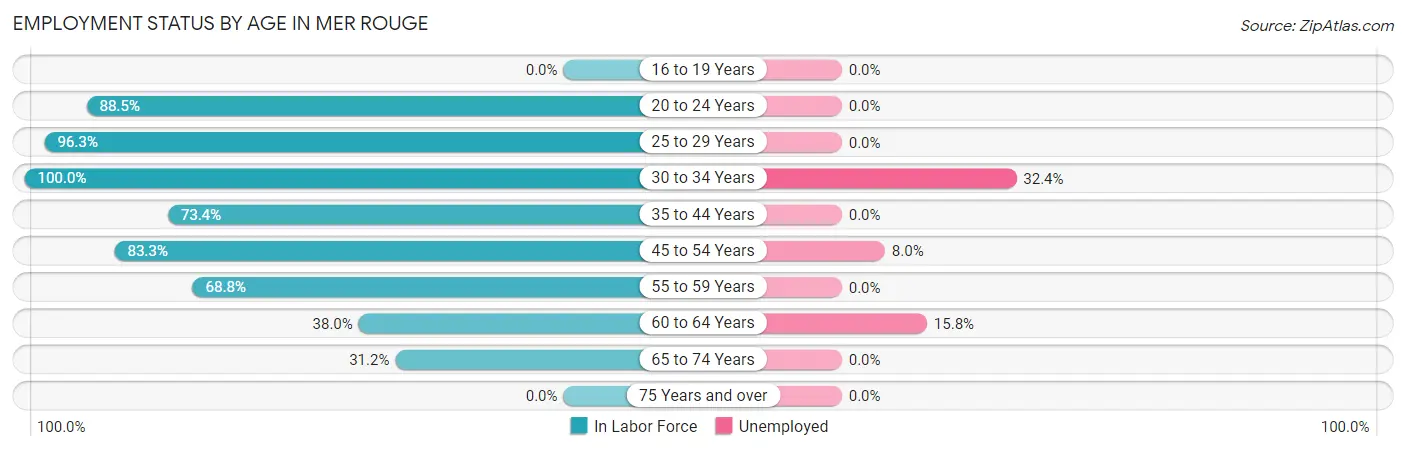
| Age Bracket | In Labor Force | Unemployed |
| 16 to 19 Years | 0 (0.0%) | 0 (0.0%) |
| 20 to 24 Years | 23 (88.5%) | 0 (0.0%) |
| 25 to 29 Years | 52 (96.3%) | 0 (0.0%) |
| 30 to 34 Years | 68 (100.0%) | 22 (32.4%) |
| 35 to 44 Years | 58 (73.4%) | 0 (0.0%) |
| 45 to 54 Years | 25 (83.3%) | 2 (8.0%) |
| 55 to 59 Years | 22 (68.8%) | 0 (0.0%) |
| 60 to 64 Years | 38 (38.0%) | 6 (15.8%) |
| 65 to 74 Years | 29 (31.2%) | 0 (0.0%) |
| 75 Years and over | 0 (0.0%) | 0 (0.0%) |
| Total | 315 (57.0%) | 30 (9.5%) |
Employment Status by Educational Attainment in Mer Rouge
According to labor force statistics for Mer Rouge, 72.5% of individuals (263) out of the total population between 25 and 64 years of age (363) are in the labor force, with 11.4% or 30 of them being unemployed. The group with the highest labor force participation rate are those with the educational attainment of less than high school, with 81.1% or 43 individuals in the labor force. Within the labor force, individuals with college / associate degree education have the highest percentage of unemployment, with 27.5% or 22 of them being unemployed.
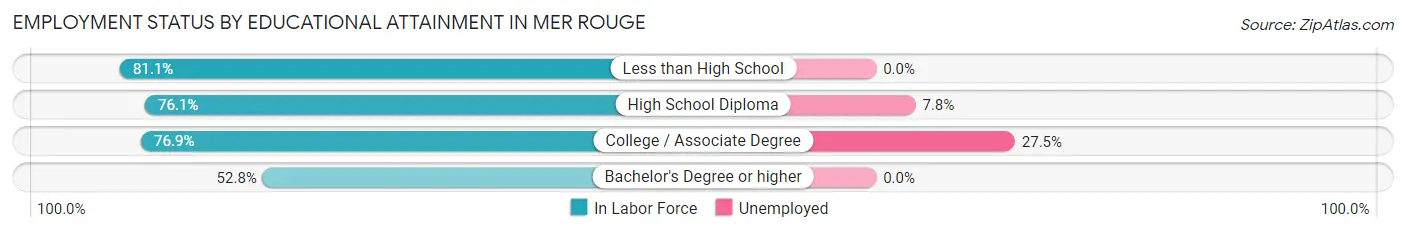
| Educational Attainment | In Labor Force | Unemployed |
| Less than High School | 43 (81.1%) | 0 (0.0%) |
| High School Diploma | 102 (76.1%) | 10 (7.8%) |
| College / Associate Degree | 80 (76.9%) | 29 (27.5%) |
| Bachelor's Degree or higher | 38 (52.8%) | 0 (0.0%) |
| Total | 263 (72.5%) | 41 (11.4%) |
Employment Occupations by Sex in Mer Rouge
Management, Business, Science and Arts Occupations
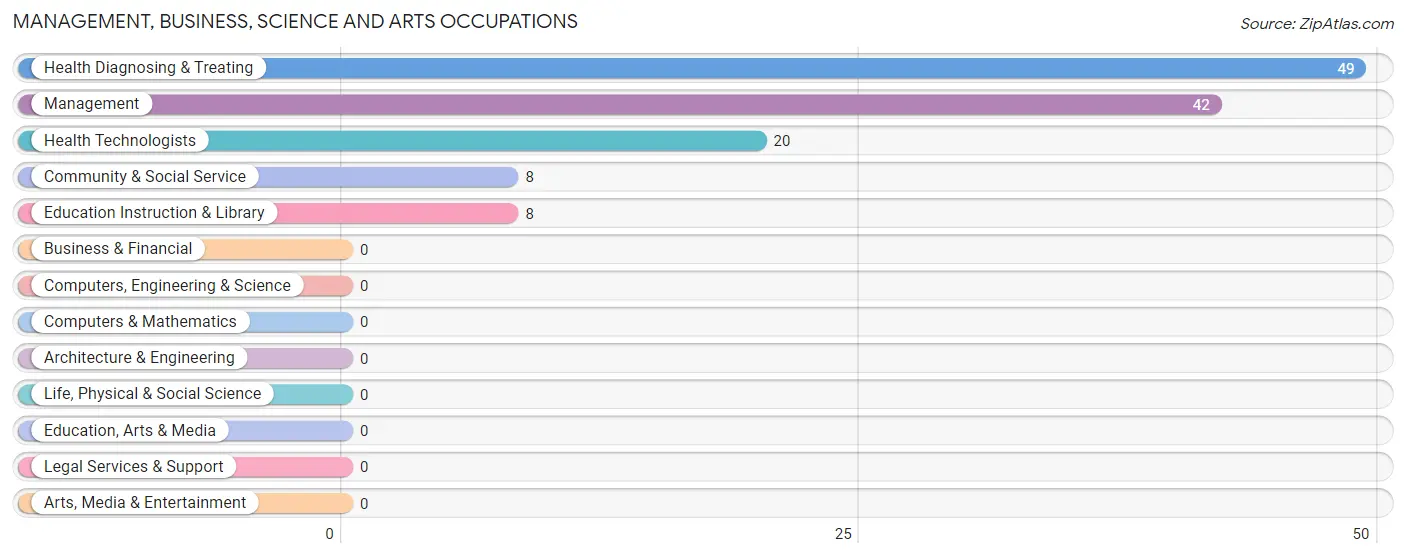
The most common Management, Business, Science and Arts occupations in Mer Rouge are Health Diagnosing & Treating (49 | 17.2%), Management (42 | 14.7%), Health Technologists (20 | 7.0%), Community & Social Service (8 | 2.8%), and Education Instruction & Library (8 | 2.8%).
Management, Business, Science and Arts Occupations by Sex
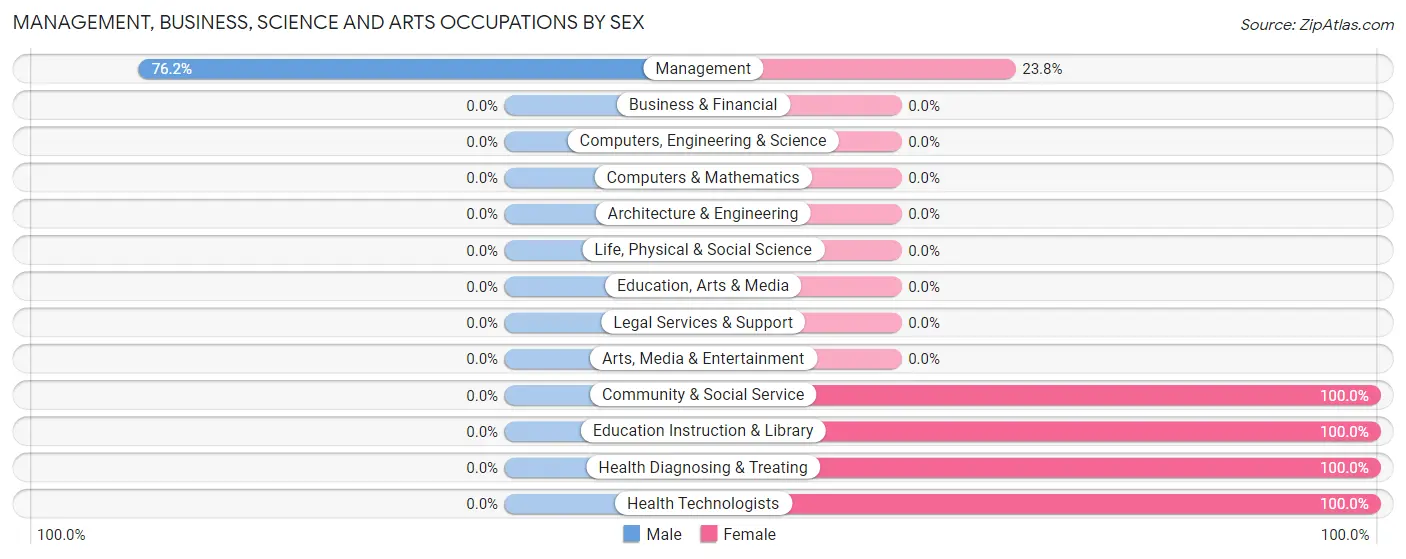
| Occupation | Male | Female |
| Management | 32 (76.2%) | 10 (23.8%) |
| Business & Financial | 0 (0.0%) | 0 (0.0%) |
| Computers, Engineering & Science | 0 (0.0%) | 0 (0.0%) |
| Computers & Mathematics | 0 (0.0%) | 0 (0.0%) |
| Architecture & Engineering | 0 (0.0%) | 0 (0.0%) |
| Life, Physical & Social Science | 0 (0.0%) | 0 (0.0%) |
| Community & Social Service | 0 (0.0%) | 8 (100.0%) |
| Education, Arts & Media | 0 (0.0%) | 0 (0.0%) |
| Legal Services & Support | 0 (0.0%) | 0 (0.0%) |
| Education Instruction & Library | 0 (0.0%) | 8 (100.0%) |
| Arts, Media & Entertainment | 0 (0.0%) | 0 (0.0%) |
| Health Diagnosing & Treating | 0 (0.0%) | 49 (100.0%) |
| Health Technologists | 0 (0.0%) | 20 (100.0%) |
| Total (Category) | 32 (32.3%) | 67 (67.7%) |
| Total (Overall) | 149 (52.3%) | 136 (47.7%) |
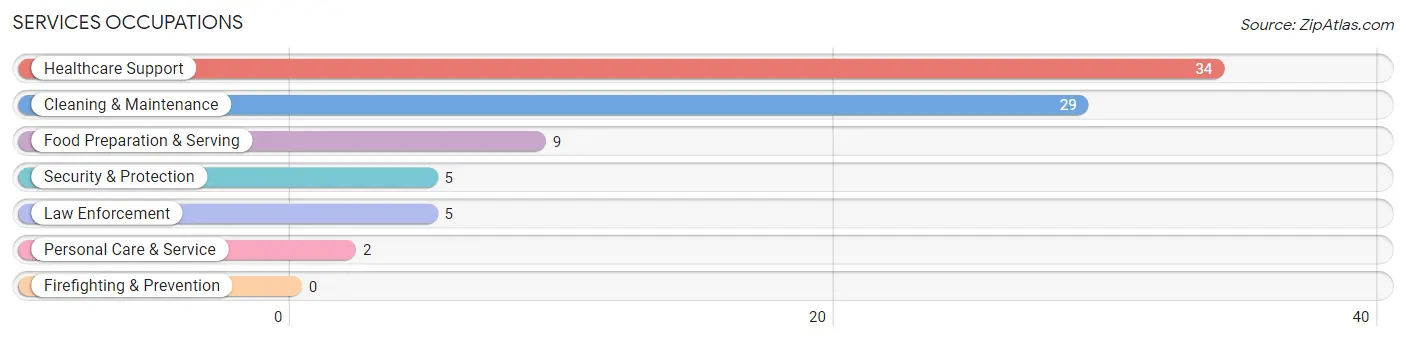
Services Occupations
The most common Services occupations in Mer Rouge are Healthcare Support (34 | 11.9%), Cleaning & Maintenance (29 | 10.2%), Food Preparation & Serving (9 | 3.2%), Security & Protection (5 | 1.8%), and Law Enforcement (5 | 1.8%).
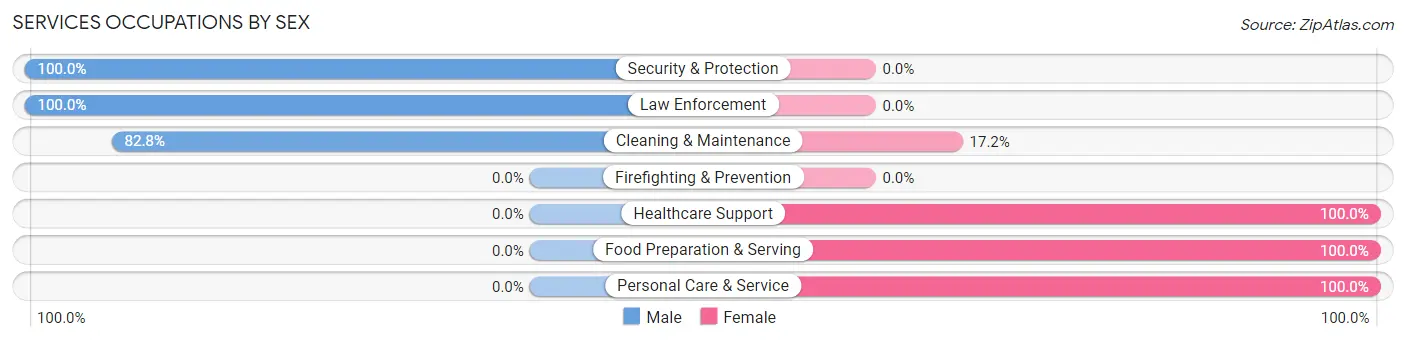
Services Occupations by Sex
Within the Services occupations in Mer Rouge, the most male-oriented occupations are Security & Protection (100.0%), Law Enforcement (100.0%), and Cleaning & Maintenance (82.8%), while the most female-oriented occupations are Healthcare Support (100.0%), Food Preparation & Serving (100.0%), and Personal Care & Service (100.0%).
| Occupation | Male | Female |
| Healthcare Support | 0 (0.0%) | 34 (100.0%) |
| Security & Protection | 5 (100.0%) | 0 (0.0%) |
| Firefighting & Prevention | 0 (0.0%) | 0 (0.0%) |
| Law Enforcement | 5 (100.0%) | 0 (0.0%) |
| Food Preparation & Serving | 0 (0.0%) | 9 (100.0%) |
| Cleaning & Maintenance | 24 (82.8%) | 5 (17.2%) |
| Personal Care & Service | 0 (0.0%) | 2 (100.0%) |
| Total (Category) | 29 (36.7%) | 50 (63.3%) |
| Total (Overall) | 149 (52.3%) | 136 (47.7%) |
Sales and Office Occupations
The most common Sales and Office occupations in Mer Rouge are Sales & Related (16 | 5.6%), and Office & Administration (11 | 3.9%).

Sales and Office Occupations by Sex

| Occupation | Male | Female |
| Sales & Related | 11 (68.8%) | 5 (31.2%) |
| Office & Administration | 0 (0.0%) | 11 (100.0%) |
| Total (Category) | 11 (40.7%) | 16 (59.3%) |
| Total (Overall) | 149 (52.3%) | 136 (47.7%) |
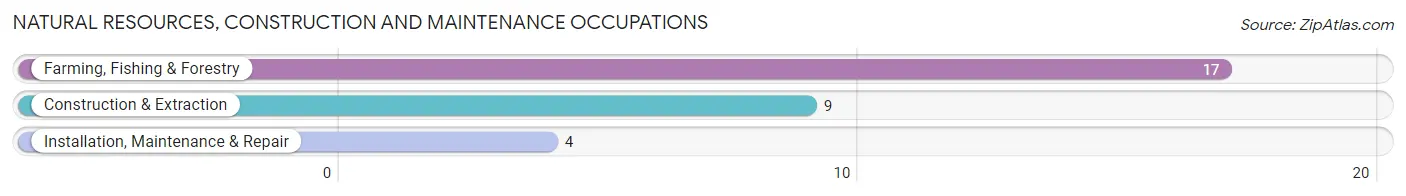
Natural Resources, Construction and Maintenance Occupations
The most common Natural Resources, Construction and Maintenance occupations in Mer Rouge are Farming, Fishing & Forestry (17 | 6.0%), Construction & Extraction (9 | 3.2%), and Installation, Maintenance & Repair (4 | 1.4%).
Natural Resources, Construction and Maintenance Occupations by Sex
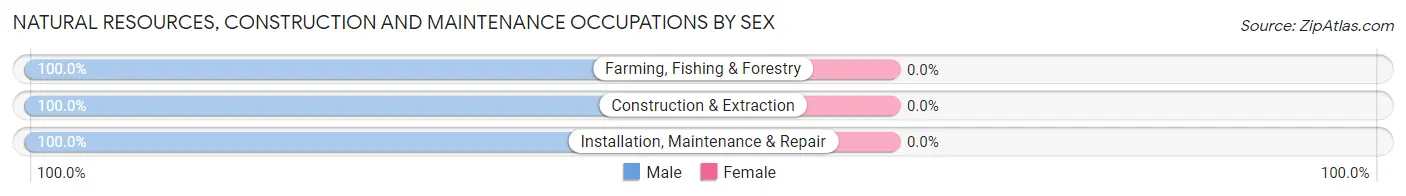
| Occupation | Male | Female |
| Farming, Fishing & Forestry | 17 (100.0%) | 0 (0.0%) |
| Construction & Extraction | 9 (100.0%) | 0 (0.0%) |
| Installation, Maintenance & Repair | 4 (100.0%) | 0 (0.0%) |
| Total (Category) | 30 (100.0%) | 0 (0.0%) |
| Total (Overall) | 149 (52.3%) | 136 (47.7%) |
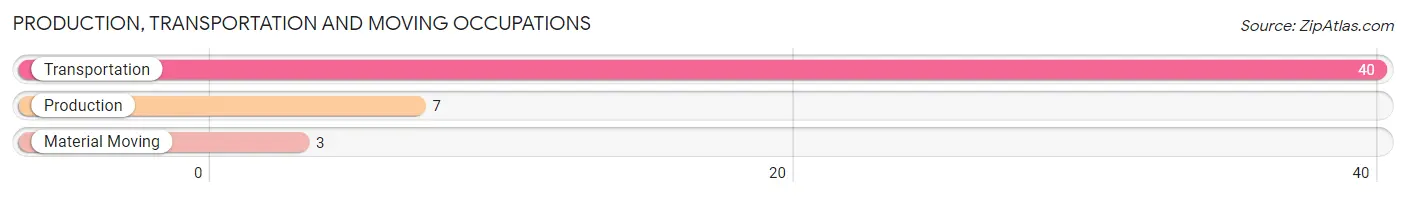
Production, Transportation and Moving Occupations
The most common Production, Transportation and Moving occupations in Mer Rouge are Transportation (40 | 14.0%), Production (7 | 2.5%), and Material Moving (3 | 1.1%).
Production, Transportation and Moving Occupations by Sex
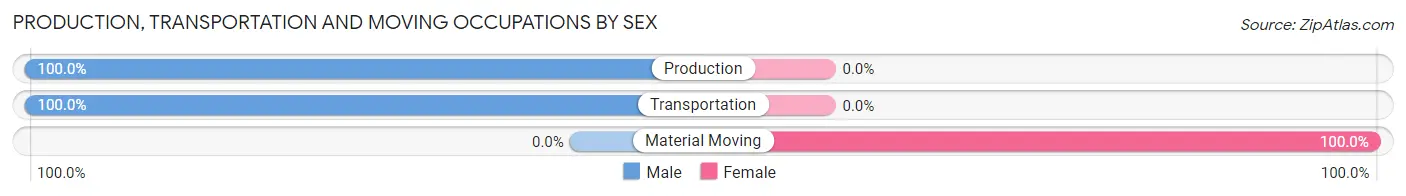
| Occupation | Male | Female |
| Production | 7 (100.0%) | 0 (0.0%) |
| Transportation | 40 (100.0%) | 0 (0.0%) |
| Material Moving | 0 (0.0%) | 3 (100.0%) |
| Total (Category) | 47 (94.0%) | 3 (6.0%) |
| Total (Overall) | 149 (52.3%) | 136 (47.7%) |
Employment Industries by Sex in Mer Rouge
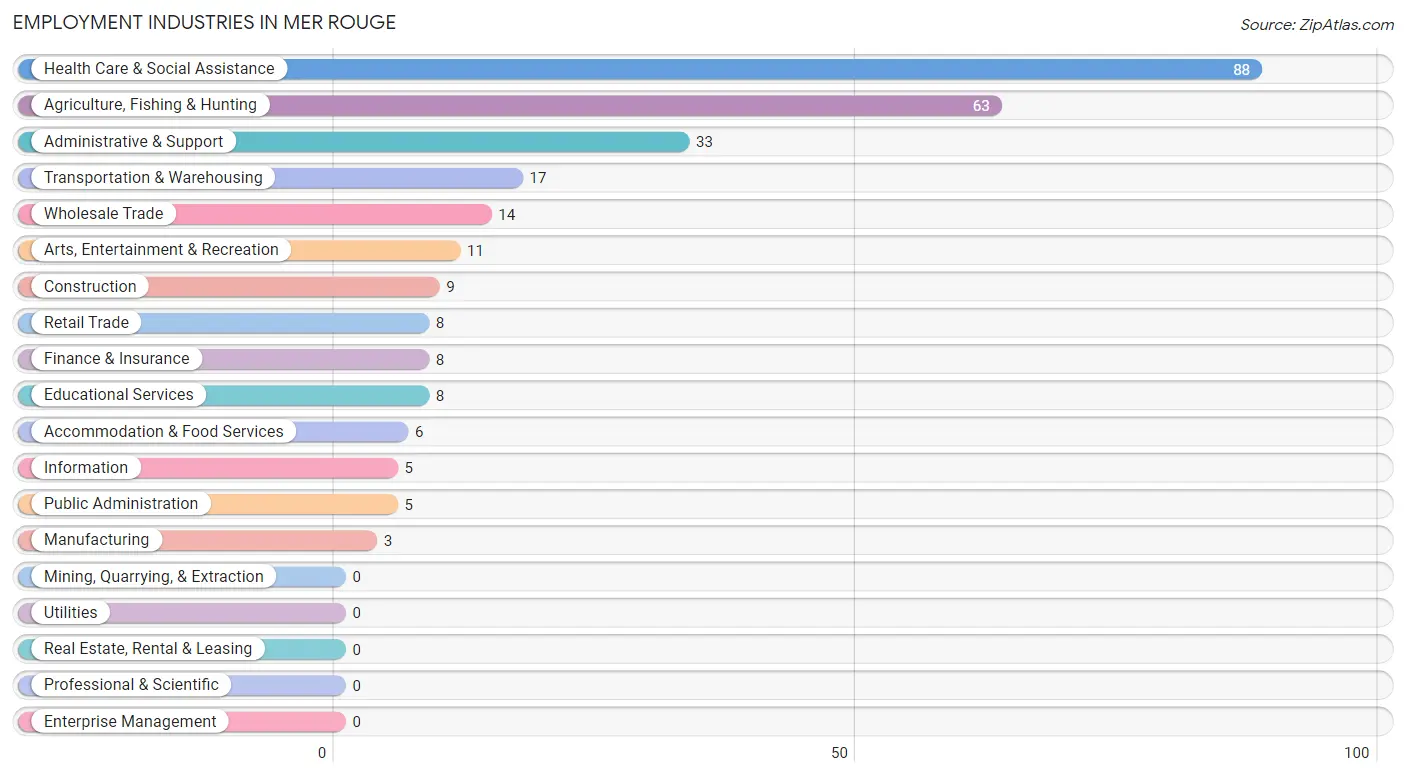
Employment Industries in Mer Rouge
The major employment industries in Mer Rouge include Health Care & Social Assistance (88 | 30.9%), Agriculture, Fishing & Hunting (63 | 22.1%), Administrative & Support (33 | 11.6%), Transportation & Warehousing (17 | 6.0%), and Wholesale Trade (14 | 4.9%).
Employment Industries by Sex in Mer Rouge
The Mer Rouge industries that see more men than women are Agriculture, Fishing & Hunting (100.0%), Construction (100.0%), and Manufacturing (100.0%), whereas the industries that tend to have a higher number of women are Retail Trade (100.0%), Finance & Insurance (100.0%), and Educational Services (100.0%).
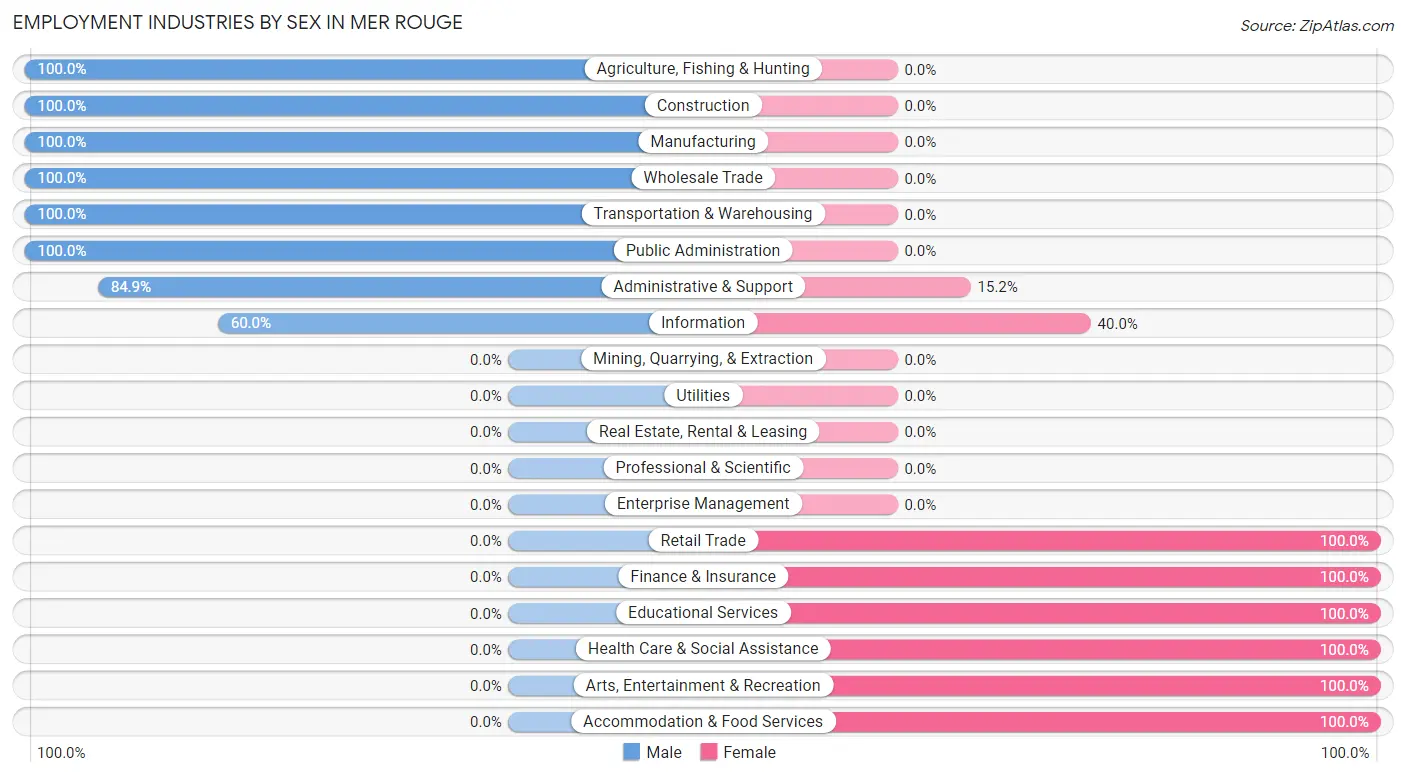
| Industry | Male | Female |
| Agriculture, Fishing & Hunting | 63 (100.0%) | 0 (0.0%) |
| Mining, Quarrying, & Extraction | 0 (0.0%) | 0 (0.0%) |
| Construction | 9 (100.0%) | 0 (0.0%) |
| Manufacturing | 3 (100.0%) | 0 (0.0%) |
| Wholesale Trade | 14 (100.0%) | 0 (0.0%) |
| Retail Trade | 0 (0.0%) | 8 (100.0%) |
| Transportation & Warehousing | 17 (100.0%) | 0 (0.0%) |
| Utilities | 0 (0.0%) | 0 (0.0%) |
| Information | 3 (60.0%) | 2 (40.0%) |
| Finance & Insurance | 0 (0.0%) | 8 (100.0%) |
| Real Estate, Rental & Leasing | 0 (0.0%) | 0 (0.0%) |
| Professional & Scientific | 0 (0.0%) | 0 (0.0%) |
| Enterprise Management | 0 (0.0%) | 0 (0.0%) |
| Administrative & Support | 28 (84.9%) | 5 (15.1%) |
| Educational Services | 0 (0.0%) | 8 (100.0%) |
| Health Care & Social Assistance | 0 (0.0%) | 88 (100.0%) |
| Arts, Entertainment & Recreation | 0 (0.0%) | 11 (100.0%) |
| Accommodation & Food Services | 0 (0.0%) | 6 (100.0%) |
| Public Administration | 5 (100.0%) | 0 (0.0%) |
| Total | 149 (52.3%) | 136 (47.7%) |
Education in Mer Rouge
School Enrollment in Mer Rouge
The most common levels of schooling among the 199 students in Mer Rouge are elementary school (86 | 43.2%), middle school (54 | 27.1%), and college / undergraduate (27 | 13.6%).
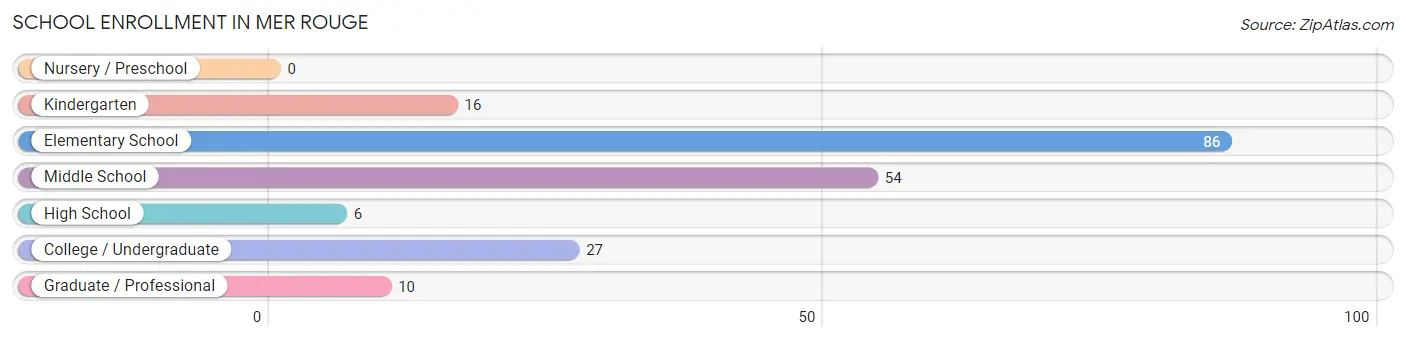
| School Level | # Students | % Students |
| Nursery / Preschool | 0 | 0.0% |
| Kindergarten | 16 | 8.0% |
| Elementary School | 86 | 43.2% |
| Middle School | 54 | 27.1% |
| High School | 6 | 3.0% |
| College / Undergraduate | 27 | 13.6% |
| Graduate / Professional | 10 | 5.0% |
| Total | 199 | 100.0% |
School Enrollment by Age by Funding Source in Mer Rouge
Out of a total of 199 students who are enrolled in schools in Mer Rouge, 35 (17.6%) attend a private institution, while the remaining 164 (82.4%) are enrolled in public schools. The age group of 20 to 24 year olds has the highest likelihood of being enrolled in private schools, with 10 (100.0% in the age bracket) enrolled. Conversely, the age group of 15 to 17 year olds has the lowest likelihood of being enrolled in a private school, with 6 (100.0% in the age bracket) attending a public institution.
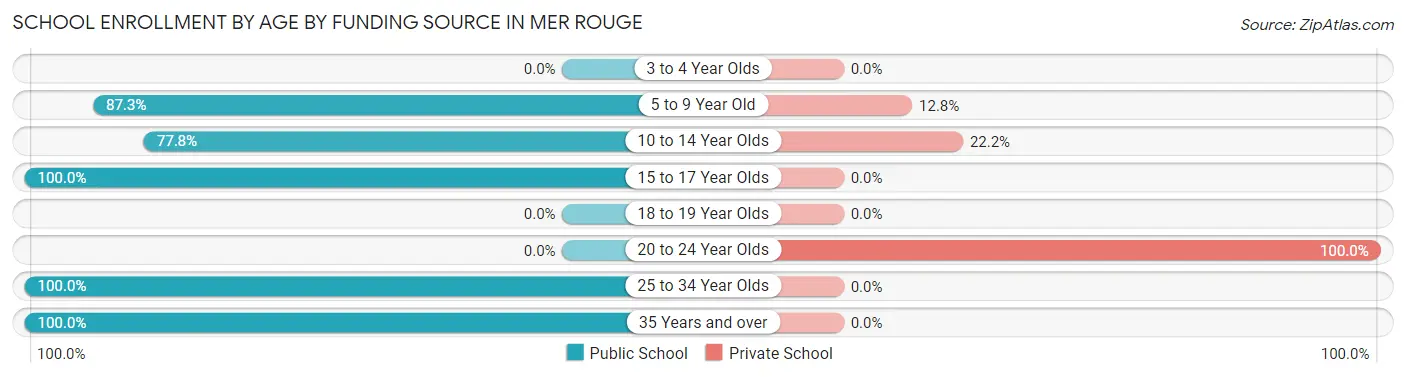
| Age Bracket | Public School | Private School |
| 3 to 4 Year Olds | 0 (0.0%) | 0 (0.0%) |
| 5 to 9 Year Old | 89 (87.3%) | 13 (12.8%) |
| 10 to 14 Year Olds | 42 (77.8%) | 12 (22.2%) |
| 15 to 17 Year Olds | 6 (100.0%) | 0 (0.0%) |
| 18 to 19 Year Olds | 0 (0.0%) | 0 (0.0%) |
| 20 to 24 Year Olds | 0 (0.0%) | 10 (100.0%) |
| 25 to 34 Year Olds | 23 (100.0%) | 0 (0.0%) |
| 35 Years and over | 4 (100.0%) | 0 (0.0%) |
| Total | 164 (82.4%) | 35 (17.6%) |
Educational Attainment by Field of Study in Mer Rouge
Business (23 | 27.7%), arts & humanities (15 | 18.1%), physical & health sciences (10 | 12.0%), education (9 | 10.8%), and science & technology (8 | 9.6%) are the most common fields of study among 83 individuals in Mer Rouge who have obtained a bachelor's degree or higher.
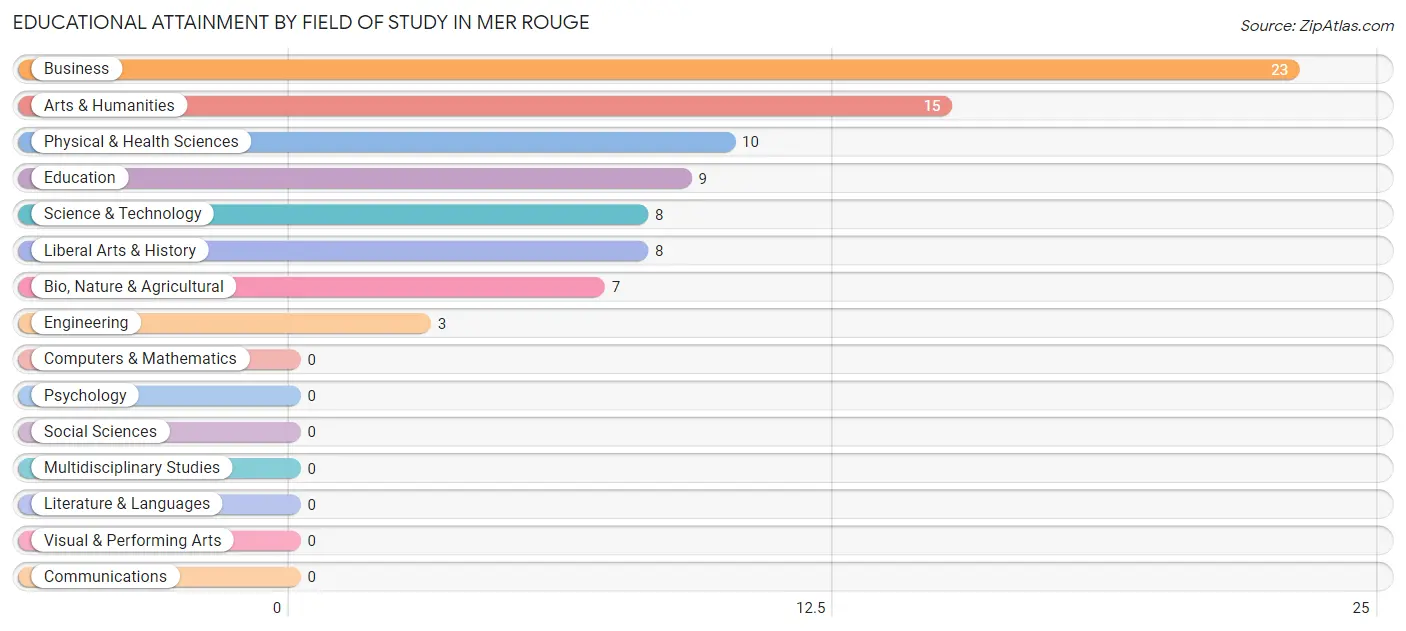
| Field of Study | # Graduates | % Graduates |
| Computers & Mathematics | 0 | 0.0% |
| Bio, Nature & Agricultural | 7 | 8.4% |
| Physical & Health Sciences | 10 | 12.0% |
| Psychology | 0 | 0.0% |
| Social Sciences | 0 | 0.0% |
| Engineering | 3 | 3.6% |
| Multidisciplinary Studies | 0 | 0.0% |
| Science & Technology | 8 | 9.6% |
| Business | 23 | 27.7% |
| Education | 9 | 10.8% |
| Literature & Languages | 0 | 0.0% |
| Liberal Arts & History | 8 | 9.6% |
| Visual & Performing Arts | 0 | 0.0% |
| Communications | 0 | 0.0% |
| Arts & Humanities | 15 | 18.1% |
| Total | 83 | 100.0% |
Transportation & Commute in Mer Rouge
Vehicle Availability by Sex in Mer Rouge
The most prevalent vehicle ownership categories in Mer Rouge are males with 3 vehicles (52, accounting for 34.9%) and females with 3 vehicles (12, making up 38.2%).
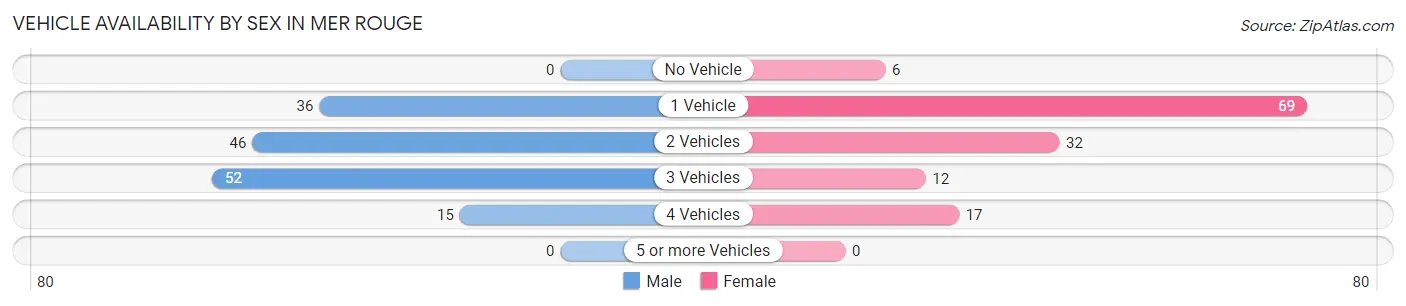
| Vehicles Available | Male | Female |
| No Vehicle | 0 (0.0%) | 6 (4.4%) |
| 1 Vehicle | 36 (24.2%) | 69 (50.7%) |
| 2 Vehicles | 46 (30.9%) | 32 (23.5%) |
| 3 Vehicles | 52 (34.9%) | 12 (8.8%) |
| 4 Vehicles | 15 (10.1%) | 17 (12.5%) |
| 5 or more Vehicles | 0 (0.0%) | 0 (0.0%) |
| Total | 149 (100.0%) | 136 (100.0%) |
Commute Time in Mer Rouge
The most frequently occuring commute durations in Mer Rouge are 15 to 19 minutes (83 commuters, 30.3%), less than 5 minutes (66 commuters, 24.1%), and 5 to 9 minutes (40 commuters, 14.6%).
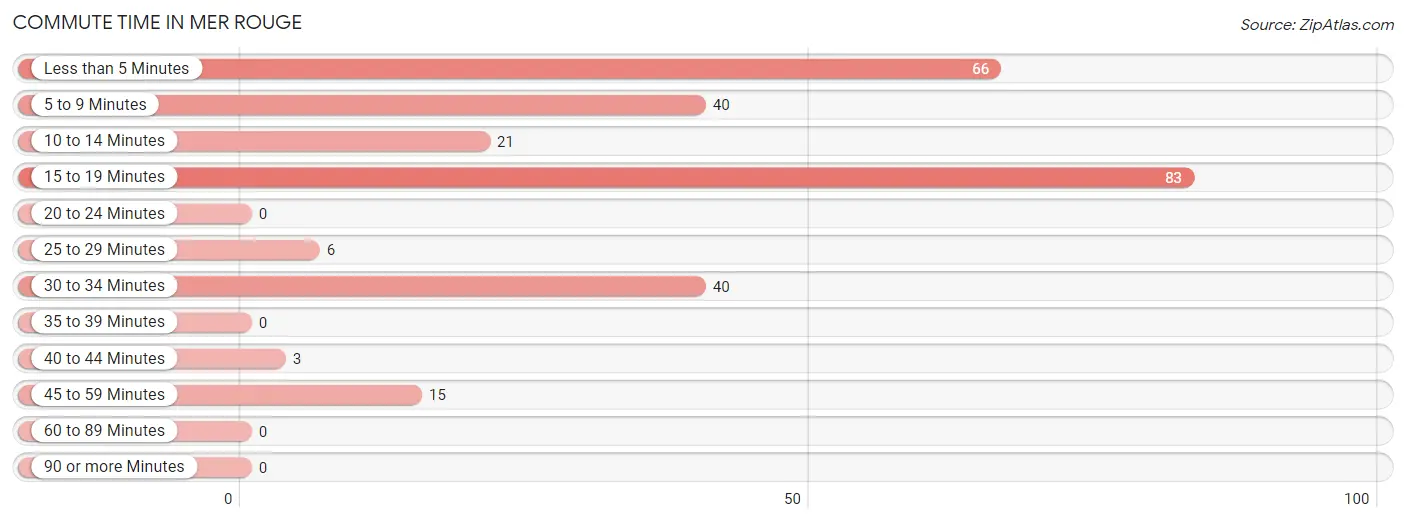
| Commute Time | # Commuters | % Commuters |
| Less than 5 Minutes | 66 | 24.1% |
| 5 to 9 Minutes | 40 | 14.6% |
| 10 to 14 Minutes | 21 | 7.7% |
| 15 to 19 Minutes | 83 | 30.3% |
| 20 to 24 Minutes | 0 | 0.0% |
| 25 to 29 Minutes | 6 | 2.2% |
| 30 to 34 Minutes | 40 | 14.6% |
| 35 to 39 Minutes | 0 | 0.0% |
| 40 to 44 Minutes | 3 | 1.1% |
| 45 to 59 Minutes | 15 | 5.5% |
| 60 to 89 Minutes | 0 | 0.0% |
| 90 or more Minutes | 0 | 0.0% |
Commute Time by Sex in Mer Rouge
The most common commute times in Mer Rouge are less than 5 minutes (60 commuters, 40.3%) for males and 15 to 19 minutes (69 commuters, 55.2%) for females.
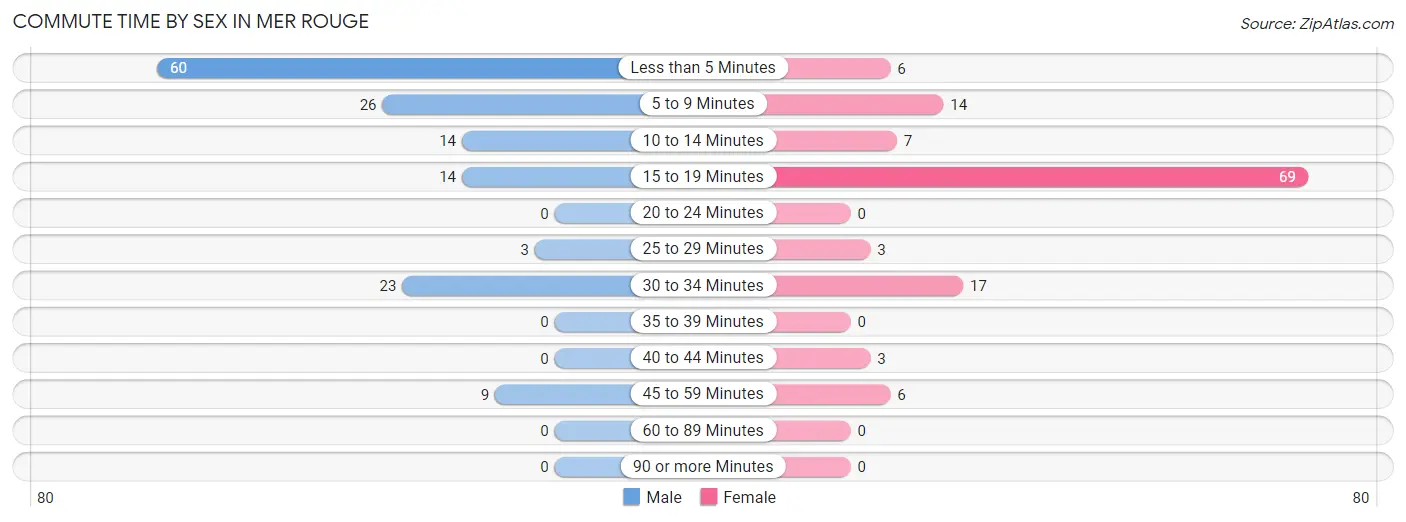
| Commute Time | Male | Female |
| Less than 5 Minutes | 60 (40.3%) | 6 (4.8%) |
| 5 to 9 Minutes | 26 (17.4%) | 14 (11.2%) |
| 10 to 14 Minutes | 14 (9.4%) | 7 (5.6%) |
| 15 to 19 Minutes | 14 (9.4%) | 69 (55.2%) |
| 20 to 24 Minutes | 0 (0.0%) | 0 (0.0%) |
| 25 to 29 Minutes | 3 (2.0%) | 3 (2.4%) |
| 30 to 34 Minutes | 23 (15.4%) | 17 (13.6%) |
| 35 to 39 Minutes | 0 (0.0%) | 0 (0.0%) |
| 40 to 44 Minutes | 0 (0.0%) | 3 (2.4%) |
| 45 to 59 Minutes | 9 (6.0%) | 6 (4.8%) |
| 60 to 89 Minutes | 0 (0.0%) | 0 (0.0%) |
| 90 or more Minutes | 0 (0.0%) | 0 (0.0%) |
Time of Departure to Work by Sex in Mer Rouge
The most frequent times of departure to work in Mer Rouge are 6:00 AM to 6:29 AM (61, 40.9%) for males and 8:00 AM to 8:29 AM (57, 45.6%) for females.
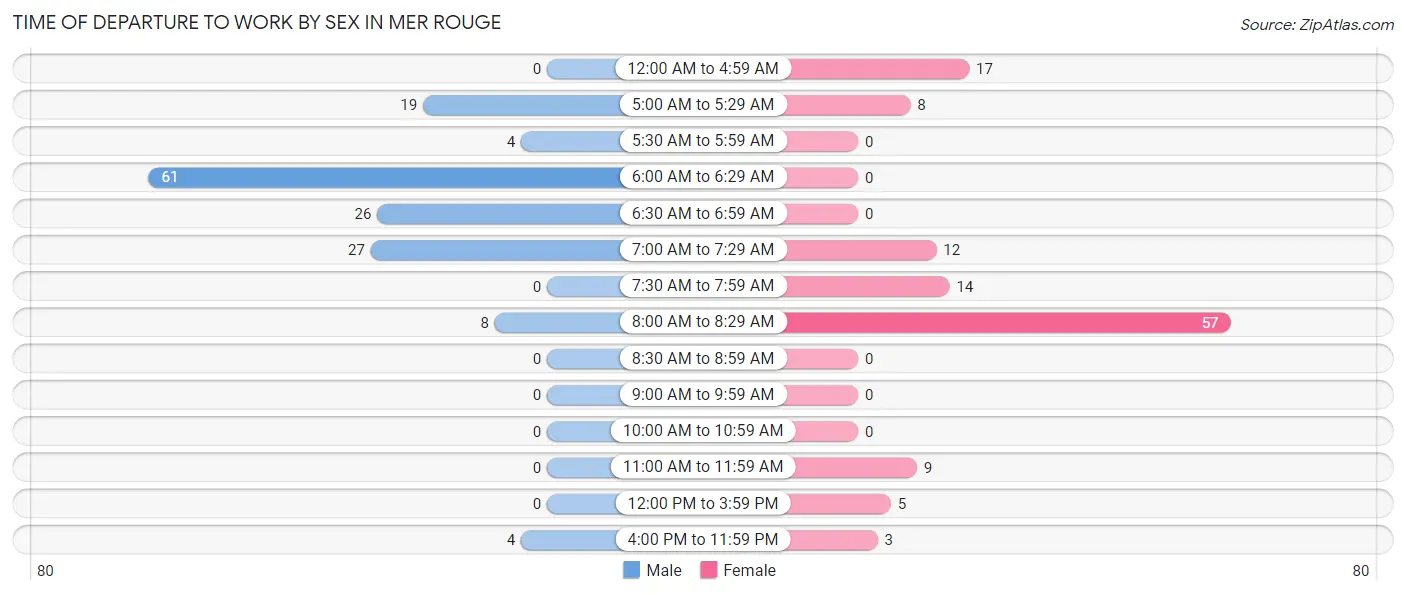
| Time of Departure | Male | Female |
| 12:00 AM to 4:59 AM | 0 (0.0%) | 17 (13.6%) |
| 5:00 AM to 5:29 AM | 19 (12.8%) | 8 (6.4%) |
| 5:30 AM to 5:59 AM | 4 (2.7%) | 0 (0.0%) |
| 6:00 AM to 6:29 AM | 61 (40.9%) | 0 (0.0%) |
| 6:30 AM to 6:59 AM | 26 (17.4%) | 0 (0.0%) |
| 7:00 AM to 7:29 AM | 27 (18.1%) | 12 (9.6%) |
| 7:30 AM to 7:59 AM | 0 (0.0%) | 14 (11.2%) |
| 8:00 AM to 8:29 AM | 8 (5.4%) | 57 (45.6%) |
| 8:30 AM to 8:59 AM | 0 (0.0%) | 0 (0.0%) |
| 9:00 AM to 9:59 AM | 0 (0.0%) | 0 (0.0%) |
| 10:00 AM to 10:59 AM | 0 (0.0%) | 0 (0.0%) |
| 11:00 AM to 11:59 AM | 0 (0.0%) | 9 (7.2%) |
| 12:00 PM to 3:59 PM | 0 (0.0%) | 5 (4.0%) |
| 4:00 PM to 11:59 PM | 4 (2.7%) | 3 (2.4%) |
| Total | 149 (100.0%) | 125 (100.0%) |
Housing Occupancy in Mer Rouge
Occupancy by Ownership in Mer Rouge
Of the total 288 dwellings in Mer Rouge, owner-occupied units account for 132 (45.8%), while renter-occupied units make up 156 (54.2%).
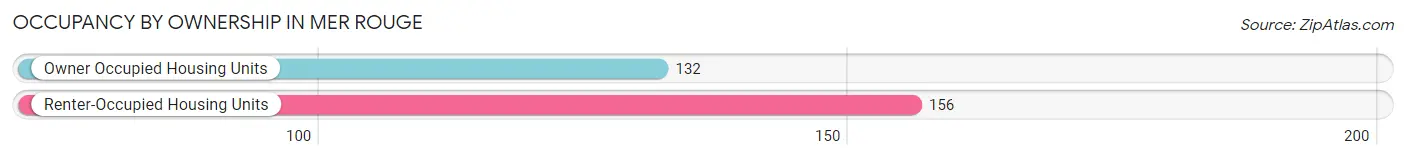
| Occupancy | # Housing Units | % Housing Units |
| Owner Occupied Housing Units | 132 | 45.8% |
| Renter-Occupied Housing Units | 156 | 54.2% |
| Total Occupied Housing Units | 288 | 100.0% |
Occupancy by Household Size in Mer Rouge
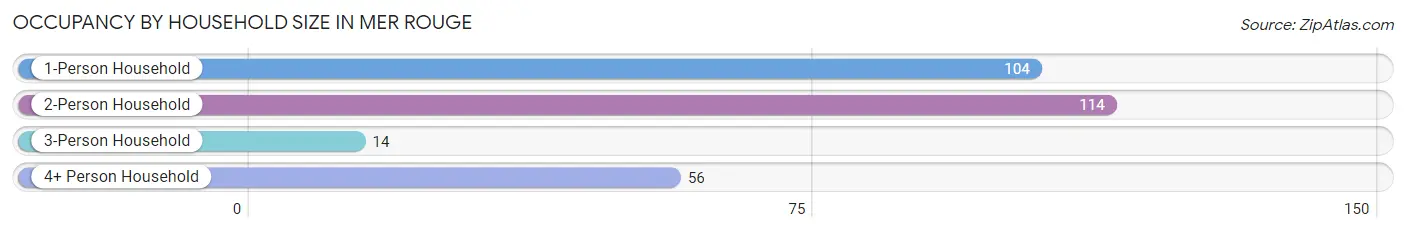
| Household Size | # Housing Units | % Housing Units |
| 1-Person Household | 104 | 36.1% |
| 2-Person Household | 114 | 39.6% |
| 3-Person Household | 14 | 4.9% |
| 4+ Person Household | 56 | 19.4% |
| Total Housing Units | 288 | 100.0% |
Occupancy by Ownership by Household Size in Mer Rouge
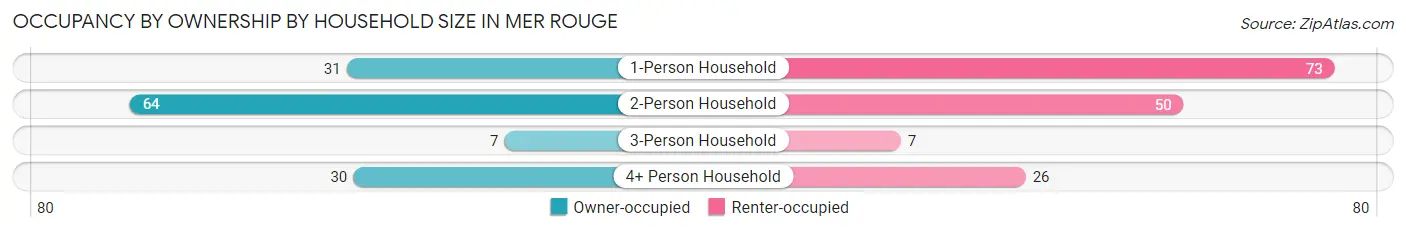
| Household Size | Owner-occupied | Renter-occupied |
| 1-Person Household | 31 (29.8%) | 73 (70.2%) |
| 2-Person Household | 64 (56.1%) | 50 (43.9%) |
| 3-Person Household | 7 (50.0%) | 7 (50.0%) |
| 4+ Person Household | 30 (53.6%) | 26 (46.4%) |
| Total Housing Units | 132 (45.8%) | 156 (54.2%) |
Occupancy by Educational Attainment in Mer Rouge
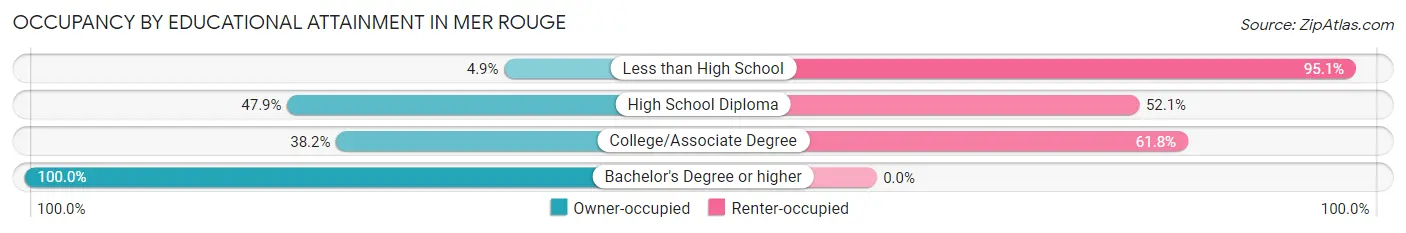
| Household Size | Owner-occupied | Renter-occupied |
| Less than High School | 2 (4.9%) | 39 (95.1%) |
| High School Diploma | 57 (47.9%) | 62 (52.1%) |
| College/Associate Degree | 34 (38.2%) | 55 (61.8%) |
| Bachelor's Degree or higher | 39 (100.0%) | 0 (0.0%) |
Occupancy by Age of Householder in Mer Rouge
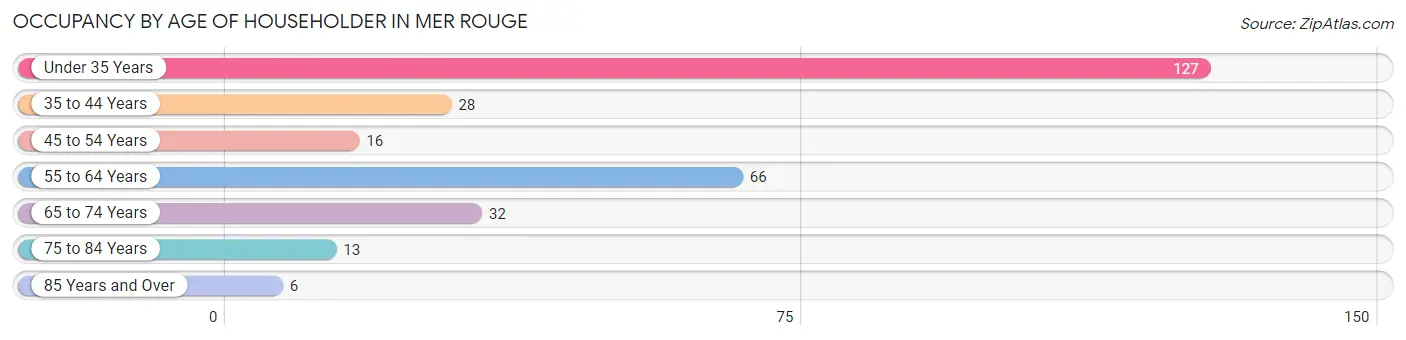
| Age Bracket | # Households | % Households |
| Under 35 Years | 127 | 44.1% |
| 35 to 44 Years | 28 | 9.7% |
| 45 to 54 Years | 16 | 5.6% |
| 55 to 64 Years | 66 | 22.9% |
| 65 to 74 Years | 32 | 11.1% |
| 75 to 84 Years | 13 | 4.5% |
| 85 Years and Over | 6 | 2.1% |
| Total | 288 | 100.0% |
Housing Finances in Mer Rouge
Median Income by Occupancy in Mer Rouge
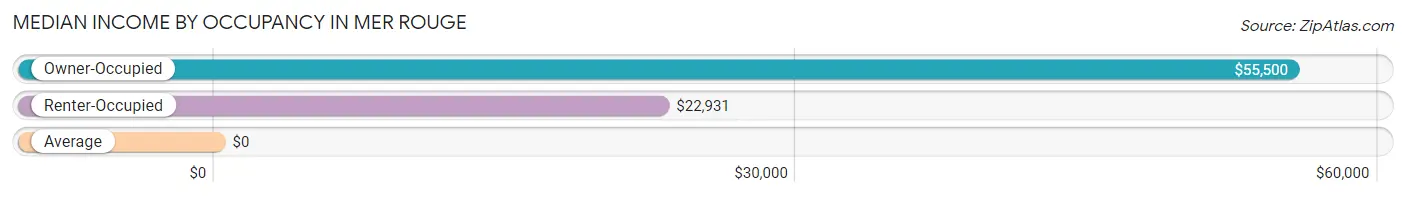
| Occupancy Type | # Households | Median Income |
| Owner-Occupied | 132 (45.8%) | $55,500 |
| Renter-Occupied | 156 (54.2%) | $22,931 |
| Average | 288 (100.0%) | $0 |
Occupancy by Householder Income Bracket in Mer Rouge
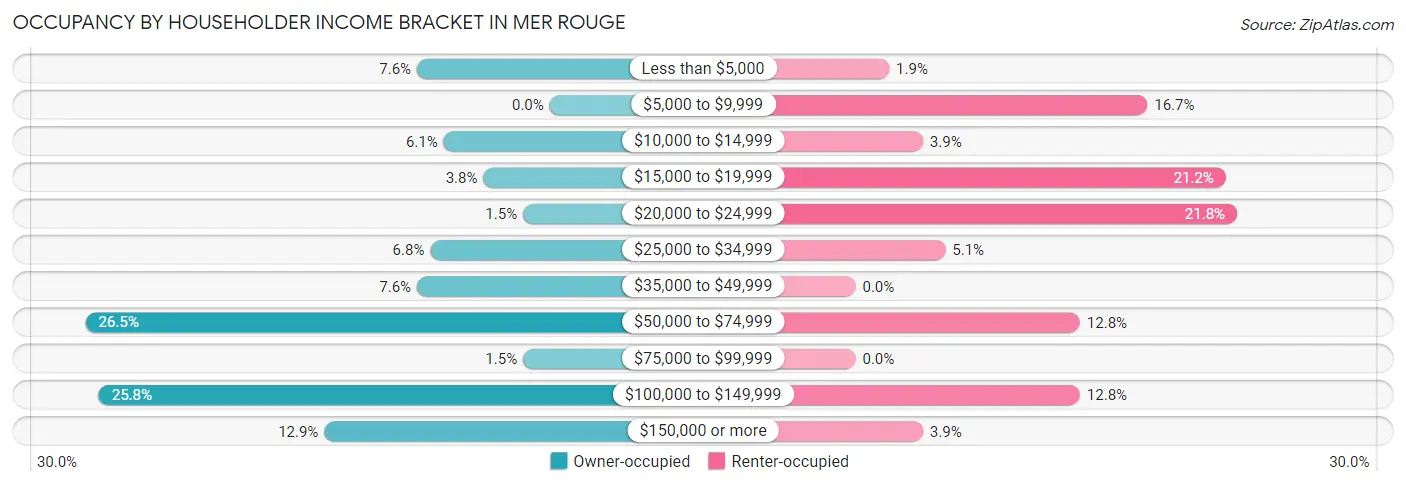
| Income Bracket | Owner-occupied | Renter-occupied |
| Less than $5,000 | 10 (7.6%) | 3 (1.9%) |
| $5,000 to $9,999 | 0 (0.0%) | 26 (16.7%) |
| $10,000 to $14,999 | 8 (6.1%) | 6 (3.8%) |
| $15,000 to $19,999 | 5 (3.8%) | 33 (21.1%) |
| $20,000 to $24,999 | 2 (1.5%) | 34 (21.8%) |
| $25,000 to $34,999 | 9 (6.8%) | 8 (5.1%) |
| $35,000 to $49,999 | 10 (7.6%) | 0 (0.0%) |
| $50,000 to $74,999 | 35 (26.5%) | 20 (12.8%) |
| $75,000 to $99,999 | 2 (1.5%) | 0 (0.0%) |
| $100,000 to $149,999 | 34 (25.8%) | 20 (12.8%) |
| $150,000 or more | 17 (12.9%) | 6 (3.8%) |
| Total | 132 (100.0%) | 156 (100.0%) |
Monthly Housing Cost Tiers in Mer Rouge
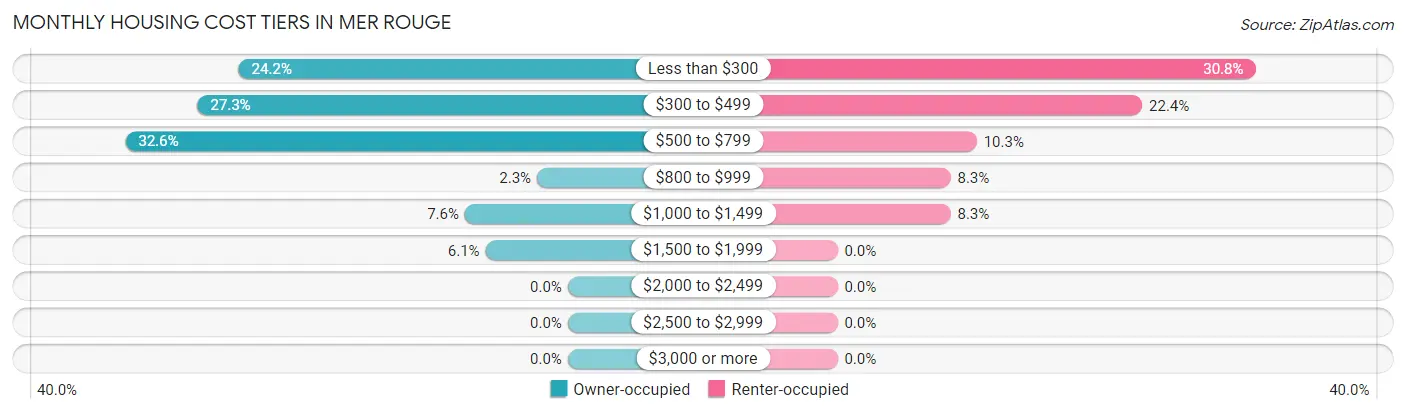
| Monthly Cost | Owner-occupied | Renter-occupied |
| Less than $300 | 32 (24.2%) | 48 (30.8%) |
| $300 to $499 | 36 (27.3%) | 35 (22.4%) |
| $500 to $799 | 43 (32.6%) | 16 (10.3%) |
| $800 to $999 | 3 (2.3%) | 13 (8.3%) |
| $1,000 to $1,499 | 10 (7.6%) | 13 (8.3%) |
| $1,500 to $1,999 | 8 (6.1%) | 0 (0.0%) |
| $2,000 to $2,499 | 0 (0.0%) | 0 (0.0%) |
| $2,500 to $2,999 | 0 (0.0%) | 0 (0.0%) |
| $3,000 or more | 0 (0.0%) | 0 (0.0%) |
| Total | 132 (100.0%) | 156 (100.0%) |
Physical Housing Characteristics in Mer Rouge
Housing Structures in Mer Rouge
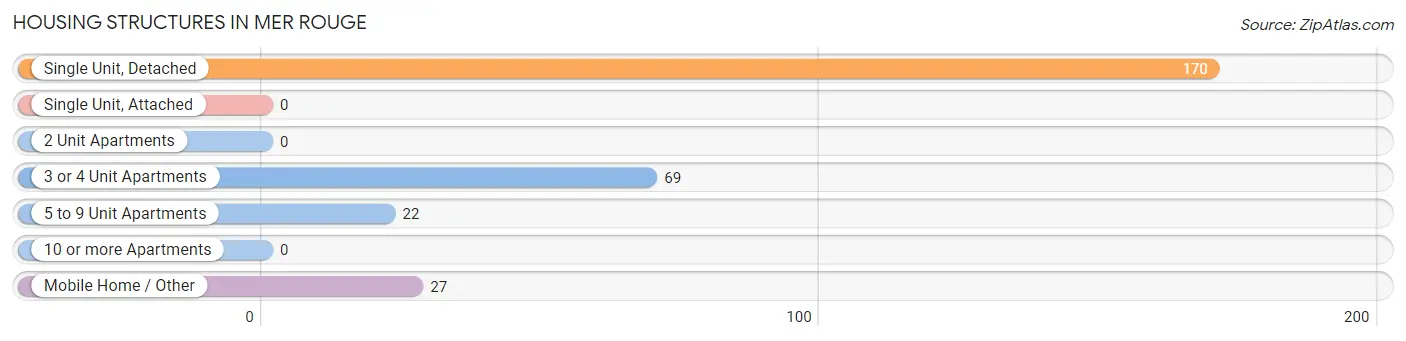
| Structure Type | # Housing Units | % Housing Units |
| Single Unit, Detached | 170 | 59.0% |
| Single Unit, Attached | 0 | 0.0% |
| 2 Unit Apartments | 0 | 0.0% |
| 3 or 4 Unit Apartments | 69 | 24.0% |
| 5 to 9 Unit Apartments | 22 | 7.6% |
| 10 or more Apartments | 0 | 0.0% |
| Mobile Home / Other | 27 | 9.4% |
| Total | 288 | 100.0% |
Housing Structures by Occupancy in Mer Rouge
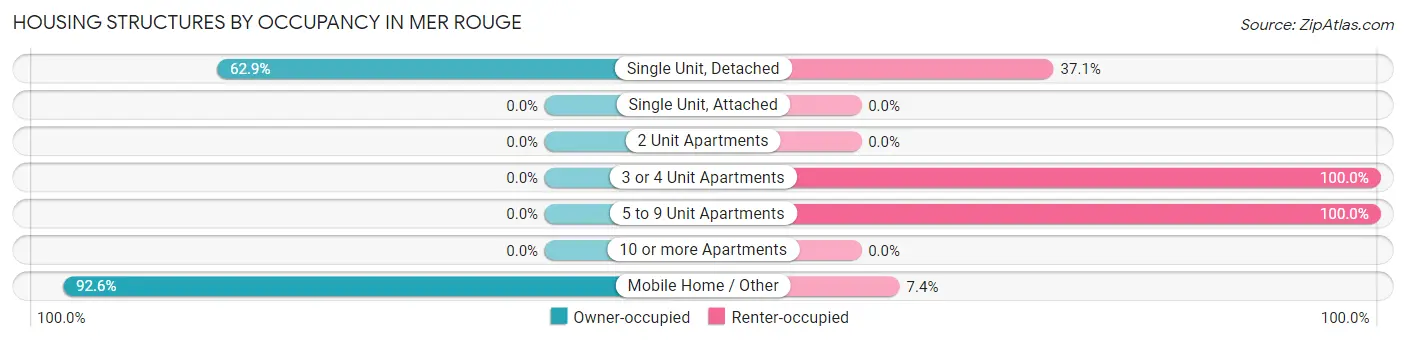
| Structure Type | Owner-occupied | Renter-occupied |
| Single Unit, Detached | 107 (62.9%) | 63 (37.1%) |
| Single Unit, Attached | 0 (0.0%) | 0 (0.0%) |
| 2 Unit Apartments | 0 (0.0%) | 0 (0.0%) |
| 3 or 4 Unit Apartments | 0 (0.0%) | 69 (100.0%) |
| 5 to 9 Unit Apartments | 0 (0.0%) | 22 (100.0%) |
| 10 or more Apartments | 0 (0.0%) | 0 (0.0%) |
| Mobile Home / Other | 25 (92.6%) | 2 (7.4%) |
| Total | 132 (45.8%) | 156 (54.2%) |
Housing Structures by Number of Rooms in Mer Rouge
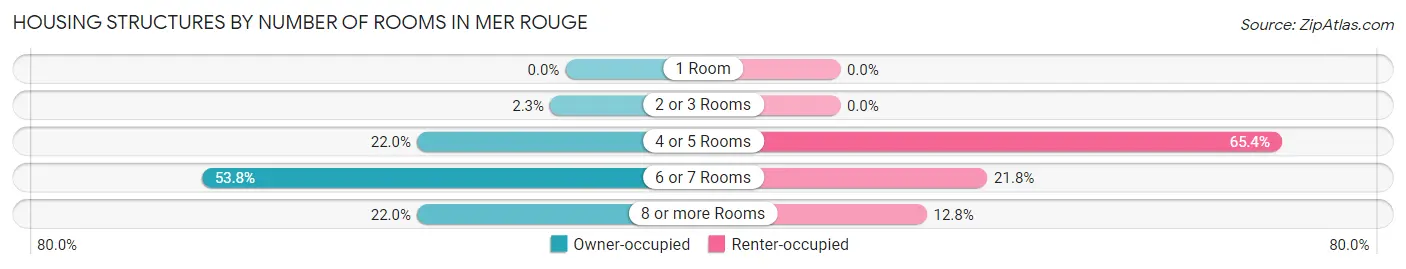
| Number of Rooms | Owner-occupied | Renter-occupied |
| 1 Room | 0 (0.0%) | 0 (0.0%) |
| 2 or 3 Rooms | 3 (2.3%) | 0 (0.0%) |
| 4 or 5 Rooms | 29 (22.0%) | 102 (65.4%) |
| 6 or 7 Rooms | 71 (53.8%) | 34 (21.8%) |
| 8 or more Rooms | 29 (22.0%) | 20 (12.8%) |
| Total | 132 (100.0%) | 156 (100.0%) |
Housing Structure by Heating Type in Mer Rouge
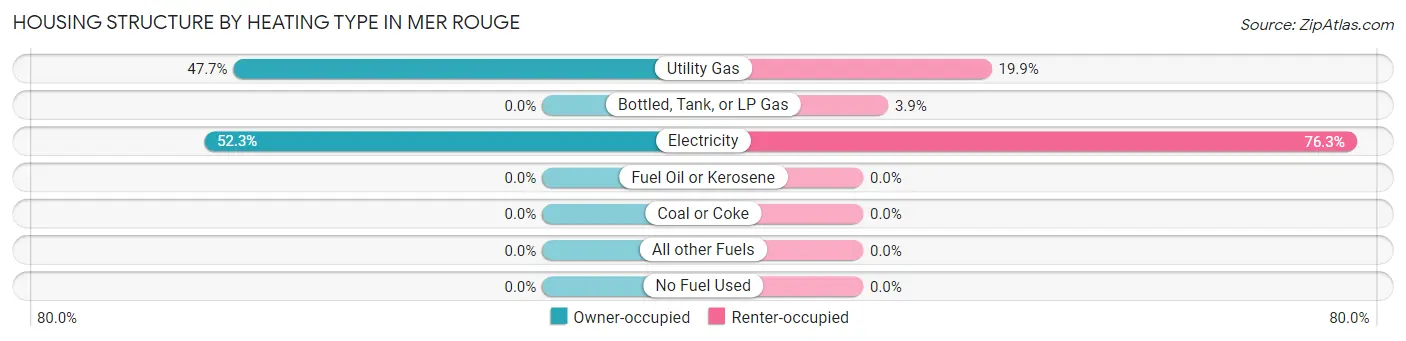
| Heating Type | Owner-occupied | Renter-occupied |
| Utility Gas | 63 (47.7%) | 31 (19.9%) |
| Bottled, Tank, or LP Gas | 0 (0.0%) | 6 (3.8%) |
| Electricity | 69 (52.3%) | 119 (76.3%) |
| Fuel Oil or Kerosene | 0 (0.0%) | 0 (0.0%) |
| Coal or Coke | 0 (0.0%) | 0 (0.0%) |
| All other Fuels | 0 (0.0%) | 0 (0.0%) |
| No Fuel Used | 0 (0.0%) | 0 (0.0%) |
| Total | 132 (100.0%) | 156 (100.0%) |
Household Vehicle Usage in Mer Rouge
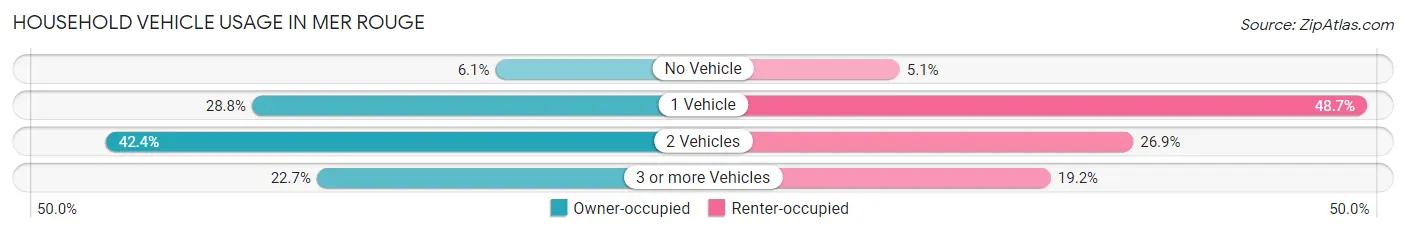
| Vehicles per Household | Owner-occupied | Renter-occupied |
| No Vehicle | 8 (6.1%) | 8 (5.1%) |
| 1 Vehicle | 38 (28.8%) | 76 (48.7%) |
| 2 Vehicles | 56 (42.4%) | 42 (26.9%) |
| 3 or more Vehicles | 30 (22.7%) | 30 (19.2%) |
| Total | 132 (100.0%) | 156 (100.0%) |
Real Estate & Mortgages in Mer Rouge
Real Estate and Mortgage Overview in Mer Rouge
| Characteristic | Without Mortgage | With Mortgage |
| Housing Units | 90 | 42 |
| Median Property Value | $112,500 | $187,500 |
| Median Household Income | $53,929 | $17 |
| Monthly Housing Costs | $386 | $0 |
| Real Estate Taxes | $199 | $0 |
Property Value by Mortgage Status in Mer Rouge
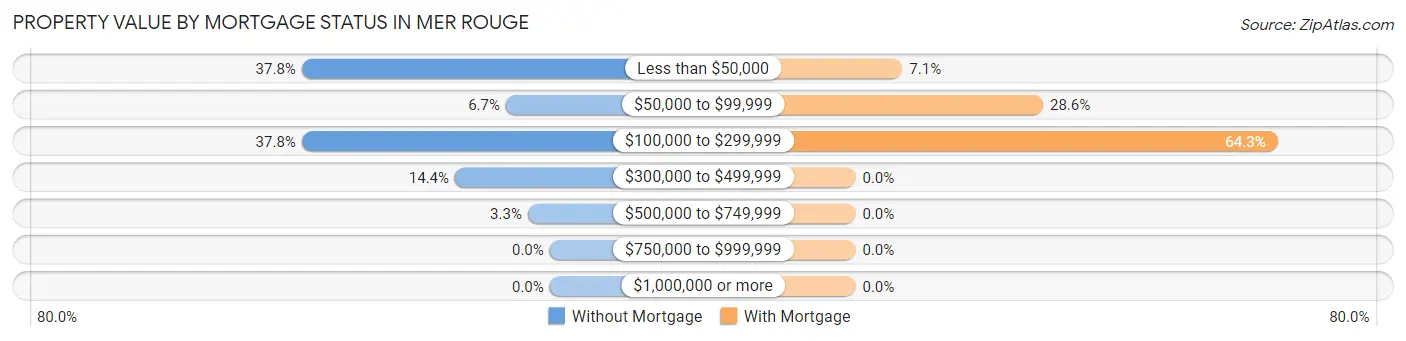
| Property Value | Without Mortgage | With Mortgage |
| Less than $50,000 | 34 (37.8%) | 3 (7.1%) |
| $50,000 to $99,999 | 6 (6.7%) | 12 (28.6%) |
| $100,000 to $299,999 | 34 (37.8%) | 27 (64.3%) |
| $300,000 to $499,999 | 13 (14.4%) | 0 (0.0%) |
| $500,000 to $749,999 | 3 (3.3%) | 0 (0.0%) |
| $750,000 to $999,999 | 0 (0.0%) | 0 (0.0%) |
| $1,000,000 or more | 0 (0.0%) | 0 (0.0%) |
| Total | 90 (100.0%) | 42 (100.0%) |
Household Income by Mortgage Status in Mer Rouge
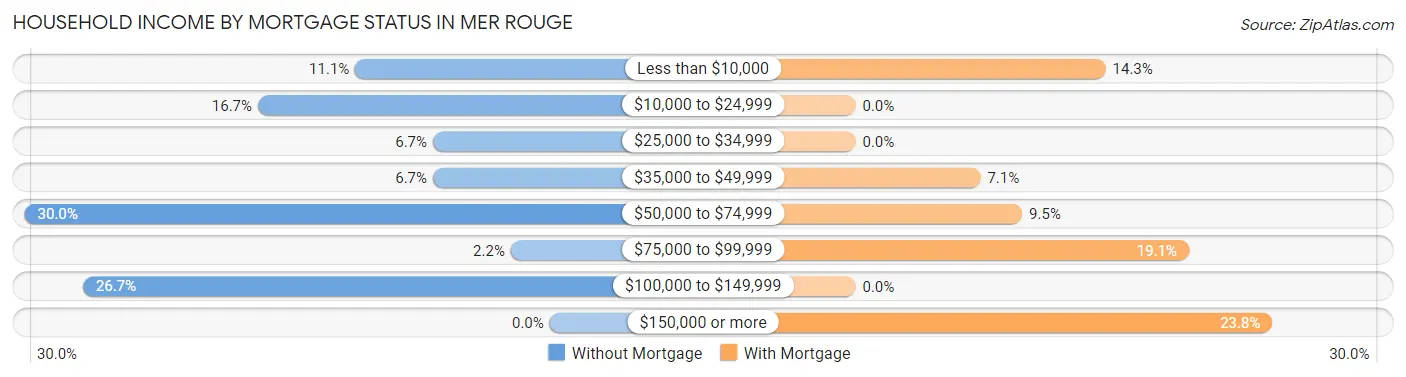
| Household Income | Without Mortgage | With Mortgage |
| Less than $10,000 | 10 (11.1%) | 6 (14.3%) |
| $10,000 to $24,999 | 15 (16.7%) | 0 (0.0%) |
| $25,000 to $34,999 | 6 (6.7%) | 0 (0.0%) |
| $35,000 to $49,999 | 6 (6.7%) | 3 (7.1%) |
| $50,000 to $74,999 | 27 (30.0%) | 4 (9.5%) |
| $75,000 to $99,999 | 2 (2.2%) | 8 (19.1%) |
| $100,000 to $149,999 | 24 (26.7%) | 0 (0.0%) |
| $150,000 or more | 0 (0.0%) | 10 (23.8%) |
| Total | 90 (100.0%) | 42 (100.0%) |
Property Value to Household Income Ratio in Mer Rouge
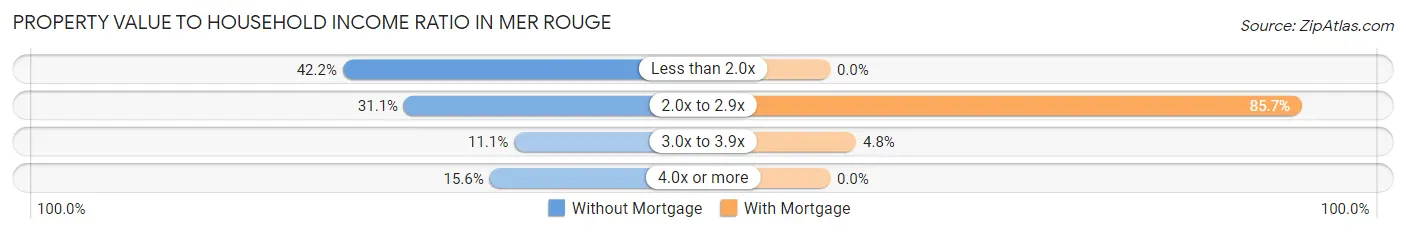
| Value-to-Income Ratio | Without Mortgage | With Mortgage |
| Less than 2.0x | 38 (42.2%) | 0 (0.0%) |
| 2.0x to 2.9x | 28 (31.1%) | 36 (85.7%) |
| 3.0x to 3.9x | 10 (11.1%) | 2 (4.8%) |
| 4.0x or more | 14 (15.6%) | 0 (0.0%) |
| Total | 90 (100.0%) | 42 (100.0%) |
Real Estate Taxes by Mortgage Status in Mer Rouge
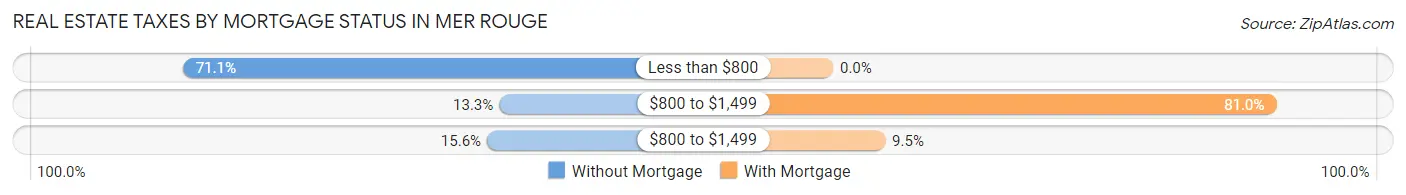
| Property Taxes | Without Mortgage | With Mortgage |
| Less than $800 | 64 (71.1%) | 0 (0.0%) |
| $800 to $1,499 | 12 (13.3%) | 34 (80.9%) |
| $800 to $1,499 | 14 (15.6%) | 4 (9.5%) |
| Total | 90 (100.0%) | 42 (100.0%) |
Health & Disability in Mer Rouge
Health Insurance Coverage by Age in Mer Rouge
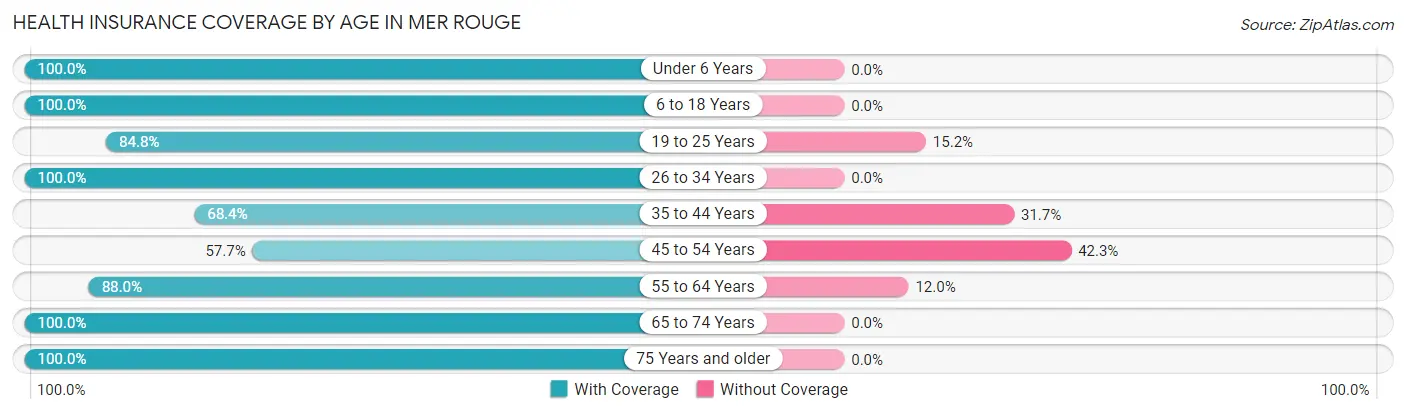
| Age Bracket | With Coverage | Without Coverage |
| Under 6 Years | 106 (100.0%) | 0 (0.0%) |
| 6 to 18 Years | 159 (100.0%) | 0 (0.0%) |
| 19 to 25 Years | 39 (84.8%) | 7 (15.2%) |
| 26 to 34 Years | 102 (100.0%) | 0 (0.0%) |
| 35 to 44 Years | 54 (68.3%) | 25 (31.7%) |
| 45 to 54 Years | 15 (57.7%) | 11 (42.3%) |
| 55 to 64 Years | 103 (88.0%) | 14 (12.0%) |
| 65 to 74 Years | 72 (100.0%) | 0 (0.0%) |
| 75 Years and older | 30 (100.0%) | 0 (0.0%) |
| Total | 680 (92.3%) | 57 (7.7%) |
Health Insurance Coverage by Citizenship Status in Mer Rouge
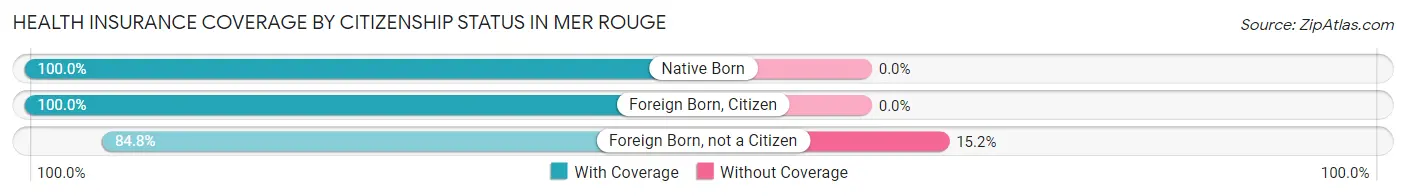
| Citizenship Status | With Coverage | Without Coverage |
| Native Born | 106 (100.0%) | 0 (0.0%) |
| Foreign Born, Citizen | 159 (100.0%) | 0 (0.0%) |
| Foreign Born, not a Citizen | 39 (84.8%) | 7 (15.2%) |
Health Insurance Coverage by Household Income in Mer Rouge
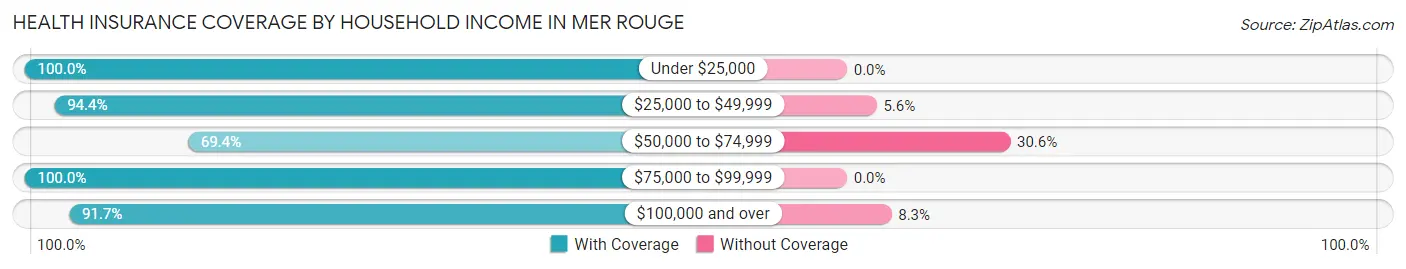
| Household Income | With Coverage | Without Coverage |
| Under $25,000 | 347 (100.0%) | 0 (0.0%) |
| $25,000 to $49,999 | 51 (94.4%) | 3 (5.6%) |
| $50,000 to $74,999 | 84 (69.4%) | 37 (30.6%) |
| $75,000 to $99,999 | 4 (100.0%) | 0 (0.0%) |
| $100,000 and over | 187 (91.7%) | 17 (8.3%) |
Public vs Private Health Insurance Coverage by Age in Mer Rouge
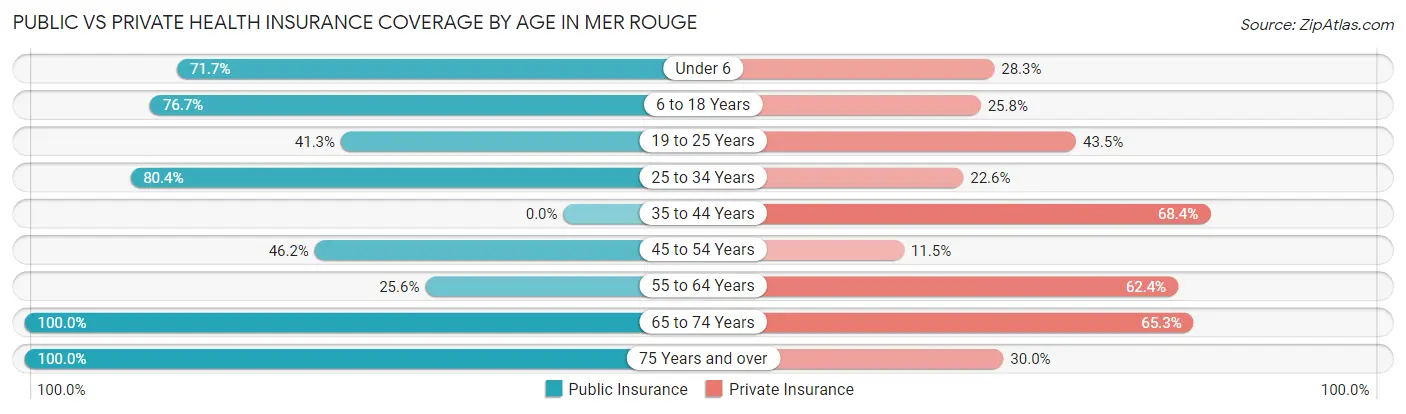
| Age Bracket | Public Insurance | Private Insurance |
| Under 6 | 76 (71.7%) | 30 (28.3%) |
| 6 to 18 Years | 122 (76.7%) | 41 (25.8%) |
| 19 to 25 Years | 19 (41.3%) | 20 (43.5%) |
| 25 to 34 Years | 82 (80.4%) | 23 (22.6%) |
| 35 to 44 Years | 0 (0.0%) | 54 (68.3%) |
| 45 to 54 Years | 12 (46.2%) | 3 (11.5%) |
| 55 to 64 Years | 30 (25.6%) | 73 (62.4%) |
| 65 to 74 Years | 72 (100.0%) | 47 (65.3%) |
| 75 Years and over | 30 (100.0%) | 9 (30.0%) |
| Total | 443 (60.1%) | 300 (40.7%) |
Disability Status by Sex by Age in Mer Rouge
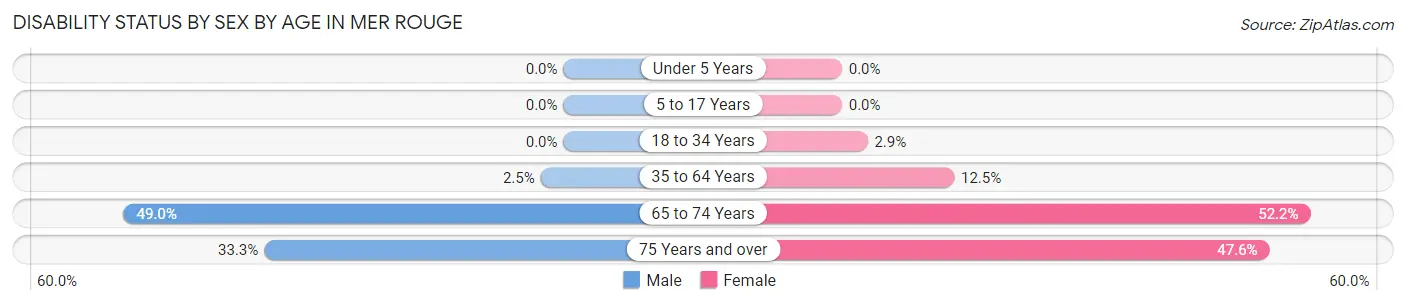
| Age Bracket | Male | Female |
| Under 5 Years | 0 (0.0%) | 0 (0.0%) |
| 5 to 17 Years | 0 (0.0%) | 0 (0.0%) |
| 18 to 34 Years | 0 (0.0%) | 3 (2.9%) |
| 35 to 64 Years | 3 (2.5%) | 13 (12.5%) |
| 65 to 74 Years | 24 (49.0%) | 12 (52.2%) |
| 75 Years and over | 3 (33.3%) | 10 (47.6%) |
Disability Class by Sex by Age in Mer Rouge
Disability Class: Hearing Difficulty
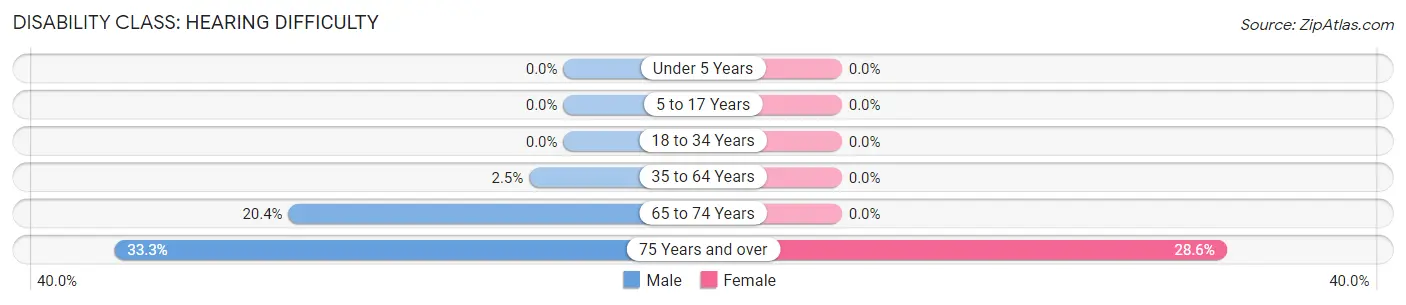
| Age Bracket | Male | Female |
| Under 5 Years | 0 (0.0%) | 0 (0.0%) |
| 5 to 17 Years | 0 (0.0%) | 0 (0.0%) |
| 18 to 34 Years | 0 (0.0%) | 0 (0.0%) |
| 35 to 64 Years | 3 (2.5%) | 0 (0.0%) |
| 65 to 74 Years | 10 (20.4%) | 0 (0.0%) |
| 75 Years and over | 3 (33.3%) | 6 (28.6%) |
Disability Class: Vision Difficulty
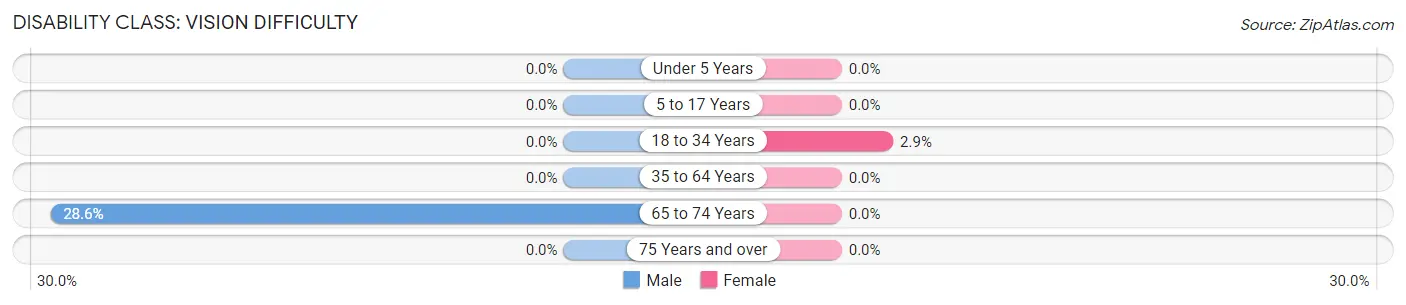
| Age Bracket | Male | Female |
| Under 5 Years | 0 (0.0%) | 0 (0.0%) |
| 5 to 17 Years | 0 (0.0%) | 0 (0.0%) |
| 18 to 34 Years | 0 (0.0%) | 3 (2.9%) |
| 35 to 64 Years | 0 (0.0%) | 0 (0.0%) |
| 65 to 74 Years | 14 (28.6%) | 0 (0.0%) |
| 75 Years and over | 0 (0.0%) | 0 (0.0%) |
Disability Class: Cognitive Difficulty
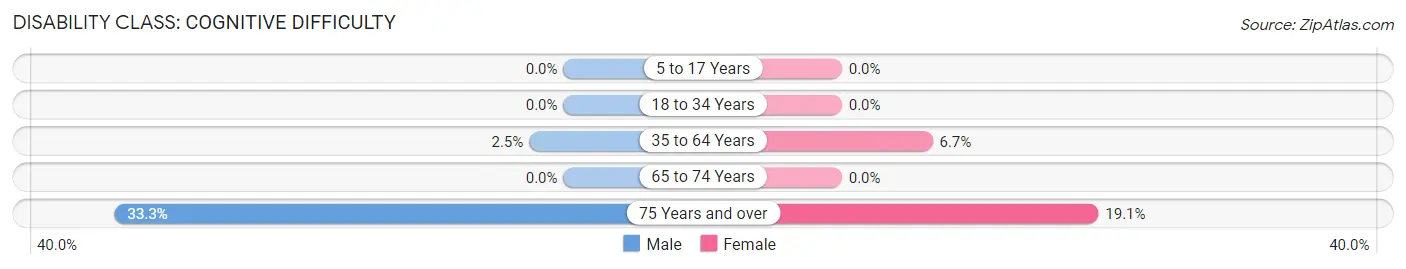
| Age Bracket | Male | Female |
| 5 to 17 Years | 0 (0.0%) | 0 (0.0%) |
| 18 to 34 Years | 0 (0.0%) | 0 (0.0%) |
| 35 to 64 Years | 3 (2.5%) | 7 (6.7%) |
| 65 to 74 Years | 0 (0.0%) | 0 (0.0%) |
| 75 Years and over | 3 (33.3%) | 4 (19.1%) |
Disability Class: Ambulatory Difficulty
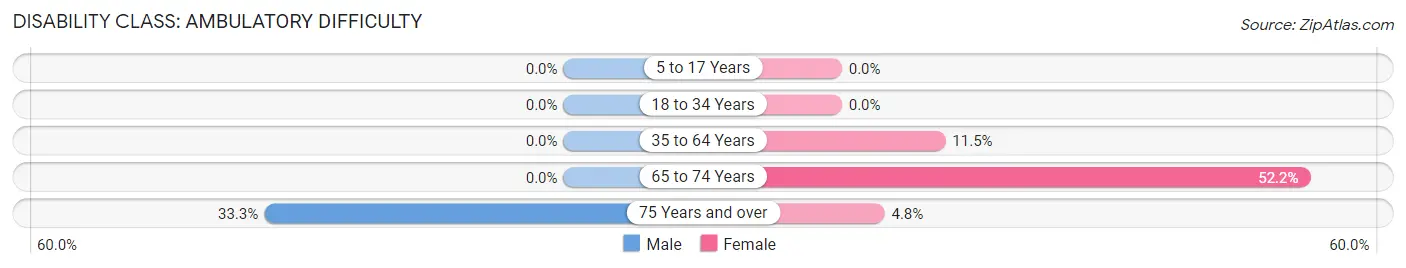
| Age Bracket | Male | Female |
| 5 to 17 Years | 0 (0.0%) | 0 (0.0%) |
| 18 to 34 Years | 0 (0.0%) | 0 (0.0%) |
| 35 to 64 Years | 0 (0.0%) | 12 (11.5%) |
| 65 to 74 Years | 0 (0.0%) | 12 (52.2%) |
| 75 Years and over | 3 (33.3%) | 1 (4.8%) |
Disability Class: Self-Care Difficulty
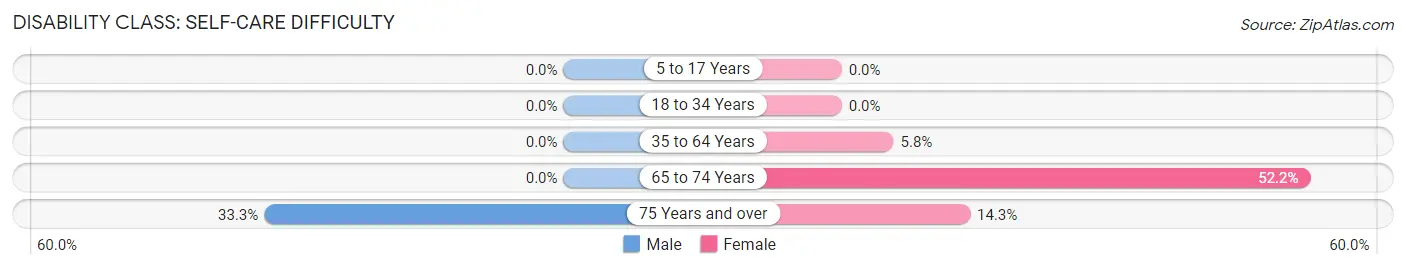
| Age Bracket | Male | Female |
| 5 to 17 Years | 0 (0.0%) | 0 (0.0%) |
| 18 to 34 Years | 0 (0.0%) | 0 (0.0%) |
| 35 to 64 Years | 0 (0.0%) | 6 (5.8%) |
| 65 to 74 Years | 0 (0.0%) | 12 (52.2%) |
| 75 Years and over | 3 (33.3%) | 3 (14.3%) |
Technology Access in Mer Rouge
Computing Device Access in Mer Rouge
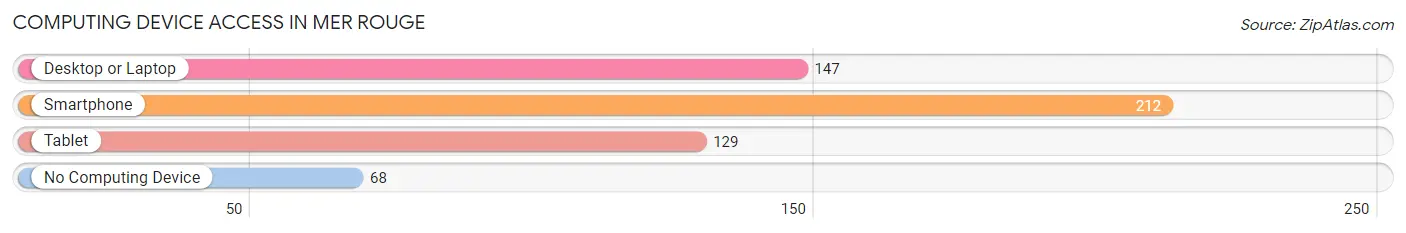
| Device Type | # Households | % Households |
| Desktop or Laptop | 147 | 51.0% |
| Smartphone | 212 | 73.6% |
| Tablet | 129 | 44.8% |
| No Computing Device | 68 | 23.6% |
| Total | 288 | 100.0% |
Internet Access in Mer Rouge
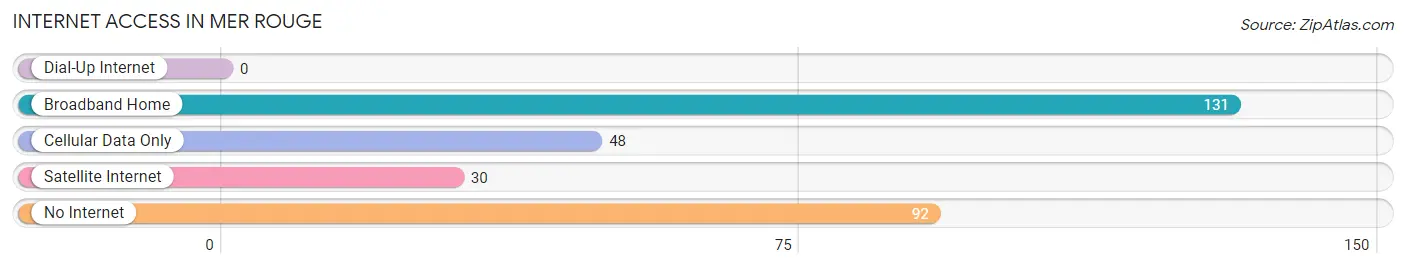
| Internet Type | # Households | % Households |
| Dial-Up Internet | 0 | 0.0% |
| Broadband Home | 131 | 45.5% |
| Cellular Data Only | 48 | 16.7% |
| Satellite Internet | 30 | 10.4% |
| No Internet | 92 | 31.9% |
| Total | 288 | 100.0% |
Mer Rouge Summary
Merr Rouge is a small town located in Morehouse Parish, Louisiana. It is situated on the banks of the Mississippi River, approximately 20 miles south of the Arkansas border. The town was founded in 1883 and has a population of 1,845 as of the 2010 census.
History
Merr Rouge was founded in 1883 by a group of settlers from the nearby town of Bastrop. The town was named after the nearby Red River, which was known as the Mer Rouge in French. The town was originally a farming community, with cotton and corn being the main crops. The town also had a sawmill and a gristmill.
In the early 1900s, the town began to grow and develop. The first school was built in 1906 and the first bank opened in 1907. The town also had a post office, a hotel, and a general store.
In the 1920s, the town began to experience a period of growth and prosperity. The population increased from 500 to 1,000 and the town had a number of businesses, including a movie theater, a drug store, and a hardware store.
In the 1940s, the town experienced a decline in population due to the Great Depression and World War II. The population decreased to 500 and many of the businesses closed.
In the 1950s, the town began to experience a period of growth and development. The population increased to 1,000 and the town had a number of businesses, including a grocery store, a hardware store, and a restaurant.
In the 1960s, the town experienced a period of decline due to the decline of the cotton industry. The population decreased to 500 and many of the businesses closed.
In the 1970s, the town began to experience a period of growth and development. The population increased to 1,000 and the town had a number of businesses, including a grocery store, a hardware store, and a restaurant.
In the 1980s, the town experienced a period of decline due to the decline of the cotton industry. The population decreased to 500 and many of the businesses closed.
In the 1990s, the town began to experience a period of growth and development. The population increased to 1,000 and the town had a number of businesses, including a grocery store, a hardware store, and a restaurant.
Geography
Merr Rouge is located in Morehouse Parish, Louisiana. It is situated on the banks of the Mississippi River, approximately 20 miles south of the Arkansas border. The town is located in the flat, alluvial plain of the Mississippi Delta. The town is surrounded by farmland and is located near the Red River.
The climate in Merr Rouge is humid subtropical, with hot, humid summers and mild winters. The average annual temperature is 68°F (20°C). The average annual precipitation is 48 inches (122 cm).
Economy
Merr Rouge is a small, rural town with a population of 1,845 as of the 2010 census. The town is primarily a farming community, with cotton and corn being the main crops. The town also has a number of businesses, including a grocery store, a hardware store, and a restaurant.
The town is also home to a number of small manufacturing companies, including a furniture factory, a woodworking factory, and a printing company. The town also has a number of small businesses, including a gas station, a barber shop, and a beauty salon.
Demographics
As of the 2010 census, the population of Merr Rouge was 1,845. The racial makeup of the town was 79.3% White, 19.2% African American, 0.2% Native American, 0.2% Asian, and 0.9% from other races. Hispanic or Latino of any race were 1.2% of the population.
The median income for a household in Merr Rouge was $30,938, and the median income for a family was $37,500. The per capita income for the town was $15,945. About 17.2% of families and 20.2% of the population were below the poverty line, including 28.3% of those under age 18 and 15.2% of those age 65 or over.
Common Questions
What is Per Capita Income in Mer Rouge?
Per Capita income in Mer Rouge is $26,924.
What is the Median Family Income in Mer Rouge?
Median Family Income in Mer Rouge is $54,167.
What is Income or Wage Gap in Mer Rouge?
Income or Wage Gap in Mer Rouge is 72.0%.
Women in Mer Rouge earn 28.0 cents for every dollar earned by a man.
What is Inequality or Gini Index in Mer Rouge?
Inequality or Gini Index in Mer Rouge is 0.55.
What is the Total Population of Mer Rouge?
Total Population of Mer Rouge is 812.
What is the Total Male Population of Mer Rouge?
Total Male Population of Mer Rouge is 364.
What is the Total Female Population of Mer Rouge?
Total Female Population of Mer Rouge is 448.
What is the Ratio of Males per 100 Females in Mer Rouge?
There are 81.25 Males per 100 Females in Mer Rouge.
What is the Ratio of Females per 100 Males in Mer Rouge?
There are 123.08 Females per 100 Males in Mer Rouge.
What is the Median Population Age in Mer Rouge?
Median Population Age in Mer Rouge is 34.7 Years.
What is the Average Family Size in Mer Rouge
Average Family Size in Mer Rouge is 3.4 People.
What is the Average Household Size in Mer Rouge
Average Household Size in Mer Rouge is 2.5 People.
How Large is the Labor Force in Mer Rouge?
There are 315 People in the Labor Forcein in Mer Rouge.
What is the Percentage of People in the Labor Force in Mer Rouge?
57.0% of People are in the Labor Force in Mer Rouge.
What is the Unemployment Rate in Mer Rouge?
Unemployment Rate in Mer Rouge is 9.5%.