Marksville, LA Map & Demographics
Marksville Map
Marksville Overview
$24,157
PER CAPITA INCOME
$43,750
AVG FAMILY INCOME
$33,635
AVG HOUSEHOLD INCOME
21.0%
WAGE / INCOME GAP [ % ]
79.0¢/ $1
WAGE / INCOME GAP [ $ ]
$12,021
FAMILY INCOME DEFICIT
0.51
INEQUALITY / GINI INDEX
5,034
TOTAL POPULATION
2,623
MALE POPULATION
2,411
FEMALE POPULATION
108.79
MALES / 100 FEMALES
91.92
FEMALES / 100 MALES
33.9
MEDIAN AGE
3.3
AVG FAMILY SIZE
2.3
AVG HOUSEHOLD SIZE
2,116
LABOR FORCE [ PEOPLE ]
55.0%
PERCENT IN LABOR FORCE
7.0%
UNEMPLOYMENT RATE
Marksville Zip Codes
Marksville Area Codes
Income in Marksville
Income Overview in Marksville
Per Capita Income in Marksville is $24,157, while median incomes of families and households are $43,750 and $33,635 respectively.
| Characteristic | Number | Measure |
| Per Capita Income | 5,034 | $24,157 |
| Median Family Income | 1,000 | $43,750 |
| Mean Family Income | 1,000 | $57,449 |
| Median Household Income | 1,975 | $33,635 |
| Mean Household Income | 1,975 | $56,863 |
| Income Deficit | 1,000 | $12,021 |
| Wage / Income Gap (%) | 5,034 | 20.97% |
| Wage / Income Gap ($) | 5,034 | 79.03¢ per $1 |
| Gini / Inequality Index | 5,034 | 0.51 |
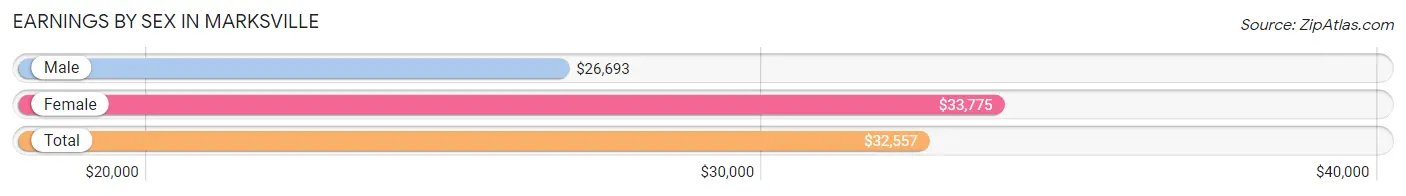
Earnings by Sex in Marksville
Average Earnings in Marksville are $32,557, $26,693 for men and $33,775 for women, a difference of 21.0%.
| Sex | Number | Average Earnings |
| Male | 1,019 (48.6%) | $26,693 |
| Female | 1,078 (51.4%) | $33,775 |
| Total | 2,097 (100.0%) | $32,557 |
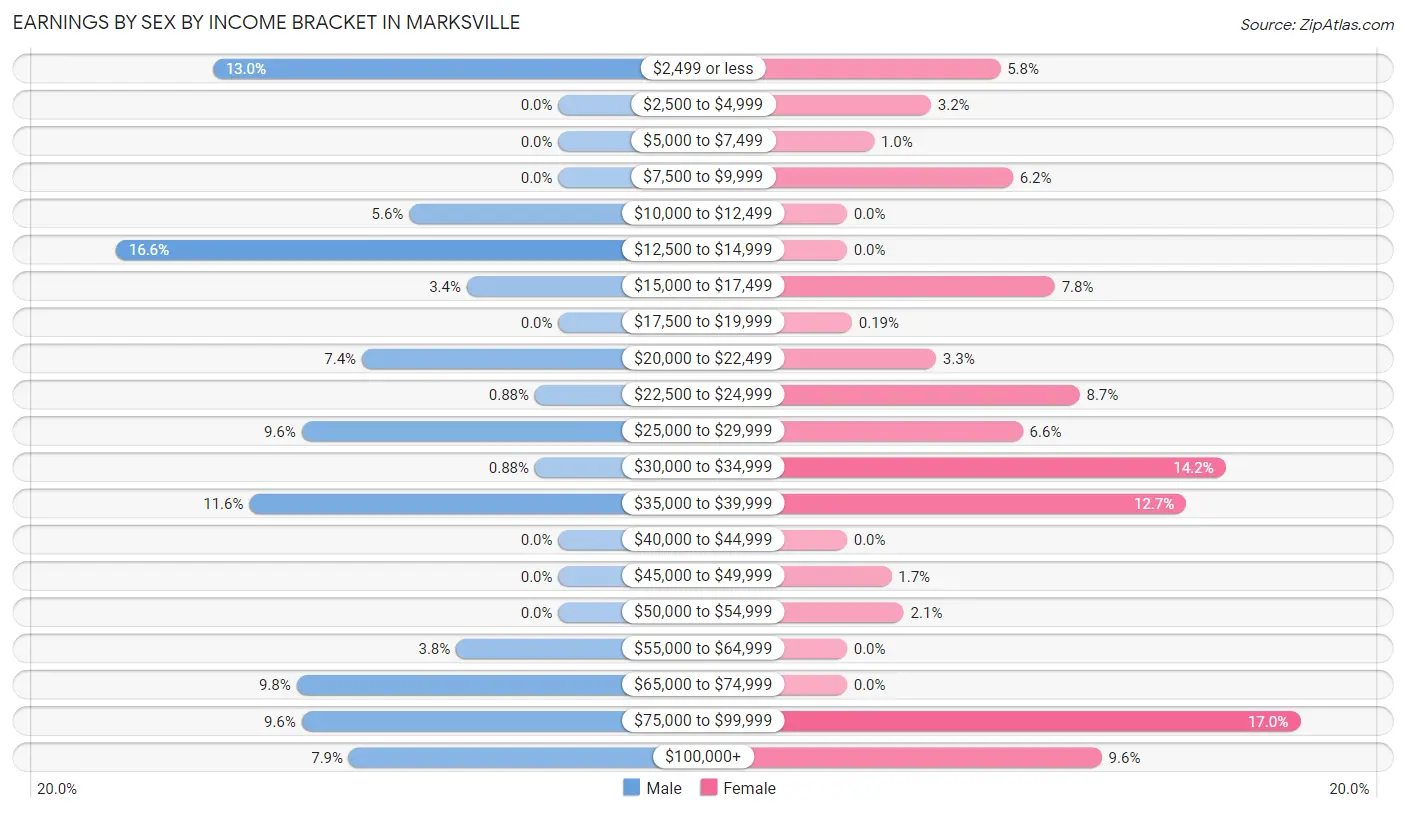
Earnings by Sex by Income Bracket in Marksville
The most common earnings brackets in Marksville are $12,500 to $14,999 for men (169 | 16.6%) and $75,000 to $99,999 for women (183 | 17.0%).
| Income | Male | Female |
| $2,499 or less | 132 (13.0%) | 62 (5.8%) |
| $2,500 to $4,999 | 0 (0.0%) | 34 (3.2%) |
| $5,000 to $7,499 | 0 (0.0%) | 11 (1.0%) |
| $7,500 to $9,999 | 0 (0.0%) | 67 (6.2%) |
| $10,000 to $12,499 | 57 (5.6%) | 0 (0.0%) |
| $12,500 to $14,999 | 169 (16.6%) | 0 (0.0%) |
| $15,000 to $17,499 | 35 (3.4%) | 84 (7.8%) |
| $17,500 to $19,999 | 0 (0.0%) | 2 (0.2%) |
| $20,000 to $22,499 | 75 (7.4%) | 36 (3.3%) |
| $22,500 to $24,999 | 9 (0.9%) | 94 (8.7%) |
| $25,000 to $29,999 | 98 (9.6%) | 71 (6.6%) |
| $30,000 to $34,999 | 9 (0.9%) | 153 (14.2%) |
| $35,000 to $39,999 | 118 (11.6%) | 137 (12.7%) |
| $40,000 to $44,999 | 0 (0.0%) | 0 (0.0%) |
| $45,000 to $49,999 | 0 (0.0%) | 18 (1.7%) |
| $50,000 to $54,999 | 0 (0.0%) | 23 (2.1%) |
| $55,000 to $64,999 | 39 (3.8%) | 0 (0.0%) |
| $65,000 to $74,999 | 100 (9.8%) | 0 (0.0%) |
| $75,000 to $99,999 | 98 (9.6%) | 183 (17.0%) |
| $100,000+ | 80 (7.9%) | 103 (9.6%) |
| Total | 1,019 (100.0%) | 1,078 (100.0%) |
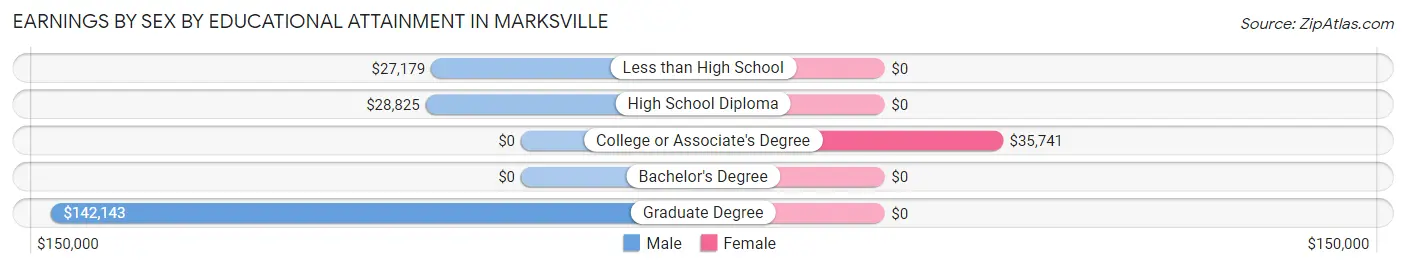
Earnings by Sex by Educational Attainment in Marksville
Average earnings in Marksville are $26,146 for men and $34,052 for women, a difference of 23.2%. Men with an educational attainment of graduate degree enjoy the highest average annual earnings of $142,143, while those with less than high school education earn the least with $27,179. Women with an educational attainment of college or associate's degree earn the most with the average annual earnings of $35,741, while those with college or associate's degree education have the smallest earnings of $35,741.
| Educational Attainment | Male Income | Female Income |
| Less than High School | $27,179 | $0 |
| High School Diploma | $28,825 | $0 |
| College or Associate's Degree | - | - |
| Bachelor's Degree | - | - |
| Graduate Degree | $142,143 | $0 |
| Total | $26,146 | $34,052 |
Family Income in Marksville
Family Income Brackets in Marksville
According to the Marksville family income data, there are 296 families falling into the $75,000 to $99,999 income range, which is the most common income bracket and makes up 29.6% of all families.
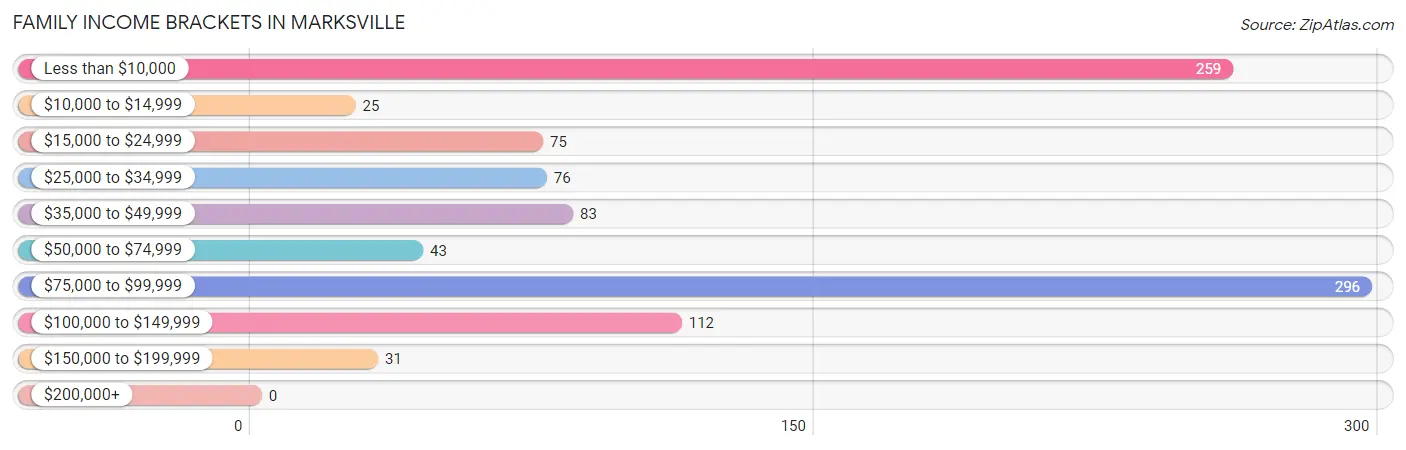
| Income Bracket | # Families | % Families |
| Less than $10,000 | 259 | 25.9% |
| $10,000 to $14,999 | 25 | 2.5% |
| $15,000 to $24,999 | 75 | 7.5% |
| $25,000 to $34,999 | 76 | 7.6% |
| $35,000 to $49,999 | 83 | 8.3% |
| $50,000 to $74,999 | 43 | 4.3% |
| $75,000 to $99,999 | 296 | 29.6% |
| $100,000 to $149,999 | 112 | 11.2% |
| $150,000 to $199,999 | 31 | 3.1% |
| $200,000+ | 0 | 0.0% |
Family Income by Famaliy Size in Marksville
4-person families (122 | 12.2%) account for the highest median family income in Marksville with $105,806 per family, while 4-person families (122 | 12.2%) have the highest median income of $26,452 per family member.
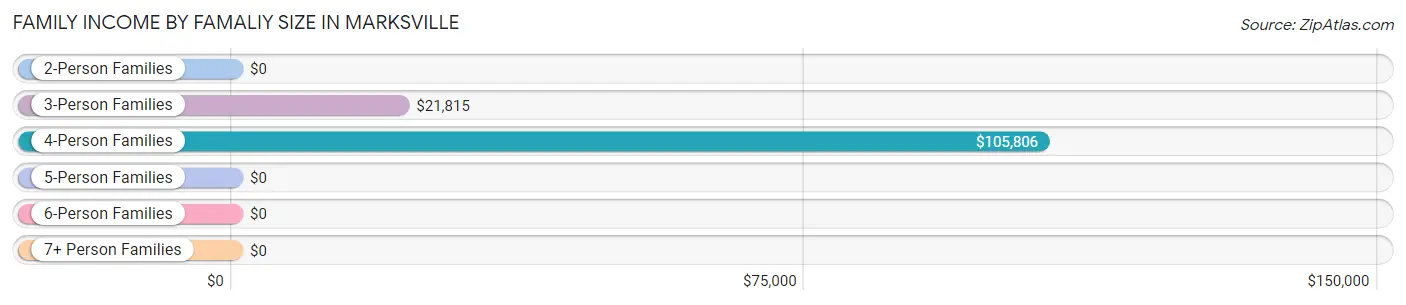
| Income Bracket | # Families | Median Income |
| 2-Person Families | 624 (62.4%) | $0 |
| 3-Person Families | 137 (13.7%) | $21,815 |
| 4-Person Families | 122 (12.2%) | $105,806 |
| 5-Person Families | 46 (4.6%) | $0 |
| 6-Person Families | 71 (7.1%) | $0 |
| 7+ Person Families | 0 (0.0%) | $0 |
| Total | 1,000 (100.0%) | $43,750 |
Family Income by Number of Earners in Marksville
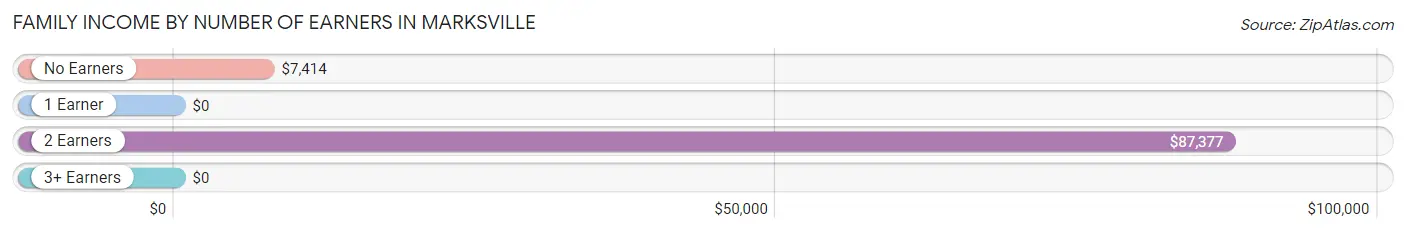
| Number of Earners | # Families | Median Income |
| No Earners | 288 (28.8%) | $7,414 |
| 1 Earner | 468 (46.8%) | $0 |
| 2 Earners | 227 (22.7%) | $87,377 |
| 3+ Earners | 17 (1.7%) | $0 |
| Total | 1,000 (100.0%) | $43,750 |
Household Income in Marksville
Household Income Brackets in Marksville
With 340 households falling in the category, the $10,000 to $14,999 income range is the most frequent in Marksville, accounting for 17.2% of all households. In contrast, only 32 households (1.6%) fall into the $150,000 to $199,999 income bracket, making it the least populous group.
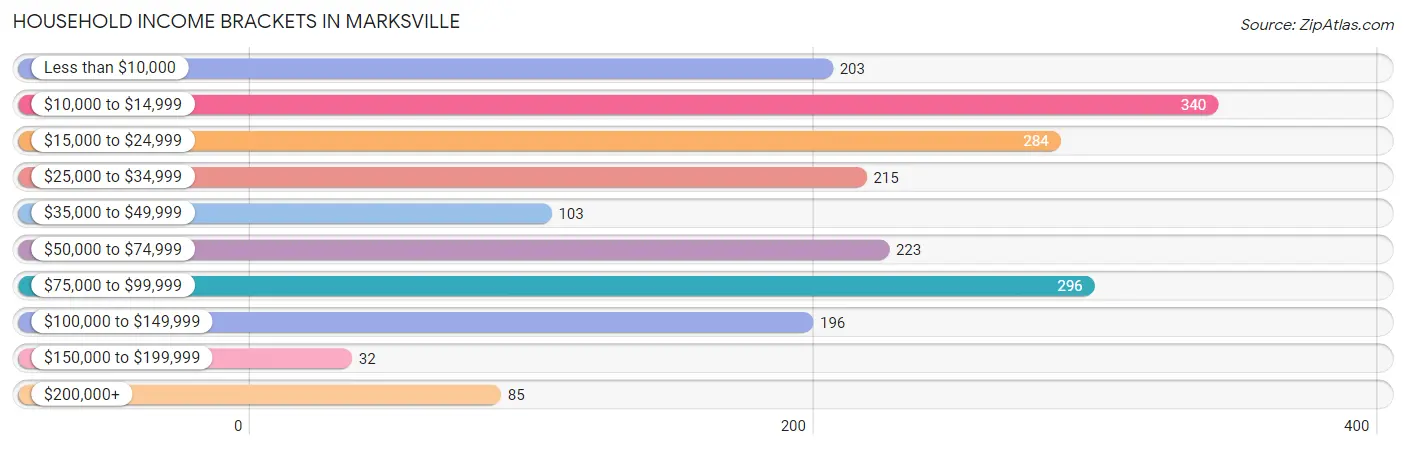
| Income Bracket | # Households | % Households |
| Less than $10,000 | 203 | 10.3% |
| $10,000 to $14,999 | 340 | 17.2% |
| $15,000 to $24,999 | 284 | 14.4% |
| $25,000 to $34,999 | 215 | 10.9% |
| $35,000 to $49,999 | 103 | 5.2% |
| $50,000 to $74,999 | 223 | 11.3% |
| $75,000 to $99,999 | 296 | 15.0% |
| $100,000 to $149,999 | 196 | 9.9% |
| $150,000 to $199,999 | 32 | 1.6% |
| $200,000+ | 85 | 4.3% |
Household Income by Householder Age in Marksville
The median household income in Marksville is $33,635, with the highest median household income of $33,224 found in the 65+ years age bracket for the primary householder. A total of 467 households (23.6%) fall into this category. Meanwhile, the 15 to 24 years age bracket for the primary householder has the lowest median household income of $0, with 118 households (6.0%) in this group.
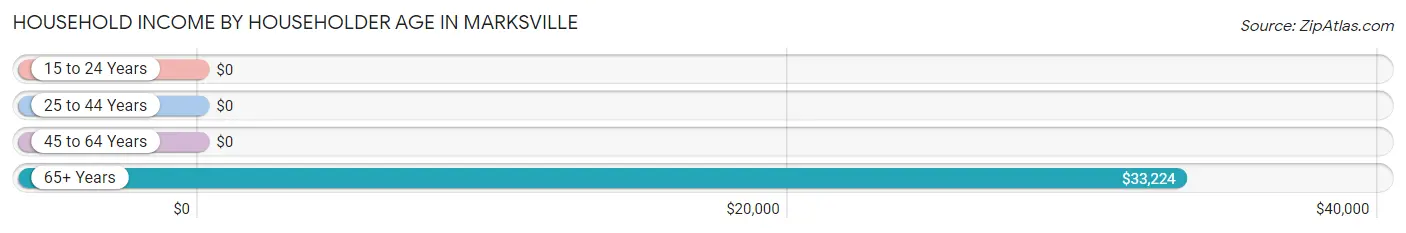
| Income Bracket | # Households | Median Income |
| 15 to 24 Years | 118 (6.0%) | $0 |
| 25 to 44 Years | 704 (35.6%) | $0 |
| 45 to 64 Years | 686 (34.7%) | $0 |
| 65+ Years | 467 (23.6%) | $33,224 |
| Total | 1,975 (100.0%) | $33,635 |
Poverty in Marksville
Income Below Poverty by Sex and Age in Marksville
With 39.1% poverty level for males and 32.2% for females among the residents of Marksville, 5 year old males and 5 year old females are the most vulnerable to poverty, with 69 males (100.0%) and 49 females (100.0%) in their respective age groups living below the poverty level.
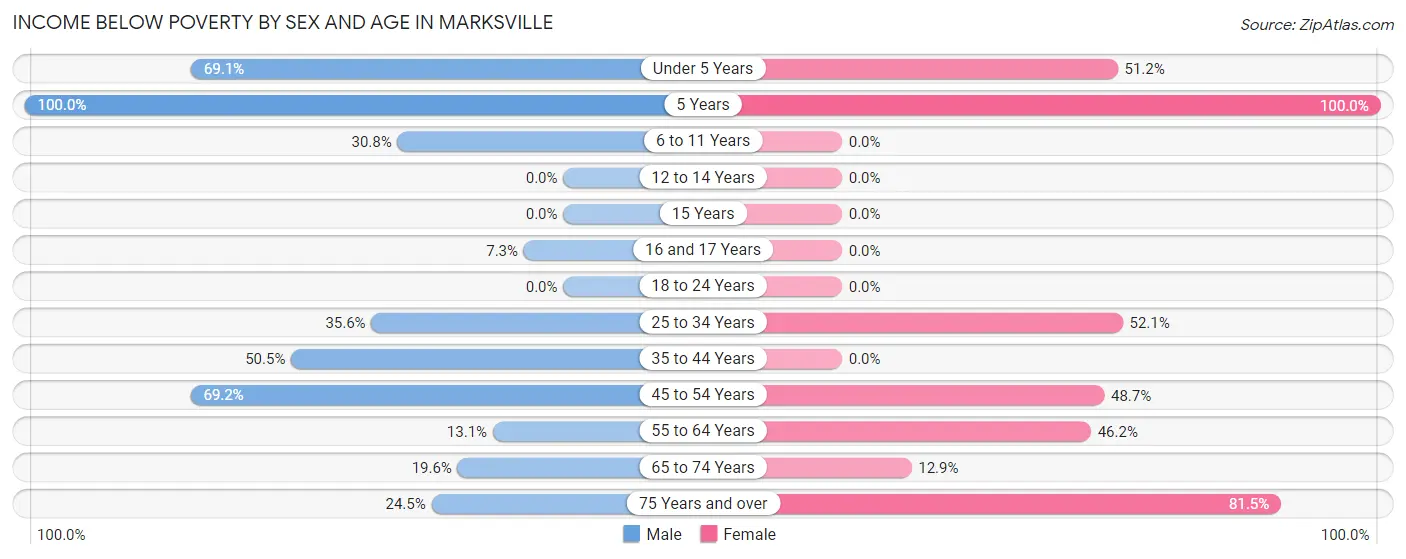
| Age Bracket | Male | Female |
| Under 5 Years | 197 (69.1%) | 65 (51.2%) |
| 5 Years | 69 (100.0%) | 49 (100.0%) |
| 6 to 11 Years | 120 (30.8%) | 0 (0.0%) |
| 12 to 14 Years | 0 (0.0%) | 0 (0.0%) |
| 15 Years | 0 (0.0%) | 0 (0.0%) |
| 16 and 17 Years | 11 (7.3%) | 0 (0.0%) |
| 18 to 24 Years | 0 (0.0%) | 0 (0.0%) |
| 25 to 34 Years | 57 (35.6%) | 345 (52.1%) |
| 35 to 44 Years | 99 (50.5%) | 0 (0.0%) |
| 45 to 54 Years | 218 (69.2%) | 92 (48.7%) |
| 55 to 64 Years | 14 (13.1%) | 128 (46.2%) |
| 65 to 74 Years | 50 (19.6%) | 28 (12.9%) |
| 75 Years and over | 58 (24.5%) | 53 (81.5%) |
| Total | 893 (39.1%) | 760 (32.2%) |
Income Above Poverty by Sex and Age in Marksville
According to the poverty statistics in Marksville, males aged 12 to 14 years and females aged 12 to 14 years are the age groups that are most secure financially, with 100.0% of males and 100.0% of females in these age groups living above the poverty line.
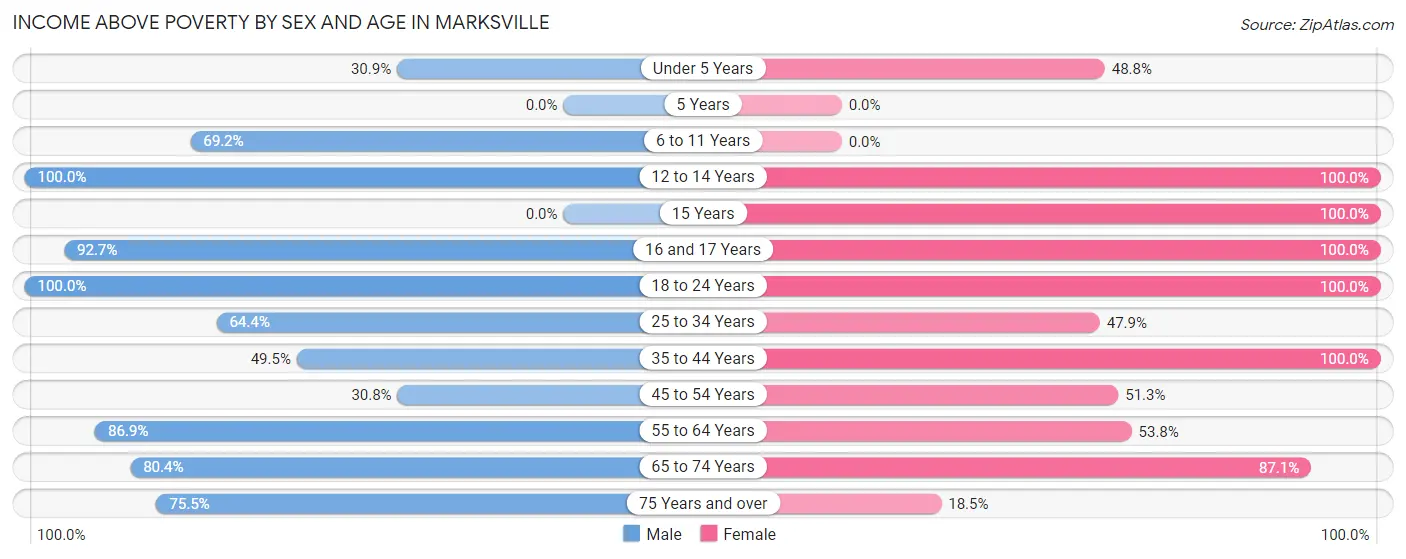
| Age Bracket | Male | Female |
| Under 5 Years | 88 (30.9%) | 62 (48.8%) |
| 5 Years | 0 (0.0%) | 0 (0.0%) |
| 6 to 11 Years | 270 (69.2%) | 0 (0.0%) |
| 12 to 14 Years | 3 (100.0%) | 243 (100.0%) |
| 15 Years | 0 (0.0%) | 20 (100.0%) |
| 16 and 17 Years | 139 (92.7%) | 100 (100.0%) |
| 18 to 24 Years | 118 (100.0%) | 34 (100.0%) |
| 25 to 34 Years | 103 (64.4%) | 317 (47.9%) |
| 35 to 44 Years | 97 (49.5%) | 374 (100.0%) |
| 45 to 54 Years | 97 (30.8%) | 97 (51.3%) |
| 55 to 64 Years | 93 (86.9%) | 149 (53.8%) |
| 65 to 74 Years | 205 (80.4%) | 189 (87.1%) |
| 75 Years and over | 179 (75.5%) | 12 (18.5%) |
| Total | 1,392 (60.9%) | 1,597 (67.8%) |
Income Below Poverty Among Married-Couple Families in Marksville
The poverty statistics for married-couple families in Marksville show that 23.9% or 106 of the total 444 families live below the poverty line. Families with 3 or 4 children have the highest poverty rate of 74.0%, comprising of 77 families. On the other hand, families with 1 or 2 children have the lowest poverty rate of 0.0%, which includes 0 families.
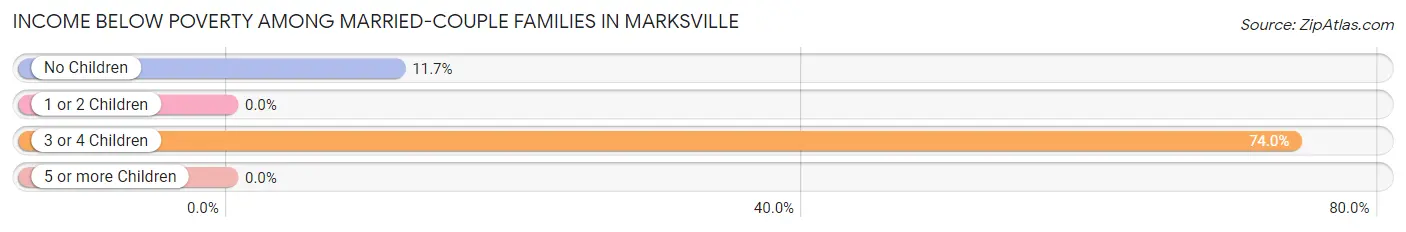
| Children | Above Poverty | Below Poverty |
| No Children | 220 (88.3%) | 29 (11.7%) |
| 1 or 2 Children | 91 (100.0%) | 0 (0.0%) |
| 3 or 4 Children | 27 (26.0%) | 77 (74.0%) |
| 5 or more Children | 0 (0.0%) | 0 (0.0%) |
| Total | 338 (76.1%) | 106 (23.9%) |
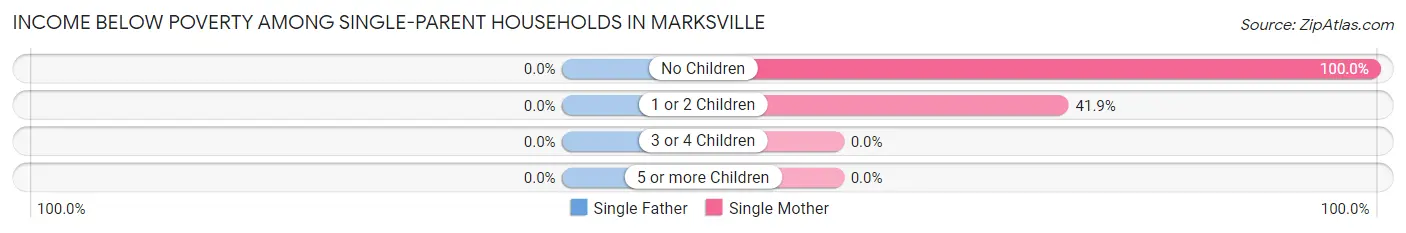
Income Below Poverty Among Single-Parent Households in Marksville
| Children | Single Father | Single Mother |
| No Children | 0 (0.0%) | 80 (100.0%) |
| 1 or 2 Children | 0 (0.0%) | 181 (41.9%) |
| 3 or 4 Children | 0 (0.0%) | 0 (0.0%) |
| 5 or more Children | 0 (0.0%) | 0 (0.0%) |
| Total | 0 (0.0%) | 261 (51.0%) |
Income Below Poverty Among Married-Couple vs Single-Parent Households in Marksville
The poverty data for Marksville shows that 106 of the married-couple family households (23.9%) and 261 of the single-parent households (46.9%) are living below the poverty level. Within the married-couple family households, those with 3 or 4 children have the highest poverty rate, with 77 households (74.0%) falling below the poverty line. Among the single-parent households, those with no children have the highest poverty rate, with 80 household (100.0%) living below poverty.
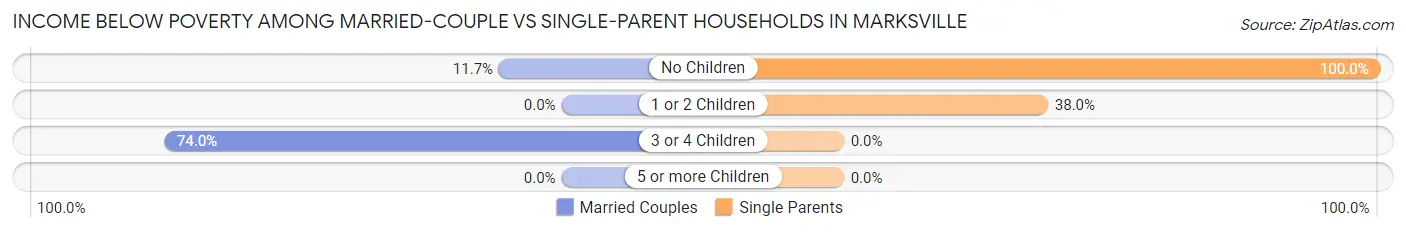
| Children | Married-Couple Families | Single-Parent Households |
| No Children | 29 (11.7%) | 80 (100.0%) |
| 1 or 2 Children | 0 (0.0%) | 181 (38.0%) |
| 3 or 4 Children | 77 (74.0%) | 0 (0.0%) |
| 5 or more Children | 0 (0.0%) | 0 (0.0%) |
| Total | 106 (23.9%) | 261 (46.9%) |
Race in Marksville
The most populous races in Marksville are White / Caucasian (2,654 | 52.7%), Black / African American (1,565 | 31.1%), and Two or more Races (752 | 14.9%).
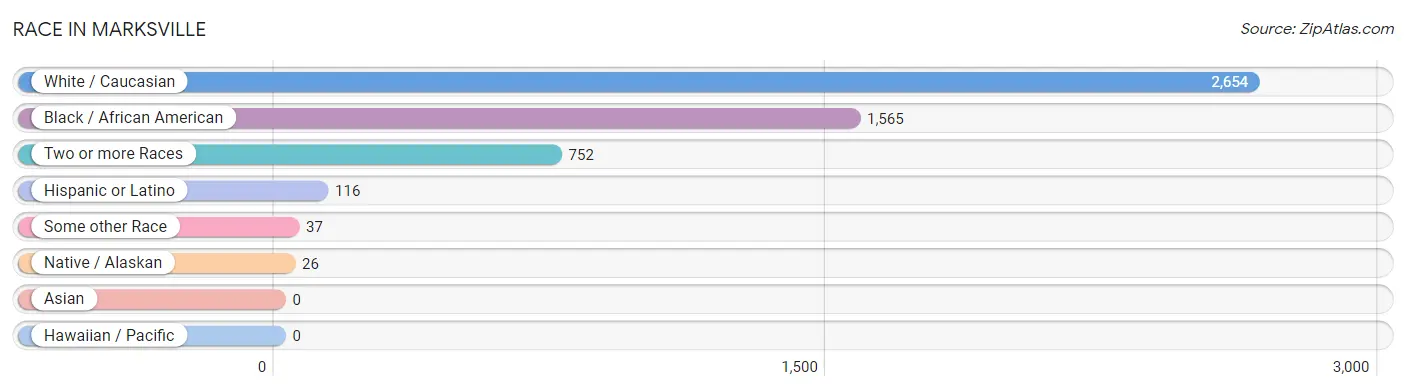
| Race | # Population | % Population |
| Asian | 0 | 0.0% |
| Black / African American | 1,565 | 31.1% |
| Hawaiian / Pacific | 0 | 0.0% |
| Hispanic or Latino | 116 | 2.3% |
| Native / Alaskan | 26 | 0.5% |
| White / Caucasian | 2,654 | 52.7% |
| Two or more Races | 752 | 14.9% |
| Some other Race | 37 | 0.7% |
| Total | 5,034 | 100.0% |
Ancestry in Marksville
The most populous ancestries reported in Marksville are French (1,223 | 24.3%), Irish (563 | 11.2%), American (556 | 11.0%), Subsaharan African (160 | 3.2%), and German (115 | 2.3%), together accounting for 52.0% of all Marksville residents.
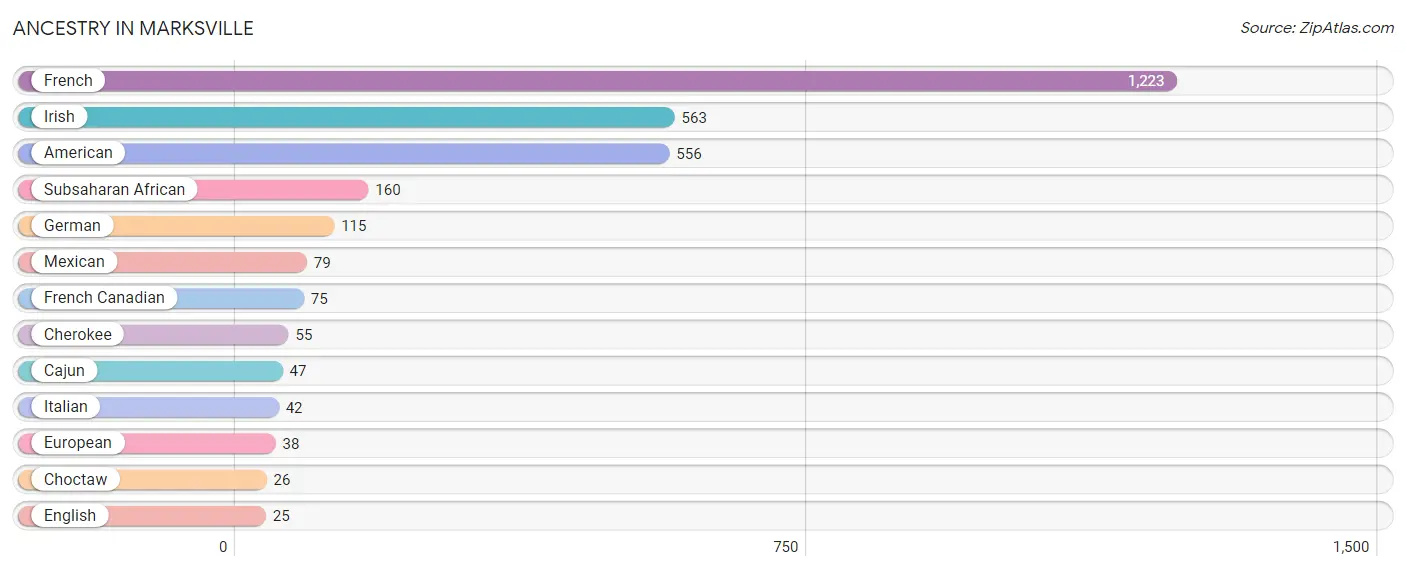
| Ancestry | # Population | % Population |
| American | 556 | 11.0% |
| Cajun | 47 | 0.9% |
| Cherokee | 55 | 1.1% |
| Choctaw | 26 | 0.5% |
| English | 25 | 0.5% |
| European | 38 | 0.7% |
| French | 1,223 | 24.3% |
| French Canadian | 75 | 1.5% |
| German | 115 | 2.3% |
| Irish | 563 | 11.2% |
| Italian | 42 | 0.8% |
| Mexican | 79 | 1.6% |
| Subsaharan African | 160 | 3.2% | View All 13 Rows |
Immigrants in Marksville

| Immigration Origin | # Population | % Population | View All 0 Rows |
Sex and Age in Marksville
Sex and Age in Marksville
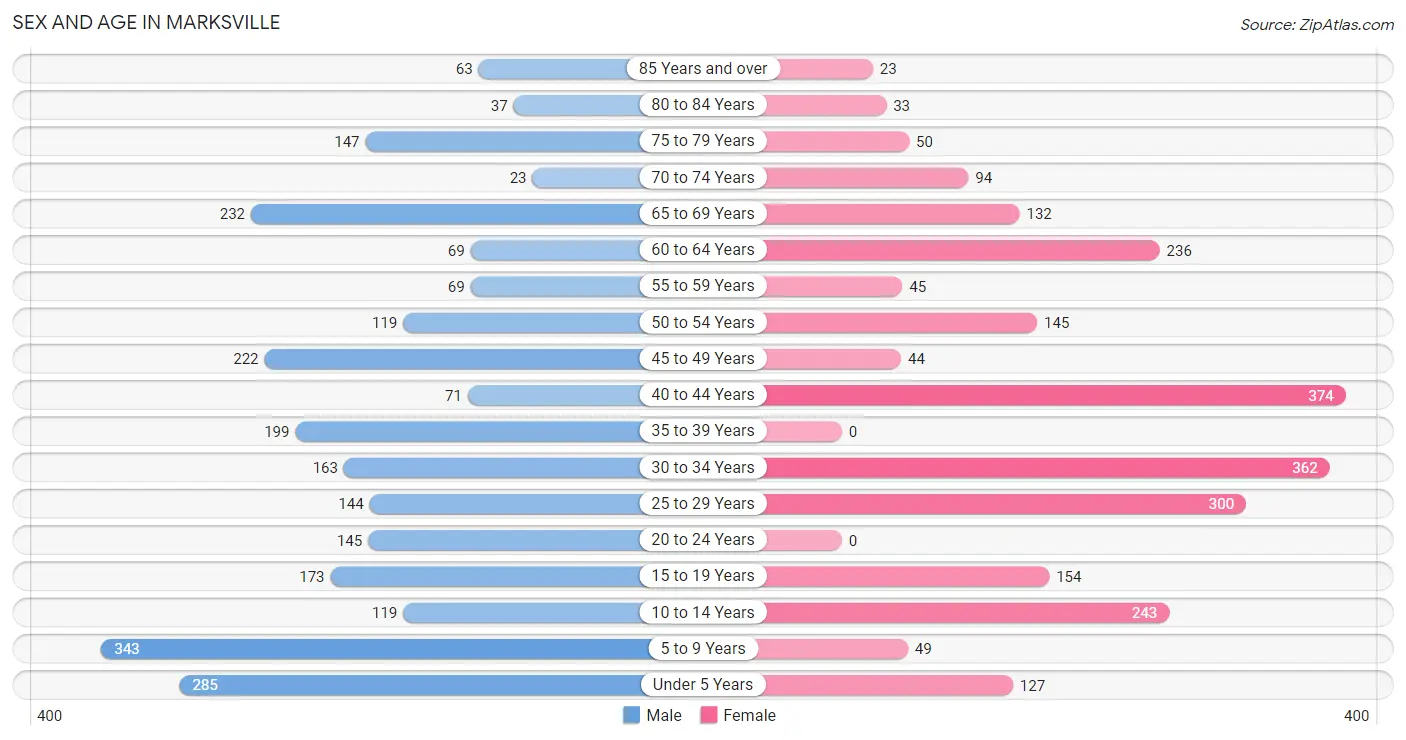
The most populous age groups in Marksville are 5 to 9 Years (343 | 13.1%) for men and 40 to 44 Years (374 | 15.5%) for women.
| Age Bracket | Male | Female |
| Under 5 Years | 285 (10.9%) | 127 (5.3%) |
| 5 to 9 Years | 343 (13.1%) | 49 (2.0%) |
| 10 to 14 Years | 119 (4.5%) | 243 (10.1%) |
| 15 to 19 Years | 173 (6.6%) | 154 (6.4%) |
| 20 to 24 Years | 145 (5.5%) | 0 (0.0%) |
| 25 to 29 Years | 144 (5.5%) | 300 (12.4%) |
| 30 to 34 Years | 163 (6.2%) | 362 (15.0%) |
| 35 to 39 Years | 199 (7.6%) | 0 (0.0%) |
| 40 to 44 Years | 71 (2.7%) | 374 (15.5%) |
| 45 to 49 Years | 222 (8.5%) | 44 (1.8%) |
| 50 to 54 Years | 119 (4.5%) | 145 (6.0%) |
| 55 to 59 Years | 69 (2.6%) | 45 (1.9%) |
| 60 to 64 Years | 69 (2.6%) | 236 (9.8%) |
| 65 to 69 Years | 232 (8.8%) | 132 (5.5%) |
| 70 to 74 Years | 23 (0.9%) | 94 (3.9%) |
| 75 to 79 Years | 147 (5.6%) | 50 (2.1%) |
| 80 to 84 Years | 37 (1.4%) | 33 (1.4%) |
| 85 Years and over | 63 (2.4%) | 23 (0.9%) |
| Total | 2,623 (100.0%) | 2,411 (100.0%) |
Families and Households in Marksville
Median Family Size in Marksville
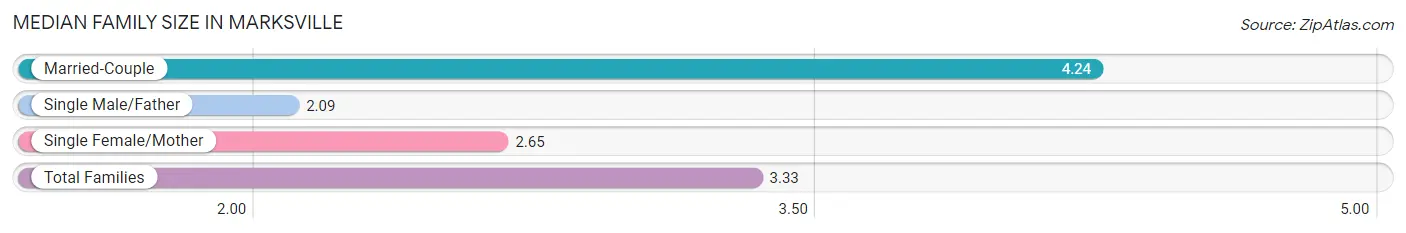
The median family size in Marksville is 3.33 persons per family, with married-couple families (444 | 44.4%) accounting for the largest median family size of 4.24 persons per family. On the other hand, single male/father families (44 | 4.4%) represent the smallest median family size with 2.09 persons per family.
| Family Type | # Families | Family Size |
| Married-Couple | 444 (44.4%) | 4.24 |
| Single Male/Father | 44 (4.4%) | 2.09 |
| Single Female/Mother | 512 (51.2%) | 2.65 |
| Total Families | 1,000 (100.0%) | 3.33 |
Median Household Size in Marksville
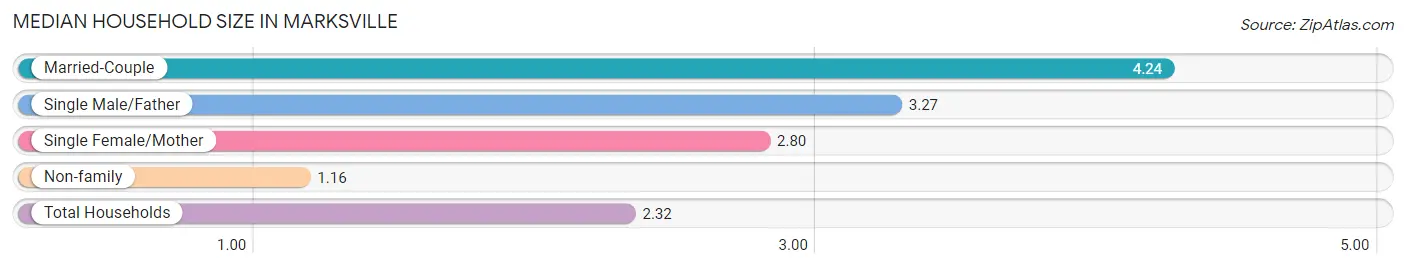
The median household size in Marksville is 2.32 persons per household, with married-couple households (444 | 22.5%) accounting for the largest median household size of 4.24 persons per household. non-family households (975 | 49.4%) represent the smallest median household size with 1.16 persons per household.
| Household Type | # Households | Household Size |
| Married-Couple | 444 (22.5%) | 4.24 |
| Single Male/Father | 44 (2.2%) | 3.27 |
| Single Female/Mother | 512 (25.9%) | 2.80 |
| Non-family | 975 (49.4%) | 1.16 |
| Total Households | 1,975 (100.0%) | 2.32 |
Household Size by Marriage Status in Marksville
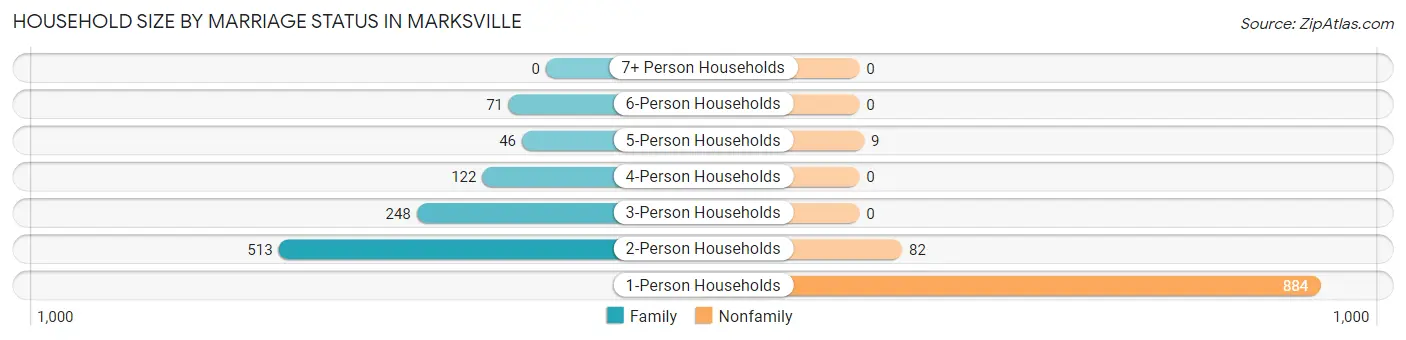
Out of a total of 1,975 households in Marksville, 1,000 (50.6%) are family households, while 975 (49.4%) are nonfamily households. The most numerous type of family households are 2-person households, comprising 513, and the most common type of nonfamily households are 1-person households, comprising 884.
| Household Size | Family Households | Nonfamily Households |
| 1-Person Households | - | 884 (44.8%) |
| 2-Person Households | 513 (26.0%) | 82 (4.2%) |
| 3-Person Households | 248 (12.6%) | 0 (0.0%) |
| 4-Person Households | 122 (6.2%) | 0 (0.0%) |
| 5-Person Households | 46 (2.3%) | 9 (0.5%) |
| 6-Person Households | 71 (3.6%) | 0 (0.0%) |
| 7+ Person Households | 0 (0.0%) | 0 (0.0%) |
| Total | 1,000 (50.6%) | 975 (49.4%) |
Female Fertility in Marksville
Fertility by Age in Marksville
Average fertility rate in Marksville is 40.0 births per 1,000 women. Women in the age bracket of 20 to 34 years have the highest fertility rate with 74.0 births per 1,000 women. Women in the age bracket of 20 to 34 years acount for 100.0% of all women with births.
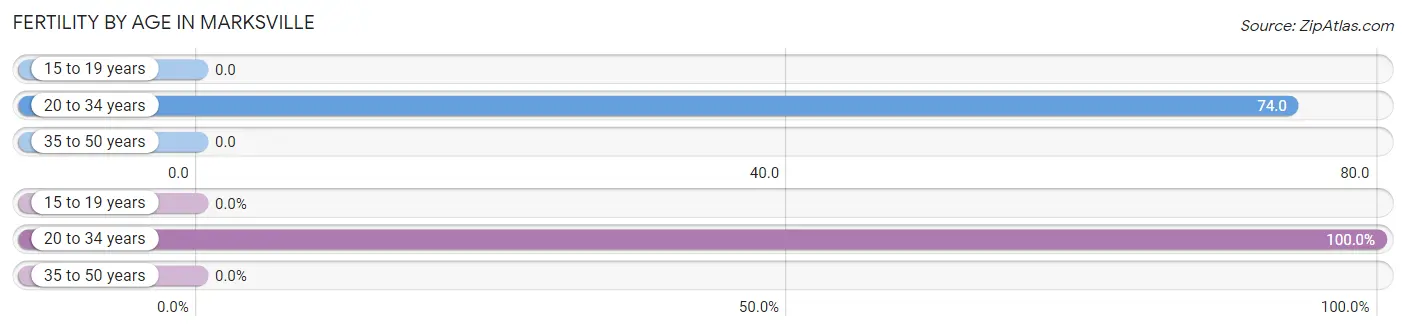
| Age Bracket | Women with Births | Births / 1,000 Women |
| 15 to 19 years | 0 (0.0%) | 0.0 |
| 20 to 34 years | 49 (100.0%) | 74.0 |
| 35 to 50 years | 0 (0.0%) | 0.0 |
| Total | 49 (100.0%) | 40.0 |
Fertility by Age by Marriage Status in Marksville
36.7% of women with births (49) in Marksville are married. The highest percentage of unmarried women with births falls into 20 to 34 years age bracket with 63.3% of them unmarried at the time of birth, while the lowest percentage of unmarried women with births belong to 20 to 34 years age bracket with 63.3% of them unmarried.
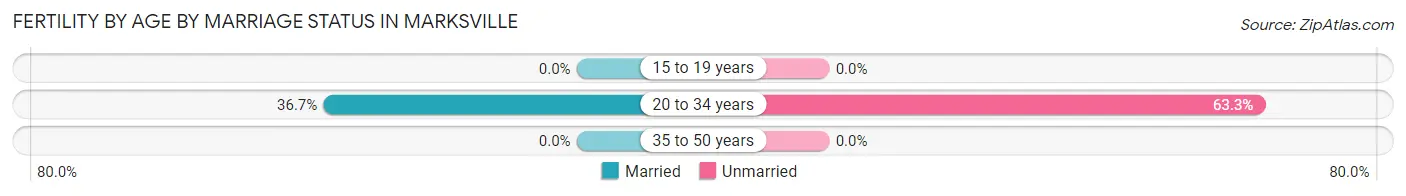
| Age Bracket | Married | Unmarried |
| 15 to 19 years | 0 (0.0%) | 0 (0.0%) |
| 20 to 34 years | 18 (36.7%) | 31 (63.3%) |
| 35 to 50 years | 0 (0.0%) | 0 (0.0%) |
| Total | 18 (36.7%) | 31 (63.3%) |
Fertility by Education in Marksville
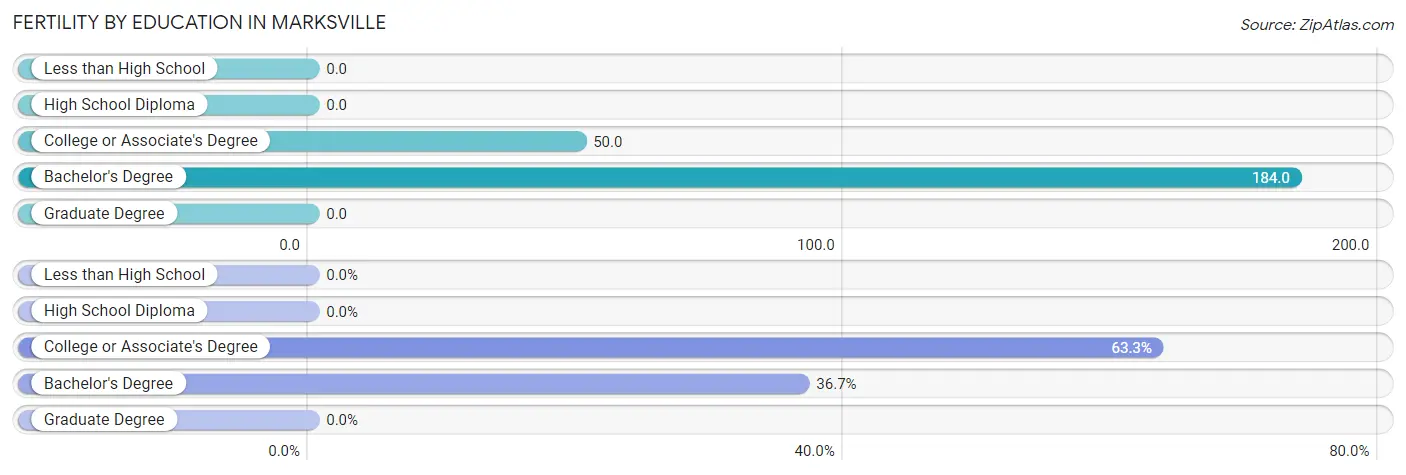
| Educational Attainment | Women with Births | Births / 1,000 Women |
| Less than High School | 0 (0.0%) | 0.0 |
| High School Diploma | 0 (0.0%) | 0.0 |
| College or Associate's Degree | 31 (63.3%) | 50.0 |
| Bachelor's Degree | 18 (36.7%) | 184.0 |
| Graduate Degree | 0 (0.0%) | 0.0 |
| Total | 49 (100.0%) | 40.0 |
Fertility by Education by Marriage Status in Marksville
63.3% of women with births in Marksville are unmarried. Women with the educational attainment of bachelor's degree are most likely to be married with 100.0% of them married at childbirth, while women with the educational attainment of college or associate's degree are least likely to be married with 100.0% of them unmarried at childbirth.
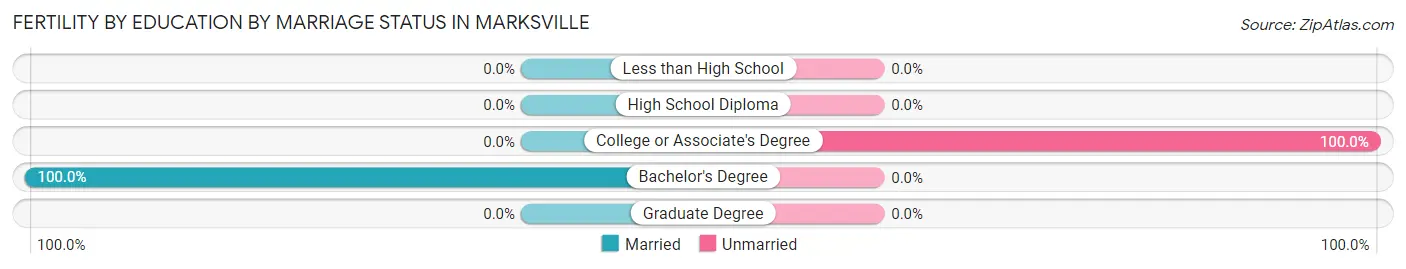
| Educational Attainment | Married | Unmarried |
| Less than High School | 0 (0.0%) | 0 (0.0%) |
| High School Diploma | 0 (0.0%) | 0 (0.0%) |
| College or Associate's Degree | 0 (0.0%) | 31 (100.0%) |
| Bachelor's Degree | 18 (100.0%) | 0 (0.0%) |
| Graduate Degree | 0 (0.0%) | 0 (0.0%) |
| Total | 18 (36.7%) | 31 (63.3%) |
Employment Characteristics in Marksville
Employment by Class of Employer in Marksville
Among the 1,899 employed individuals in Marksville, private company employees (993 | 52.3%), state government employees (343 | 18.1%), and local government employees (300 | 15.8%) make up the most common classes of employment.
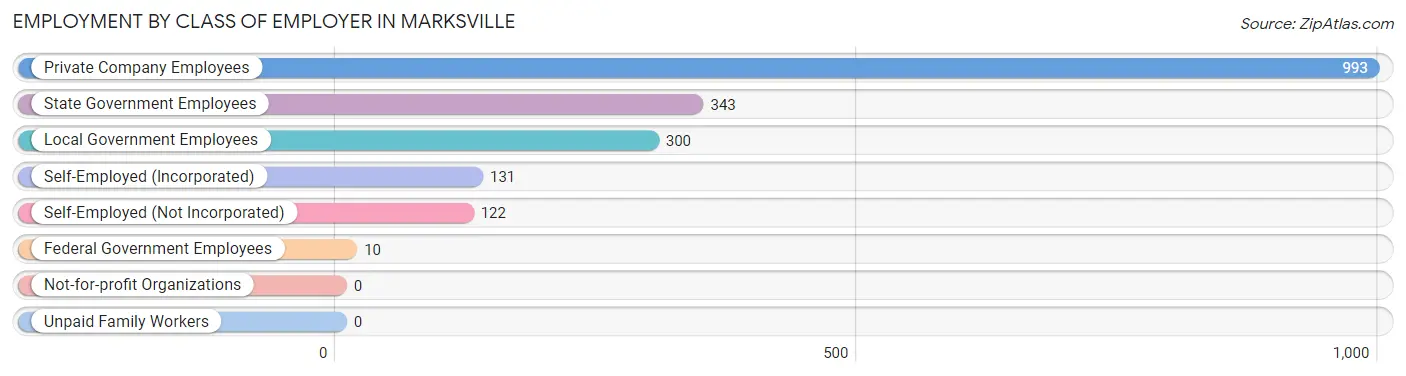
| Employer Class | # Employees | % Employees |
| Private Company Employees | 993 | 52.3% |
| Self-Employed (Incorporated) | 131 | 6.9% |
| Self-Employed (Not Incorporated) | 122 | 6.4% |
| Not-for-profit Organizations | 0 | 0.0% |
| Local Government Employees | 300 | 15.8% |
| State Government Employees | 343 | 18.1% |
| Federal Government Employees | 10 | 0.5% |
| Unpaid Family Workers | 0 | 0.0% |
| Total | 1,899 | 100.0% |
Employment Status by Age in Marksville
According to the labor force statistics for Marksville, out of the total population over 16 years of age (3,848), 55.0% or 2,116 individuals are in the labor force, with 7.0% or 148 of them unemployed. The age group with the highest labor force participation rate is 25 to 29 years, with 85.8% or 381 individuals in the labor force. Within the labor force, the 55 to 59 years age range has the highest percentage of unemployed individuals, with 27.5% or 11 of them being unemployed.
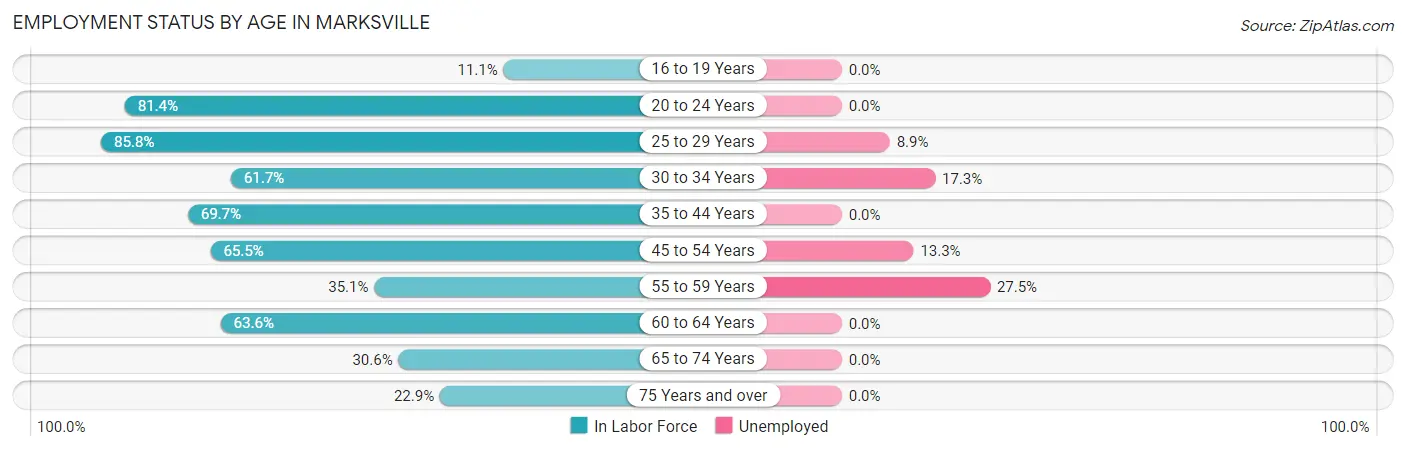
| Age Bracket | In Labor Force | Unemployed |
| 16 to 19 Years | 34 (11.1%) | 0 (0.0%) |
| 20 to 24 Years | 118 (81.4%) | 0 (0.0%) |
| 25 to 29 Years | 381 (85.8%) | 34 (8.9%) |
| 30 to 34 Years | 324 (61.7%) | 56 (17.3%) |
| 35 to 44 Years | 449 (69.7%) | 0 (0.0%) |
| 45 to 54 Years | 347 (65.5%) | 46 (13.3%) |
| 55 to 59 Years | 40 (35.1%) | 11 (27.5%) |
| 60 to 64 Years | 194 (63.6%) | 0 (0.0%) |
| 65 to 74 Years | 147 (30.6%) | 0 (0.0%) |
| 75 Years and over | 81 (22.9%) | 0 (0.0%) |
| Total | 2,116 (55.0%) | 148 (7.0%) |
Employment Status by Educational Attainment in Marksville
According to labor force statistics for Marksville, 67.7% of individuals (1,734) out of the total population between 25 and 64 years of age (2,562) are in the labor force, with 8.5% or 147 of them being unemployed. The group with the highest labor force participation rate are those with the educational attainment of college / associate degree, with 90.9% or 900 individuals in the labor force. Within the labor force, individuals with less than high school education have the highest percentage of unemployment, with 32.1% or 34 of them being unemployed.
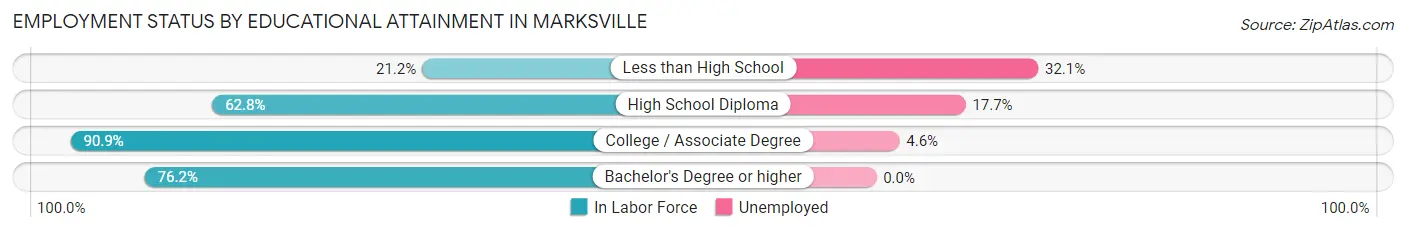
| Educational Attainment | In Labor Force | Unemployed |
| Less than High School | 106 (21.2%) | 161 (32.1%) |
| High School Diploma | 406 (62.8%) | 115 (17.7%) |
| College / Associate Degree | 900 (90.9%) | 46 (4.6%) |
| Bachelor's Degree or higher | 323 (76.2%) | 0 (0.0%) |
| Total | 1,734 (67.7%) | 218 (8.5%) |
Employment Occupations by Sex in Marksville
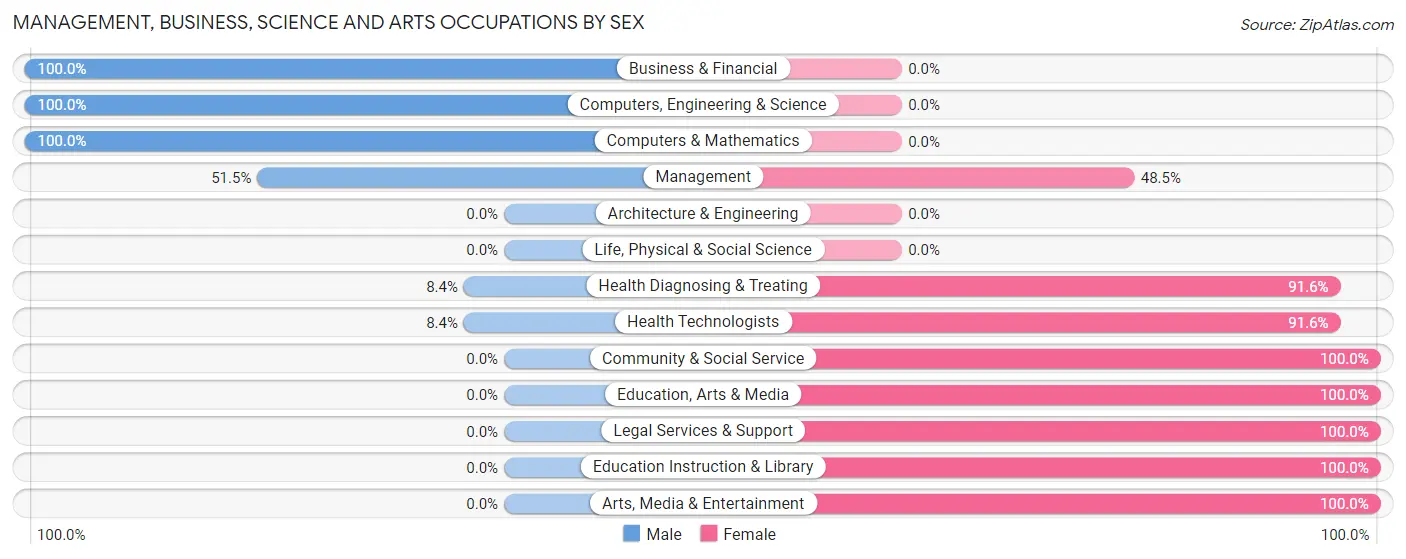
Management, Business, Science and Arts Occupations
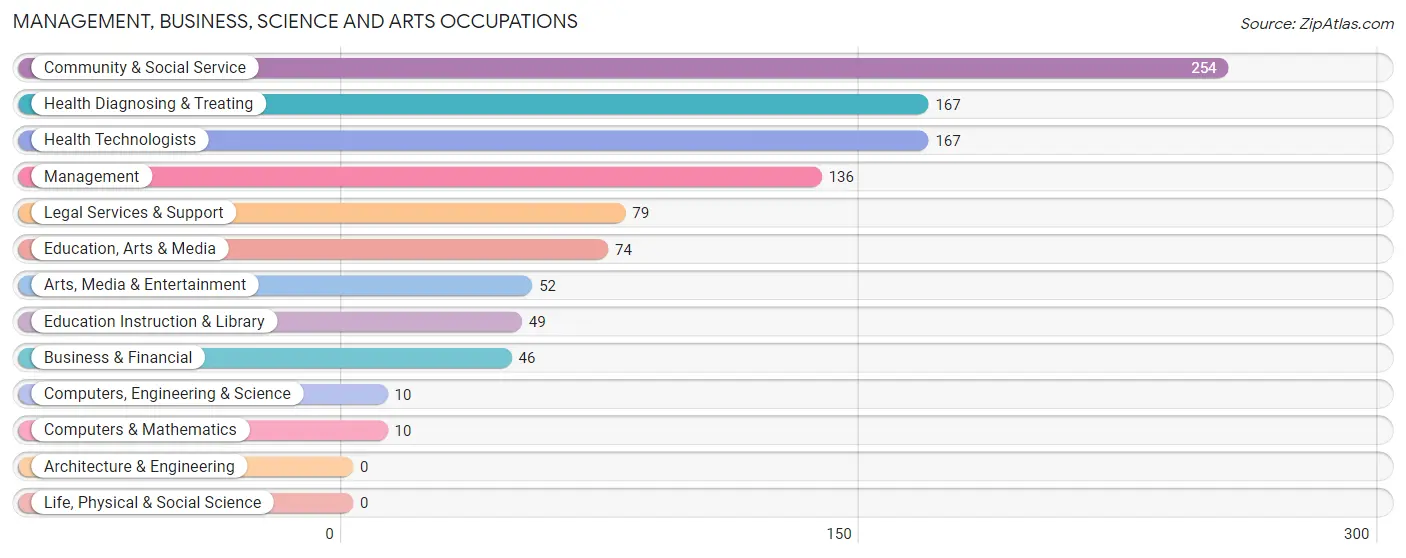
The most common Management, Business, Science and Arts occupations in Marksville are Community & Social Service (254 | 12.9%), Health Diagnosing & Treating (167 | 8.5%), Health Technologists (167 | 8.5%), Management (136 | 6.9%), and Legal Services & Support (79 | 4.0%).
Management, Business, Science and Arts Occupations by Sex
Within the Management, Business, Science and Arts occupations in Marksville, the most male-oriented occupations are Business & Financial (100.0%), Computers, Engineering & Science (100.0%), and Computers & Mathematics (100.0%), while the most female-oriented occupations are Community & Social Service (100.0%), Education, Arts & Media (100.0%), and Legal Services & Support (100.0%).
| Occupation | Male | Female |
| Management | 70 (51.5%) | 66 (48.5%) |
| Business & Financial | 46 (100.0%) | 0 (0.0%) |
| Computers, Engineering & Science | 10 (100.0%) | 0 (0.0%) |
| Computers & Mathematics | 10 (100.0%) | 0 (0.0%) |
| Architecture & Engineering | 0 (0.0%) | 0 (0.0%) |
| Life, Physical & Social Science | 0 (0.0%) | 0 (0.0%) |
| Community & Social Service | 0 (0.0%) | 254 (100.0%) |
| Education, Arts & Media | 0 (0.0%) | 74 (100.0%) |
| Legal Services & Support | 0 (0.0%) | 79 (100.0%) |
| Education Instruction & Library | 0 (0.0%) | 49 (100.0%) |
| Arts, Media & Entertainment | 0 (0.0%) | 52 (100.0%) |
| Health Diagnosing & Treating | 14 (8.4%) | 153 (91.6%) |
| Health Technologists | 14 (8.4%) | 153 (91.6%) |
| Total (Category) | 140 (22.8%) | 473 (77.2%) |
| Total (Overall) | 930 (47.3%) | 1,038 (52.7%) |
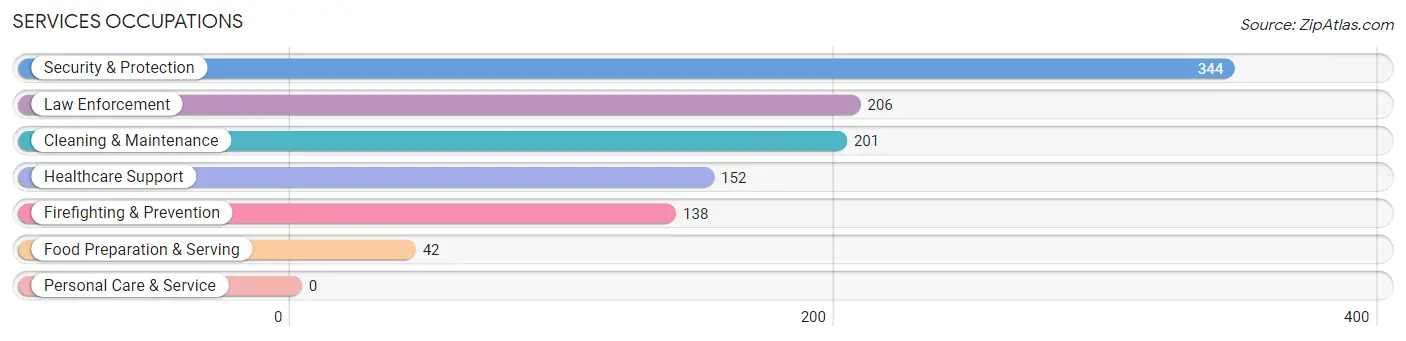
Services Occupations
The most common Services occupations in Marksville are Security & Protection (344 | 17.5%), Law Enforcement (206 | 10.5%), Cleaning & Maintenance (201 | 10.2%), Healthcare Support (152 | 7.7%), and Firefighting & Prevention (138 | 7.0%).
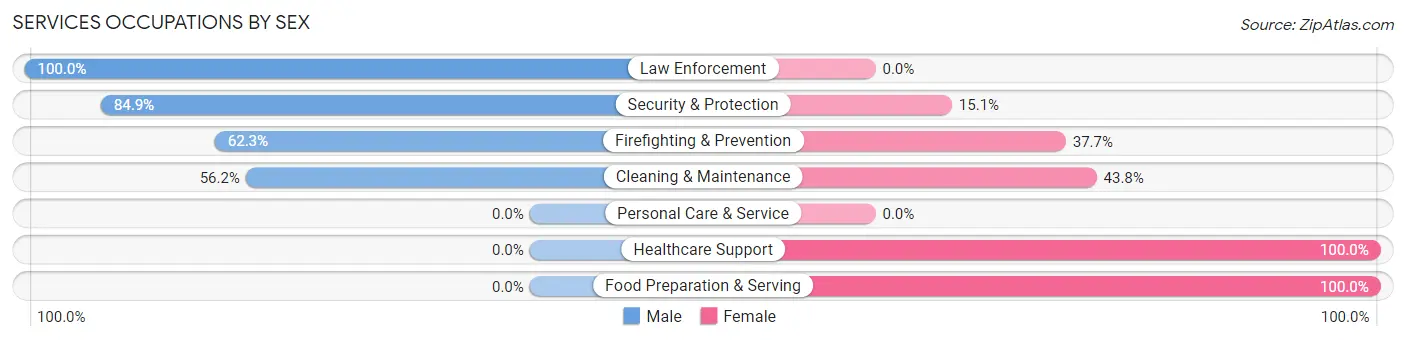
Services Occupations by Sex
Within the Services occupations in Marksville, the most male-oriented occupations are Law Enforcement (100.0%), Security & Protection (84.9%), and Firefighting & Prevention (62.3%), while the most female-oriented occupations are Healthcare Support (100.0%), Food Preparation & Serving (100.0%), and Cleaning & Maintenance (43.8%).
| Occupation | Male | Female |
| Healthcare Support | 0 (0.0%) | 152 (100.0%) |
| Security & Protection | 292 (84.9%) | 52 (15.1%) |
| Firefighting & Prevention | 86 (62.3%) | 52 (37.7%) |
| Law Enforcement | 206 (100.0%) | 0 (0.0%) |
| Food Preparation & Serving | 0 (0.0%) | 42 (100.0%) |
| Cleaning & Maintenance | 113 (56.2%) | 88 (43.8%) |
| Personal Care & Service | 0 (0.0%) | 0 (0.0%) |
| Total (Category) | 405 (54.8%) | 334 (45.2%) |
| Total (Overall) | 930 (47.3%) | 1,038 (52.7%) |
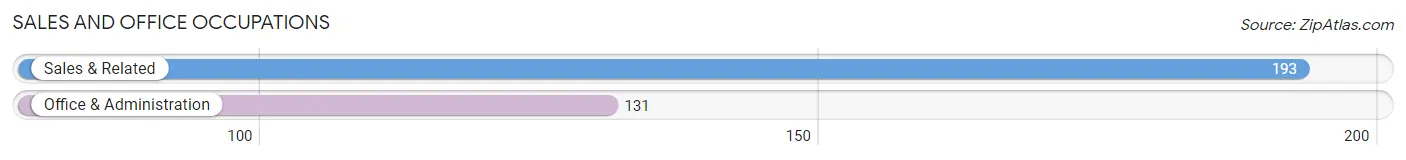
Sales and Office Occupations
The most common Sales and Office occupations in Marksville are Sales & Related (193 | 9.8%), and Office & Administration (131 | 6.7%).
Sales and Office Occupations by Sex
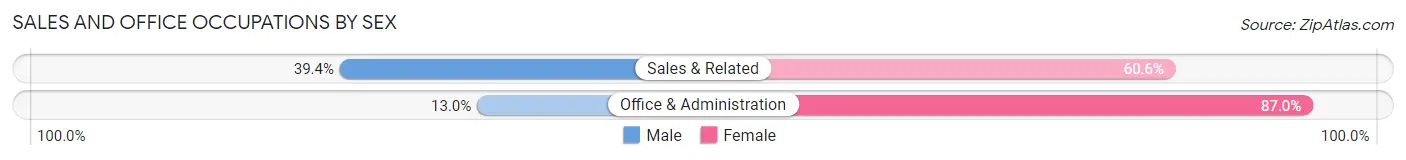
| Occupation | Male | Female |
| Sales & Related | 76 (39.4%) | 117 (60.6%) |
| Office & Administration | 17 (13.0%) | 114 (87.0%) |
| Total (Category) | 93 (28.7%) | 231 (71.3%) |
| Total (Overall) | 930 (47.3%) | 1,038 (52.7%) |
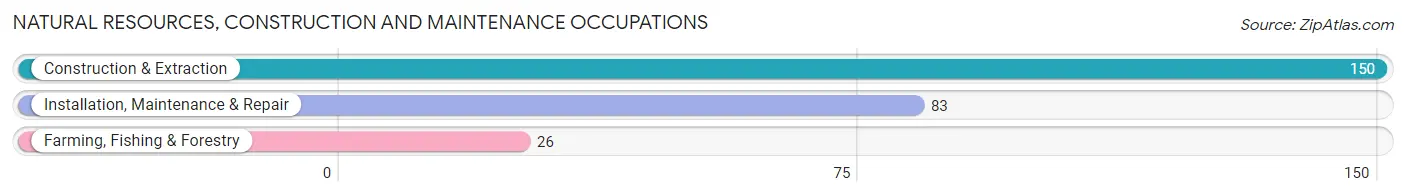
Natural Resources, Construction and Maintenance Occupations
The most common Natural Resources, Construction and Maintenance occupations in Marksville are Construction & Extraction (150 | 7.6%), Installation, Maintenance & Repair (83 | 4.2%), and Farming, Fishing & Forestry (26 | 1.3%).
Natural Resources, Construction and Maintenance Occupations by Sex
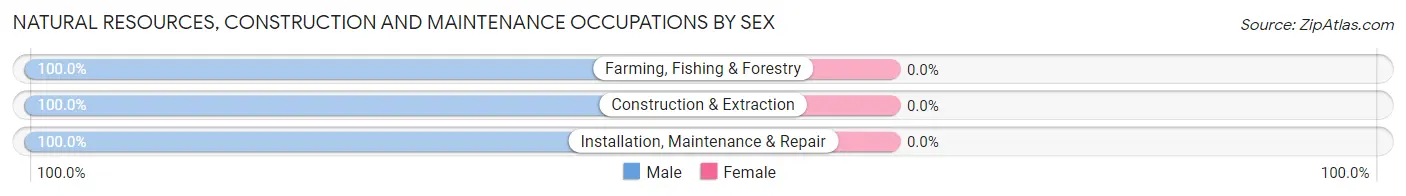
| Occupation | Male | Female |
| Farming, Fishing & Forestry | 26 (100.0%) | 0 (0.0%) |
| Construction & Extraction | 150 (100.0%) | 0 (0.0%) |
| Installation, Maintenance & Repair | 83 (100.0%) | 0 (0.0%) |
| Total (Category) | 259 (100.0%) | 0 (0.0%) |
| Total (Overall) | 930 (47.3%) | 1,038 (52.7%) |
Production, Transportation and Moving Occupations
The most common Production, Transportation and Moving occupations in Marksville are , and Transportation (33 | 1.7%).
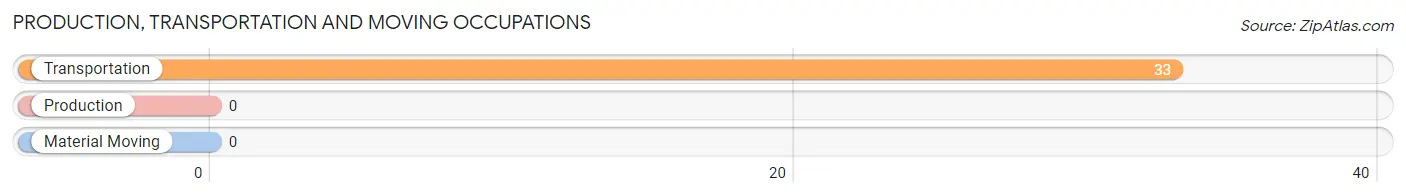
Production, Transportation and Moving Occupations by Sex
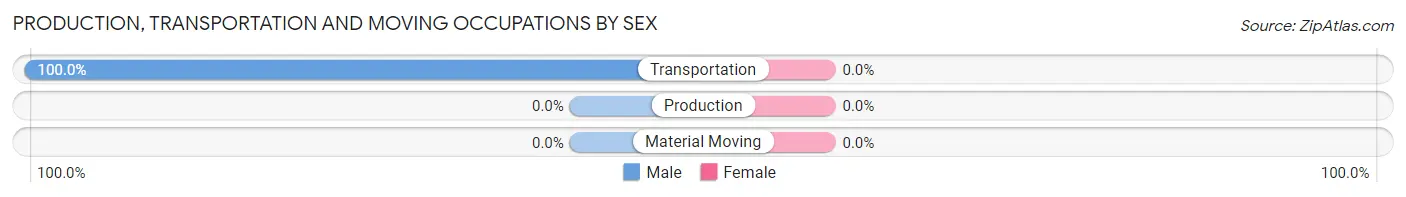
| Occupation | Male | Female |
| Production | 0 (0.0%) | 0 (0.0%) |
| Transportation | 33 (100.0%) | 0 (0.0%) |
| Material Moving | 0 (0.0%) | 0 (0.0%) |
| Total (Category) | 33 (100.0%) | 0 (0.0%) |
| Total (Overall) | 930 (47.3%) | 1,038 (52.7%) |
Employment Industries by Sex in Marksville
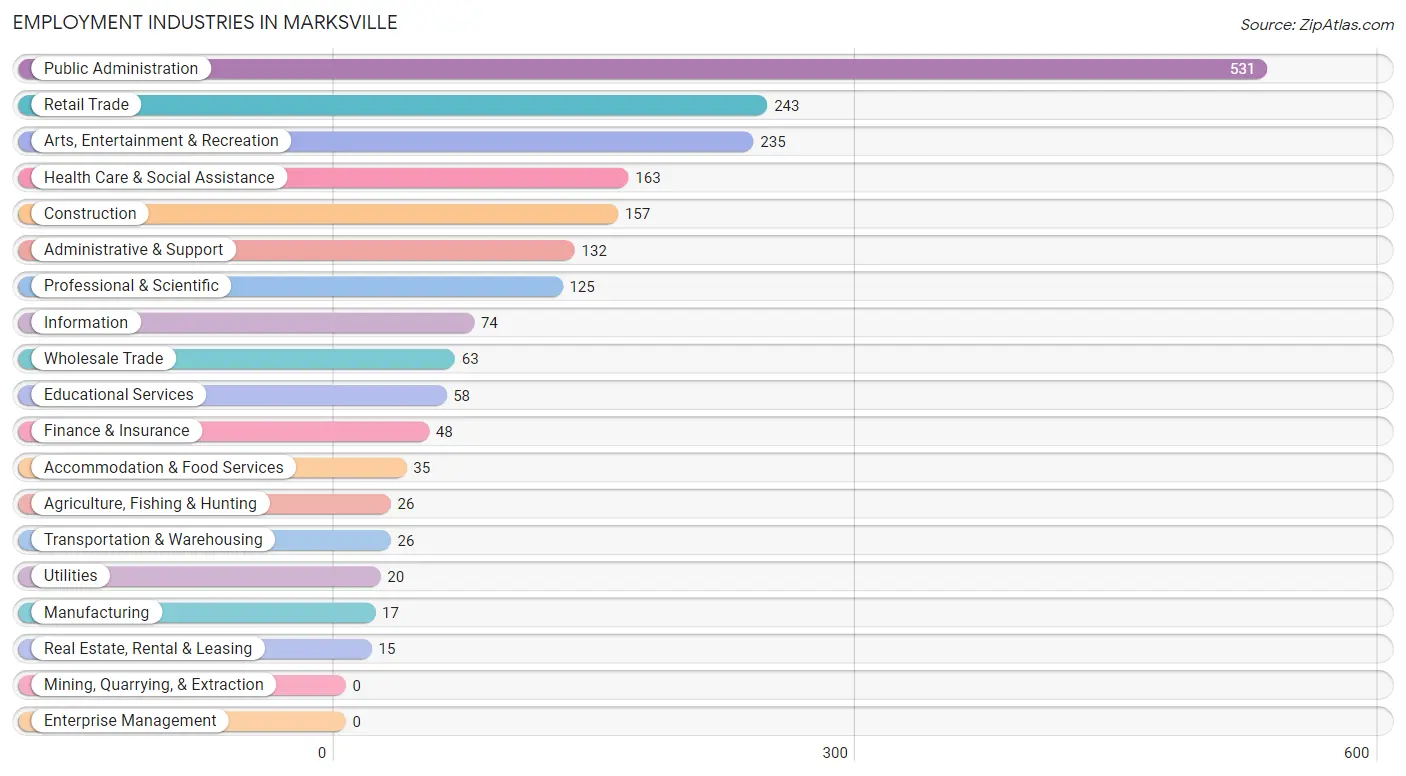
Employment Industries in Marksville
The major employment industries in Marksville include Public Administration (531 | 27.0%), Retail Trade (243 | 12.3%), Arts, Entertainment & Recreation (235 | 11.9%), Health Care & Social Assistance (163 | 8.3%), and Construction (157 | 8.0%).
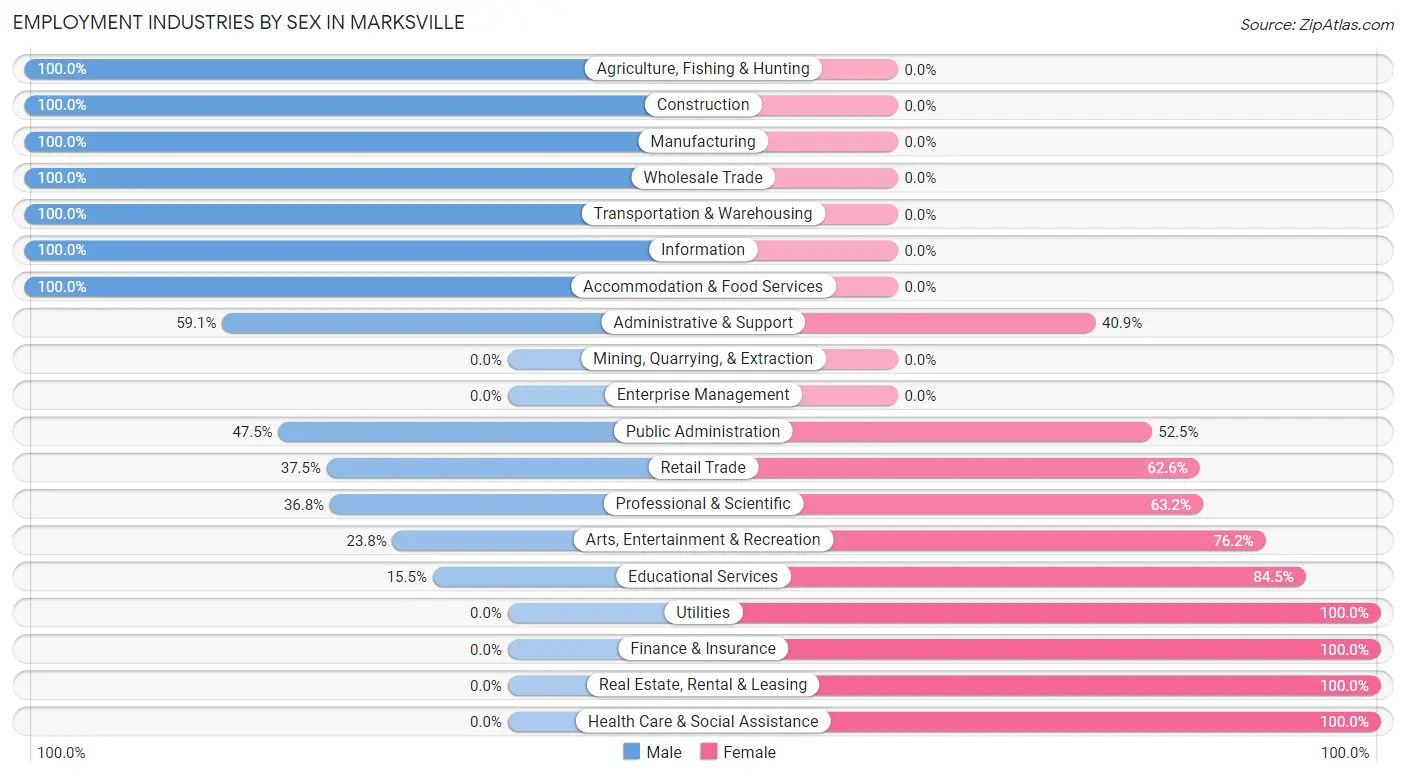
Employment Industries by Sex in Marksville
The Marksville industries that see more men than women are Agriculture, Fishing & Hunting (100.0%), Construction (100.0%), and Manufacturing (100.0%), whereas the industries that tend to have a higher number of women are Utilities (100.0%), Finance & Insurance (100.0%), and Real Estate, Rental & Leasing (100.0%).
| Industry | Male | Female |
| Agriculture, Fishing & Hunting | 26 (100.0%) | 0 (0.0%) |
| Mining, Quarrying, & Extraction | 0 (0.0%) | 0 (0.0%) |
| Construction | 157 (100.0%) | 0 (0.0%) |
| Manufacturing | 17 (100.0%) | 0 (0.0%) |
| Wholesale Trade | 63 (100.0%) | 0 (0.0%) |
| Retail Trade | 91 (37.4%) | 152 (62.5%) |
| Transportation & Warehousing | 26 (100.0%) | 0 (0.0%) |
| Utilities | 0 (0.0%) | 20 (100.0%) |
| Information | 74 (100.0%) | 0 (0.0%) |
| Finance & Insurance | 0 (0.0%) | 48 (100.0%) |
| Real Estate, Rental & Leasing | 0 (0.0%) | 15 (100.0%) |
| Professional & Scientific | 46 (36.8%) | 79 (63.2%) |
| Enterprise Management | 0 (0.0%) | 0 (0.0%) |
| Administrative & Support | 78 (59.1%) | 54 (40.9%) |
| Educational Services | 9 (15.5%) | 49 (84.5%) |
| Health Care & Social Assistance | 0 (0.0%) | 163 (100.0%) |
| Arts, Entertainment & Recreation | 56 (23.8%) | 179 (76.2%) |
| Accommodation & Food Services | 35 (100.0%) | 0 (0.0%) |
| Public Administration | 252 (47.5%) | 279 (52.5%) |
| Total | 930 (47.3%) | 1,038 (52.7%) |
Education in Marksville
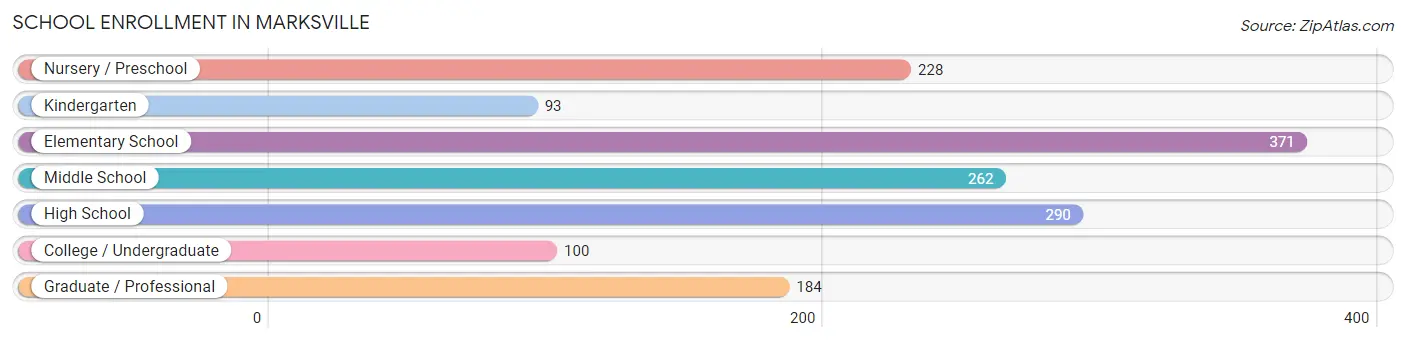
School Enrollment in Marksville
The most common levels of schooling among the 1,528 students in Marksville are elementary school (371 | 24.3%), high school (290 | 19.0%), and middle school (262 | 17.2%).
| School Level | # Students | % Students |
| Nursery / Preschool | 228 | 14.9% |
| Kindergarten | 93 | 6.1% |
| Elementary School | 371 | 24.3% |
| Middle School | 262 | 17.2% |
| High School | 290 | 19.0% |
| College / Undergraduate | 100 | 6.5% |
| Graduate / Professional | 184 | 12.0% |
| Total | 1,528 | 100.0% |
School Enrollment by Age by Funding Source in Marksville
Out of a total of 1,528 students who are enrolled in schools in Marksville, 237 (15.5%) attend a private institution, while the remaining 1,291 (84.5%) are enrolled in public schools. The age group of 5 to 9 year old has the highest likelihood of being enrolled in private schools, with 223 (56.9% in the age bracket) enrolled. Conversely, the age group of 10 to 14 year olds has the lowest likelihood of being enrolled in a private school, with 362 (100.0% in the age bracket) attending a public institution.
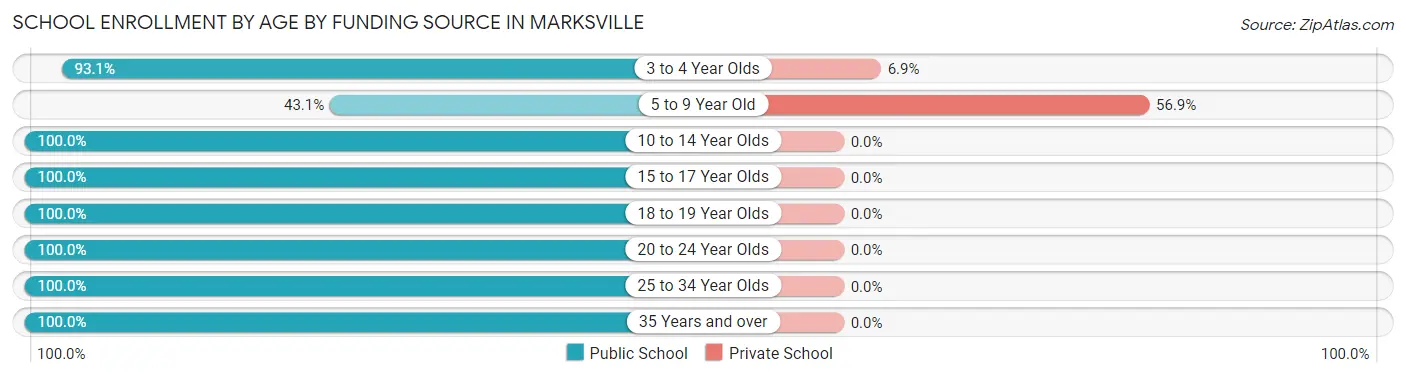
| Age Bracket | Public School | Private School |
| 3 to 4 Year Olds | 189 (93.1%) | 14 (6.9%) |
| 5 to 9 Year Old | 169 (43.1%) | 223 (56.9%) |
| 10 to 14 Year Olds | 362 (100.0%) | 0 (0.0%) |
| 15 to 17 Year Olds | 270 (100.0%) | 0 (0.0%) |
| 18 to 19 Year Olds | 34 (100.0%) | 0 (0.0%) |
| 20 to 24 Year Olds | 9 (100.0%) | 0 (0.0%) |
| 25 to 34 Year Olds | 94 (100.0%) | 0 (0.0%) |
| 35 Years and over | 164 (100.0%) | 0 (0.0%) |
| Total | 1,291 (84.5%) | 237 (15.5%) |
Educational Attainment by Field of Study in Marksville
Liberal arts & history (167 | 30.9%), business (142 | 26.3%), education (79 | 14.6%), arts & humanities (75 | 13.9%), and psychology (28 | 5.2%) are the most common fields of study among 540 individuals in Marksville who have obtained a bachelor's degree or higher.
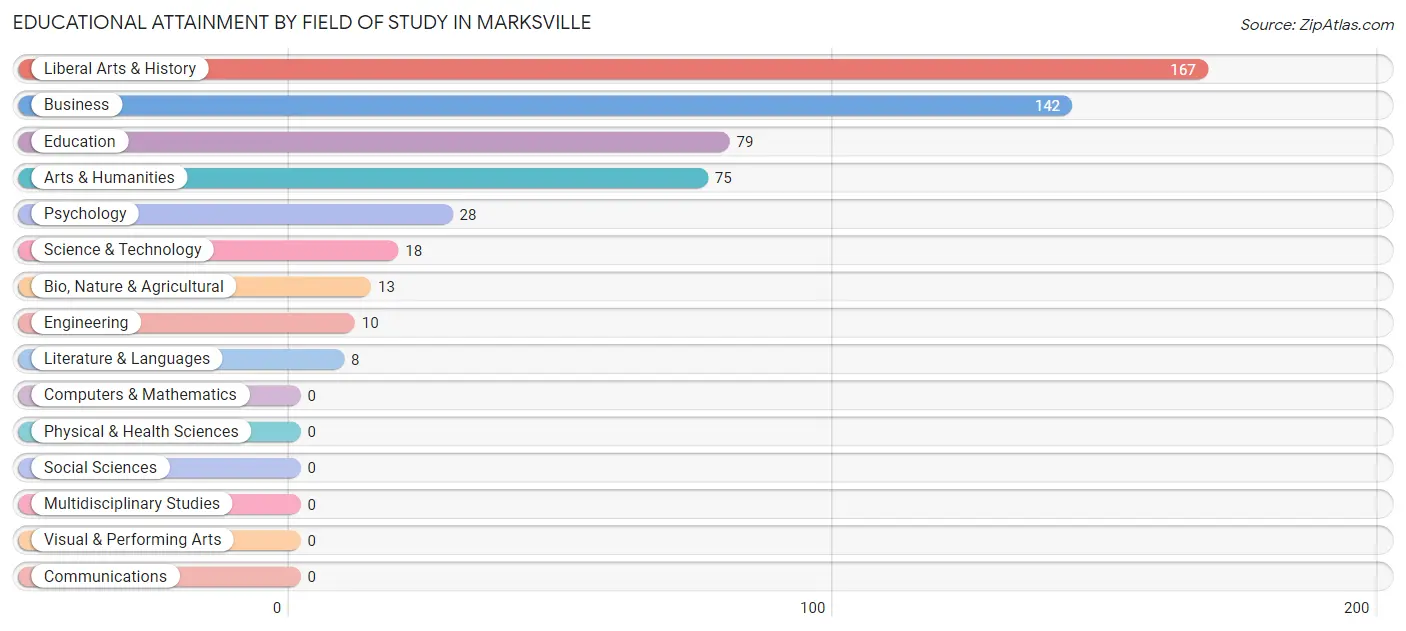
| Field of Study | # Graduates | % Graduates |
| Computers & Mathematics | 0 | 0.0% |
| Bio, Nature & Agricultural | 13 | 2.4% |
| Physical & Health Sciences | 0 | 0.0% |
| Psychology | 28 | 5.2% |
| Social Sciences | 0 | 0.0% |
| Engineering | 10 | 1.8% |
| Multidisciplinary Studies | 0 | 0.0% |
| Science & Technology | 18 | 3.3% |
| Business | 142 | 26.3% |
| Education | 79 | 14.6% |
| Literature & Languages | 8 | 1.5% |
| Liberal Arts & History | 167 | 30.9% |
| Visual & Performing Arts | 0 | 0.0% |
| Communications | 0 | 0.0% |
| Arts & Humanities | 75 | 13.9% |
| Total | 540 | 100.0% |
Transportation & Commute in Marksville
Vehicle Availability by Sex in Marksville
The most prevalent vehicle ownership categories in Marksville are males with 2 vehicles (343, accounting for 36.9%) and females with 2 vehicles (239, making up 35.4%).
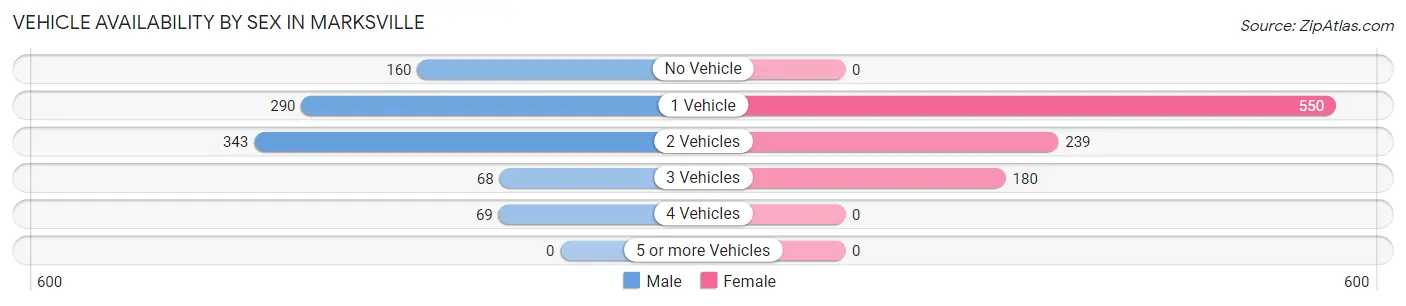
| Vehicles Available | Male | Female |
| No Vehicle | 160 (17.2%) | 0 (0.0%) |
| 1 Vehicle | 290 (31.2%) | 550 (56.8%) |
| 2 Vehicles | 343 (36.9%) | 239 (24.7%) |
| 3 Vehicles | 68 (7.3%) | 180 (18.6%) |
| 4 Vehicles | 69 (7.4%) | 0 (0.0%) |
| 5 or more Vehicles | 0 (0.0%) | 0 (0.0%) |
| Total | 930 (100.0%) | 969 (100.0%) |
Commute Time in Marksville
The most frequently occuring commute durations in Marksville are 10 to 14 minutes (435 commuters, 24.1%), 5 to 9 minutes (321 commuters, 17.8%), and 60 to 89 minutes (283 commuters, 15.7%).
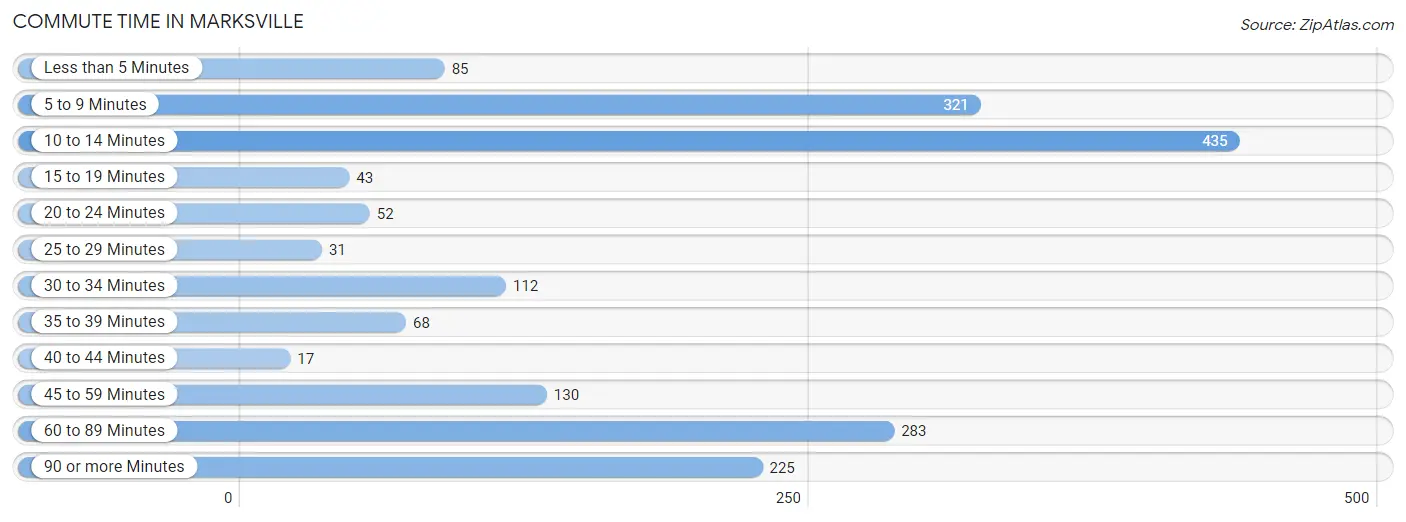
| Commute Time | # Commuters | % Commuters |
| Less than 5 Minutes | 85 | 4.7% |
| 5 to 9 Minutes | 321 | 17.8% |
| 10 to 14 Minutes | 435 | 24.1% |
| 15 to 19 Minutes | 43 | 2.4% |
| 20 to 24 Minutes | 52 | 2.9% |
| 25 to 29 Minutes | 31 | 1.7% |
| 30 to 34 Minutes | 112 | 6.2% |
| 35 to 39 Minutes | 68 | 3.8% |
| 40 to 44 Minutes | 17 | 0.9% |
| 45 to 59 Minutes | 130 | 7.2% |
| 60 to 89 Minutes | 283 | 15.7% |
| 90 or more Minutes | 225 | 12.5% |
Commute Time by Sex in Marksville
The most common commute times in Marksville are 10 to 14 minutes (250 commuters, 29.3%) for males and 60 to 89 minutes (210 commuters, 22.1%) for females.
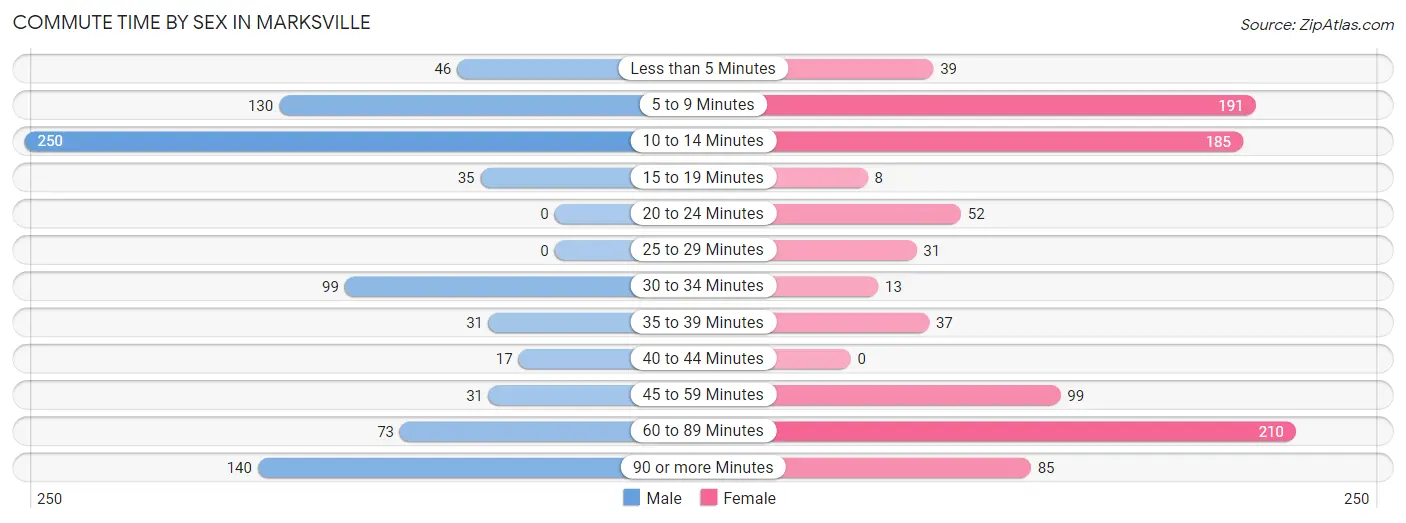
| Commute Time | Male | Female |
| Less than 5 Minutes | 46 (5.4%) | 39 (4.1%) |
| 5 to 9 Minutes | 130 (15.3%) | 191 (20.1%) |
| 10 to 14 Minutes | 250 (29.3%) | 185 (19.5%) |
| 15 to 19 Minutes | 35 (4.1%) | 8 (0.8%) |
| 20 to 24 Minutes | 0 (0.0%) | 52 (5.5%) |
| 25 to 29 Minutes | 0 (0.0%) | 31 (3.3%) |
| 30 to 34 Minutes | 99 (11.6%) | 13 (1.4%) |
| 35 to 39 Minutes | 31 (3.6%) | 37 (3.9%) |
| 40 to 44 Minutes | 17 (2.0%) | 0 (0.0%) |
| 45 to 59 Minutes | 31 (3.6%) | 99 (10.4%) |
| 60 to 89 Minutes | 73 (8.6%) | 210 (22.1%) |
| 90 or more Minutes | 140 (16.4%) | 85 (8.9%) |
Time of Departure to Work by Sex in Marksville
The most frequent times of departure to work in Marksville are 12:00 AM to 4:59 AM (311, 36.5%) for males and 7:30 AM to 7:59 AM (320, 33.7%) for females.
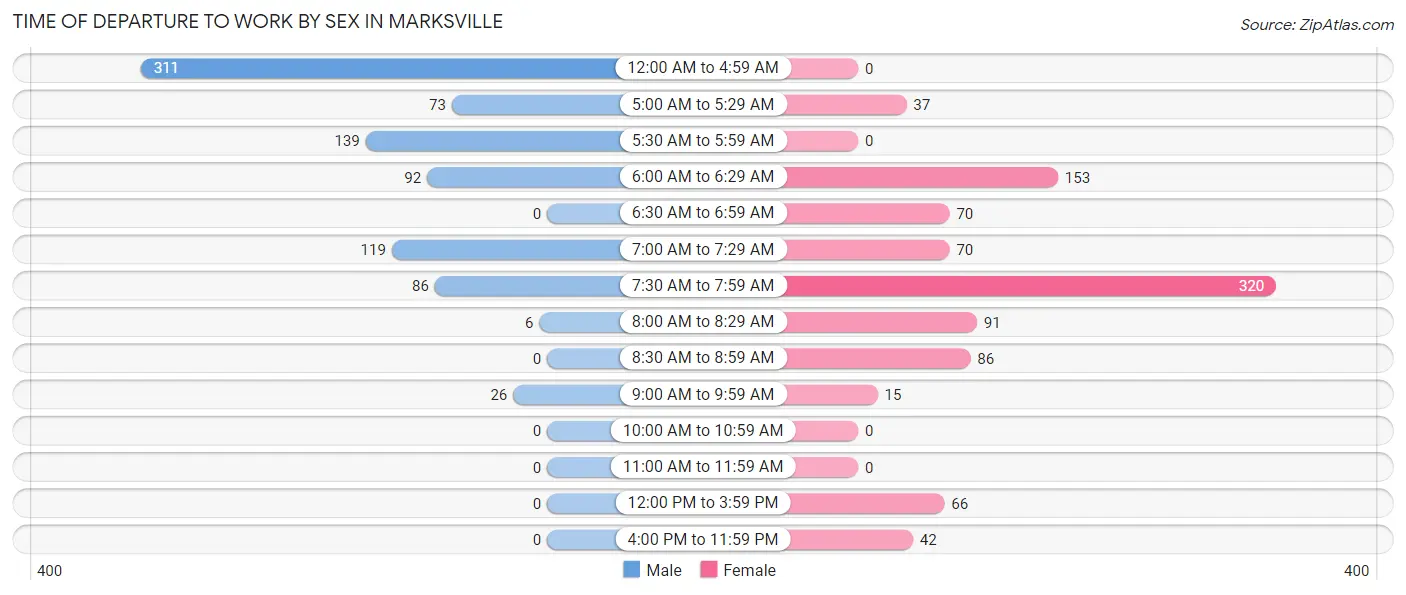
| Time of Departure | Male | Female |
| 12:00 AM to 4:59 AM | 311 (36.5%) | 0 (0.0%) |
| 5:00 AM to 5:29 AM | 73 (8.6%) | 37 (3.9%) |
| 5:30 AM to 5:59 AM | 139 (16.3%) | 0 (0.0%) |
| 6:00 AM to 6:29 AM | 92 (10.8%) | 153 (16.1%) |
| 6:30 AM to 6:59 AM | 0 (0.0%) | 70 (7.4%) |
| 7:00 AM to 7:29 AM | 119 (14.0%) | 70 (7.4%) |
| 7:30 AM to 7:59 AM | 86 (10.1%) | 320 (33.7%) |
| 8:00 AM to 8:29 AM | 6 (0.7%) | 91 (9.6%) |
| 8:30 AM to 8:59 AM | 0 (0.0%) | 86 (9.0%) |
| 9:00 AM to 9:59 AM | 26 (3.0%) | 15 (1.6%) |
| 10:00 AM to 10:59 AM | 0 (0.0%) | 0 (0.0%) |
| 11:00 AM to 11:59 AM | 0 (0.0%) | 0 (0.0%) |
| 12:00 PM to 3:59 PM | 0 (0.0%) | 66 (7.0%) |
| 4:00 PM to 11:59 PM | 0 (0.0%) | 42 (4.4%) |
| Total | 852 (100.0%) | 950 (100.0%) |
Housing Occupancy in Marksville
Occupancy by Ownership in Marksville
Of the total 1,975 dwellings in Marksville, owner-occupied units account for 1,220 (61.8%), while renter-occupied units make up 755 (38.2%).
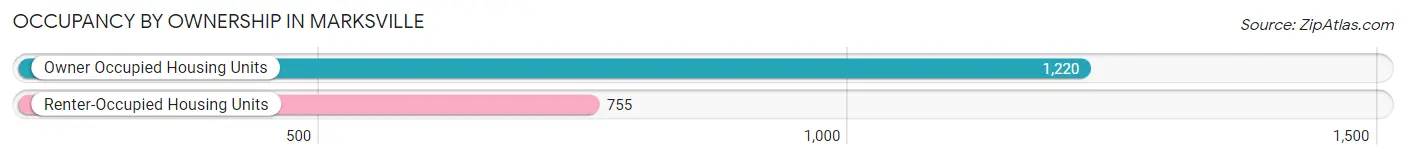
| Occupancy | # Housing Units | % Housing Units |
| Owner Occupied Housing Units | 1,220 | 61.8% |
| Renter-Occupied Housing Units | 755 | 38.2% |
| Total Occupied Housing Units | 1,975 | 100.0% |
Occupancy by Household Size in Marksville
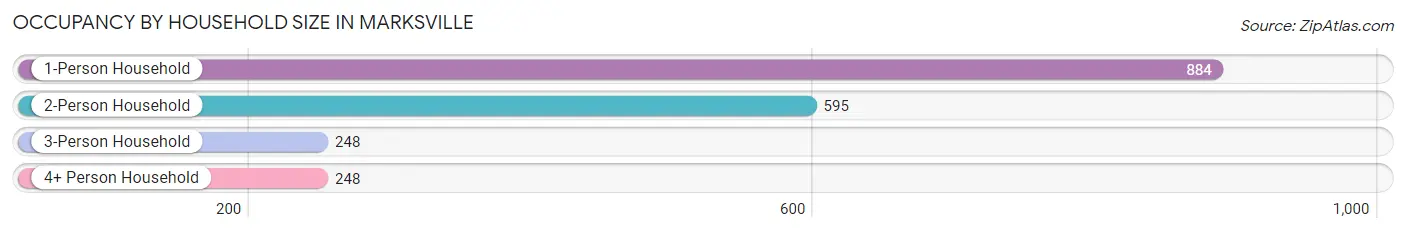
| Household Size | # Housing Units | % Housing Units |
| 1-Person Household | 884 | 44.8% |
| 2-Person Household | 595 | 30.1% |
| 3-Person Household | 248 | 12.6% |
| 4+ Person Household | 248 | 12.6% |
| Total Housing Units | 1,975 | 100.0% |
Occupancy by Ownership by Household Size in Marksville
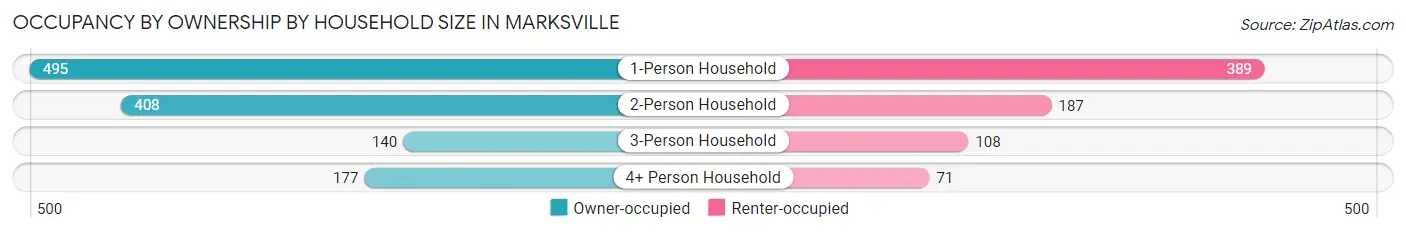
| Household Size | Owner-occupied | Renter-occupied |
| 1-Person Household | 495 (56.0%) | 389 (44.0%) |
| 2-Person Household | 408 (68.6%) | 187 (31.4%) |
| 3-Person Household | 140 (56.5%) | 108 (43.5%) |
| 4+ Person Household | 177 (71.4%) | 71 (28.6%) |
| Total Housing Units | 1,220 (61.8%) | 755 (38.2%) |
Occupancy by Educational Attainment in Marksville
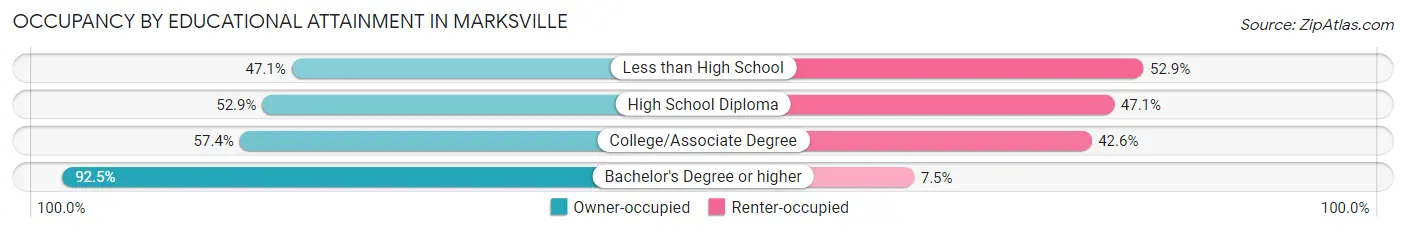
| Household Size | Owner-occupied | Renter-occupied |
| Less than High School | 113 (47.1%) | 127 (52.9%) |
| High School Diploma | 295 (52.9%) | 263 (47.1%) |
| College/Associate Degree | 452 (57.4%) | 336 (42.6%) |
| Bachelor's Degree or higher | 360 (92.5%) | 29 (7.5%) |
Occupancy by Age of Householder in Marksville
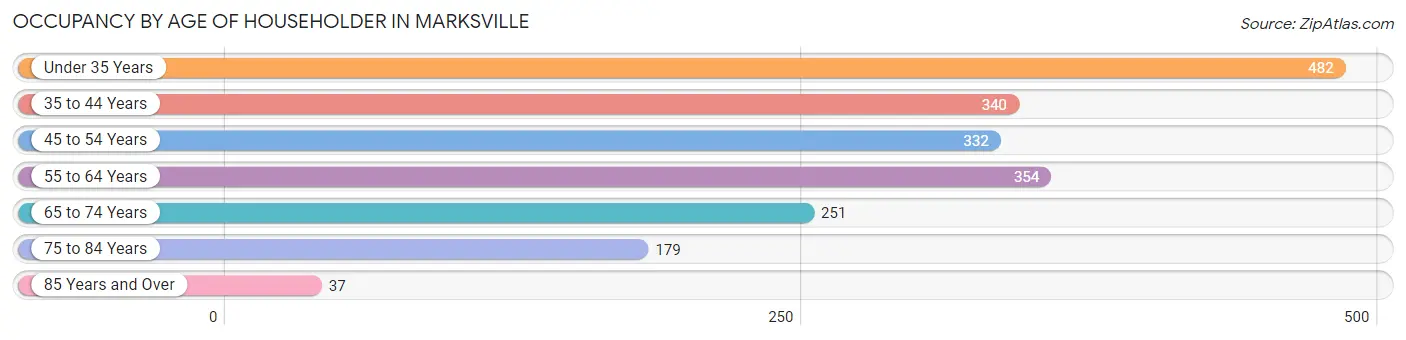
| Age Bracket | # Households | % Households |
| Under 35 Years | 482 | 24.4% |
| 35 to 44 Years | 340 | 17.2% |
| 45 to 54 Years | 332 | 16.8% |
| 55 to 64 Years | 354 | 17.9% |
| 65 to 74 Years | 251 | 12.7% |
| 75 to 84 Years | 179 | 9.1% |
| 85 Years and Over | 37 | 1.9% |
| Total | 1,975 | 100.0% |
Housing Finances in Marksville
Median Income by Occupancy in Marksville
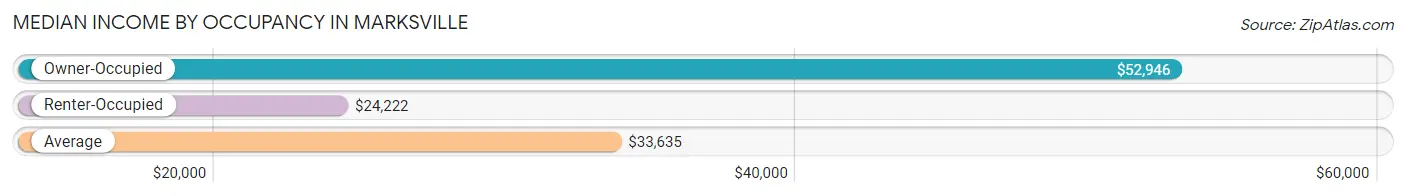
| Occupancy Type | # Households | Median Income |
| Owner-Occupied | 1,220 (61.8%) | $52,946 |
| Renter-Occupied | 755 (38.2%) | $24,222 |
| Average | 1,975 (100.0%) | $33,635 |
Occupancy by Householder Income Bracket in Marksville
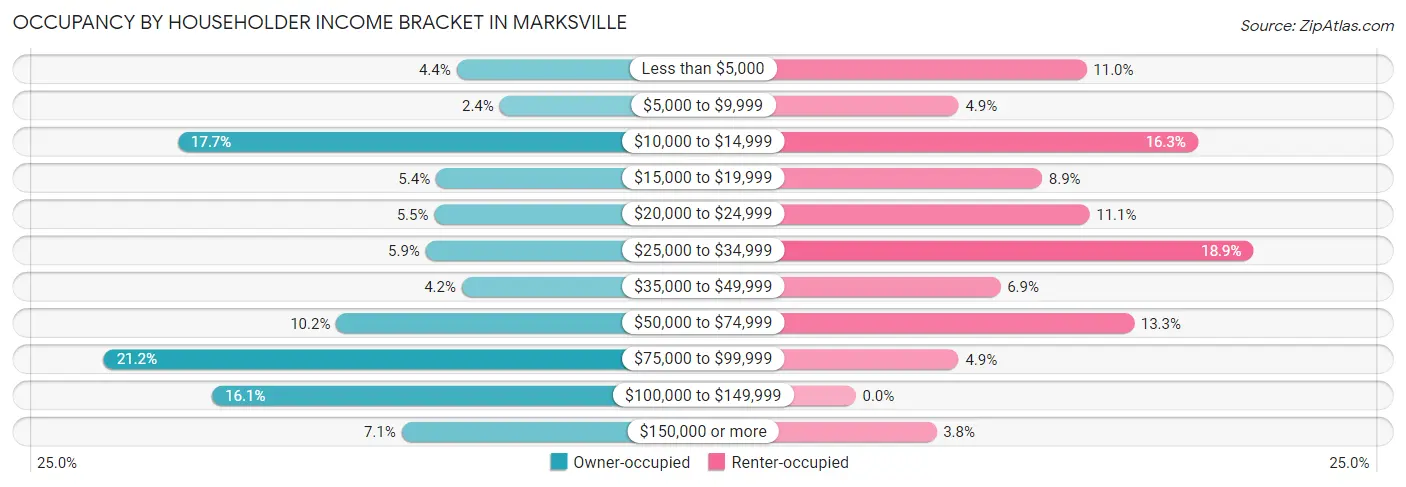
| Income Bracket | Owner-occupied | Renter-occupied |
| Less than $5,000 | 54 (4.4%) | 83 (11.0%) |
| $5,000 to $9,999 | 29 (2.4%) | 37 (4.9%) |
| $10,000 to $14,999 | 216 (17.7%) | 123 (16.3%) |
| $15,000 to $19,999 | 66 (5.4%) | 67 (8.9%) |
| $20,000 to $24,999 | 67 (5.5%) | 84 (11.1%) |
| $25,000 to $34,999 | 72 (5.9%) | 143 (18.9%) |
| $35,000 to $49,999 | 51 (4.2%) | 52 (6.9%) |
| $50,000 to $74,999 | 124 (10.2%) | 100 (13.3%) |
| $75,000 to $99,999 | 259 (21.2%) | 37 (4.9%) |
| $100,000 to $149,999 | 196 (16.1%) | 0 (0.0%) |
| $150,000 or more | 86 (7.0%) | 29 (3.8%) |
| Total | 1,220 (100.0%) | 755 (100.0%) |
Monthly Housing Cost Tiers in Marksville
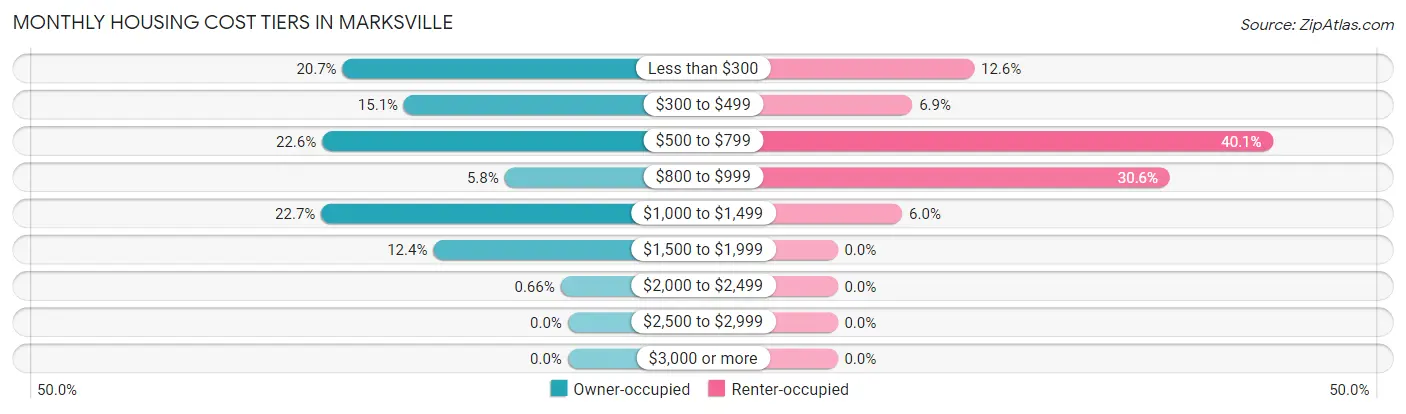
| Monthly Cost | Owner-occupied | Renter-occupied |
| Less than $300 | 253 (20.7%) | 95 (12.6%) |
| $300 to $499 | 184 (15.1%) | 52 (6.9%) |
| $500 to $799 | 276 (22.6%) | 303 (40.1%) |
| $800 to $999 | 71 (5.8%) | 231 (30.6%) |
| $1,000 to $1,499 | 277 (22.7%) | 45 (6.0%) |
| $1,500 to $1,999 | 151 (12.4%) | 0 (0.0%) |
| $2,000 to $2,499 | 8 (0.7%) | 0 (0.0%) |
| $2,500 to $2,999 | 0 (0.0%) | 0 (0.0%) |
| $3,000 or more | 0 (0.0%) | 0 (0.0%) |
| Total | 1,220 (100.0%) | 755 (100.0%) |
Physical Housing Characteristics in Marksville
Housing Structures in Marksville
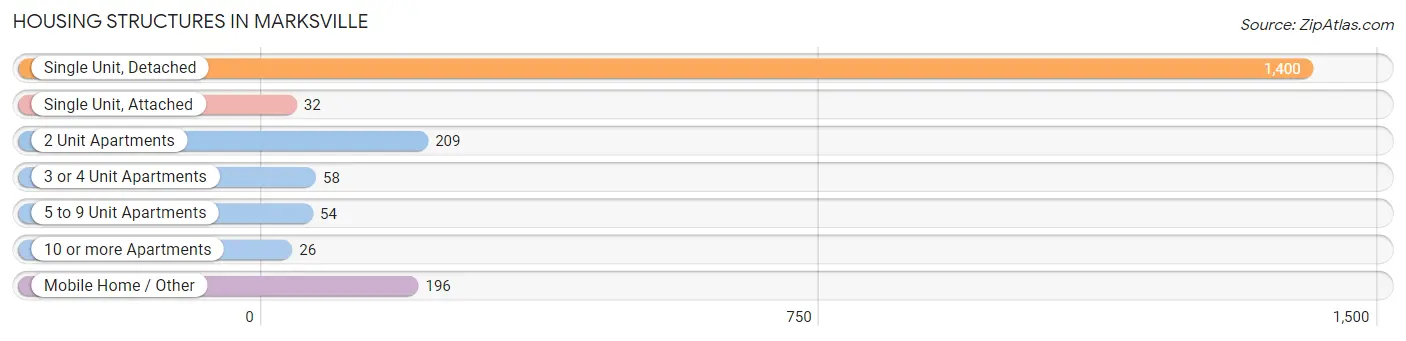
| Structure Type | # Housing Units | % Housing Units |
| Single Unit, Detached | 1,400 | 70.9% |
| Single Unit, Attached | 32 | 1.6% |
| 2 Unit Apartments | 209 | 10.6% |
| 3 or 4 Unit Apartments | 58 | 2.9% |
| 5 to 9 Unit Apartments | 54 | 2.7% |
| 10 or more Apartments | 26 | 1.3% |
| Mobile Home / Other | 196 | 9.9% |
| Total | 1,975 | 100.0% |
Housing Structures by Occupancy in Marksville
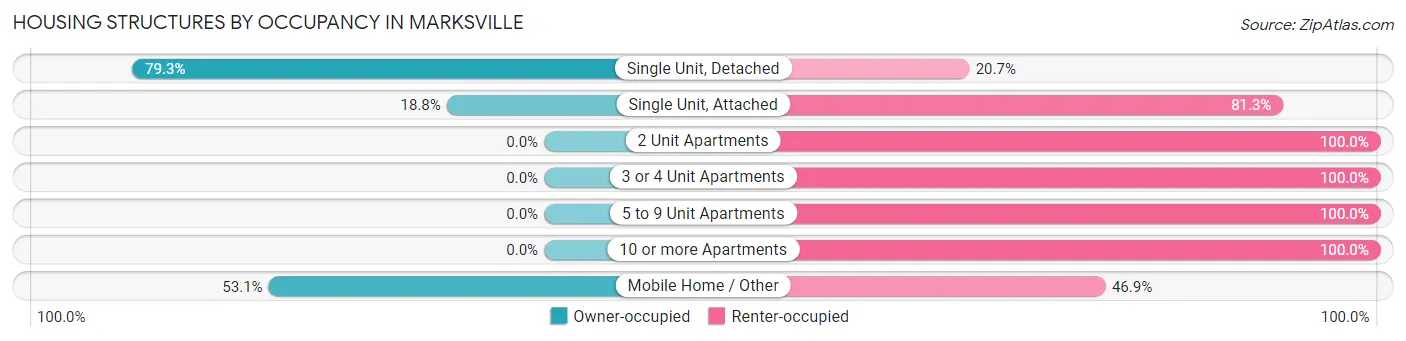
| Structure Type | Owner-occupied | Renter-occupied |
| Single Unit, Detached | 1,110 (79.3%) | 290 (20.7%) |
| Single Unit, Attached | 6 (18.8%) | 26 (81.2%) |
| 2 Unit Apartments | 0 (0.0%) | 209 (100.0%) |
| 3 or 4 Unit Apartments | 0 (0.0%) | 58 (100.0%) |
| 5 to 9 Unit Apartments | 0 (0.0%) | 54 (100.0%) |
| 10 or more Apartments | 0 (0.0%) | 26 (100.0%) |
| Mobile Home / Other | 104 (53.1%) | 92 (46.9%) |
| Total | 1,220 (61.8%) | 755 (38.2%) |
Housing Structures by Number of Rooms in Marksville
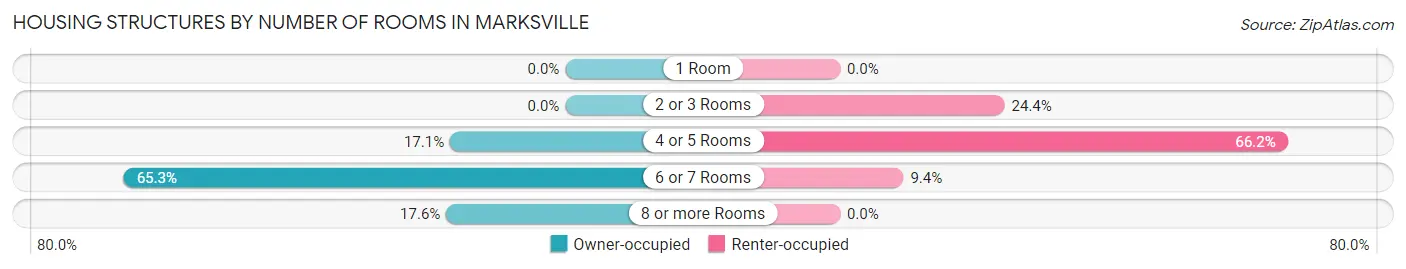
| Number of Rooms | Owner-occupied | Renter-occupied |
| 1 Room | 0 (0.0%) | 0 (0.0%) |
| 2 or 3 Rooms | 0 (0.0%) | 184 (24.4%) |
| 4 or 5 Rooms | 208 (17.1%) | 500 (66.2%) |
| 6 or 7 Rooms | 797 (65.3%) | 71 (9.4%) |
| 8 or more Rooms | 215 (17.6%) | 0 (0.0%) |
| Total | 1,220 (100.0%) | 755 (100.0%) |
Housing Structure by Heating Type in Marksville
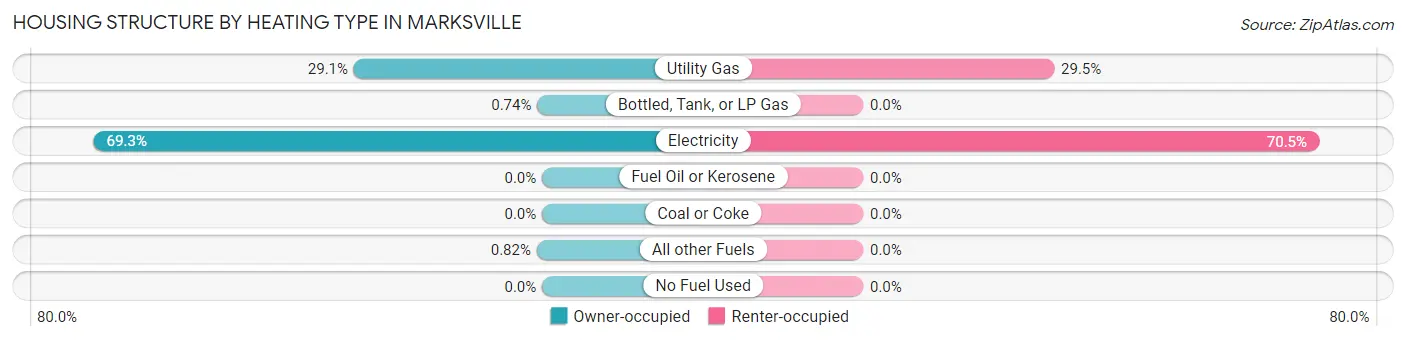
| Heating Type | Owner-occupied | Renter-occupied |
| Utility Gas | 355 (29.1%) | 223 (29.5%) |
| Bottled, Tank, or LP Gas | 9 (0.7%) | 0 (0.0%) |
| Electricity | 846 (69.3%) | 532 (70.5%) |
| Fuel Oil or Kerosene | 0 (0.0%) | 0 (0.0%) |
| Coal or Coke | 0 (0.0%) | 0 (0.0%) |
| All other Fuels | 10 (0.8%) | 0 (0.0%) |
| No Fuel Used | 0 (0.0%) | 0 (0.0%) |
| Total | 1,220 (100.0%) | 755 (100.0%) |
Household Vehicle Usage in Marksville
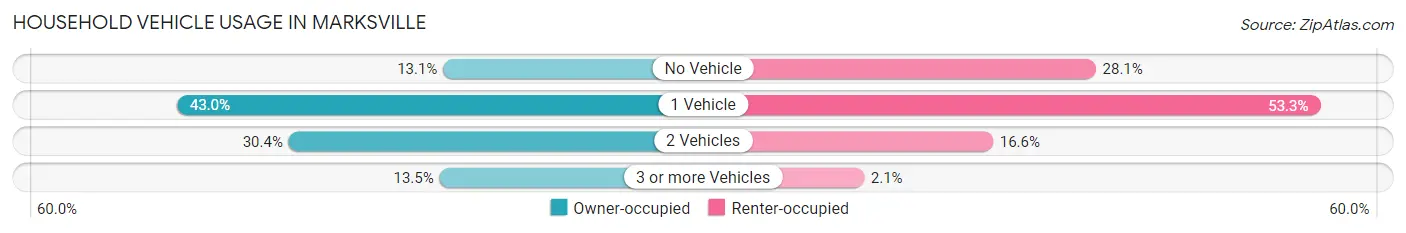
| Vehicles per Household | Owner-occupied | Renter-occupied |
| No Vehicle | 160 (13.1%) | 212 (28.1%) |
| 1 Vehicle | 524 (42.9%) | 402 (53.2%) |
| 2 Vehicles | 371 (30.4%) | 125 (16.6%) |
| 3 or more Vehicles | 165 (13.5%) | 16 (2.1%) |
| Total | 1,220 (100.0%) | 755 (100.0%) |
Real Estate & Mortgages in Marksville
Real Estate and Mortgage Overview in Marksville
| Characteristic | Without Mortgage | With Mortgage |
| Housing Units | 496 | 724 |
| Median Property Value | $123,000 | $139,900 |
| Median Household Income | $35,083 | $31 |
| Monthly Housing Costs | $297 | $0 |
| Real Estate Taxes | $199 | $0 |
Property Value by Mortgage Status in Marksville
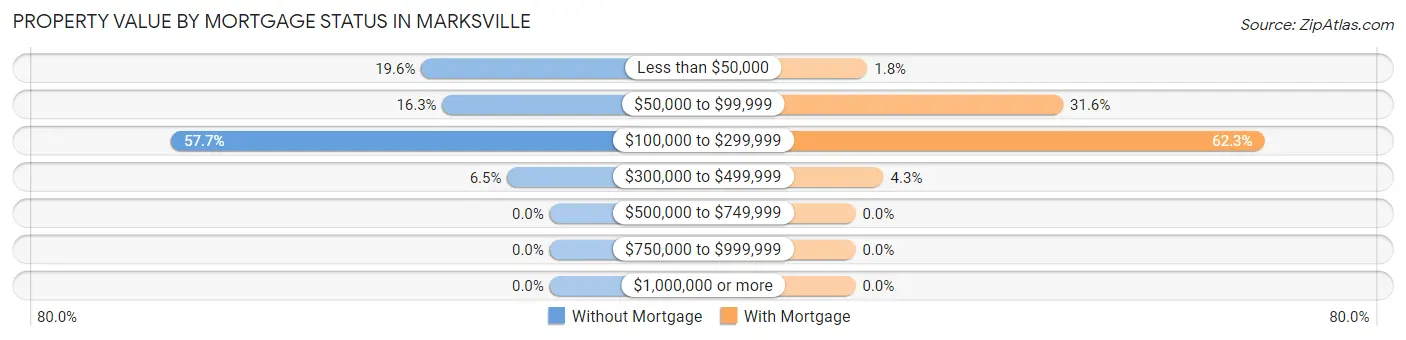
| Property Value | Without Mortgage | With Mortgage |
| Less than $50,000 | 97 (19.6%) | 13 (1.8%) |
| $50,000 to $99,999 | 81 (16.3%) | 229 (31.6%) |
| $100,000 to $299,999 | 286 (57.7%) | 451 (62.3%) |
| $300,000 to $499,999 | 32 (6.5%) | 31 (4.3%) |
| $500,000 to $749,999 | 0 (0.0%) | 0 (0.0%) |
| $750,000 to $999,999 | 0 (0.0%) | 0 (0.0%) |
| $1,000,000 or more | 0 (0.0%) | 0 (0.0%) |
| Total | 496 (100.0%) | 724 (100.0%) |
Household Income by Mortgage Status in Marksville
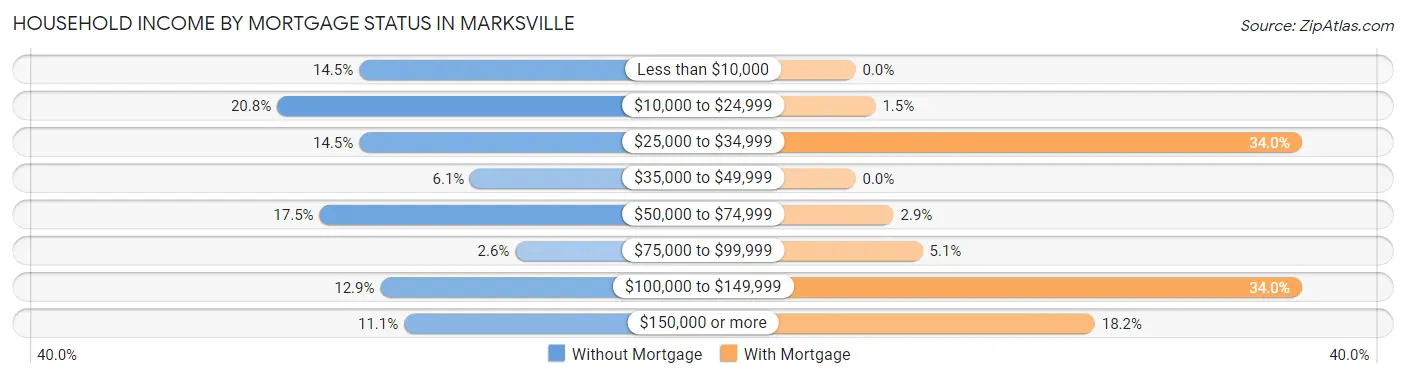
| Household Income | Without Mortgage | With Mortgage |
| Less than $10,000 | 72 (14.5%) | 0 (0.0%) |
| $10,000 to $24,999 | 103 (20.8%) | 11 (1.5%) |
| $25,000 to $34,999 | 72 (14.5%) | 246 (34.0%) |
| $35,000 to $49,999 | 30 (6.0%) | 0 (0.0%) |
| $50,000 to $74,999 | 87 (17.5%) | 21 (2.9%) |
| $75,000 to $99,999 | 13 (2.6%) | 37 (5.1%) |
| $100,000 to $149,999 | 64 (12.9%) | 246 (34.0%) |
| $150,000 or more | 55 (11.1%) | 132 (18.2%) |
| Total | 496 (100.0%) | 724 (100.0%) |
Property Value to Household Income Ratio in Marksville
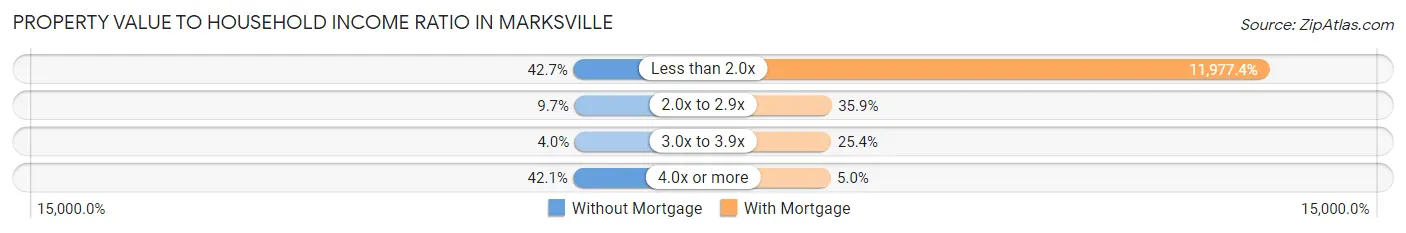
| Value-to-Income Ratio | Without Mortgage | With Mortgage |
| Less than 2.0x | 212 (42.7%) | 86,716 (11,977.3%) |
| 2.0x to 2.9x | 48 (9.7%) | 260 (35.9%) |
| 3.0x to 3.9x | 20 (4.0%) | 184 (25.4%) |
| 4.0x or more | 209 (42.1%) | 36 (5.0%) |
| Total | 496 (100.0%) | 724 (100.0%) |
Real Estate Taxes by Mortgage Status in Marksville
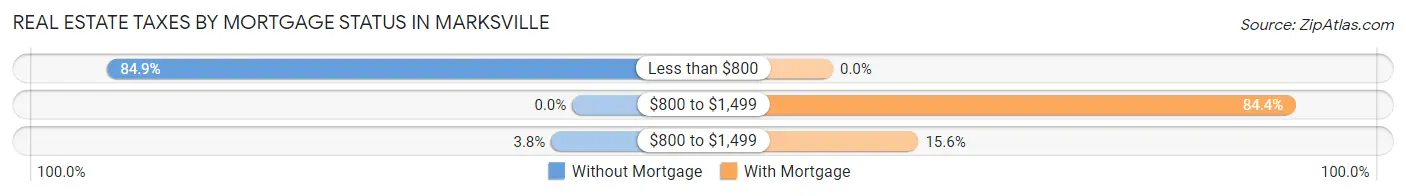
| Property Taxes | Without Mortgage | With Mortgage |
| Less than $800 | 421 (84.9%) | 0 (0.0%) |
| $800 to $1,499 | 0 (0.0%) | 611 (84.4%) |
| $800 to $1,499 | 19 (3.8%) | 113 (15.6%) |
| Total | 496 (100.0%) | 724 (100.0%) |
Health & Disability in Marksville
Health Insurance Coverage by Age in Marksville
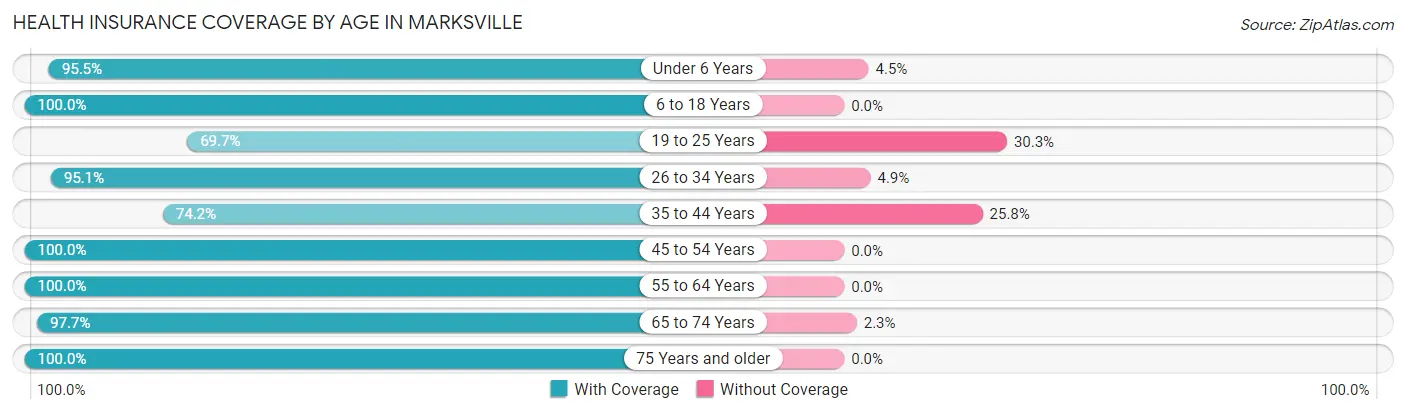
| Age Bracket | With Coverage | Without Coverage |
| Under 6 Years | 506 (95.5%) | 24 (4.5%) |
| 6 to 18 Years | 940 (100.0%) | 0 (0.0%) |
| 19 to 25 Years | 170 (69.7%) | 74 (30.3%) |
| 26 to 34 Years | 662 (95.1%) | 34 (4.9%) |
| 35 to 44 Years | 423 (74.2%) | 147 (25.8%) |
| 45 to 54 Years | 504 (100.0%) | 0 (0.0%) |
| 55 to 64 Years | 384 (100.0%) | 0 (0.0%) |
| 65 to 74 Years | 461 (97.7%) | 11 (2.3%) |
| 75 Years and older | 302 (100.0%) | 0 (0.0%) |
| Total | 4,352 (93.8%) | 290 (6.2%) |
Health Insurance Coverage by Citizenship Status in Marksville
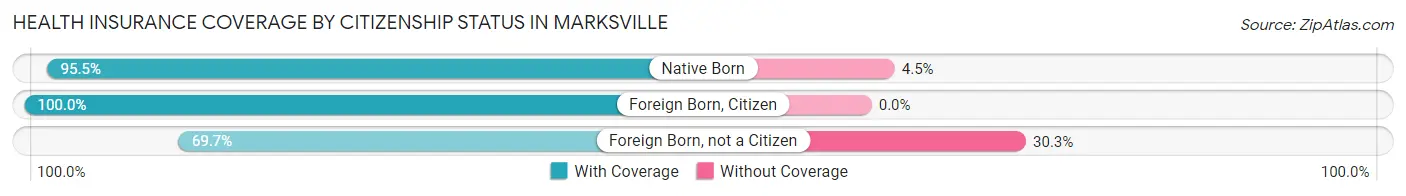
| Citizenship Status | With Coverage | Without Coverage |
| Native Born | 506 (95.5%) | 24 (4.5%) |
| Foreign Born, Citizen | 940 (100.0%) | 0 (0.0%) |
| Foreign Born, not a Citizen | 170 (69.7%) | 74 (30.3%) |
Health Insurance Coverage by Household Income in Marksville
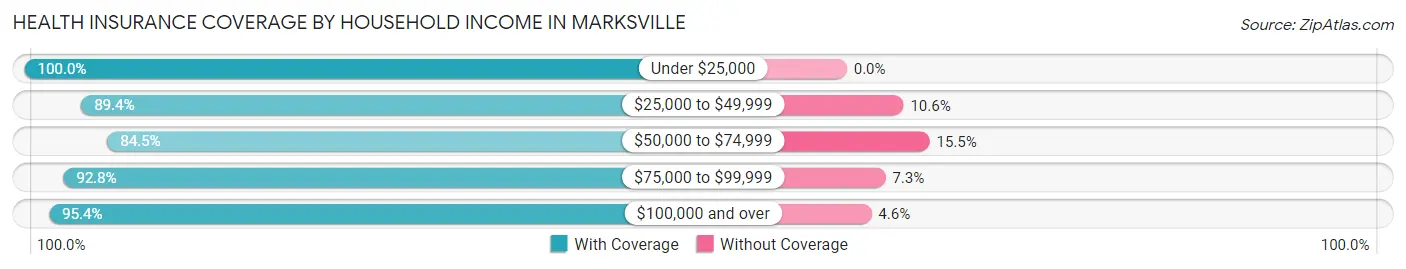
| Household Income | With Coverage | Without Coverage |
| Under $25,000 | 1,403 (100.0%) | 0 (0.0%) |
| $25,000 to $49,999 | 682 (89.4%) | 81 (10.6%) |
| $50,000 to $74,999 | 545 (84.5%) | 100 (15.5%) |
| $75,000 to $99,999 | 947 (92.7%) | 74 (7.2%) |
| $100,000 and over | 724 (95.4%) | 35 (4.6%) |
Public vs Private Health Insurance Coverage by Age in Marksville
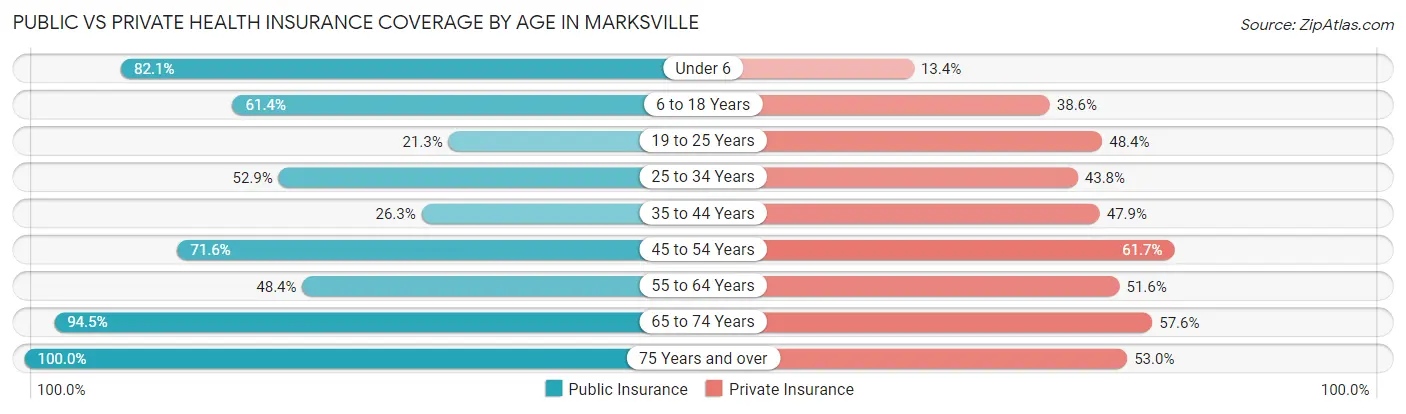
| Age Bracket | Public Insurance | Private Insurance |
| Under 6 | 435 (82.1%) | 71 (13.4%) |
| 6 to 18 Years | 577 (61.4%) | 363 (38.6%) |
| 19 to 25 Years | 52 (21.3%) | 118 (48.4%) |
| 25 to 34 Years | 368 (52.9%) | 305 (43.8%) |
| 35 to 44 Years | 150 (26.3%) | 273 (47.9%) |
| 45 to 54 Years | 361 (71.6%) | 311 (61.7%) |
| 55 to 64 Years | 186 (48.4%) | 198 (51.6%) |
| 65 to 74 Years | 446 (94.5%) | 272 (57.6%) |
| 75 Years and over | 302 (100.0%) | 160 (53.0%) |
| Total | 2,877 (62.0%) | 2,071 (44.6%) |
Disability Status by Sex by Age in Marksville
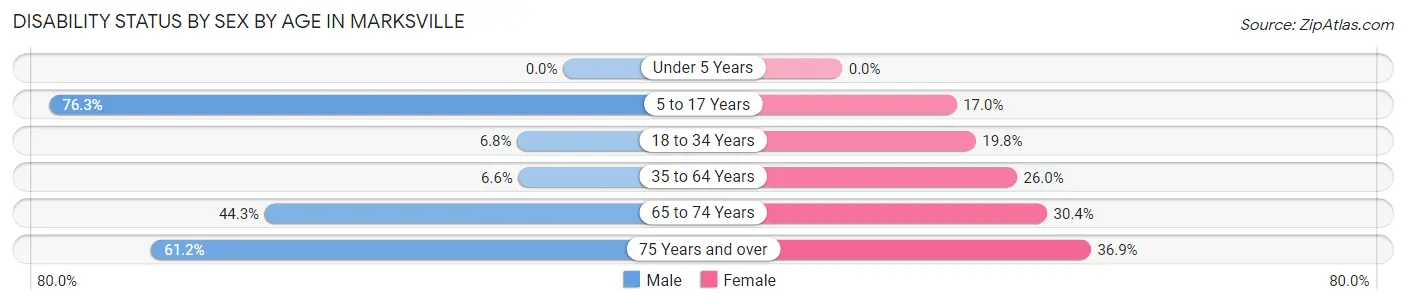
| Age Bracket | Male | Female |
| Under 5 Years | 0 (0.0%) | 0 (0.0%) |
| 5 to 17 Years | 467 (76.3%) | 70 (17.0%) |
| 18 to 34 Years | 19 (6.8%) | 138 (19.8%) |
| 35 to 64 Years | 41 (6.6%) | 218 (26.0%) |
| 65 to 74 Years | 113 (44.3%) | 66 (30.4%) |
| 75 Years and over | 145 (61.2%) | 24 (36.9%) |
Disability Class by Sex by Age in Marksville
Disability Class: Hearing Difficulty
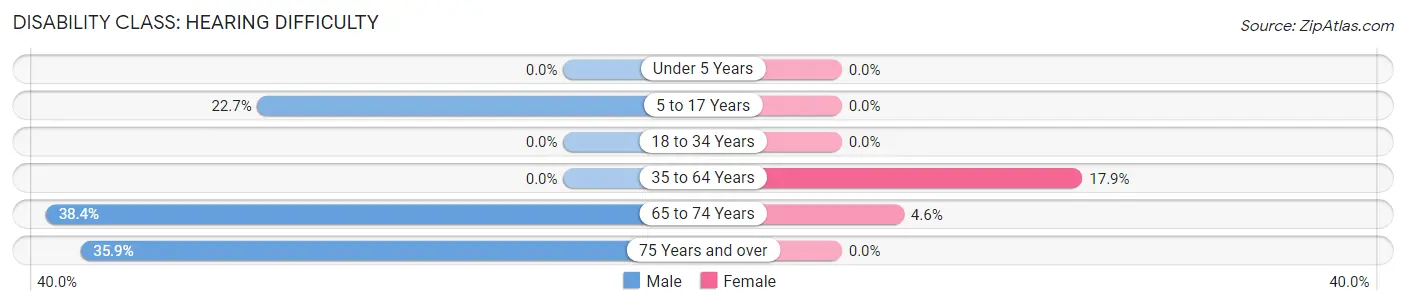
| Age Bracket | Male | Female |
| Under 5 Years | 0 (0.0%) | 0 (0.0%) |
| 5 to 17 Years | 139 (22.7%) | 0 (0.0%) |
| 18 to 34 Years | 0 (0.0%) | 0 (0.0%) |
| 35 to 64 Years | 0 (0.0%) | 150 (17.9%) |
| 65 to 74 Years | 98 (38.4%) | 10 (4.6%) |
| 75 Years and over | 85 (35.9%) | 0 (0.0%) |
Disability Class: Vision Difficulty
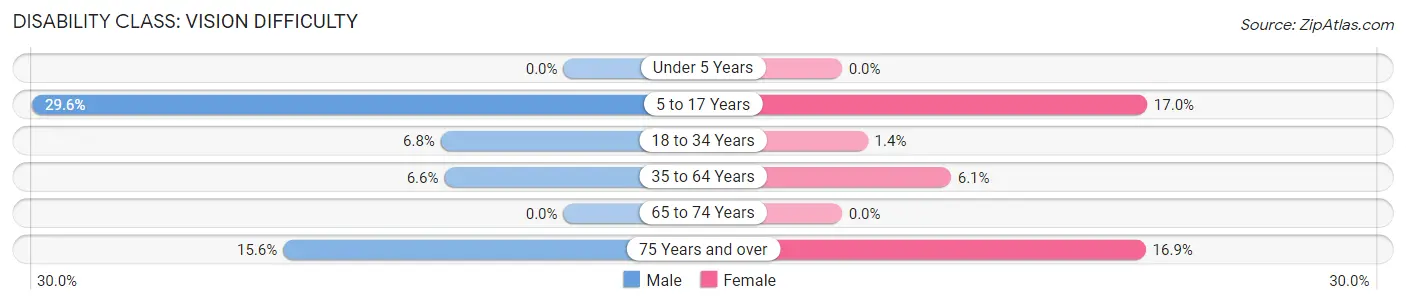
| Age Bracket | Male | Female |
| Under 5 Years | 0 (0.0%) | 0 (0.0%) |
| 5 to 17 Years | 181 (29.6%) | 70 (17.0%) |
| 18 to 34 Years | 19 (6.8%) | 10 (1.4%) |
| 35 to 64 Years | 41 (6.6%) | 51 (6.1%) |
| 65 to 74 Years | 0 (0.0%) | 0 (0.0%) |
| 75 Years and over | 37 (15.6%) | 11 (16.9%) |
Disability Class: Cognitive Difficulty
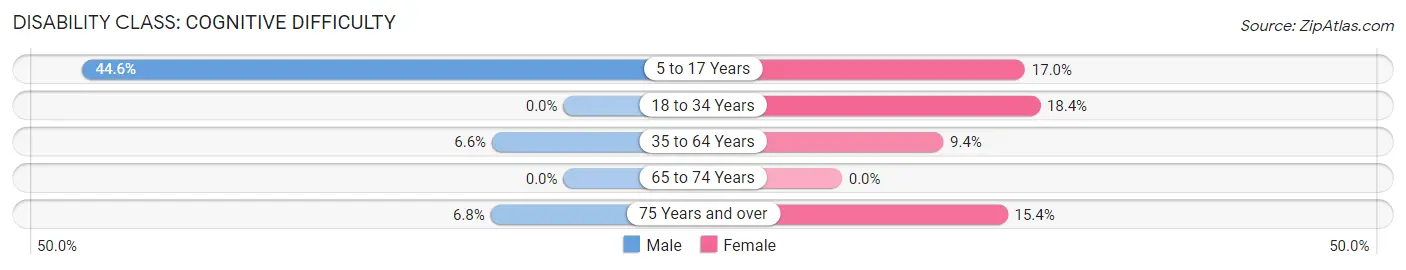
| Age Bracket | Male | Female |
| 5 to 17 Years | 273 (44.6%) | 70 (17.0%) |
| 18 to 34 Years | 0 (0.0%) | 128 (18.4%) |
| 35 to 64 Years | 41 (6.6%) | 79 (9.4%) |
| 65 to 74 Years | 0 (0.0%) | 0 (0.0%) |
| 75 Years and over | 16 (6.8%) | 10 (15.4%) |
Disability Class: Ambulatory Difficulty
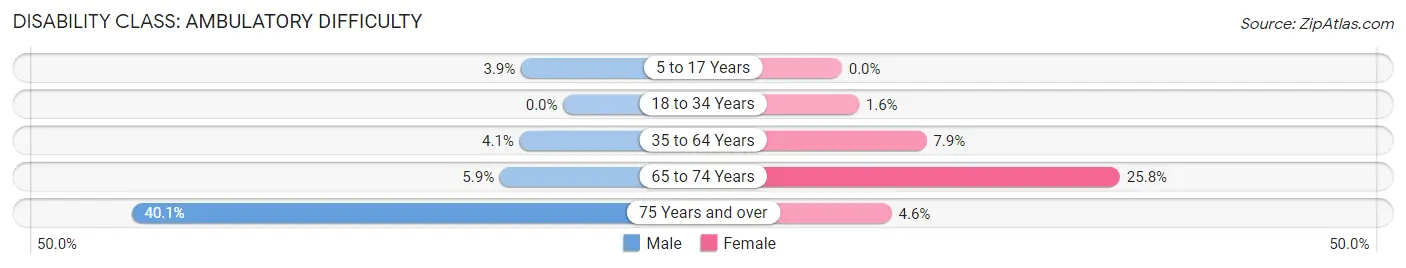
| Age Bracket | Male | Female |
| 5 to 17 Years | 24 (3.9%) | 0 (0.0%) |
| 18 to 34 Years | 0 (0.0%) | 11 (1.6%) |
| 35 to 64 Years | 25 (4.1%) | 66 (7.9%) |
| 65 to 74 Years | 15 (5.9%) | 56 (25.8%) |
| 75 Years and over | 95 (40.1%) | 3 (4.6%) |
Disability Class: Self-Care Difficulty
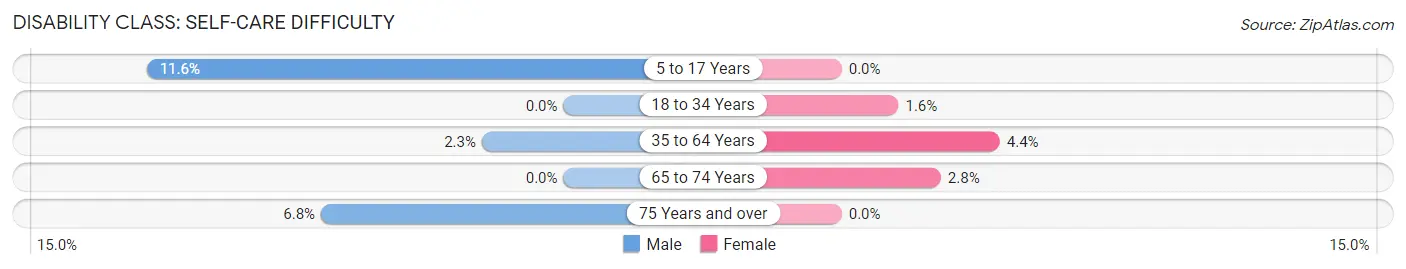
| Age Bracket | Male | Female |
| 5 to 17 Years | 71 (11.6%) | 0 (0.0%) |
| 18 to 34 Years | 0 (0.0%) | 11 (1.6%) |
| 35 to 64 Years | 14 (2.3%) | 37 (4.4%) |
| 65 to 74 Years | 0 (0.0%) | 6 (2.8%) |
| 75 Years and over | 16 (6.8%) | 0 (0.0%) |
Technology Access in Marksville
Computing Device Access in Marksville
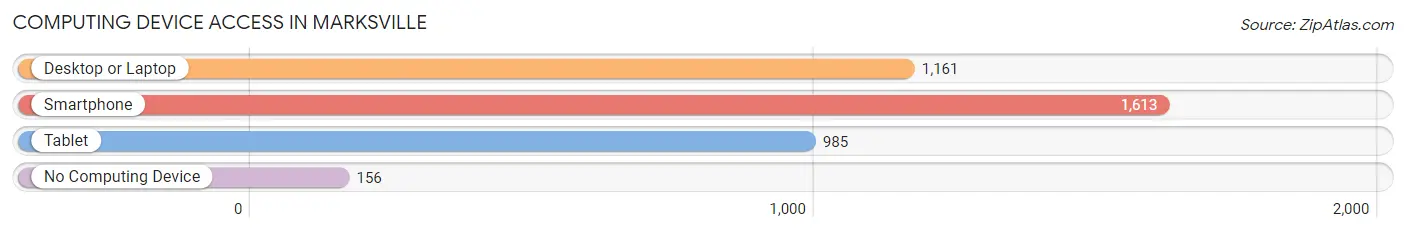
| Device Type | # Households | % Households |
| Desktop or Laptop | 1,161 | 58.8% |
| Smartphone | 1,613 | 81.7% |
| Tablet | 985 | 49.9% |
| No Computing Device | 156 | 7.9% |
| Total | 1,975 | 100.0% |
Internet Access in Marksville
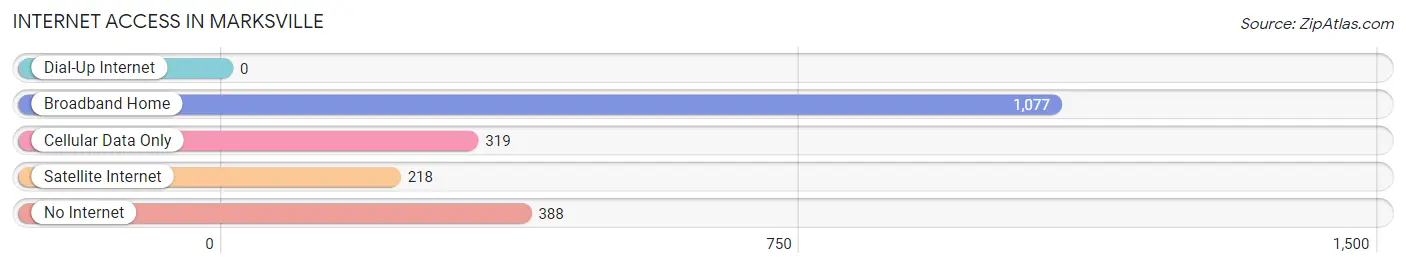
| Internet Type | # Households | % Households |
| Dial-Up Internet | 0 | 0.0% |
| Broadband Home | 1,077 | 54.5% |
| Cellular Data Only | 319 | 16.2% |
| Satellite Internet | 218 | 11.0% |
| No Internet | 388 | 19.7% |
| Total | 1,975 | 100.0% |
Marksville Summary
Marksville is a city located in the parish of Avoyelles in the state of Louisiana. It is the parish seat and the largest city in the parish. The city is located on the banks of the Red River and is part of the Alexandria metropolitan area. The population of Marksville was 5,702 at the 2010 census, an increase of 165 since the 2000 census.
History
Marksville was founded in 1719 by Jean-Baptiste Le Moyne, Sieur de Bienville, the founder of New Orleans. The city was named after his friend, Marc-Antoine de la Marque, who was a French naval officer. The city was originally a trading post and was used as a base for French exploration of the area.
In 1803, the United States acquired the Louisiana Purchase from France, and Marksville became part of the Territory of Orleans. In 1805, the city was incorporated as a town and in 1811, it was incorporated as a city.
During the Civil War, Marksville was occupied by Union forces in 1863. After the war, the city was rebuilt and the economy began to grow. In the late 19th century, Marksville became a center for the lumber industry and the city's population began to grow.
Geography
Marksville is located at 31°7'25" North, 92°7'17" West (31.123611, -92.121389). The city is situated on the banks of the Red River, which forms the border between Louisiana and Texas. The city is located in the Central Louisiana region and is part of the Alexandria metropolitan area.
The city has a total area of 4.2 square miles, of which 4.1 square miles is land and 0.1 square miles is water. The terrain is mostly flat with some rolling hills. The climate is humid subtropical, with hot, humid summers and mild winters.
Economy
Marksville's economy is largely based on agriculture and tourism. The city is home to several large farms, which produce cotton, soybeans, corn, and other crops. The city is also home to several tourist attractions, including the Marksville State Historic Site, the Marksville Prehistoric Indian Site, and the Marksville State Park.
The city is also home to several manufacturing companies, including a paper mill, a furniture factory, and a plastics plant. The city is also home to several retail stores, restaurants, and other businesses.
Demographics
As of the 2010 census, there were 5,702 people, 2,093 households, and 1,427 families residing in the city. The population density was 1,377.2 people per square mile. The racial makeup of the city was 63.2% White, 33.3% African American, 0.3% Native American, 0.5% Asian, 0.1% Pacific Islander, 0.7% from other races, and 1.9% from two or more races. Hispanic or Latino of any race were 2.2% of the population.
The median income for a household in the city was $30,938, and the median income for a family was $37,813. Males had a median income of $31,944 versus $20,917 for females. The per capita income for the city was $15,945. About 17.2% of families and 20.3% of the population were below the poverty line, including 28.2% of those under age 18 and 16.2% of those age 65 or over.
Common Questions
What is Per Capita Income in Marksville?
Per Capita income in Marksville is $24,157.
What is the Median Family Income in Marksville?
Median Family Income in Marksville is $43,750.
What is the Median Household income in Marksville?
Median Household Income in Marksville is $33,635.
What is Income or Wage Gap in Marksville?
Income or Wage Gap in Marksville is 21.0%.
Women in Marksville earn 79.0 cents for every dollar earned by a man.
What is Family Income Deficit in Marksville?
Family Income Deficit in Marksville is $12,021.
Families that are below poverty line in Marksville earn $12,021 less on average than the poverty threshold level.
What is Inequality or Gini Index in Marksville?
Inequality or Gini Index in Marksville is 0.51.
What is the Total Population of Marksville?
Total Population of Marksville is 5,034.
What is the Total Male Population of Marksville?
Total Male Population of Marksville is 2,623.
What is the Total Female Population of Marksville?
Total Female Population of Marksville is 2,411.
What is the Ratio of Males per 100 Females in Marksville?
There are 108.79 Males per 100 Females in Marksville.
What is the Ratio of Females per 100 Males in Marksville?
There are 91.92 Females per 100 Males in Marksville.
What is the Median Population Age in Marksville?
Median Population Age in Marksville is 33.9 Years.
What is the Average Family Size in Marksville
Average Family Size in Marksville is 3.3 People.
What is the Average Household Size in Marksville
Average Household Size in Marksville is 2.3 People.
How Large is the Labor Force in Marksville?
There are 2,116 People in the Labor Forcein in Marksville.
What is the Percentage of People in the Labor Force in Marksville?
55.0% of People are in the Labor Force in Marksville.
What is the Unemployment Rate in Marksville?
Unemployment Rate in Marksville is 7.0%.