Many, LA Map & Demographics
Many Map
Many Overview
$23,291
PER CAPITA INCOME
$14,438
AVG FAMILY INCOME
$22,260
AVG HOUSEHOLD INCOME
49.7%
WAGE / INCOME GAP [ % ]
50.3¢/ $1
WAGE / INCOME GAP [ $ ]
0.61
INEQUALITY / GINI INDEX
2,566
TOTAL POPULATION
1,163
MALE POPULATION
1,403
FEMALE POPULATION
82.89
MALES / 100 FEMALES
120.64
FEMALES / 100 MALES
37.3
MEDIAN AGE
3.2
AVG FAMILY SIZE
2.5
AVG HOUSEHOLD SIZE
821
LABOR FORCE [ PEOPLE ]
38.3%
PERCENT IN LABOR FORCE
8.3%
UNEMPLOYMENT RATE
Many Zip Codes
Many Area Codes
Income in Many
Income Overview in Many
Per Capita Income in Many is $23,291, while median incomes of families and households are $14,438 and $22,260 respectively.
| Characteristic | Number | Measure |
| Per Capita Income | 2,566 | $23,291 |
| Median Family Income | 558 | $14,438 |
| Mean Family Income | 558 | $60,849 |
| Median Household Income | 938 | $22,260 |
| Mean Household Income | 938 | $53,401 |
| Income Deficit | 558 | $0 |
| Wage / Income Gap (%) | 2,566 | 49.71% |
| Wage / Income Gap ($) | 2,566 | 50.29¢ per $1 |
| Gini / Inequality Index | 2,566 | 0.61 |
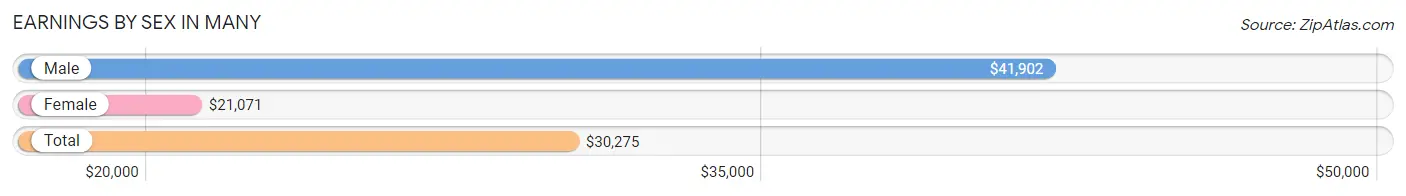
Earnings by Sex in Many
Average Earnings in Many are $30,275, $41,902 for men and $21,071 for women, a difference of 49.7%.
| Sex | Number | Average Earnings |
| Male | 379 (45.1%) | $41,902 |
| Female | 462 (54.9%) | $21,071 |
| Total | 841 (100.0%) | $30,275 |
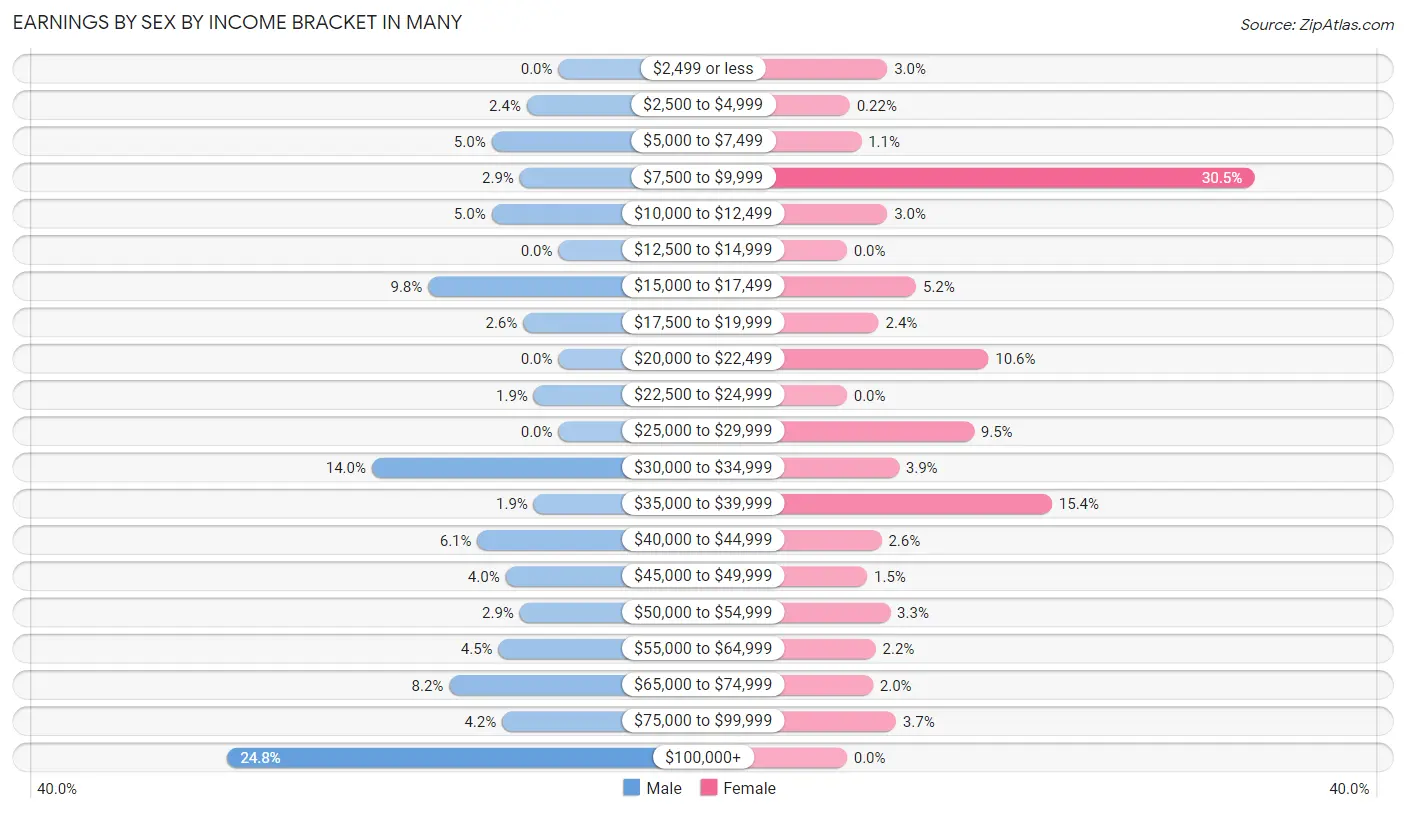
Earnings by Sex by Income Bracket in Many
The most common earnings brackets in Many are $100,000+ for men (94 | 24.8%) and $7,500 to $9,999 for women (141 | 30.5%).
| Income | Male | Female |
| $2,499 or less | 0 (0.0%) | 14 (3.0%) |
| $2,500 to $4,999 | 9 (2.4%) | 1 (0.2%) |
| $5,000 to $7,499 | 19 (5.0%) | 5 (1.1%) |
| $7,500 to $9,999 | 11 (2.9%) | 141 (30.5%) |
| $10,000 to $12,499 | 19 (5.0%) | 14 (3.0%) |
| $12,500 to $14,999 | 0 (0.0%) | 0 (0.0%) |
| $15,000 to $17,499 | 37 (9.8%) | 24 (5.2%) |
| $17,500 to $19,999 | 10 (2.6%) | 11 (2.4%) |
| $20,000 to $22,499 | 0 (0.0%) | 49 (10.6%) |
| $22,500 to $24,999 | 7 (1.8%) | 0 (0.0%) |
| $25,000 to $29,999 | 0 (0.0%) | 44 (9.5%) |
| $30,000 to $34,999 | 53 (14.0%) | 18 (3.9%) |
| $35,000 to $39,999 | 7 (1.8%) | 71 (15.4%) |
| $40,000 to $44,999 | 23 (6.1%) | 12 (2.6%) |
| $45,000 to $49,999 | 15 (4.0%) | 7 (1.5%) |
| $50,000 to $54,999 | 11 (2.9%) | 15 (3.3%) |
| $55,000 to $64,999 | 17 (4.5%) | 10 (2.2%) |
| $65,000 to $74,999 | 31 (8.2%) | 9 (1.9%) |
| $75,000 to $99,999 | 16 (4.2%) | 17 (3.7%) |
| $100,000+ | 94 (24.8%) | 0 (0.0%) |
| Total | 379 (100.0%) | 462 (100.0%) |
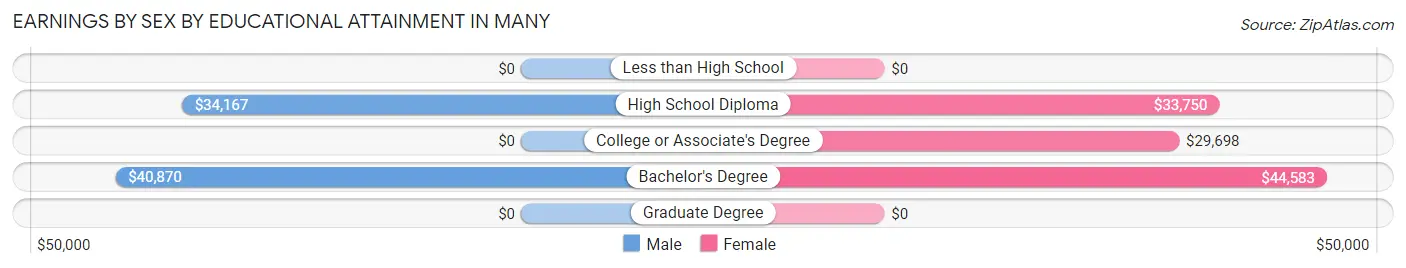
Earnings by Sex by Educational Attainment in Many
Average earnings in Many are $51,875 for men and $28,929 for women, a difference of 44.2%. Men with an educational attainment of bachelor's degree enjoy the highest average annual earnings of $40,870, while those with high school diploma education earn the least with $34,167. Women with an educational attainment of bachelor's degree earn the most with the average annual earnings of $44,583, while those with college or associate's degree education have the smallest earnings of $29,698.
| Educational Attainment | Male Income | Female Income |
| Less than High School | - | - |
| High School Diploma | $34,167 | $33,750 |
| College or Associate's Degree | - | - |
| Bachelor's Degree | $40,870 | $44,583 |
| Graduate Degree | - | - |
| Total | $51,875 | $28,929 |
Family Income in Many
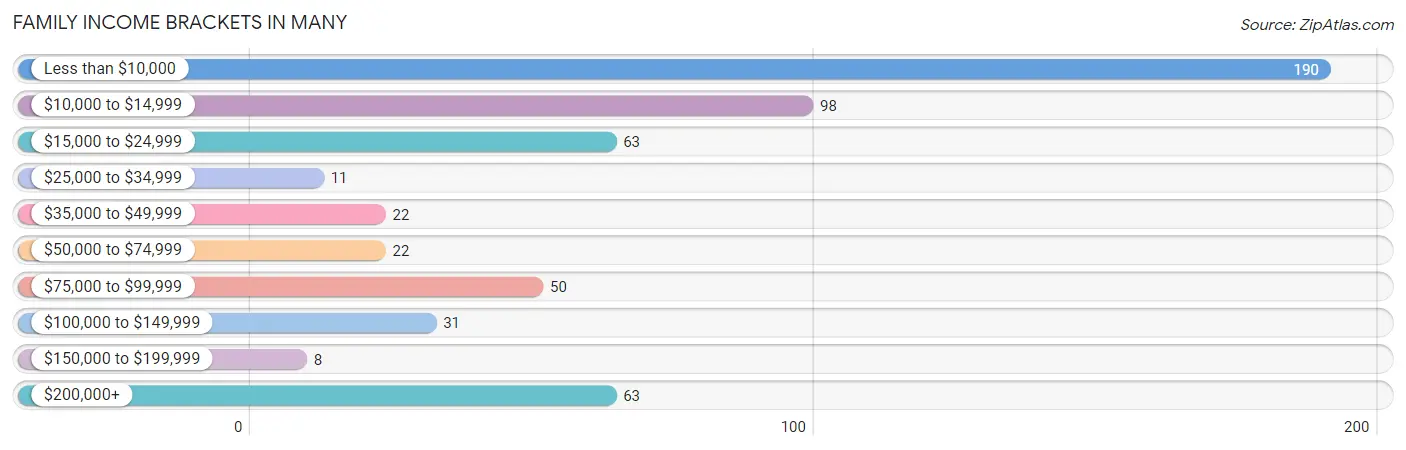
Family Income Brackets in Many
According to the Many family income data, there are 190 families falling into the less than $10,000 income range, which is the most common income bracket and makes up 34.1% of all families. Conversely, the $150,000 to $199,999 income bracket is the least frequent group with only 8 families (1.4%) belonging to this category.
| Income Bracket | # Families | % Families |
| Less than $10,000 | 190 | 34.1% |
| $10,000 to $14,999 | 98 | 17.6% |
| $15,000 to $24,999 | 63 | 11.3% |
| $25,000 to $34,999 | 11 | 2.0% |
| $35,000 to $49,999 | 22 | 3.9% |
| $50,000 to $74,999 | 22 | 3.9% |
| $75,000 to $99,999 | 50 | 9.0% |
| $100,000 to $149,999 | 31 | 5.6% |
| $150,000 to $199,999 | 8 | 1.4% |
| $200,000+ | 63 | 11.3% |
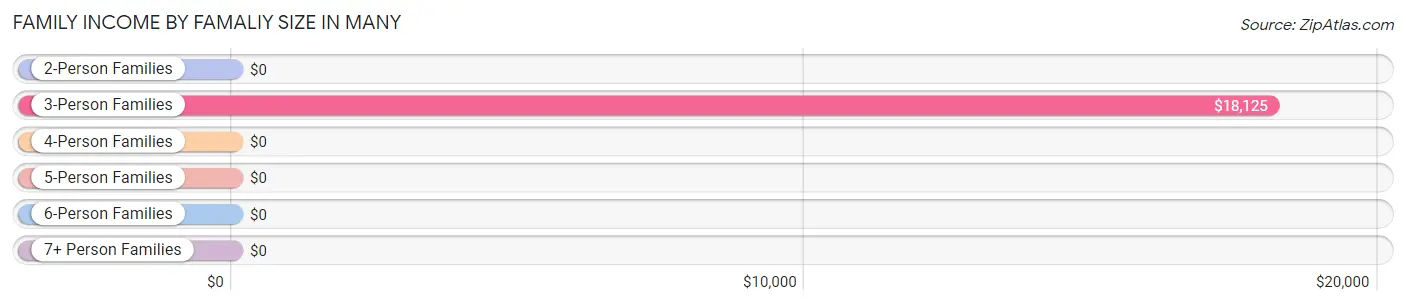
Family Income by Famaliy Size in Many
3-person families (147 | 26.3%) account for the highest median family income in Many with $18,125 per family, while 3-person families (147 | 26.3%) have the highest median income of $6,042 per family member.
| Income Bracket | # Families | Median Income |
| 2-Person Families | 287 (51.4%) | $0 |
| 3-Person Families | 147 (26.3%) | $18,125 |
| 4-Person Families | 100 (17.9%) | $0 |
| 5-Person Families | 24 (4.3%) | $0 |
| 6-Person Families | 0 (0.0%) | $0 |
| 7+ Person Families | 0 (0.0%) | $0 |
| Total | 558 (100.0%) | $14,438 |
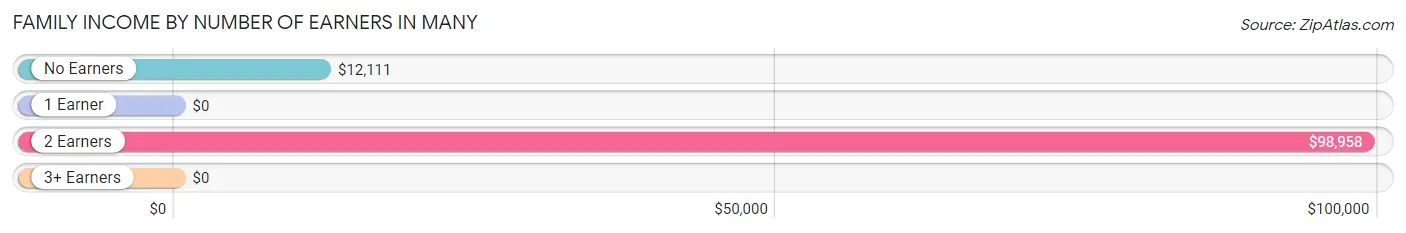
Family Income by Number of Earners in Many
| Number of Earners | # Families | Median Income |
| No Earners | 242 (43.4%) | $12,111 |
| 1 Earner | 259 (46.4%) | $0 |
| 2 Earners | 48 (8.6%) | $98,958 |
| 3+ Earners | 9 (1.6%) | $0 |
| Total | 558 (100.0%) | $14,438 |
Household Income in Many
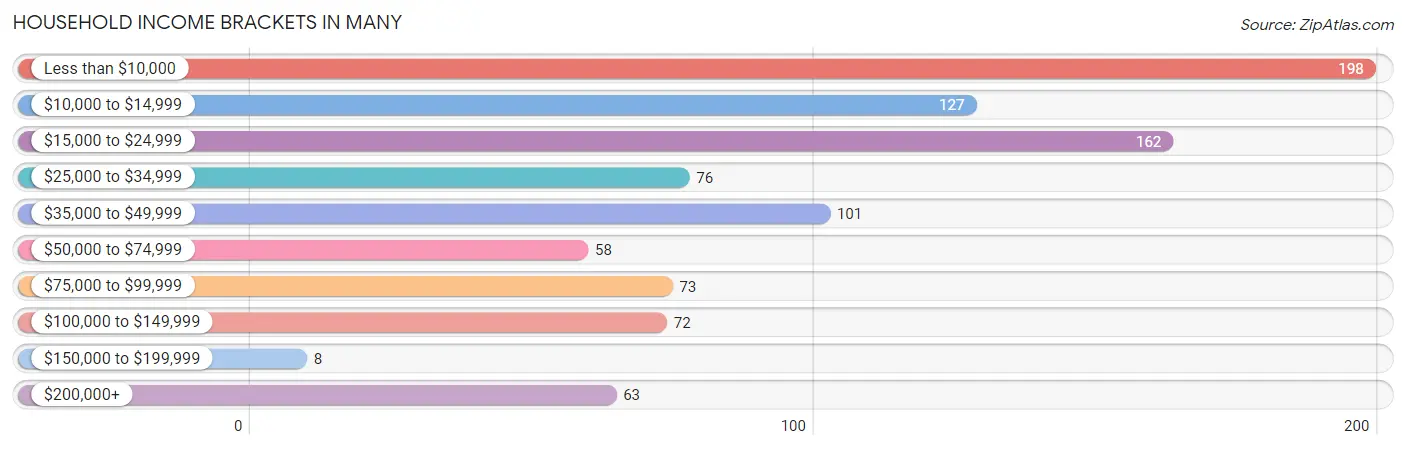
Household Income Brackets in Many
With 198 households falling in the category, the less than $10,000 income range is the most frequent in Many, accounting for 21.1% of all households. In contrast, only 8 households (0.9%) fall into the $150,000 to $199,999 income bracket, making it the least populous group.
| Income Bracket | # Households | % Households |
| Less than $10,000 | 198 | 21.1% |
| $10,000 to $14,999 | 127 | 13.5% |
| $15,000 to $24,999 | 162 | 17.3% |
| $25,000 to $34,999 | 76 | 8.1% |
| $35,000 to $49,999 | 101 | 10.8% |
| $50,000 to $74,999 | 58 | 6.2% |
| $75,000 to $99,999 | 73 | 7.8% |
| $100,000 to $149,999 | 72 | 7.7% |
| $150,000 to $199,999 | 8 | 0.9% |
| $200,000+ | 63 | 6.7% |
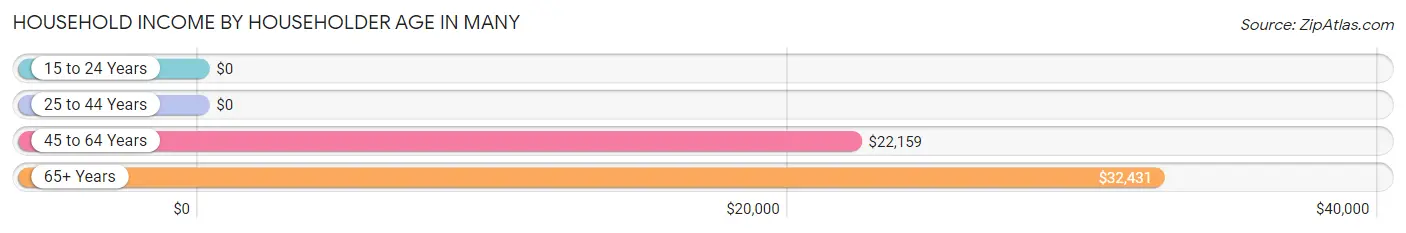
Household Income by Householder Age in Many
The median household income in Many is $22,260, with the highest median household income of $32,431 found in the 65+ years age bracket for the primary householder. A total of 279 households (29.7%) fall into this category. Meanwhile, the 15 to 24 years age bracket for the primary householder has the lowest median household income of $0, with 39 households (4.2%) in this group.
| Income Bracket | # Households | Median Income |
| 15 to 24 Years | 39 (4.2%) | $0 |
| 25 to 44 Years | 367 (39.1%) | $0 |
| 45 to 64 Years | 253 (27.0%) | $22,159 |
| 65+ Years | 279 (29.7%) | $32,431 |
| Total | 938 (100.0%) | $22,260 |
Poverty in Many
Income Below Poverty by Sex and Age in Many
With 50.8% poverty level for males and 48.0% for females among the residents of Many, under 5 year old males and 6 to 11 year old females are the most vulnerable to poverty, with 84 males (100.0%) and 97 females (100.0%) in their respective age groups living below the poverty level.
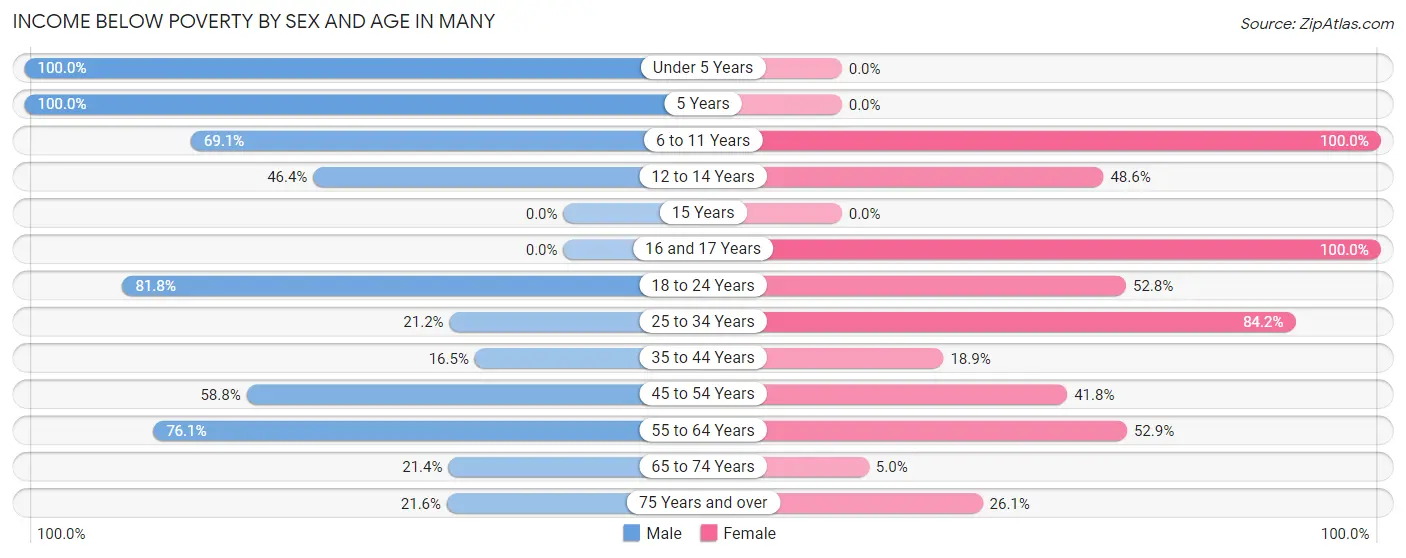
| Age Bracket | Male | Female |
| Under 5 Years | 84 (100.0%) | 0 (0.0%) |
| 5 Years | 19 (100.0%) | 0 (0.0%) |
| 6 to 11 Years | 47 (69.1%) | 97 (100.0%) |
| 12 to 14 Years | 39 (46.4%) | 34 (48.6%) |
| 15 Years | 0 (0.0%) | 0 (0.0%) |
| 16 and 17 Years | 0 (0.0%) | 33 (100.0%) |
| 18 to 24 Years | 117 (81.8%) | 86 (52.8%) |
| 25 to 34 Years | 22 (21.1%) | 170 (84.2%) |
| 35 to 44 Years | 25 (16.5%) | 27 (18.9%) |
| 45 to 54 Years | 90 (58.8%) | 59 (41.8%) |
| 55 to 64 Years | 51 (76.1%) | 72 (52.9%) |
| 65 to 74 Years | 19 (21.3%) | 10 (5.0%) |
| 75 Years and over | 8 (21.6%) | 23 (26.1%) |
| Total | 521 (50.8%) | 611 (48.0%) |
Income Above Poverty by Sex and Age in Many
According to the poverty statistics in Many, males aged 16 and 17 years and females aged 65 to 74 years are the age groups that are most secure financially, with 100.0% of males and 95.0% of females in these age groups living above the poverty line.
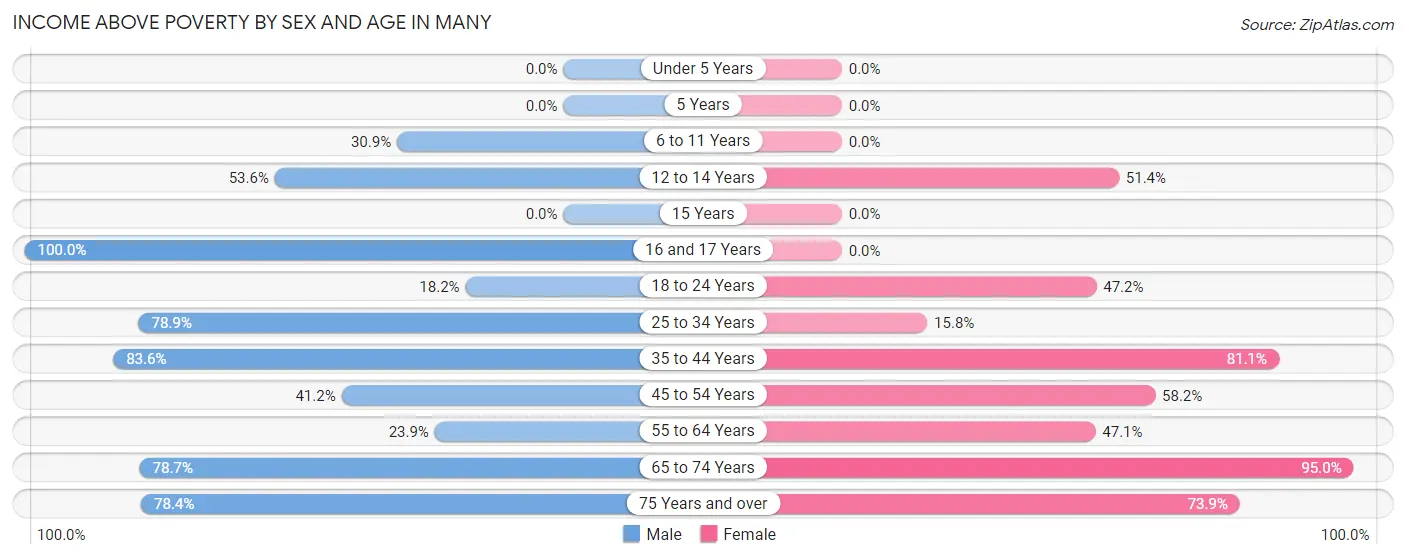
| Age Bracket | Male | Female |
| Under 5 Years | 0 (0.0%) | 0 (0.0%) |
| 5 Years | 0 (0.0%) | 0 (0.0%) |
| 6 to 11 Years | 21 (30.9%) | 0 (0.0%) |
| 12 to 14 Years | 45 (53.6%) | 36 (51.4%) |
| 15 Years | 0 (0.0%) | 0 (0.0%) |
| 16 and 17 Years | 26 (100.0%) | 0 (0.0%) |
| 18 to 24 Years | 26 (18.2%) | 77 (47.2%) |
| 25 to 34 Years | 82 (78.8%) | 32 (15.8%) |
| 35 to 44 Years | 127 (83.6%) | 116 (81.1%) |
| 45 to 54 Years | 63 (41.2%) | 82 (58.2%) |
| 55 to 64 Years | 16 (23.9%) | 64 (47.1%) |
| 65 to 74 Years | 70 (78.6%) | 189 (95.0%) |
| 75 Years and over | 29 (78.4%) | 65 (73.9%) |
| Total | 505 (49.2%) | 661 (52.0%) |
Income Below Poverty Among Married-Couple Families in Many
The poverty statistics for married-couple families in Many show that 29.0% or 58 of the total 200 families live below the poverty line. Families with 1 or 2 children have the highest poverty rate of 43.2%, comprising of 16 families. On the other hand, families with 3 or 4 children have the lowest poverty rate of 0.0%, which includes 0 families.
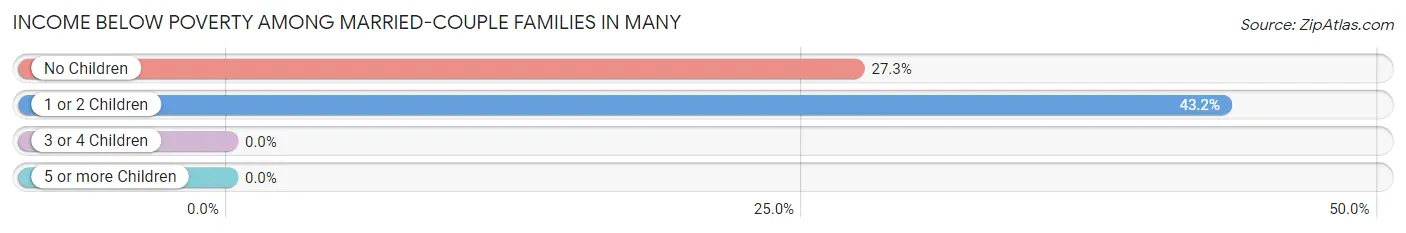
| Children | Above Poverty | Below Poverty |
| No Children | 112 (72.7%) | 42 (27.3%) |
| 1 or 2 Children | 21 (56.8%) | 16 (43.2%) |
| 3 or 4 Children | 9 (100.0%) | 0 (0.0%) |
| 5 or more Children | 0 (0.0%) | 0 (0.0%) |
| Total | 142 (71.0%) | 58 (29.0%) |
Income Below Poverty Among Single-Parent Households in Many
According to the poverty data in Many, 82.0% or 50 single-father households and 75.4% or 224 single-mother households are living below the poverty line. Among single-father households, those with no children have the highest poverty rate, with 50 households (82.0%) experiencing poverty. Likewise, among single-mother households, those with 3 or 4 children have the highest poverty rate, with 67 households (100.0%) falling below the poverty line.
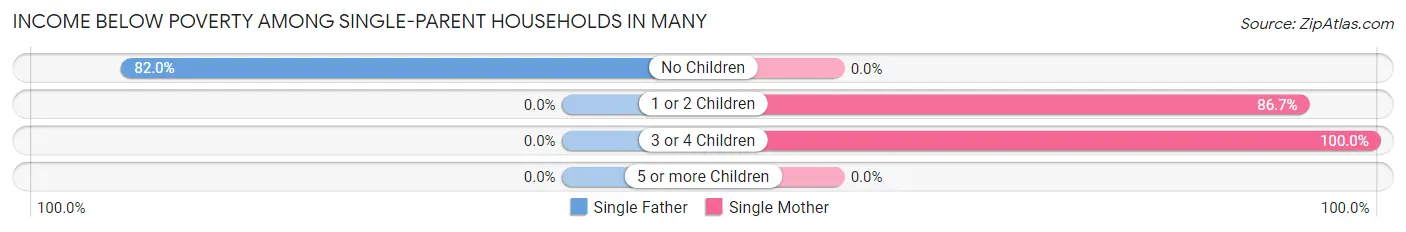
| Children | Single Father | Single Mother |
| No Children | 50 (82.0%) | 0 (0.0%) |
| 1 or 2 Children | 0 (0.0%) | 157 (86.7%) |
| 3 or 4 Children | 0 (0.0%) | 67 (100.0%) |
| 5 or more Children | 0 (0.0%) | 0 (0.0%) |
| Total | 50 (82.0%) | 224 (75.4%) |
Income Below Poverty Among Married-Couple vs Single-Parent Households in Many
The poverty data for Many shows that 58 of the married-couple family households (29.0%) and 274 of the single-parent households (76.5%) are living below the poverty level. Within the married-couple family households, those with 1 or 2 children have the highest poverty rate, with 16 households (43.2%) falling below the poverty line. Among the single-parent households, those with 3 or 4 children have the highest poverty rate, with 67 household (100.0%) living below poverty.
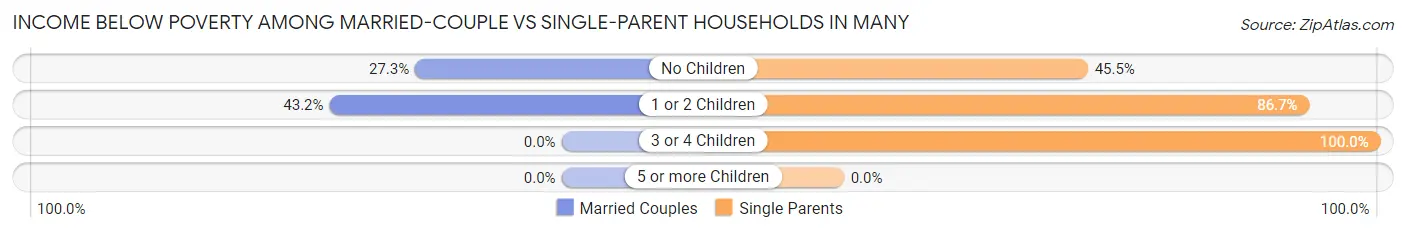
| Children | Married-Couple Families | Single-Parent Households |
| No Children | 42 (27.3%) | 50 (45.5%) |
| 1 or 2 Children | 16 (43.2%) | 157 (86.7%) |
| 3 or 4 Children | 0 (0.0%) | 67 (100.0%) |
| 5 or more Children | 0 (0.0%) | 0 (0.0%) |
| Total | 58 (29.0%) | 274 (76.5%) |
Race in Many
The most populous races in Many are Black / African American (1,244 | 48.5%), White / Caucasian (1,220 | 47.5%), and Two or more Races (70 | 2.7%).
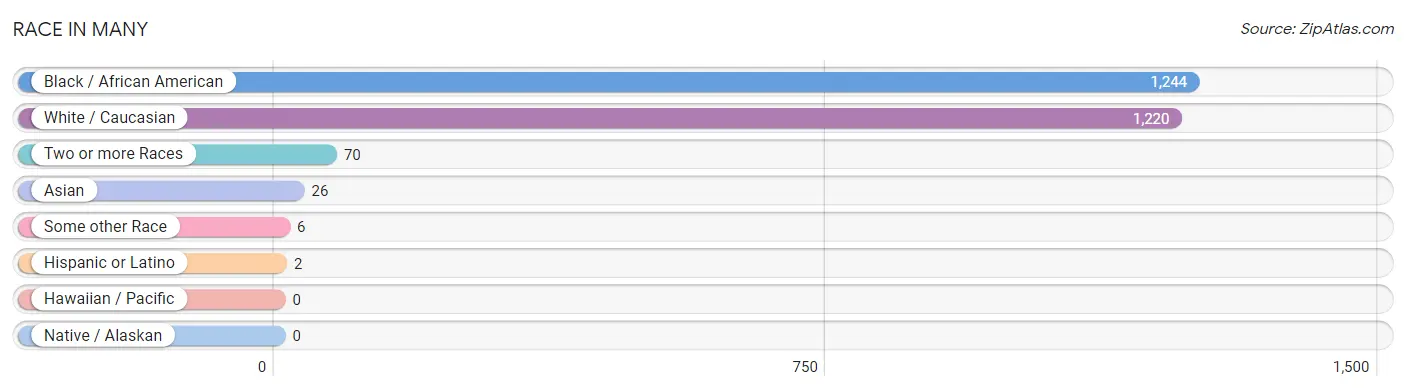
| Race | # Population | % Population |
| Asian | 26 | 1.0% |
| Black / African American | 1,244 | 48.5% |
| Hawaiian / Pacific | 0 | 0.0% |
| Hispanic or Latino | 2 | 0.1% |
| Native / Alaskan | 0 | 0.0% |
| White / Caucasian | 1,220 | 47.5% |
| Two or more Races | 70 | 2.7% |
| Some other Race | 6 | 0.2% |
| Total | 2,566 | 100.0% |
Ancestry in Many
The most populous ancestries reported in Many are American (243 | 9.5%), French (173 | 6.7%), English (138 | 5.4%), Irish (114 | 4.4%), and German (91 | 3.5%), together accounting for 29.6% of all Many residents.
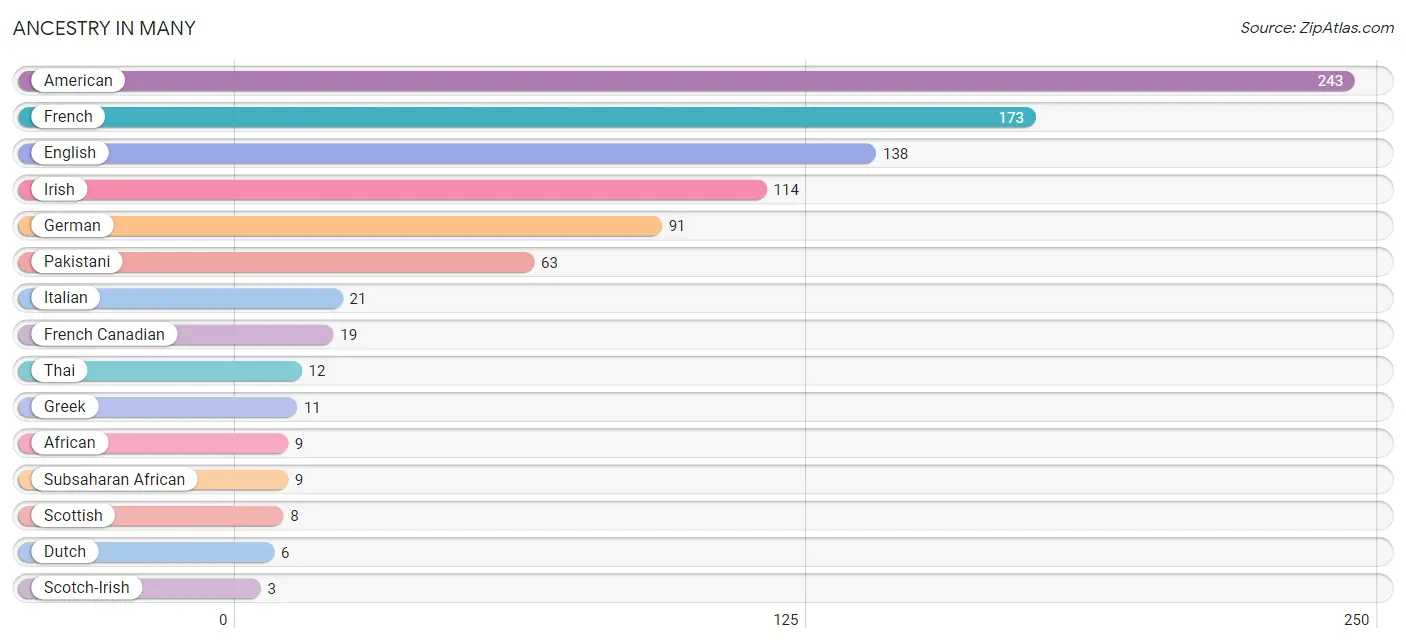
| Ancestry | # Population | % Population |
| African | 9 | 0.4% |
| American | 243 | 9.5% |
| Cheyenne | 1 | 0.0% |
| Dutch | 6 | 0.2% |
| English | 138 | 5.4% |
| French | 173 | 6.7% |
| French Canadian | 19 | 0.7% |
| German | 91 | 3.5% |
| Greek | 11 | 0.4% |
| Irish | 114 | 4.4% |
| Italian | 21 | 0.8% |
| Pakistani | 63 | 2.5% |
| Scotch-Irish | 3 | 0.1% |
| Scottish | 8 | 0.3% |
| Spaniard | 1 | 0.0% |
| Spanish | 1 | 0.0% |
| Sri Lankan | 1 | 0.0% |
| Subsaharan African | 9 | 0.4% |
| Thai | 12 | 0.5% | View All 19 Rows |
Immigrants in Many
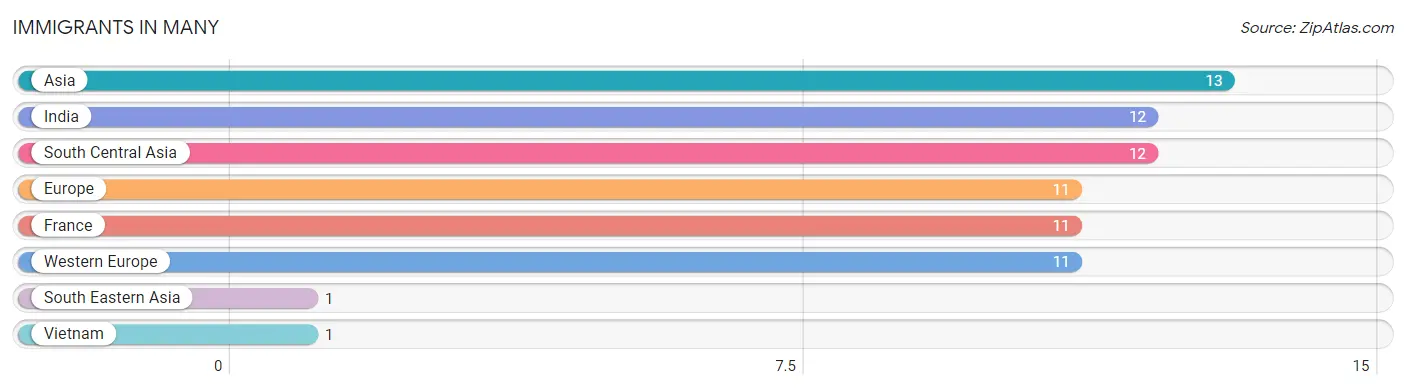
The most numerous immigrant groups reported in Many came from Asia (13 | 0.5%), India (12 | 0.5%), South Central Asia (12 | 0.5%), Europe (11 | 0.4%), and France (11 | 0.4%), together accounting for 2.3% of all Many residents.
| Immigration Origin | # Population | % Population |
| Asia | 13 | 0.5% |
| Europe | 11 | 0.4% |
| France | 11 | 0.4% |
| India | 12 | 0.5% |
| South Central Asia | 12 | 0.5% |
| South Eastern Asia | 1 | 0.0% |
| Vietnam | 1 | 0.0% |
| Western Europe | 11 | 0.4% | View All 8 Rows |
Sex and Age in Many
Sex and Age in Many
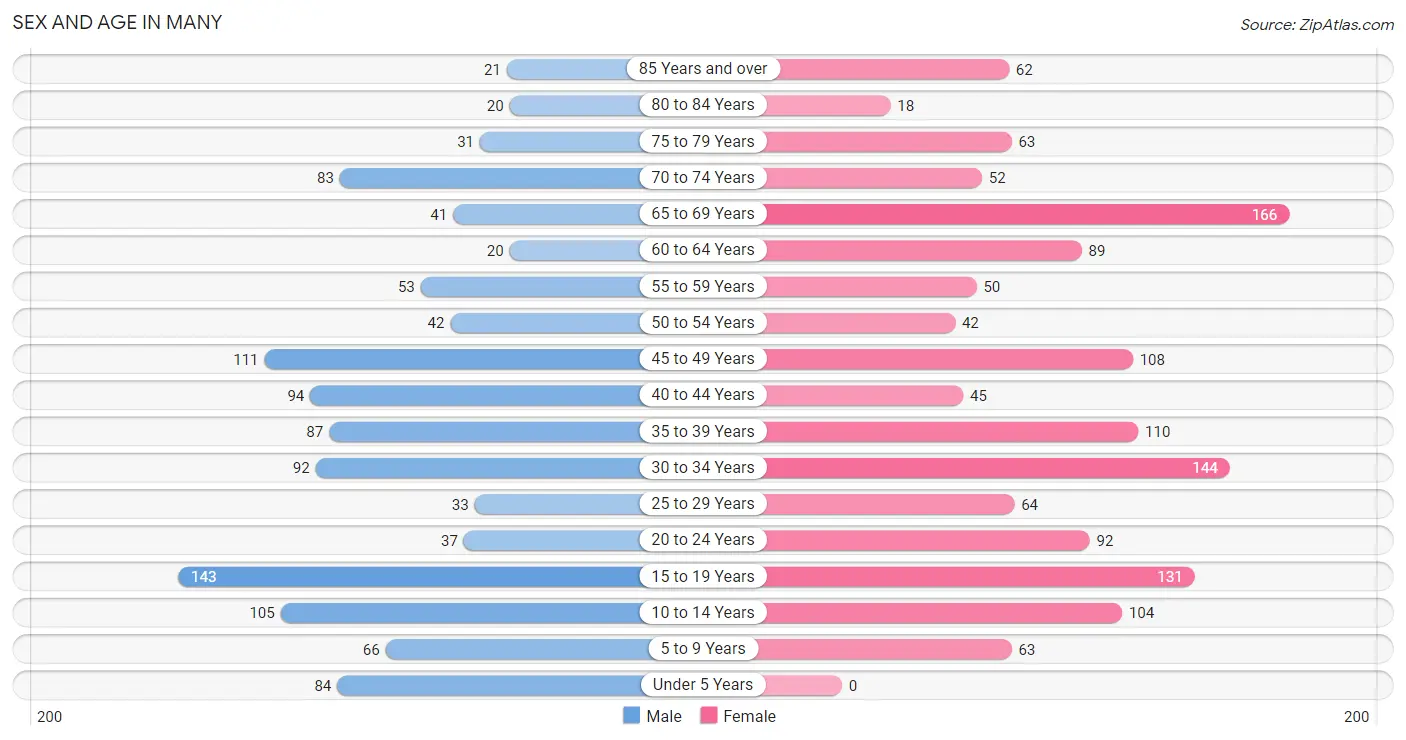
The most populous age groups in Many are 15 to 19 Years (143 | 12.3%) for men and 65 to 69 Years (166 | 11.8%) for women.
| Age Bracket | Male | Female |
| Under 5 Years | 84 (7.2%) | 0 (0.0%) |
| 5 to 9 Years | 66 (5.7%) | 63 (4.5%) |
| 10 to 14 Years | 105 (9.0%) | 104 (7.4%) |
| 15 to 19 Years | 143 (12.3%) | 131 (9.3%) |
| 20 to 24 Years | 37 (3.2%) | 92 (6.6%) |
| 25 to 29 Years | 33 (2.8%) | 64 (4.6%) |
| 30 to 34 Years | 92 (7.9%) | 144 (10.3%) |
| 35 to 39 Years | 87 (7.5%) | 110 (7.8%) |
| 40 to 44 Years | 94 (8.1%) | 45 (3.2%) |
| 45 to 49 Years | 111 (9.5%) | 108 (7.7%) |
| 50 to 54 Years | 42 (3.6%) | 42 (3.0%) |
| 55 to 59 Years | 53 (4.6%) | 50 (3.6%) |
| 60 to 64 Years | 20 (1.7%) | 89 (6.3%) |
| 65 to 69 Years | 41 (3.5%) | 166 (11.8%) |
| 70 to 74 Years | 83 (7.1%) | 52 (3.7%) |
| 75 to 79 Years | 31 (2.7%) | 63 (4.5%) |
| 80 to 84 Years | 20 (1.7%) | 18 (1.3%) |
| 85 Years and over | 21 (1.8%) | 62 (4.4%) |
| Total | 1,163 (100.0%) | 1,403 (100.0%) |
Families and Households in Many
Median Family Size in Many
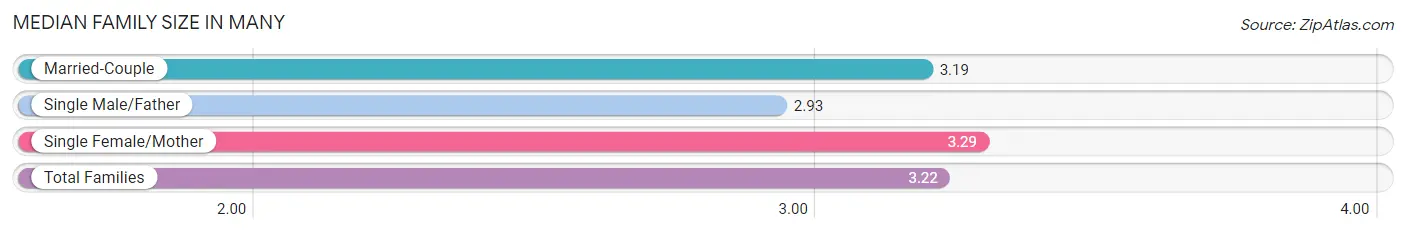
The median family size in Many is 3.22 persons per family, with single female/mother families (297 | 53.2%) accounting for the largest median family size of 3.29 persons per family. On the other hand, single male/father families (61 | 10.9%) represent the smallest median family size with 2.93 persons per family.
| Family Type | # Families | Family Size |
| Married-Couple | 200 (35.8%) | 3.19 |
| Single Male/Father | 61 (10.9%) | 2.93 |
| Single Female/Mother | 297 (53.2%) | 3.29 |
| Total Families | 558 (100.0%) | 3.22 |
Median Household Size in Many
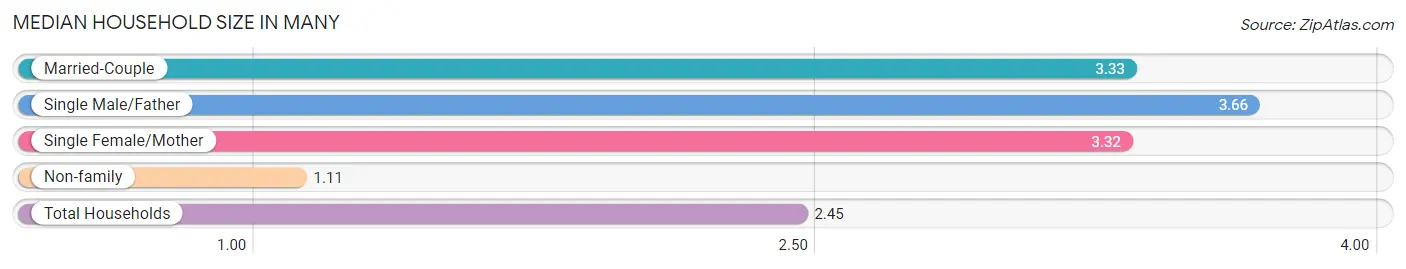
The median household size in Many is 2.45 persons per household, with single male/father households (61 | 6.5%) accounting for the largest median household size of 3.66 persons per household. non-family households (380 | 40.5%) represent the smallest median household size with 1.11 persons per household.
| Household Type | # Households | Household Size |
| Married-Couple | 200 (21.3%) | 3.33 |
| Single Male/Father | 61 (6.5%) | 3.66 |
| Single Female/Mother | 297 (31.7%) | 3.32 |
| Non-family | 380 (40.5%) | 1.11 |
| Total Households | 938 (100.0%) | 2.45 |
Household Size by Marriage Status in Many
Out of a total of 938 households in Many, 558 (59.5%) are family households, while 380 (40.5%) are nonfamily households. The most numerous type of family households are 2-person households, comprising 243, and the most common type of nonfamily households are 1-person households, comprising 362.
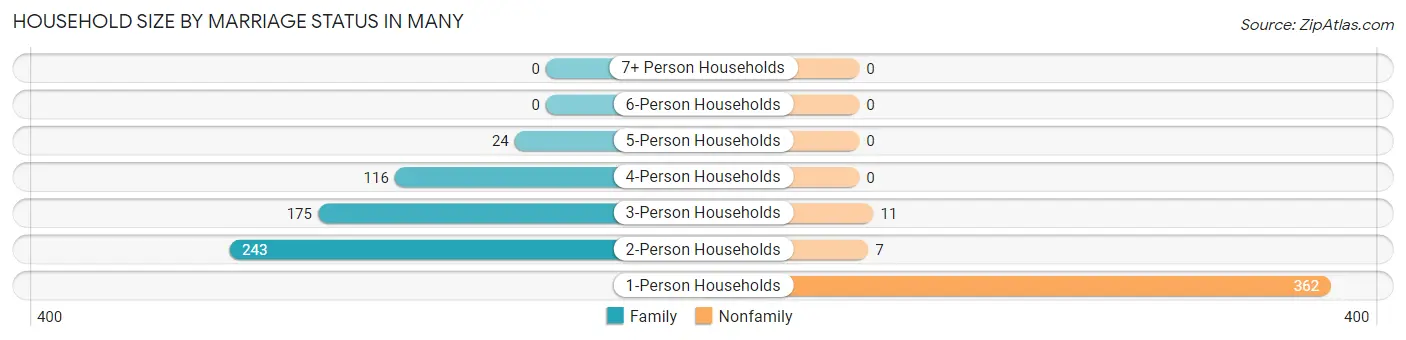
| Household Size | Family Households | Nonfamily Households |
| 1-Person Households | - | 362 (38.6%) |
| 2-Person Households | 243 (25.9%) | 7 (0.7%) |
| 3-Person Households | 175 (18.7%) | 11 (1.2%) |
| 4-Person Households | 116 (12.4%) | 0 (0.0%) |
| 5-Person Households | 24 (2.6%) | 0 (0.0%) |
| 6-Person Households | 0 (0.0%) | 0 (0.0%) |
| 7+ Person Households | 0 (0.0%) | 0 (0.0%) |
| Total | 558 (59.5%) | 380 (40.5%) |
Female Fertility in Many
Fertility by Age in Many
Average fertility rate in Many is 99.0 births per 1,000 women. Women in the age bracket of 35 to 50 years have the highest fertility rate with 205.0 births per 1,000 women. Women in the age bracket of 35 to 50 years acount for 78.3% of all women with births.
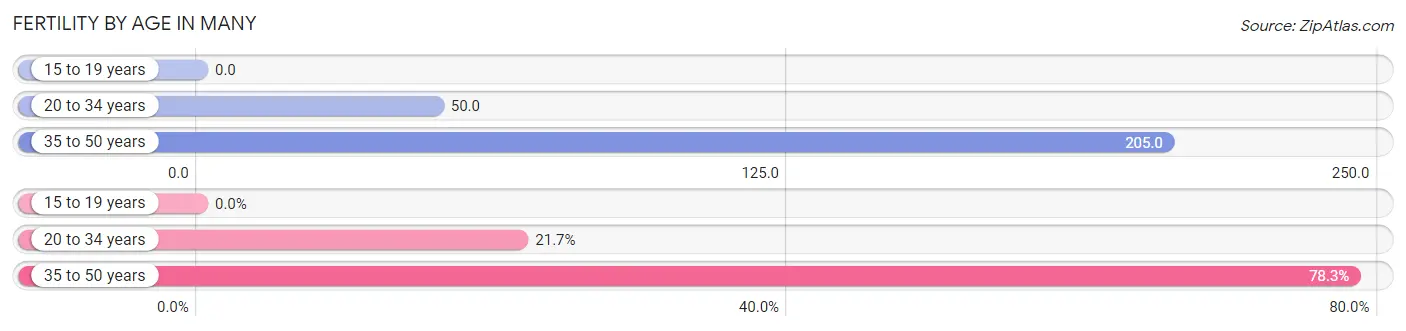
| Age Bracket | Women with Births | Births / 1,000 Women |
| 15 to 19 years | 0 (0.0%) | 0.0 |
| 20 to 34 years | 15 (21.7%) | 50.0 |
| 35 to 50 years | 54 (78.3%) | 205.0 |
| Total | 69 (100.0%) | 99.0 |
Fertility by Age by Marriage Status in Many
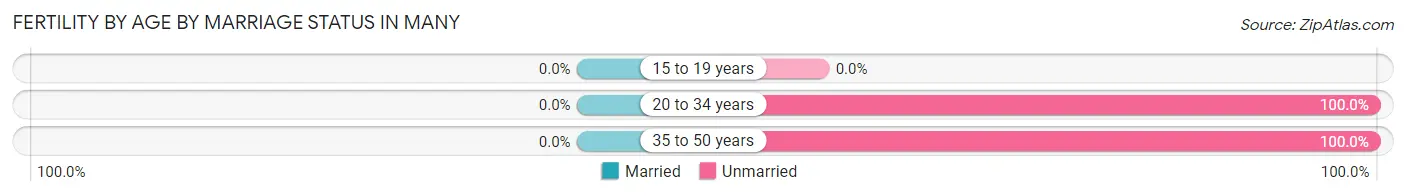
| Age Bracket | Married | Unmarried |
| 15 to 19 years | 0 (0.0%) | 0 (0.0%) |
| 20 to 34 years | 0 (0.0%) | 15 (100.0%) |
| 35 to 50 years | 0 (0.0%) | 54 (100.0%) |
| Total | 0 (0.0%) | 69 (100.0%) |
Fertility by Education in Many
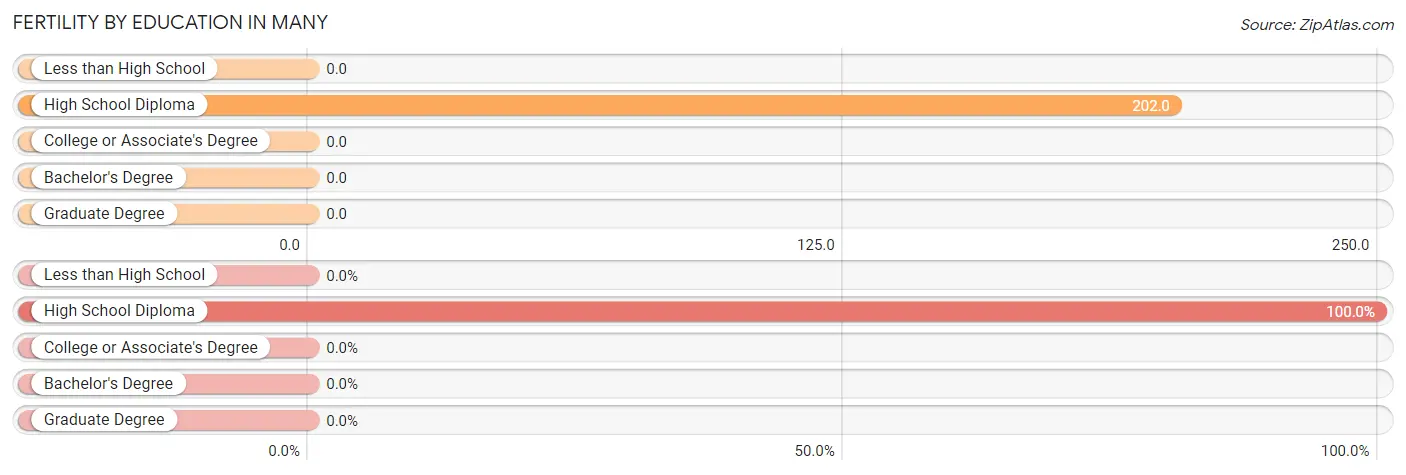
| Educational Attainment | Women with Births | Births / 1,000 Women |
| Less than High School | 0 (0.0%) | 0.0 |
| High School Diploma | 69 (100.0%) | 202.0 |
| College or Associate's Degree | 0 (0.0%) | 0.0 |
| Bachelor's Degree | 0 (0.0%) | 0.0 |
| Graduate Degree | 0 (0.0%) | 0.0 |
| Total | 69 (100.0%) | 99.0 |
Fertility by Education by Marriage Status in Many
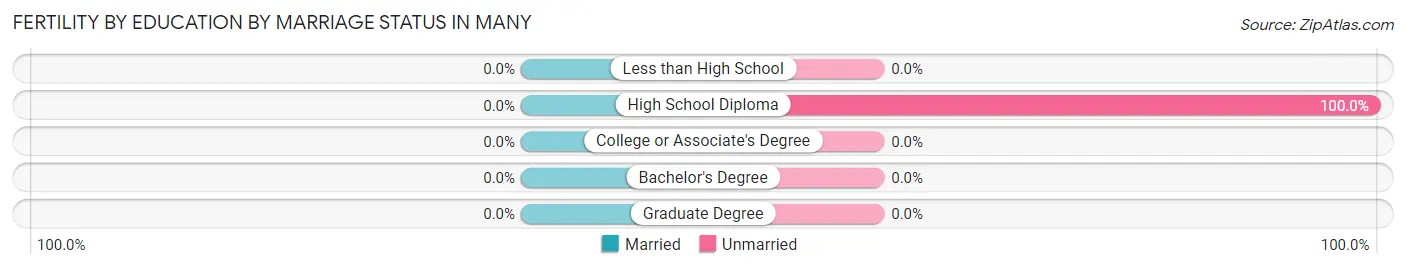
| Educational Attainment | Married | Unmarried |
| Less than High School | 0 (0.0%) | 0 (0.0%) |
| High School Diploma | 0 (0.0%) | 69 (100.0%) |
| College or Associate's Degree | 0 (0.0%) | 0 (0.0%) |
| Bachelor's Degree | 0 (0.0%) | 0 (0.0%) |
| Graduate Degree | 0 (0.0%) | 0 (0.0%) |
| Total | 0 (0.0%) | 69 (100.0%) |
Employment Characteristics in Many
Employment by Class of Employer in Many
Among the 754 employed individuals in Many, private company employees (641 | 85.0%), local government employees (49 | 6.5%), and federal government employees (24 | 3.2%) make up the most common classes of employment.
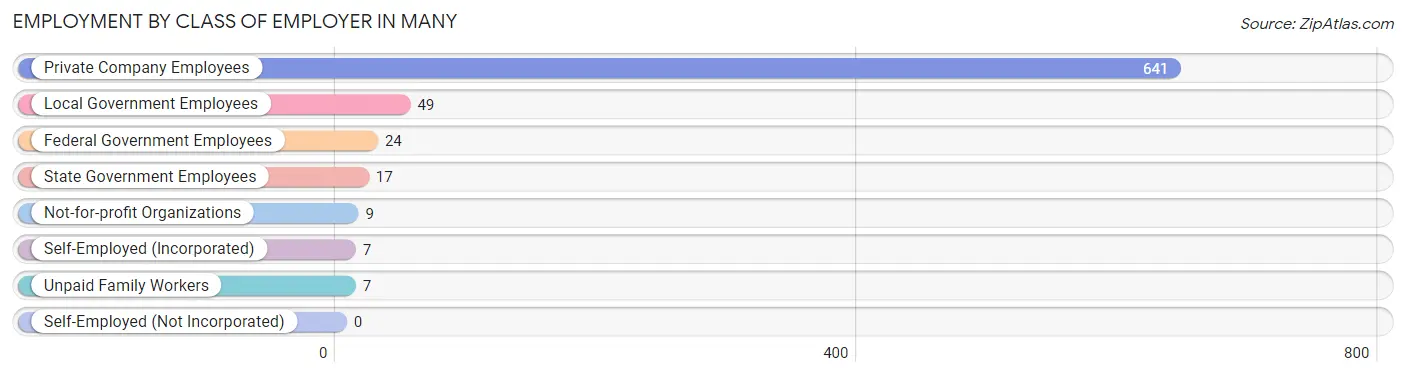
| Employer Class | # Employees | % Employees |
| Private Company Employees | 641 | 85.0% |
| Self-Employed (Incorporated) | 7 | 0.9% |
| Self-Employed (Not Incorporated) | 0 | 0.0% |
| Not-for-profit Organizations | 9 | 1.2% |
| Local Government Employees | 49 | 6.5% |
| State Government Employees | 17 | 2.2% |
| Federal Government Employees | 24 | 3.2% |
| Unpaid Family Workers | 7 | 0.9% |
| Total | 754 | 100.0% |
Employment Status by Age in Many
According to the labor force statistics for Many, out of the total population over 16 years of age (2,144), 38.3% or 821 individuals are in the labor force, with 8.3% or 68 of them unemployed. The age group with the highest labor force participation rate is 20 to 24 years, with 70.5% or 91 individuals in the labor force. Within the labor force, the 16 to 19 years age range has the highest percentage of unemployed individuals, with 24.7% or 19 of them being unemployed.
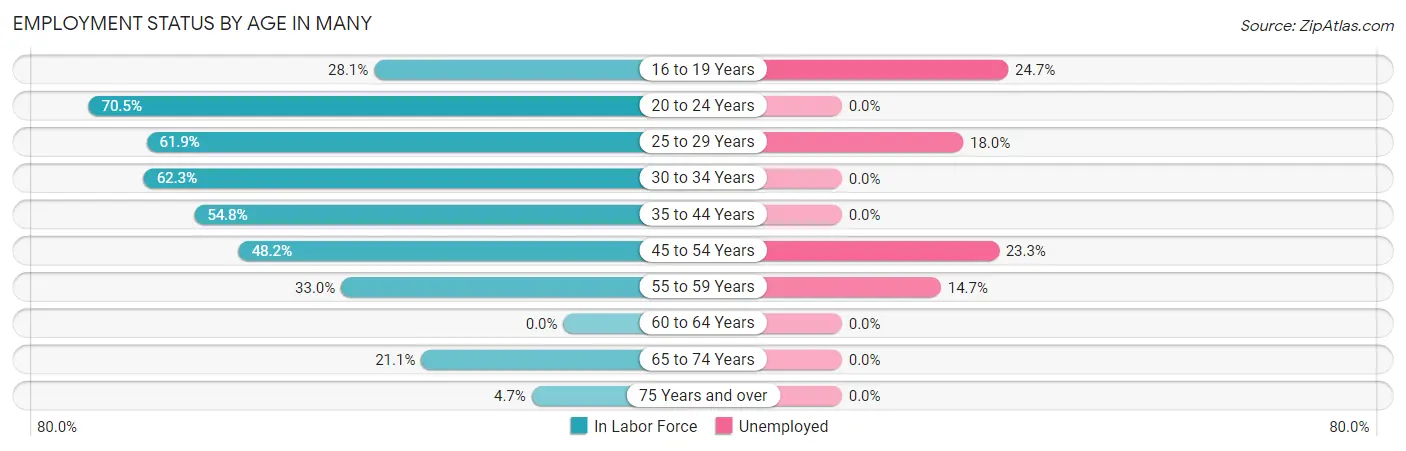
| Age Bracket | In Labor Force | Unemployed |
| 16 to 19 Years | 77 (28.1%) | 19 (24.7%) |
| 20 to 24 Years | 91 (70.5%) | 0 (0.0%) |
| 25 to 29 Years | 60 (61.9%) | 11 (18.0%) |
| 30 to 34 Years | 147 (62.3%) | 0 (0.0%) |
| 35 to 44 Years | 184 (54.8%) | 0 (0.0%) |
| 45 to 54 Years | 146 (48.2%) | 34 (23.3%) |
| 55 to 59 Years | 34 (33.0%) | 5 (14.7%) |
| 60 to 64 Years | 0 (0.0%) | 0 (0.0%) |
| 65 to 74 Years | 72 (21.1%) | 0 (0.0%) |
| 75 Years and over | 10 (4.7%) | 0 (0.0%) |
| Total | 821 (38.3%) | 68 (8.3%) |
Employment Status by Educational Attainment in Many
According to labor force statistics for Many, 48.2% of individuals (571) out of the total population between 25 and 64 years of age (1,184) are in the labor force, with 8.6% or 49 of them being unemployed. The group with the highest labor force participation rate are those with the educational attainment of bachelor's degree or higher, with 69.3% or 122 individuals in the labor force. Within the labor force, individuals with high school diploma education have the highest percentage of unemployment, with 17.7% or 34 of them being unemployed.
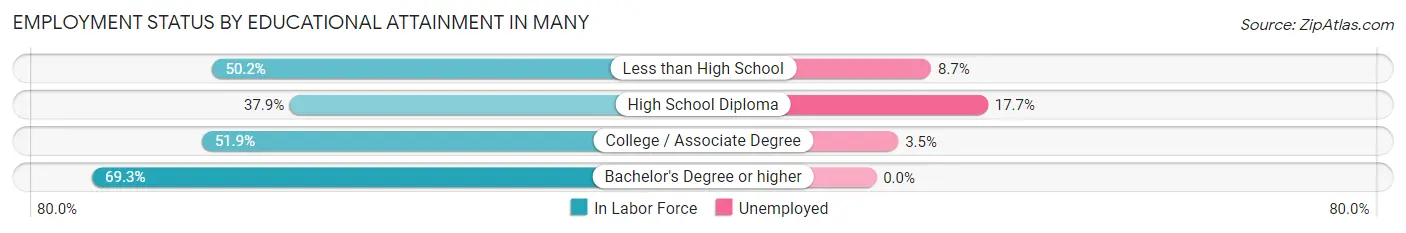
| Educational Attainment | In Labor Force | Unemployed |
| Less than High School | 103 (50.2%) | 18 (8.7%) |
| High School Diploma | 192 (37.9%) | 90 (17.7%) |
| College / Associate Degree | 154 (51.9%) | 10 (3.5%) |
| Bachelor's Degree or higher | 122 (69.3%) | 0 (0.0%) |
| Total | 571 (48.2%) | 102 (8.6%) |
Employment Occupations by Sex in Many
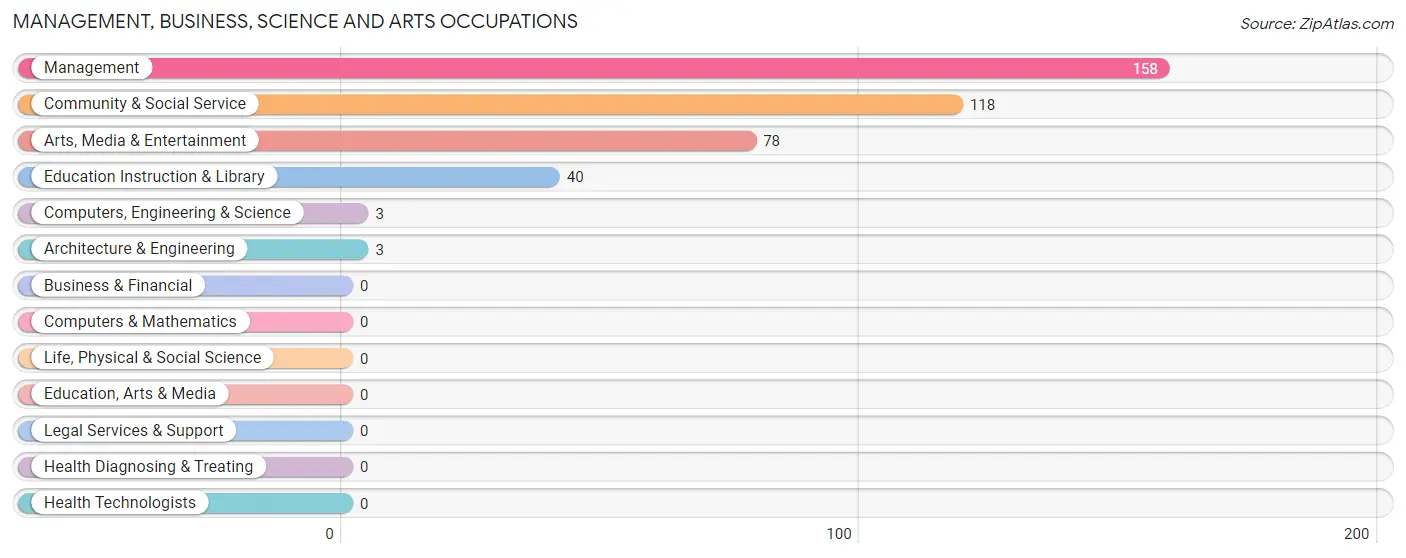
Management, Business, Science and Arts Occupations
The most common Management, Business, Science and Arts occupations in Many are Management (158 | 21.2%), Community & Social Service (118 | 15.9%), Arts, Media & Entertainment (78 | 10.5%), Education Instruction & Library (40 | 5.4%), and Computers, Engineering & Science (3 | 0.4%).
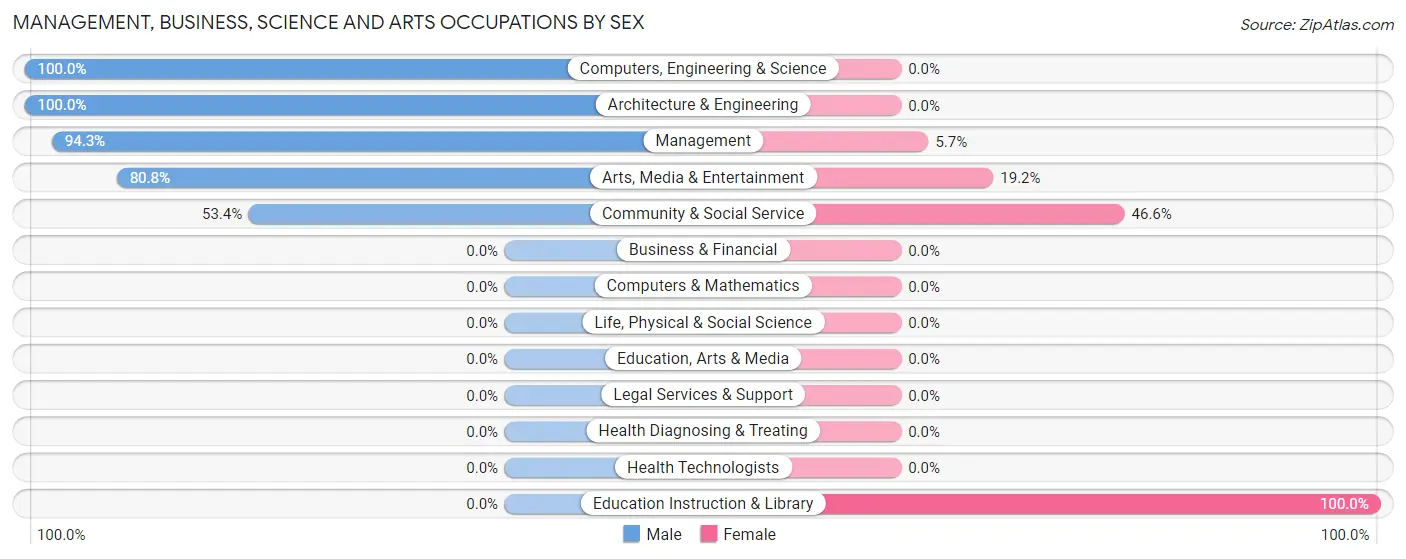
Management, Business, Science and Arts Occupations by Sex
Within the Management, Business, Science and Arts occupations in Many, the most male-oriented occupations are Computers, Engineering & Science (100.0%), Architecture & Engineering (100.0%), and Management (94.3%), while the most female-oriented occupations are Education Instruction & Library (100.0%), Community & Social Service (46.6%), and Arts, Media & Entertainment (19.2%).
| Occupation | Male | Female |
| Management | 149 (94.3%) | 9 (5.7%) |
| Business & Financial | 0 (0.0%) | 0 (0.0%) |
| Computers, Engineering & Science | 3 (100.0%) | 0 (0.0%) |
| Computers & Mathematics | 0 (0.0%) | 0 (0.0%) |
| Architecture & Engineering | 3 (100.0%) | 0 (0.0%) |
| Life, Physical & Social Science | 0 (0.0%) | 0 (0.0%) |
| Community & Social Service | 63 (53.4%) | 55 (46.6%) |
| Education, Arts & Media | 0 (0.0%) | 0 (0.0%) |
| Legal Services & Support | 0 (0.0%) | 0 (0.0%) |
| Education Instruction & Library | 0 (0.0%) | 40 (100.0%) |
| Arts, Media & Entertainment | 63 (80.8%) | 15 (19.2%) |
| Health Diagnosing & Treating | 0 (0.0%) | 0 (0.0%) |
| Health Technologists | 0 (0.0%) | 0 (0.0%) |
| Total (Category) | 215 (77.1%) | 64 (22.9%) |
| Total (Overall) | 318 (42.7%) | 426 (57.3%) |
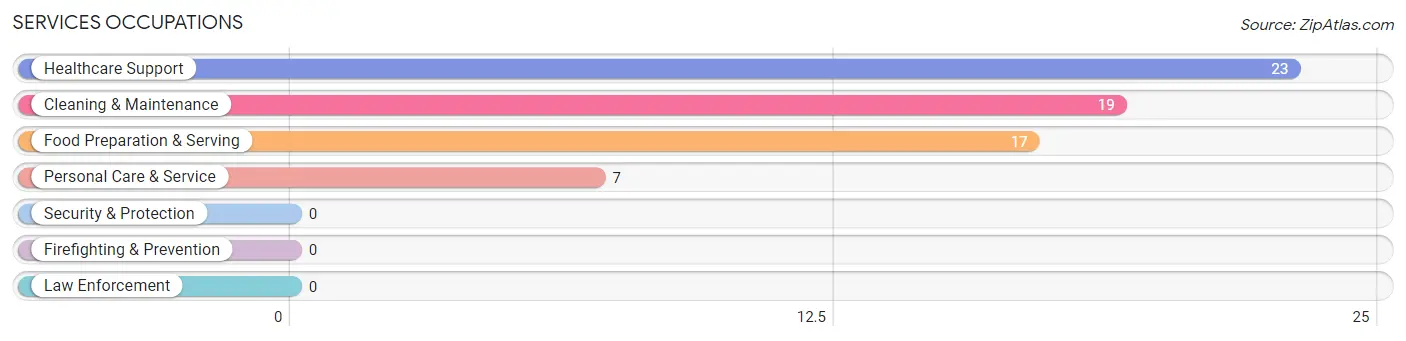
Services Occupations
The most common Services occupations in Many are Healthcare Support (23 | 3.1%), Cleaning & Maintenance (19 | 2.5%), Food Preparation & Serving (17 | 2.3%), and Personal Care & Service (7 | 0.9%).
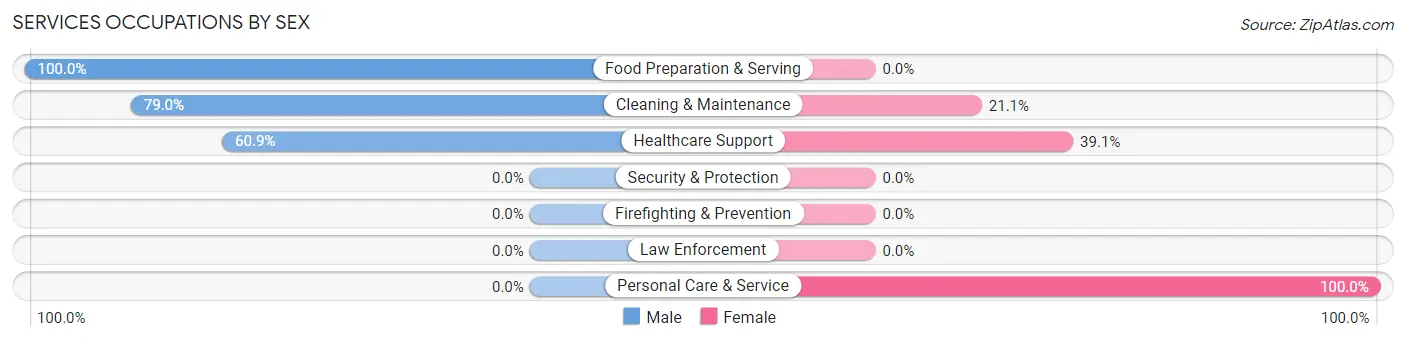
Services Occupations by Sex
Within the Services occupations in Many, the most male-oriented occupations are Food Preparation & Serving (100.0%), Cleaning & Maintenance (78.9%), and Healthcare Support (60.9%), while the most female-oriented occupations are Personal Care & Service (100.0%), Healthcare Support (39.1%), and Cleaning & Maintenance (21.0%).
| Occupation | Male | Female |
| Healthcare Support | 14 (60.9%) | 9 (39.1%) |
| Security & Protection | 0 (0.0%) | 0 (0.0%) |
| Firefighting & Prevention | 0 (0.0%) | 0 (0.0%) |
| Law Enforcement | 0 (0.0%) | 0 (0.0%) |
| Food Preparation & Serving | 17 (100.0%) | 0 (0.0%) |
| Cleaning & Maintenance | 15 (78.9%) | 4 (21.0%) |
| Personal Care & Service | 0 (0.0%) | 7 (100.0%) |
| Total (Category) | 46 (69.7%) | 20 (30.3%) |
| Total (Overall) | 318 (42.7%) | 426 (57.3%) |
Sales and Office Occupations
The most common Sales and Office occupations in Many are Sales & Related (189 | 25.4%), and Office & Administration (92 | 12.4%).
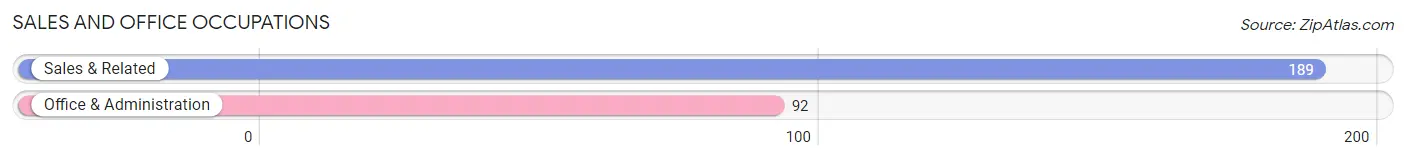
Sales and Office Occupations by Sex
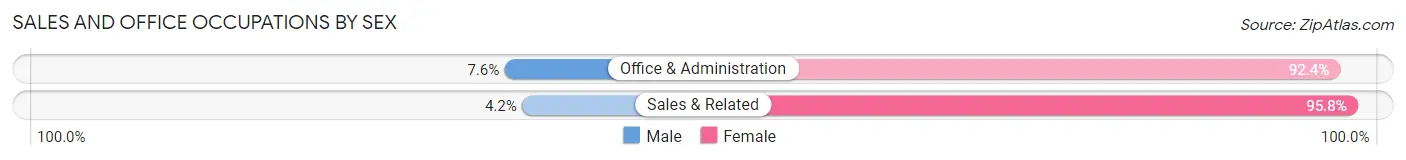
| Occupation | Male | Female |
| Sales & Related | 8 (4.2%) | 181 (95.8%) |
| Office & Administration | 7 (7.6%) | 85 (92.4%) |
| Total (Category) | 15 (5.3%) | 266 (94.7%) |
| Total (Overall) | 318 (42.7%) | 426 (57.3%) |
Natural Resources, Construction and Maintenance Occupations
The most common Natural Resources, Construction and Maintenance occupations in Many are , and Installation, Maintenance & Repair (14 | 1.9%).
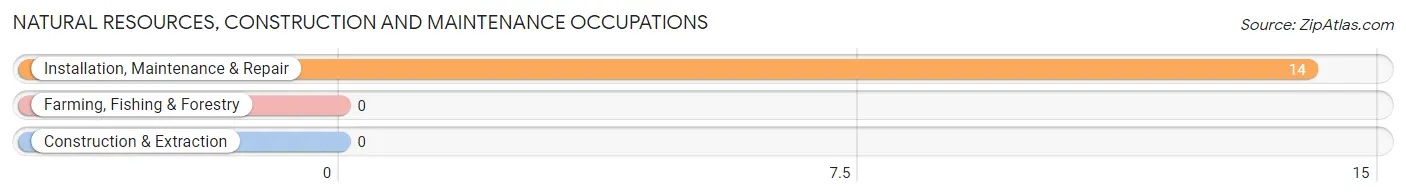
Natural Resources, Construction and Maintenance Occupations by Sex
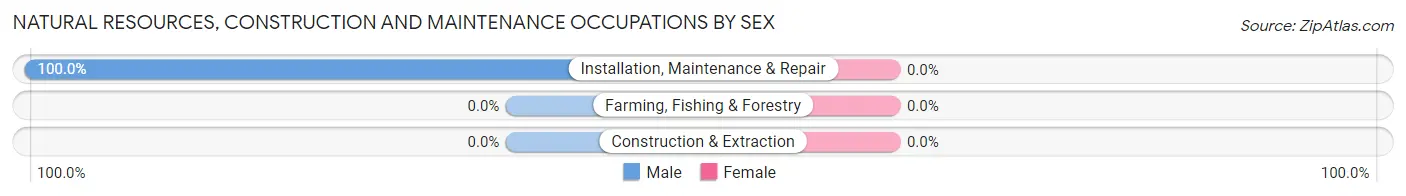
| Occupation | Male | Female |
| Farming, Fishing & Forestry | 0 (0.0%) | 0 (0.0%) |
| Construction & Extraction | 0 (0.0%) | 0 (0.0%) |
| Installation, Maintenance & Repair | 14 (100.0%) | 0 (0.0%) |
| Total (Category) | 14 (100.0%) | 0 (0.0%) |
| Total (Overall) | 318 (42.7%) | 426 (57.3%) |
Production, Transportation and Moving Occupations
The most common Production, Transportation and Moving occupations in Many are Production (72 | 9.7%), and Material Moving (32 | 4.3%).
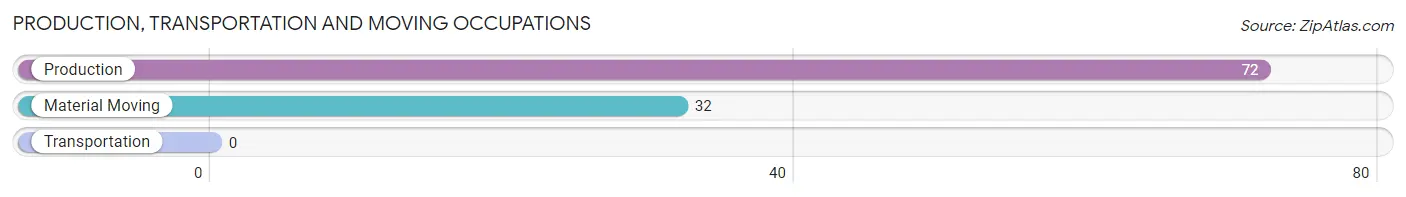
Production, Transportation and Moving Occupations by Sex
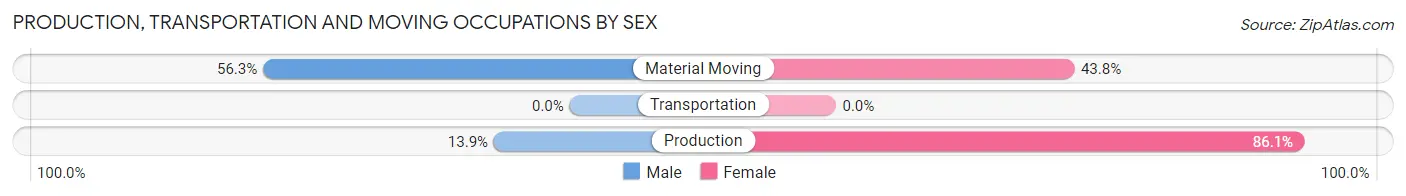
| Occupation | Male | Female |
| Production | 10 (13.9%) | 62 (86.1%) |
| Transportation | 0 (0.0%) | 0 (0.0%) |
| Material Moving | 18 (56.2%) | 14 (43.8%) |
| Total (Category) | 28 (26.9%) | 76 (73.1%) |
| Total (Overall) | 318 (42.7%) | 426 (57.3%) |
Employment Industries by Sex in Many
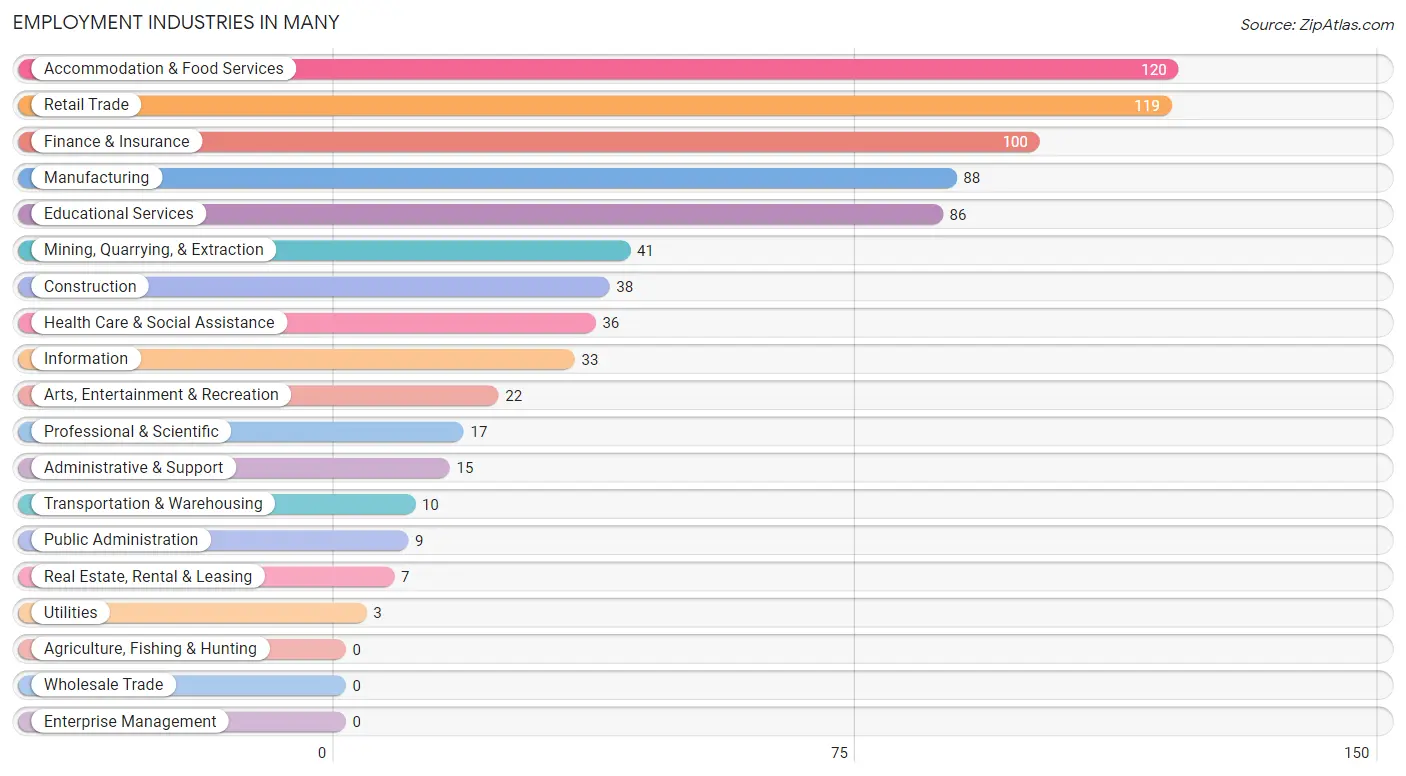
Employment Industries in Many
The major employment industries in Many include Accommodation & Food Services (120 | 16.1%), Retail Trade (119 | 16.0%), Finance & Insurance (100 | 13.4%), Manufacturing (88 | 11.8%), and Educational Services (86 | 11.6%).
Employment Industries by Sex in Many
The Many industries that see more men than women are Mining, Quarrying, & Extraction (100.0%), Construction (100.0%), and Utilities (100.0%), whereas the industries that tend to have a higher number of women are Transportation & Warehousing (100.0%), Finance & Insurance (100.0%), and Arts, Entertainment & Recreation (100.0%).
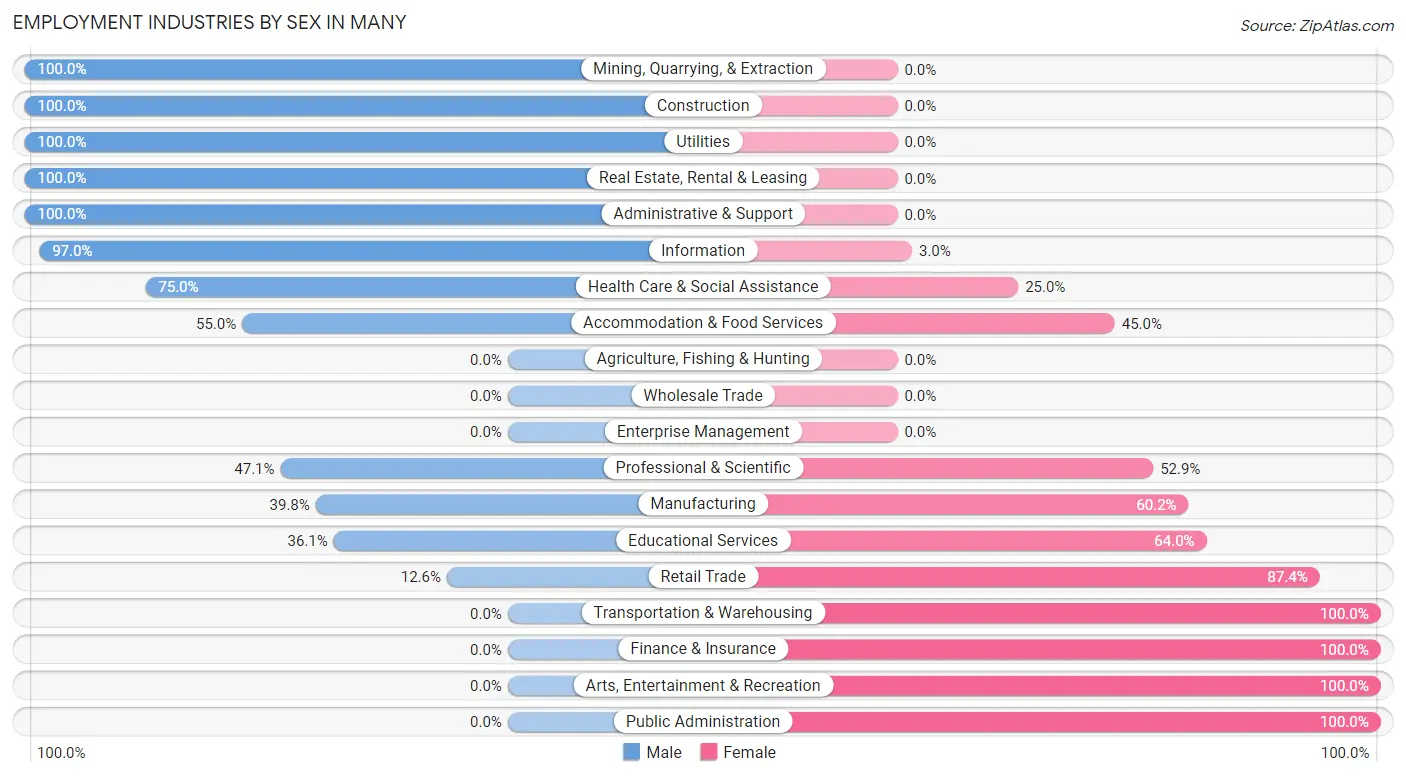
| Industry | Male | Female |
| Agriculture, Fishing & Hunting | 0 (0.0%) | 0 (0.0%) |
| Mining, Quarrying, & Extraction | 41 (100.0%) | 0 (0.0%) |
| Construction | 38 (100.0%) | 0 (0.0%) |
| Manufacturing | 35 (39.8%) | 53 (60.2%) |
| Wholesale Trade | 0 (0.0%) | 0 (0.0%) |
| Retail Trade | 15 (12.6%) | 104 (87.4%) |
| Transportation & Warehousing | 0 (0.0%) | 10 (100.0%) |
| Utilities | 3 (100.0%) | 0 (0.0%) |
| Information | 32 (97.0%) | 1 (3.0%) |
| Finance & Insurance | 0 (0.0%) | 100 (100.0%) |
| Real Estate, Rental & Leasing | 7 (100.0%) | 0 (0.0%) |
| Professional & Scientific | 8 (47.1%) | 9 (52.9%) |
| Enterprise Management | 0 (0.0%) | 0 (0.0%) |
| Administrative & Support | 15 (100.0%) | 0 (0.0%) |
| Educational Services | 31 (36.0%) | 55 (63.9%) |
| Health Care & Social Assistance | 27 (75.0%) | 9 (25.0%) |
| Arts, Entertainment & Recreation | 0 (0.0%) | 22 (100.0%) |
| Accommodation & Food Services | 66 (55.0%) | 54 (45.0%) |
| Public Administration | 0 (0.0%) | 9 (100.0%) |
| Total | 318 (42.7%) | 426 (57.3%) |
Education in Many
School Enrollment in Many
The most common levels of schooling among the 585 students in Many are middle school (188 | 32.1%), high school (185 | 31.6%), and elementary school (113 | 19.3%).
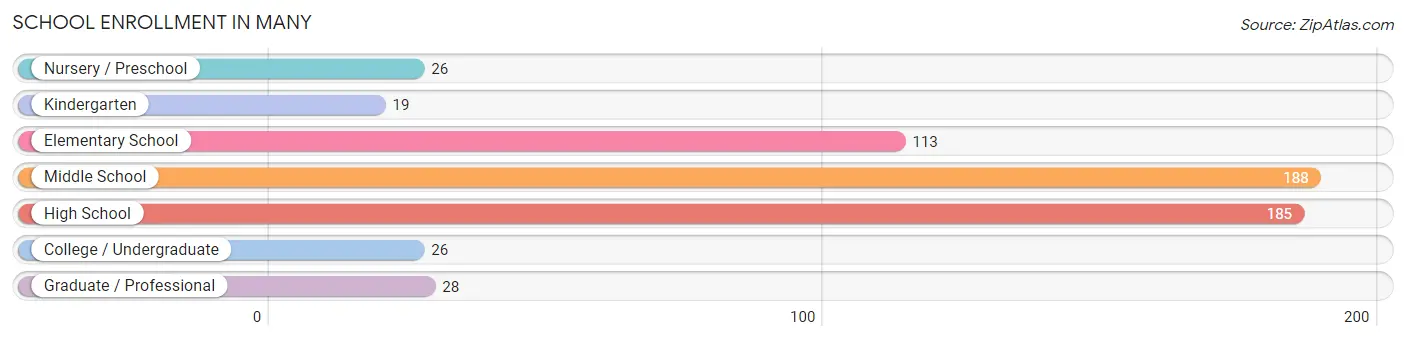
| School Level | # Students | % Students |
| Nursery / Preschool | 26 | 4.4% |
| Kindergarten | 19 | 3.3% |
| Elementary School | 113 | 19.3% |
| Middle School | 188 | 32.1% |
| High School | 185 | 31.6% |
| College / Undergraduate | 26 | 4.4% |
| Graduate / Professional | 28 | 4.8% |
| Total | 585 | 100.0% |
School Enrollment by Age by Funding Source in Many
Out of a total of 585 students who are enrolled in schools in Many, 24 (4.1%) attend a private institution, while the remaining 561 (95.9%) are enrolled in public schools. The age group of 25 to 34 year olds has the highest likelihood of being enrolled in private schools, with 24 (70.6% in the age bracket) enrolled. Conversely, the age group of 3 to 4 year olds has the lowest likelihood of being enrolled in a private school, with 26 (100.0% in the age bracket) attending a public institution.
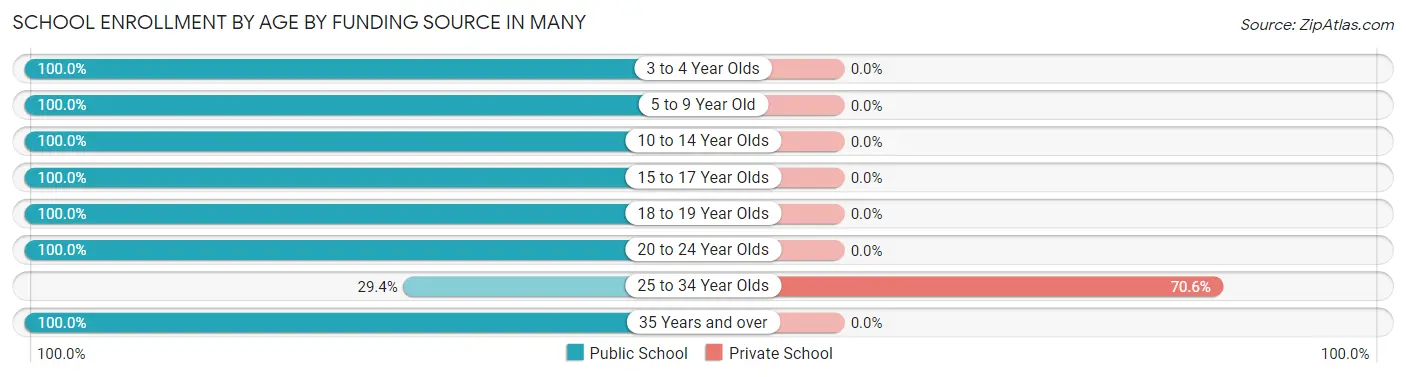
| Age Bracket | Public School | Private School |
| 3 to 4 Year Olds | 26 (100.0%) | 0 (0.0%) |
| 5 to 9 Year Old | 111 (100.0%) | 0 (0.0%) |
| 10 to 14 Year Olds | 209 (100.0%) | 0 (0.0%) |
| 15 to 17 Year Olds | 59 (100.0%) | 0 (0.0%) |
| 18 to 19 Year Olds | 126 (100.0%) | 0 (0.0%) |
| 20 to 24 Year Olds | 16 (100.0%) | 0 (0.0%) |
| 25 to 34 Year Olds | 10 (29.4%) | 24 (70.6%) |
| 35 Years and over | 4 (100.0%) | 0 (0.0%) |
| Total | 561 (95.9%) | 24 (4.1%) |
Educational Attainment by Field of Study in Many
Engineering (48 | 15.8%), education (48 | 15.8%), bio, nature & agricultural (44 | 14.5%), science & technology (38 | 12.5%), and visual & performing arts (37 | 12.2%) are the most common fields of study among 304 individuals in Many who have obtained a bachelor's degree or higher.
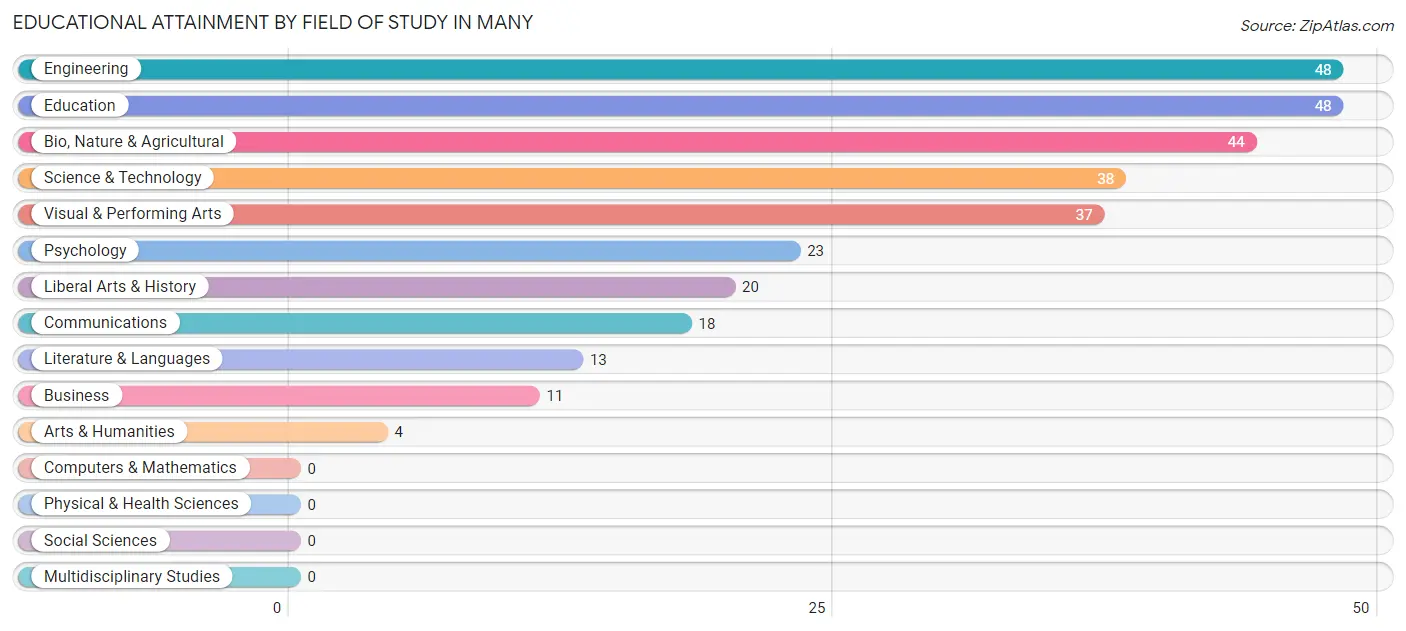
| Field of Study | # Graduates | % Graduates |
| Computers & Mathematics | 0 | 0.0% |
| Bio, Nature & Agricultural | 44 | 14.5% |
| Physical & Health Sciences | 0 | 0.0% |
| Psychology | 23 | 7.6% |
| Social Sciences | 0 | 0.0% |
| Engineering | 48 | 15.8% |
| Multidisciplinary Studies | 0 | 0.0% |
| Science & Technology | 38 | 12.5% |
| Business | 11 | 3.6% |
| Education | 48 | 15.8% |
| Literature & Languages | 13 | 4.3% |
| Liberal Arts & History | 20 | 6.6% |
| Visual & Performing Arts | 37 | 12.2% |
| Communications | 18 | 5.9% |
| Arts & Humanities | 4 | 1.3% |
| Total | 304 | 100.0% |
Transportation & Commute in Many
Vehicle Availability by Sex in Many
The most prevalent vehicle ownership categories in Many are males with 2 vehicles (100, accounting for 30.5%) and females with 2 vehicles (68, making up 23.5%).
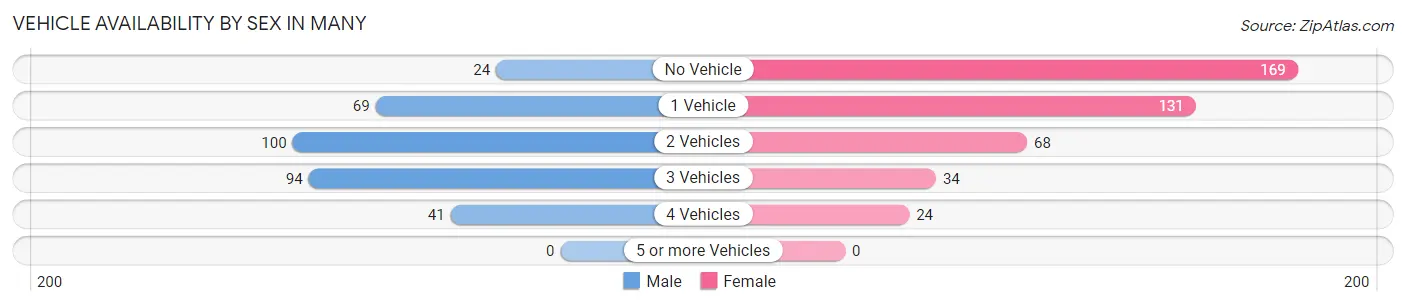
| Vehicles Available | Male | Female |
| No Vehicle | 24 (7.3%) | 169 (39.7%) |
| 1 Vehicle | 69 (21.0%) | 131 (30.7%) |
| 2 Vehicles | 100 (30.5%) | 68 (16.0%) |
| 3 Vehicles | 94 (28.7%) | 34 (8.0%) |
| 4 Vehicles | 41 (12.5%) | 24 (5.6%) |
| 5 or more Vehicles | 0 (0.0%) | 0 (0.0%) |
| Total | 328 (100.0%) | 426 (100.0%) |
Commute Time in Many
The most frequently occuring commute durations in Many are 5 to 9 minutes (229 commuters, 32.9%), less than 5 minutes (167 commuters, 24.0%), and 10 to 14 minutes (136 commuters, 19.5%).
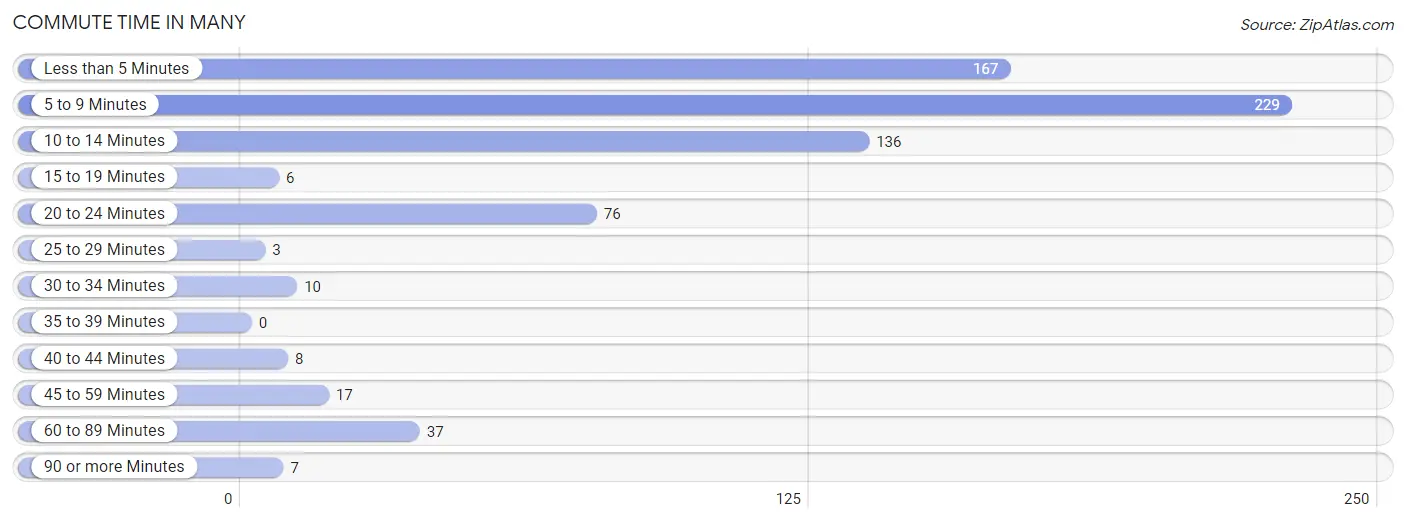
| Commute Time | # Commuters | % Commuters |
| Less than 5 Minutes | 167 | 24.0% |
| 5 to 9 Minutes | 229 | 32.9% |
| 10 to 14 Minutes | 136 | 19.5% |
| 15 to 19 Minutes | 6 | 0.9% |
| 20 to 24 Minutes | 76 | 10.9% |
| 25 to 29 Minutes | 3 | 0.4% |
| 30 to 34 Minutes | 10 | 1.4% |
| 35 to 39 Minutes | 0 | 0.0% |
| 40 to 44 Minutes | 8 | 1.1% |
| 45 to 59 Minutes | 17 | 2.4% |
| 60 to 89 Minutes | 37 | 5.3% |
| 90 or more Minutes | 7 | 1.0% |
Commute Time by Sex in Many
The most common commute times in Many are 10 to 14 minutes (104 commuters, 31.7%) for males and 5 to 9 minutes (157 commuters, 42.7%) for females.
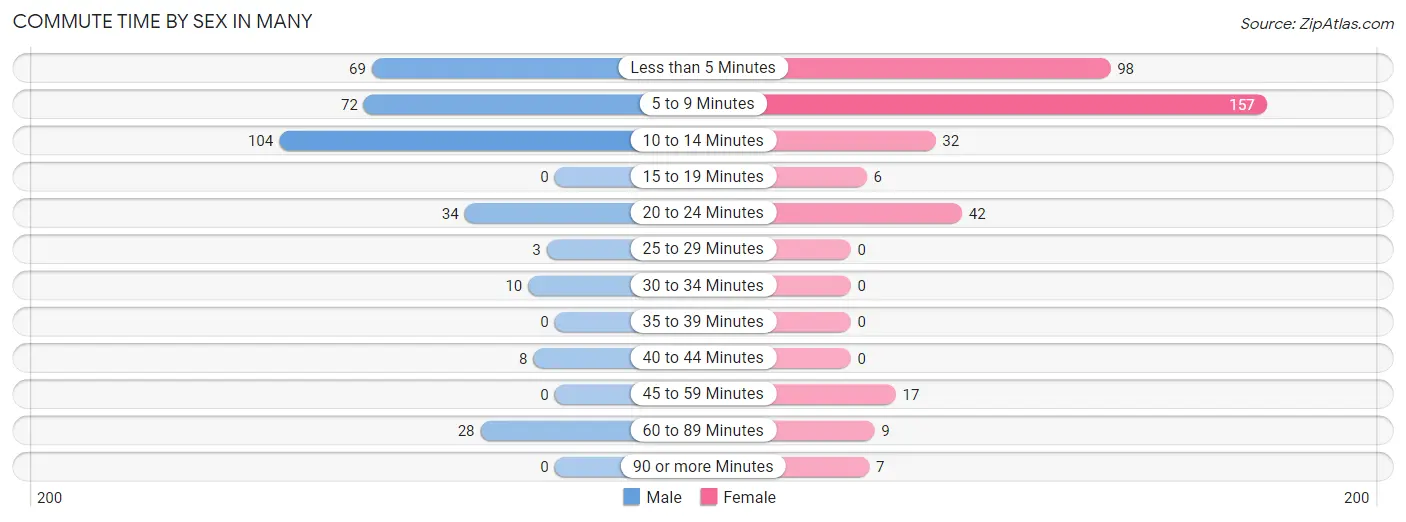
| Commute Time | Male | Female |
| Less than 5 Minutes | 69 (21.0%) | 98 (26.6%) |
| 5 to 9 Minutes | 72 (22.0%) | 157 (42.7%) |
| 10 to 14 Minutes | 104 (31.7%) | 32 (8.7%) |
| 15 to 19 Minutes | 0 (0.0%) | 6 (1.6%) |
| 20 to 24 Minutes | 34 (10.4%) | 42 (11.4%) |
| 25 to 29 Minutes | 3 (0.9%) | 0 (0.0%) |
| 30 to 34 Minutes | 10 (3.0%) | 0 (0.0%) |
| 35 to 39 Minutes | 0 (0.0%) | 0 (0.0%) |
| 40 to 44 Minutes | 8 (2.4%) | 0 (0.0%) |
| 45 to 59 Minutes | 0 (0.0%) | 17 (4.6%) |
| 60 to 89 Minutes | 28 (8.5%) | 9 (2.5%) |
| 90 or more Minutes | 0 (0.0%) | 7 (1.9%) |
Time of Departure to Work by Sex in Many
The most frequent times of departure to work in Many are 7:30 AM to 7:59 AM (83, 25.3%) for males and 7:30 AM to 7:59 AM (115, 31.2%) for females.
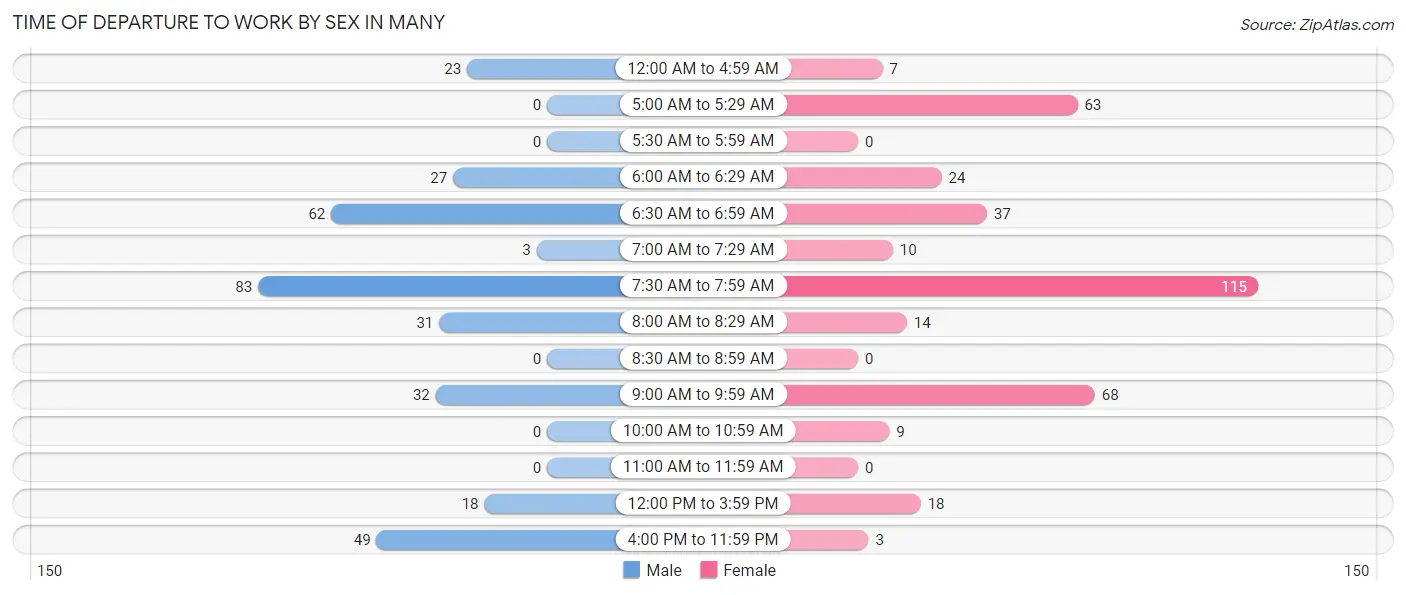
| Time of Departure | Male | Female |
| 12:00 AM to 4:59 AM | 23 (7.0%) | 7 (1.9%) |
| 5:00 AM to 5:29 AM | 0 (0.0%) | 63 (17.1%) |
| 5:30 AM to 5:59 AM | 0 (0.0%) | 0 (0.0%) |
| 6:00 AM to 6:29 AM | 27 (8.2%) | 24 (6.5%) |
| 6:30 AM to 6:59 AM | 62 (18.9%) | 37 (10.1%) |
| 7:00 AM to 7:29 AM | 3 (0.9%) | 10 (2.7%) |
| 7:30 AM to 7:59 AM | 83 (25.3%) | 115 (31.2%) |
| 8:00 AM to 8:29 AM | 31 (9.5%) | 14 (3.8%) |
| 8:30 AM to 8:59 AM | 0 (0.0%) | 0 (0.0%) |
| 9:00 AM to 9:59 AM | 32 (9.8%) | 68 (18.5%) |
| 10:00 AM to 10:59 AM | 0 (0.0%) | 9 (2.5%) |
| 11:00 AM to 11:59 AM | 0 (0.0%) | 0 (0.0%) |
| 12:00 PM to 3:59 PM | 18 (5.5%) | 18 (4.9%) |
| 4:00 PM to 11:59 PM | 49 (14.9%) | 3 (0.8%) |
| Total | 328 (100.0%) | 368 (100.0%) |
Housing Occupancy in Many
Occupancy by Ownership in Many
Of the total 938 dwellings in Many, owner-occupied units account for 394 (42.0%), while renter-occupied units make up 544 (58.0%).
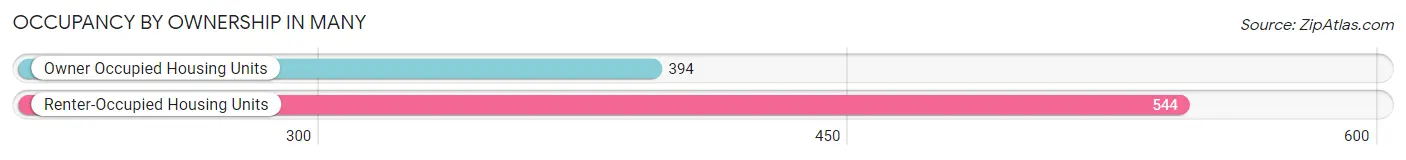
| Occupancy | # Housing Units | % Housing Units |
| Owner Occupied Housing Units | 394 | 42.0% |
| Renter-Occupied Housing Units | 544 | 58.0% |
| Total Occupied Housing Units | 938 | 100.0% |
Occupancy by Household Size in Many
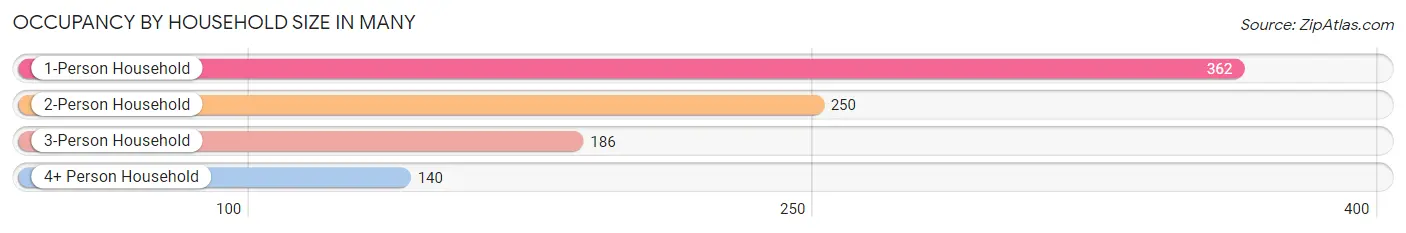
| Household Size | # Housing Units | % Housing Units |
| 1-Person Household | 362 | 38.6% |
| 2-Person Household | 250 | 26.7% |
| 3-Person Household | 186 | 19.8% |
| 4+ Person Household | 140 | 14.9% |
| Total Housing Units | 938 | 100.0% |
Occupancy by Ownership by Household Size in Many
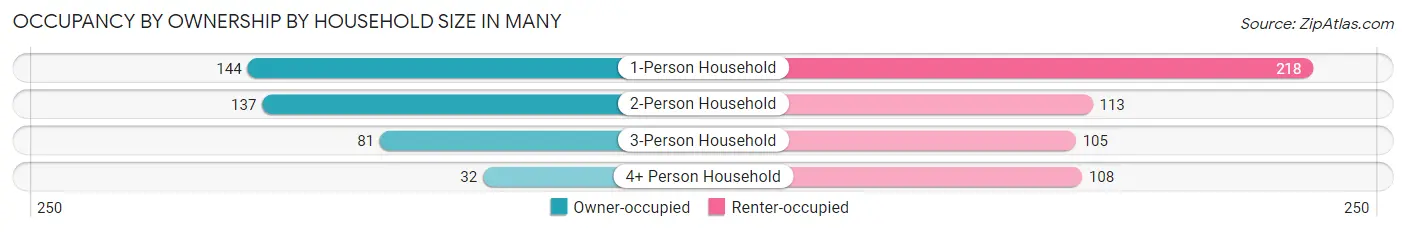
| Household Size | Owner-occupied | Renter-occupied |
| 1-Person Household | 144 (39.8%) | 218 (60.2%) |
| 2-Person Household | 137 (54.8%) | 113 (45.2%) |
| 3-Person Household | 81 (43.5%) | 105 (56.5%) |
| 4+ Person Household | 32 (22.9%) | 108 (77.1%) |
| Total Housing Units | 394 (42.0%) | 544 (58.0%) |
Occupancy by Educational Attainment in Many
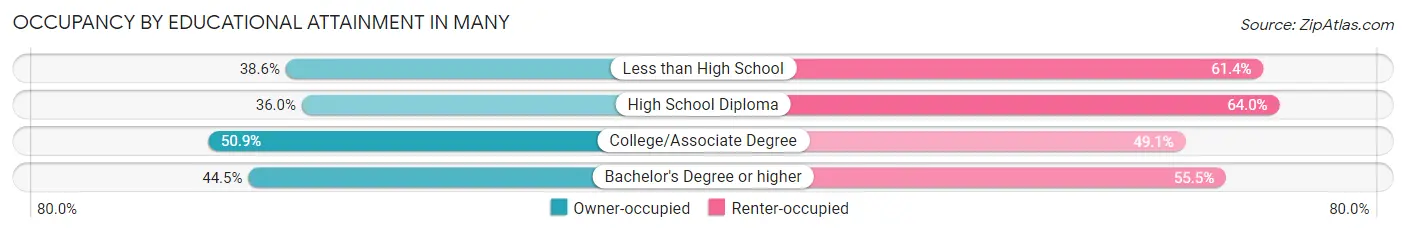
| Household Size | Owner-occupied | Renter-occupied |
| Less than High School | 49 (38.6%) | 78 (61.4%) |
| High School Diploma | 142 (36.0%) | 252 (64.0%) |
| College/Associate Degree | 138 (50.9%) | 133 (49.1%) |
| Bachelor's Degree or higher | 65 (44.5%) | 81 (55.5%) |
Occupancy by Age of Householder in Many
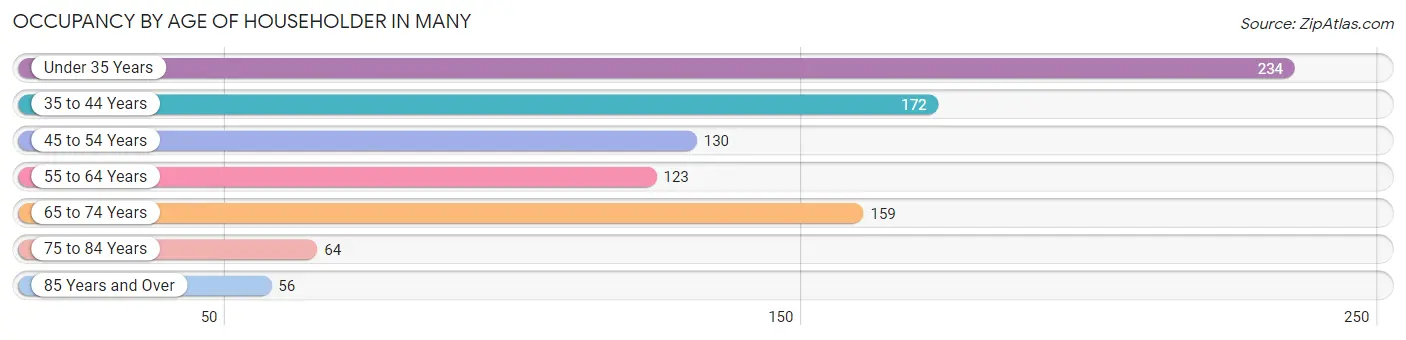
| Age Bracket | # Households | % Households |
| Under 35 Years | 234 | 24.9% |
| 35 to 44 Years | 172 | 18.3% |
| 45 to 54 Years | 130 | 13.9% |
| 55 to 64 Years | 123 | 13.1% |
| 65 to 74 Years | 159 | 17.0% |
| 75 to 84 Years | 64 | 6.8% |
| 85 Years and Over | 56 | 6.0% |
| Total | 938 | 100.0% |
Housing Finances in Many
Median Income by Occupancy in Many
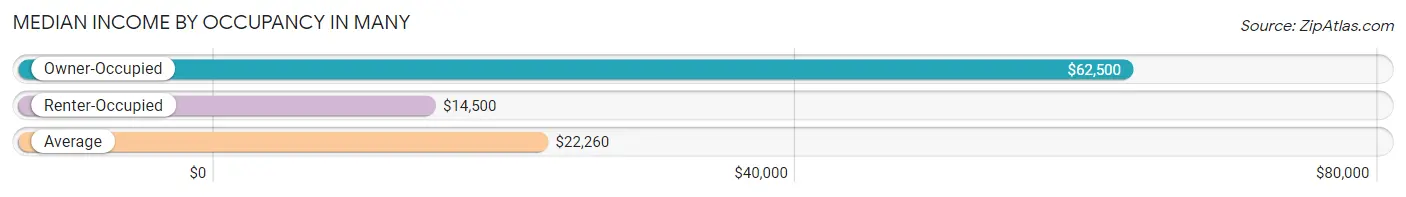
| Occupancy Type | # Households | Median Income |
| Owner-Occupied | 394 (42.0%) | $62,500 |
| Renter-Occupied | 544 (58.0%) | $14,500 |
| Average | 938 (100.0%) | $22,260 |
Occupancy by Householder Income Bracket in Many
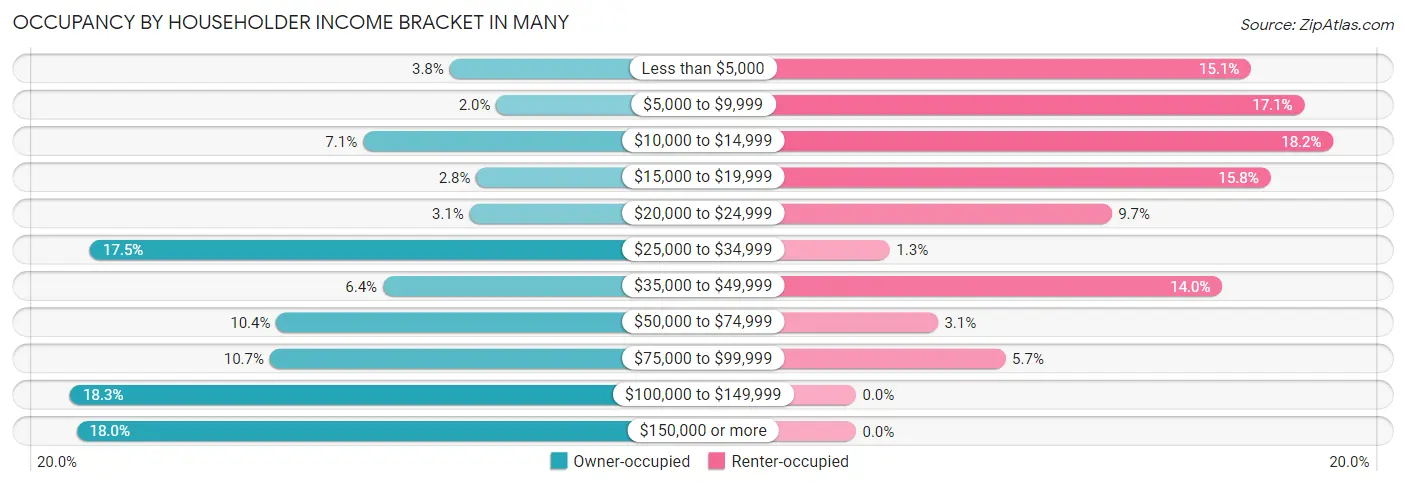
| Income Bracket | Owner-occupied | Renter-occupied |
| Less than $5,000 | 15 (3.8%) | 82 (15.1%) |
| $5,000 to $9,999 | 8 (2.0%) | 93 (17.1%) |
| $10,000 to $14,999 | 28 (7.1%) | 99 (18.2%) |
| $15,000 to $19,999 | 11 (2.8%) | 86 (15.8%) |
| $20,000 to $24,999 | 12 (3.0%) | 53 (9.7%) |
| $25,000 to $34,999 | 69 (17.5%) | 7 (1.3%) |
| $35,000 to $49,999 | 25 (6.4%) | 76 (14.0%) |
| $50,000 to $74,999 | 41 (10.4%) | 17 (3.1%) |
| $75,000 to $99,999 | 42 (10.7%) | 31 (5.7%) |
| $100,000 to $149,999 | 72 (18.3%) | 0 (0.0%) |
| $150,000 or more | 71 (18.0%) | 0 (0.0%) |
| Total | 394 (100.0%) | 544 (100.0%) |
Monthly Housing Cost Tiers in Many
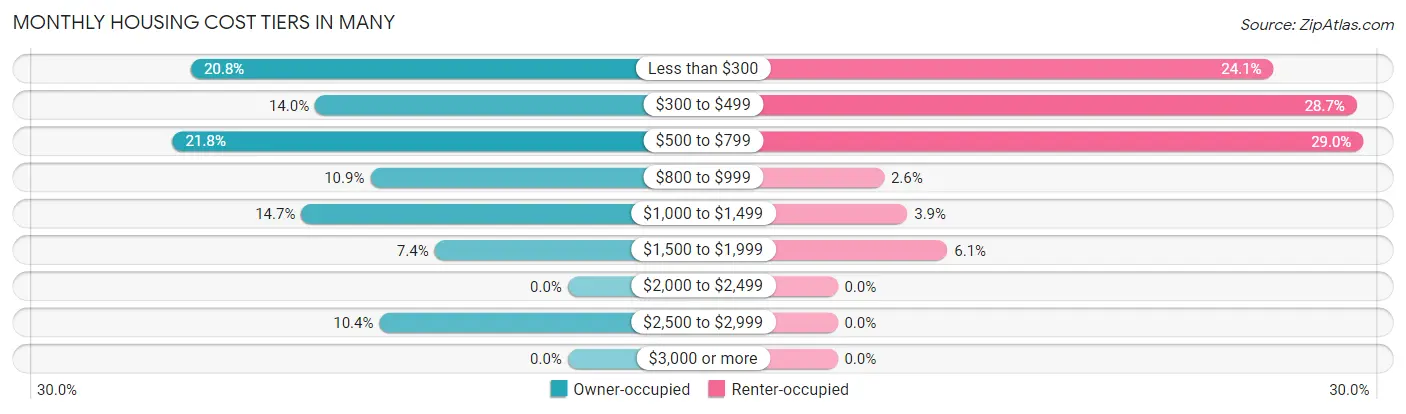
| Monthly Cost | Owner-occupied | Renter-occupied |
| Less than $300 | 82 (20.8%) | 131 (24.1%) |
| $300 to $499 | 55 (14.0%) | 156 (28.7%) |
| $500 to $799 | 86 (21.8%) | 158 (29.0%) |
| $800 to $999 | 43 (10.9%) | 14 (2.6%) |
| $1,000 to $1,499 | 58 (14.7%) | 21 (3.9%) |
| $1,500 to $1,999 | 29 (7.4%) | 33 (6.1%) |
| $2,000 to $2,499 | 0 (0.0%) | 0 (0.0%) |
| $2,500 to $2,999 | 41 (10.4%) | 0 (0.0%) |
| $3,000 or more | 0 (0.0%) | 0 (0.0%) |
| Total | 394 (100.0%) | 544 (100.0%) |
Physical Housing Characteristics in Many
Housing Structures in Many
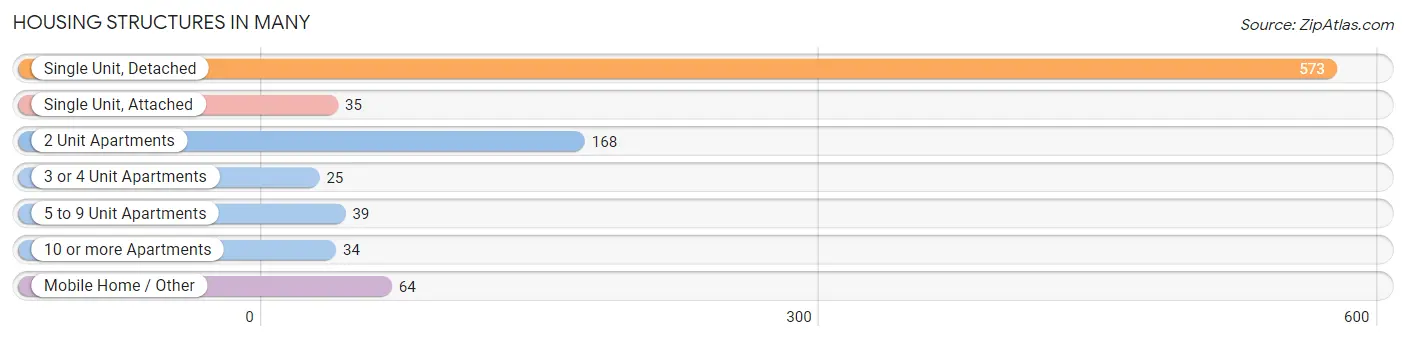
| Structure Type | # Housing Units | % Housing Units |
| Single Unit, Detached | 573 | 61.1% |
| Single Unit, Attached | 35 | 3.7% |
| 2 Unit Apartments | 168 | 17.9% |
| 3 or 4 Unit Apartments | 25 | 2.7% |
| 5 to 9 Unit Apartments | 39 | 4.2% |
| 10 or more Apartments | 34 | 3.6% |
| Mobile Home / Other | 64 | 6.8% |
| Total | 938 | 100.0% |
Housing Structures by Occupancy in Many
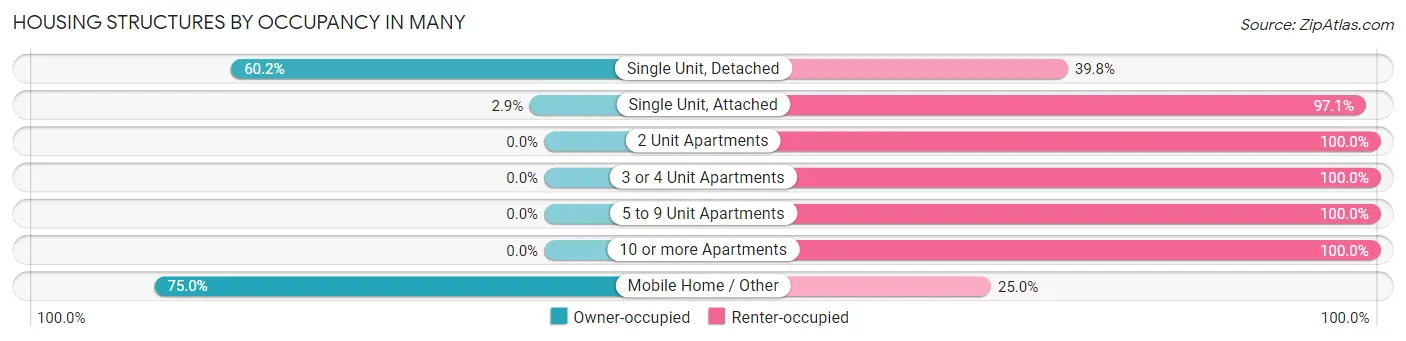
| Structure Type | Owner-occupied | Renter-occupied |
| Single Unit, Detached | 345 (60.2%) | 228 (39.8%) |
| Single Unit, Attached | 1 (2.9%) | 34 (97.1%) |
| 2 Unit Apartments | 0 (0.0%) | 168 (100.0%) |
| 3 or 4 Unit Apartments | 0 (0.0%) | 25 (100.0%) |
| 5 to 9 Unit Apartments | 0 (0.0%) | 39 (100.0%) |
| 10 or more Apartments | 0 (0.0%) | 34 (100.0%) |
| Mobile Home / Other | 48 (75.0%) | 16 (25.0%) |
| Total | 394 (42.0%) | 544 (58.0%) |
Housing Structures by Number of Rooms in Many
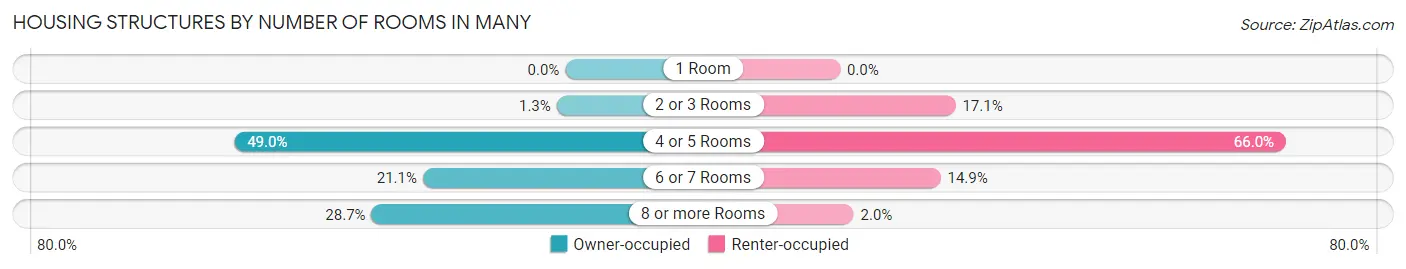
| Number of Rooms | Owner-occupied | Renter-occupied |
| 1 Room | 0 (0.0%) | 0 (0.0%) |
| 2 or 3 Rooms | 5 (1.3%) | 93 (17.1%) |
| 4 or 5 Rooms | 193 (49.0%) | 359 (66.0%) |
| 6 or 7 Rooms | 83 (21.1%) | 81 (14.9%) |
| 8 or more Rooms | 113 (28.7%) | 11 (2.0%) |
| Total | 394 (100.0%) | 544 (100.0%) |
Housing Structure by Heating Type in Many
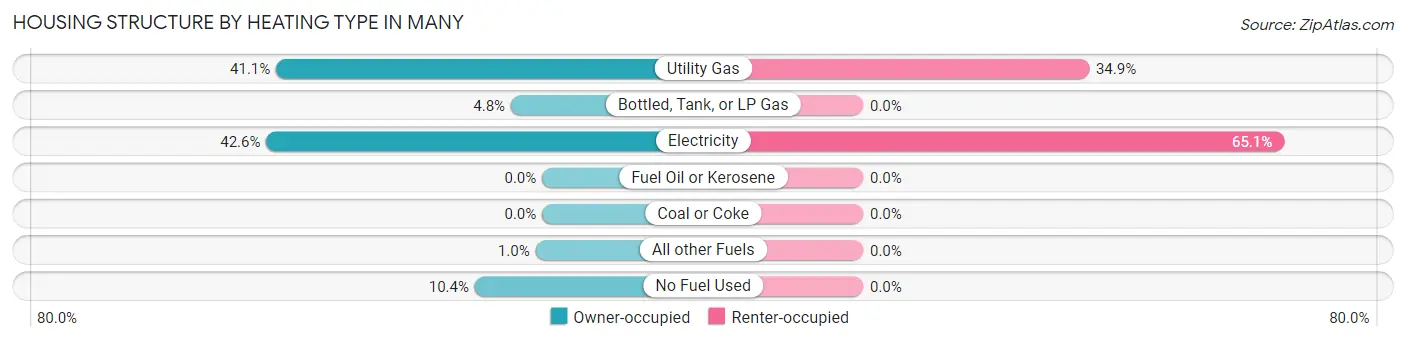
| Heating Type | Owner-occupied | Renter-occupied |
| Utility Gas | 162 (41.1%) | 190 (34.9%) |
| Bottled, Tank, or LP Gas | 19 (4.8%) | 0 (0.0%) |
| Electricity | 168 (42.6%) | 354 (65.1%) |
| Fuel Oil or Kerosene | 0 (0.0%) | 0 (0.0%) |
| Coal or Coke | 0 (0.0%) | 0 (0.0%) |
| All other Fuels | 4 (1.0%) | 0 (0.0%) |
| No Fuel Used | 41 (10.4%) | 0 (0.0%) |
| Total | 394 (100.0%) | 544 (100.0%) |
Household Vehicle Usage in Many
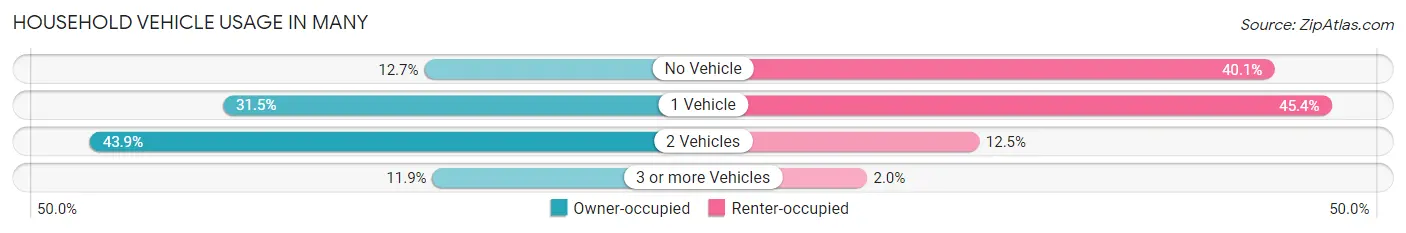
| Vehicles per Household | Owner-occupied | Renter-occupied |
| No Vehicle | 50 (12.7%) | 218 (40.1%) |
| 1 Vehicle | 124 (31.5%) | 247 (45.4%) |
| 2 Vehicles | 173 (43.9%) | 68 (12.5%) |
| 3 or more Vehicles | 47 (11.9%) | 11 (2.0%) |
| Total | 394 (100.0%) | 544 (100.0%) |
Real Estate & Mortgages in Many
Real Estate and Mortgage Overview in Many
| Characteristic | Without Mortgage | With Mortgage |
| Housing Units | 254 | 140 |
| Median Property Value | $84,800 | $222,600 |
| Median Household Income | $33,889 | $20 |
| Monthly Housing Costs | $462 | $0 |
| Real Estate Taxes | $725 | $19 |
Property Value by Mortgage Status in Many
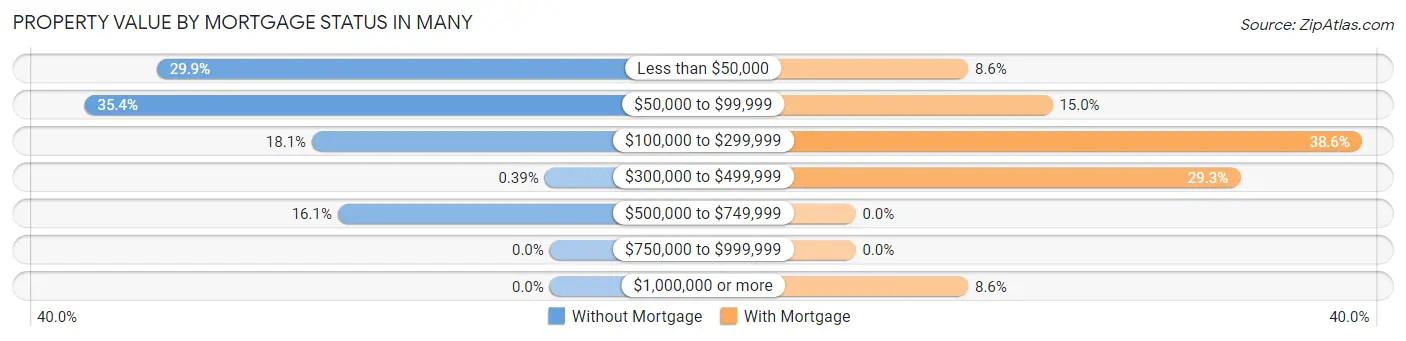
| Property Value | Without Mortgage | With Mortgage |
| Less than $50,000 | 76 (29.9%) | 12 (8.6%) |
| $50,000 to $99,999 | 90 (35.4%) | 21 (15.0%) |
| $100,000 to $299,999 | 46 (18.1%) | 54 (38.6%) |
| $300,000 to $499,999 | 1 (0.4%) | 41 (29.3%) |
| $500,000 to $749,999 | 41 (16.1%) | 0 (0.0%) |
| $750,000 to $999,999 | 0 (0.0%) | 0 (0.0%) |
| $1,000,000 or more | 0 (0.0%) | 12 (8.6%) |
| Total | 254 (100.0%) | 140 (100.0%) |
Household Income by Mortgage Status in Many
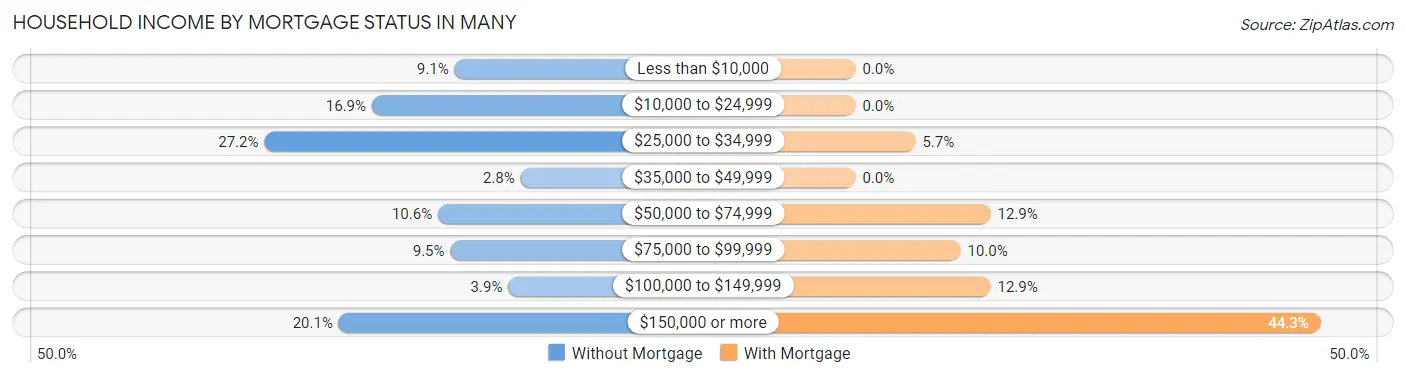
| Household Income | Without Mortgage | With Mortgage |
| Less than $10,000 | 23 (9.1%) | 0 (0.0%) |
| $10,000 to $24,999 | 43 (16.9%) | 0 (0.0%) |
| $25,000 to $34,999 | 69 (27.2%) | 8 (5.7%) |
| $35,000 to $49,999 | 7 (2.8%) | 0 (0.0%) |
| $50,000 to $74,999 | 27 (10.6%) | 18 (12.9%) |
| $75,000 to $99,999 | 24 (9.5%) | 14 (10.0%) |
| $100,000 to $149,999 | 10 (3.9%) | 18 (12.9%) |
| $150,000 or more | 51 (20.1%) | 62 (44.3%) |
| Total | 254 (100.0%) | 140 (100.0%) |
Property Value to Household Income Ratio in Many
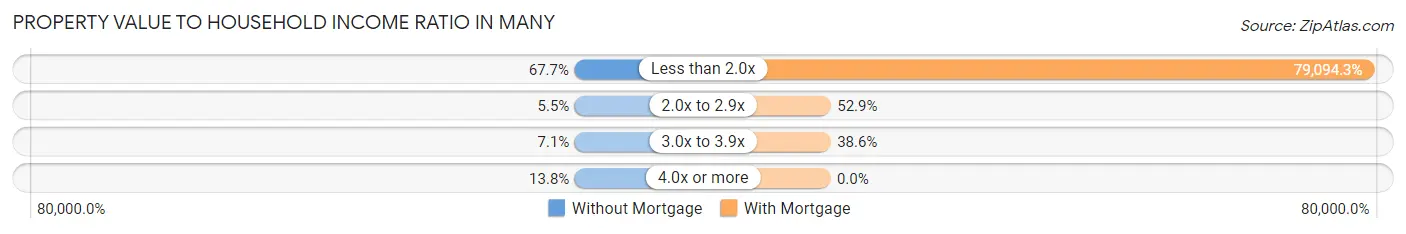
| Value-to-Income Ratio | Without Mortgage | With Mortgage |
| Less than 2.0x | 172 (67.7%) | 110,732 (79,094.3%) |
| 2.0x to 2.9x | 14 (5.5%) | 74 (52.9%) |
| 3.0x to 3.9x | 18 (7.1%) | 54 (38.6%) |
| 4.0x or more | 35 (13.8%) | 0 (0.0%) |
| Total | 254 (100.0%) | 140 (100.0%) |
Real Estate Taxes by Mortgage Status in Many
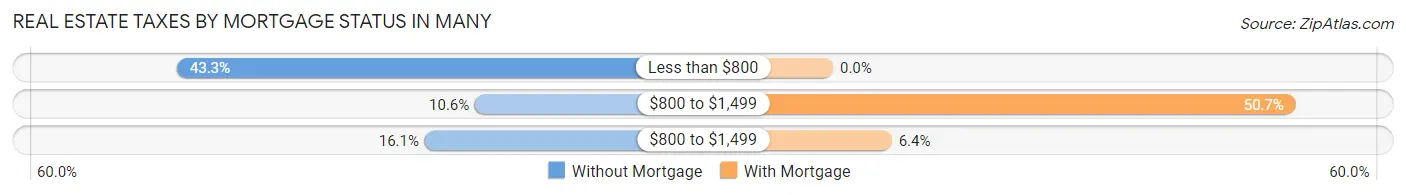
| Property Taxes | Without Mortgage | With Mortgage |
| Less than $800 | 110 (43.3%) | 0 (0.0%) |
| $800 to $1,499 | 27 (10.6%) | 71 (50.7%) |
| $800 to $1,499 | 41 (16.1%) | 9 (6.4%) |
| Total | 254 (100.0%) | 140 (100.0%) |
Health & Disability in Many
Health Insurance Coverage by Age in Many
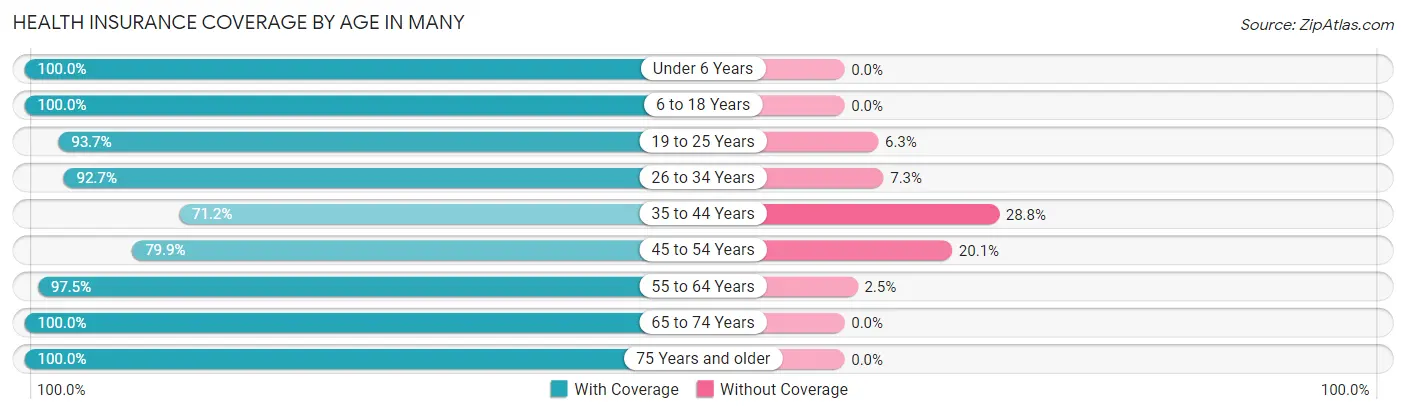
| Age Bracket | With Coverage | Without Coverage |
| Under 6 Years | 103 (100.0%) | 0 (0.0%) |
| 6 to 18 Years | 562 (100.0%) | 0 (0.0%) |
| 19 to 25 Years | 134 (93.7%) | 9 (6.3%) |
| 26 to 34 Years | 255 (92.7%) | 20 (7.3%) |
| 35 to 44 Years | 210 (71.2%) | 85 (28.8%) |
| 45 to 54 Years | 235 (79.9%) | 59 (20.1%) |
| 55 to 64 Years | 198 (97.5%) | 5 (2.5%) |
| 65 to 74 Years | 288 (100.0%) | 0 (0.0%) |
| 75 Years and older | 125 (100.0%) | 0 (0.0%) |
| Total | 2,110 (92.2%) | 178 (7.8%) |
Health Insurance Coverage by Citizenship Status in Many
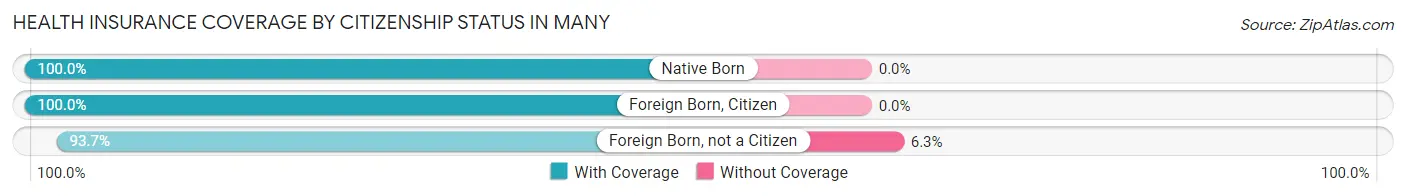
| Citizenship Status | With Coverage | Without Coverage |
| Native Born | 103 (100.0%) | 0 (0.0%) |
| Foreign Born, Citizen | 562 (100.0%) | 0 (0.0%) |
| Foreign Born, not a Citizen | 134 (93.7%) | 9 (6.3%) |
Health Insurance Coverage by Household Income in Many
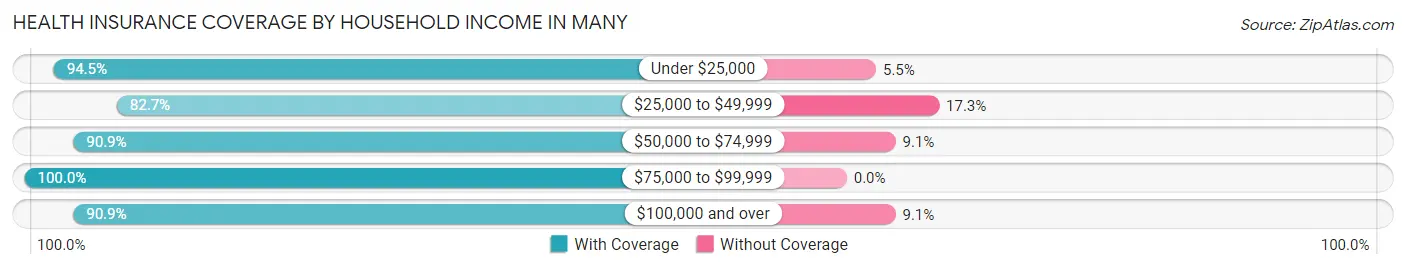
| Household Income | With Coverage | Without Coverage |
| Under $25,000 | 1,069 (94.5%) | 62 (5.5%) |
| $25,000 to $49,999 | 282 (82.7%) | 59 (17.3%) |
| $50,000 to $74,999 | 159 (90.9%) | 16 (9.1%) |
| $75,000 to $99,999 | 192 (100.0%) | 0 (0.0%) |
| $100,000 and over | 408 (90.9%) | 41 (9.1%) |
Public vs Private Health Insurance Coverage by Age in Many
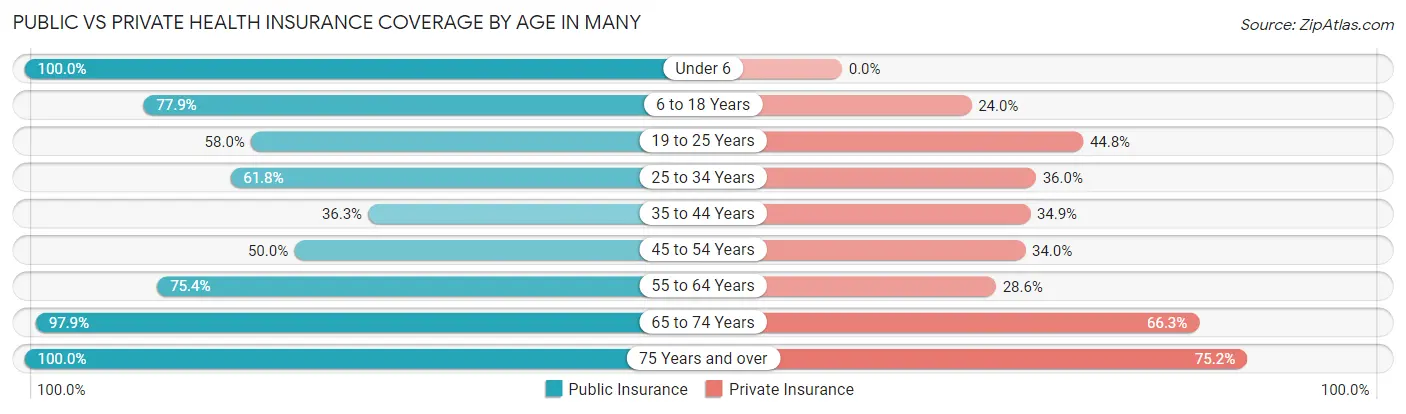
| Age Bracket | Public Insurance | Private Insurance |
| Under 6 | 103 (100.0%) | 0 (0.0%) |
| 6 to 18 Years | 438 (77.9%) | 135 (24.0%) |
| 19 to 25 Years | 83 (58.0%) | 64 (44.8%) |
| 25 to 34 Years | 170 (61.8%) | 99 (36.0%) |
| 35 to 44 Years | 107 (36.3%) | 103 (34.9%) |
| 45 to 54 Years | 147 (50.0%) | 100 (34.0%) |
| 55 to 64 Years | 153 (75.4%) | 58 (28.6%) |
| 65 to 74 Years | 282 (97.9%) | 191 (66.3%) |
| 75 Years and over | 125 (100.0%) | 94 (75.2%) |
| Total | 1,608 (70.3%) | 844 (36.9%) |
Disability Status by Sex by Age in Many
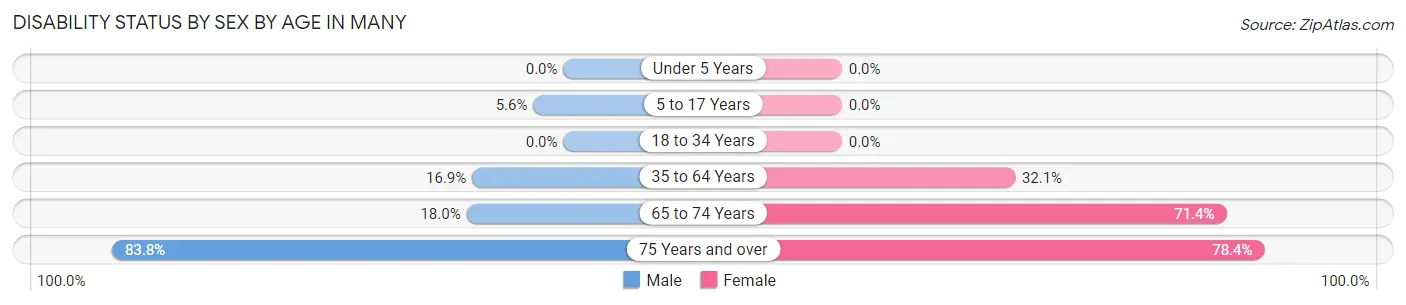
| Age Bracket | Male | Female |
| Under 5 Years | 0 (0.0%) | 0 (0.0%) |
| 5 to 17 Years | 11 (5.6%) | 0 (0.0%) |
| 18 to 34 Years | 0 (0.0%) | 0 (0.0%) |
| 35 to 64 Years | 63 (16.9%) | 135 (32.1%) |
| 65 to 74 Years | 16 (18.0%) | 142 (71.4%) |
| 75 Years and over | 31 (83.8%) | 69 (78.4%) |
Disability Class by Sex by Age in Many
Disability Class: Hearing Difficulty
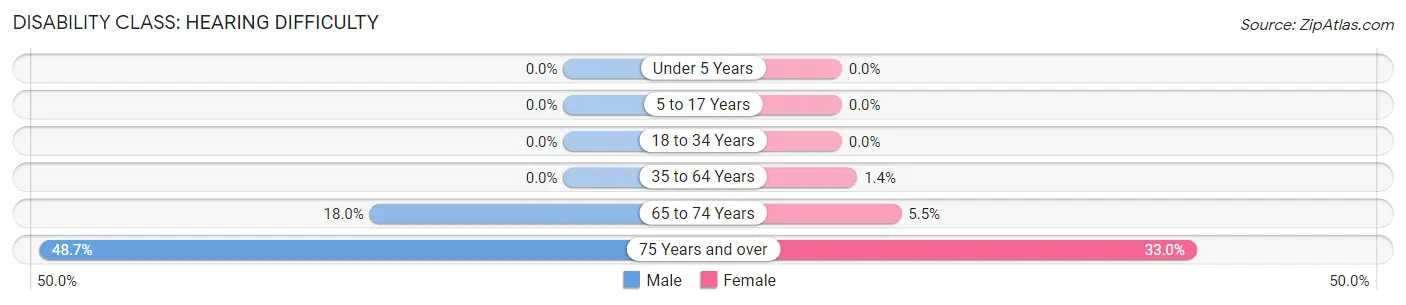
| Age Bracket | Male | Female |
| Under 5 Years | 0 (0.0%) | 0 (0.0%) |
| 5 to 17 Years | 0 (0.0%) | 0 (0.0%) |
| 18 to 34 Years | 0 (0.0%) | 0 (0.0%) |
| 35 to 64 Years | 0 (0.0%) | 6 (1.4%) |
| 65 to 74 Years | 16 (18.0%) | 11 (5.5%) |
| 75 Years and over | 18 (48.6%) | 29 (33.0%) |
Disability Class: Vision Difficulty
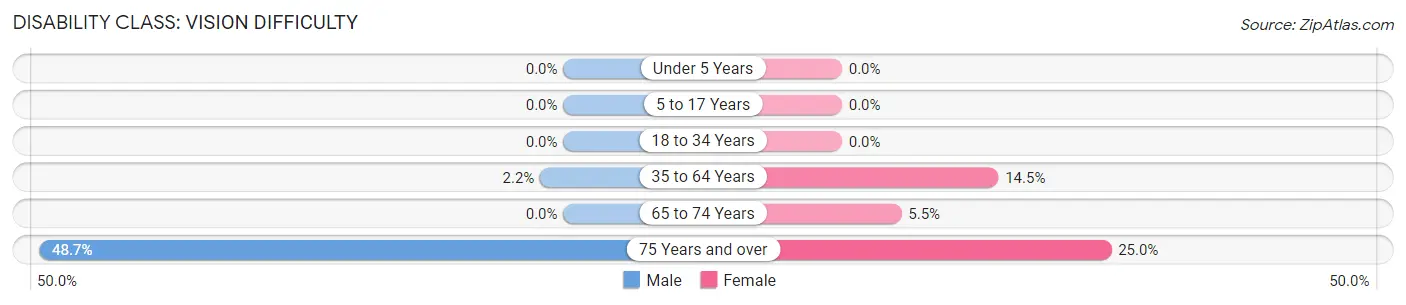
| Age Bracket | Male | Female |
| Under 5 Years | 0 (0.0%) | 0 (0.0%) |
| 5 to 17 Years | 0 (0.0%) | 0 (0.0%) |
| 18 to 34 Years | 0 (0.0%) | 0 (0.0%) |
| 35 to 64 Years | 8 (2.1%) | 61 (14.5%) |
| 65 to 74 Years | 0 (0.0%) | 11 (5.5%) |
| 75 Years and over | 18 (48.6%) | 22 (25.0%) |
Disability Class: Cognitive Difficulty
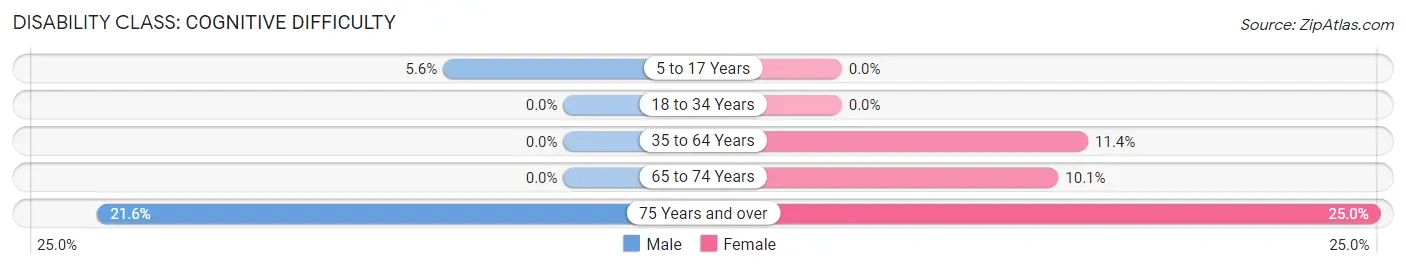
| Age Bracket | Male | Female |
| 5 to 17 Years | 11 (5.6%) | 0 (0.0%) |
| 18 to 34 Years | 0 (0.0%) | 0 (0.0%) |
| 35 to 64 Years | 0 (0.0%) | 48 (11.4%) |
| 65 to 74 Years | 0 (0.0%) | 20 (10.1%) |
| 75 Years and over | 8 (21.6%) | 22 (25.0%) |
Disability Class: Ambulatory Difficulty
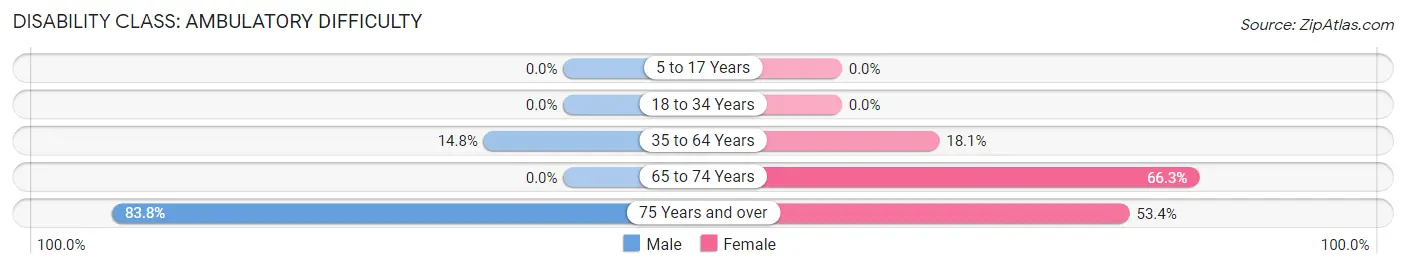
| Age Bracket | Male | Female |
| 5 to 17 Years | 0 (0.0%) | 0 (0.0%) |
| 18 to 34 Years | 0 (0.0%) | 0 (0.0%) |
| 35 to 64 Years | 55 (14.8%) | 76 (18.1%) |
| 65 to 74 Years | 0 (0.0%) | 132 (66.3%) |
| 75 Years and over | 31 (83.8%) | 47 (53.4%) |
Disability Class: Self-Care Difficulty
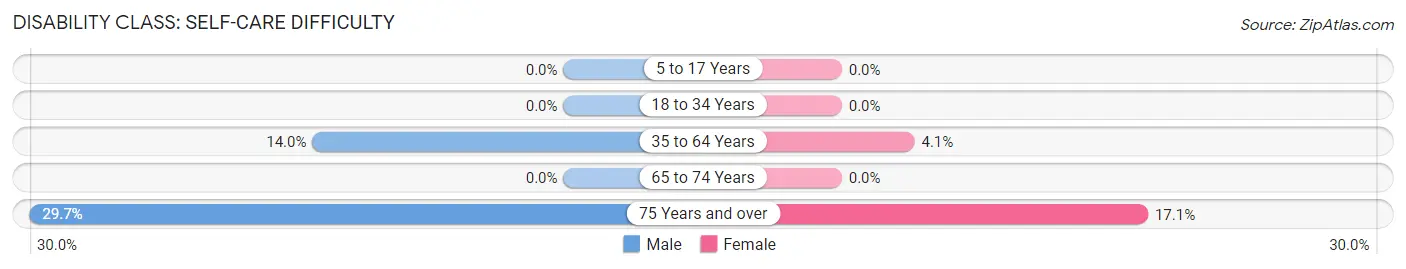
| Age Bracket | Male | Female |
| 5 to 17 Years | 0 (0.0%) | 0 (0.0%) |
| 18 to 34 Years | 0 (0.0%) | 0 (0.0%) |
| 35 to 64 Years | 52 (14.0%) | 17 (4.1%) |
| 65 to 74 Years | 0 (0.0%) | 0 (0.0%) |
| 75 Years and over | 11 (29.7%) | 15 (17.1%) |
Technology Access in Many
Computing Device Access in Many
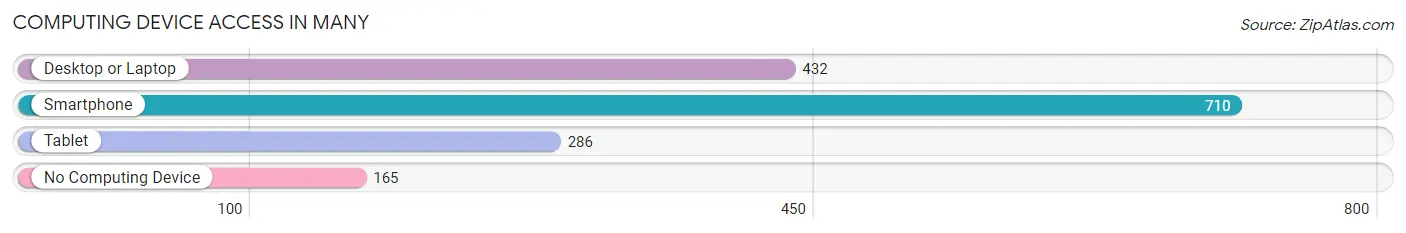
| Device Type | # Households | % Households |
| Desktop or Laptop | 432 | 46.1% |
| Smartphone | 710 | 75.7% |
| Tablet | 286 | 30.5% |
| No Computing Device | 165 | 17.6% |
| Total | 938 | 100.0% |
Internet Access in Many
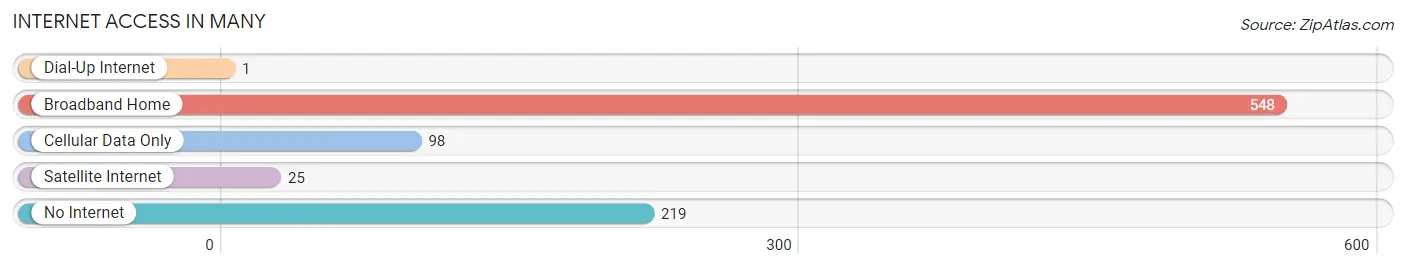
| Internet Type | # Households | % Households |
| Dial-Up Internet | 1 | 0.1% |
| Broadband Home | 548 | 58.4% |
| Cellular Data Only | 98 | 10.4% |
| Satellite Internet | 25 | 2.7% |
| No Internet | 219 | 23.4% |
| Total | 938 | 100.0% |
Many Summary
Los Angeles is the second largest city in the United States and the largest city in California. It is located in the southern part of the state, along the Pacific Ocean. The city is known for its diverse population, its vibrant culture, and its many attractions.
History
Los Angeles was founded in 1781 by Spanish settlers, who named it El Pueblo de Nuestra Señora la Reina de los Angeles de Porciuncula. The city was originally a small agricultural community, but it quickly grew into a major port and trading center. In 1848, the city was annexed by the United States as part of the Treaty of Guadalupe Hidalgo.
In the late 19th century, Los Angeles experienced a period of rapid growth and development. The city was transformed from a small agricultural community into a major industrial center. The population of the city grew rapidly, and by the early 20th century, Los Angeles was the largest city in California.
Geography
Los Angeles is located in the southern part of California, along the Pacific Ocean. The city is bordered by the San Gabriel Mountains to the north, the Santa Monica Mountains to the west, and the San Fernando Valley to the east. The city covers an area of 469 square miles and has a population of over four million people.
The city is divided into several distinct neighborhoods, each with its own unique character and culture. Downtown Los Angeles is the city’s business and financial center, while Hollywood is the center of the entertainment industry. Other neighborhoods include Westwood, Beverly Hills, and Venice Beach.
Economy
Los Angeles is one of the largest and most important economic centers in the United States. The city is home to many major corporations, including the Walt Disney Company, Warner Bros., and Universal Studios. The city is also a major center for the entertainment industry, with many television and film studios located in the area.
The city’s economy is also driven by tourism, with millions of visitors coming to the city each year to visit its many attractions. Los Angeles is also home to a large number of universities and colleges, which contribute to the city’s economy.
Demographics
Los Angeles is one of the most diverse cities in the United States. The city’s population is made up of people from all over the world, including Mexico, Central America, South America, Asia, and Europe. The city is also home to a large number of African Americans, Latinos, and Asians.
The city’s population is also diverse in terms of religion, with many different faiths represented in the city. The city is also home to a large number of immigrants, with over one million foreign-born residents living in the city.
Los Angeles is a vibrant and diverse city, with a rich history, culture, and economy. The city is home to many attractions, including world-famous beaches, museums, and entertainment venues. The city is also home to a large and diverse population, making it one of the most interesting cities in the United States.
Common Questions
What is Per Capita Income in Many?
Per Capita income in Many is $23,291.
What is the Median Family Income in Many?
Median Family Income in Many is $14,438.
What is the Median Household income in Many?
Median Household Income in Many is $22,260.
What is Income or Wage Gap in Many?
Income or Wage Gap in Many is 49.7%.
Women in Many earn 50.3 cents for every dollar earned by a man.
What is Inequality or Gini Index in Many?
Inequality or Gini Index in Many is 0.61.
What is the Total Population of Many?
Total Population of Many is 2,566.
What is the Total Male Population of Many?
Total Male Population of Many is 1,163.
What is the Total Female Population of Many?
Total Female Population of Many is 1,403.
What is the Ratio of Males per 100 Females in Many?
There are 82.89 Males per 100 Females in Many.
What is the Ratio of Females per 100 Males in Many?
There are 120.64 Females per 100 Males in Many.
What is the Median Population Age in Many?
Median Population Age in Many is 37.3 Years.
What is the Average Family Size in Many
Average Family Size in Many is 3.2 People.
What is the Average Household Size in Many
Average Household Size in Many is 2.5 People.
How Large is the Labor Force in Many?
There are 821 People in the Labor Forcein in Many.
What is the Percentage of People in the Labor Force in Many?
38.3% of People are in the Labor Force in Many.
What is the Unemployment Rate in Many?
Unemployment Rate in Many is 8.3%.