Mansura, LA Map & Demographics
Mansura Map
Mansura Overview
$14,945
PER CAPITA INCOME
$21,394
AVG FAMILY INCOME
$21,173
AVG HOUSEHOLD INCOME
23.7%
WAGE / INCOME GAP [ % ]
76.3¢/ $1
WAGE / INCOME GAP [ $ ]
$9,443
FAMILY INCOME DEFICIT
0.42
INEQUALITY / GINI INDEX
1,376
TOTAL POPULATION
519
MALE POPULATION
857
FEMALE POPULATION
60.56
MALES / 100 FEMALES
165.13
FEMALES / 100 MALES
49.1
MEDIAN AGE
2.8
AVG FAMILY SIZE
2.2
AVG HOUSEHOLD SIZE
531
LABOR FORCE [ PEOPLE ]
44.3%
PERCENT IN LABOR FORCE
23.2%
UNEMPLOYMENT RATE
Mansura Zip Codes
Mansura Area Codes
Income in Mansura
Income Overview in Mansura
Per Capita Income in Mansura is $14,945, while median incomes of families and households are $21,394 and $21,173 respectively.
| Characteristic | Number | Measure |
| Per Capita Income | 1,376 | $14,945 |
| Median Family Income | 291 | $21,394 |
| Mean Family Income | 291 | $32,907 |
| Median Household Income | 564 | $21,173 |
| Mean Household Income | 564 | $27,684 |
| Income Deficit | 291 | $9,443 |
| Wage / Income Gap (%) | 1,376 | 23.66% |
| Wage / Income Gap ($) | 1,376 | 76.34¢ per $1 |
| Gini / Inequality Index | 1,376 | 0.42 |
Earnings by Sex in Mansura
Average Earnings in Mansura are $14,547, $16,563 for men and $12,645 for women, a difference of 23.7%.
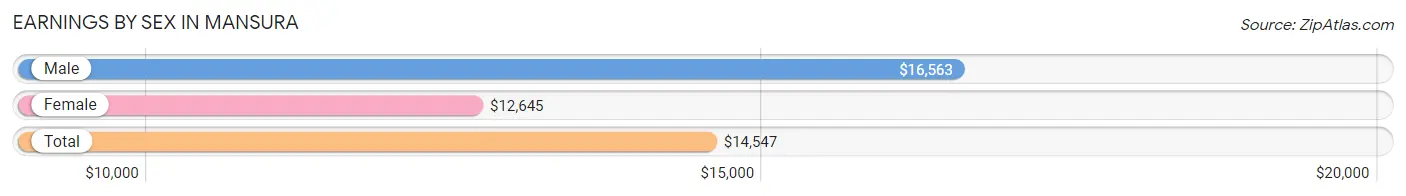
| Sex | Number | Average Earnings |
| Male | 196 (38.1%) | $16,563 |
| Female | 319 (61.9%) | $12,645 |
| Total | 515 (100.0%) | $14,547 |
Earnings by Sex by Income Bracket in Mansura
The most common earnings brackets in Mansura are $15,000 to $17,499 for men (48 | 24.5%) and $10,000 to $12,499 for women (67 | 21.0%).
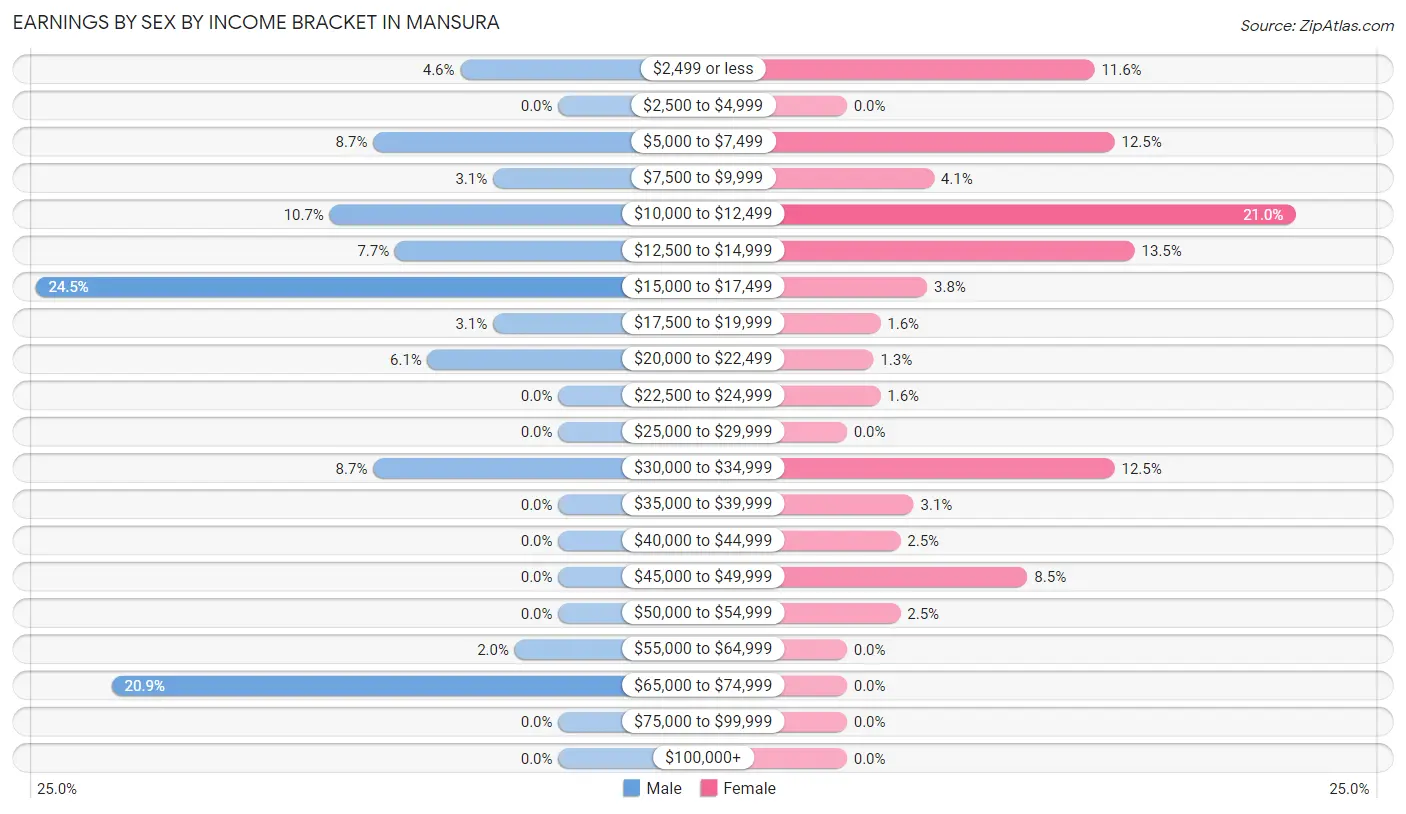
| Income | Male | Female |
| $2,499 or less | 9 (4.6%) | 37 (11.6%) |
| $2,500 to $4,999 | 0 (0.0%) | 0 (0.0%) |
| $5,000 to $7,499 | 17 (8.7%) | 40 (12.5%) |
| $7,500 to $9,999 | 6 (3.1%) | 13 (4.1%) |
| $10,000 to $12,499 | 21 (10.7%) | 67 (21.0%) |
| $12,500 to $14,999 | 15 (7.6%) | 43 (13.5%) |
| $15,000 to $17,499 | 48 (24.5%) | 12 (3.8%) |
| $17,500 to $19,999 | 6 (3.1%) | 5 (1.6%) |
| $20,000 to $22,499 | 12 (6.1%) | 4 (1.3%) |
| $22,500 to $24,999 | 0 (0.0%) | 5 (1.6%) |
| $25,000 to $29,999 | 0 (0.0%) | 0 (0.0%) |
| $30,000 to $34,999 | 17 (8.7%) | 40 (12.5%) |
| $35,000 to $39,999 | 0 (0.0%) | 10 (3.1%) |
| $40,000 to $44,999 | 0 (0.0%) | 8 (2.5%) |
| $45,000 to $49,999 | 0 (0.0%) | 27 (8.5%) |
| $50,000 to $54,999 | 0 (0.0%) | 8 (2.5%) |
| $55,000 to $64,999 | 4 (2.0%) | 0 (0.0%) |
| $65,000 to $74,999 | 41 (20.9%) | 0 (0.0%) |
| $75,000 to $99,999 | 0 (0.0%) | 0 (0.0%) |
| $100,000+ | 0 (0.0%) | 0 (0.0%) |
| Total | 196 (100.0%) | 319 (100.0%) |
Earnings by Sex by Educational Attainment in Mansura
Average earnings in Mansura are $16,328 for men and $13,357 for women, a difference of 18.2%. Men with an educational attainment of college or associate's degree enjoy the highest average annual earnings of $18,542, while those with high school diploma education earn the least with $15,096. Women with an educational attainment of college or associate's degree earn the most with the average annual earnings of $13,393, while those with less than high school education have the smallest earnings of $2,499.
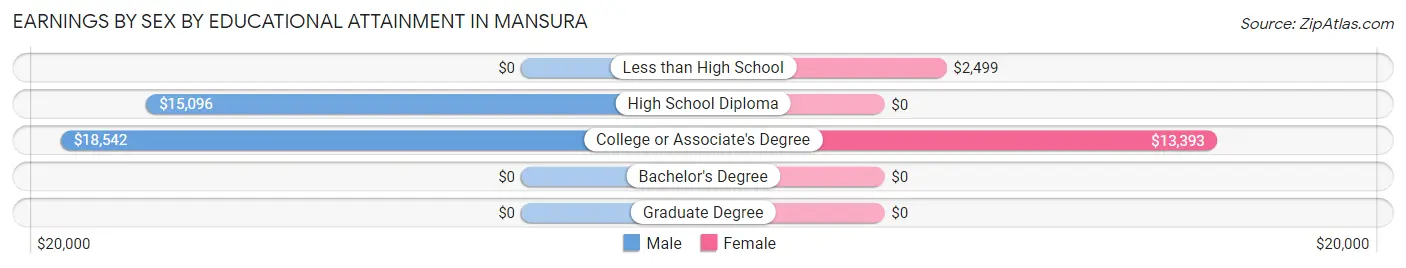
| Educational Attainment | Male Income | Female Income |
| Less than High School | - | - |
| High School Diploma | $15,096 | $0 |
| College or Associate's Degree | $18,542 | $13,393 |
| Bachelor's Degree | - | - |
| Graduate Degree | - | - |
| Total | $16,328 | $13,357 |
Family Income in Mansura
Family Income Brackets in Mansura
According to the Mansura family income data, there are 77 families falling into the $15,000 to $24,999 income range, which is the most common income bracket and makes up 26.5% of all families.
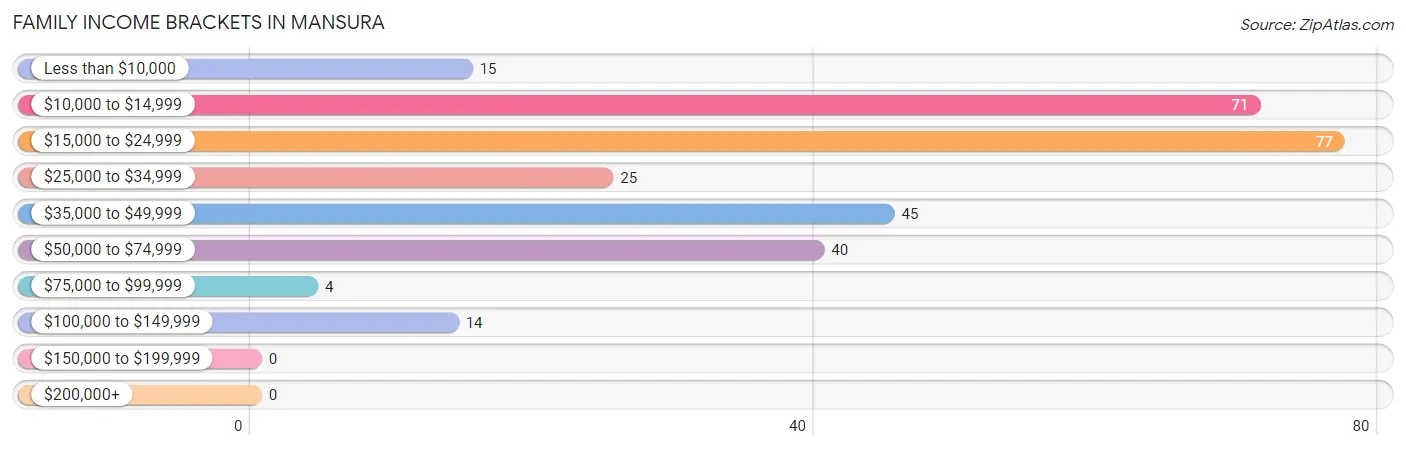
| Income Bracket | # Families | % Families |
| Less than $10,000 | 15 | 5.2% |
| $10,000 to $14,999 | 71 | 24.4% |
| $15,000 to $24,999 | 77 | 26.5% |
| $25,000 to $34,999 | 25 | 8.6% |
| $35,000 to $49,999 | 45 | 15.5% |
| $50,000 to $74,999 | 40 | 13.7% |
| $75,000 to $99,999 | 4 | 1.4% |
| $100,000 to $149,999 | 14 | 4.8% |
| $150,000 to $199,999 | 0 | 0.0% |
| $200,000+ | 0 | 0.0% |
Family Income by Famaliy Size in Mansura
3-person families (124 | 42.6%) account for the highest median family income in Mansura with $26,029 per family, while 3-person families (124 | 42.6%) have the highest median income of $8,676 per family member.
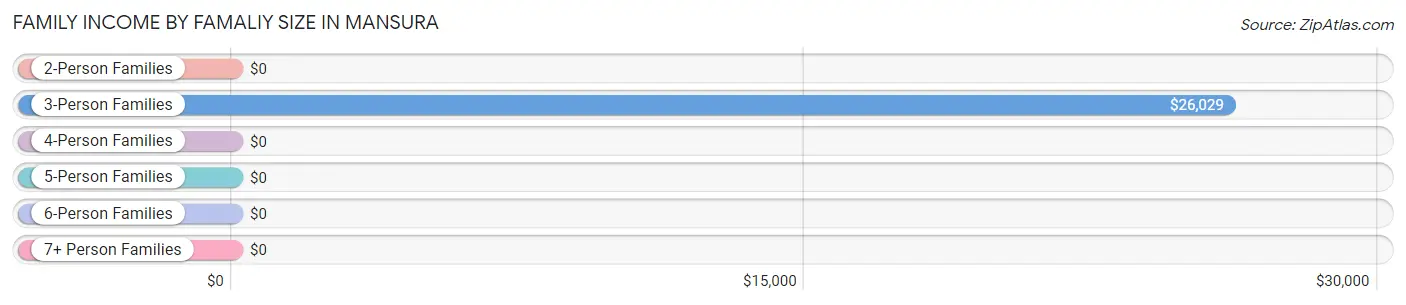
| Income Bracket | # Families | Median Income |
| 2-Person Families | 142 (48.8%) | $0 |
| 3-Person Families | 124 (42.6%) | $26,029 |
| 4-Person Families | 10 (3.4%) | $0 |
| 5-Person Families | 15 (5.1%) | $0 |
| 6-Person Families | 0 (0.0%) | $0 |
| 7+ Person Families | 0 (0.0%) | $0 |
| Total | 291 (100.0%) | $21,394 |
Family Income by Number of Earners in Mansura
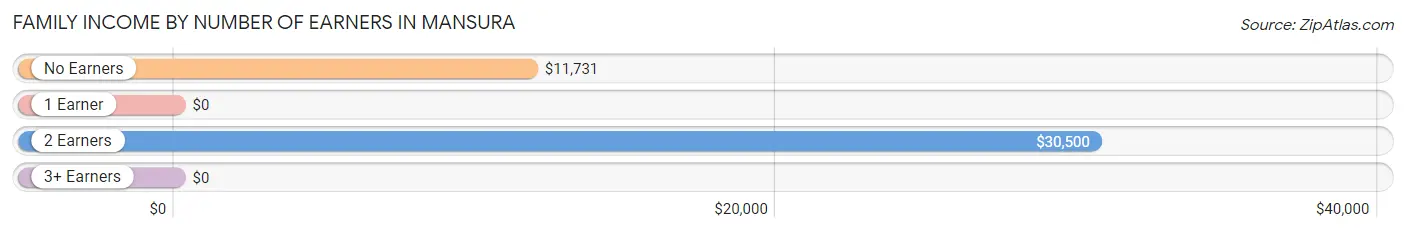
| Number of Earners | # Families | Median Income |
| No Earners | 60 (20.6%) | $11,731 |
| 1 Earner | 165 (56.7%) | $0 |
| 2 Earners | 66 (22.7%) | $30,500 |
| 3+ Earners | 0 (0.0%) | $0 |
| Total | 291 (100.0%) | $21,394 |
Household Income in Mansura
Household Income Brackets in Mansura
With 161 households falling in the category, the $15,000 to $24,999 income range is the most frequent in Mansura, accounting for 28.5% of all households.
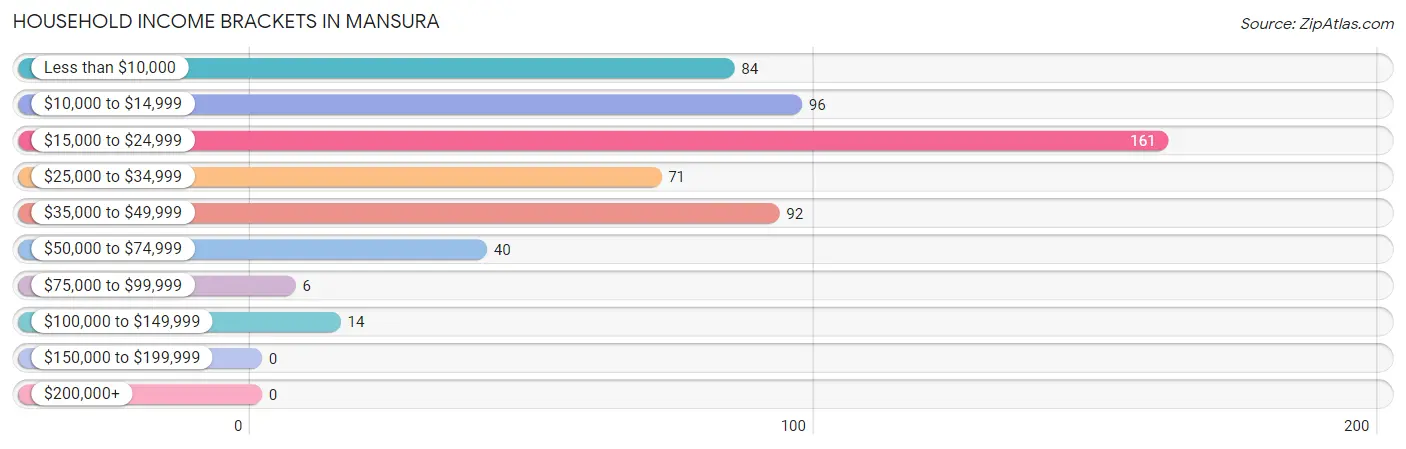
| Income Bracket | # Households | % Households |
| Less than $10,000 | 84 | 14.9% |
| $10,000 to $14,999 | 96 | 17.0% |
| $15,000 to $24,999 | 161 | 28.5% |
| $25,000 to $34,999 | 71 | 12.6% |
| $35,000 to $49,999 | 92 | 16.3% |
| $50,000 to $74,999 | 40 | 7.1% |
| $75,000 to $99,999 | 6 | 1.1% |
| $100,000 to $149,999 | 14 | 2.5% |
| $150,000 to $199,999 | 0 | 0.0% |
| $200,000+ | 0 | 0.0% |
Household Income by Householder Age in Mansura
The median household income in Mansura is $21,173, with the highest median household income of $24,167 found in the 65+ years age bracket for the primary householder. A total of 132 households (23.4%) fall into this category. Meanwhile, the 15 to 24 years age bracket for the primary householder has the lowest median household income of $0, with 17 households (3.0%) in this group.
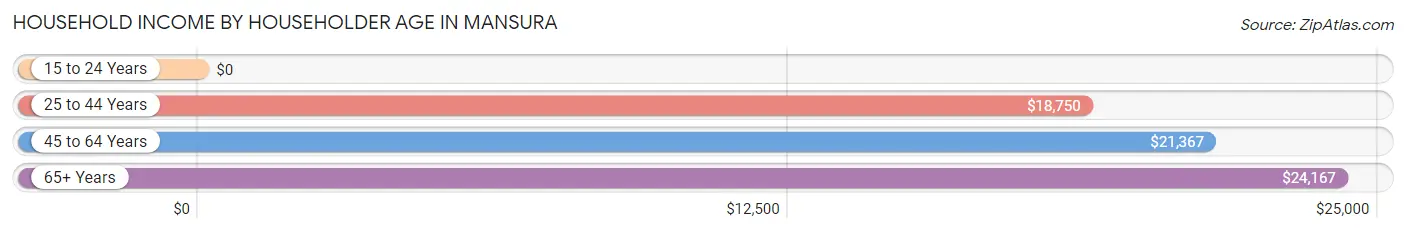
| Income Bracket | # Households | Median Income |
| 15 to 24 Years | 17 (3.0%) | $0 |
| 25 to 44 Years | 104 (18.4%) | $18,750 |
| 45 to 64 Years | 311 (55.1%) | $21,367 |
| 65+ Years | 132 (23.4%) | $24,167 |
| Total | 564 (100.0%) | $21,173 |
Poverty in Mansura
Income Below Poverty by Sex and Age in Mansura
With 44.6% poverty level for males and 49.0% for females among the residents of Mansura, under 5 year old males and 15 year old females are the most vulnerable to poverty, with 18 males (100.0%) and 3 females (100.0%) in their respective age groups living below the poverty level.
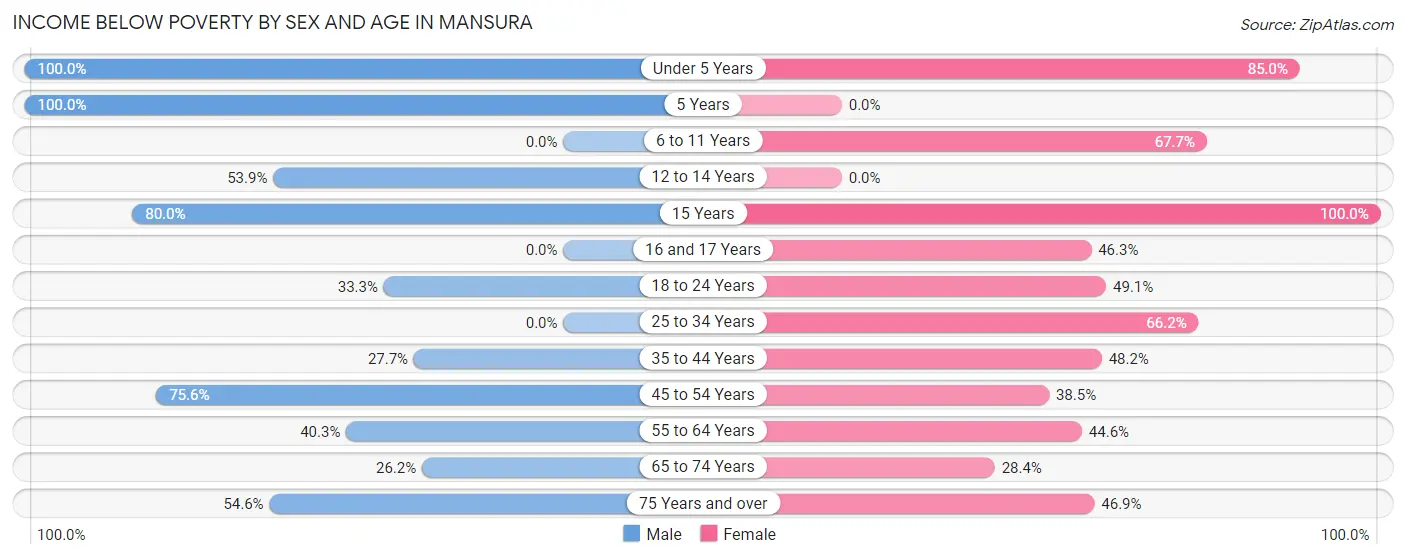
| Age Bracket | Male | Female |
| Under 5 Years | 18 (100.0%) | 34 (85.0%) |
| 5 Years | 10 (100.0%) | 0 (0.0%) |
| 6 to 11 Years | 0 (0.0%) | 21 (67.7%) |
| 12 to 14 Years | 21 (53.8%) | 0 (0.0%) |
| 15 Years | 8 (80.0%) | 3 (100.0%) |
| 16 and 17 Years | 0 (0.0%) | 25 (46.3%) |
| 18 to 24 Years | 3 (33.3%) | 52 (49.1%) |
| 25 to 34 Years | 0 (0.0%) | 47 (66.2%) |
| 35 to 44 Years | 33 (27.7%) | 41 (48.2%) |
| 45 to 54 Years | 68 (75.6%) | 30 (38.5%) |
| 55 to 64 Years | 27 (40.3%) | 78 (44.6%) |
| 65 to 74 Years | 16 (26.2%) | 21 (28.4%) |
| 75 Years and over | 6 (54.5%) | 15 (46.9%) |
| Total | 210 (44.6%) | 367 (49.0%) |
Income Above Poverty by Sex and Age in Mansura
According to the poverty statistics in Mansura, males aged 6 to 11 years and females aged 65 to 74 years are the age groups that are most secure financially, with 100.0% of males and 71.6% of females in these age groups living above the poverty line.
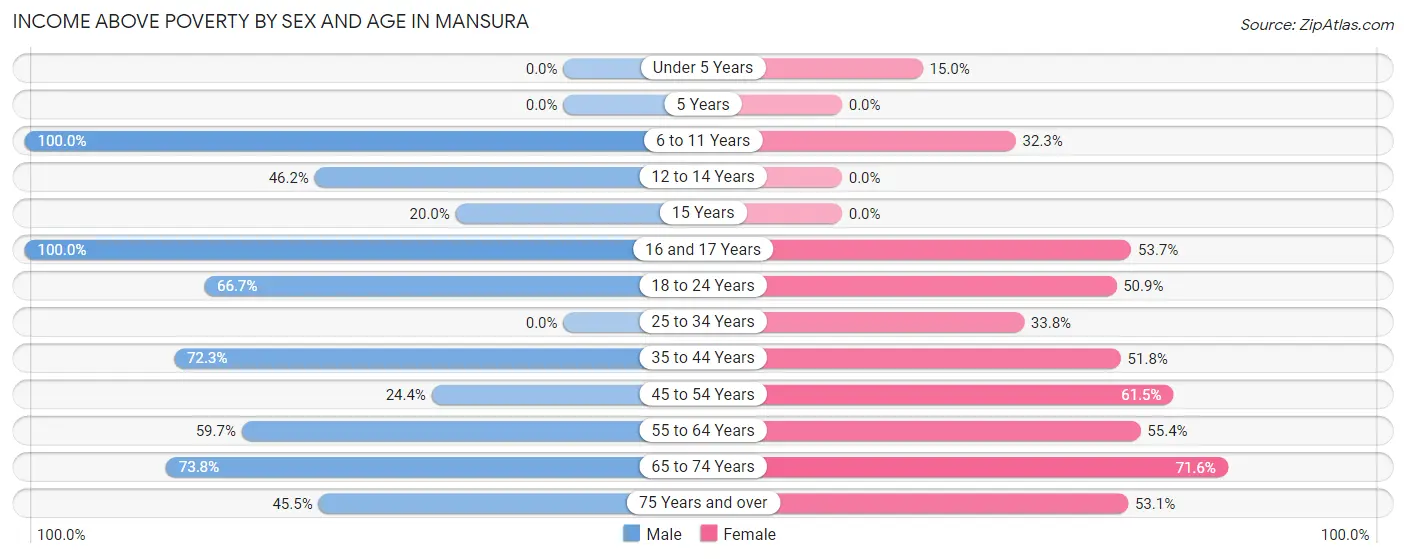
| Age Bracket | Male | Female |
| Under 5 Years | 0 (0.0%) | 6 (15.0%) |
| 5 Years | 0 (0.0%) | 0 (0.0%) |
| 6 to 11 Years | 3 (100.0%) | 10 (32.3%) |
| 12 to 14 Years | 18 (46.2%) | 0 (0.0%) |
| 15 Years | 2 (20.0%) | 0 (0.0%) |
| 16 and 17 Years | 34 (100.0%) | 29 (53.7%) |
| 18 to 24 Years | 6 (66.7%) | 54 (50.9%) |
| 25 to 34 Years | 0 (0.0%) | 24 (33.8%) |
| 35 to 44 Years | 86 (72.3%) | 44 (51.8%) |
| 45 to 54 Years | 22 (24.4%) | 48 (61.5%) |
| 55 to 64 Years | 40 (59.7%) | 97 (55.4%) |
| 65 to 74 Years | 45 (73.8%) | 53 (71.6%) |
| 75 Years and over | 5 (45.5%) | 17 (53.1%) |
| Total | 261 (55.4%) | 382 (51.0%) |
Income Below Poverty Among Married-Couple Families in Mansura
The poverty statistics for married-couple families in Mansura show that 48.3% or 43 of the total 89 families live below the poverty line. Families with 3 or 4 children have the highest poverty rate of 100.0%, comprising of 3 families. On the other hand, families with 1 or 2 children have the lowest poverty rate of 0.0%, which includes 0 families.
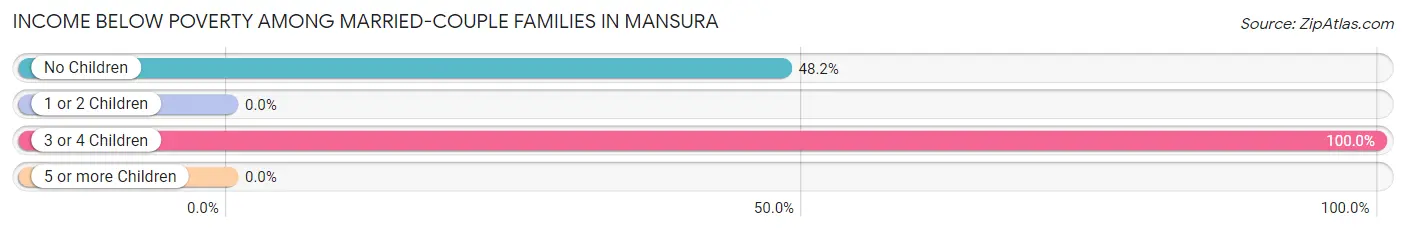
| Children | Above Poverty | Below Poverty |
| No Children | 43 (51.8%) | 40 (48.2%) |
| 1 or 2 Children | 3 (100.0%) | 0 (0.0%) |
| 3 or 4 Children | 0 (0.0%) | 3 (100.0%) |
| 5 or more Children | 0 (0.0%) | 0 (0.0%) |
| Total | 46 (51.7%) | 43 (48.3%) |
Income Below Poverty Among Single-Parent Households in Mansura
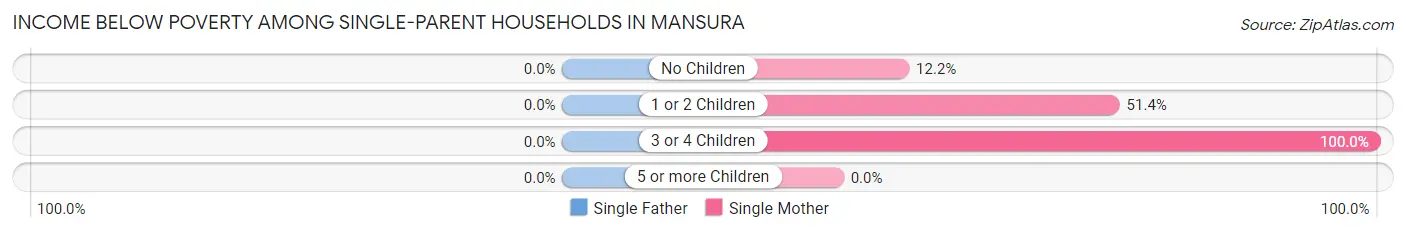
| Children | Single Father | Single Mother |
| No Children | 0 (0.0%) | 5 (12.2%) |
| 1 or 2 Children | 0 (0.0%) | 73 (51.4%) |
| 3 or 4 Children | 0 (0.0%) | 19 (100.0%) |
| 5 or more Children | 0 (0.0%) | 0 (0.0%) |
| Total | 0 (0.0%) | 97 (48.0%) |
Income Below Poverty Among Married-Couple vs Single-Parent Households in Mansura
The poverty data for Mansura shows that 43 of the married-couple family households (48.3%) and 97 of the single-parent households (48.0%) are living below the poverty level. Within the married-couple family households, those with 3 or 4 children have the highest poverty rate, with 3 households (100.0%) falling below the poverty line. Among the single-parent households, those with 3 or 4 children have the highest poverty rate, with 19 household (100.0%) living below poverty.
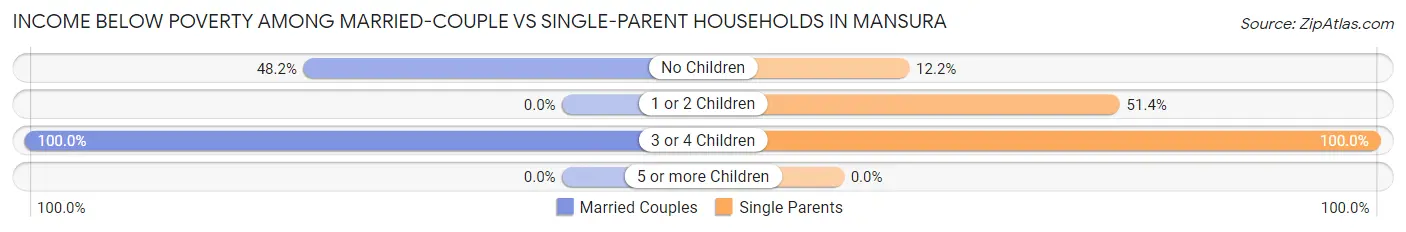
| Children | Married-Couple Families | Single-Parent Households |
| No Children | 40 (48.2%) | 5 (12.2%) |
| 1 or 2 Children | 0 (0.0%) | 73 (51.4%) |
| 3 or 4 Children | 3 (100.0%) | 19 (100.0%) |
| 5 or more Children | 0 (0.0%) | 0 (0.0%) |
| Total | 43 (48.3%) | 97 (48.0%) |
Race in Mansura
The most populous races in Mansura are Black / African American (859 | 62.4%), White / Caucasian (422 | 30.7%), and Two or more Races (78 | 5.7%).
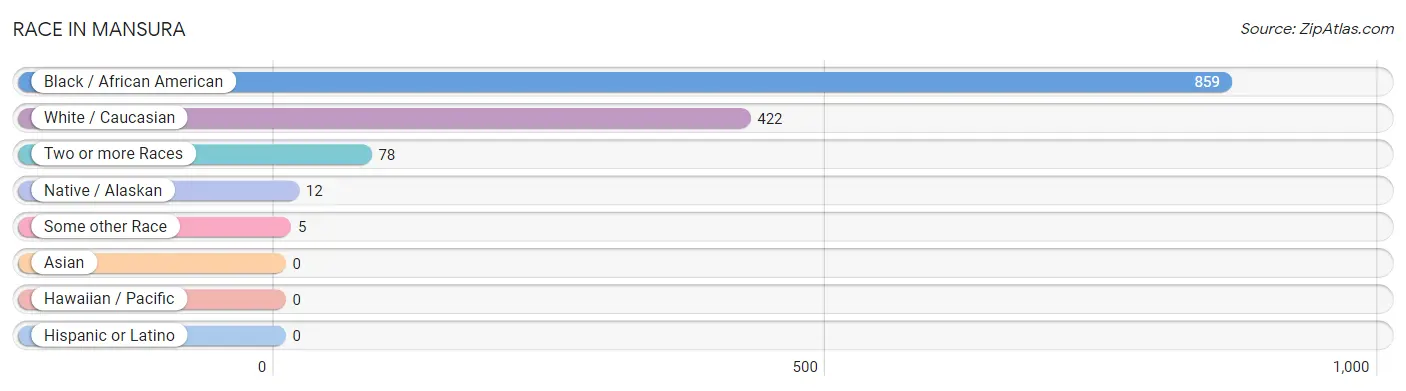
| Race | # Population | % Population |
| Asian | 0 | 0.0% |
| Black / African American | 859 | 62.4% |
| Hawaiian / Pacific | 0 | 0.0% |
| Hispanic or Latino | 0 | 0.0% |
| Native / Alaskan | 12 | 0.9% |
| White / Caucasian | 422 | 30.7% |
| Two or more Races | 78 | 5.7% |
| Some other Race | 5 | 0.4% |
| Total | 1,376 | 100.0% |
Ancestry in Mansura
The most populous ancestries reported in Mansura are French (175 | 12.7%), American (107 | 7.8%), Italian (58 | 4.2%), English (56 | 4.1%), and Arab (35 | 2.5%), together accounting for 31.3% of all Mansura residents.
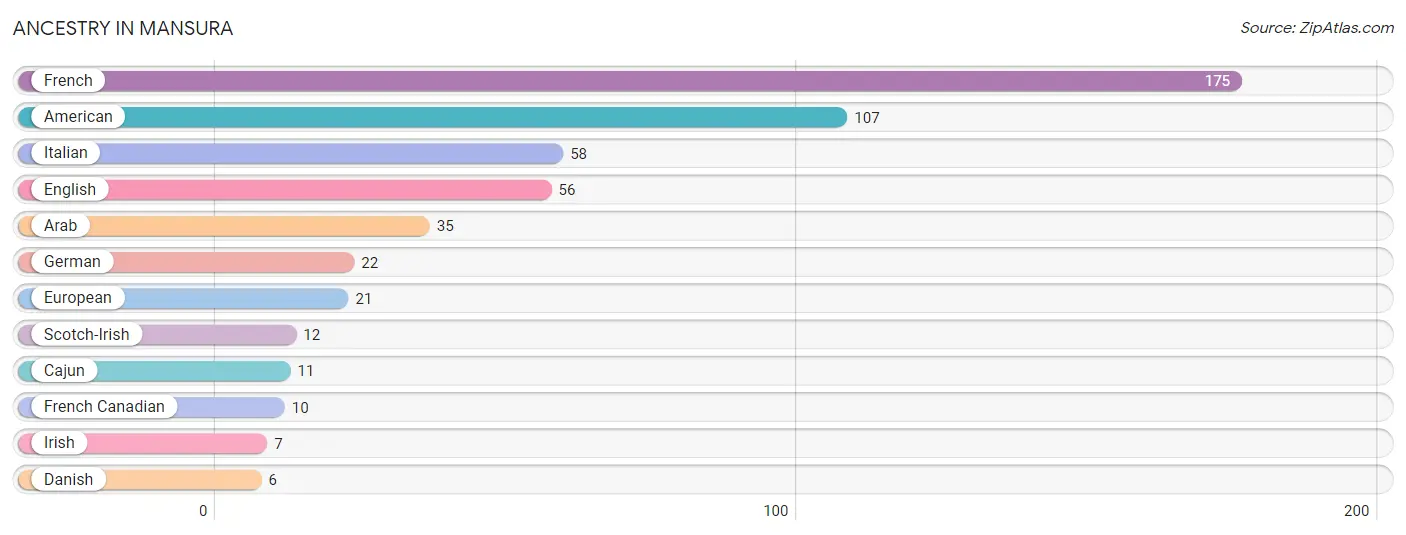
| Ancestry | # Population | % Population |
| American | 107 | 7.8% |
| Arab | 35 | 2.5% |
| Cajun | 11 | 0.8% |
| Danish | 6 | 0.4% |
| English | 56 | 4.1% |
| European | 21 | 1.5% |
| French | 175 | 12.7% |
| French Canadian | 10 | 0.7% |
| German | 22 | 1.6% |
| Irish | 7 | 0.5% |
| Italian | 58 | 4.2% |
| Scotch-Irish | 12 | 0.9% | View All 12 Rows |
Immigrants in Mansura

| Immigration Origin | # Population | % Population | View All 0 Rows |
Sex and Age in Mansura
Sex and Age in Mansura
The most populous age groups in Mansura are 40 to 44 Years (84 | 16.2%) for men and 60 to 64 Years (92 | 10.7%) for women.
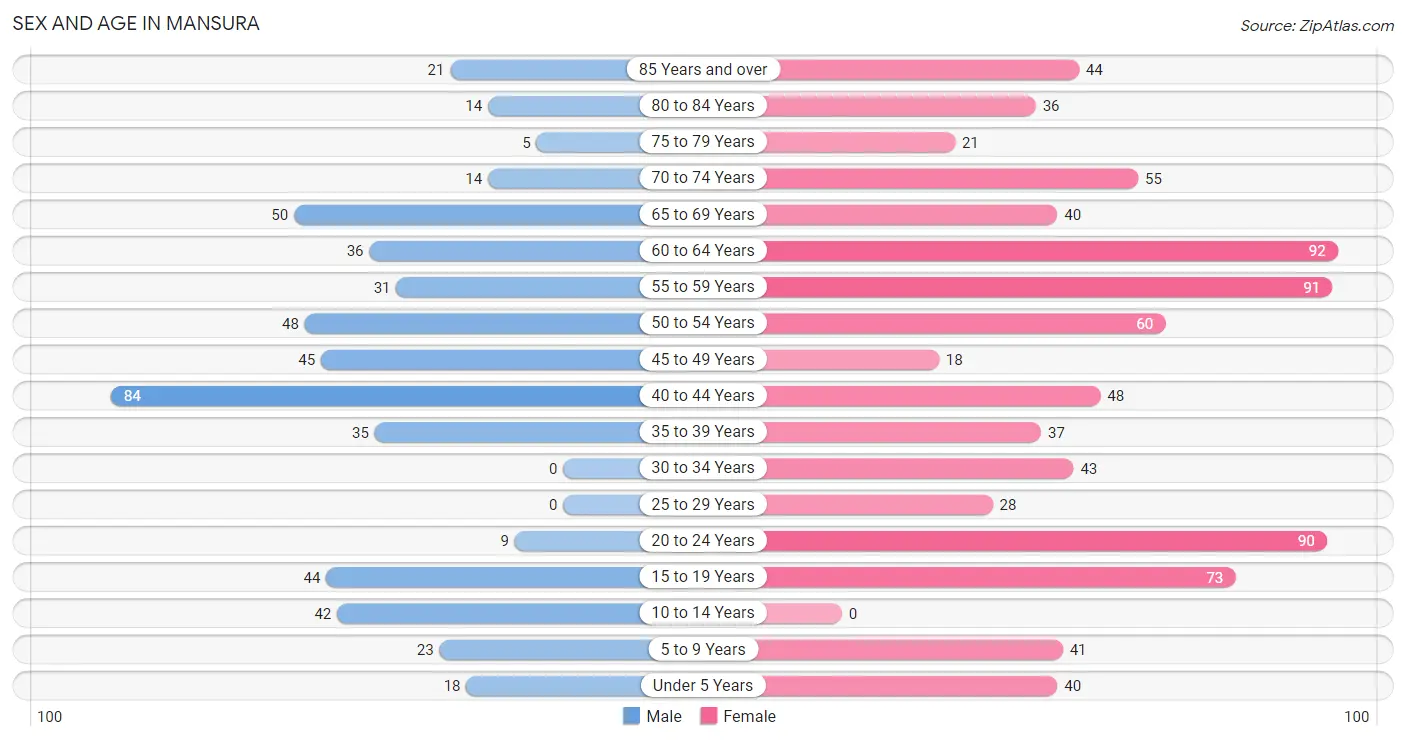
| Age Bracket | Male | Female |
| Under 5 Years | 18 (3.5%) | 40 (4.7%) |
| 5 to 9 Years | 23 (4.4%) | 41 (4.8%) |
| 10 to 14 Years | 42 (8.1%) | 0 (0.0%) |
| 15 to 19 Years | 44 (8.5%) | 73 (8.5%) |
| 20 to 24 Years | 9 (1.7%) | 90 (10.5%) |
| 25 to 29 Years | 0 (0.0%) | 28 (3.3%) |
| 30 to 34 Years | 0 (0.0%) | 43 (5.0%) |
| 35 to 39 Years | 35 (6.7%) | 37 (4.3%) |
| 40 to 44 Years | 84 (16.2%) | 48 (5.6%) |
| 45 to 49 Years | 45 (8.7%) | 18 (2.1%) |
| 50 to 54 Years | 48 (9.2%) | 60 (7.0%) |
| 55 to 59 Years | 31 (6.0%) | 91 (10.6%) |
| 60 to 64 Years | 36 (6.9%) | 92 (10.7%) |
| 65 to 69 Years | 50 (9.6%) | 40 (4.7%) |
| 70 to 74 Years | 14 (2.7%) | 55 (6.4%) |
| 75 to 79 Years | 5 (1.0%) | 21 (2.5%) |
| 80 to 84 Years | 14 (2.7%) | 36 (4.2%) |
| 85 Years and over | 21 (4.1%) | 44 (5.1%) |
| Total | 519 (100.0%) | 857 (100.0%) |
Families and Households in Mansura
Median Family Size in Mansura
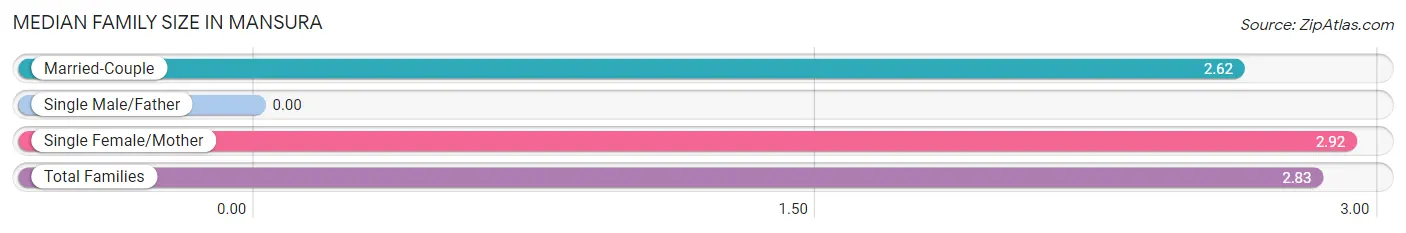
| Family Type | # Families | Family Size |
| Married-Couple | 89 (30.6%) | 2.62 |
| Single Male/Father | 0 (0.0%) | - |
| Single Female/Mother | 202 (69.4%) | 2.92 |
| Total Families | 291 (100.0%) | 2.83 |
Median Household Size in Mansura
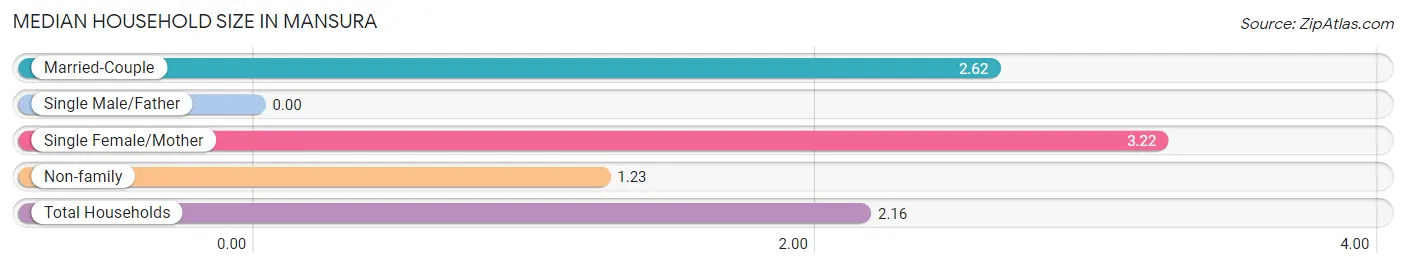
| Household Type | # Households | Household Size |
| Married-Couple | 89 (15.8%) | 2.62 |
| Single Male/Father | 0 (0.0%) | - |
| Single Female/Mother | 202 (35.8%) | 3.22 |
| Non-family | 273 (48.4%) | 1.23 |
| Total Households | 564 (100.0%) | 2.16 |
Household Size by Marriage Status in Mansura
Out of a total of 564 households in Mansura, 291 (51.6%) are family households, while 273 (48.4%) are nonfamily households. The most numerous type of family households are 2-person households, comprising 142, and the most common type of nonfamily households are 1-person households, comprising 227.
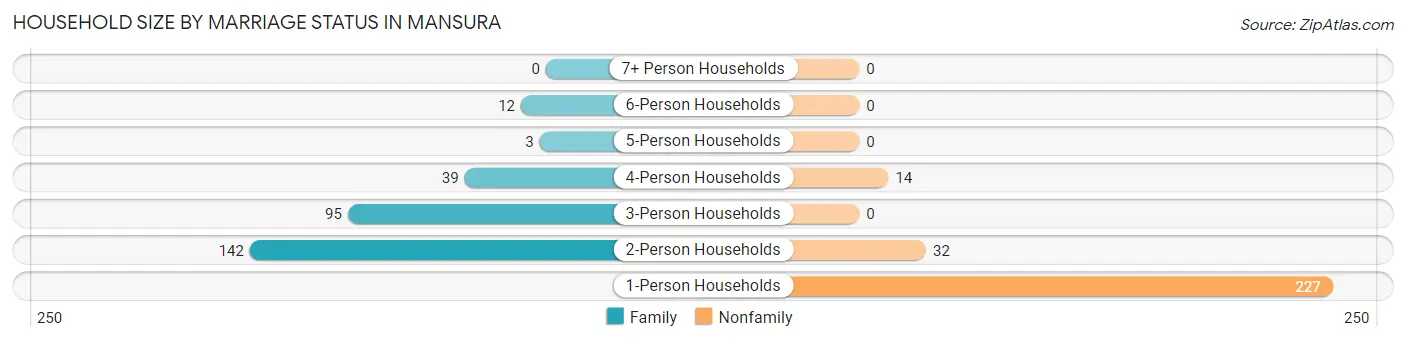
| Household Size | Family Households | Nonfamily Households |
| 1-Person Households | - | 227 (40.3%) |
| 2-Person Households | 142 (25.2%) | 32 (5.7%) |
| 3-Person Households | 95 (16.8%) | 0 (0.0%) |
| 4-Person Households | 39 (6.9%) | 14 (2.5%) |
| 5-Person Households | 3 (0.5%) | 0 (0.0%) |
| 6-Person Households | 12 (2.1%) | 0 (0.0%) |
| 7+ Person Households | 0 (0.0%) | 0 (0.0%) |
| Total | 291 (51.6%) | 273 (48.4%) |
Female Fertility in Mansura
Fertility by Age in Mansura
Average fertility rate in Mansura is 128.0 births per 1,000 women. Women in the age bracket of 20 to 34 years have the highest fertility rate with 180.0 births per 1,000 women. Women in the age bracket of 20 to 34 years acount for 61.7% of all women with births.
| Age Bracket | Women with Births | Births / 1,000 Women |
| 15 to 19 years | 0 (0.0%) | 0.0 |
| 20 to 34 years | 29 (61.7%) | 180.0 |
| 35 to 50 years | 18 (38.3%) | 136.0 |
| Total | 47 (100.0%) | 128.0 |
Fertility by Age by Marriage Status in Mansura
14.9% of women with births (47) in Mansura are married. The highest percentage of unmarried women with births falls into 20 to 34 years age bracket with 89.7% of them unmarried at the time of birth, while the lowest percentage of unmarried women with births belong to 35 to 50 years age bracket with 77.8% of them unmarried.
| Age Bracket | Married | Unmarried |
| 15 to 19 years | 0 (0.0%) | 0 (0.0%) |
| 20 to 34 years | 3 (10.3%) | 26 (89.7%) |
| 35 to 50 years | 4 (22.2%) | 14 (77.8%) |
| Total | 7 (14.9%) | 40 (85.1%) |
Fertility by Education in Mansura
| Educational Attainment | Women with Births | Births / 1,000 Women |
| Less than High School | 0 (0.0%) | 0.0 |
| High School Diploma | 18 (38.3%) | 220.0 |
| College or Associate's Degree | 29 (61.7%) | 225.0 |
| Bachelor's Degree | 0 (0.0%) | 0.0 |
| Graduate Degree | 0 (0.0%) | 0.0 |
| Total | 47 (100.0%) | 128.0 |
Fertility by Education by Marriage Status in Mansura
85.1% of women with births in Mansura are unmarried. Women with the educational attainment of high school diploma are most likely to be married with 22.2% of them married at childbirth, while women with the educational attainment of college or associate's degree are least likely to be married with 89.7% of them unmarried at childbirth.
| Educational Attainment | Married | Unmarried |
| Less than High School | 0 (0.0%) | 0 (0.0%) |
| High School Diploma | 4 (22.2%) | 14 (77.8%) |
| College or Associate's Degree | 3 (10.3%) | 26 (89.7%) |
| Bachelor's Degree | 0 (0.0%) | 0 (0.0%) |
| Graduate Degree | 0 (0.0%) | 0 (0.0%) |
| Total | 7 (14.9%) | 40 (85.1%) |
Employment Characteristics in Mansura
Employment by Class of Employer in Mansura
Among the 408 employed individuals in Mansura, private company employees (273 | 66.9%), state government employees (63 | 15.4%), and not-for-profit organizations (39 | 9.6%) make up the most common classes of employment.
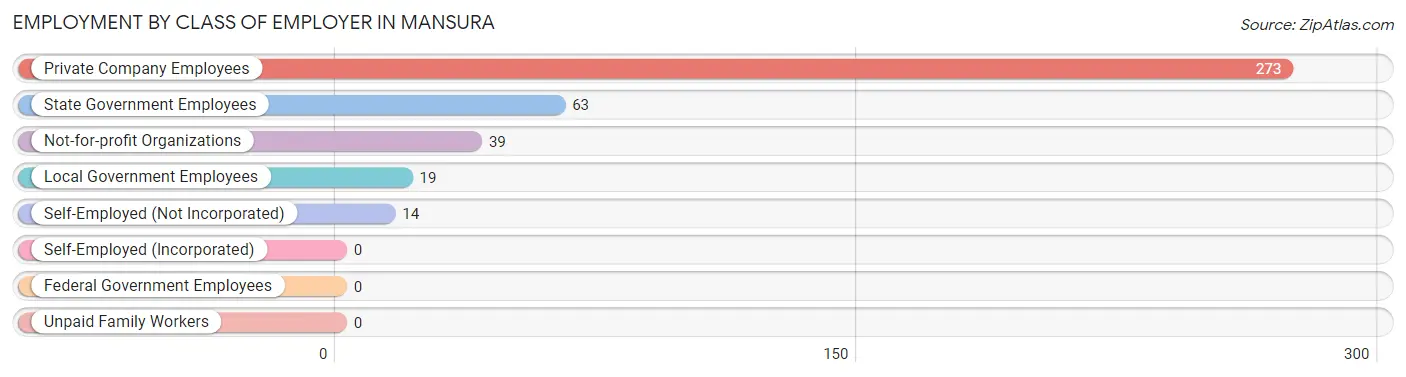
| Employer Class | # Employees | % Employees |
| Private Company Employees | 273 | 66.9% |
| Self-Employed (Incorporated) | 0 | 0.0% |
| Self-Employed (Not Incorporated) | 14 | 3.4% |
| Not-for-profit Organizations | 39 | 9.6% |
| Local Government Employees | 19 | 4.7% |
| State Government Employees | 63 | 15.4% |
| Federal Government Employees | 0 | 0.0% |
| Unpaid Family Workers | 0 | 0.0% |
| Total | 408 | 100.0% |
Employment Status by Age in Mansura
According to the labor force statistics for Mansura, out of the total population over 16 years of age (1,199), 44.3% or 531 individuals are in the labor force, with 23.2% or 123 of them unemployed. The age group with the highest labor force participation rate is 25 to 29 years, with 100.0% or 28 individuals in the labor force. Within the labor force, the 30 to 34 years age range has the highest percentage of unemployed individuals, with 76.5% or 26 of them being unemployed.
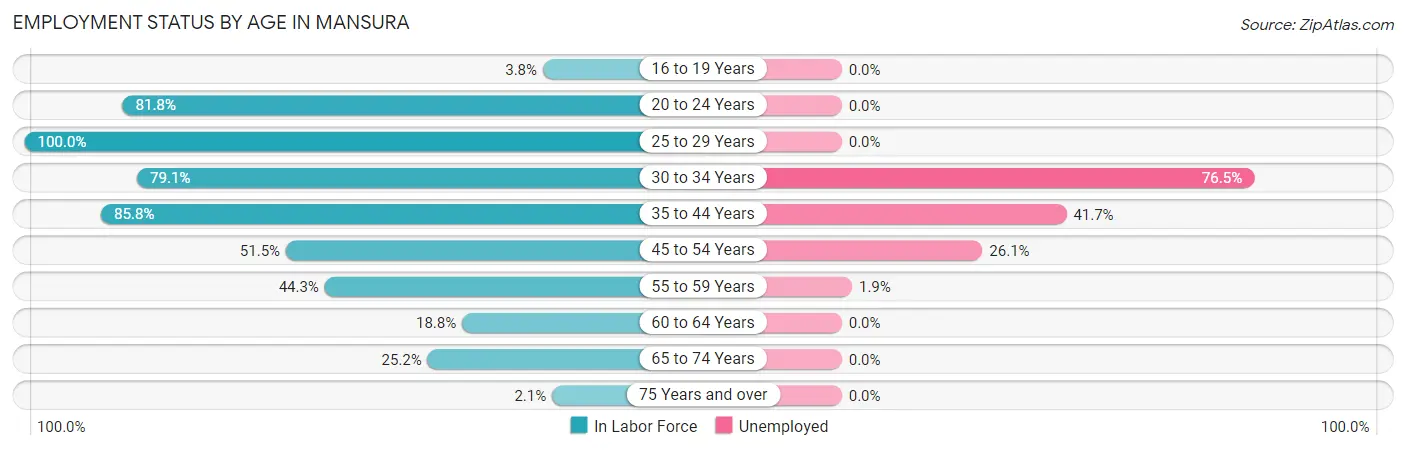
| Age Bracket | In Labor Force | Unemployed |
| 16 to 19 Years | 4 (3.8%) | 0 (0.0%) |
| 20 to 24 Years | 81 (81.8%) | 0 (0.0%) |
| 25 to 29 Years | 28 (100.0%) | 0 (0.0%) |
| 30 to 34 Years | 34 (79.1%) | 26 (76.5%) |
| 35 to 44 Years | 175 (85.8%) | 73 (41.7%) |
| 45 to 54 Years | 88 (51.5%) | 23 (26.1%) |
| 55 to 59 Years | 54 (44.3%) | 1 (1.9%) |
| 60 to 64 Years | 24 (18.8%) | 0 (0.0%) |
| 65 to 74 Years | 40 (25.2%) | 0 (0.0%) |
| 75 Years and over | 3 (2.1%) | 0 (0.0%) |
| Total | 531 (44.3%) | 123 (23.2%) |
Employment Status by Educational Attainment in Mansura
According to labor force statistics for Mansura, 57.9% of individuals (403) out of the total population between 25 and 64 years of age (696) are in the labor force, with 30.5% or 123 of them being unemployed. The group with the highest labor force participation rate are those with the educational attainment of bachelor's degree or higher, with 78.0% or 39 individuals in the labor force. Within the labor force, individuals with less than high school education have the highest percentage of unemployment, with 74.1% or 80 of them being unemployed.
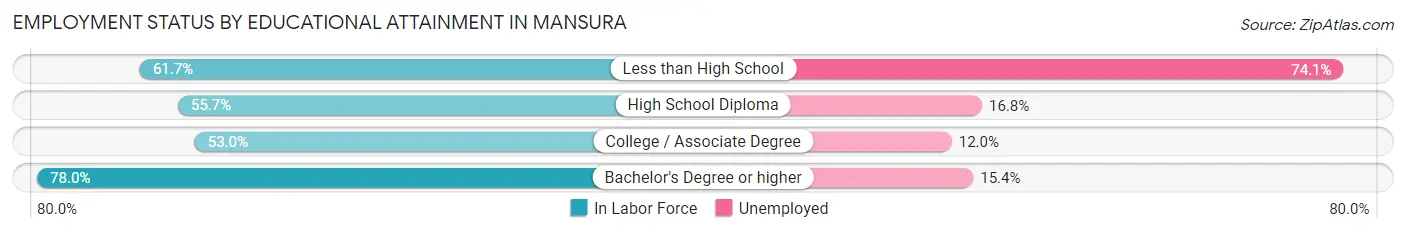
| Educational Attainment | In Labor Force | Unemployed |
| Less than High School | 108 (61.7%) | 130 (74.1%) |
| High School Diploma | 131 (55.7%) | 39 (16.8%) |
| College / Associate Degree | 125 (53.0%) | 28 (12.0%) |
| Bachelor's Degree or higher | 39 (78.0%) | 8 (15.4%) |
| Total | 403 (57.9%) | 212 (30.5%) |
Employment Occupations by Sex in Mansura
Management, Business, Science and Arts Occupations
The most common Management, Business, Science and Arts occupations in Mansura are Health Diagnosing & Treating (52 | 12.8%), Management (33 | 8.1%), Computers, Engineering & Science (16 | 3.9%), Computers & Mathematics (16 | 3.9%), and Business & Financial (4 | 1.0%).
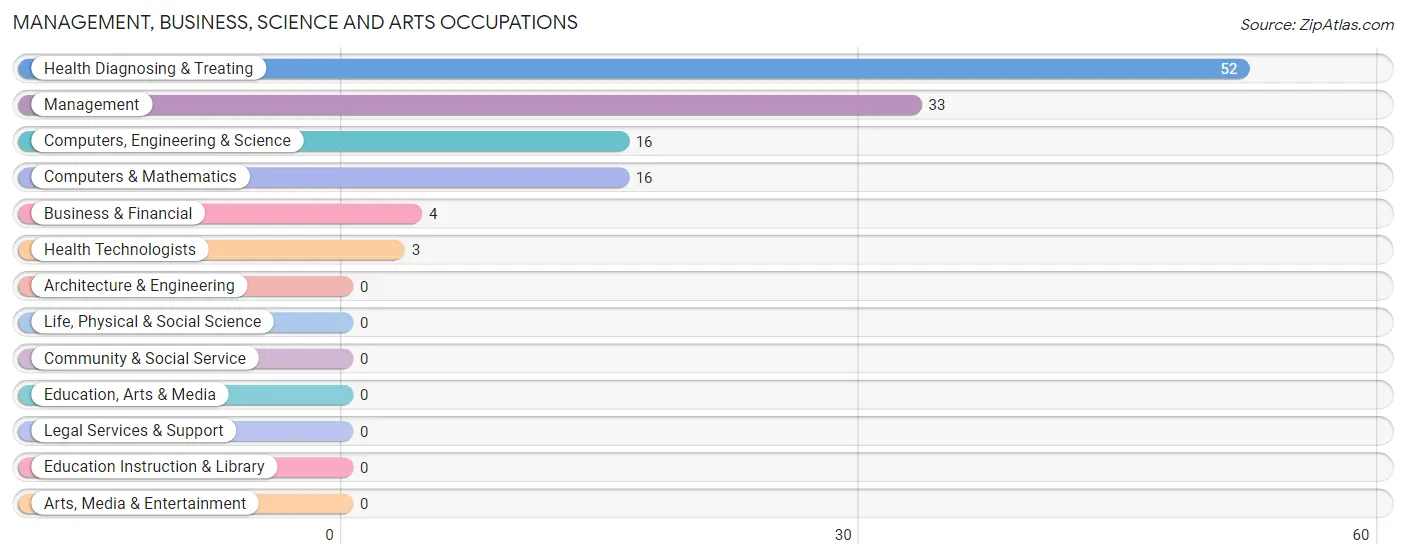
Management, Business, Science and Arts Occupations by Sex
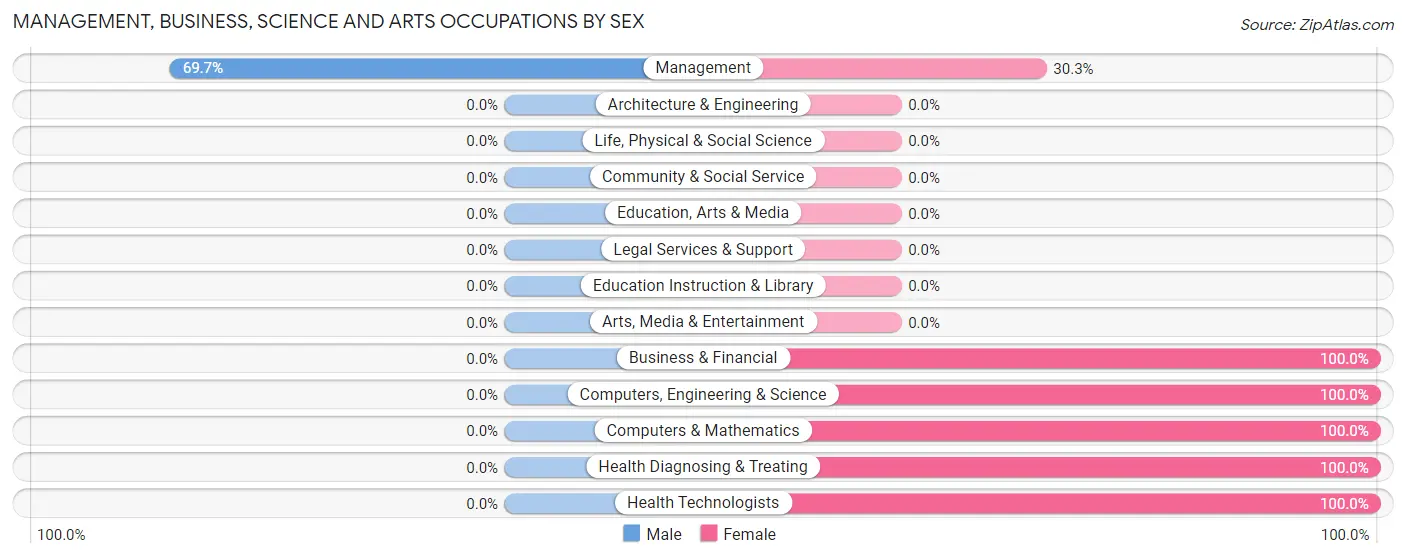
| Occupation | Male | Female |
| Management | 23 (69.7%) | 10 (30.3%) |
| Business & Financial | 0 (0.0%) | 4 (100.0%) |
| Computers, Engineering & Science | 0 (0.0%) | 16 (100.0%) |
| Computers & Mathematics | 0 (0.0%) | 16 (100.0%) |
| Architecture & Engineering | 0 (0.0%) | 0 (0.0%) |
| Life, Physical & Social Science | 0 (0.0%) | 0 (0.0%) |
| Community & Social Service | 0 (0.0%) | 0 (0.0%) |
| Education, Arts & Media | 0 (0.0%) | 0 (0.0%) |
| Legal Services & Support | 0 (0.0%) | 0 (0.0%) |
| Education Instruction & Library | 0 (0.0%) | 0 (0.0%) |
| Arts, Media & Entertainment | 0 (0.0%) | 0 (0.0%) |
| Health Diagnosing & Treating | 0 (0.0%) | 52 (100.0%) |
| Health Technologists | 0 (0.0%) | 3 (100.0%) |
| Total (Category) | 23 (21.9%) | 82 (78.1%) |
| Total (Overall) | 133 (32.6%) | 275 (67.4%) |
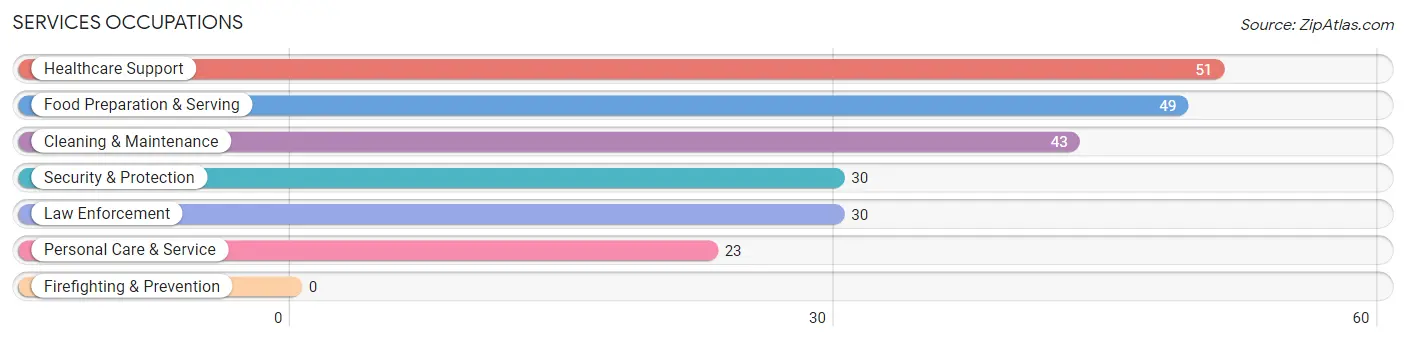
Services Occupations
The most common Services occupations in Mansura are Healthcare Support (51 | 12.5%), Food Preparation & Serving (49 | 12.0%), Cleaning & Maintenance (43 | 10.5%), Security & Protection (30 | 7.3%), and Law Enforcement (30 | 7.3%).
Services Occupations by Sex
Within the Services occupations in Mansura, the most male-oriented occupations are Cleaning & Maintenance (25.6%), Food Preparation & Serving (18.4%), and Security & Protection (10.0%), while the most female-oriented occupations are Healthcare Support (100.0%), Personal Care & Service (100.0%), and Security & Protection (90.0%).
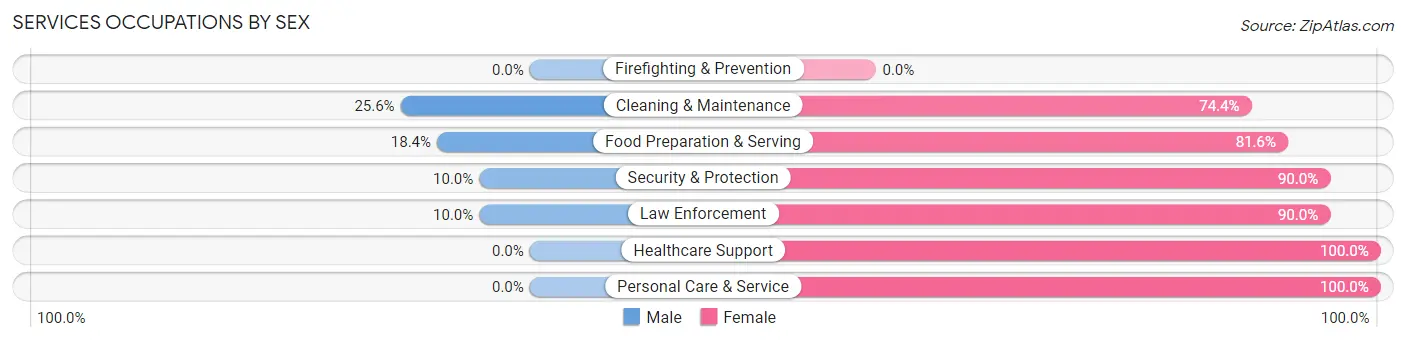
| Occupation | Male | Female |
| Healthcare Support | 0 (0.0%) | 51 (100.0%) |
| Security & Protection | 3 (10.0%) | 27 (90.0%) |
| Firefighting & Prevention | 0 (0.0%) | 0 (0.0%) |
| Law Enforcement | 3 (10.0%) | 27 (90.0%) |
| Food Preparation & Serving | 9 (18.4%) | 40 (81.6%) |
| Cleaning & Maintenance | 11 (25.6%) | 32 (74.4%) |
| Personal Care & Service | 0 (0.0%) | 23 (100.0%) |
| Total (Category) | 23 (11.7%) | 173 (88.3%) |
| Total (Overall) | 133 (32.6%) | 275 (67.4%) |
Sales and Office Occupations
The most common Sales and Office occupations in Mansura are Office & Administration (17 | 4.2%), and Sales & Related (15 | 3.7%).
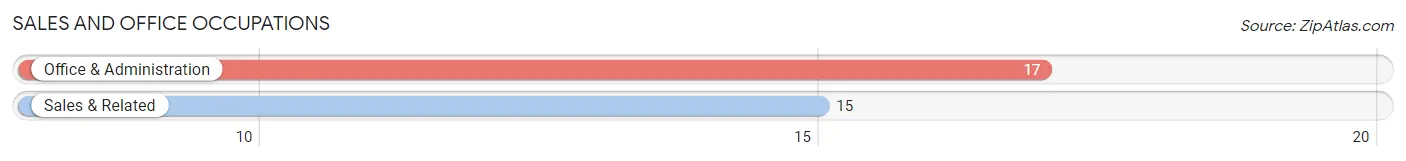
Sales and Office Occupations by Sex
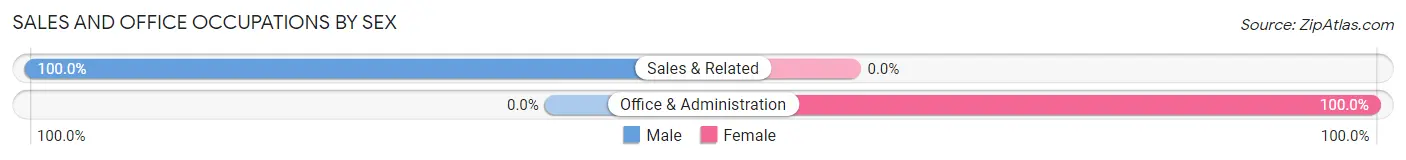
| Occupation | Male | Female |
| Sales & Related | 15 (100.0%) | 0 (0.0%) |
| Office & Administration | 0 (0.0%) | 17 (100.0%) |
| Total (Category) | 15 (46.9%) | 17 (53.1%) |
| Total (Overall) | 133 (32.6%) | 275 (67.4%) |
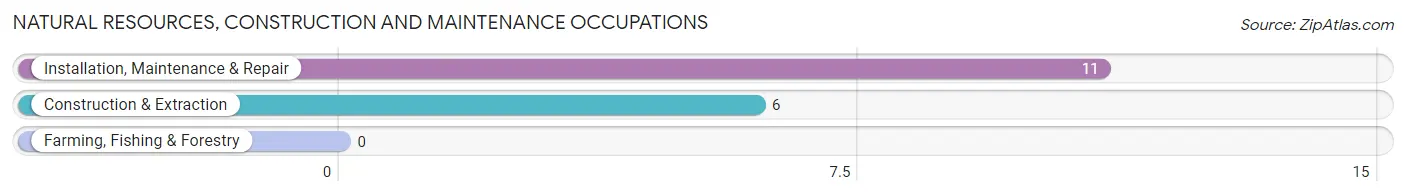
Natural Resources, Construction and Maintenance Occupations
The most common Natural Resources, Construction and Maintenance occupations in Mansura are Installation, Maintenance & Repair (11 | 2.7%), and Construction & Extraction (6 | 1.5%).
Natural Resources, Construction and Maintenance Occupations by Sex
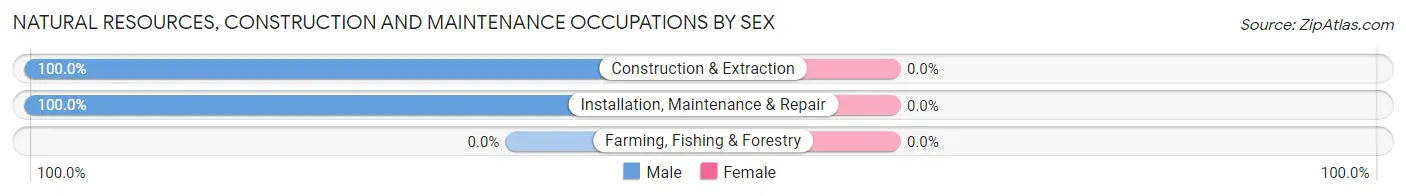
| Occupation | Male | Female |
| Farming, Fishing & Forestry | 0 (0.0%) | 0 (0.0%) |
| Construction & Extraction | 6 (100.0%) | 0 (0.0%) |
| Installation, Maintenance & Repair | 11 (100.0%) | 0 (0.0%) |
| Total (Category) | 17 (100.0%) | 0 (0.0%) |
| Total (Overall) | 133 (32.6%) | 275 (67.4%) |
Production, Transportation and Moving Occupations
The most common Production, Transportation and Moving occupations in Mansura are Production (36 | 8.8%), Material Moving (18 | 4.4%), and Transportation (4 | 1.0%).
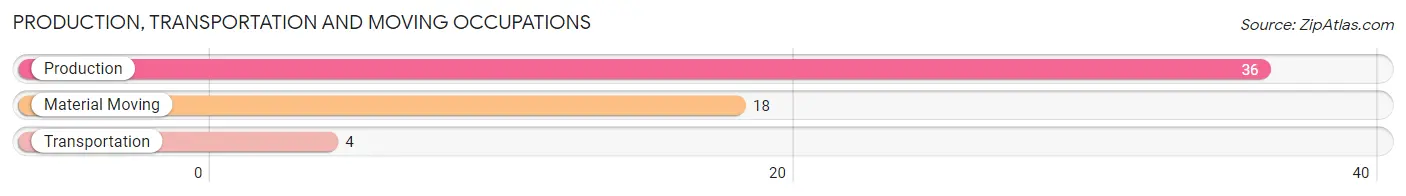
Production, Transportation and Moving Occupations by Sex
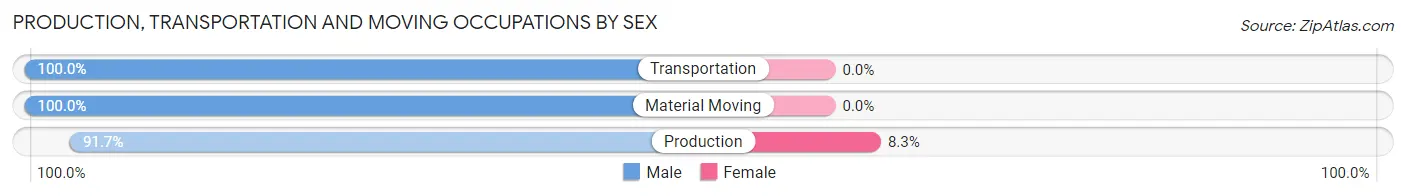
| Occupation | Male | Female |
| Production | 33 (91.7%) | 3 (8.3%) |
| Transportation | 4 (100.0%) | 0 (0.0%) |
| Material Moving | 18 (100.0%) | 0 (0.0%) |
| Total (Category) | 55 (94.8%) | 3 (5.2%) |
| Total (Overall) | 133 (32.6%) | 275 (67.4%) |
Employment Industries by Sex in Mansura
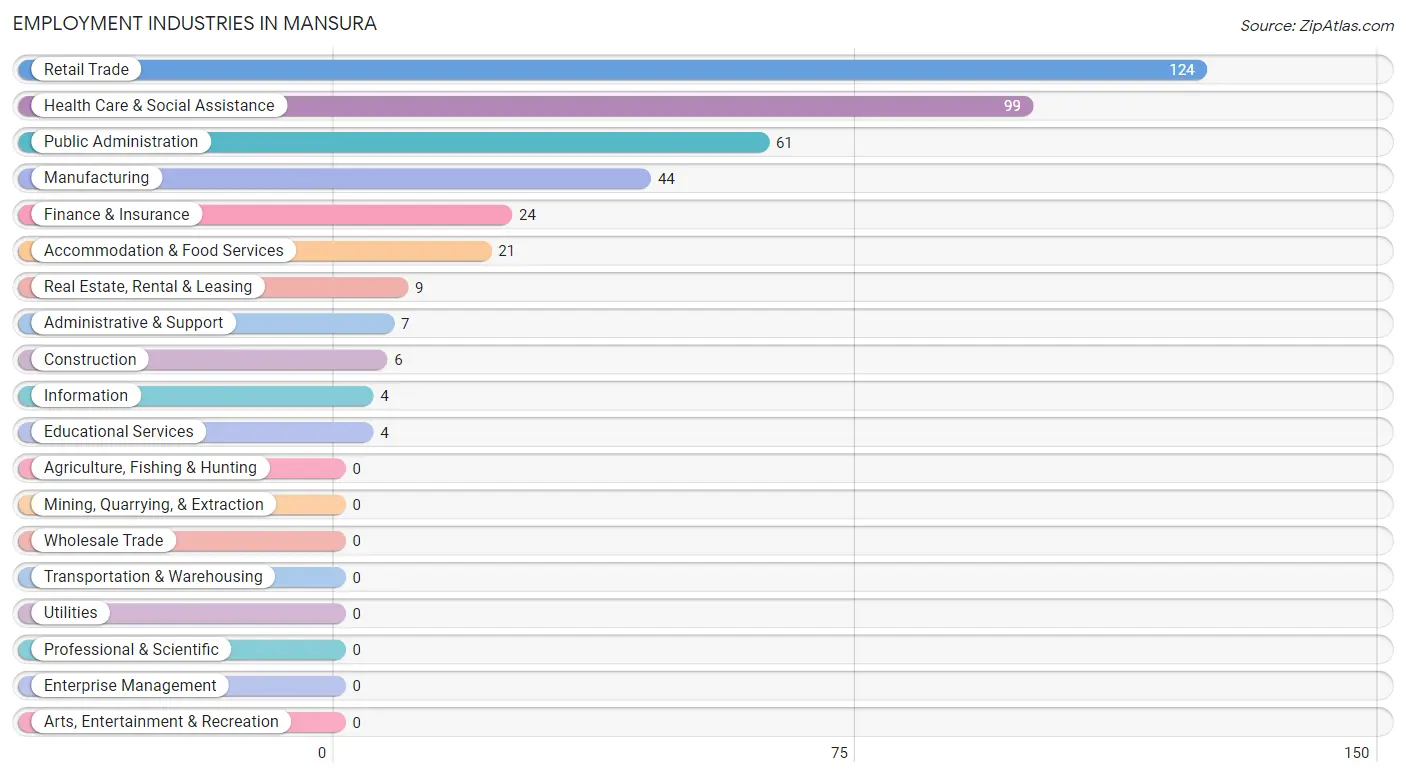
Employment Industries in Mansura
The major employment industries in Mansura include Retail Trade (124 | 30.4%), Health Care & Social Assistance (99 | 24.3%), Public Administration (61 | 14.9%), Manufacturing (44 | 10.8%), and Finance & Insurance (24 | 5.9%).
Employment Industries by Sex in Mansura
The Mansura industries that see more men than women are Construction (100.0%), Real Estate, Rental & Leasing (100.0%), and Administrative & Support (100.0%), whereas the industries that tend to have a higher number of women are Information (100.0%), Finance & Insurance (100.0%), and Educational Services (100.0%).
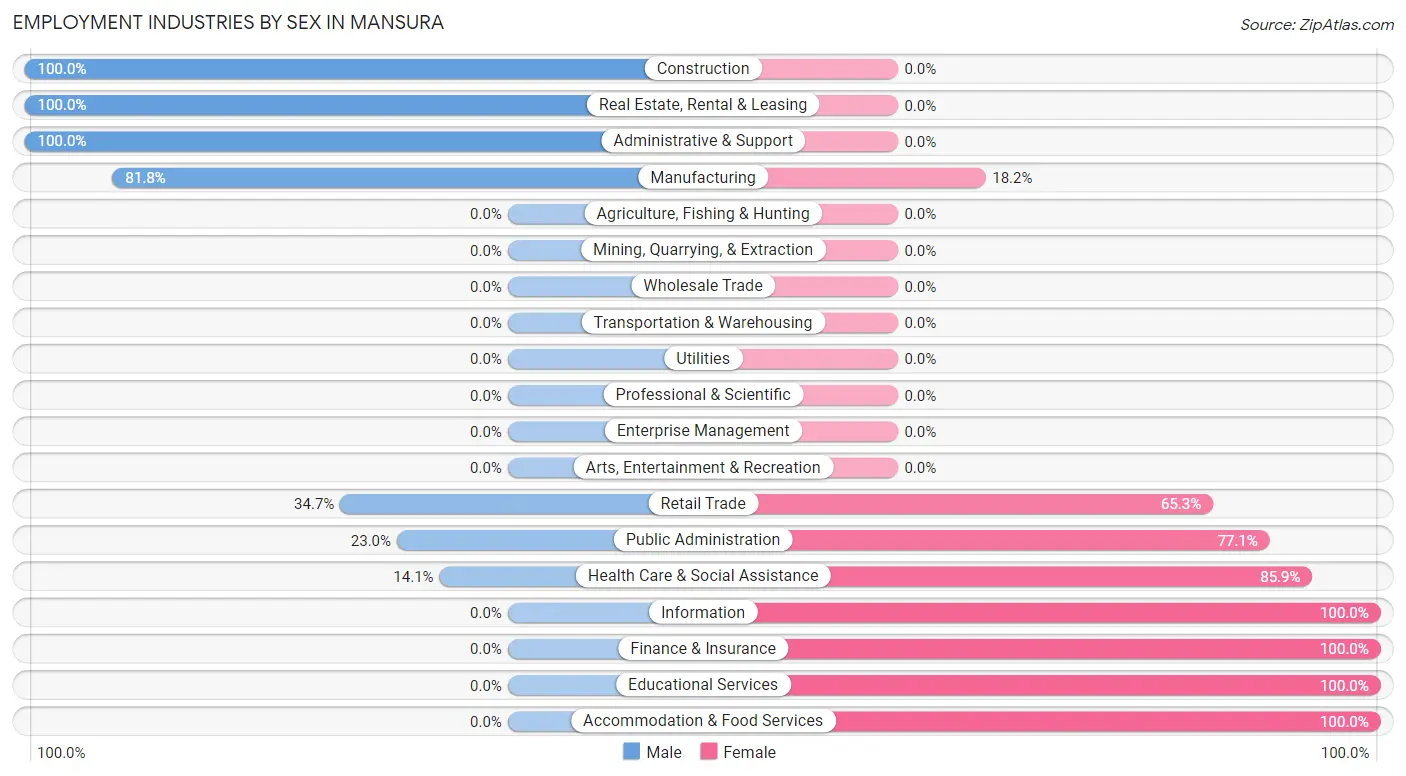
| Industry | Male | Female |
| Agriculture, Fishing & Hunting | 0 (0.0%) | 0 (0.0%) |
| Mining, Quarrying, & Extraction | 0 (0.0%) | 0 (0.0%) |
| Construction | 6 (100.0%) | 0 (0.0%) |
| Manufacturing | 36 (81.8%) | 8 (18.2%) |
| Wholesale Trade | 0 (0.0%) | 0 (0.0%) |
| Retail Trade | 43 (34.7%) | 81 (65.3%) |
| Transportation & Warehousing | 0 (0.0%) | 0 (0.0%) |
| Utilities | 0 (0.0%) | 0 (0.0%) |
| Information | 0 (0.0%) | 4 (100.0%) |
| Finance & Insurance | 0 (0.0%) | 24 (100.0%) |
| Real Estate, Rental & Leasing | 9 (100.0%) | 0 (0.0%) |
| Professional & Scientific | 0 (0.0%) | 0 (0.0%) |
| Enterprise Management | 0 (0.0%) | 0 (0.0%) |
| Administrative & Support | 7 (100.0%) | 0 (0.0%) |
| Educational Services | 0 (0.0%) | 4 (100.0%) |
| Health Care & Social Assistance | 14 (14.1%) | 85 (85.9%) |
| Arts, Entertainment & Recreation | 0 (0.0%) | 0 (0.0%) |
| Accommodation & Food Services | 0 (0.0%) | 21 (100.0%) |
| Public Administration | 14 (23.0%) | 47 (77.0%) |
| Total | 133 (32.6%) | 275 (67.4%) |
Education in Mansura
School Enrollment in Mansura
The most common levels of schooling among the 273 students in Mansura are high school (101 | 37.0%), college / undergraduate (47 | 17.2%), and middle school (39 | 14.3%).
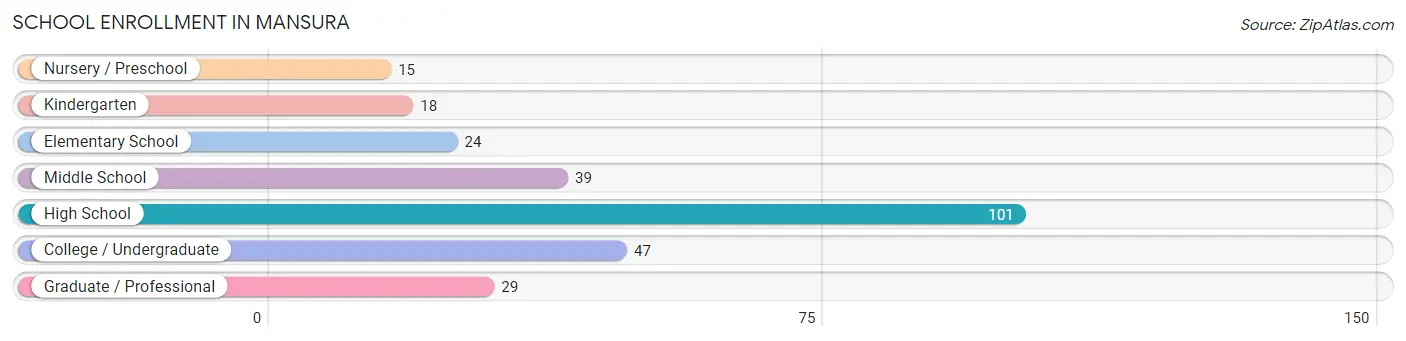
| School Level | # Students | % Students |
| Nursery / Preschool | 15 | 5.5% |
| Kindergarten | 18 | 6.6% |
| Elementary School | 24 | 8.8% |
| Middle School | 39 | 14.3% |
| High School | 101 | 37.0% |
| College / Undergraduate | 47 | 17.2% |
| Graduate / Professional | 29 | 10.6% |
| Total | 273 | 100.0% |
School Enrollment by Age by Funding Source in Mansura
Out of a total of 273 students who are enrolled in schools in Mansura, 21 (7.7%) attend a private institution, while the remaining 252 (92.3%) are enrolled in public schools. The age group of 18 to 19 year olds has the highest likelihood of being enrolled in private schools, with 7 (43.8% in the age bracket) enrolled. Conversely, the age group of 5 to 9 year old has the lowest likelihood of being enrolled in a private school, with 54 (100.0% in the age bracket) attending a public institution.
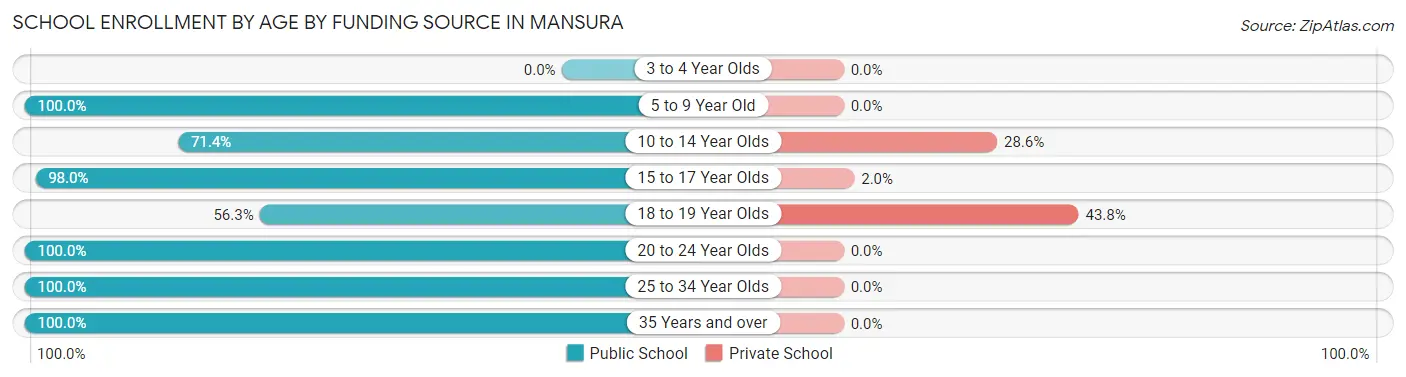
| Age Bracket | Public School | Private School |
| 3 to 4 Year Olds | 0 (0.0%) | 0 (0.0%) |
| 5 to 9 Year Old | 54 (100.0%) | 0 (0.0%) |
| 10 to 14 Year Olds | 30 (71.4%) | 12 (28.6%) |
| 15 to 17 Year Olds | 99 (98.0%) | 2 (2.0%) |
| 18 to 19 Year Olds | 9 (56.2%) | 7 (43.8%) |
| 20 to 24 Year Olds | 34 (100.0%) | 0 (0.0%) |
| 25 to 34 Year Olds | 8 (100.0%) | 0 (0.0%) |
| 35 Years and over | 18 (100.0%) | 0 (0.0%) |
| Total | 252 (92.3%) | 21 (7.7%) |
Educational Attainment by Field of Study in Mansura
Education (25 | 37.3%), arts & humanities (19 | 28.4%), computers & mathematics (16 | 23.9%), physical & health sciences (4 | 6.0%), and business (3 | 4.5%) are the most common fields of study among 67 individuals in Mansura who have obtained a bachelor's degree or higher.
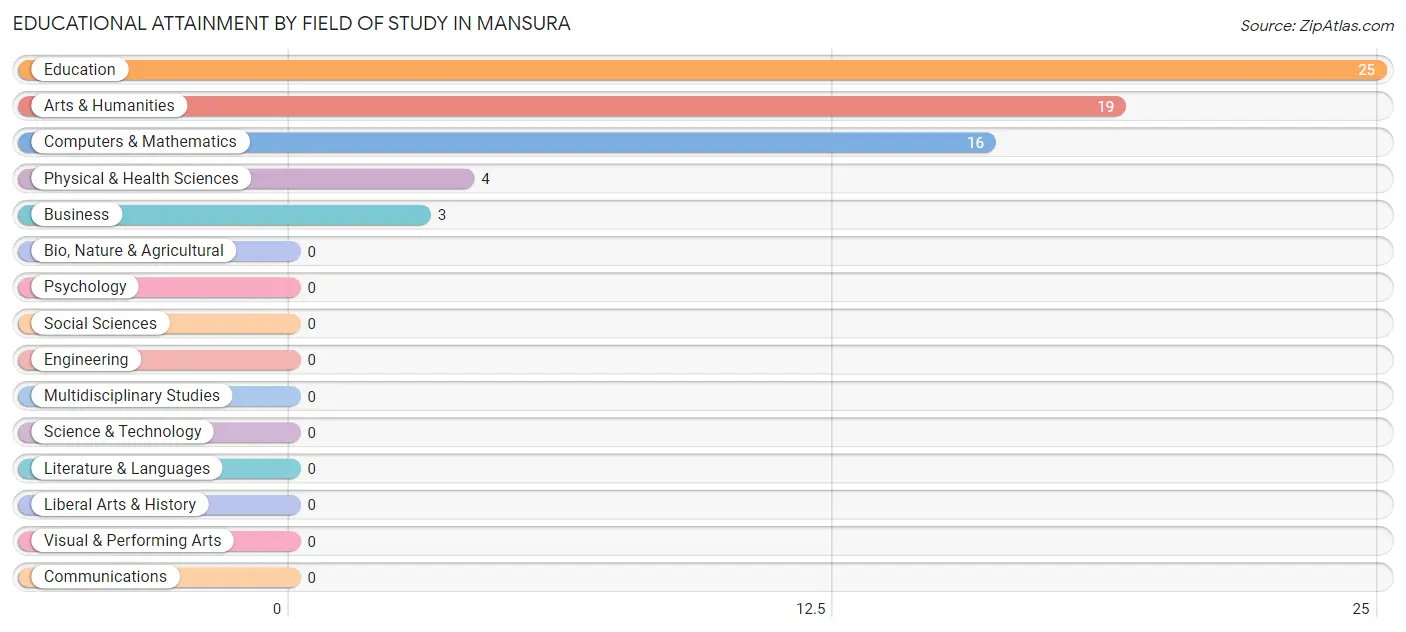
| Field of Study | # Graduates | % Graduates |
| Computers & Mathematics | 16 | 23.9% |
| Bio, Nature & Agricultural | 0 | 0.0% |
| Physical & Health Sciences | 4 | 6.0% |
| Psychology | 0 | 0.0% |
| Social Sciences | 0 | 0.0% |
| Engineering | 0 | 0.0% |
| Multidisciplinary Studies | 0 | 0.0% |
| Science & Technology | 0 | 0.0% |
| Business | 3 | 4.5% |
| Education | 25 | 37.3% |
| Literature & Languages | 0 | 0.0% |
| Liberal Arts & History | 0 | 0.0% |
| Visual & Performing Arts | 0 | 0.0% |
| Communications | 0 | 0.0% |
| Arts & Humanities | 19 | 28.4% |
| Total | 67 | 100.0% |
Transportation & Commute in Mansura
Vehicle Availability by Sex in Mansura
The most prevalent vehicle ownership categories in Mansura are males with 1 vehicle (46, accounting for 39.0%) and females with 1 vehicle (101, making up 16.7%).
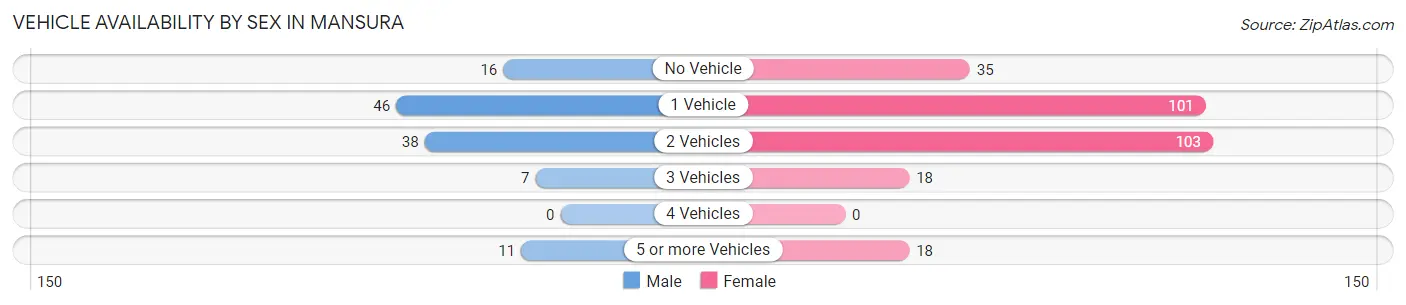
| Vehicles Available | Male | Female |
| No Vehicle | 16 (13.6%) | 35 (12.7%) |
| 1 Vehicle | 46 (39.0%) | 101 (36.7%) |
| 2 Vehicles | 38 (32.2%) | 103 (37.4%) |
| 3 Vehicles | 7 (5.9%) | 18 (6.6%) |
| 4 Vehicles | 0 (0.0%) | 0 (0.0%) |
| 5 or more Vehicles | 11 (9.3%) | 18 (6.6%) |
| Total | 118 (100.0%) | 275 (100.0%) |
Commute Time in Mansura
The most frequently occuring commute durations in Mansura are 5 to 9 minutes (106 commuters, 26.0%), 10 to 14 minutes (100 commuters, 24.5%), and 15 to 19 minutes (62 commuters, 15.2%).
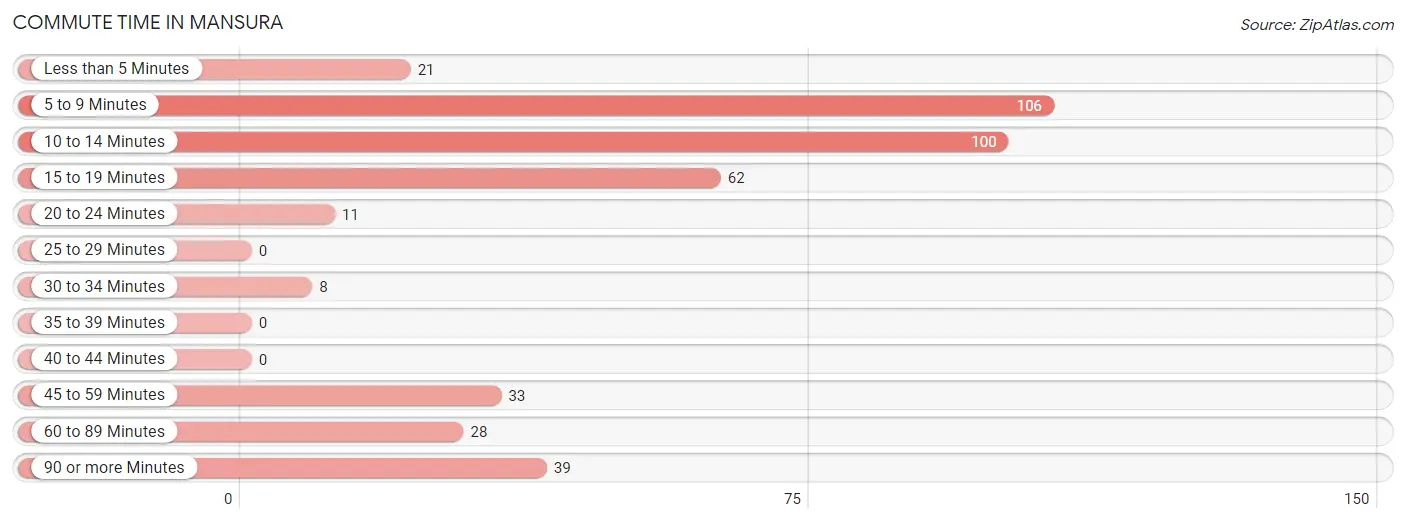
| Commute Time | # Commuters | % Commuters |
| Less than 5 Minutes | 21 | 5.1% |
| 5 to 9 Minutes | 106 | 26.0% |
| 10 to 14 Minutes | 100 | 24.5% |
| 15 to 19 Minutes | 62 | 15.2% |
| 20 to 24 Minutes | 11 | 2.7% |
| 25 to 29 Minutes | 0 | 0.0% |
| 30 to 34 Minutes | 8 | 2.0% |
| 35 to 39 Minutes | 0 | 0.0% |
| 40 to 44 Minutes | 0 | 0.0% |
| 45 to 59 Minutes | 33 | 8.1% |
| 60 to 89 Minutes | 28 | 6.9% |
| 90 or more Minutes | 39 | 9.6% |
Commute Time by Sex in Mansura
The most common commute times in Mansura are 5 to 9 minutes (33 commuters, 24.8%) for males and 10 to 14 minutes (100 commuters, 36.4%) for females.
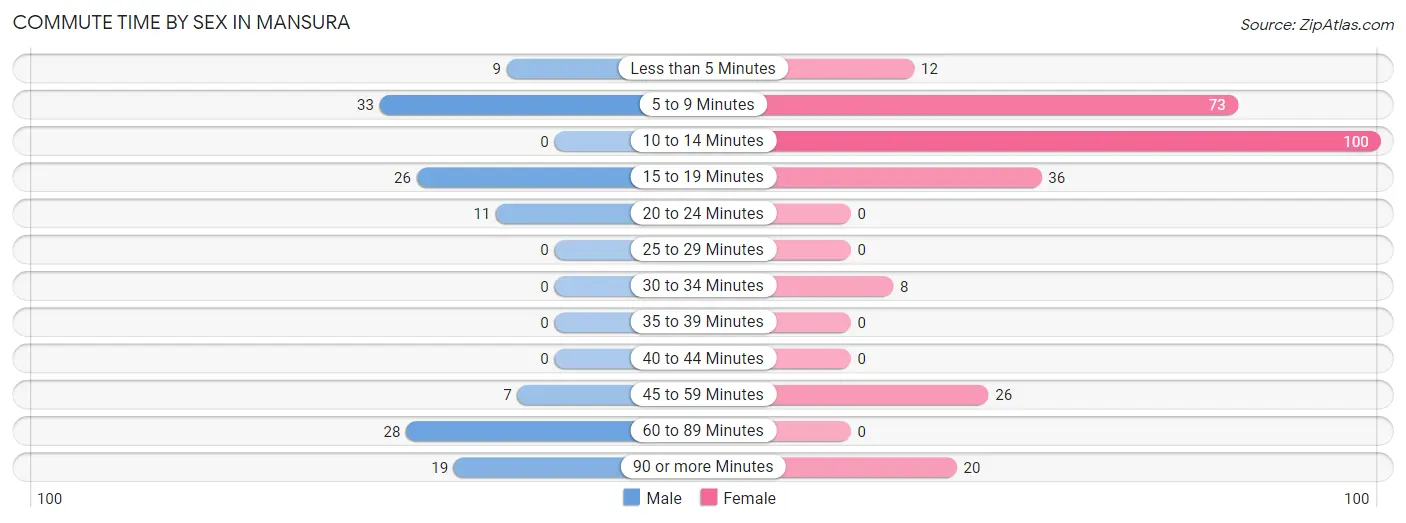
| Commute Time | Male | Female |
| Less than 5 Minutes | 9 (6.8%) | 12 (4.4%) |
| 5 to 9 Minutes | 33 (24.8%) | 73 (26.6%) |
| 10 to 14 Minutes | 0 (0.0%) | 100 (36.4%) |
| 15 to 19 Minutes | 26 (19.6%) | 36 (13.1%) |
| 20 to 24 Minutes | 11 (8.3%) | 0 (0.0%) |
| 25 to 29 Minutes | 0 (0.0%) | 0 (0.0%) |
| 30 to 34 Minutes | 0 (0.0%) | 8 (2.9%) |
| 35 to 39 Minutes | 0 (0.0%) | 0 (0.0%) |
| 40 to 44 Minutes | 0 (0.0%) | 0 (0.0%) |
| 45 to 59 Minutes | 7 (5.3%) | 26 (9.5%) |
| 60 to 89 Minutes | 28 (21.0%) | 0 (0.0%) |
| 90 or more Minutes | 19 (14.3%) | 20 (7.3%) |
Time of Departure to Work by Sex in Mansura
The most frequent times of departure to work in Mansura are 7:30 AM to 7:59 AM (48, 36.1%) for males and 7:30 AM to 7:59 AM (56, 20.4%) for females.
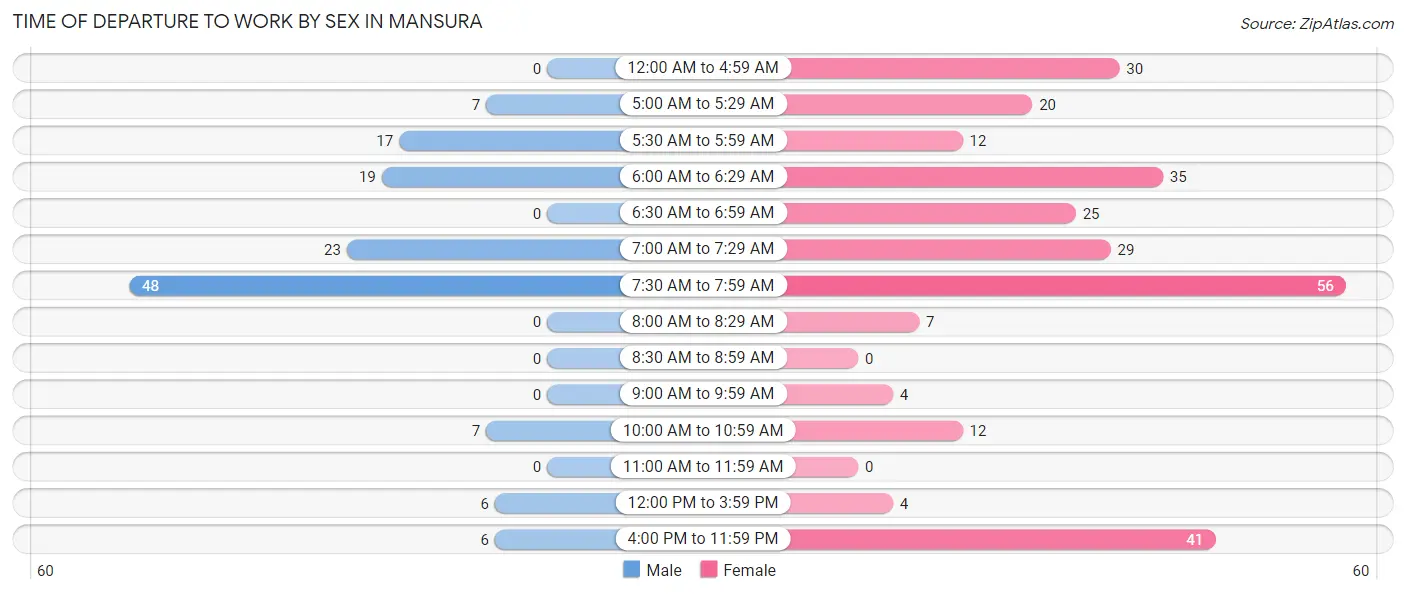
| Time of Departure | Male | Female |
| 12:00 AM to 4:59 AM | 0 (0.0%) | 30 (10.9%) |
| 5:00 AM to 5:29 AM | 7 (5.3%) | 20 (7.3%) |
| 5:30 AM to 5:59 AM | 17 (12.8%) | 12 (4.4%) |
| 6:00 AM to 6:29 AM | 19 (14.3%) | 35 (12.7%) |
| 6:30 AM to 6:59 AM | 0 (0.0%) | 25 (9.1%) |
| 7:00 AM to 7:29 AM | 23 (17.3%) | 29 (10.5%) |
| 7:30 AM to 7:59 AM | 48 (36.1%) | 56 (20.4%) |
| 8:00 AM to 8:29 AM | 0 (0.0%) | 7 (2.5%) |
| 8:30 AM to 8:59 AM | 0 (0.0%) | 0 (0.0%) |
| 9:00 AM to 9:59 AM | 0 (0.0%) | 4 (1.5%) |
| 10:00 AM to 10:59 AM | 7 (5.3%) | 12 (4.4%) |
| 11:00 AM to 11:59 AM | 0 (0.0%) | 0 (0.0%) |
| 12:00 PM to 3:59 PM | 6 (4.5%) | 4 (1.5%) |
| 4:00 PM to 11:59 PM | 6 (4.5%) | 41 (14.9%) |
| Total | 133 (100.0%) | 275 (100.0%) |
Housing Occupancy in Mansura
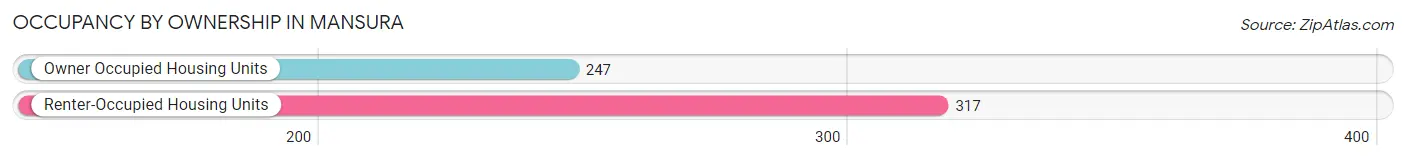
Occupancy by Ownership in Mansura
Of the total 564 dwellings in Mansura, owner-occupied units account for 247 (43.8%), while renter-occupied units make up 317 (56.2%).
| Occupancy | # Housing Units | % Housing Units |
| Owner Occupied Housing Units | 247 | 43.8% |
| Renter-Occupied Housing Units | 317 | 56.2% |
| Total Occupied Housing Units | 564 | 100.0% |
Occupancy by Household Size in Mansura
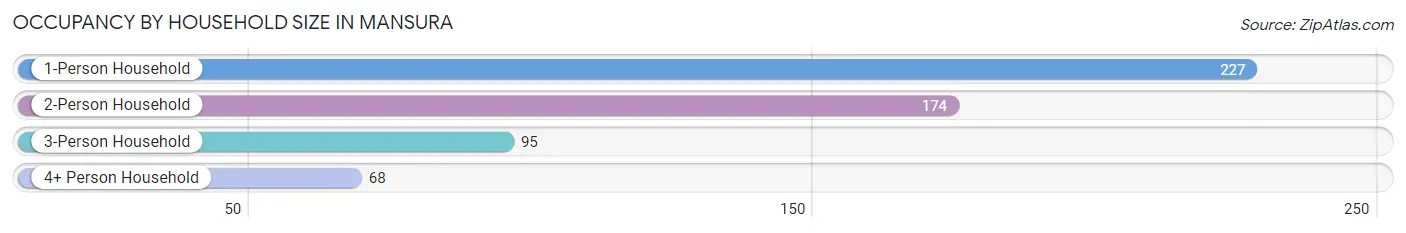
| Household Size | # Housing Units | % Housing Units |
| 1-Person Household | 227 | 40.3% |
| 2-Person Household | 174 | 30.8% |
| 3-Person Household | 95 | 16.8% |
| 4+ Person Household | 68 | 12.1% |
| Total Housing Units | 564 | 100.0% |
Occupancy by Ownership by Household Size in Mansura
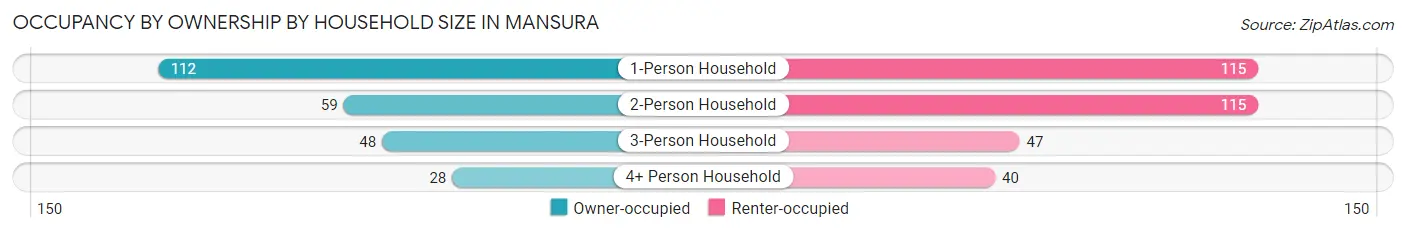
| Household Size | Owner-occupied | Renter-occupied |
| 1-Person Household | 112 (49.3%) | 115 (50.7%) |
| 2-Person Household | 59 (33.9%) | 115 (66.1%) |
| 3-Person Household | 48 (50.5%) | 47 (49.5%) |
| 4+ Person Household | 28 (41.2%) | 40 (58.8%) |
| Total Housing Units | 247 (43.8%) | 317 (56.2%) |
Occupancy by Educational Attainment in Mansura
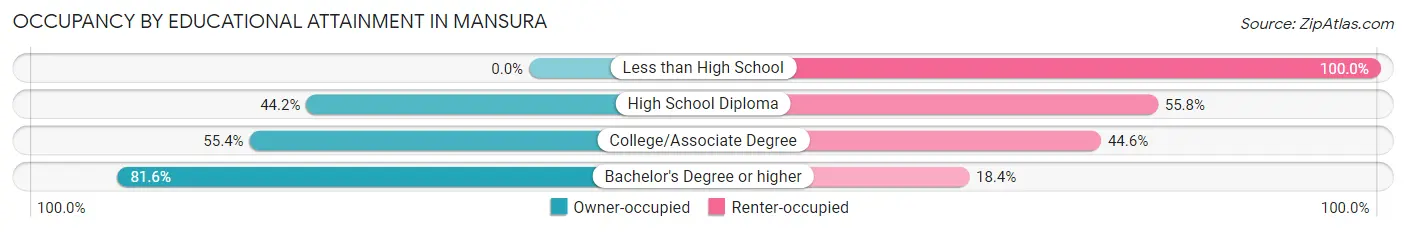
| Household Size | Owner-occupied | Renter-occupied |
| Less than High School | 0 (0.0%) | 105 (100.0%) |
| High School Diploma | 68 (44.2%) | 86 (55.8%) |
| College/Associate Degree | 148 (55.4%) | 119 (44.6%) |
| Bachelor's Degree or higher | 31 (81.6%) | 7 (18.4%) |
Occupancy by Age of Householder in Mansura
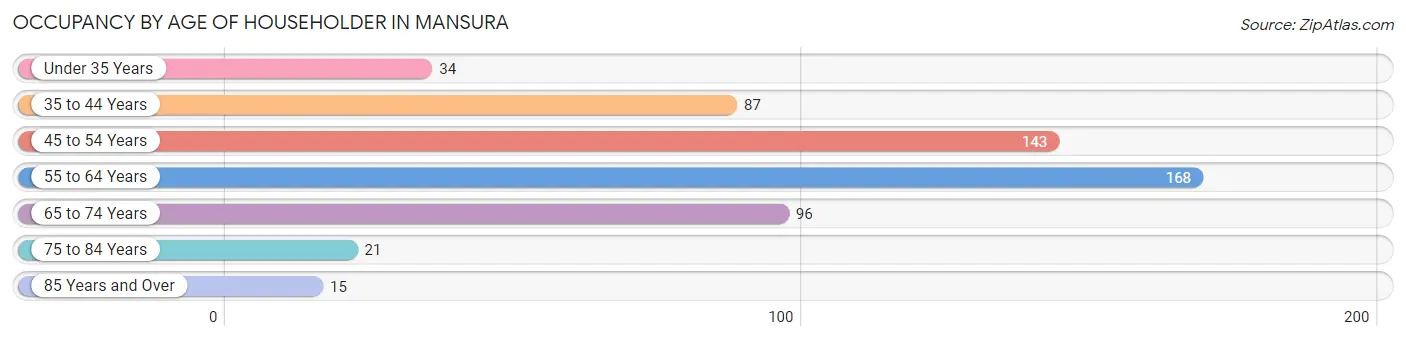
| Age Bracket | # Households | % Households |
| Under 35 Years | 34 | 6.0% |
| 35 to 44 Years | 87 | 15.4% |
| 45 to 54 Years | 143 | 25.4% |
| 55 to 64 Years | 168 | 29.8% |
| 65 to 74 Years | 96 | 17.0% |
| 75 to 84 Years | 21 | 3.7% |
| 85 Years and Over | 15 | 2.7% |
| Total | 564 | 100.0% |
Housing Finances in Mansura
Median Income by Occupancy in Mansura
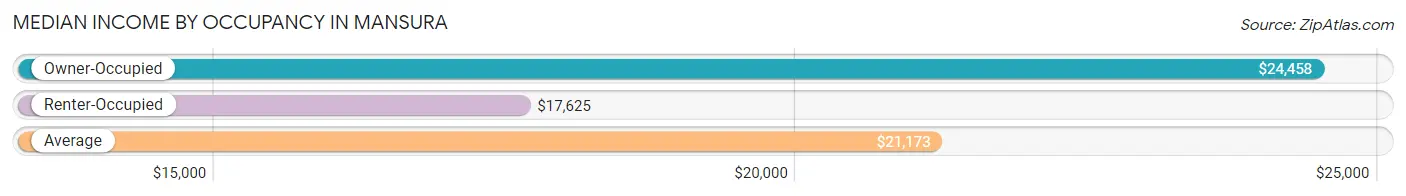
| Occupancy Type | # Households | Median Income |
| Owner-Occupied | 247 (43.8%) | $24,458 |
| Renter-Occupied | 317 (56.2%) | $17,625 |
| Average | 564 (100.0%) | $21,173 |
Occupancy by Householder Income Bracket in Mansura
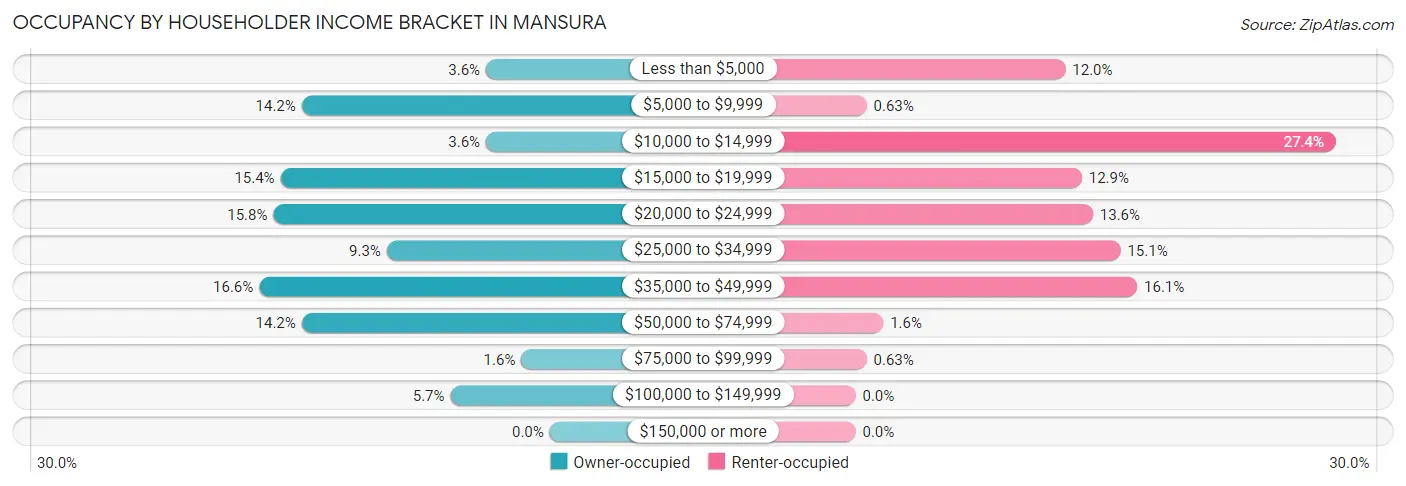
| Income Bracket | Owner-occupied | Renter-occupied |
| Less than $5,000 | 9 (3.6%) | 38 (12.0%) |
| $5,000 to $9,999 | 35 (14.2%) | 2 (0.6%) |
| $10,000 to $14,999 | 9 (3.6%) | 87 (27.4%) |
| $15,000 to $19,999 | 38 (15.4%) | 41 (12.9%) |
| $20,000 to $24,999 | 39 (15.8%) | 43 (13.6%) |
| $25,000 to $34,999 | 23 (9.3%) | 48 (15.1%) |
| $35,000 to $49,999 | 41 (16.6%) | 51 (16.1%) |
| $50,000 to $74,999 | 35 (14.2%) | 5 (1.6%) |
| $75,000 to $99,999 | 4 (1.6%) | 2 (0.6%) |
| $100,000 to $149,999 | 14 (5.7%) | 0 (0.0%) |
| $150,000 or more | 0 (0.0%) | 0 (0.0%) |
| Total | 247 (100.0%) | 317 (100.0%) |
Monthly Housing Cost Tiers in Mansura
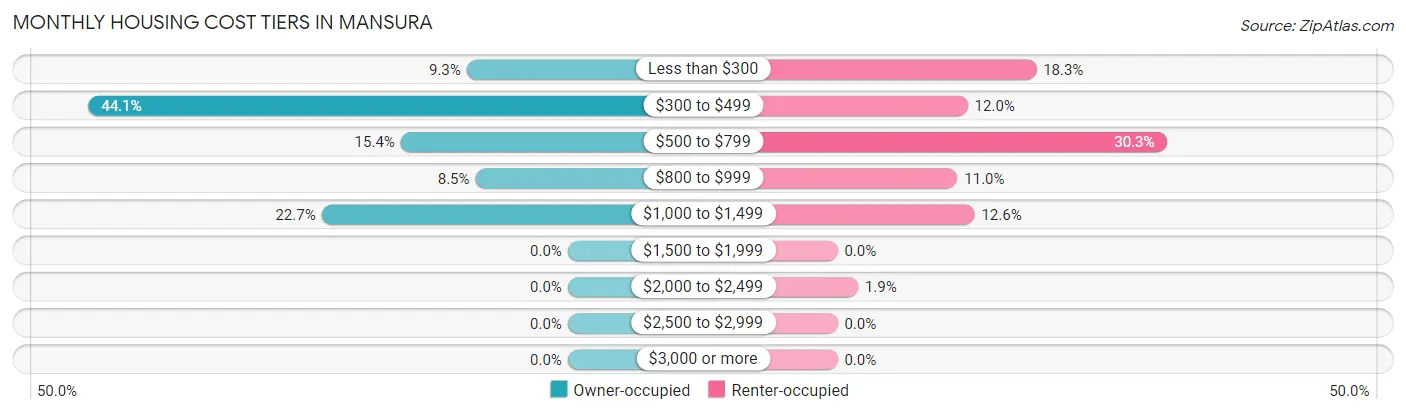
| Monthly Cost | Owner-occupied | Renter-occupied |
| Less than $300 | 23 (9.3%) | 58 (18.3%) |
| $300 to $499 | 109 (44.1%) | 38 (12.0%) |
| $500 to $799 | 38 (15.4%) | 96 (30.3%) |
| $800 to $999 | 21 (8.5%) | 35 (11.0%) |
| $1,000 to $1,499 | 56 (22.7%) | 40 (12.6%) |
| $1,500 to $1,999 | 0 (0.0%) | 0 (0.0%) |
| $2,000 to $2,499 | 0 (0.0%) | 6 (1.9%) |
| $2,500 to $2,999 | 0 (0.0%) | 0 (0.0%) |
| $3,000 or more | 0 (0.0%) | 0 (0.0%) |
| Total | 247 (100.0%) | 317 (100.0%) |
Physical Housing Characteristics in Mansura
Housing Structures in Mansura
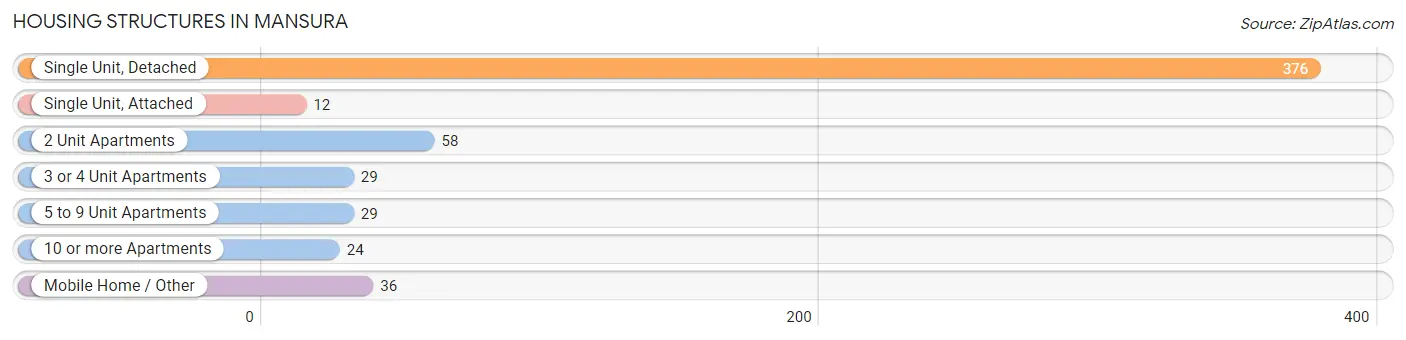
| Structure Type | # Housing Units | % Housing Units |
| Single Unit, Detached | 376 | 66.7% |
| Single Unit, Attached | 12 | 2.1% |
| 2 Unit Apartments | 58 | 10.3% |
| 3 or 4 Unit Apartments | 29 | 5.1% |
| 5 to 9 Unit Apartments | 29 | 5.1% |
| 10 or more Apartments | 24 | 4.3% |
| Mobile Home / Other | 36 | 6.4% |
| Total | 564 | 100.0% |
Housing Structures by Occupancy in Mansura
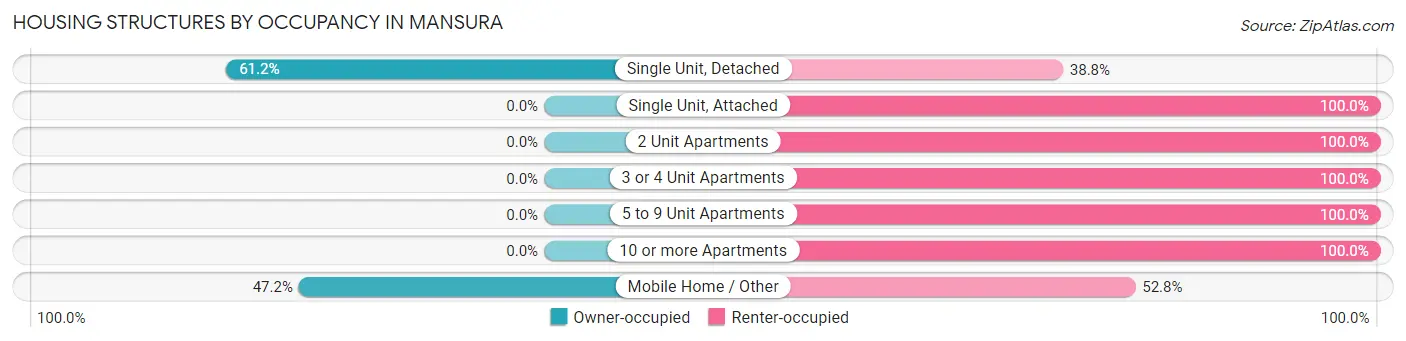
| Structure Type | Owner-occupied | Renter-occupied |
| Single Unit, Detached | 230 (61.2%) | 146 (38.8%) |
| Single Unit, Attached | 0 (0.0%) | 12 (100.0%) |
| 2 Unit Apartments | 0 (0.0%) | 58 (100.0%) |
| 3 or 4 Unit Apartments | 0 (0.0%) | 29 (100.0%) |
| 5 to 9 Unit Apartments | 0 (0.0%) | 29 (100.0%) |
| 10 or more Apartments | 0 (0.0%) | 24 (100.0%) |
| Mobile Home / Other | 17 (47.2%) | 19 (52.8%) |
| Total | 247 (43.8%) | 317 (56.2%) |
Housing Structures by Number of Rooms in Mansura
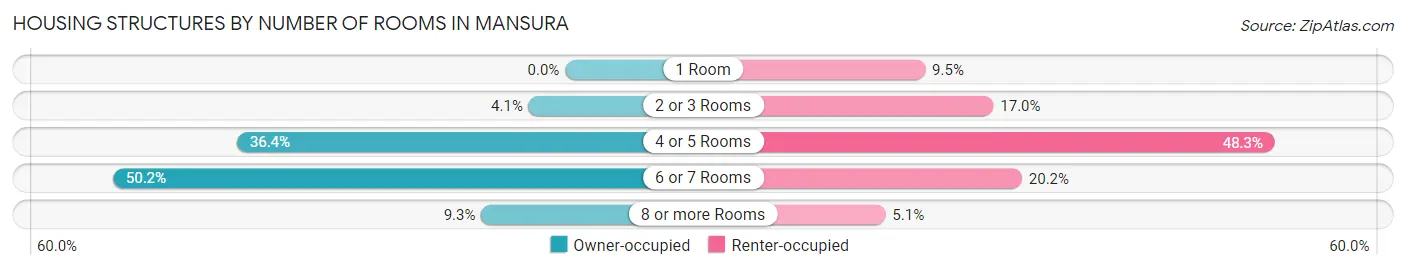
| Number of Rooms | Owner-occupied | Renter-occupied |
| 1 Room | 0 (0.0%) | 30 (9.5%) |
| 2 or 3 Rooms | 10 (4.1%) | 54 (17.0%) |
| 4 or 5 Rooms | 90 (36.4%) | 153 (48.3%) |
| 6 or 7 Rooms | 124 (50.2%) | 64 (20.2%) |
| 8 or more Rooms | 23 (9.3%) | 16 (5.1%) |
| Total | 247 (100.0%) | 317 (100.0%) |
Housing Structure by Heating Type in Mansura
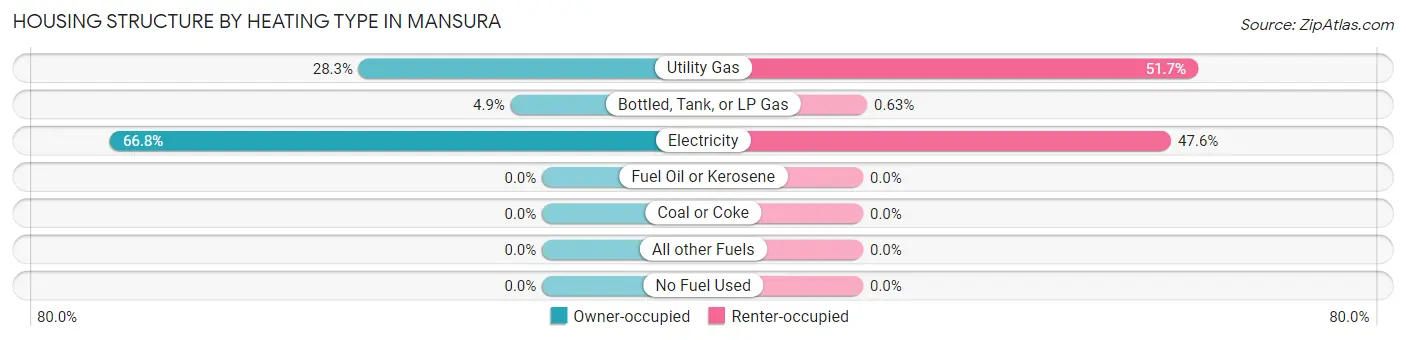
| Heating Type | Owner-occupied | Renter-occupied |
| Utility Gas | 70 (28.3%) | 164 (51.7%) |
| Bottled, Tank, or LP Gas | 12 (4.9%) | 2 (0.6%) |
| Electricity | 165 (66.8%) | 151 (47.6%) |
| Fuel Oil or Kerosene | 0 (0.0%) | 0 (0.0%) |
| Coal or Coke | 0 (0.0%) | 0 (0.0%) |
| All other Fuels | 0 (0.0%) | 0 (0.0%) |
| No Fuel Used | 0 (0.0%) | 0 (0.0%) |
| Total | 247 (100.0%) | 317 (100.0%) |
Household Vehicle Usage in Mansura
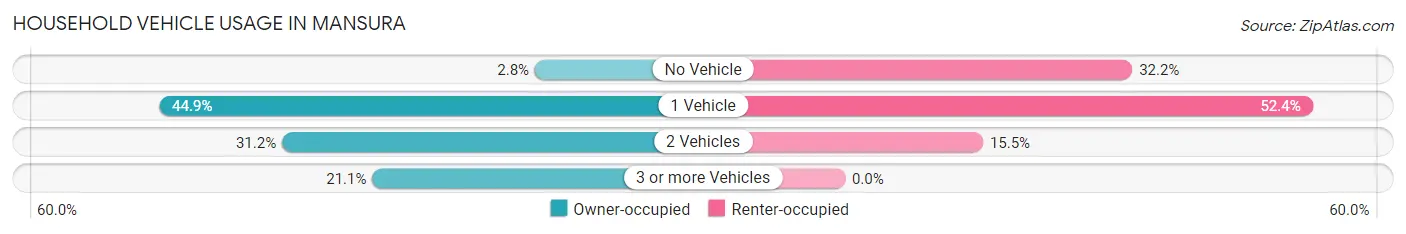
| Vehicles per Household | Owner-occupied | Renter-occupied |
| No Vehicle | 7 (2.8%) | 102 (32.2%) |
| 1 Vehicle | 111 (44.9%) | 166 (52.4%) |
| 2 Vehicles | 77 (31.2%) | 49 (15.5%) |
| 3 or more Vehicles | 52 (21.0%) | 0 (0.0%) |
| Total | 247 (100.0%) | 317 (100.0%) |
Real Estate & Mortgages in Mansura
Real Estate and Mortgage Overview in Mansura
| Characteristic | Without Mortgage | With Mortgage |
| Housing Units | 138 | 109 |
| Median Property Value | $80,400 | $88,800 |
| Median Household Income | - | - |
| Monthly Housing Costs | $388 | $0 |
| Real Estate Taxes | $199 | $9 |
Property Value by Mortgage Status in Mansura
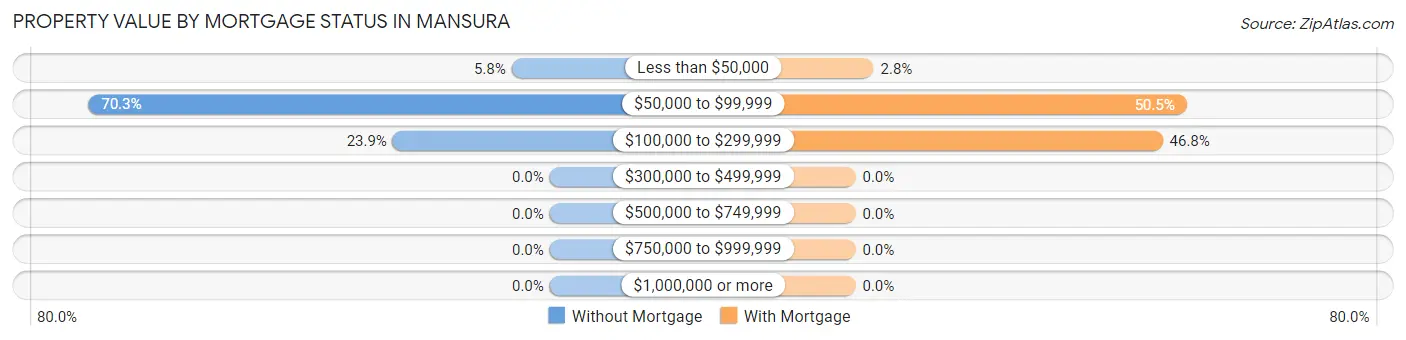
| Property Value | Without Mortgage | With Mortgage |
| Less than $50,000 | 8 (5.8%) | 3 (2.8%) |
| $50,000 to $99,999 | 97 (70.3%) | 55 (50.5%) |
| $100,000 to $299,999 | 33 (23.9%) | 51 (46.8%) |
| $300,000 to $499,999 | 0 (0.0%) | 0 (0.0%) |
| $500,000 to $749,999 | 0 (0.0%) | 0 (0.0%) |
| $750,000 to $999,999 | 0 (0.0%) | 0 (0.0%) |
| $1,000,000 or more | 0 (0.0%) | 0 (0.0%) |
| Total | 138 (100.0%) | 109 (100.0%) |
Household Income by Mortgage Status in Mansura
| Household Income | Without Mortgage | With Mortgage |
| Less than $10,000 | 30 (21.7%) | 0 (0.0%) |
| $10,000 to $24,999 | 53 (38.4%) | 14 (12.8%) |
| $25,000 to $34,999 | 3 (2.2%) | 33 (30.3%) |
| $35,000 to $49,999 | 16 (11.6%) | 20 (18.3%) |
| $50,000 to $74,999 | 18 (13.0%) | 25 (22.9%) |
| $75,000 to $99,999 | 4 (2.9%) | 17 (15.6%) |
| $100,000 to $149,999 | 14 (10.1%) | 0 (0.0%) |
| $150,000 or more | 0 (0.0%) | 0 (0.0%) |
| Total | 138 (100.0%) | 109 (100.0%) |
Property Value to Household Income Ratio in Mansura
| Value-to-Income Ratio | Without Mortgage | With Mortgage |
| Less than 2.0x | 27 (19.6%) | 28,750 (26,376.2%) |
| 2.0x to 2.9x | 26 (18.8%) | 7 (6.4%) |
| 3.0x to 3.9x | 55 (39.9%) | 31 (28.4%) |
| 4.0x or more | 27 (19.6%) | 20 (18.3%) |
| Total | 138 (100.0%) | 109 (100.0%) |
Real Estate Taxes by Mortgage Status in Mansura
| Property Taxes | Without Mortgage | With Mortgage |
| Less than $800 | 127 (92.0%) | 0 (0.0%) |
| $800 to $1,499 | 8 (5.8%) | 100 (91.7%) |
| $800 to $1,499 | 0 (0.0%) | 0 (0.0%) |
| Total | 138 (100.0%) | 109 (100.0%) |
Health & Disability in Mansura
Health Insurance Coverage by Age in Mansura
| Age Bracket | With Coverage | Without Coverage |
| Under 6 Years | 78 (100.0%) | 0 (0.0%) |
| 6 to 18 Years | 194 (100.0%) | 0 (0.0%) |
| 19 to 25 Years | 113 (94.2%) | 7 (5.8%) |
| 26 to 34 Years | 59 (100.0%) | 0 (0.0%) |
| 35 to 44 Years | 152 (74.5%) | 52 (25.5%) |
| 45 to 54 Years | 157 (93.4%) | 11 (6.6%) |
| 55 to 64 Years | 215 (88.8%) | 27 (11.2%) |
| 65 to 74 Years | 126 (93.3%) | 9 (6.7%) |
| 75 Years and older | 43 (100.0%) | 0 (0.0%) |
| Total | 1,137 (91.5%) | 106 (8.5%) |
Health Insurance Coverage by Citizenship Status in Mansura
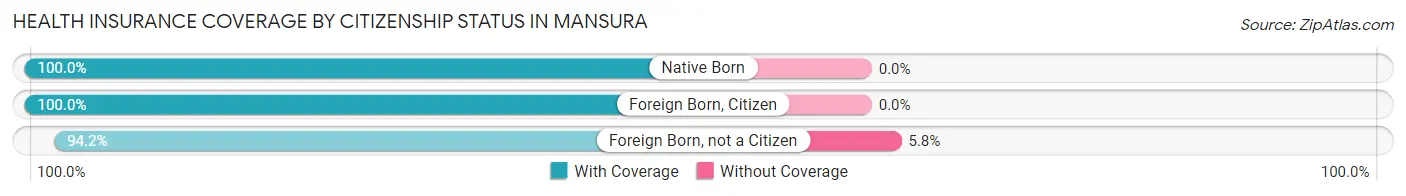
| Citizenship Status | With Coverage | Without Coverage |
| Native Born | 78 (100.0%) | 0 (0.0%) |
| Foreign Born, Citizen | 194 (100.0%) | 0 (0.0%) |
| Foreign Born, not a Citizen | 113 (94.2%) | 7 (5.8%) |
Health Insurance Coverage by Household Income in Mansura
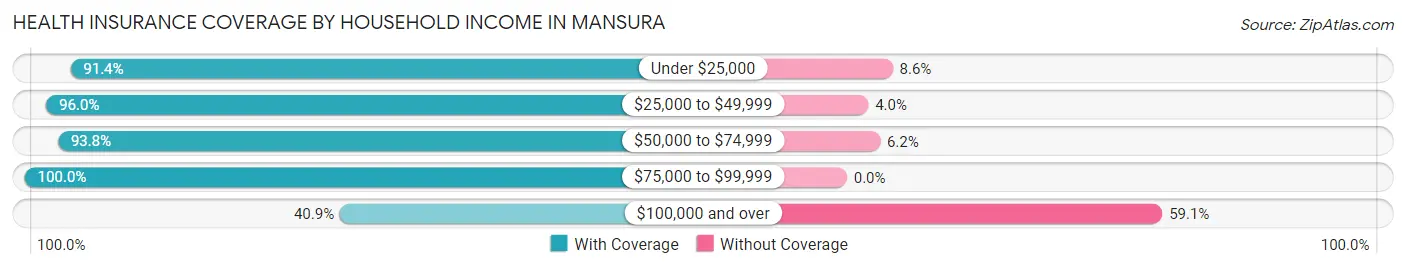
| Household Income | With Coverage | Without Coverage |
| Under $25,000 | 586 (91.4%) | 55 (8.6%) |
| $25,000 to $49,999 | 334 (96.0%) | 14 (4.0%) |
| $50,000 to $74,999 | 166 (93.8%) | 11 (6.2%) |
| $75,000 to $99,999 | 10 (100.0%) | 0 (0.0%) |
| $100,000 and over | 18 (40.9%) | 26 (59.1%) |
Public vs Private Health Insurance Coverage by Age in Mansura
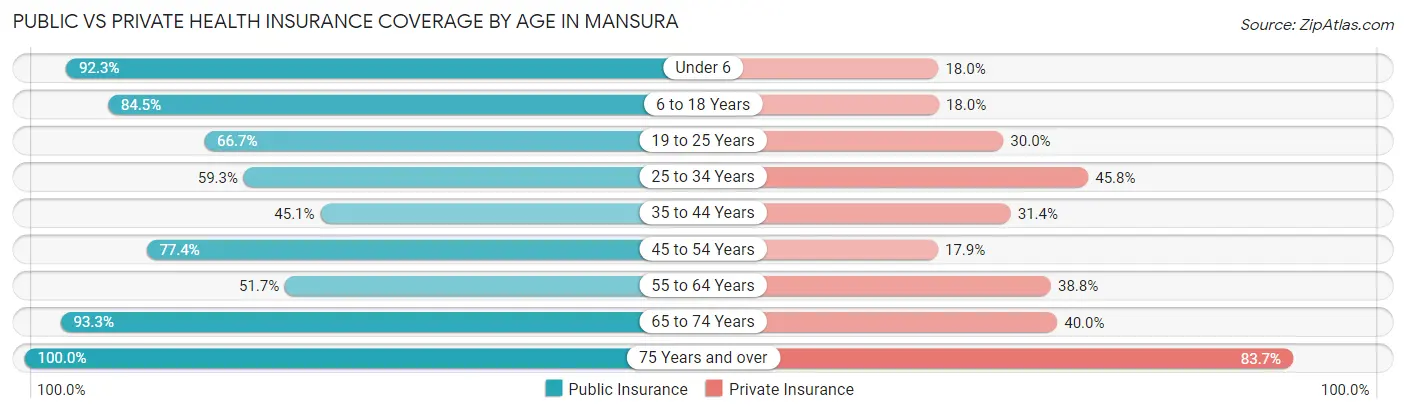
| Age Bracket | Public Insurance | Private Insurance |
| Under 6 | 72 (92.3%) | 14 (17.9%) |
| 6 to 18 Years | 164 (84.5%) | 35 (18.0%) |
| 19 to 25 Years | 80 (66.7%) | 36 (30.0%) |
| 25 to 34 Years | 35 (59.3%) | 27 (45.8%) |
| 35 to 44 Years | 92 (45.1%) | 64 (31.4%) |
| 45 to 54 Years | 130 (77.4%) | 30 (17.9%) |
| 55 to 64 Years | 125 (51.6%) | 94 (38.8%) |
| 65 to 74 Years | 126 (93.3%) | 54 (40.0%) |
| 75 Years and over | 43 (100.0%) | 36 (83.7%) |
| Total | 867 (69.8%) | 390 (31.4%) |
Disability Status by Sex by Age in Mansura
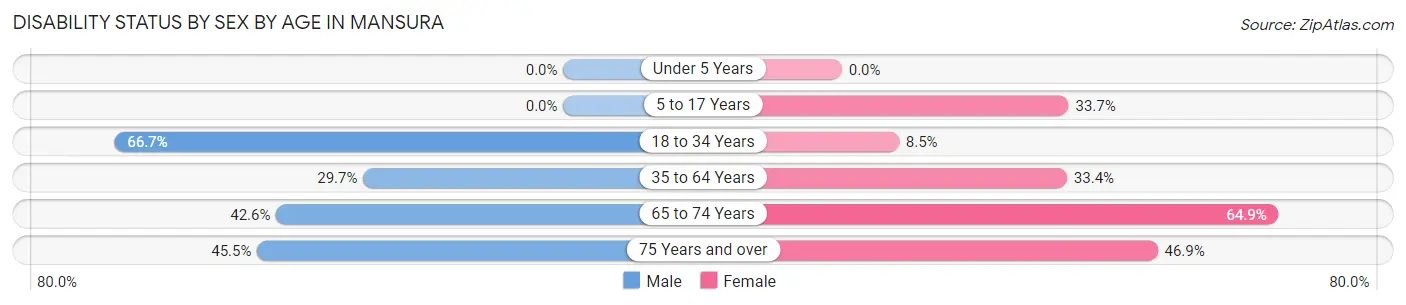
| Age Bracket | Male | Female |
| Under 5 Years | 0 (0.0%) | 0 (0.0%) |
| 5 to 17 Years | 0 (0.0%) | 33 (33.7%) |
| 18 to 34 Years | 6 (66.7%) | 15 (8.5%) |
| 35 to 64 Years | 82 (29.7%) | 113 (33.4%) |
| 65 to 74 Years | 26 (42.6%) | 48 (64.9%) |
| 75 Years and over | 5 (45.5%) | 15 (46.9%) |
Disability Class by Sex by Age in Mansura
Disability Class: Hearing Difficulty
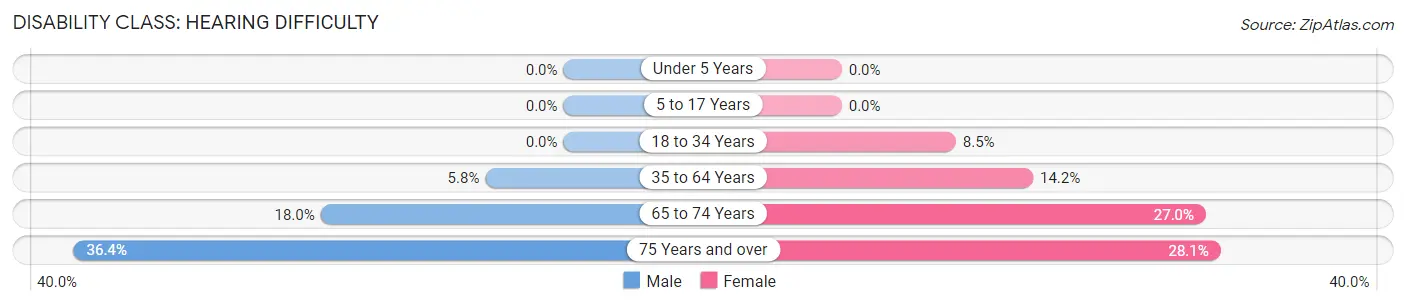
| Age Bracket | Male | Female |
| Under 5 Years | 0 (0.0%) | 0 (0.0%) |
| 5 to 17 Years | 0 (0.0%) | 0 (0.0%) |
| 18 to 34 Years | 0 (0.0%) | 15 (8.5%) |
| 35 to 64 Years | 16 (5.8%) | 48 (14.2%) |
| 65 to 74 Years | 11 (18.0%) | 20 (27.0%) |
| 75 Years and over | 4 (36.4%) | 9 (28.1%) |
Disability Class: Vision Difficulty
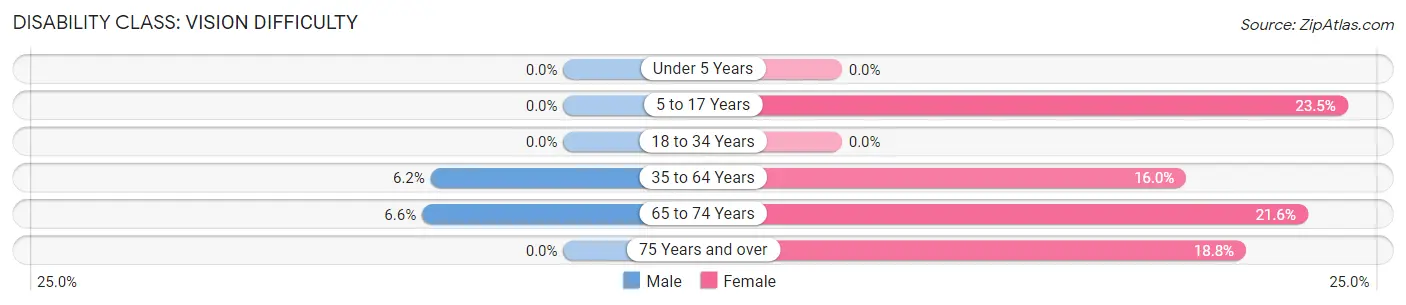
| Age Bracket | Male | Female |
| Under 5 Years | 0 (0.0%) | 0 (0.0%) |
| 5 to 17 Years | 0 (0.0%) | 23 (23.5%) |
| 18 to 34 Years | 0 (0.0%) | 0 (0.0%) |
| 35 to 64 Years | 17 (6.2%) | 54 (16.0%) |
| 65 to 74 Years | 4 (6.6%) | 16 (21.6%) |
| 75 Years and over | 0 (0.0%) | 6 (18.8%) |
Disability Class: Cognitive Difficulty
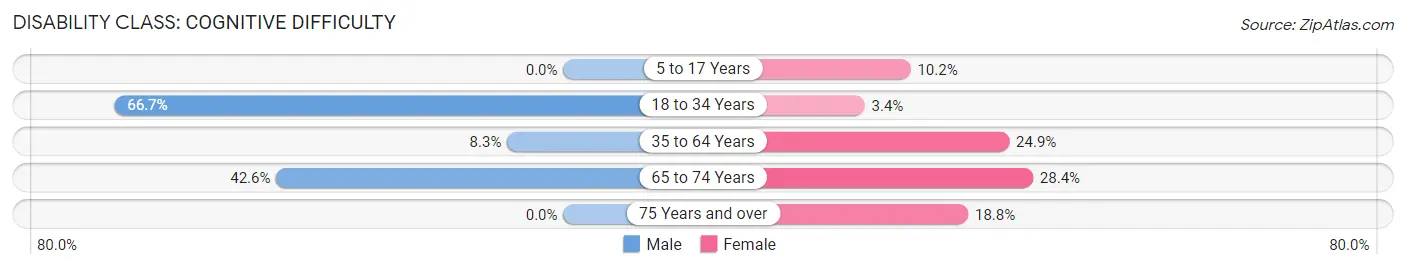
| Age Bracket | Male | Female |
| 5 to 17 Years | 0 (0.0%) | 10 (10.2%) |
| 18 to 34 Years | 6 (66.7%) | 6 (3.4%) |
| 35 to 64 Years | 23 (8.3%) | 84 (24.8%) |
| 65 to 74 Years | 26 (42.6%) | 21 (28.4%) |
| 75 Years and over | 0 (0.0%) | 6 (18.8%) |
Disability Class: Ambulatory Difficulty
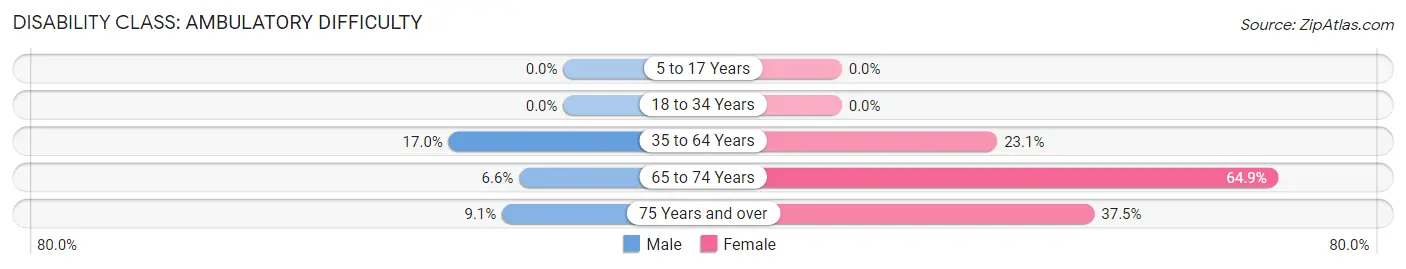
| Age Bracket | Male | Female |
| 5 to 17 Years | 0 (0.0%) | 0 (0.0%) |
| 18 to 34 Years | 0 (0.0%) | 0 (0.0%) |
| 35 to 64 Years | 47 (17.0%) | 78 (23.1%) |
| 65 to 74 Years | 4 (6.6%) | 48 (64.9%) |
| 75 Years and over | 1 (9.1%) | 12 (37.5%) |
Disability Class: Self-Care Difficulty
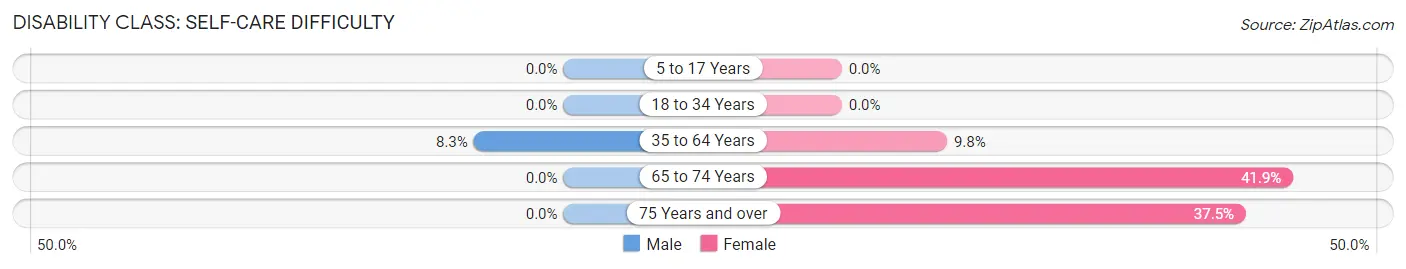
| Age Bracket | Male | Female |
| 5 to 17 Years | 0 (0.0%) | 0 (0.0%) |
| 18 to 34 Years | 0 (0.0%) | 0 (0.0%) |
| 35 to 64 Years | 23 (8.3%) | 33 (9.8%) |
| 65 to 74 Years | 0 (0.0%) | 31 (41.9%) |
| 75 Years and over | 0 (0.0%) | 12 (37.5%) |
Technology Access in Mansura
Computing Device Access in Mansura
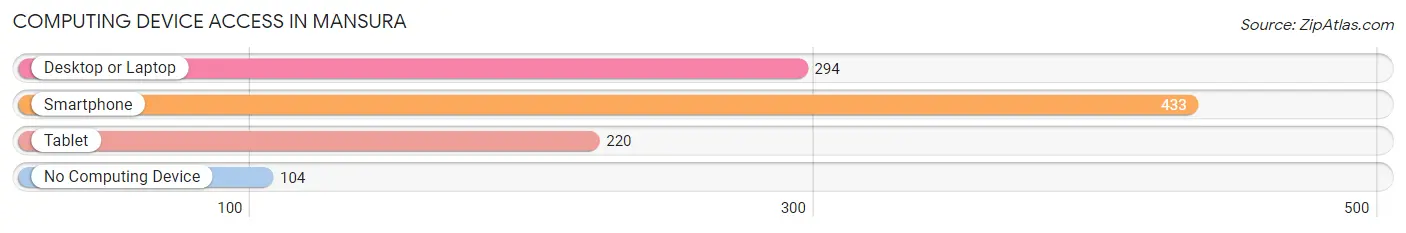
| Device Type | # Households | % Households |
| Desktop or Laptop | 294 | 52.1% |
| Smartphone | 433 | 76.8% |
| Tablet | 220 | 39.0% |
| No Computing Device | 104 | 18.4% |
| Total | 564 | 100.0% |
Internet Access in Mansura
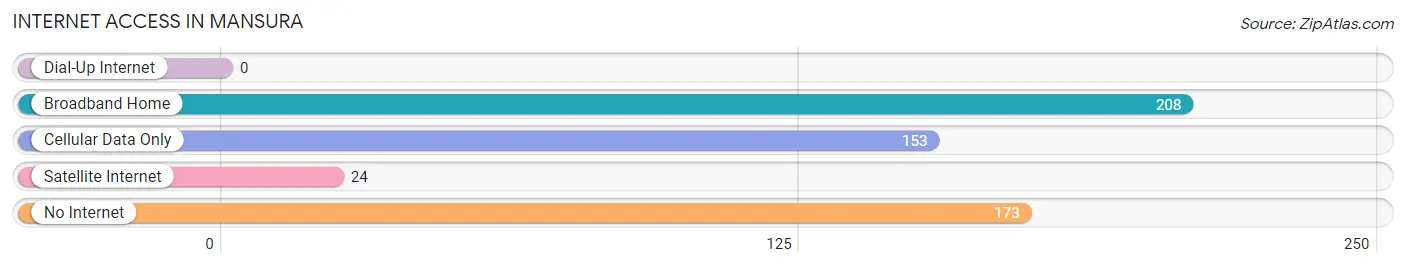
| Internet Type | # Households | % Households |
| Dial-Up Internet | 0 | 0.0% |
| Broadband Home | 208 | 36.9% |
| Cellular Data Only | 153 | 27.1% |
| Satellite Internet | 24 | 4.3% |
| No Internet | 173 | 30.7% |
| Total | 564 | 100.0% |
Mansura Summary
Mansura is a small town located in Avoyelles Parish, Louisiana. It is situated on the banks of the Atchafalaya River, approximately 25 miles northwest of Alexandria. The town was founded in 1837 and is named after the Mansura Indian tribe, which inhabited the area prior to European settlement. The population of Mansura was 1,845 at the 2010 census.
History
Mansura was founded in 1837 by a group of French-speaking settlers from the nearby town of Marksville. The town was named after the Mansura Indian tribe, which had inhabited the area prior to European settlement. The town was originally a trading post and was known for its cotton production.
In the late 19th century, the town began to grow and develop. The first school was established in 1885 and the first bank opened in 1887. The town was incorporated in 1895 and the first mayor was elected in 1896.
In the early 20th century, the town continued to grow and develop. The first telephone service was established in 1906 and the first newspaper was published in 1908. The town was connected to the railroad in 1910 and the first hospital was built in 1912.
Geography
Mansura is located in Avoyelles Parish, Louisiana. It is situated on the banks of the Atchafalaya River, approximately 25 miles northwest of Alexandria. The town has a total area of 1.3 square miles, all of which is land.
The climate in Mansura is humid subtropical, with hot, humid summers and mild winters. The average annual temperature is 68°F and the average annual precipitation is 48 inches.
Economy
The economy of Mansura is largely based on agriculture. The town is home to several farms, which produce cotton, soybeans, corn, and other crops. The town is also home to several small businesses, including restaurants, retail stores, and service providers.
Demographics
As of the 2010 census, the population of Mansura was 1,845. The racial makeup of the town was 79.2% White, 19.2% African American, 0.3% Native American, 0.2% Asian, 0.1% Pacific Islander, and 0.9% from other races. Hispanic or Latino of any race were 1.2% of the population.
The median income for a household in Mansura was $30,938 and the median income for a family was $37,500. The per capita income for the town was $15,945. About 17.2% of families and 20.2% of the population were below the poverty line, including 28.3% of those under age 18 and 15.2% of those age 65 or over.
Common Questions
What is Per Capita Income in Mansura?
Per Capita income in Mansura is $14,945.
What is the Median Family Income in Mansura?
Median Family Income in Mansura is $21,394.
What is the Median Household income in Mansura?
Median Household Income in Mansura is $21,173.
What is Income or Wage Gap in Mansura?
Income or Wage Gap in Mansura is 23.7%.
Women in Mansura earn 76.3 cents for every dollar earned by a man.
What is Family Income Deficit in Mansura?
Family Income Deficit in Mansura is $9,443.
Families that are below poverty line in Mansura earn $9,443 less on average than the poverty threshold level.
What is Inequality or Gini Index in Mansura?
Inequality or Gini Index in Mansura is 0.42.
What is the Total Population of Mansura?
Total Population of Mansura is 1,376.
What is the Total Male Population of Mansura?
Total Male Population of Mansura is 519.
What is the Total Female Population of Mansura?
Total Female Population of Mansura is 857.
What is the Ratio of Males per 100 Females in Mansura?
There are 60.56 Males per 100 Females in Mansura.
What is the Ratio of Females per 100 Males in Mansura?
There are 165.13 Females per 100 Males in Mansura.
What is the Median Population Age in Mansura?
Median Population Age in Mansura is 49.1 Years.
What is the Average Family Size in Mansura
Average Family Size in Mansura is 2.8 People.
What is the Average Household Size in Mansura
Average Household Size in Mansura is 2.2 People.
How Large is the Labor Force in Mansura?
There are 531 People in the Labor Forcein in Mansura.
What is the Percentage of People in the Labor Force in Mansura?
44.3% of People are in the Labor Force in Mansura.
What is the Unemployment Rate in Mansura?
Unemployment Rate in Mansura is 23.2%.