Mansfield, LA Map & Demographics
Mansfield Map
Mansfield Overview
$16,198
PER CAPITA INCOME
$34,365
AVG FAMILY INCOME
$33,072
AVG HOUSEHOLD INCOME
23.6%
WAGE / INCOME GAP [ % ]
76.4¢/ $1
WAGE / INCOME GAP [ $ ]
$10,067
FAMILY INCOME DEFICIT
0.38
INEQUALITY / GINI INDEX
4,675
TOTAL POPULATION
2,259
MALE POPULATION
2,416
FEMALE POPULATION
93.50
MALES / 100 FEMALES
106.95
FEMALES / 100 MALES
41.3
MEDIAN AGE
3.3
AVG FAMILY SIZE
2.6
AVG HOUSEHOLD SIZE
1,965
LABOR FORCE [ PEOPLE ]
47.9%
PERCENT IN LABOR FORCE
15.8%
UNEMPLOYMENT RATE
Mansfield Zip Codes
Mansfield Area Codes
Income in Mansfield
Income Overview in Mansfield
Per Capita Income in Mansfield is $16,198, while median incomes of families and households are $34,365 and $33,072 respectively.
| Characteristic | Number | Measure |
| Per Capita Income | 4,675 | $16,198 |
| Median Family Income | 1,129 | $34,365 |
| Mean Family Income | 1,129 | $47,076 |
| Median Household Income | 1,721 | $33,072 |
| Mean Household Income | 1,721 | $39,277 |
| Income Deficit | 1,129 | $10,067 |
| Wage / Income Gap (%) | 4,675 | 23.55% |
| Wage / Income Gap ($) | 4,675 | 76.45¢ per $1 |
| Gini / Inequality Index | 4,675 | 0.38 |
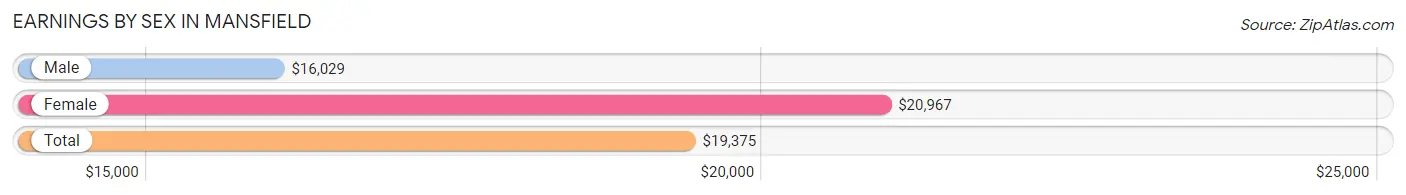
Earnings by Sex in Mansfield
Average Earnings in Mansfield are $19,375, $16,029 for men and $20,967 for women, a difference of 23.5%.
| Sex | Number | Average Earnings |
| Male | 1,096 (53.9%) | $16,029 |
| Female | 936 (46.1%) | $20,967 |
| Total | 2,032 (100.0%) | $19,375 |
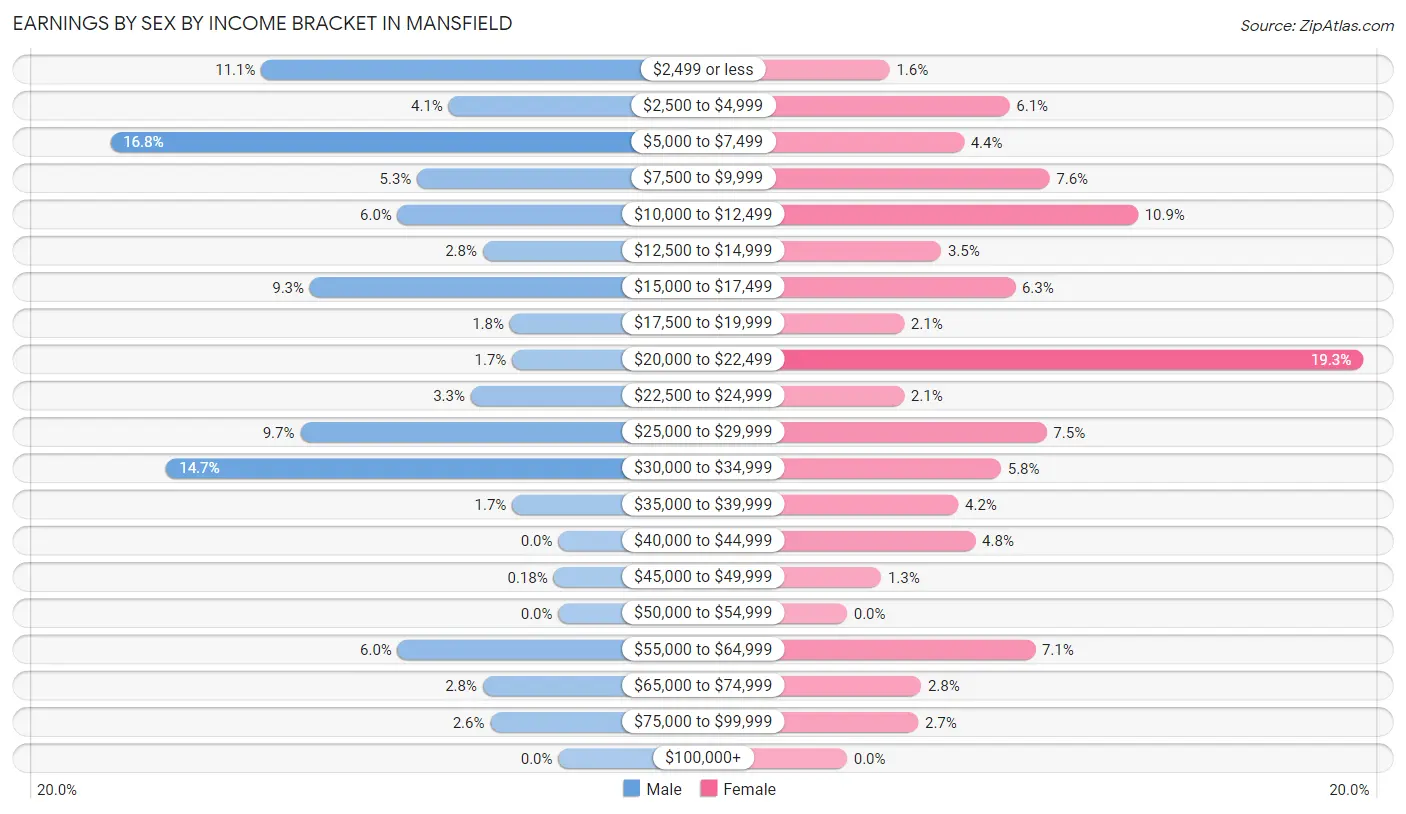
Earnings by Sex by Income Bracket in Mansfield
The most common earnings brackets in Mansfield are $5,000 to $7,499 for men (184 | 16.8%) and $20,000 to $22,499 for women (181 | 19.3%).
| Income | Male | Female |
| $2,499 or less | 122 (11.1%) | 15 (1.6%) |
| $2,500 to $4,999 | 45 (4.1%) | 57 (6.1%) |
| $5,000 to $7,499 | 184 (16.8%) | 41 (4.4%) |
| $7,500 to $9,999 | 58 (5.3%) | 71 (7.6%) |
| $10,000 to $12,499 | 66 (6.0%) | 102 (10.9%) |
| $12,500 to $14,999 | 31 (2.8%) | 33 (3.5%) |
| $15,000 to $17,499 | 102 (9.3%) | 59 (6.3%) |
| $17,500 to $19,999 | 20 (1.8%) | 20 (2.1%) |
| $20,000 to $22,499 | 19 (1.7%) | 181 (19.3%) |
| $22,500 to $24,999 | 36 (3.3%) | 20 (2.1%) |
| $25,000 to $29,999 | 106 (9.7%) | 70 (7.5%) |
| $30,000 to $34,999 | 161 (14.7%) | 54 (5.8%) |
| $35,000 to $39,999 | 19 (1.7%) | 39 (4.2%) |
| $40,000 to $44,999 | 0 (0.0%) | 45 (4.8%) |
| $45,000 to $49,999 | 2 (0.2%) | 12 (1.3%) |
| $50,000 to $54,999 | 0 (0.0%) | 0 (0.0%) |
| $55,000 to $64,999 | 66 (6.0%) | 66 (7.0%) |
| $65,000 to $74,999 | 31 (2.8%) | 26 (2.8%) |
| $75,000 to $99,999 | 28 (2.5%) | 25 (2.7%) |
| $100,000+ | 0 (0.0%) | 0 (0.0%) |
| Total | 1,096 (100.0%) | 936 (100.0%) |
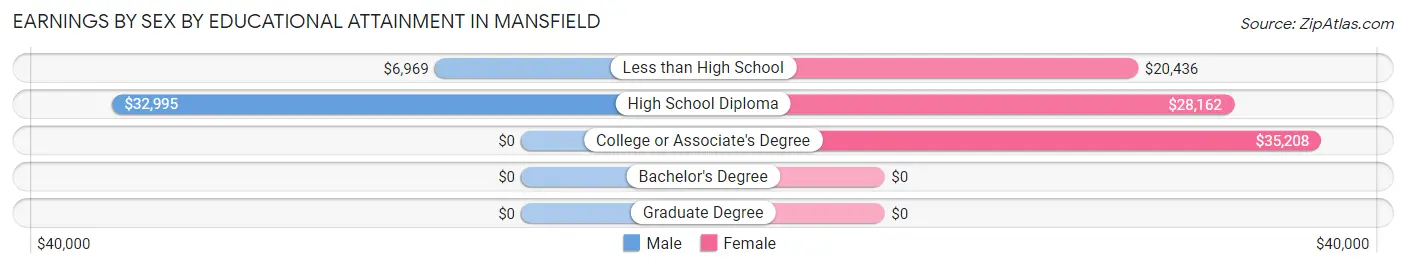
Earnings by Sex by Educational Attainment in Mansfield
Average earnings in Mansfield are $22,368 for men and $22,348 for women, a difference of 0.1%. Men with an educational attainment of high school diploma enjoy the highest average annual earnings of $32,995, while those with less than high school education earn the least with $6,969. Women with an educational attainment of college or associate's degree earn the most with the average annual earnings of $35,208, while those with less than high school education have the smallest earnings of $20,436.
| Educational Attainment | Male Income | Female Income |
| Less than High School | $6,969 | $20,436 |
| High School Diploma | $32,995 | $28,162 |
| College or Associate's Degree | - | - |
| Bachelor's Degree | - | - |
| Graduate Degree | - | - |
| Total | $22,368 | $22,348 |
Family Income in Mansfield
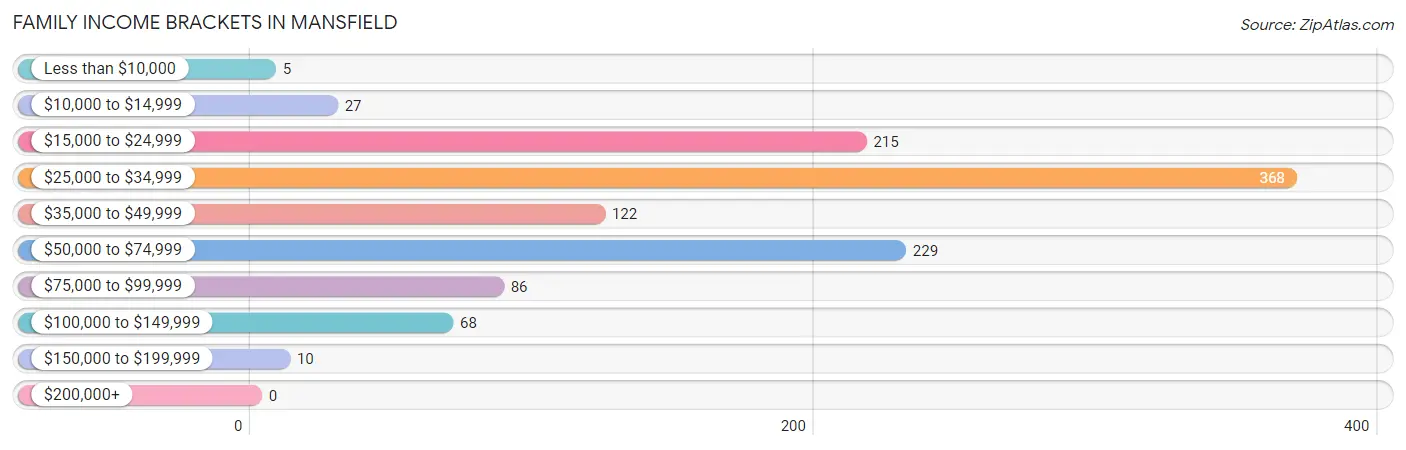
Family Income Brackets in Mansfield
According to the Mansfield family income data, there are 368 families falling into the $25,000 to $34,999 income range, which is the most common income bracket and makes up 32.6% of all families.
| Income Bracket | # Families | % Families |
| Less than $10,000 | 5 | 0.4% |
| $10,000 to $14,999 | 27 | 2.4% |
| $15,000 to $24,999 | 215 | 19.0% |
| $25,000 to $34,999 | 368 | 32.6% |
| $35,000 to $49,999 | 122 | 10.8% |
| $50,000 to $74,999 | 229 | 20.3% |
| $75,000 to $99,999 | 86 | 7.6% |
| $100,000 to $149,999 | 68 | 6.0% |
| $150,000 to $199,999 | 10 | 0.9% |
| $200,000+ | 0 | 0.0% |
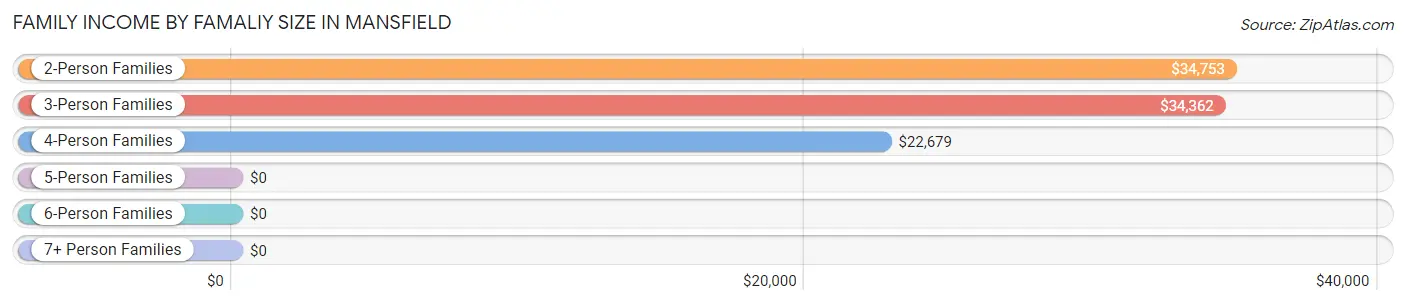
Family Income by Famaliy Size in Mansfield
2-person families (455 | 40.3%) account for the highest median family income in Mansfield with $34,753 per family, while 2-person families (455 | 40.3%) have the highest median income of $17,376 per family member.
| Income Bracket | # Families | Median Income |
| 2-Person Families | 455 (40.3%) | $34,753 |
| 3-Person Families | 406 (36.0%) | $34,362 |
| 4-Person Families | 202 (17.9%) | $22,679 |
| 5-Person Families | 55 (4.9%) | $0 |
| 6-Person Families | 0 (0.0%) | $0 |
| 7+ Person Families | 11 (1.0%) | $0 |
| Total | 1,129 (100.0%) | $34,365 |
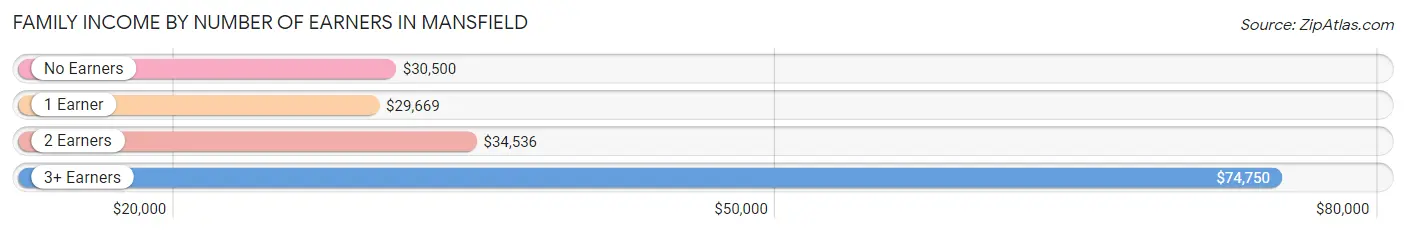
Family Income by Number of Earners in Mansfield
The median family income in Mansfield is $34,365, with families comprising 3+ earners (81) having the highest median family income of $74,750, while families with 1 earner (434) have the lowest median family income of $29,669, accounting for 7.2% and 38.4% of families, respectively.
| Number of Earners | # Families | Median Income |
| No Earners | 198 (17.5%) | $30,500 |
| 1 Earner | 434 (38.4%) | $29,669 |
| 2 Earners | 416 (36.8%) | $34,536 |
| 3+ Earners | 81 (7.2%) | $74,750 |
| Total | 1,129 (100.0%) | $34,365 |
Household Income in Mansfield
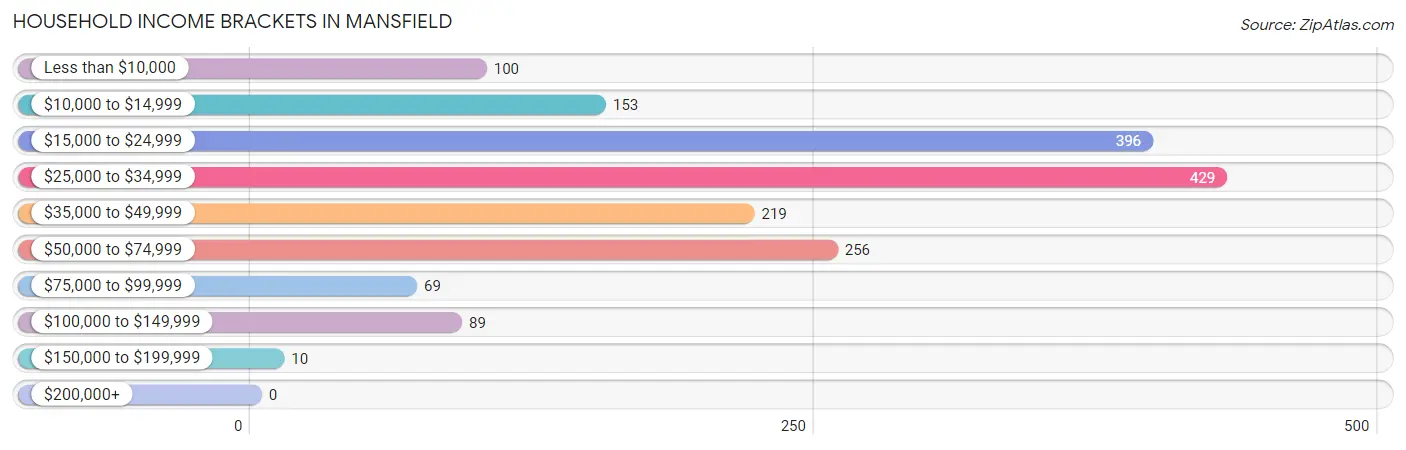
Household Income Brackets in Mansfield
With 429 households falling in the category, the $25,000 to $34,999 income range is the most frequent in Mansfield, accounting for 24.9% of all households.
| Income Bracket | # Households | % Households |
| Less than $10,000 | 100 | 5.8% |
| $10,000 to $14,999 | 153 | 8.9% |
| $15,000 to $24,999 | 396 | 23.0% |
| $25,000 to $34,999 | 429 | 24.9% |
| $35,000 to $49,999 | 219 | 12.7% |
| $50,000 to $74,999 | 256 | 14.9% |
| $75,000 to $99,999 | 69 | 4.0% |
| $100,000 to $149,999 | 89 | 5.2% |
| $150,000 to $199,999 | 10 | 0.6% |
| $200,000+ | 0 | 0.0% |
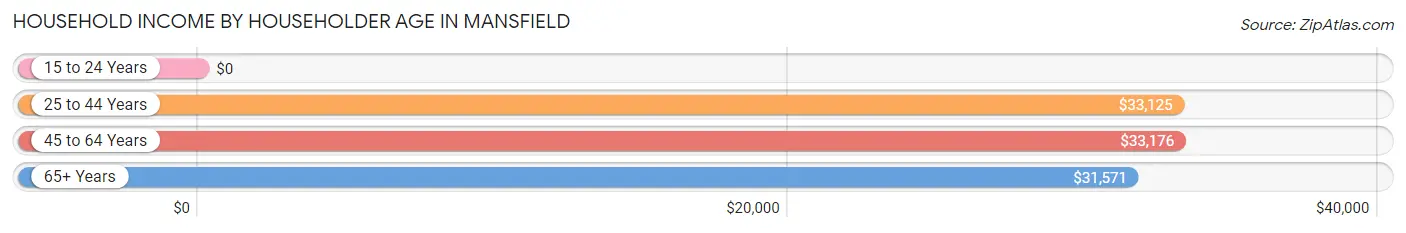
Household Income by Householder Age in Mansfield
The median household income in Mansfield is $33,072, with the highest median household income of $33,176 found in the 45 to 64 years age bracket for the primary householder. A total of 579 households (33.6%) fall into this category. Meanwhile, the 15 to 24 years age bracket for the primary householder has the lowest median household income of $0, with 37 households (2.1%) in this group.
| Income Bracket | # Households | Median Income |
| 15 to 24 Years | 37 (2.1%) | $0 |
| 25 to 44 Years | 468 (27.2%) | $33,125 |
| 45 to 64 Years | 579 (33.6%) | $33,176 |
| 65+ Years | 637 (37.0%) | $31,571 |
| Total | 1,721 (100.0%) | $33,072 |
Poverty in Mansfield
Income Below Poverty by Sex and Age in Mansfield
With 26.2% poverty level for males and 25.7% for females among the residents of Mansfield, under 5 year old males and 15 year old females are the most vulnerable to poverty, with 10 males (100.0%) and 12 females (100.0%) in their respective age groups living below the poverty level.
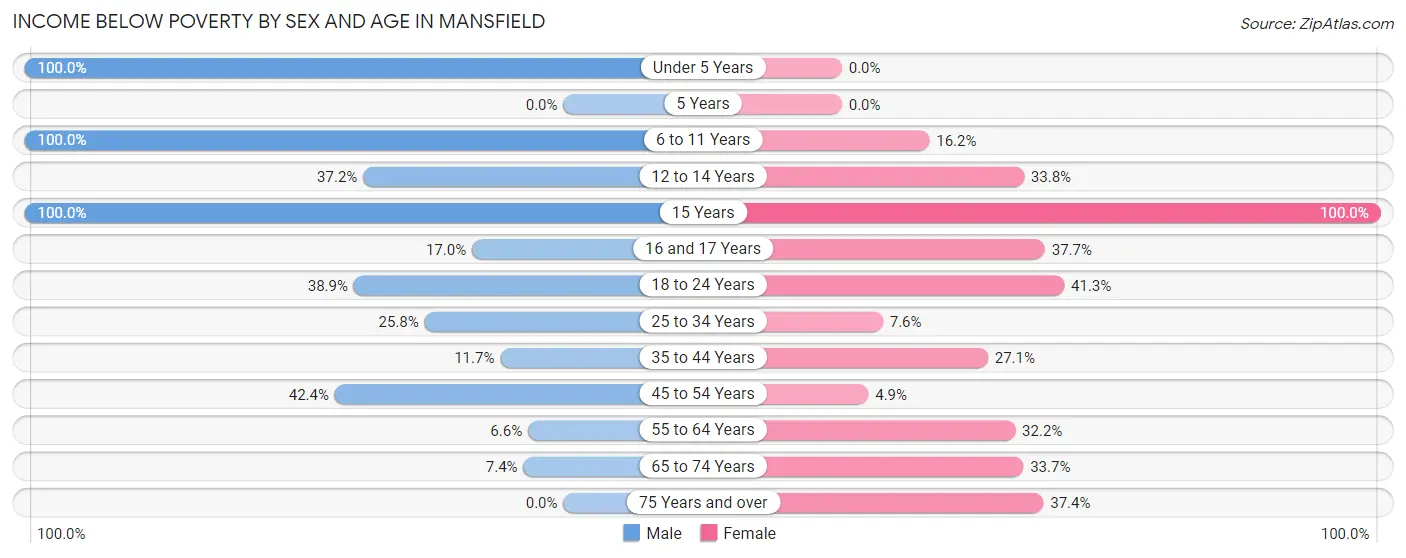
| Age Bracket | Male | Female |
| Under 5 Years | 10 (100.0%) | 0 (0.0%) |
| 5 Years | 0 (0.0%) | 0 (0.0%) |
| 6 to 11 Years | 73 (100.0%) | 19 (16.2%) |
| 12 to 14 Years | 55 (37.2%) | 48 (33.8%) |
| 15 Years | 8 (100.0%) | 12 (100.0%) |
| 16 and 17 Years | 19 (17.0%) | 26 (37.7%) |
| 18 to 24 Years | 105 (38.9%) | 92 (41.3%) |
| 25 to 34 Years | 93 (25.8%) | 15 (7.6%) |
| 35 to 44 Years | 52 (11.7%) | 87 (27.1%) |
| 45 to 54 Years | 126 (42.4%) | 18 (4.9%) |
| 55 to 64 Years | 12 (6.6%) | 93 (32.2%) |
| 65 to 74 Years | 14 (7.4%) | 97 (33.7%) |
| 75 Years and over | 0 (0.0%) | 95 (37.4%) |
| Total | 567 (26.2%) | 602 (25.7%) |
Income Above Poverty by Sex and Age in Mansfield
According to the poverty statistics in Mansfield, males aged 75 years and over and females aged under 5 years are the age groups that are most secure financially, with 100.0% of males and 100.0% of females in these age groups living above the poverty line.
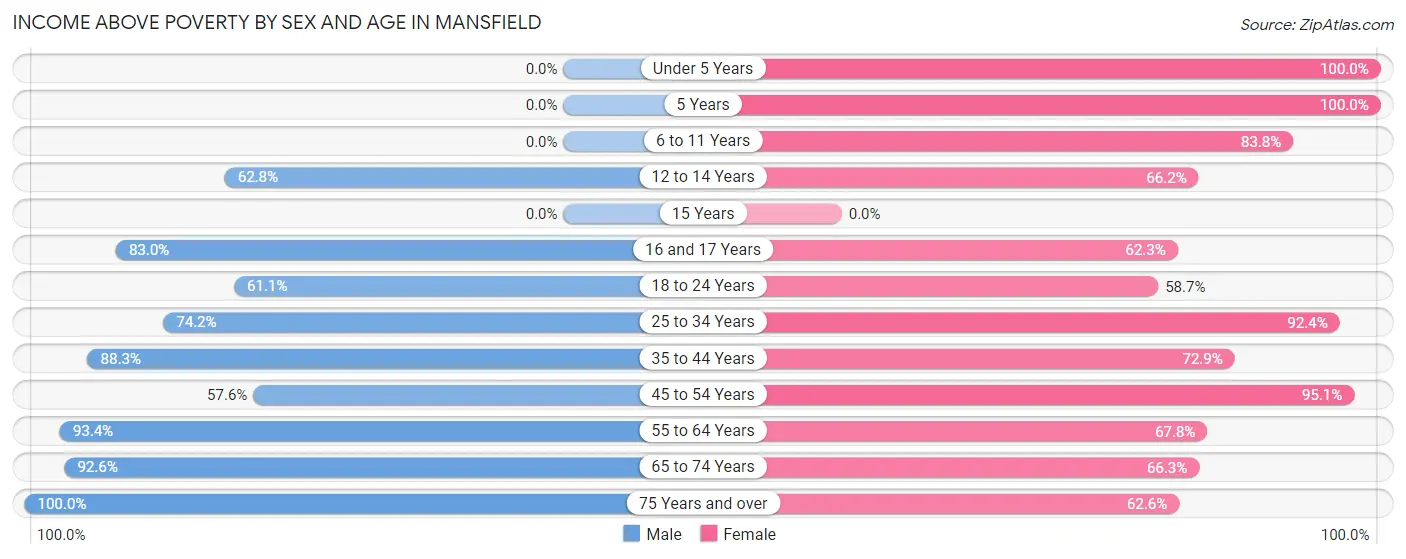
| Age Bracket | Male | Female |
| Under 5 Years | 0 (0.0%) | 54 (100.0%) |
| 5 Years | 0 (0.0%) | 9 (100.0%) |
| 6 to 11 Years | 0 (0.0%) | 98 (83.8%) |
| 12 to 14 Years | 93 (62.8%) | 94 (66.2%) |
| 15 Years | 0 (0.0%) | 0 (0.0%) |
| 16 and 17 Years | 93 (83.0%) | 43 (62.3%) |
| 18 to 24 Years | 165 (61.1%) | 131 (58.7%) |
| 25 to 34 Years | 268 (74.2%) | 182 (92.4%) |
| 35 to 44 Years | 392 (88.3%) | 234 (72.9%) |
| 45 to 54 Years | 171 (57.6%) | 348 (95.1%) |
| 55 to 64 Years | 171 (93.4%) | 196 (67.8%) |
| 65 to 74 Years | 175 (92.6%) | 191 (66.3%) |
| 75 Years and over | 69 (100.0%) | 159 (62.6%) |
| Total | 1,597 (73.8%) | 1,739 (74.3%) |
Income Below Poverty Among Married-Couple Families in Mansfield
The poverty statistics for married-couple families in Mansfield show that 10.1% or 37 of the total 367 families live below the poverty line. Families with 1 or 2 children have the highest poverty rate of 39.1%, comprising of 36 families. On the other hand, families with no children have the lowest poverty rate of 0.4%, which includes 1 families.
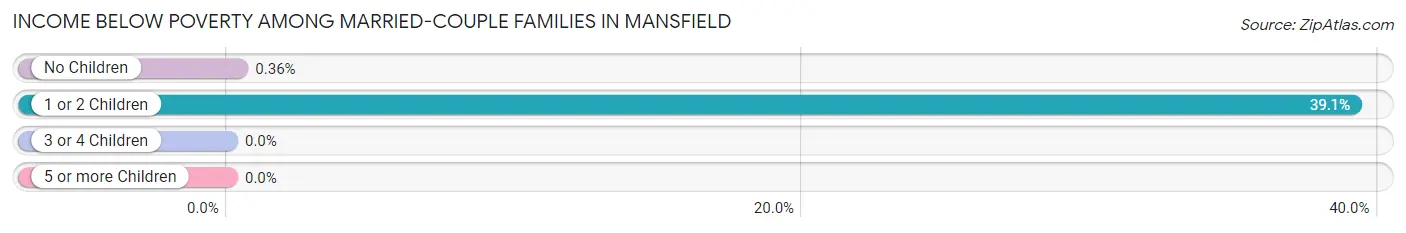
| Children | Above Poverty | Below Poverty |
| No Children | 274 (99.6%) | 1 (0.4%) |
| 1 or 2 Children | 56 (60.9%) | 36 (39.1%) |
| 3 or 4 Children | 0 (0.0%) | 0 (0.0%) |
| 5 or more Children | 0 (0.0%) | 0 (0.0%) |
| Total | 330 (89.9%) | 37 (10.1%) |
Income Below Poverty Among Single-Parent Households in Mansfield
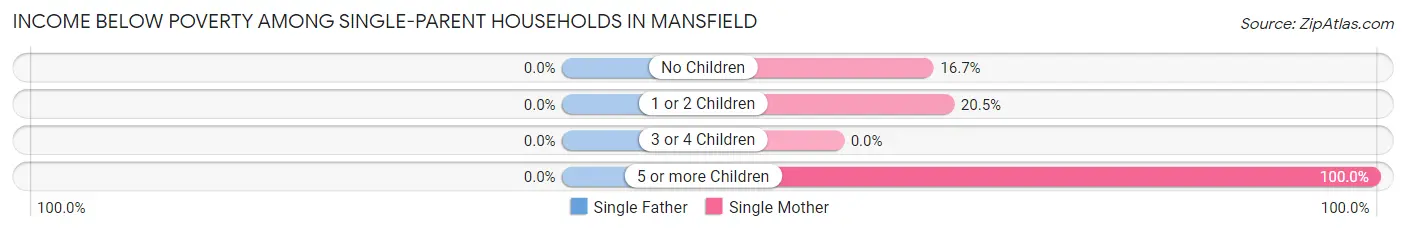
| Children | Single Father | Single Mother |
| No Children | 0 (0.0%) | 58 (16.7%) |
| 1 or 2 Children | 0 (0.0%) | 54 (20.5%) |
| 3 or 4 Children | 0 (0.0%) | 0 (0.0%) |
| 5 or more Children | 0 (0.0%) | 11 (100.0%) |
| Total | 0 (0.0%) | 123 (18.8%) |
Income Below Poverty Among Married-Couple vs Single-Parent Households in Mansfield
The poverty data for Mansfield shows that 37 of the married-couple family households (10.1%) and 123 of the single-parent households (16.1%) are living below the poverty level. Within the married-couple family households, those with 1 or 2 children have the highest poverty rate, with 36 households (39.1%) falling below the poverty line. Among the single-parent households, those with 5 or more children have the highest poverty rate, with 11 household (100.0%) living below poverty.
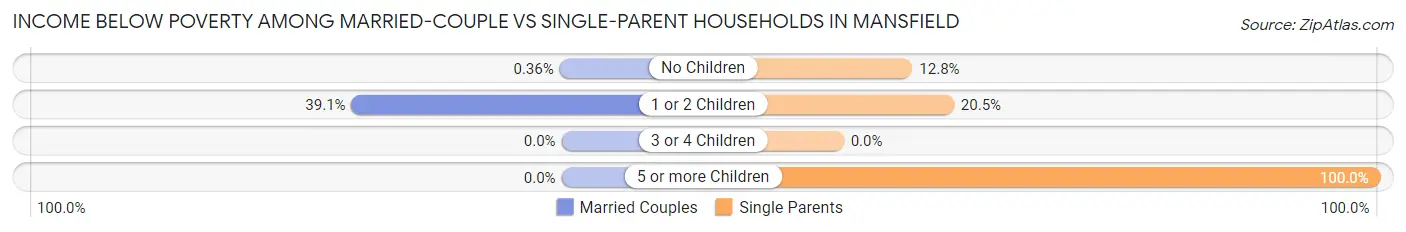
| Children | Married-Couple Families | Single-Parent Households |
| No Children | 1 (0.4%) | 58 (12.8%) |
| 1 or 2 Children | 36 (39.1%) | 54 (20.5%) |
| 3 or 4 Children | 0 (0.0%) | 0 (0.0%) |
| 5 or more Children | 0 (0.0%) | 11 (100.0%) |
| Total | 37 (10.1%) | 123 (16.1%) |
Race in Mansfield
The most populous races in Mansfield are Black / African American (4,046 | 86.6%), White / Caucasian (541 | 11.6%), and Two or more Races (66 | 1.4%).
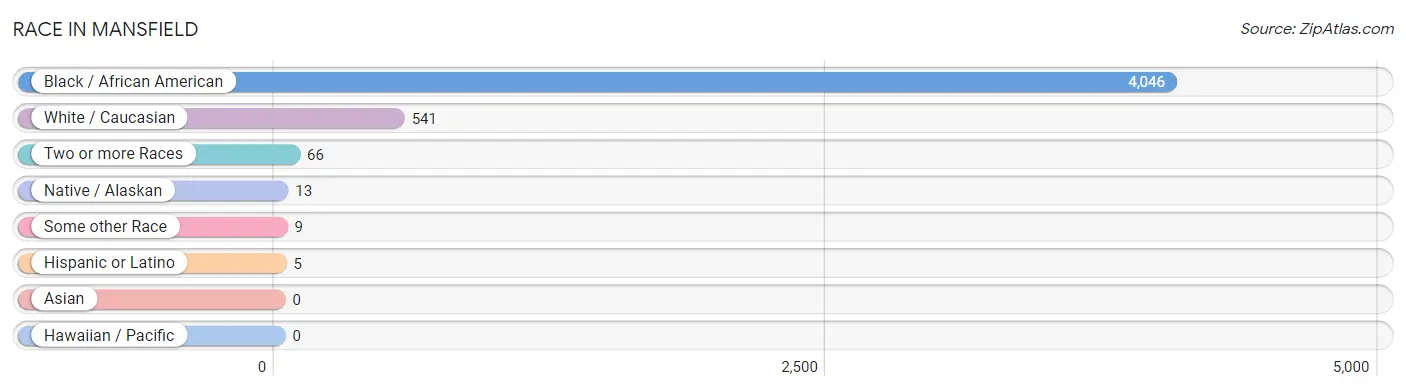
| Race | # Population | % Population |
| Asian | 0 | 0.0% |
| Black / African American | 4,046 | 86.6% |
| Hawaiian / Pacific | 0 | 0.0% |
| Hispanic or Latino | 5 | 0.1% |
| Native / Alaskan | 13 | 0.3% |
| White / Caucasian | 541 | 11.6% |
| Two or more Races | 66 | 1.4% |
| Some other Race | 9 | 0.2% |
| Total | 4,675 | 100.0% |
Ancestry in Mansfield
The most populous ancestries reported in Mansfield are Irish (191 | 4.1%), American (141 | 3.0%), French (45 | 1.0%), English (29 | 0.6%), and German (26 | 0.6%), together accounting for 9.2% of all Mansfield residents.

| Ancestry | # Population | % Population |
| African | 12 | 0.3% |
| American | 141 | 3.0% |
| Brazilian | 9 | 0.2% |
| British | 10 | 0.2% |
| Cherokee | 22 | 0.5% |
| Choctaw | 10 | 0.2% |
| Czechoslovakian | 21 | 0.4% |
| Dutch | 24 | 0.5% |
| English | 29 | 0.6% |
| French | 45 | 1.0% |
| German | 26 | 0.6% |
| Irish | 191 | 4.1% |
| Italian | 2 | 0.0% |
| Mexican | 5 | 0.1% |
| Scotch-Irish | 15 | 0.3% |
| Scottish | 2 | 0.0% |
| Subsaharan African | 12 | 0.3% |
| West Indian | 3 | 0.1% | View All 18 Rows |
Immigrants in Mansfield
The most numerous immigrant groups reported in Mansfield came from Brazil (9 | 0.2%), Latin America (9 | 0.2%), and South America (9 | 0.2%), together accounting for 0.6% of all Mansfield residents.
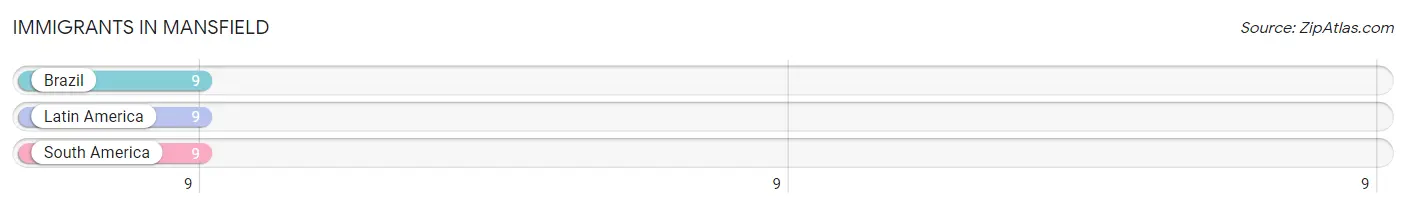
| Immigration Origin | # Population | % Population |
| Brazil | 9 | 0.2% |
| Latin America | 9 | 0.2% |
| South America | 9 | 0.2% | View All 3 Rows |
Sex and Age in Mansfield
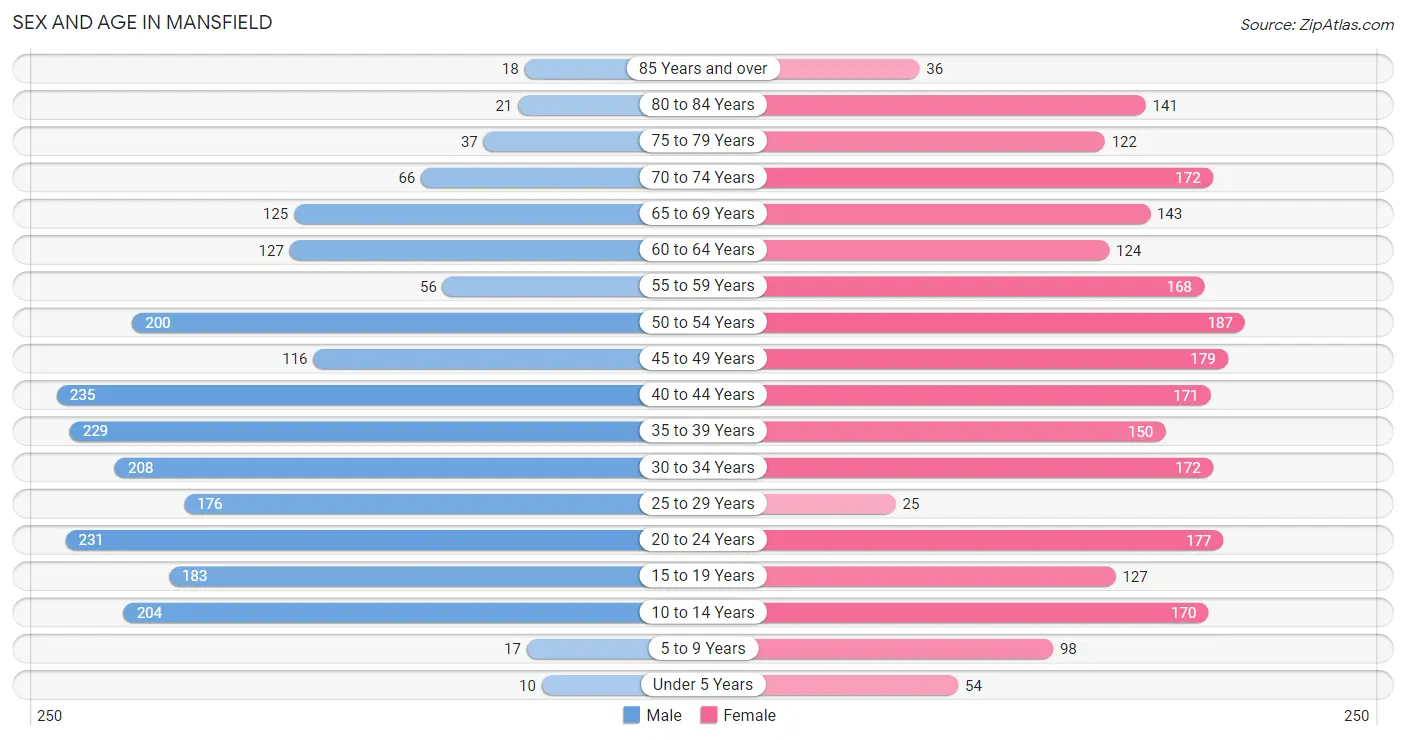
Sex and Age in Mansfield
The most populous age groups in Mansfield are 40 to 44 Years (235 | 10.4%) for men and 50 to 54 Years (187 | 7.7%) for women.
| Age Bracket | Male | Female |
| Under 5 Years | 10 (0.4%) | 54 (2.2%) |
| 5 to 9 Years | 17 (0.7%) | 98 (4.1%) |
| 10 to 14 Years | 204 (9.0%) | 170 (7.0%) |
| 15 to 19 Years | 183 (8.1%) | 127 (5.3%) |
| 20 to 24 Years | 231 (10.2%) | 177 (7.3%) |
| 25 to 29 Years | 176 (7.8%) | 25 (1.0%) |
| 30 to 34 Years | 208 (9.2%) | 172 (7.1%) |
| 35 to 39 Years | 229 (10.1%) | 150 (6.2%) |
| 40 to 44 Years | 235 (10.4%) | 171 (7.1%) |
| 45 to 49 Years | 116 (5.1%) | 179 (7.4%) |
| 50 to 54 Years | 200 (8.8%) | 187 (7.7%) |
| 55 to 59 Years | 56 (2.5%) | 168 (7.0%) |
| 60 to 64 Years | 127 (5.6%) | 124 (5.1%) |
| 65 to 69 Years | 125 (5.5%) | 143 (5.9%) |
| 70 to 74 Years | 66 (2.9%) | 172 (7.1%) |
| 75 to 79 Years | 37 (1.6%) | 122 (5.1%) |
| 80 to 84 Years | 21 (0.9%) | 141 (5.8%) |
| 85 Years and over | 18 (0.8%) | 36 (1.5%) |
| Total | 2,259 (100.0%) | 2,416 (100.0%) |
Families and Households in Mansfield
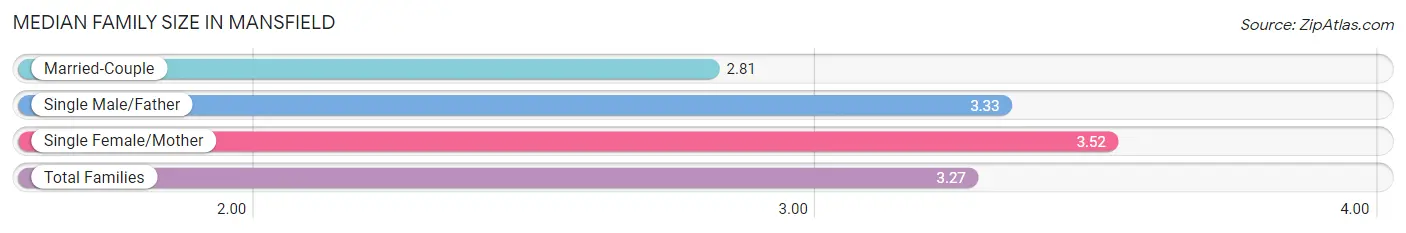
Median Family Size in Mansfield
The median family size in Mansfield is 3.27 persons per family, with single female/mother families (656 | 58.1%) accounting for the largest median family size of 3.52 persons per family. On the other hand, married-couple families (367 | 32.5%) represent the smallest median family size with 2.81 persons per family.
| Family Type | # Families | Family Size |
| Married-Couple | 367 (32.5%) | 2.81 |
| Single Male/Father | 106 (9.4%) | 3.33 |
| Single Female/Mother | 656 (58.1%) | 3.52 |
| Total Families | 1,129 (100.0%) | 3.27 |
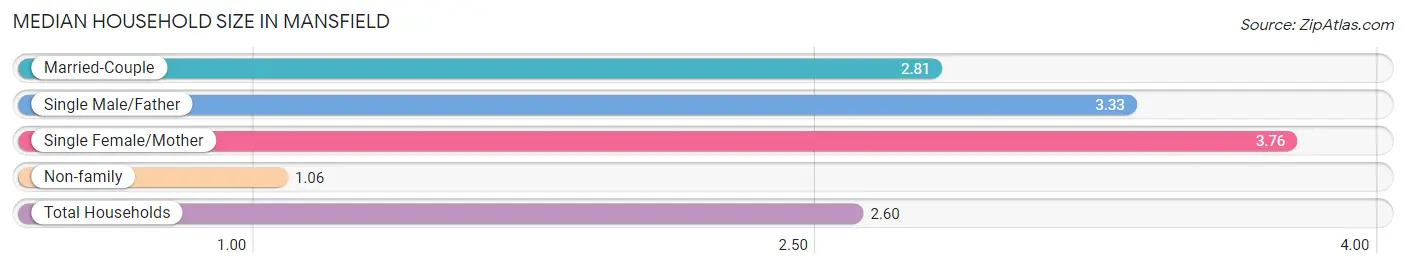
Median Household Size in Mansfield
The median household size in Mansfield is 2.60 persons per household, with single female/mother households (656 | 38.1%) accounting for the largest median household size of 3.76 persons per household. non-family households (592 | 34.4%) represent the smallest median household size with 1.06 persons per household.
| Household Type | # Households | Household Size |
| Married-Couple | 367 (21.3%) | 2.81 |
| Single Male/Father | 106 (6.2%) | 3.33 |
| Single Female/Mother | 656 (38.1%) | 3.76 |
| Non-family | 592 (34.4%) | 1.06 |
| Total Households | 1,721 (100.0%) | 2.60 |
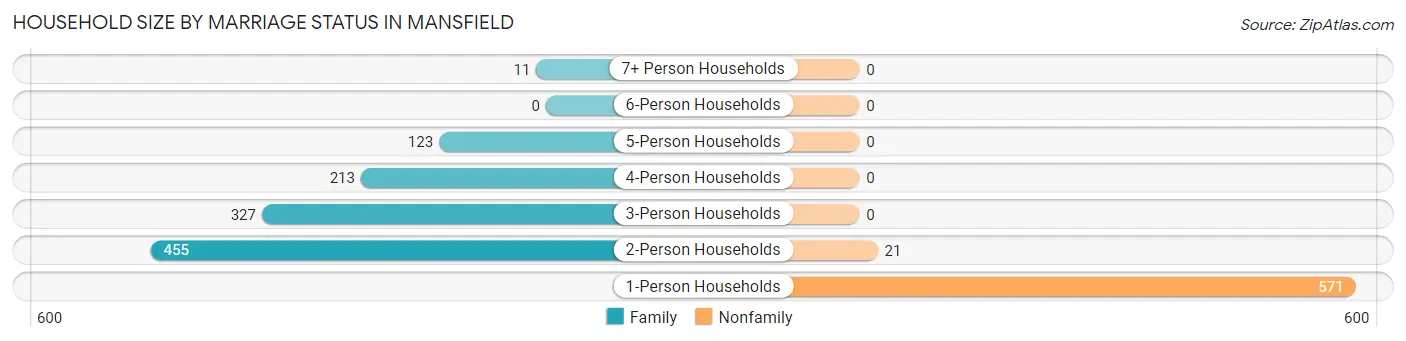
Household Size by Marriage Status in Mansfield
Out of a total of 1,721 households in Mansfield, 1,129 (65.6%) are family households, while 592 (34.4%) are nonfamily households. The most numerous type of family households are 2-person households, comprising 455, and the most common type of nonfamily households are 1-person households, comprising 571.
| Household Size | Family Households | Nonfamily Households |
| 1-Person Households | - | 571 (33.2%) |
| 2-Person Households | 455 (26.4%) | 21 (1.2%) |
| 3-Person Households | 327 (19.0%) | 0 (0.0%) |
| 4-Person Households | 213 (12.4%) | 0 (0.0%) |
| 5-Person Households | 123 (7.1%) | 0 (0.0%) |
| 6-Person Households | 0 (0.0%) | 0 (0.0%) |
| 7+ Person Households | 11 (0.6%) | 0 (0.0%) |
| Total | 1,129 (65.6%) | 592 (34.4%) |
Female Fertility in Mansfield
Fertility by Age in Mansfield
Average fertility rate in Mansfield is 25.0 births per 1,000 women. Women in the age bracket of 35 to 50 years have the highest fertility rate with 50.0 births per 1,000 women. Women in the age bracket of 35 to 50 years acount for 100.0% of all women with births.
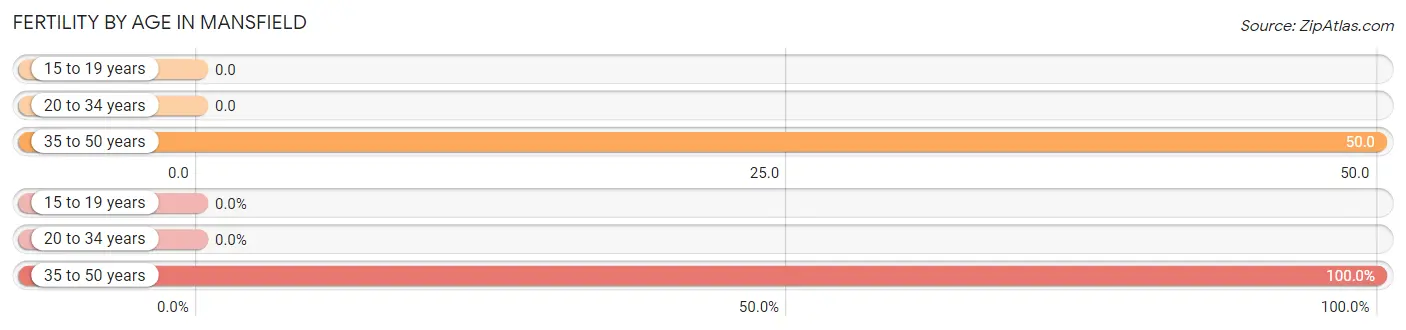
| Age Bracket | Women with Births | Births / 1,000 Women |
| 15 to 19 years | 0 (0.0%) | 0.0 |
| 20 to 34 years | 0 (0.0%) | 0.0 |
| 35 to 50 years | 25 (100.0%) | 50.0 |
| Total | 25 (100.0%) | 25.0 |
Fertility by Age by Marriage Status in Mansfield
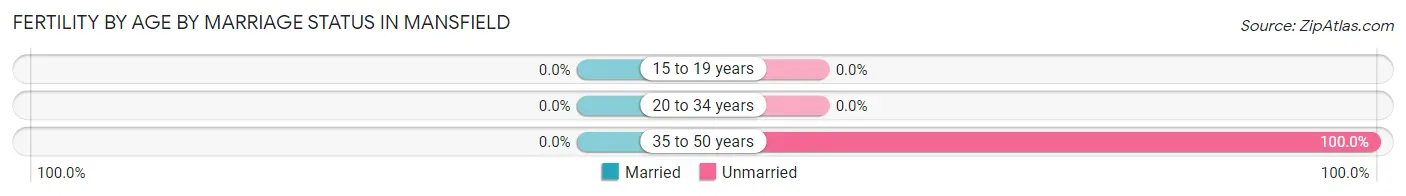
| Age Bracket | Married | Unmarried |
| 15 to 19 years | 0 (0.0%) | 0 (0.0%) |
| 20 to 34 years | 0 (0.0%) | 0 (0.0%) |
| 35 to 50 years | 0 (0.0%) | 25 (100.0%) |
| Total | 0 (0.0%) | 25 (100.0%) |
Fertility by Education in Mansfield
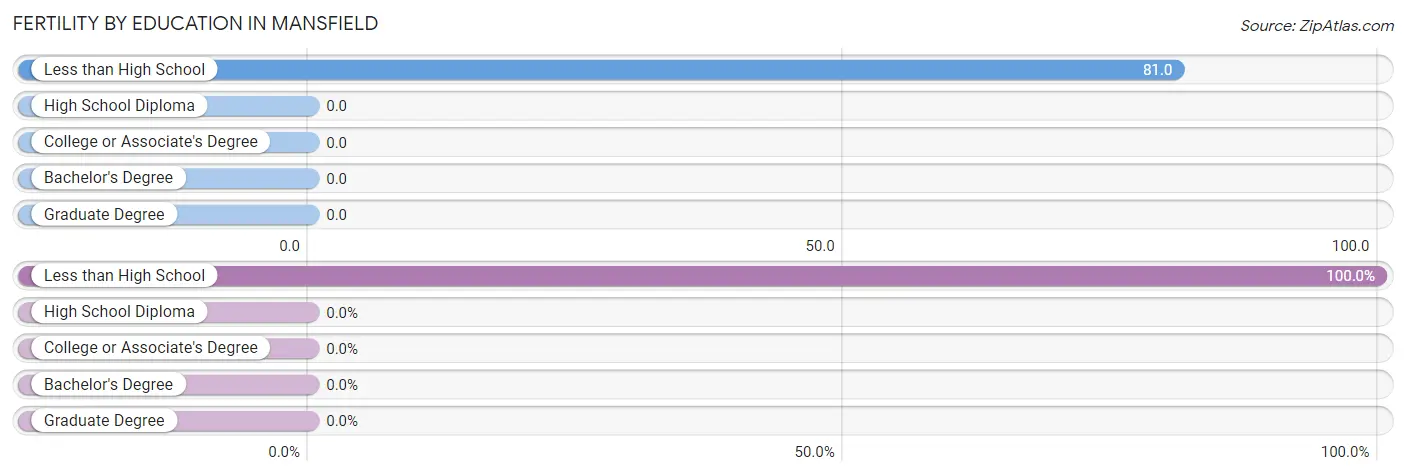
| Educational Attainment | Women with Births | Births / 1,000 Women |
| Less than High School | 25 (100.0%) | 81.0 |
| High School Diploma | 0 (0.0%) | 0.0 |
| College or Associate's Degree | 0 (0.0%) | 0.0 |
| Bachelor's Degree | 0 (0.0%) | 0.0 |
| Graduate Degree | 0 (0.0%) | 0.0 |
| Total | 25 (100.0%) | 25.0 |
Fertility by Education by Marriage Status in Mansfield
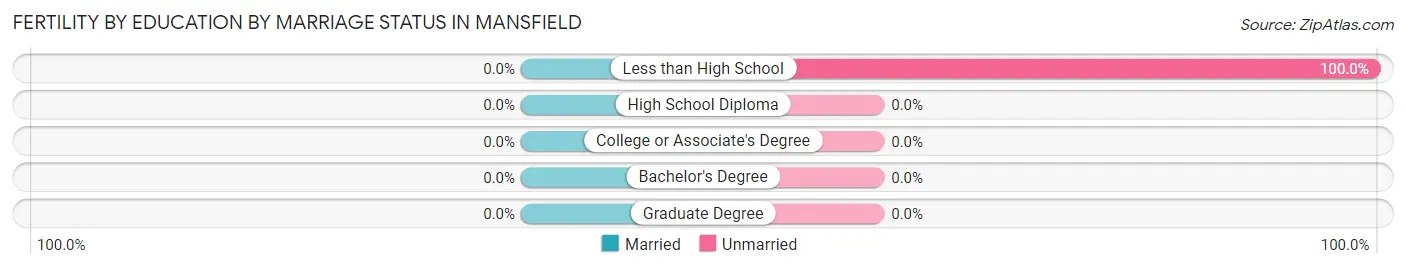
| Educational Attainment | Married | Unmarried |
| Less than High School | 0 (0.0%) | 25 (100.0%) |
| High School Diploma | 0 (0.0%) | 0 (0.0%) |
| College or Associate's Degree | 0 (0.0%) | 0 (0.0%) |
| Bachelor's Degree | 0 (0.0%) | 0 (0.0%) |
| Graduate Degree | 0 (0.0%) | 0 (0.0%) |
| Total | 0 (0.0%) | 25 (100.0%) |
Employment Characteristics in Mansfield
Employment by Class of Employer in Mansfield
Among the 1,655 employed individuals in Mansfield, private company employees (1,184 | 71.5%), self-employed (not incorporated) (231 | 14.0%), and local government employees (128 | 7.7%) make up the most common classes of employment.
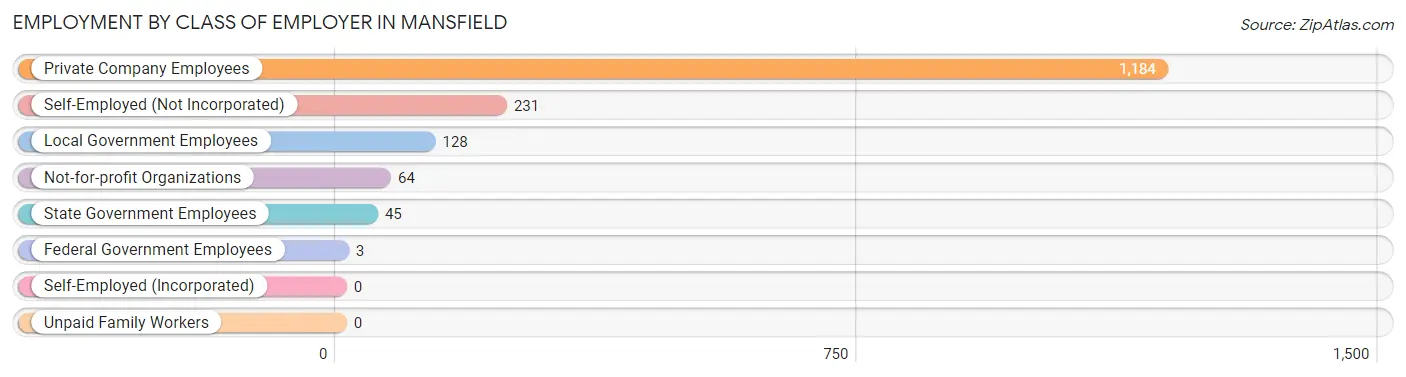
| Employer Class | # Employees | % Employees |
| Private Company Employees | 1,184 | 71.5% |
| Self-Employed (Incorporated) | 0 | 0.0% |
| Self-Employed (Not Incorporated) | 231 | 14.0% |
| Not-for-profit Organizations | 64 | 3.9% |
| Local Government Employees | 128 | 7.7% |
| State Government Employees | 45 | 2.7% |
| Federal Government Employees | 3 | 0.2% |
| Unpaid Family Workers | 0 | 0.0% |
| Total | 1,655 | 100.0% |
Employment Status by Age in Mansfield
According to the labor force statistics for Mansfield, out of the total population over 16 years of age (4,102), 47.9% or 1,965 individuals are in the labor force, with 15.8% or 310 of them unemployed. The age group with the highest labor force participation rate is 25 to 29 years, with 90.0% or 181 individuals in the labor force. Within the labor force, the 20 to 24 years age range has the highest percentage of unemployed individuals, with 33.1% or 112 of them being unemployed.
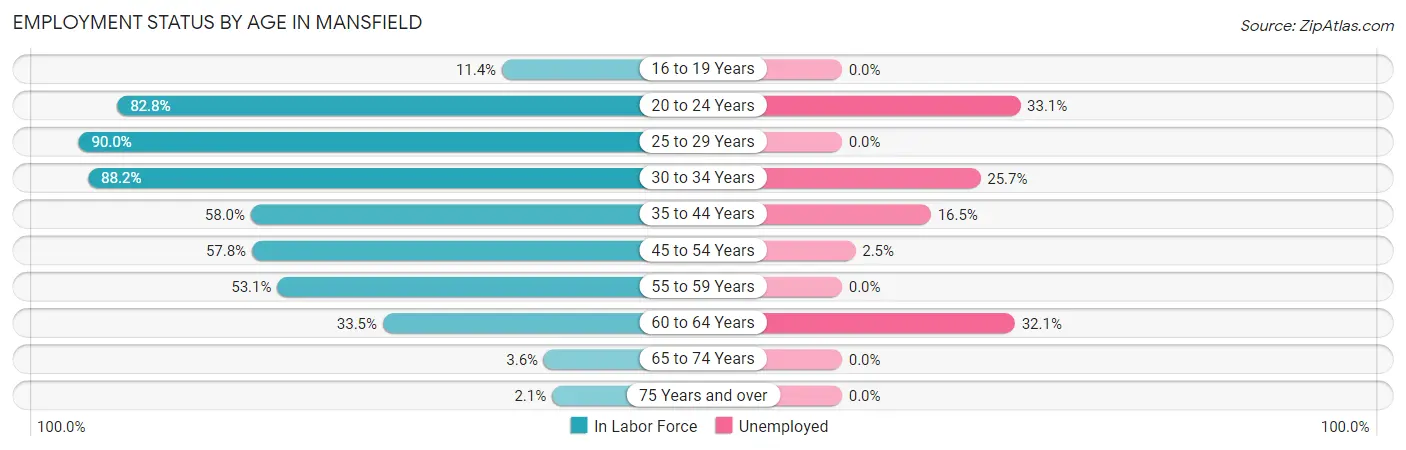
| Age Bracket | In Labor Force | Unemployed |
| 16 to 19 Years | 33 (11.4%) | 0 (0.0%) |
| 20 to 24 Years | 338 (82.8%) | 112 (33.1%) |
| 25 to 29 Years | 181 (90.0%) | 0 (0.0%) |
| 30 to 34 Years | 335 (88.2%) | 86 (25.7%) |
| 35 to 44 Years | 455 (58.0%) | 75 (16.5%) |
| 45 to 54 Years | 394 (57.8%) | 10 (2.5%) |
| 55 to 59 Years | 119 (53.1%) | 0 (0.0%) |
| 60 to 64 Years | 84 (33.5%) | 27 (32.1%) |
| 65 to 74 Years | 18 (3.6%) | 0 (0.0%) |
| 75 Years and over | 8 (2.1%) | 0 (0.0%) |
| Total | 1,965 (47.9%) | 310 (15.8%) |
Employment Status by Educational Attainment in Mansfield
According to labor force statistics for Mansfield, 62.1% of individuals (1,567) out of the total population between 25 and 64 years of age (2,523) are in the labor force, with 12.7% or 199 of them being unemployed. The group with the highest labor force participation rate are those with the educational attainment of bachelor's degree or higher, with 90.4% or 66 individuals in the labor force. Within the labor force, individuals with less than high school education have the highest percentage of unemployment, with 24.5% or 124 of them being unemployed.
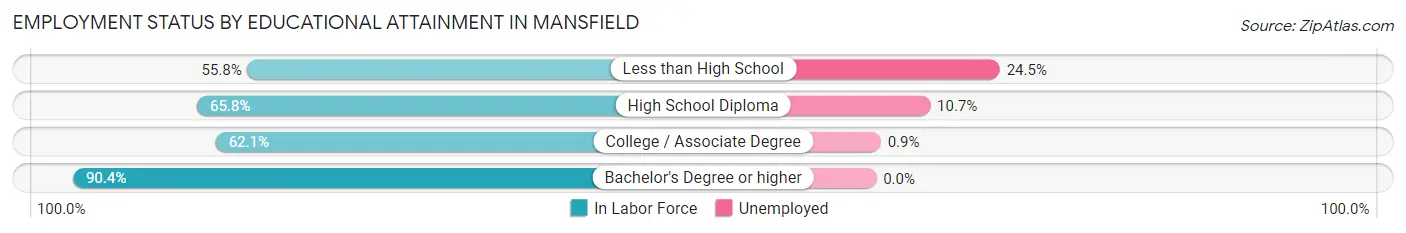
| Educational Attainment | In Labor Force | Unemployed |
| Less than High School | 507 (55.8%) | 222 (24.5%) |
| High School Diploma | 666 (65.8%) | 108 (10.7%) |
| College / Associate Degree | 329 (62.1%) | 5 (0.9%) |
| Bachelor's Degree or higher | 66 (90.4%) | 0 (0.0%) |
| Total | 1,567 (62.1%) | 320 (12.7%) |
Employment Occupations by Sex in Mansfield
Management, Business, Science and Arts Occupations
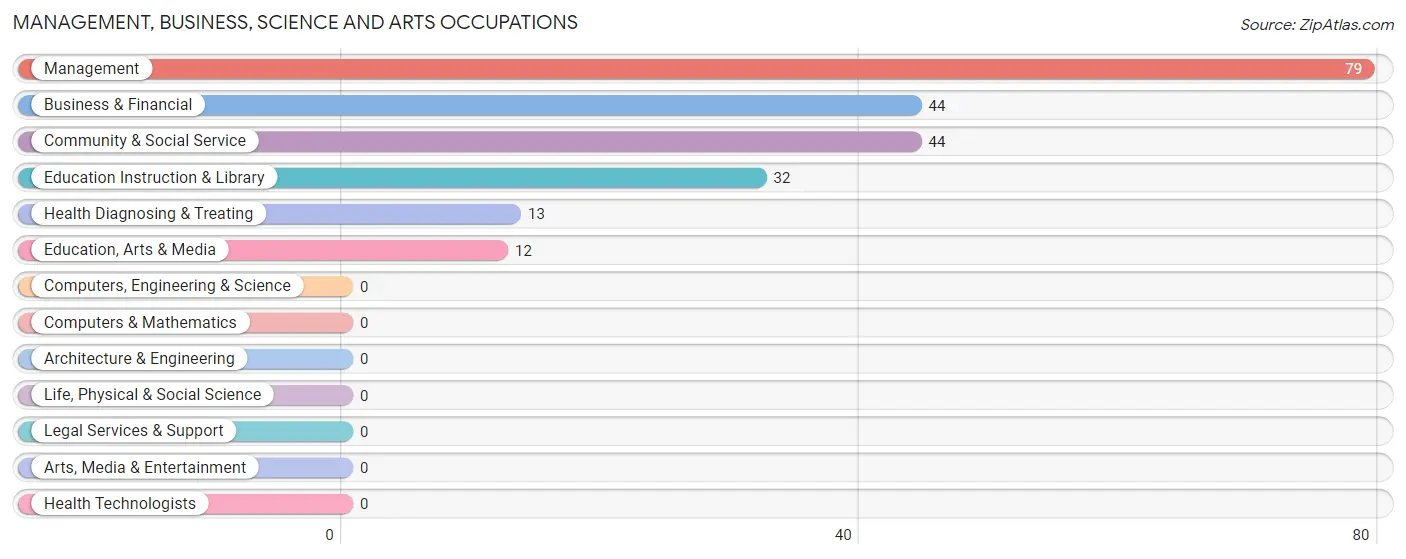
The most common Management, Business, Science and Arts occupations in Mansfield are Management (79 | 4.8%), Business & Financial (44 | 2.7%), Community & Social Service (44 | 2.7%), Education Instruction & Library (32 | 1.9%), and Health Diagnosing & Treating (13 | 0.8%).
Management, Business, Science and Arts Occupations by Sex
Within the Management, Business, Science and Arts occupations in Mansfield, the most male-oriented occupations are Education, Arts & Media (100.0%), Business & Financial (52.3%), and Community & Social Service (50.0%), while the most female-oriented occupations are Health Diagnosing & Treating (100.0%), Education Instruction & Library (68.8%), and Management (58.2%).
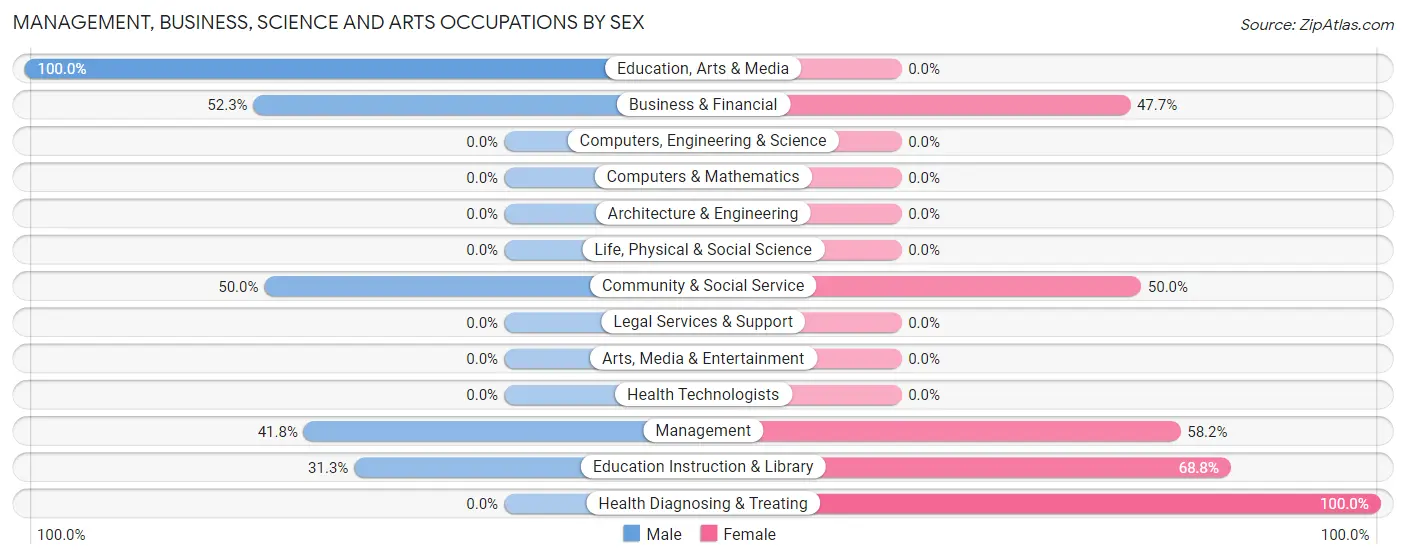
| Occupation | Male | Female |
| Management | 33 (41.8%) | 46 (58.2%) |
| Business & Financial | 23 (52.3%) | 21 (47.7%) |
| Computers, Engineering & Science | 0 (0.0%) | 0 (0.0%) |
| Computers & Mathematics | 0 (0.0%) | 0 (0.0%) |
| Architecture & Engineering | 0 (0.0%) | 0 (0.0%) |
| Life, Physical & Social Science | 0 (0.0%) | 0 (0.0%) |
| Community & Social Service | 22 (50.0%) | 22 (50.0%) |
| Education, Arts & Media | 12 (100.0%) | 0 (0.0%) |
| Legal Services & Support | 0 (0.0%) | 0 (0.0%) |
| Education Instruction & Library | 10 (31.2%) | 22 (68.8%) |
| Arts, Media & Entertainment | 0 (0.0%) | 0 (0.0%) |
| Health Diagnosing & Treating | 0 (0.0%) | 13 (100.0%) |
| Health Technologists | 0 (0.0%) | 0 (0.0%) |
| Total (Category) | 78 (43.3%) | 102 (56.7%) |
| Total (Overall) | 887 (53.7%) | 765 (46.3%) |
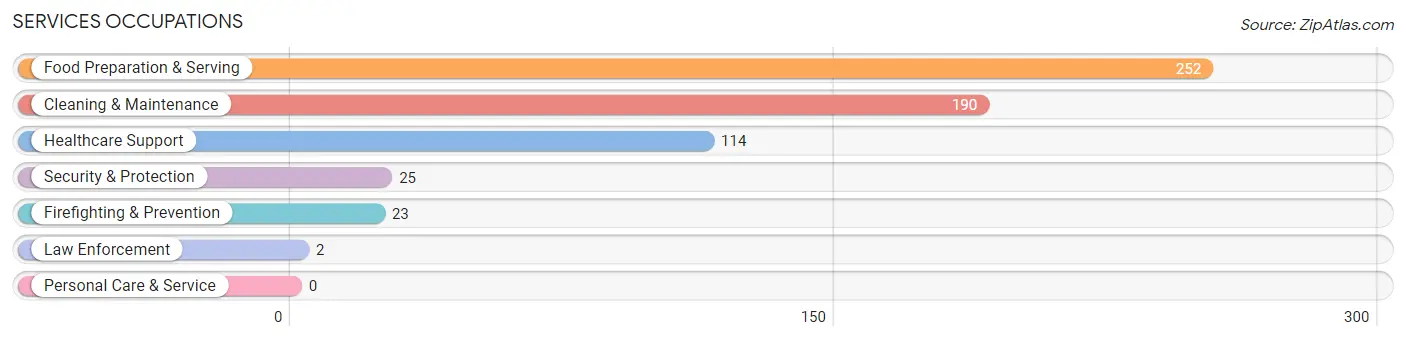
Services Occupations
The most common Services occupations in Mansfield are Food Preparation & Serving (252 | 15.2%), Cleaning & Maintenance (190 | 11.5%), Healthcare Support (114 | 6.9%), Security & Protection (25 | 1.5%), and Firefighting & Prevention (23 | 1.4%).
Services Occupations by Sex
Within the Services occupations in Mansfield, the most male-oriented occupations are Law Enforcement (100.0%), Food Preparation & Serving (80.6%), and Security & Protection (44.0%), while the most female-oriented occupations are Healthcare Support (93.0%), Cleaning & Maintenance (74.2%), and Firefighting & Prevention (60.9%).
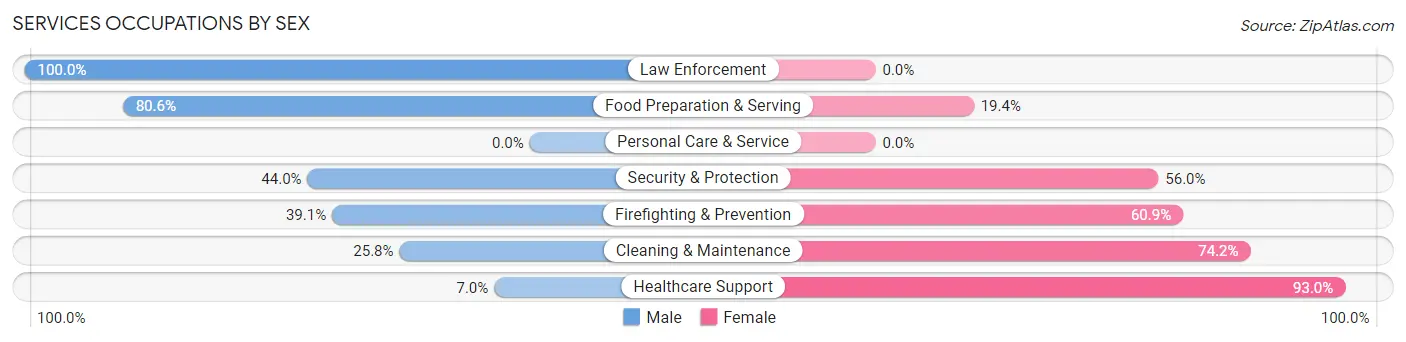
| Occupation | Male | Female |
| Healthcare Support | 8 (7.0%) | 106 (93.0%) |
| Security & Protection | 11 (44.0%) | 14 (56.0%) |
| Firefighting & Prevention | 9 (39.1%) | 14 (60.9%) |
| Law Enforcement | 2 (100.0%) | 0 (0.0%) |
| Food Preparation & Serving | 203 (80.6%) | 49 (19.4%) |
| Cleaning & Maintenance | 49 (25.8%) | 141 (74.2%) |
| Personal Care & Service | 0 (0.0%) | 0 (0.0%) |
| Total (Category) | 271 (46.6%) | 310 (53.4%) |
| Total (Overall) | 887 (53.7%) | 765 (46.3%) |
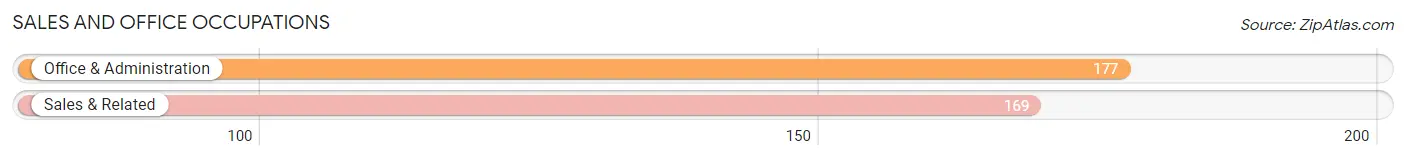
Sales and Office Occupations
The most common Sales and Office occupations in Mansfield are Office & Administration (177 | 10.7%), and Sales & Related (169 | 10.2%).
Sales and Office Occupations by Sex
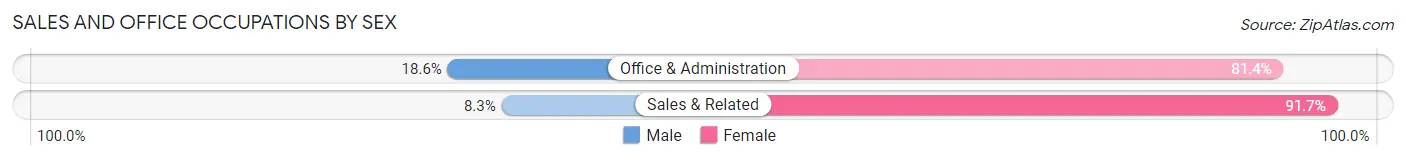
| Occupation | Male | Female |
| Sales & Related | 14 (8.3%) | 155 (91.7%) |
| Office & Administration | 33 (18.6%) | 144 (81.4%) |
| Total (Category) | 47 (13.6%) | 299 (86.4%) |
| Total (Overall) | 887 (53.7%) | 765 (46.3%) |
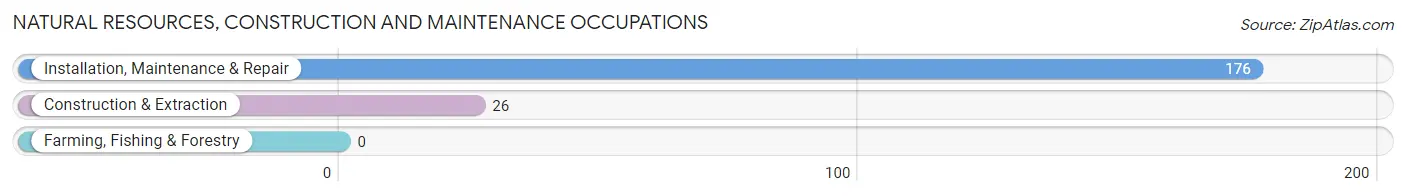
Natural Resources, Construction and Maintenance Occupations
The most common Natural Resources, Construction and Maintenance occupations in Mansfield are Installation, Maintenance & Repair (176 | 10.6%), and Construction & Extraction (26 | 1.6%).
Natural Resources, Construction and Maintenance Occupations by Sex
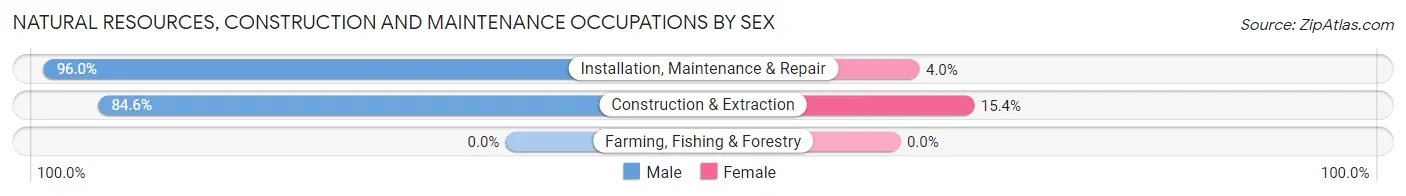
| Occupation | Male | Female |
| Farming, Fishing & Forestry | 0 (0.0%) | 0 (0.0%) |
| Construction & Extraction | 22 (84.6%) | 4 (15.4%) |
| Installation, Maintenance & Repair | 169 (96.0%) | 7 (4.0%) |
| Total (Category) | 191 (94.6%) | 11 (5.4%) |
| Total (Overall) | 887 (53.7%) | 765 (46.3%) |
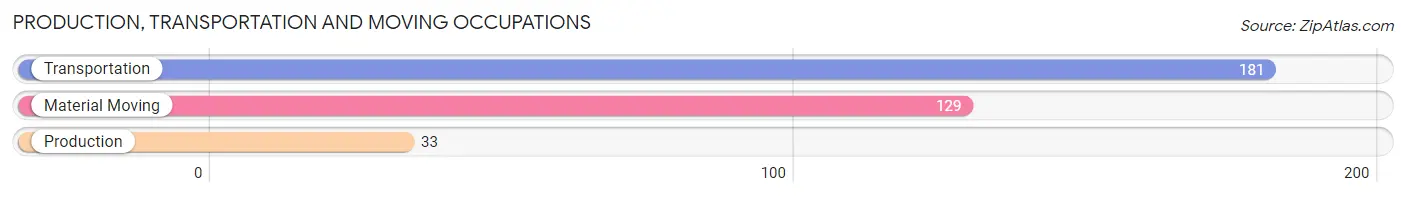
Production, Transportation and Moving Occupations
The most common Production, Transportation and Moving occupations in Mansfield are Transportation (181 | 11.0%), Material Moving (129 | 7.8%), and Production (33 | 2.0%).
Production, Transportation and Moving Occupations by Sex
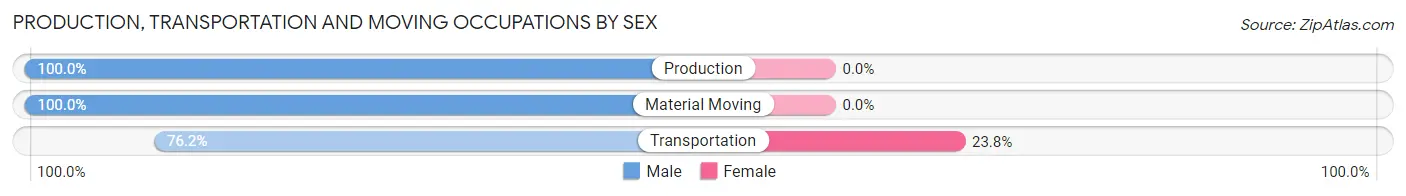
| Occupation | Male | Female |
| Production | 33 (100.0%) | 0 (0.0%) |
| Transportation | 138 (76.2%) | 43 (23.8%) |
| Material Moving | 129 (100.0%) | 0 (0.0%) |
| Total (Category) | 300 (87.5%) | 43 (12.5%) |
| Total (Overall) | 887 (53.7%) | 765 (46.3%) |
Employment Industries by Sex in Mansfield
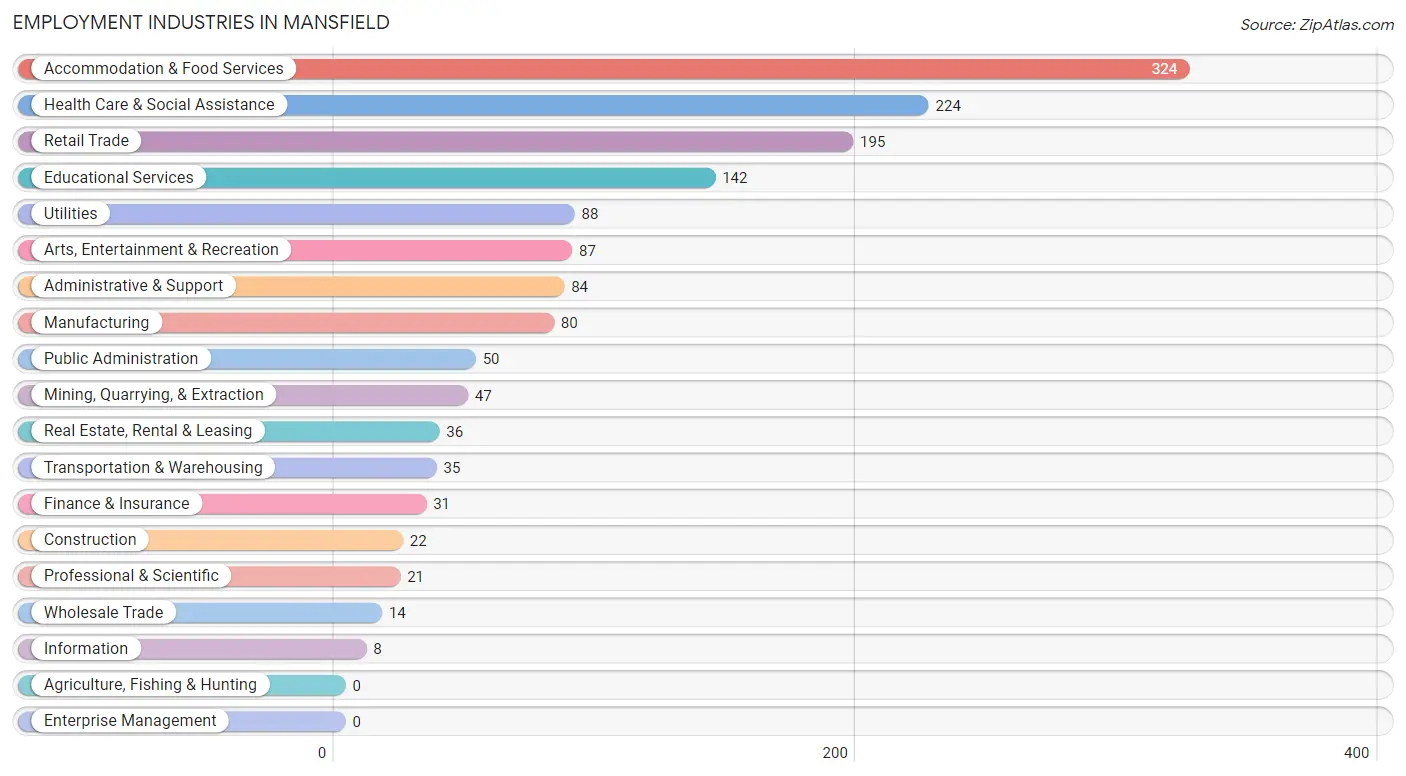
Employment Industries in Mansfield
The major employment industries in Mansfield include Accommodation & Food Services (324 | 19.6%), Health Care & Social Assistance (224 | 13.6%), Retail Trade (195 | 11.8%), Educational Services (142 | 8.6%), and Utilities (88 | 5.3%).
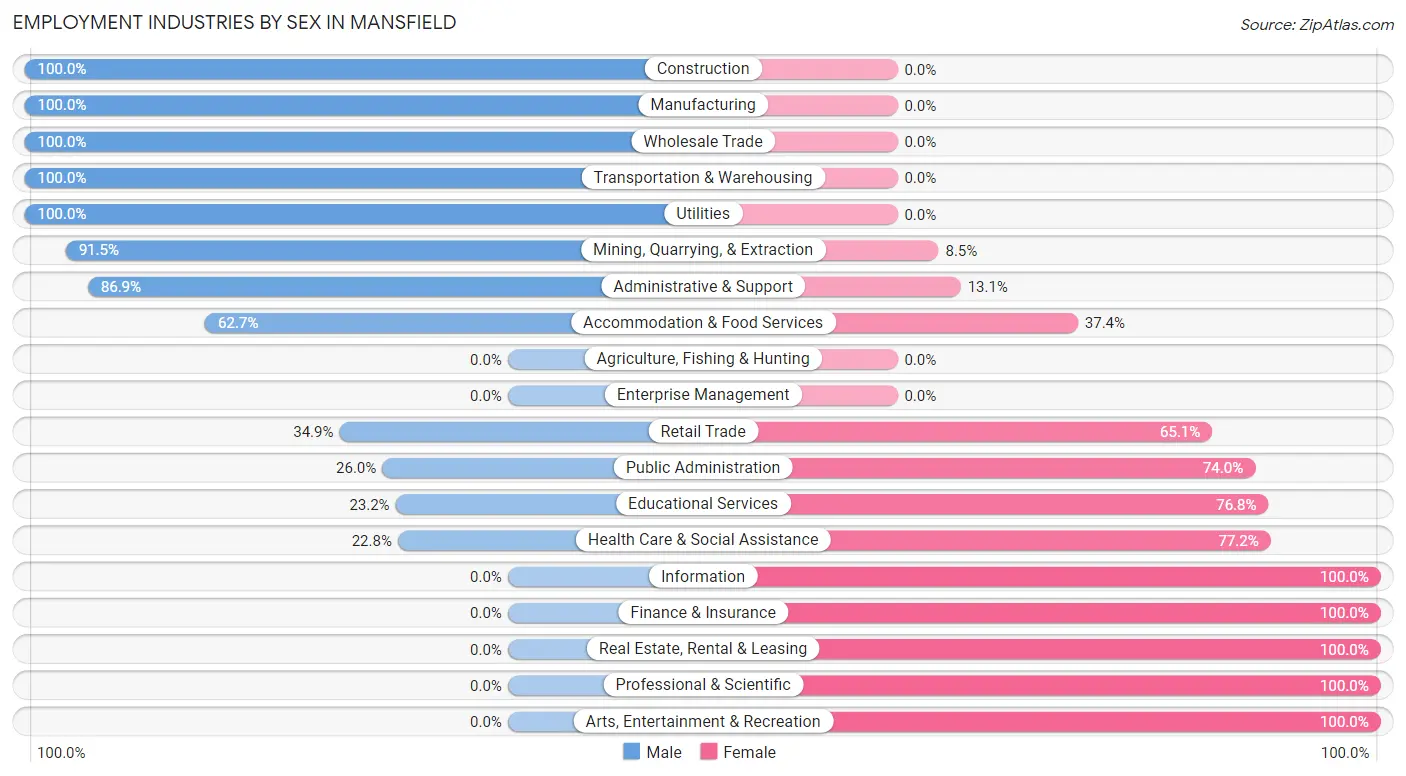
Employment Industries by Sex in Mansfield
The Mansfield industries that see more men than women are Construction (100.0%), Manufacturing (100.0%), and Wholesale Trade (100.0%), whereas the industries that tend to have a higher number of women are Information (100.0%), Finance & Insurance (100.0%), and Real Estate, Rental & Leasing (100.0%).
| Industry | Male | Female |
| Agriculture, Fishing & Hunting | 0 (0.0%) | 0 (0.0%) |
| Mining, Quarrying, & Extraction | 43 (91.5%) | 4 (8.5%) |
| Construction | 22 (100.0%) | 0 (0.0%) |
| Manufacturing | 80 (100.0%) | 0 (0.0%) |
| Wholesale Trade | 14 (100.0%) | 0 (0.0%) |
| Retail Trade | 68 (34.9%) | 127 (65.1%) |
| Transportation & Warehousing | 35 (100.0%) | 0 (0.0%) |
| Utilities | 88 (100.0%) | 0 (0.0%) |
| Information | 0 (0.0%) | 8 (100.0%) |
| Finance & Insurance | 0 (0.0%) | 31 (100.0%) |
| Real Estate, Rental & Leasing | 0 (0.0%) | 36 (100.0%) |
| Professional & Scientific | 0 (0.0%) | 21 (100.0%) |
| Enterprise Management | 0 (0.0%) | 0 (0.0%) |
| Administrative & Support | 73 (86.9%) | 11 (13.1%) |
| Educational Services | 33 (23.2%) | 109 (76.8%) |
| Health Care & Social Assistance | 51 (22.8%) | 173 (77.2%) |
| Arts, Entertainment & Recreation | 0 (0.0%) | 87 (100.0%) |
| Accommodation & Food Services | 203 (62.6%) | 121 (37.3%) |
| Public Administration | 13 (26.0%) | 37 (74.0%) |
| Total | 887 (53.7%) | 765 (46.3%) |
Education in Mansfield
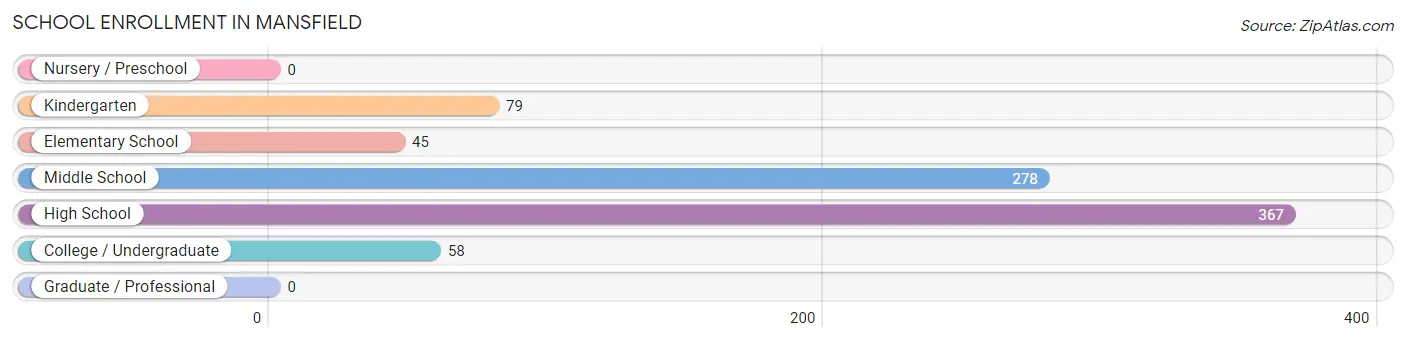
School Enrollment in Mansfield
The most common levels of schooling among the 827 students in Mansfield are high school (367 | 44.4%), middle school (278 | 33.6%), and kindergarten (79 | 9.6%).
| School Level | # Students | % Students |
| Nursery / Preschool | 0 | 0.0% |
| Kindergarten | 79 | 9.6% |
| Elementary School | 45 | 5.4% |
| Middle School | 278 | 33.6% |
| High School | 367 | 44.4% |
| College / Undergraduate | 58 | 7.0% |
| Graduate / Professional | 0 | 0.0% |
| Total | 827 | 100.0% |
School Enrollment by Age by Funding Source in Mansfield
Out of a total of 827 students who are enrolled in schools in Mansfield, 33 (4.0%) attend a private institution, while the remaining 794 (96.0%) are enrolled in public schools. The age group of 35 years and over has the highest likelihood of being enrolled in private schools, with 7 (14.0% in the age bracket) enrolled. Conversely, the age group of 5 to 9 year old has the lowest likelihood of being enrolled in a private school, with 115 (100.0% in the age bracket) attending a public institution.
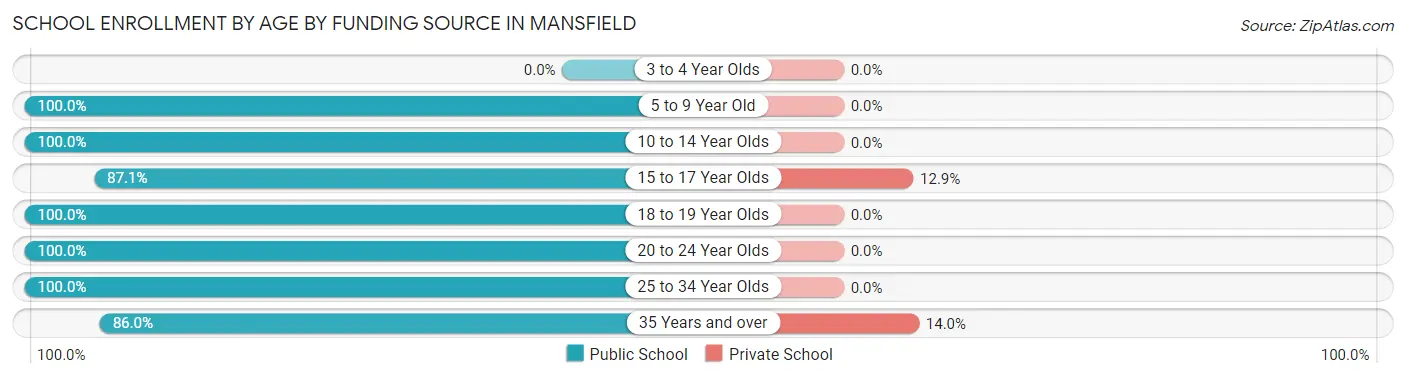
| Age Bracket | Public School | Private School |
| 3 to 4 Year Olds | 0 (0.0%) | 0 (0.0%) |
| 5 to 9 Year Old | 115 (100.0%) | 0 (0.0%) |
| 10 to 14 Year Olds | 312 (100.0%) | 0 (0.0%) |
| 15 to 17 Year Olds | 175 (87.1%) | 26 (12.9%) |
| 18 to 19 Year Olds | 70 (100.0%) | 0 (0.0%) |
| 20 to 24 Year Olds | 56 (100.0%) | 0 (0.0%) |
| 25 to 34 Year Olds | 23 (100.0%) | 0 (0.0%) |
| 35 Years and over | 43 (86.0%) | 7 (14.0%) |
| Total | 794 (96.0%) | 33 (4.0%) |
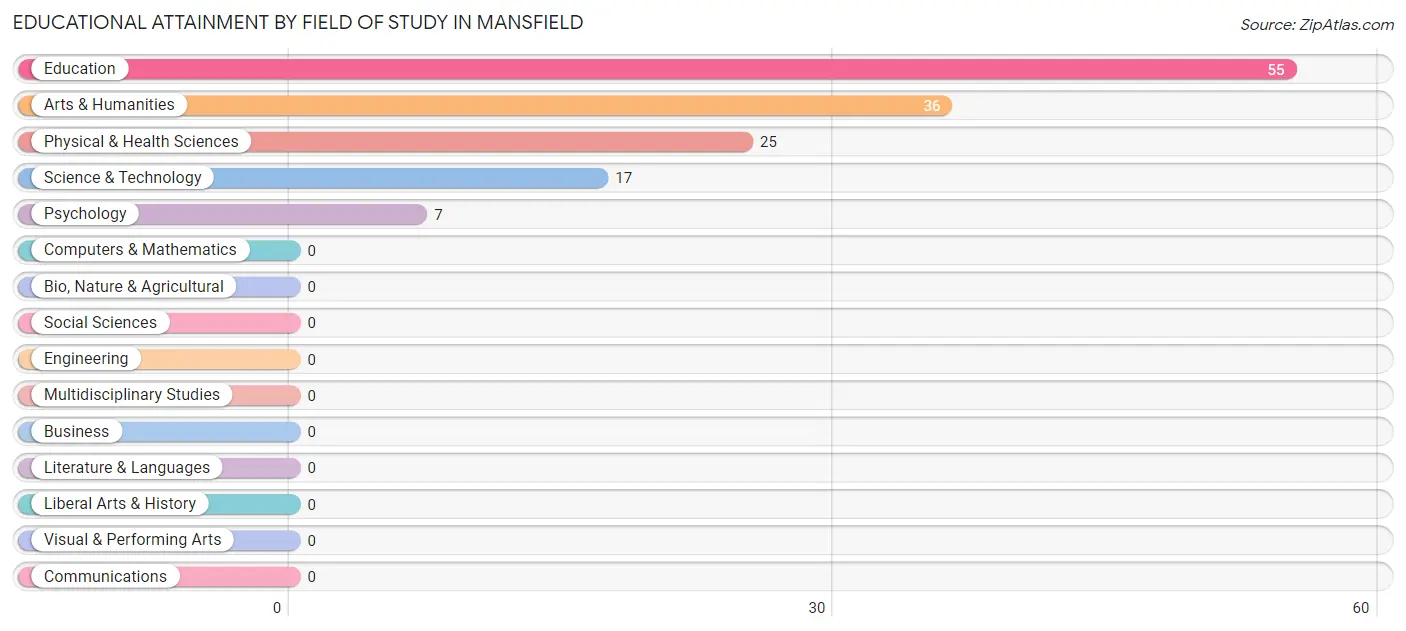
Educational Attainment by Field of Study in Mansfield
Education (55 | 39.3%), arts & humanities (36 | 25.7%), physical & health sciences (25 | 17.9%), science & technology (17 | 12.1%), and psychology (7 | 5.0%) are the most common fields of study among 140 individuals in Mansfield who have obtained a bachelor's degree or higher.
| Field of Study | # Graduates | % Graduates |
| Computers & Mathematics | 0 | 0.0% |
| Bio, Nature & Agricultural | 0 | 0.0% |
| Physical & Health Sciences | 25 | 17.9% |
| Psychology | 7 | 5.0% |
| Social Sciences | 0 | 0.0% |
| Engineering | 0 | 0.0% |
| Multidisciplinary Studies | 0 | 0.0% |
| Science & Technology | 17 | 12.1% |
| Business | 0 | 0.0% |
| Education | 55 | 39.3% |
| Literature & Languages | 0 | 0.0% |
| Liberal Arts & History | 0 | 0.0% |
| Visual & Performing Arts | 0 | 0.0% |
| Communications | 0 | 0.0% |
| Arts & Humanities | 36 | 25.7% |
| Total | 140 | 100.0% |
Transportation & Commute in Mansfield
Vehicle Availability by Sex in Mansfield
The most prevalent vehicle ownership categories in Mansfield are males with 2 vehicles (328, accounting for 37.1%) and females with 2 vehicles (130, making up 42.9%).
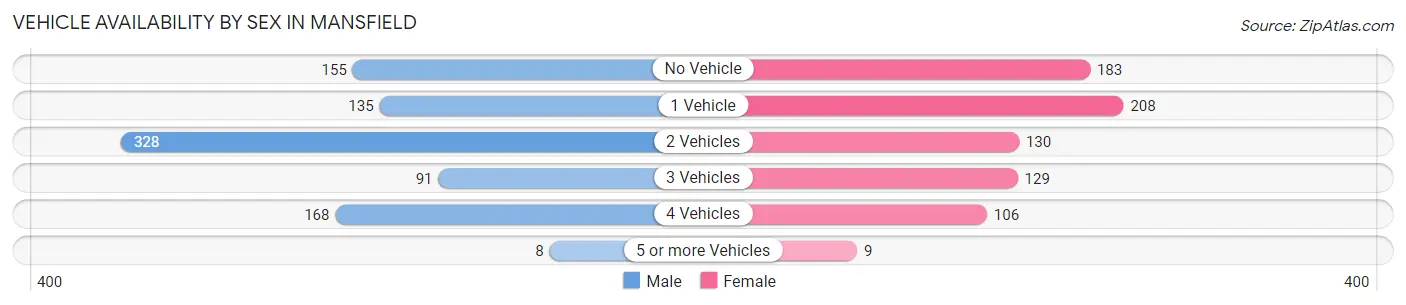
| Vehicles Available | Male | Female |
| No Vehicle | 155 (17.5%) | 183 (23.9%) |
| 1 Vehicle | 135 (15.2%) | 208 (27.2%) |
| 2 Vehicles | 328 (37.1%) | 130 (17.0%) |
| 3 Vehicles | 91 (10.3%) | 129 (16.9%) |
| 4 Vehicles | 168 (19.0%) | 106 (13.9%) |
| 5 or more Vehicles | 8 (0.9%) | 9 (1.2%) |
| Total | 885 (100.0%) | 765 (100.0%) |
Commute Time in Mansfield
The most frequently occuring commute durations in Mansfield are 5 to 9 minutes (368 commuters, 22.3%), less than 5 minutes (230 commuters, 13.9%), and 10 to 14 minutes (230 commuters, 13.9%).
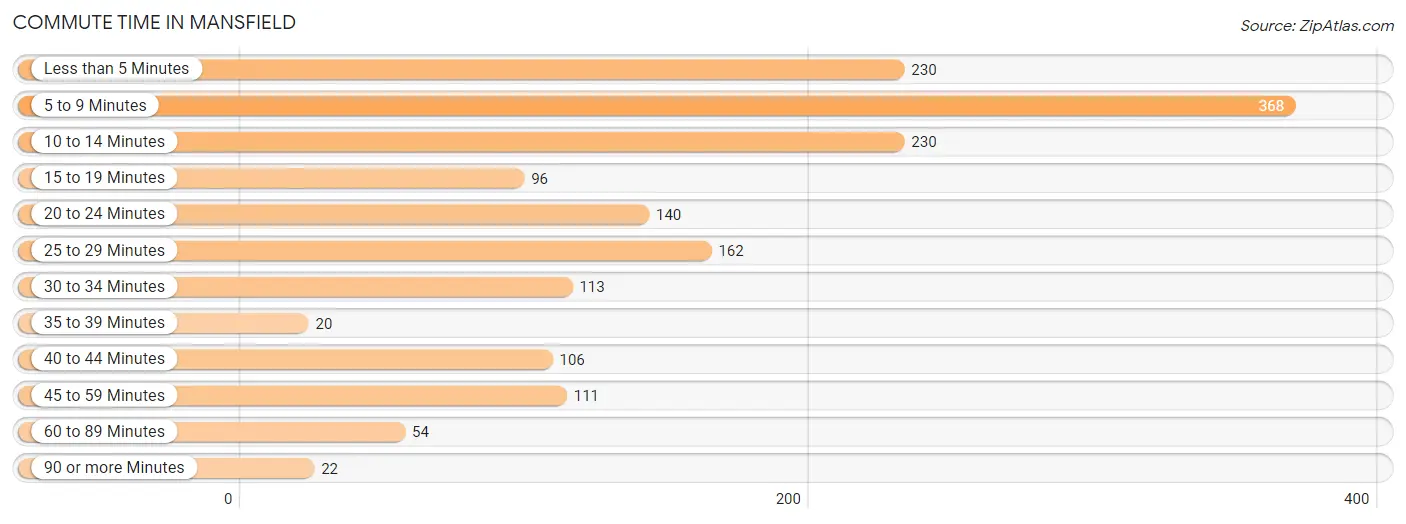
| Commute Time | # Commuters | % Commuters |
| Less than 5 Minutes | 230 | 13.9% |
| 5 to 9 Minutes | 368 | 22.3% |
| 10 to 14 Minutes | 230 | 13.9% |
| 15 to 19 Minutes | 96 | 5.8% |
| 20 to 24 Minutes | 140 | 8.5% |
| 25 to 29 Minutes | 162 | 9.8% |
| 30 to 34 Minutes | 113 | 6.8% |
| 35 to 39 Minutes | 20 | 1.2% |
| 40 to 44 Minutes | 106 | 6.4% |
| 45 to 59 Minutes | 111 | 6.7% |
| 60 to 89 Minutes | 54 | 3.3% |
| 90 or more Minutes | 22 | 1.3% |
Commute Time by Sex in Mansfield
The most common commute times in Mansfield are 5 to 9 minutes (185 commuters, 20.9%) for males and less than 5 minutes (197 commuters, 25.8%) for females.
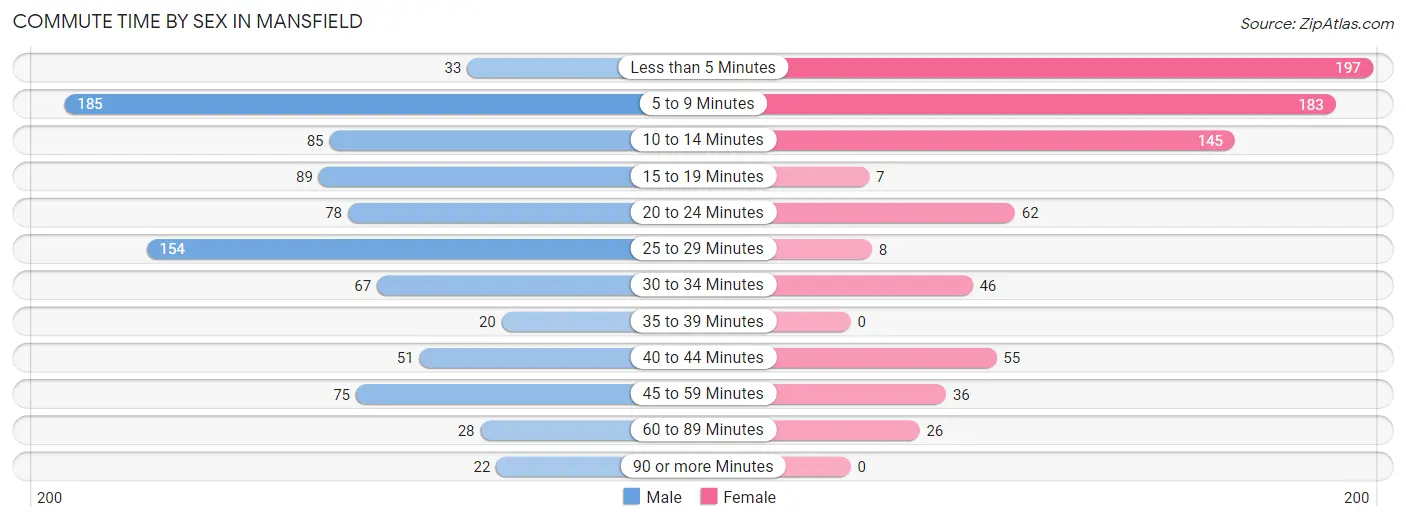
| Commute Time | Male | Female |
| Less than 5 Minutes | 33 (3.7%) | 197 (25.8%) |
| 5 to 9 Minutes | 185 (20.9%) | 183 (23.9%) |
| 10 to 14 Minutes | 85 (9.6%) | 145 (19.0%) |
| 15 to 19 Minutes | 89 (10.0%) | 7 (0.9%) |
| 20 to 24 Minutes | 78 (8.8%) | 62 (8.1%) |
| 25 to 29 Minutes | 154 (17.4%) | 8 (1.1%) |
| 30 to 34 Minutes | 67 (7.5%) | 46 (6.0%) |
| 35 to 39 Minutes | 20 (2.2%) | 0 (0.0%) |
| 40 to 44 Minutes | 51 (5.8%) | 55 (7.2%) |
| 45 to 59 Minutes | 75 (8.5%) | 36 (4.7%) |
| 60 to 89 Minutes | 28 (3.2%) | 26 (3.4%) |
| 90 or more Minutes | 22 (2.5%) | 0 (0.0%) |
Time of Departure to Work by Sex in Mansfield
The most frequent times of departure to work in Mansfield are 6:00 AM to 6:29 AM (294, 33.2%) for males and 4:00 PM to 11:59 PM (190, 24.8%) for females.
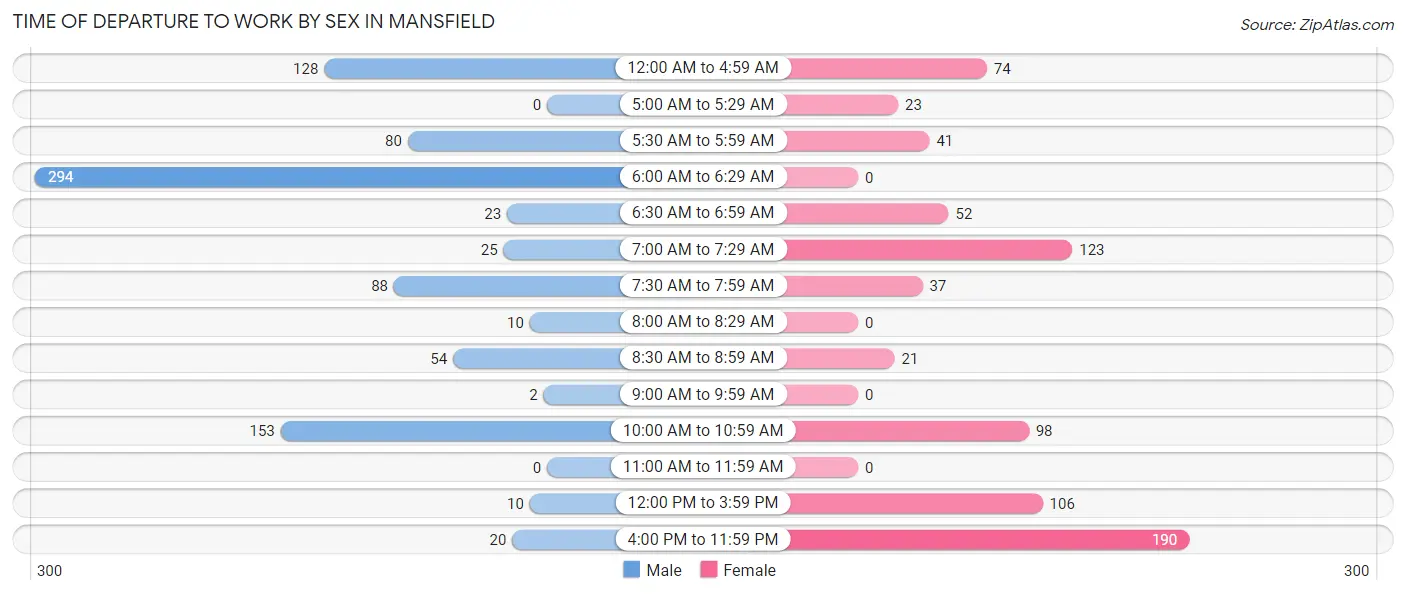
| Time of Departure | Male | Female |
| 12:00 AM to 4:59 AM | 128 (14.4%) | 74 (9.7%) |
| 5:00 AM to 5:29 AM | 0 (0.0%) | 23 (3.0%) |
| 5:30 AM to 5:59 AM | 80 (9.0%) | 41 (5.4%) |
| 6:00 AM to 6:29 AM | 294 (33.2%) | 0 (0.0%) |
| 6:30 AM to 6:59 AM | 23 (2.6%) | 52 (6.8%) |
| 7:00 AM to 7:29 AM | 25 (2.8%) | 123 (16.1%) |
| 7:30 AM to 7:59 AM | 88 (9.9%) | 37 (4.8%) |
| 8:00 AM to 8:29 AM | 10 (1.1%) | 0 (0.0%) |
| 8:30 AM to 8:59 AM | 54 (6.1%) | 21 (2.8%) |
| 9:00 AM to 9:59 AM | 2 (0.2%) | 0 (0.0%) |
| 10:00 AM to 10:59 AM | 153 (17.2%) | 98 (12.8%) |
| 11:00 AM to 11:59 AM | 0 (0.0%) | 0 (0.0%) |
| 12:00 PM to 3:59 PM | 10 (1.1%) | 106 (13.9%) |
| 4:00 PM to 11:59 PM | 20 (2.2%) | 190 (24.8%) |
| Total | 887 (100.0%) | 765 (100.0%) |
Housing Occupancy in Mansfield
Occupancy by Ownership in Mansfield
Of the total 1,721 dwellings in Mansfield, owner-occupied units account for 928 (53.9%), while renter-occupied units make up 793 (46.1%).
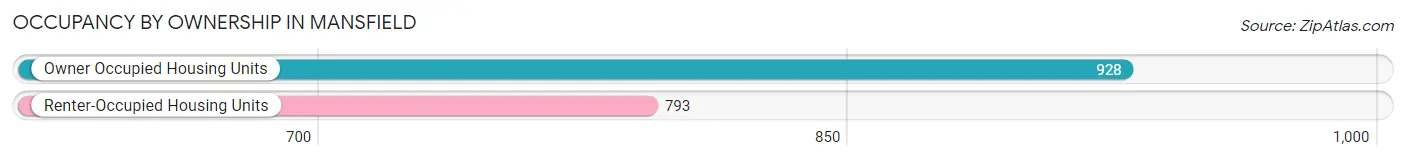
| Occupancy | # Housing Units | % Housing Units |
| Owner Occupied Housing Units | 928 | 53.9% |
| Renter-Occupied Housing Units | 793 | 46.1% |
| Total Occupied Housing Units | 1,721 | 100.0% |
Occupancy by Household Size in Mansfield
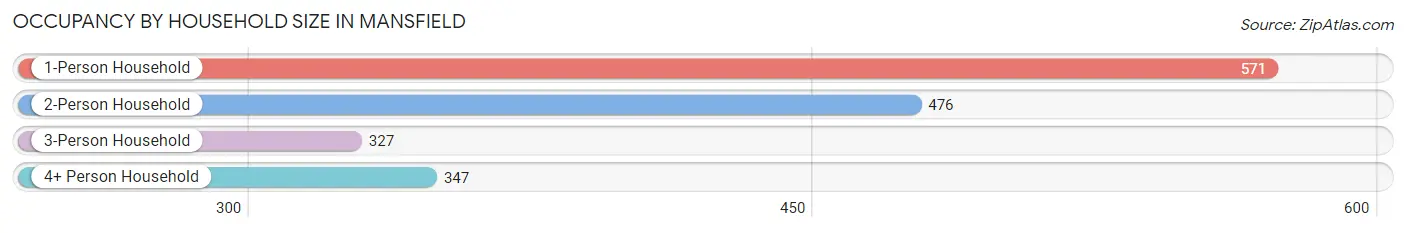
| Household Size | # Housing Units | % Housing Units |
| 1-Person Household | 571 | 33.2% |
| 2-Person Household | 476 | 27.7% |
| 3-Person Household | 327 | 19.0% |
| 4+ Person Household | 347 | 20.2% |
| Total Housing Units | 1,721 | 100.0% |
Occupancy by Ownership by Household Size in Mansfield
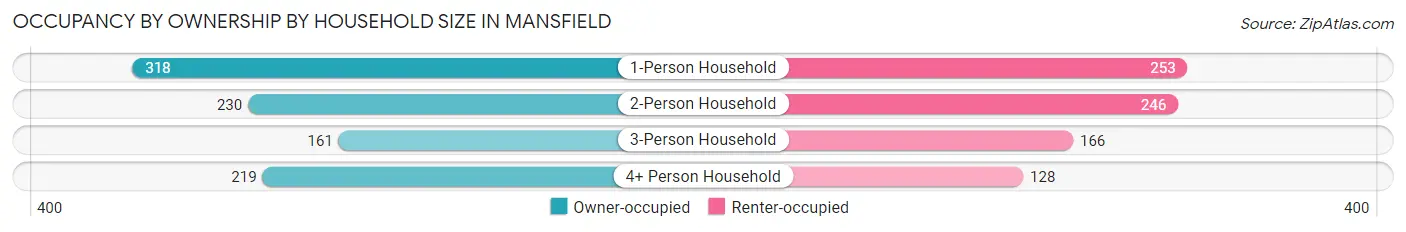
| Household Size | Owner-occupied | Renter-occupied |
| 1-Person Household | 318 (55.7%) | 253 (44.3%) |
| 2-Person Household | 230 (48.3%) | 246 (51.7%) |
| 3-Person Household | 161 (49.2%) | 166 (50.8%) |
| 4+ Person Household | 219 (63.1%) | 128 (36.9%) |
| Total Housing Units | 928 (53.9%) | 793 (46.1%) |
Occupancy by Educational Attainment in Mansfield
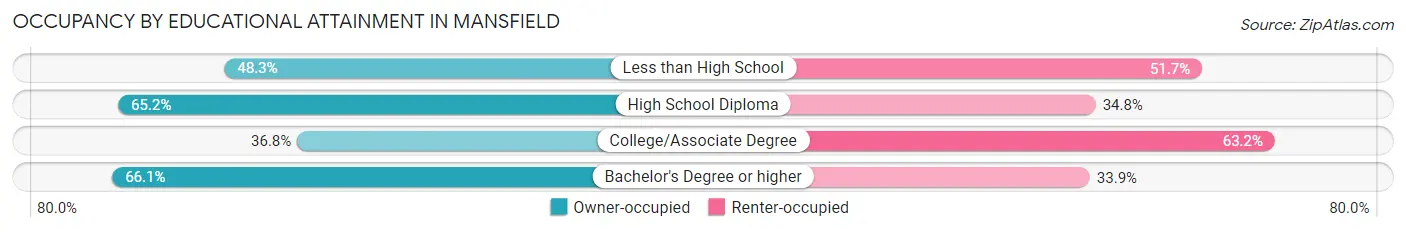
| Household Size | Owner-occupied | Renter-occupied |
| Less than High School | 258 (48.3%) | 276 (51.7%) |
| High School Diploma | 496 (65.2%) | 265 (34.8%) |
| College/Associate Degree | 135 (36.8%) | 232 (63.2%) |
| Bachelor's Degree or higher | 39 (66.1%) | 20 (33.9%) |
Occupancy by Age of Householder in Mansfield
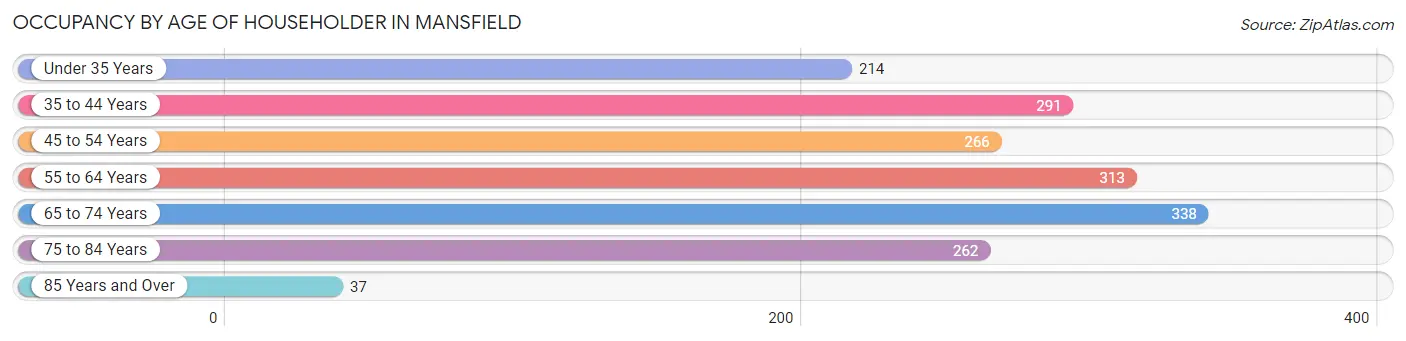
| Age Bracket | # Households | % Households |
| Under 35 Years | 214 | 12.4% |
| 35 to 44 Years | 291 | 16.9% |
| 45 to 54 Years | 266 | 15.5% |
| 55 to 64 Years | 313 | 18.2% |
| 65 to 74 Years | 338 | 19.6% |
| 75 to 84 Years | 262 | 15.2% |
| 85 Years and Over | 37 | 2.1% |
| Total | 1,721 | 100.0% |
Housing Finances in Mansfield
Median Income by Occupancy in Mansfield
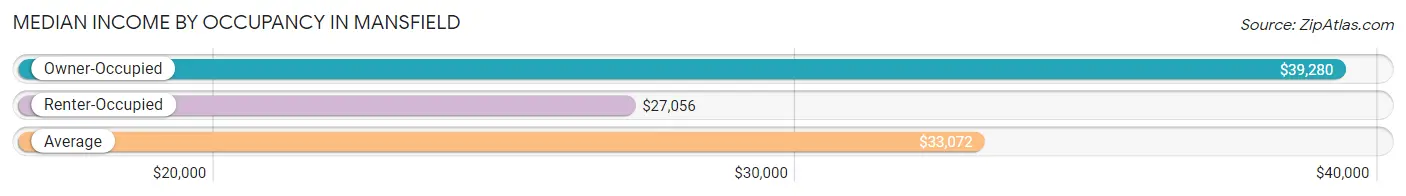
| Occupancy Type | # Households | Median Income |
| Owner-Occupied | 928 (53.9%) | $39,280 |
| Renter-Occupied | 793 (46.1%) | $27,056 |
| Average | 1,721 (100.0%) | $33,072 |
Occupancy by Householder Income Bracket in Mansfield
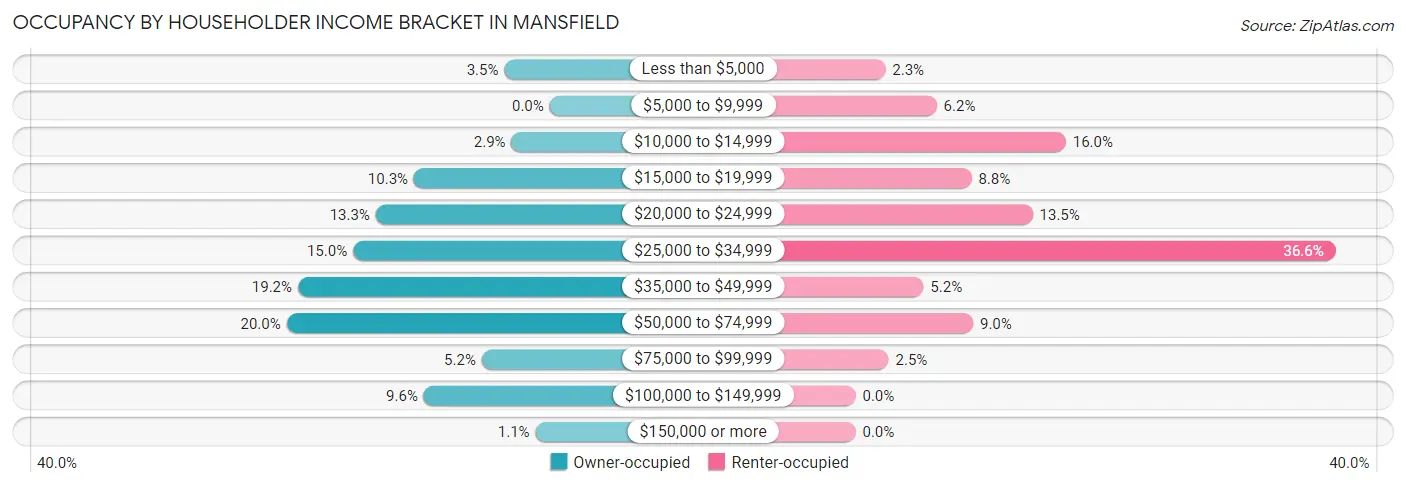
| Income Bracket | Owner-occupied | Renter-occupied |
| Less than $5,000 | 32 (3.5%) | 18 (2.3%) |
| $5,000 to $9,999 | 0 (0.0%) | 49 (6.2%) |
| $10,000 to $14,999 | 27 (2.9%) | 127 (16.0%) |
| $15,000 to $19,999 | 96 (10.3%) | 70 (8.8%) |
| $20,000 to $24,999 | 123 (13.3%) | 107 (13.5%) |
| $25,000 to $34,999 | 139 (15.0%) | 290 (36.6%) |
| $35,000 to $49,999 | 178 (19.2%) | 41 (5.2%) |
| $50,000 to $74,999 | 186 (20.0%) | 71 (8.9%) |
| $75,000 to $99,999 | 48 (5.2%) | 20 (2.5%) |
| $100,000 to $149,999 | 89 (9.6%) | 0 (0.0%) |
| $150,000 or more | 10 (1.1%) | 0 (0.0%) |
| Total | 928 (100.0%) | 793 (100.0%) |
Monthly Housing Cost Tiers in Mansfield
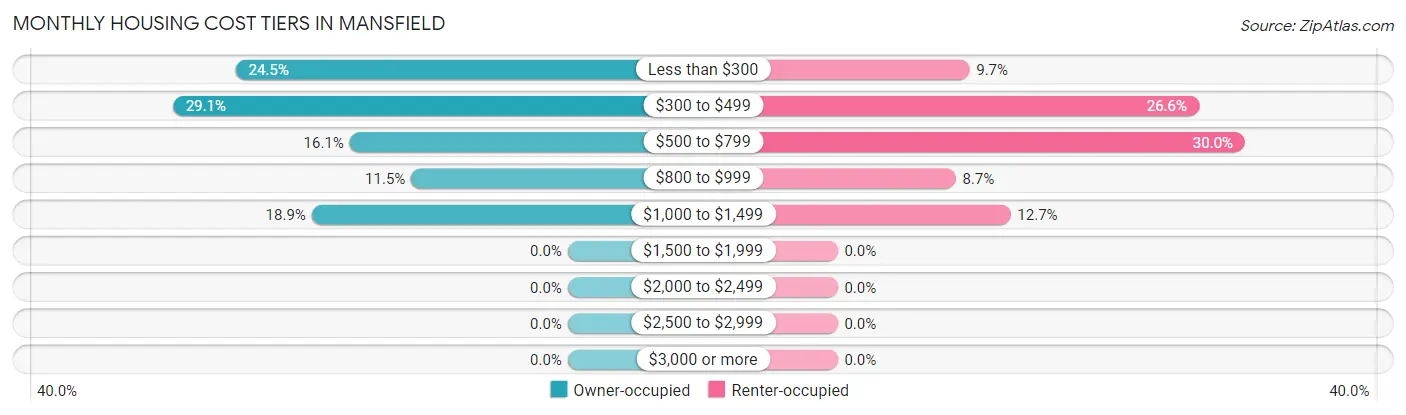
| Monthly Cost | Owner-occupied | Renter-occupied |
| Less than $300 | 227 (24.5%) | 77 (9.7%) |
| $300 to $499 | 270 (29.1%) | 211 (26.6%) |
| $500 to $799 | 149 (16.1%) | 238 (30.0%) |
| $800 to $999 | 107 (11.5%) | 69 (8.7%) |
| $1,000 to $1,499 | 175 (18.9%) | 101 (12.7%) |
| $1,500 to $1,999 | 0 (0.0%) | 0 (0.0%) |
| $2,000 to $2,499 | 0 (0.0%) | 0 (0.0%) |
| $2,500 to $2,999 | 0 (0.0%) | 0 (0.0%) |
| $3,000 or more | 0 (0.0%) | 0 (0.0%) |
| Total | 928 (100.0%) | 793 (100.0%) |
Physical Housing Characteristics in Mansfield
Housing Structures in Mansfield
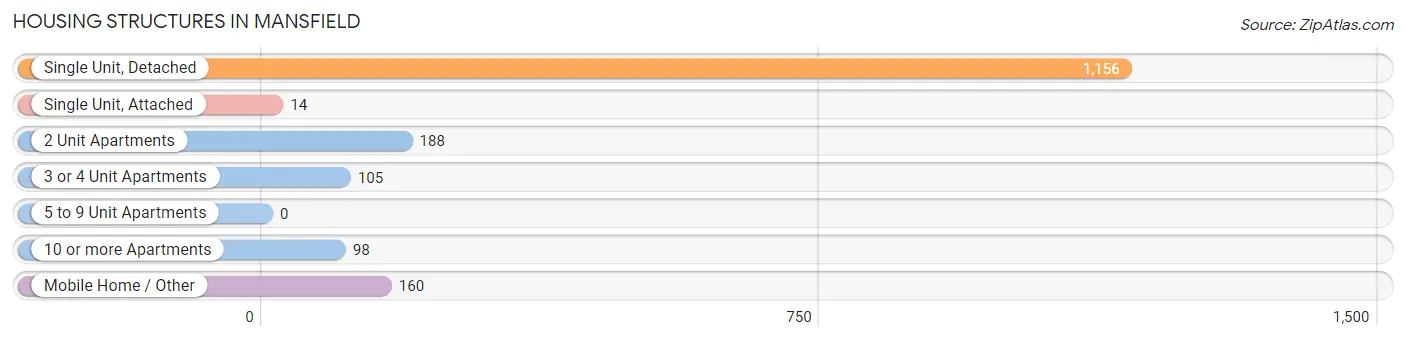
| Structure Type | # Housing Units | % Housing Units |
| Single Unit, Detached | 1,156 | 67.2% |
| Single Unit, Attached | 14 | 0.8% |
| 2 Unit Apartments | 188 | 10.9% |
| 3 or 4 Unit Apartments | 105 | 6.1% |
| 5 to 9 Unit Apartments | 0 | 0.0% |
| 10 or more Apartments | 98 | 5.7% |
| Mobile Home / Other | 160 | 9.3% |
| Total | 1,721 | 100.0% |
Housing Structures by Occupancy in Mansfield
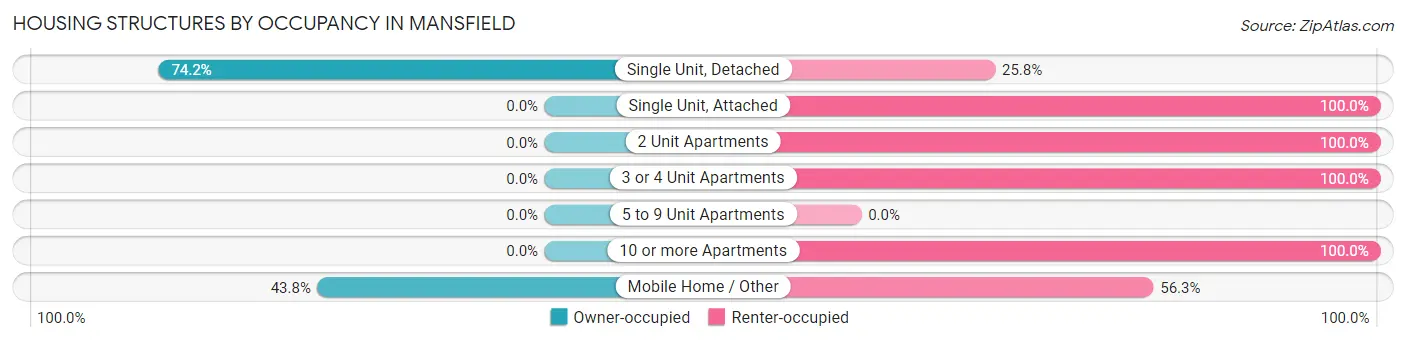
| Structure Type | Owner-occupied | Renter-occupied |
| Single Unit, Detached | 858 (74.2%) | 298 (25.8%) |
| Single Unit, Attached | 0 (0.0%) | 14 (100.0%) |
| 2 Unit Apartments | 0 (0.0%) | 188 (100.0%) |
| 3 or 4 Unit Apartments | 0 (0.0%) | 105 (100.0%) |
| 5 to 9 Unit Apartments | 0 (0.0%) | 0 (0.0%) |
| 10 or more Apartments | 0 (0.0%) | 98 (100.0%) |
| Mobile Home / Other | 70 (43.8%) | 90 (56.2%) |
| Total | 928 (53.9%) | 793 (46.1%) |
Housing Structures by Number of Rooms in Mansfield
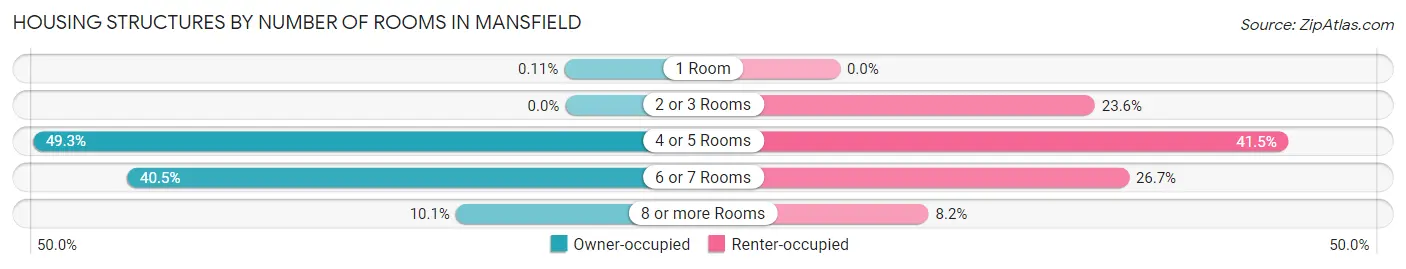
| Number of Rooms | Owner-occupied | Renter-occupied |
| 1 Room | 1 (0.1%) | 0 (0.0%) |
| 2 or 3 Rooms | 0 (0.0%) | 187 (23.6%) |
| 4 or 5 Rooms | 457 (49.2%) | 329 (41.5%) |
| 6 or 7 Rooms | 376 (40.5%) | 212 (26.7%) |
| 8 or more Rooms | 94 (10.1%) | 65 (8.2%) |
| Total | 928 (100.0%) | 793 (100.0%) |
Housing Structure by Heating Type in Mansfield
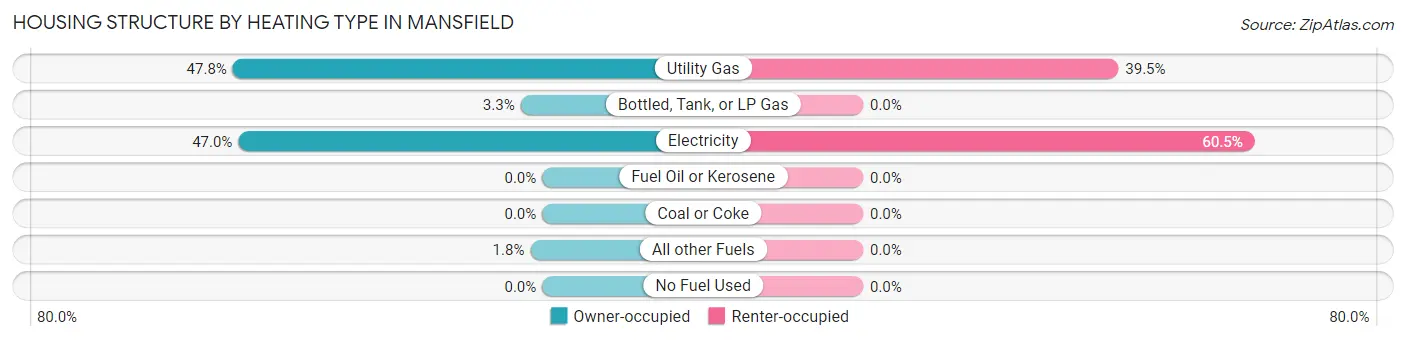
| Heating Type | Owner-occupied | Renter-occupied |
| Utility Gas | 444 (47.8%) | 313 (39.5%) |
| Bottled, Tank, or LP Gas | 31 (3.3%) | 0 (0.0%) |
| Electricity | 436 (47.0%) | 480 (60.5%) |
| Fuel Oil or Kerosene | 0 (0.0%) | 0 (0.0%) |
| Coal or Coke | 0 (0.0%) | 0 (0.0%) |
| All other Fuels | 17 (1.8%) | 0 (0.0%) |
| No Fuel Used | 0 (0.0%) | 0 (0.0%) |
| Total | 928 (100.0%) | 793 (100.0%) |
Household Vehicle Usage in Mansfield
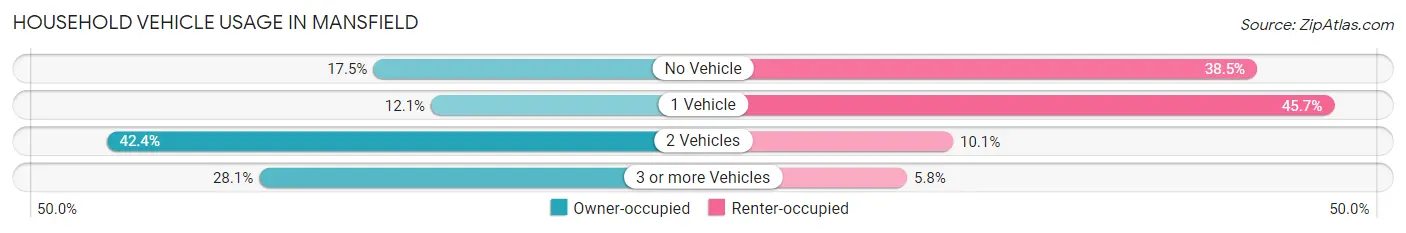
| Vehicles per Household | Owner-occupied | Renter-occupied |
| No Vehicle | 162 (17.5%) | 305 (38.5%) |
| 1 Vehicle | 112 (12.1%) | 362 (45.7%) |
| 2 Vehicles | 393 (42.3%) | 80 (10.1%) |
| 3 or more Vehicles | 261 (28.1%) | 46 (5.8%) |
| Total | 928 (100.0%) | 793 (100.0%) |
Real Estate & Mortgages in Mansfield
Real Estate and Mortgage Overview in Mansfield
| Characteristic | Without Mortgage | With Mortgage |
| Housing Units | 572 | 356 |
| Median Property Value | $93,800 | $67,800 |
| Median Household Income | $38,898 | $10 |
| Monthly Housing Costs | $318 | $0 |
| Real Estate Taxes | $199 | $47 |
Property Value by Mortgage Status in Mansfield
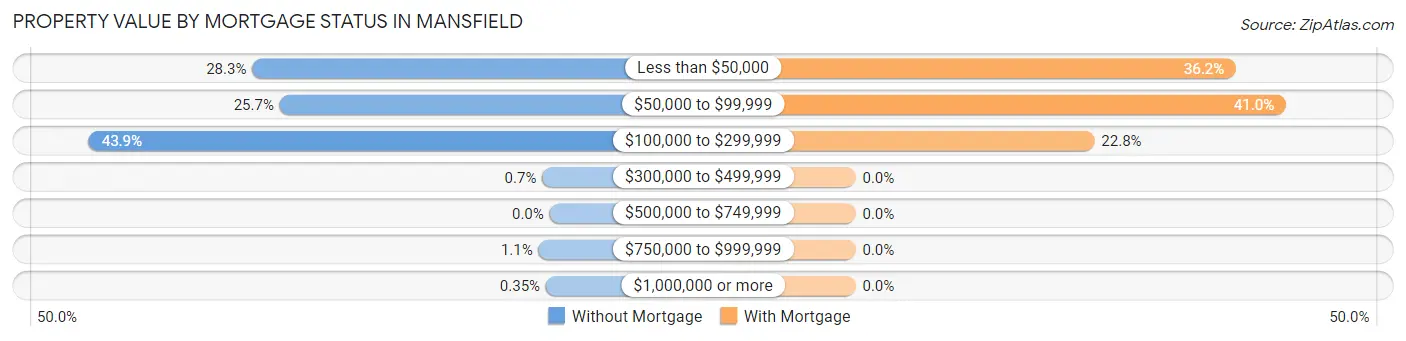
| Property Value | Without Mortgage | With Mortgage |
| Less than $50,000 | 162 (28.3%) | 129 (36.2%) |
| $50,000 to $99,999 | 147 (25.7%) | 146 (41.0%) |
| $100,000 to $299,999 | 251 (43.9%) | 81 (22.8%) |
| $300,000 to $499,999 | 4 (0.7%) | 0 (0.0%) |
| $500,000 to $749,999 | 0 (0.0%) | 0 (0.0%) |
| $750,000 to $999,999 | 6 (1.1%) | 0 (0.0%) |
| $1,000,000 or more | 2 (0.4%) | 0 (0.0%) |
| Total | 572 (100.0%) | 356 (100.0%) |
Household Income by Mortgage Status in Mansfield
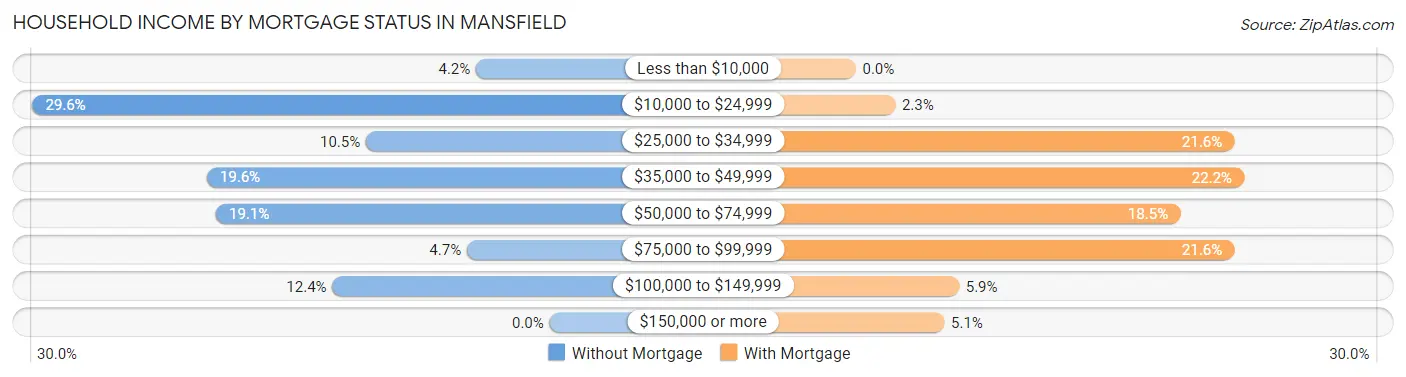
| Household Income | Without Mortgage | With Mortgage |
| Less than $10,000 | 24 (4.2%) | 0 (0.0%) |
| $10,000 to $24,999 | 169 (29.5%) | 8 (2.2%) |
| $25,000 to $34,999 | 60 (10.5%) | 77 (21.6%) |
| $35,000 to $49,999 | 112 (19.6%) | 79 (22.2%) |
| $50,000 to $74,999 | 109 (19.1%) | 66 (18.5%) |
| $75,000 to $99,999 | 27 (4.7%) | 77 (21.6%) |
| $100,000 to $149,999 | 71 (12.4%) | 21 (5.9%) |
| $150,000 or more | 0 (0.0%) | 18 (5.1%) |
| Total | 572 (100.0%) | 356 (100.0%) |
Property Value to Household Income Ratio in Mansfield
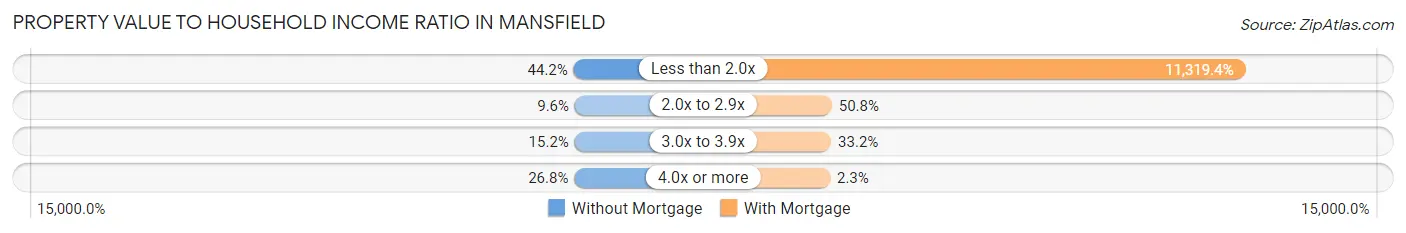
| Value-to-Income Ratio | Without Mortgage | With Mortgage |
| Less than 2.0x | 253 (44.2%) | 40,297 (11,319.4%) |
| 2.0x to 2.9x | 55 (9.6%) | 181 (50.8%) |
| 3.0x to 3.9x | 87 (15.2%) | 118 (33.2%) |
| 4.0x or more | 153 (26.8%) | 8 (2.2%) |
| Total | 572 (100.0%) | 356 (100.0%) |
Real Estate Taxes by Mortgage Status in Mansfield
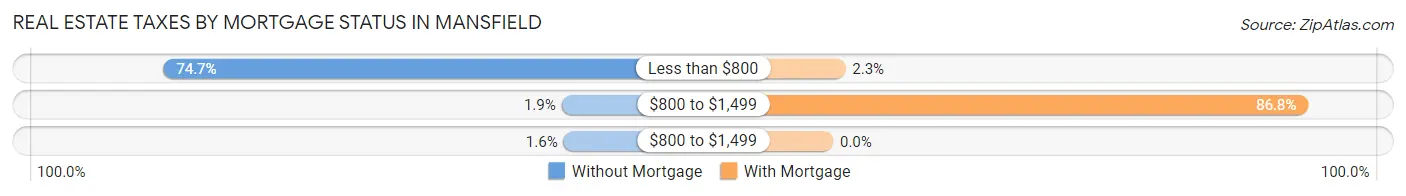
| Property Taxes | Without Mortgage | With Mortgage |
| Less than $800 | 427 (74.7%) | 8 (2.2%) |
| $800 to $1,499 | 11 (1.9%) | 309 (86.8%) |
| $800 to $1,499 | 9 (1.6%) | 0 (0.0%) |
| Total | 572 (100.0%) | 356 (100.0%) |
Health & Disability in Mansfield
Health Insurance Coverage by Age in Mansfield
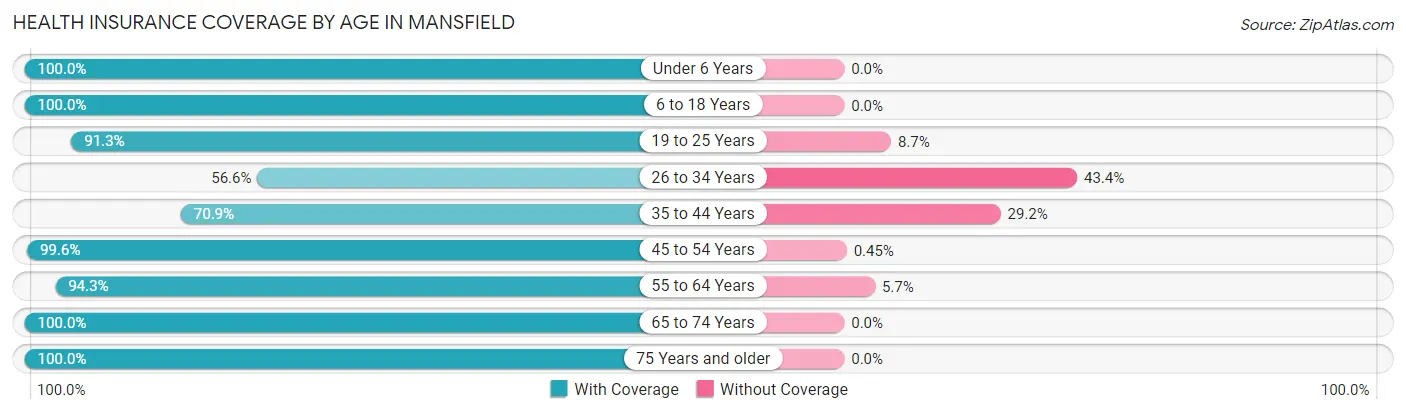
| Age Bracket | With Coverage | Without Coverage |
| Under 6 Years | 73 (100.0%) | 0 (0.0%) |
| 6 to 18 Years | 751 (100.0%) | 0 (0.0%) |
| 19 to 25 Years | 409 (91.3%) | 39 (8.7%) |
| 26 to 34 Years | 300 (56.6%) | 230 (43.4%) |
| 35 to 44 Years | 542 (70.9%) | 223 (29.1%) |
| 45 to 54 Years | 660 (99.6%) | 3 (0.4%) |
| 55 to 64 Years | 445 (94.3%) | 27 (5.7%) |
| 65 to 74 Years | 477 (100.0%) | 0 (0.0%) |
| 75 Years and older | 323 (100.0%) | 0 (0.0%) |
| Total | 3,980 (88.4%) | 522 (11.6%) |
Health Insurance Coverage by Citizenship Status in Mansfield
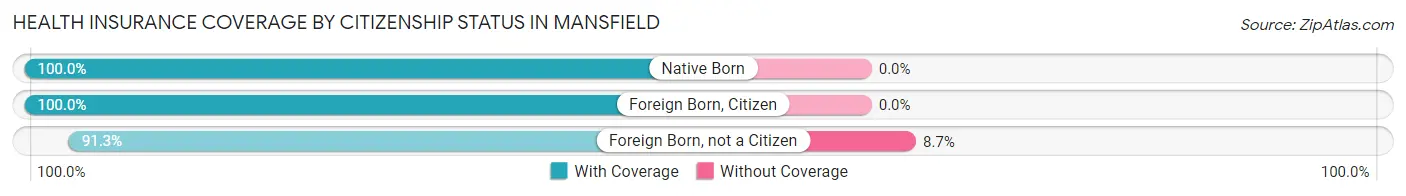
| Citizenship Status | With Coverage | Without Coverage |
| Native Born | 73 (100.0%) | 0 (0.0%) |
| Foreign Born, Citizen | 751 (100.0%) | 0 (0.0%) |
| Foreign Born, not a Citizen | 409 (91.3%) | 39 (8.7%) |
Health Insurance Coverage by Household Income in Mansfield
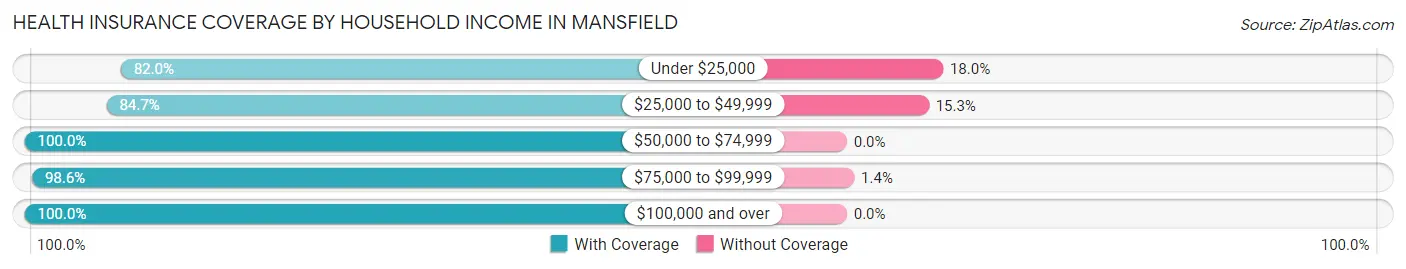
| Household Income | With Coverage | Without Coverage |
| Under $25,000 | 1,037 (82.0%) | 228 (18.0%) |
| $25,000 to $49,999 | 1,606 (84.7%) | 291 (15.3%) |
| $50,000 to $74,999 | 771 (100.0%) | 0 (0.0%) |
| $75,000 to $99,999 | 215 (98.6%) | 3 (1.4%) |
| $100,000 and over | 331 (100.0%) | 0 (0.0%) |
Public vs Private Health Insurance Coverage by Age in Mansfield
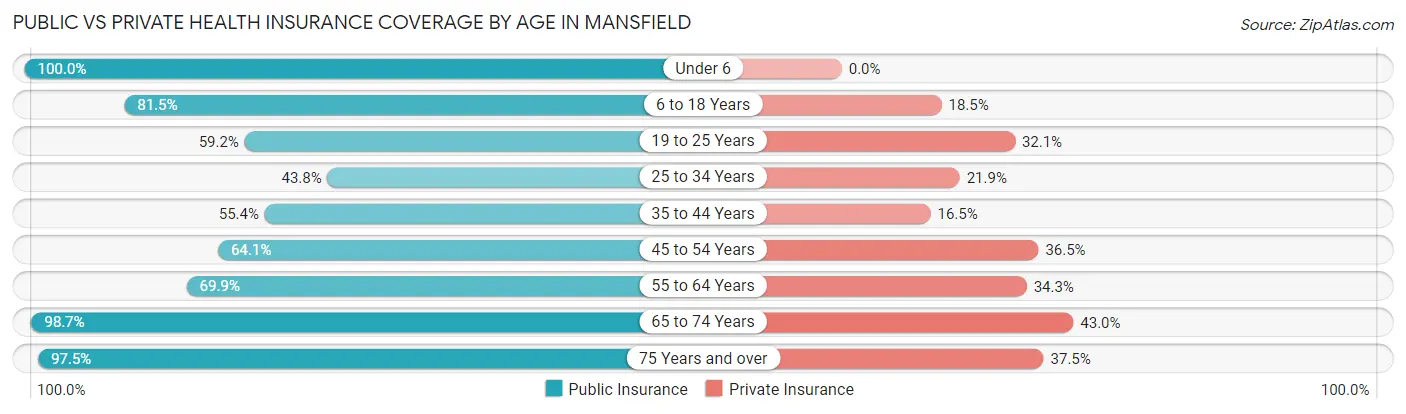
| Age Bracket | Public Insurance | Private Insurance |
| Under 6 | 73 (100.0%) | 0 (0.0%) |
| 6 to 18 Years | 612 (81.5%) | 139 (18.5%) |
| 19 to 25 Years | 265 (59.2%) | 144 (32.1%) |
| 25 to 34 Years | 232 (43.8%) | 116 (21.9%) |
| 35 to 44 Years | 424 (55.4%) | 126 (16.5%) |
| 45 to 54 Years | 425 (64.1%) | 242 (36.5%) |
| 55 to 64 Years | 330 (69.9%) | 162 (34.3%) |
| 65 to 74 Years | 471 (98.7%) | 205 (43.0%) |
| 75 Years and over | 315 (97.5%) | 121 (37.5%) |
| Total | 3,147 (69.9%) | 1,255 (27.9%) |
Disability Status by Sex by Age in Mansfield
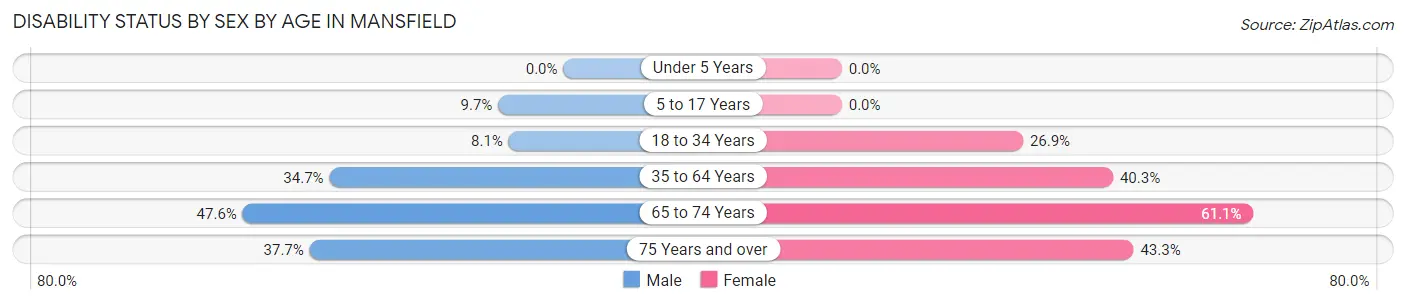
| Age Bracket | Male | Female |
| Under 5 Years | 0 (0.0%) | 0 (0.0%) |
| 5 to 17 Years | 33 (9.7%) | 0 (0.0%) |
| 18 to 34 Years | 51 (8.1%) | 113 (26.9%) |
| 35 to 64 Years | 321 (34.7%) | 393 (40.3%) |
| 65 to 74 Years | 90 (47.6%) | 176 (61.1%) |
| 75 Years and over | 26 (37.7%) | 110 (43.3%) |
Disability Class by Sex by Age in Mansfield
Disability Class: Hearing Difficulty
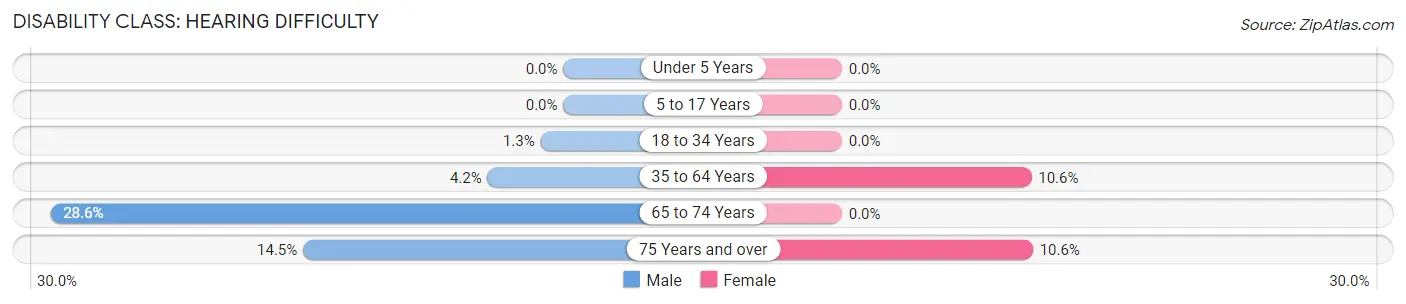
| Age Bracket | Male | Female |
| Under 5 Years | 0 (0.0%) | 0 (0.0%) |
| 5 to 17 Years | 0 (0.0%) | 0 (0.0%) |
| 18 to 34 Years | 8 (1.3%) | 0 (0.0%) |
| 35 to 64 Years | 39 (4.2%) | 103 (10.5%) |
| 65 to 74 Years | 54 (28.6%) | 0 (0.0%) |
| 75 Years and over | 10 (14.5%) | 27 (10.6%) |
Disability Class: Vision Difficulty
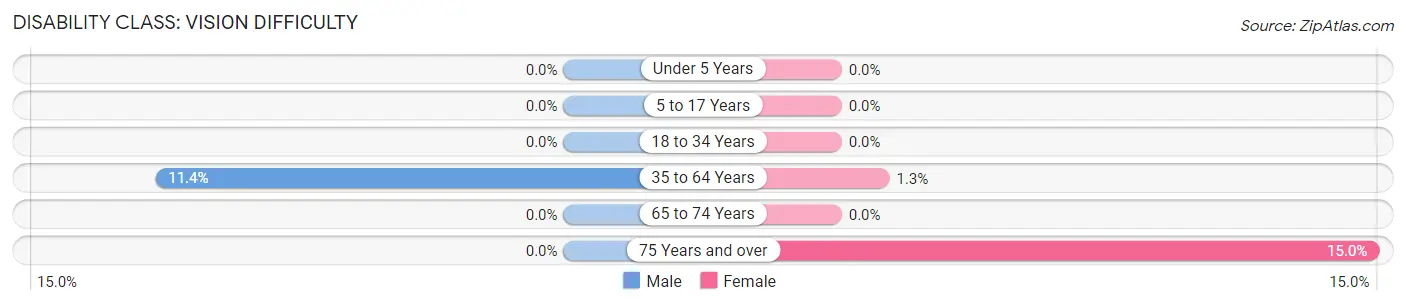
| Age Bracket | Male | Female |
| Under 5 Years | 0 (0.0%) | 0 (0.0%) |
| 5 to 17 Years | 0 (0.0%) | 0 (0.0%) |
| 18 to 34 Years | 0 (0.0%) | 0 (0.0%) |
| 35 to 64 Years | 105 (11.4%) | 13 (1.3%) |
| 65 to 74 Years | 0 (0.0%) | 0 (0.0%) |
| 75 Years and over | 0 (0.0%) | 38 (15.0%) |
Disability Class: Cognitive Difficulty
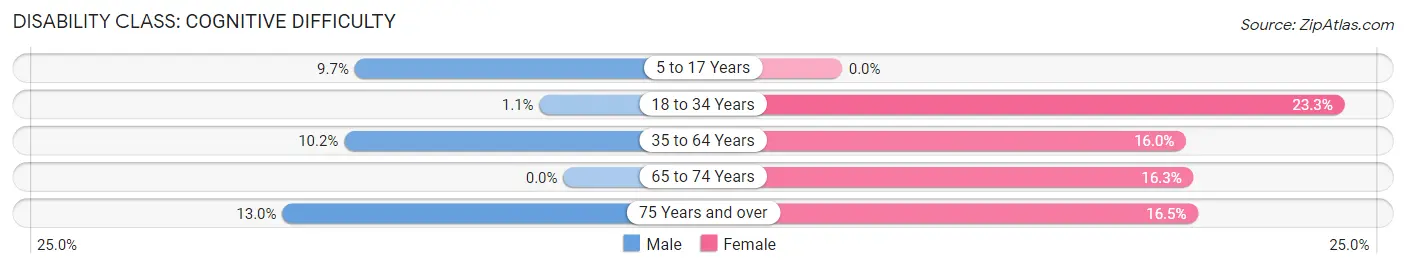
| Age Bracket | Male | Female |
| 5 to 17 Years | 33 (9.7%) | 0 (0.0%) |
| 18 to 34 Years | 7 (1.1%) | 98 (23.3%) |
| 35 to 64 Years | 94 (10.2%) | 156 (16.0%) |
| 65 to 74 Years | 0 (0.0%) | 47 (16.3%) |
| 75 Years and over | 9 (13.0%) | 42 (16.5%) |
Disability Class: Ambulatory Difficulty
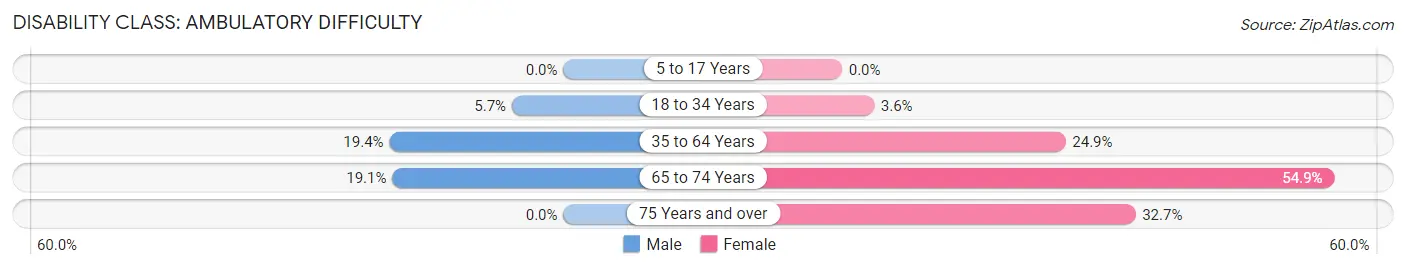
| Age Bracket | Male | Female |
| 5 to 17 Years | 0 (0.0%) | 0 (0.0%) |
| 18 to 34 Years | 36 (5.7%) | 15 (3.6%) |
| 35 to 64 Years | 179 (19.4%) | 243 (24.9%) |
| 65 to 74 Years | 36 (19.1%) | 158 (54.9%) |
| 75 Years and over | 0 (0.0%) | 83 (32.7%) |
Disability Class: Self-Care Difficulty
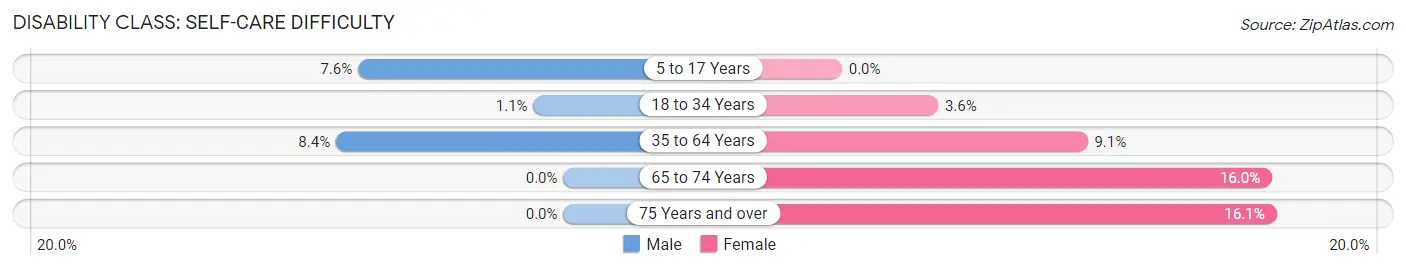
| Age Bracket | Male | Female |
| 5 to 17 Years | 26 (7.6%) | 0 (0.0%) |
| 18 to 34 Years | 7 (1.1%) | 15 (3.6%) |
| 35 to 64 Years | 78 (8.4%) | 89 (9.1%) |
| 65 to 74 Years | 0 (0.0%) | 46 (16.0%) |
| 75 Years and over | 0 (0.0%) | 41 (16.1%) |
Technology Access in Mansfield
Computing Device Access in Mansfield
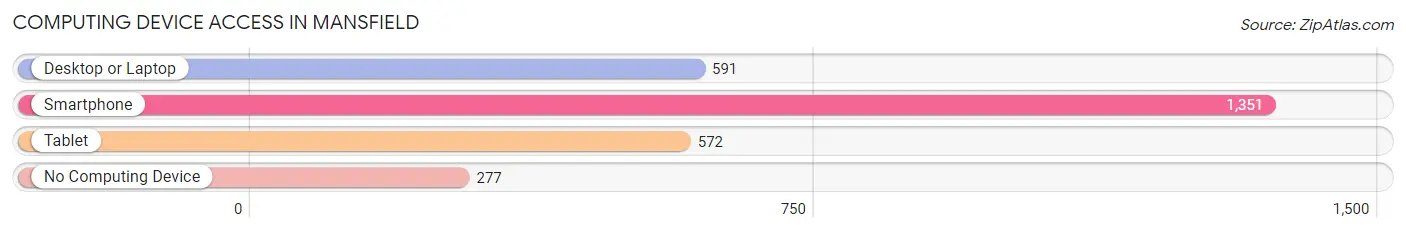
| Device Type | # Households | % Households |
| Desktop or Laptop | 591 | 34.3% |
| Smartphone | 1,351 | 78.5% |
| Tablet | 572 | 33.2% |
| No Computing Device | 277 | 16.1% |
| Total | 1,721 | 100.0% |
Internet Access in Mansfield
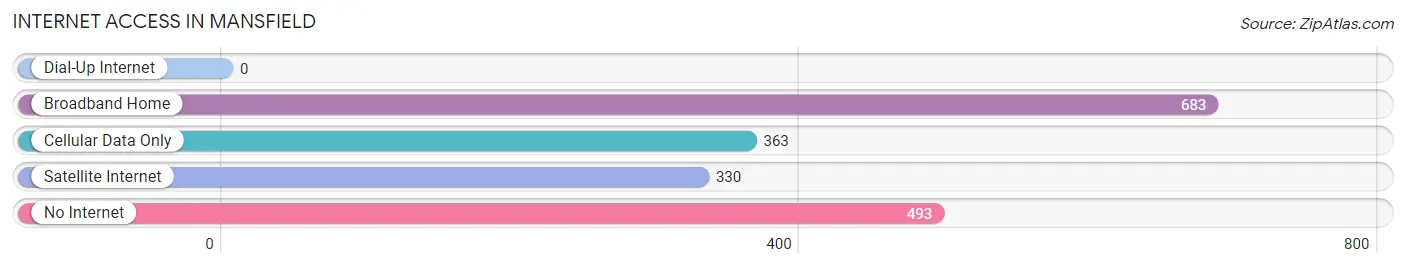
| Internet Type | # Households | % Households |
| Dial-Up Internet | 0 | 0.0% |
| Broadband Home | 683 | 39.7% |
| Cellular Data Only | 363 | 21.1% |
| Satellite Internet | 330 | 19.2% |
| No Internet | 493 | 28.6% |
| Total | 1,721 | 100.0% |
Mansfield Summary
Mansfield is a small city located in DeSoto Parish, Louisiana. It is situated in the northwest corner of the state, approximately 30 miles south of Shreveport. The city has a population of 5,001 as of the 2010 census, making it the largest city in DeSoto Parish.
History
Mansfield was founded in 1839 by a group of settlers from Georgia and Alabama. The city was named after General Mansfield, a hero of the War of 1812. The city was incorporated in 1848 and has been the county seat of DeSoto Parish since 1848.
The city was a major center of the cotton industry in the 19th century. The city was also the site of a major battle during the Civil War, the Battle of Mansfield. The battle was fought on April 8, 1864 and resulted in a Confederate victory.
Geography
Mansfield is located at the intersection of Interstate 49 and U.S. Highway 84. The city is situated in the northwest corner of the state, approximately 30 miles south of Shreveport. The city has a total area of 4.2 square miles, all of which is land.
The city is located in a hilly region of the state, with the highest point being the summit of Mansfield Hill, which is located just south of the city. The city is located in a humid subtropical climate zone, with hot, humid summers and mild winters.
Economy
Mansfield’s economy is largely based on agriculture and manufacturing. The city is home to several large manufacturing plants, including a paper mill, a steel mill, and a chemical plant. The city is also home to several large agricultural operations, including cotton, soybeans, and corn.
The city is also home to several retail stores, restaurants, and other businesses. The city is also home to a large medical center, which provides medical care to the residents of the city and the surrounding area.
Demographics
As of the 2010 census, the city had a population of 5,001. The racial makeup of the city was 65.2% White, 28.3% African American, 0.3% Native American, 0.3% Asian, 0.1% Pacific Islander, 4.2% from other races, and 1.8% from two or more races. Hispanic or Latino of any race were 8.2% of the population.
The median income for a household in the city was $30,938, and the median income for a family was $37,813. The per capita income for the city was $17,845. About 17.2% of families and 20.3% of the population were below the poverty line, including 28.3% of those under age 18 and 15.2% of those age 65 or over.
Mansfield is a small city with a rich history and a diverse economy. The city is home to several large manufacturing and agricultural operations, as well as a large medical center. The city has a population of 5,001 as of the 2010 census, and the racial makeup of the city is largely White and African American. The median income for a household in the city is $30,938, and the per capita income for the city is $17,845.
Common Questions
What is Per Capita Income in Mansfield?
Per Capita income in Mansfield is $16,198.
What is the Median Family Income in Mansfield?
Median Family Income in Mansfield is $34,365.
What is the Median Household income in Mansfield?
Median Household Income in Mansfield is $33,072.
What is Income or Wage Gap in Mansfield?
Income or Wage Gap in Mansfield is 23.6%.
Women in Mansfield earn 76.4 cents for every dollar earned by a man.
What is Family Income Deficit in Mansfield?
Family Income Deficit in Mansfield is $10,067.
Families that are below poverty line in Mansfield earn $10,067 less on average than the poverty threshold level.
What is Inequality or Gini Index in Mansfield?
Inequality or Gini Index in Mansfield is 0.38.
What is the Total Population of Mansfield?
Total Population of Mansfield is 4,675.
What is the Total Male Population of Mansfield?
Total Male Population of Mansfield is 2,259.
What is the Total Female Population of Mansfield?
Total Female Population of Mansfield is 2,416.
What is the Ratio of Males per 100 Females in Mansfield?
There are 93.50 Males per 100 Females in Mansfield.
What is the Ratio of Females per 100 Males in Mansfield?
There are 106.95 Females per 100 Males in Mansfield.
What is the Median Population Age in Mansfield?
Median Population Age in Mansfield is 41.3 Years.
What is the Average Family Size in Mansfield
Average Family Size in Mansfield is 3.3 People.
What is the Average Household Size in Mansfield
Average Household Size in Mansfield is 2.6 People.
How Large is the Labor Force in Mansfield?
There are 1,965 People in the Labor Forcein in Mansfield.
What is the Percentage of People in the Labor Force in Mansfield?
47.9% of People are in the Labor Force in Mansfield.
What is the Unemployment Rate in Mansfield?
Unemployment Rate in Mansfield is 15.8%.