Logansport, LA Map & Demographics
Logansport Map
Logansport Overview
$18,837
PER CAPITA INCOME
$54,038
AVG FAMILY INCOME
$37,550
AVG HOUSEHOLD INCOME
58.4%
WAGE / INCOME GAP [ % ]
41.6¢/ $1
WAGE / INCOME GAP [ $ ]
$10,685
FAMILY INCOME DEFICIT
0.46
INEQUALITY / GINI INDEX
1,972
TOTAL POPULATION
906
MALE POPULATION
1,066
FEMALE POPULATION
84.99
MALES / 100 FEMALES
117.66
FEMALES / 100 MALES
27.7
MEDIAN AGE
4.0
AVG FAMILY SIZE
3.1
AVG HOUSEHOLD SIZE
685
LABOR FORCE [ PEOPLE ]
52.9%
PERCENT IN LABOR FORCE
7.9%
UNEMPLOYMENT RATE
Logansport Zip Codes
Logansport Area Codes
Income in Logansport
Income Overview in Logansport
Per Capita Income in Logansport is $18,837, while median incomes of families and households are $54,038 and $37,550 respectively.
| Characteristic | Number | Measure |
| Per Capita Income | 1,972 | $18,837 |
| Median Family Income | 422 | $54,038 |
| Mean Family Income | 422 | $61,067 |
| Median Household Income | 627 | $37,550 |
| Mean Household Income | 627 | $55,498 |
| Income Deficit | 422 | $10,685 |
| Wage / Income Gap (%) | 1,972 | 58.45% |
| Wage / Income Gap ($) | 1,972 | 41.55¢ per $1 |
| Gini / Inequality Index | 1,972 | 0.46 |
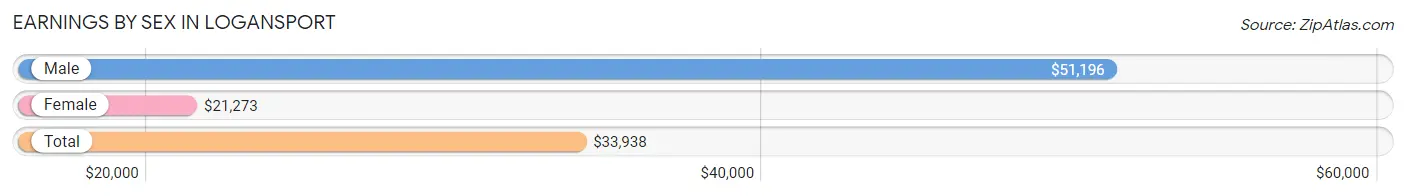
Earnings by Sex in Logansport
Average Earnings in Logansport are $33,938, $51,196 for men and $21,273 for women, a difference of 58.5%.
| Sex | Number | Average Earnings |
| Male | 240 (35.2%) | $51,196 |
| Female | 442 (64.8%) | $21,273 |
| Total | 682 (100.0%) | $33,938 |
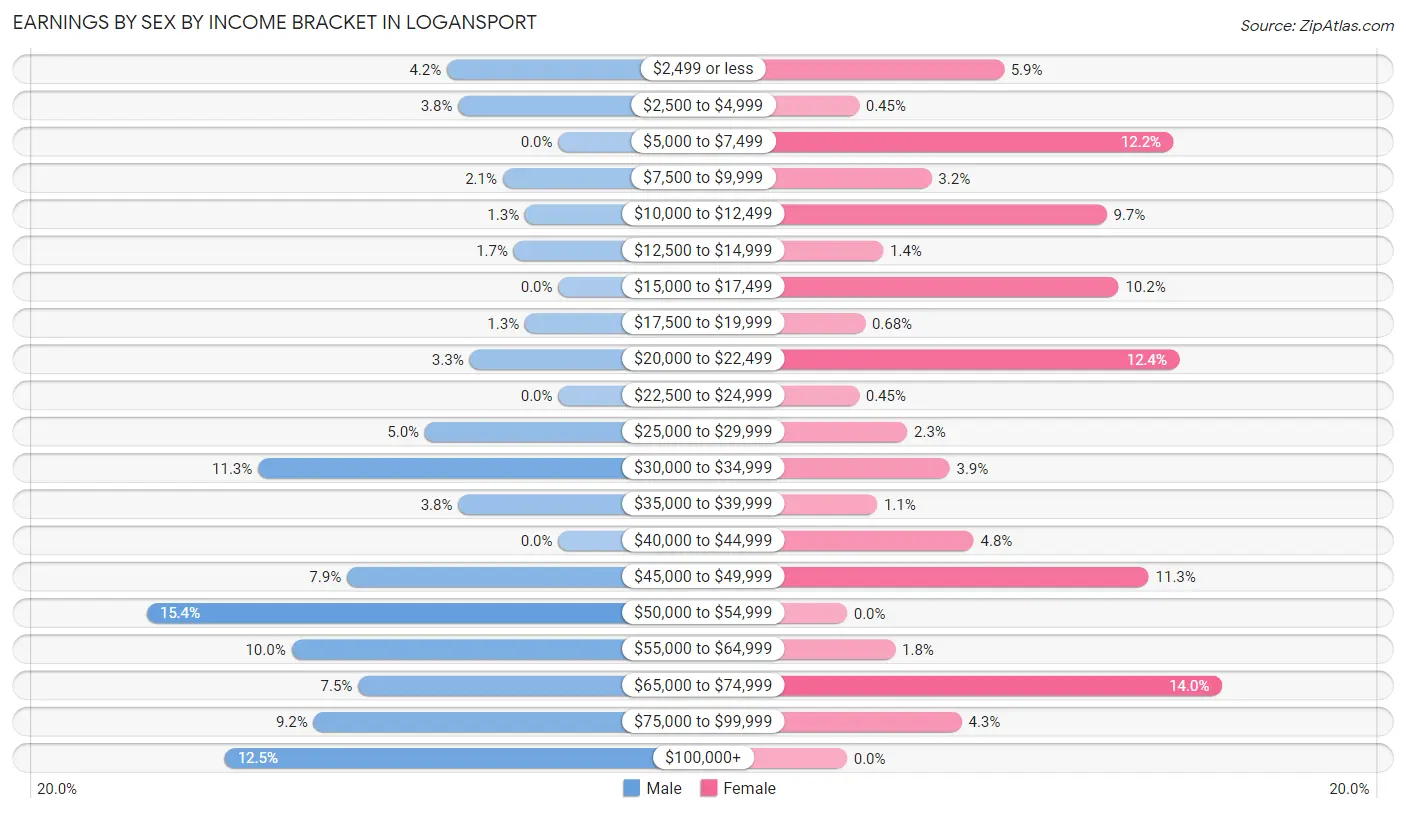
Earnings by Sex by Income Bracket in Logansport
The most common earnings brackets in Logansport are $50,000 to $54,999 for men (37 | 15.4%) and $65,000 to $74,999 for women (62 | 14.0%).
| Income | Male | Female |
| $2,499 or less | 10 (4.2%) | 26 (5.9%) |
| $2,500 to $4,999 | 9 (3.7%) | 2 (0.4%) |
| $5,000 to $7,499 | 0 (0.0%) | 54 (12.2%) |
| $7,500 to $9,999 | 5 (2.1%) | 14 (3.2%) |
| $10,000 to $12,499 | 3 (1.3%) | 43 (9.7%) |
| $12,500 to $14,999 | 4 (1.7%) | 6 (1.4%) |
| $15,000 to $17,499 | 0 (0.0%) | 45 (10.2%) |
| $17,500 to $19,999 | 3 (1.3%) | 3 (0.7%) |
| $20,000 to $22,499 | 8 (3.3%) | 55 (12.4%) |
| $22,500 to $24,999 | 0 (0.0%) | 2 (0.4%) |
| $25,000 to $29,999 | 12 (5.0%) | 10 (2.3%) |
| $30,000 to $34,999 | 27 (11.3%) | 17 (3.8%) |
| $35,000 to $39,999 | 9 (3.7%) | 5 (1.1%) |
| $40,000 to $44,999 | 0 (0.0%) | 21 (4.8%) |
| $45,000 to $49,999 | 19 (7.9%) | 50 (11.3%) |
| $50,000 to $54,999 | 37 (15.4%) | 0 (0.0%) |
| $55,000 to $64,999 | 24 (10.0%) | 8 (1.8%) |
| $65,000 to $74,999 | 18 (7.5%) | 62 (14.0%) |
| $75,000 to $99,999 | 22 (9.2%) | 19 (4.3%) |
| $100,000+ | 30 (12.5%) | 0 (0.0%) |
| Total | 240 (100.0%) | 442 (100.0%) |
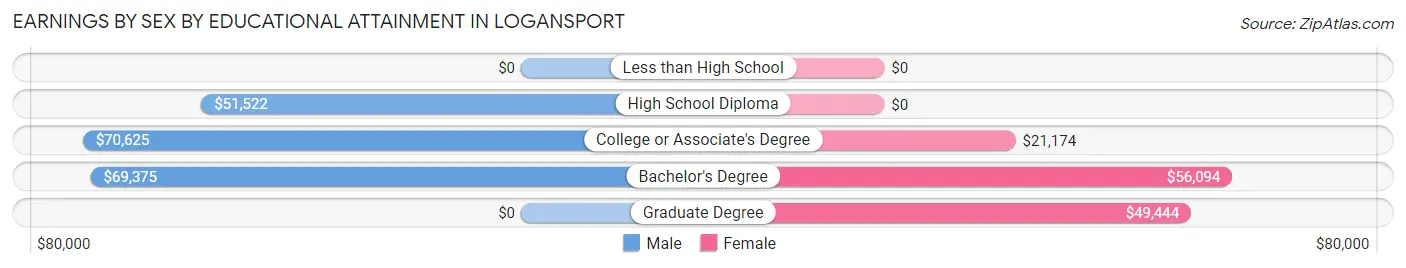
Earnings by Sex by Educational Attainment in Logansport
Average earnings in Logansport are $52,337 for men and $21,528 for women, a difference of 58.9%. Men with an educational attainment of college or associate's degree enjoy the highest average annual earnings of $70,625, while those with high school diploma education earn the least with $51,522. Women with an educational attainment of bachelor's degree earn the most with the average annual earnings of $56,094, while those with college or associate's degree education have the smallest earnings of $21,174.
| Educational Attainment | Male Income | Female Income |
| Less than High School | - | - |
| High School Diploma | $51,522 | $0 |
| College or Associate's Degree | $70,625 | $21,174 |
| Bachelor's Degree | $69,375 | $56,094 |
| Graduate Degree | - | - |
| Total | $52,337 | $21,528 |
Family Income in Logansport
Family Income Brackets in Logansport
According to the Logansport family income data, there are 89 families falling into the $50,000 to $74,999 income range, which is the most common income bracket and makes up 21.1% of all families.
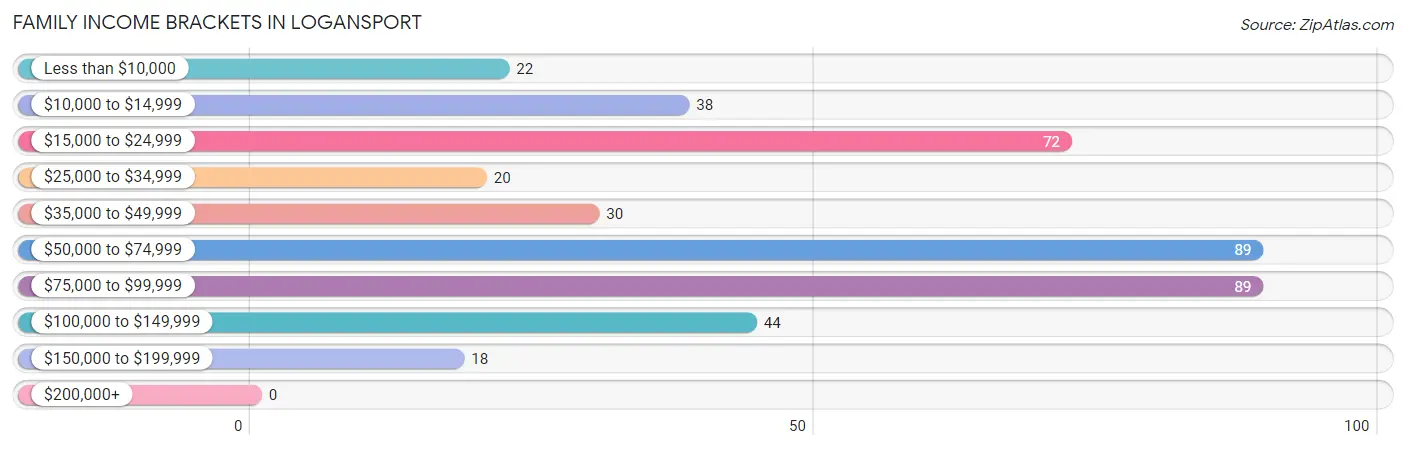
| Income Bracket | # Families | % Families |
| Less than $10,000 | 22 | 5.2% |
| $10,000 to $14,999 | 38 | 9.0% |
| $15,000 to $24,999 | 72 | 17.1% |
| $25,000 to $34,999 | 20 | 4.7% |
| $35,000 to $49,999 | 30 | 7.1% |
| $50,000 to $74,999 | 89 | 21.1% |
| $75,000 to $99,999 | 89 | 21.1% |
| $100,000 to $149,999 | 44 | 10.4% |
| $150,000 to $199,999 | 18 | 4.3% |
| $200,000+ | 0 | 0.0% |
Family Income by Famaliy Size in Logansport
4-person families (119 | 28.2%) account for the highest median family income in Logansport with $78,250 per family, while 4-person families (119 | 28.2%) have the highest median income of $19,562 per family member.
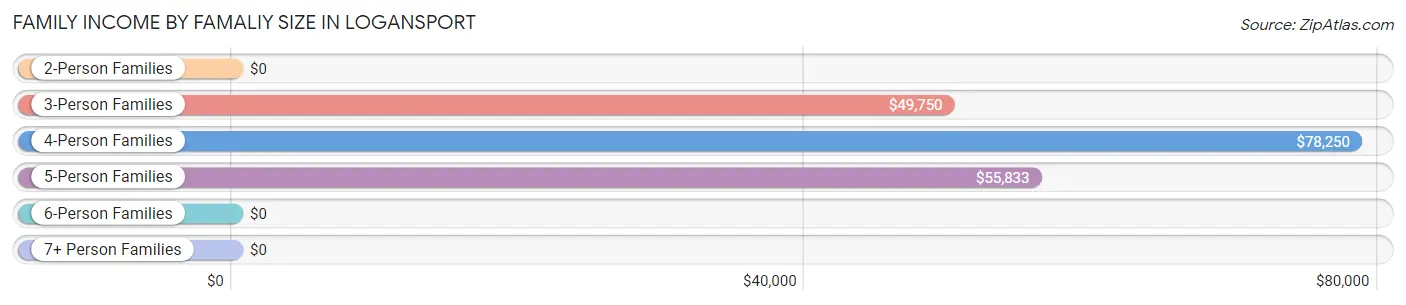
| Income Bracket | # Families | Median Income |
| 2-Person Families | 155 (36.7%) | $0 |
| 3-Person Families | 67 (15.9%) | $49,750 |
| 4-Person Families | 119 (28.2%) | $78,250 |
| 5-Person Families | 80 (19.0%) | $55,833 |
| 6-Person Families | 1 (0.2%) | $0 |
| 7+ Person Families | 0 (0.0%) | $0 |
| Total | 422 (100.0%) | $54,038 |
Family Income by Number of Earners in Logansport
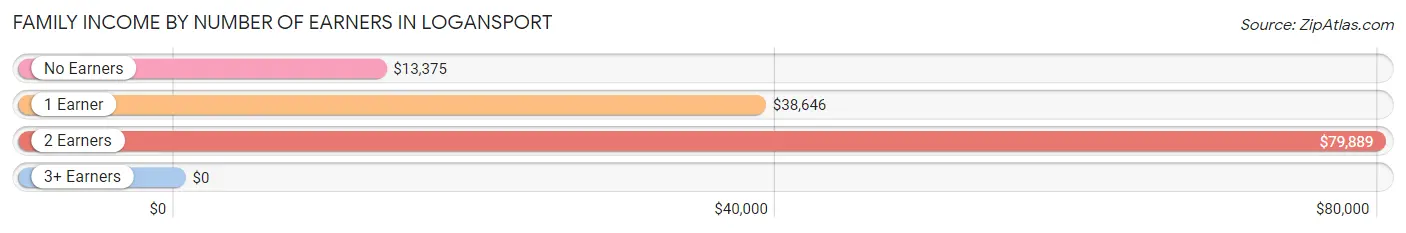
| Number of Earners | # Families | Median Income |
| No Earners | 73 (17.3%) | $13,375 |
| 1 Earner | 179 (42.4%) | $38,646 |
| 2 Earners | 170 (40.3%) | $79,889 |
| 3+ Earners | 0 (0.0%) | $0 |
| Total | 422 (100.0%) | $54,038 |
Household Income in Logansport
Household Income Brackets in Logansport
With 135 households falling in the category, the $15,000 to $24,999 income range is the most frequent in Logansport, accounting for 21.5% of all households. In contrast, only 9 households (1.4%) fall into the $200,000+ income bracket, making it the least populous group.
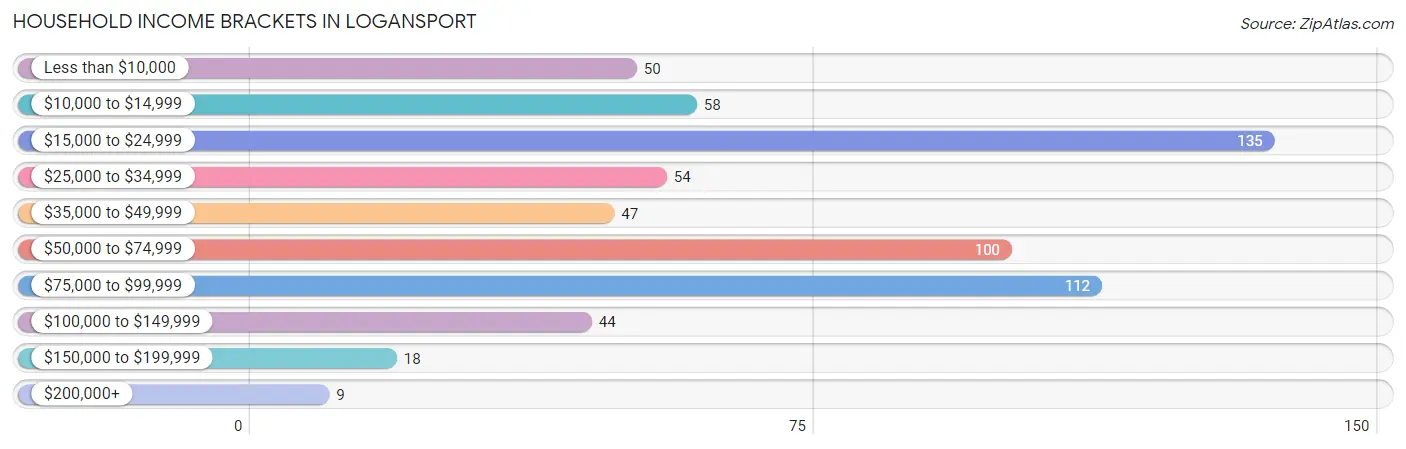
| Income Bracket | # Households | % Households |
| Less than $10,000 | 50 | 8.0% |
| $10,000 to $14,999 | 58 | 9.3% |
| $15,000 to $24,999 | 135 | 21.5% |
| $25,000 to $34,999 | 54 | 8.6% |
| $35,000 to $49,999 | 47 | 7.5% |
| $50,000 to $74,999 | 100 | 15.9% |
| $75,000 to $99,999 | 112 | 17.9% |
| $100,000 to $149,999 | 44 | 7.0% |
| $150,000 to $199,999 | 18 | 2.9% |
| $200,000+ | 9 | 1.4% |
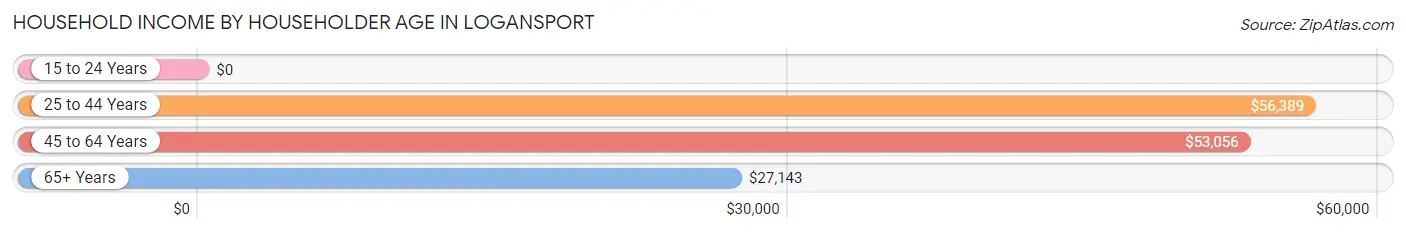
Household Income by Householder Age in Logansport
The median household income in Logansport is $37,550, with the highest median household income of $56,389 found in the 25 to 44 years age bracket for the primary householder. A total of 212 households (33.8%) fall into this category. Meanwhile, the 15 to 24 years age bracket for the primary householder has the lowest median household income of $0, with 7 households (1.1%) in this group.
| Income Bracket | # Households | Median Income |
| 15 to 24 Years | 7 (1.1%) | $0 |
| 25 to 44 Years | 212 (33.8%) | $56,389 |
| 45 to 64 Years | 210 (33.5%) | $53,056 |
| 65+ Years | 198 (31.6%) | $27,143 |
| Total | 627 (100.0%) | $37,550 |
Poverty in Logansport
Income Below Poverty by Sex and Age in Logansport
With 23.8% poverty level for males and 37.4% for females among the residents of Logansport, 65 to 74 year old males and under 5 year old females are the most vulnerable to poverty, with 26 males (61.9%) and 59 females (76.6%) in their respective age groups living below the poverty level.
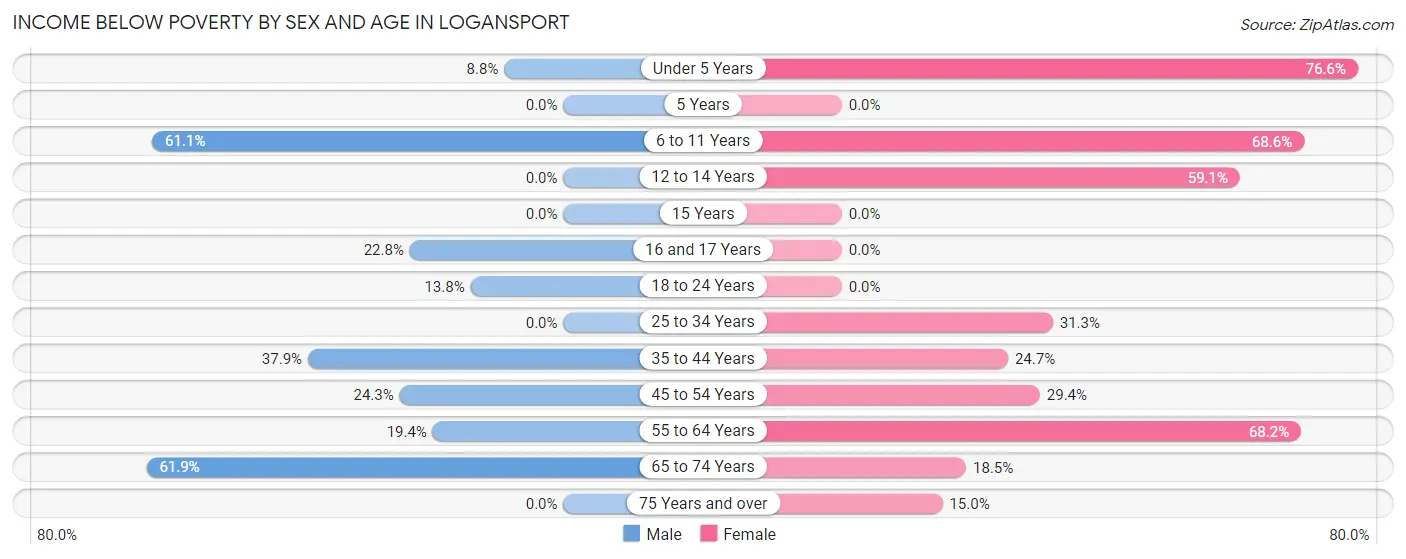
| Age Bracket | Male | Female |
| Under 5 Years | 13 (8.8%) | 59 (76.6%) |
| 5 Years | 0 (0.0%) | 0 (0.0%) |
| 6 to 11 Years | 91 (61.1%) | 105 (68.6%) |
| 12 to 14 Years | 0 (0.0%) | 26 (59.1%) |
| 15 Years | 0 (0.0%) | 0 (0.0%) |
| 16 and 17 Years | 13 (22.8%) | 0 (0.0%) |
| 18 to 24 Years | 8 (13.8%) | 0 (0.0%) |
| 25 to 34 Years | 0 (0.0%) | 52 (31.3%) |
| 35 to 44 Years | 22 (37.9%) | 39 (24.7%) |
| 45 to 54 Years | 27 (24.3%) | 30 (29.4%) |
| 55 to 64 Years | 13 (19.4%) | 60 (68.2%) |
| 65 to 74 Years | 26 (61.9%) | 12 (18.5%) |
| 75 Years and over | 0 (0.0%) | 16 (14.9%) |
| Total | 213 (23.8%) | 399 (37.4%) |
Income Above Poverty by Sex and Age in Logansport
According to the poverty statistics in Logansport, males aged 5 years and females aged 16 and 17 years are the age groups that are most secure financially, with 100.0% of males and 100.0% of females in these age groups living above the poverty line.
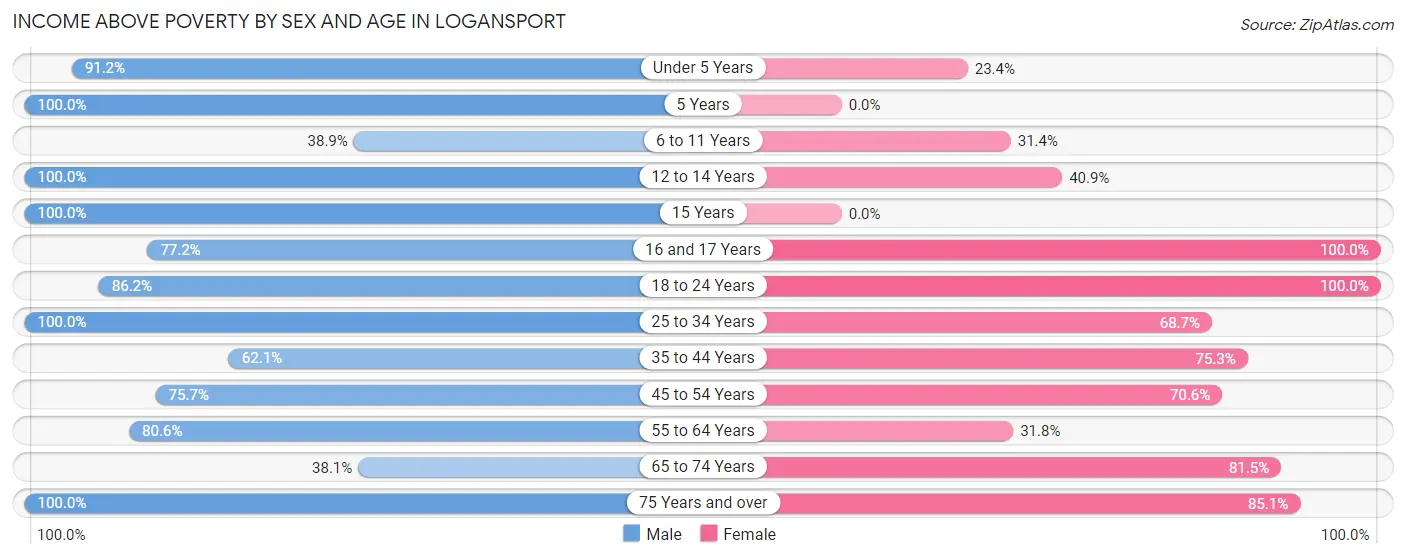
| Age Bracket | Male | Female |
| Under 5 Years | 135 (91.2%) | 18 (23.4%) |
| 5 Years | 9 (100.0%) | 0 (0.0%) |
| 6 to 11 Years | 58 (38.9%) | 48 (31.4%) |
| 12 to 14 Years | 72 (100.0%) | 18 (40.9%) |
| 15 Years | 14 (100.0%) | 0 (0.0%) |
| 16 and 17 Years | 44 (77.2%) | 40 (100.0%) |
| 18 to 24 Years | 50 (86.2%) | 66 (100.0%) |
| 25 to 34 Years | 77 (100.0%) | 114 (68.7%) |
| 35 to 44 Years | 36 (62.1%) | 119 (75.3%) |
| 45 to 54 Years | 84 (75.7%) | 72 (70.6%) |
| 55 to 64 Years | 54 (80.6%) | 28 (31.8%) |
| 65 to 74 Years | 16 (38.1%) | 53 (81.5%) |
| 75 Years and over | 32 (100.0%) | 91 (85.1%) |
| Total | 681 (76.2%) | 667 (62.6%) |
Income Below Poverty Among Married-Couple Families in Logansport
The poverty statistics for married-couple families in Logansport show that 13.5% or 29 of the total 215 families live below the poverty line. Families with no children have the highest poverty rate of 21.4%, comprising of 22 families. On the other hand, families with 3 or 4 children have the lowest poverty rate of 0.0%, which includes 0 families.
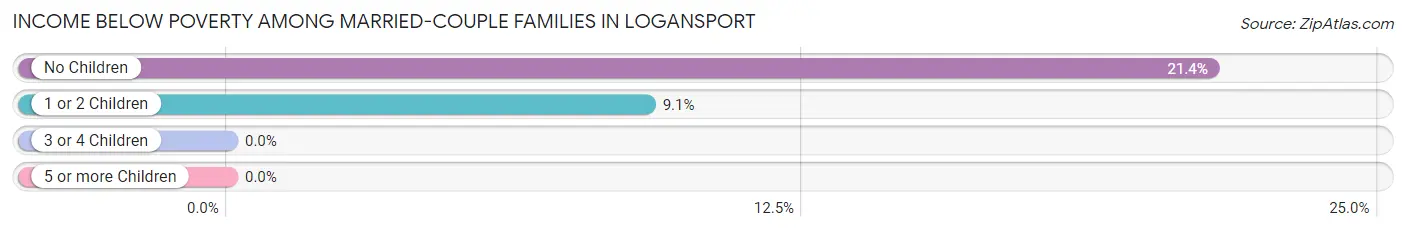
| Children | Above Poverty | Below Poverty |
| No Children | 81 (78.6%) | 22 (21.4%) |
| 1 or 2 Children | 70 (90.9%) | 7 (9.1%) |
| 3 or 4 Children | 35 (100.0%) | 0 (0.0%) |
| 5 or more Children | 0 (0.0%) | 0 (0.0%) |
| Total | 186 (86.5%) | 29 (13.5%) |
Income Below Poverty Among Single-Parent Households in Logansport
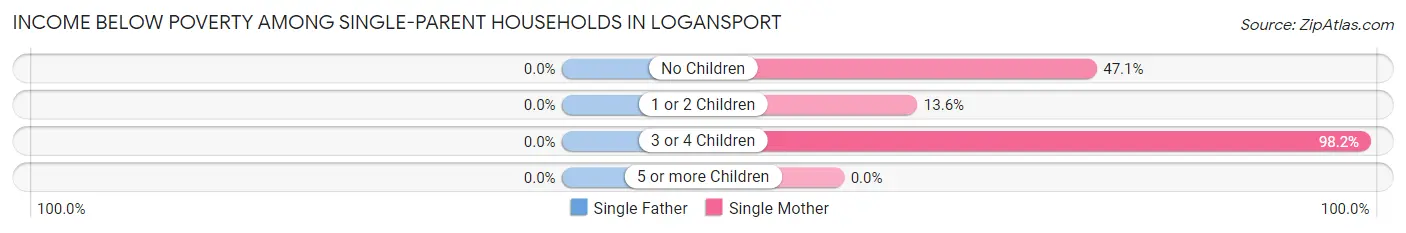
| Children | Single Father | Single Mother |
| No Children | 0 (0.0%) | 16 (47.1%) |
| 1 or 2 Children | 0 (0.0%) | 9 (13.6%) |
| 3 or 4 Children | 0 (0.0%) | 55 (98.2%) |
| 5 or more Children | 0 (0.0%) | 0 (0.0%) |
| Total | 0 (0.0%) | 80 (51.3%) |
Income Below Poverty Among Married-Couple vs Single-Parent Households in Logansport
The poverty data for Logansport shows that 29 of the married-couple family households (13.5%) and 80 of the single-parent households (38.7%) are living below the poverty level. Within the married-couple family households, those with no children have the highest poverty rate, with 22 households (21.4%) falling below the poverty line. Among the single-parent households, those with 3 or 4 children have the highest poverty rate, with 55 household (80.9%) living below poverty.
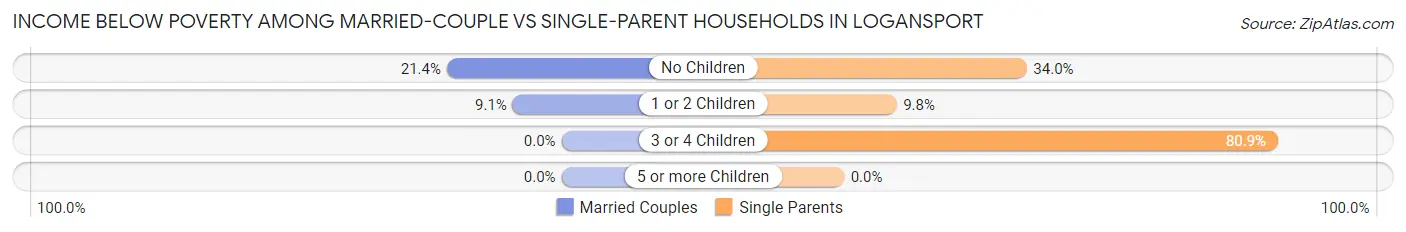
| Children | Married-Couple Families | Single-Parent Households |
| No Children | 22 (21.4%) | 16 (34.0%) |
| 1 or 2 Children | 7 (9.1%) | 9 (9.8%) |
| 3 or 4 Children | 0 (0.0%) | 55 (80.9%) |
| 5 or more Children | 0 (0.0%) | 0 (0.0%) |
| Total | 29 (13.5%) | 80 (38.7%) |
Race in Logansport
The most populous races in Logansport are White / Caucasian (995 | 50.5%), Black / African American (806 | 40.9%), and Two or more Races (163 | 8.3%).
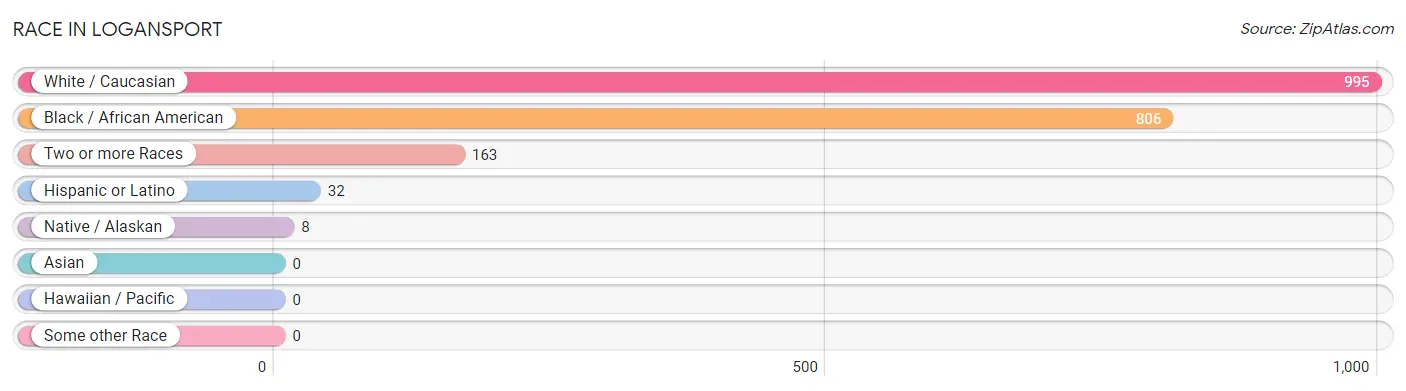
| Race | # Population | % Population |
| Asian | 0 | 0.0% |
| Black / African American | 806 | 40.9% |
| Hawaiian / Pacific | 0 | 0.0% |
| Hispanic or Latino | 32 | 1.6% |
| Native / Alaskan | 8 | 0.4% |
| White / Caucasian | 995 | 50.5% |
| Two or more Races | 163 | 8.3% |
| Some other Race | 0 | 0.0% |
| Total | 1,972 | 100.0% |
Ancestry in Logansport
The most populous ancestries reported in Logansport are American (144 | 7.3%), Irish (125 | 6.3%), English (70 | 3.5%), French (69 | 3.5%), and German (32 | 1.6%), together accounting for 22.3% of all Logansport residents.
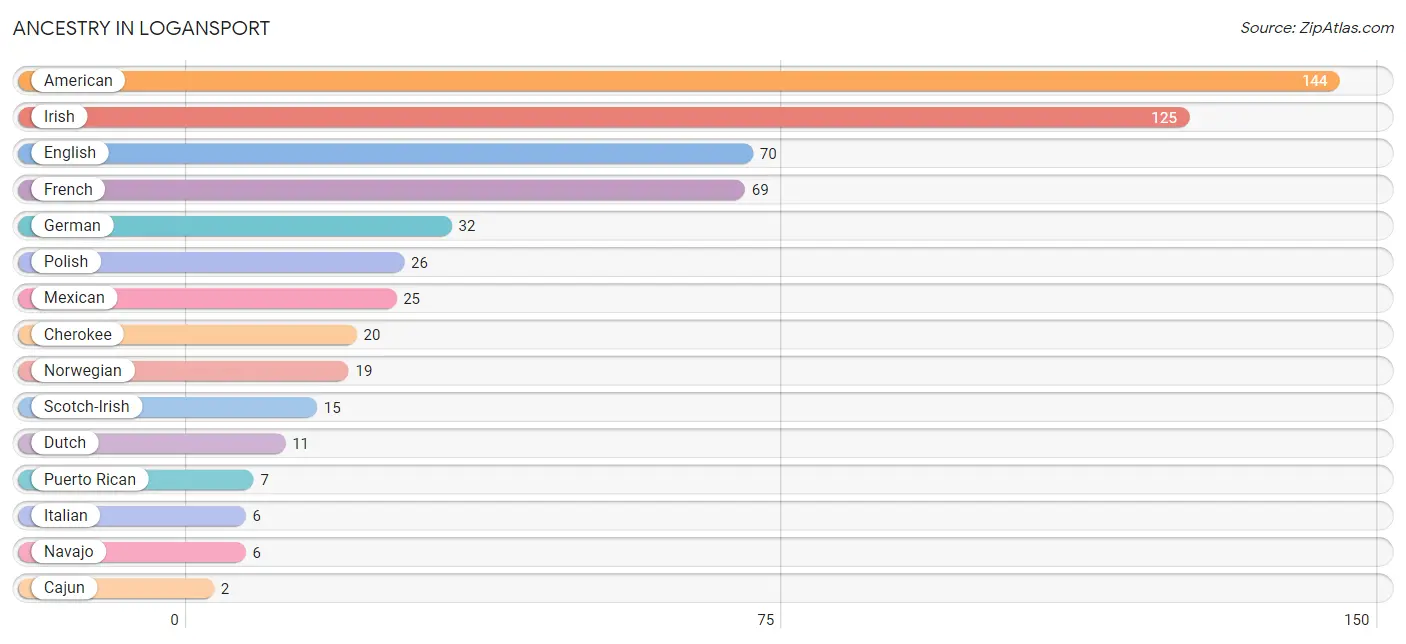
| Ancestry | # Population | % Population |
| American | 144 | 7.3% |
| Cajun | 2 | 0.1% |
| Cherokee | 20 | 1.0% |
| Dutch | 11 | 0.6% |
| English | 70 | 3.5% |
| French | 69 | 3.5% |
| German | 32 | 1.6% |
| Irish | 125 | 6.3% |
| Italian | 6 | 0.3% |
| Mexican | 25 | 1.3% |
| Navajo | 6 | 0.3% |
| Norwegian | 19 | 1.0% |
| Polish | 26 | 1.3% |
| Puerto Rican | 7 | 0.4% |
| Scotch-Irish | 15 | 0.8% |
| Scottish | 2 | 0.1% |
| Seminole | 1 | 0.1% | View All 17 Rows |
Immigrants in Logansport
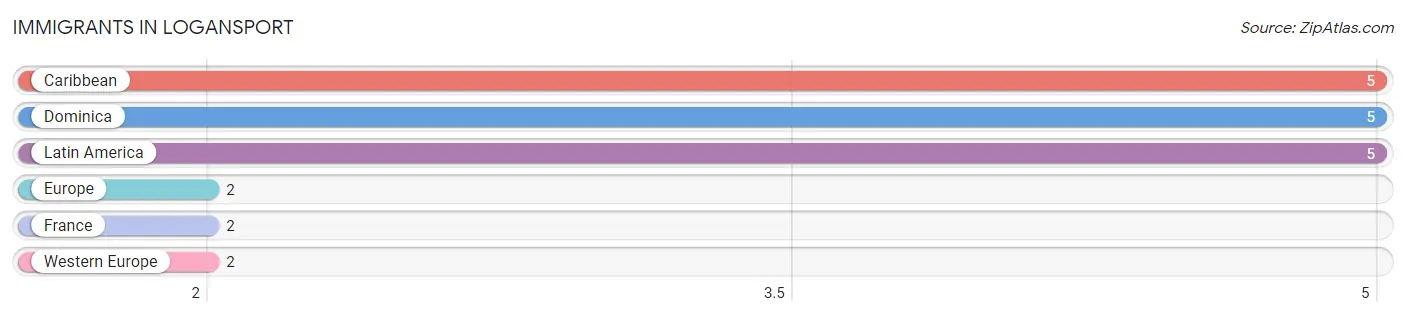
The most numerous immigrant groups reported in Logansport came from Caribbean (5 | 0.3%), Dominica (5 | 0.3%), Latin America (5 | 0.3%), Europe (2 | 0.1%), and France (2 | 0.1%), together accounting for 1.0% of all Logansport residents.
| Immigration Origin | # Population | % Population |
| Caribbean | 5 | 0.3% |
| Dominica | 5 | 0.3% |
| Europe | 2 | 0.1% |
| France | 2 | 0.1% |
| Latin America | 5 | 0.3% |
| Western Europe | 2 | 0.1% | View All 6 Rows |
Sex and Age in Logansport
Sex and Age in Logansport
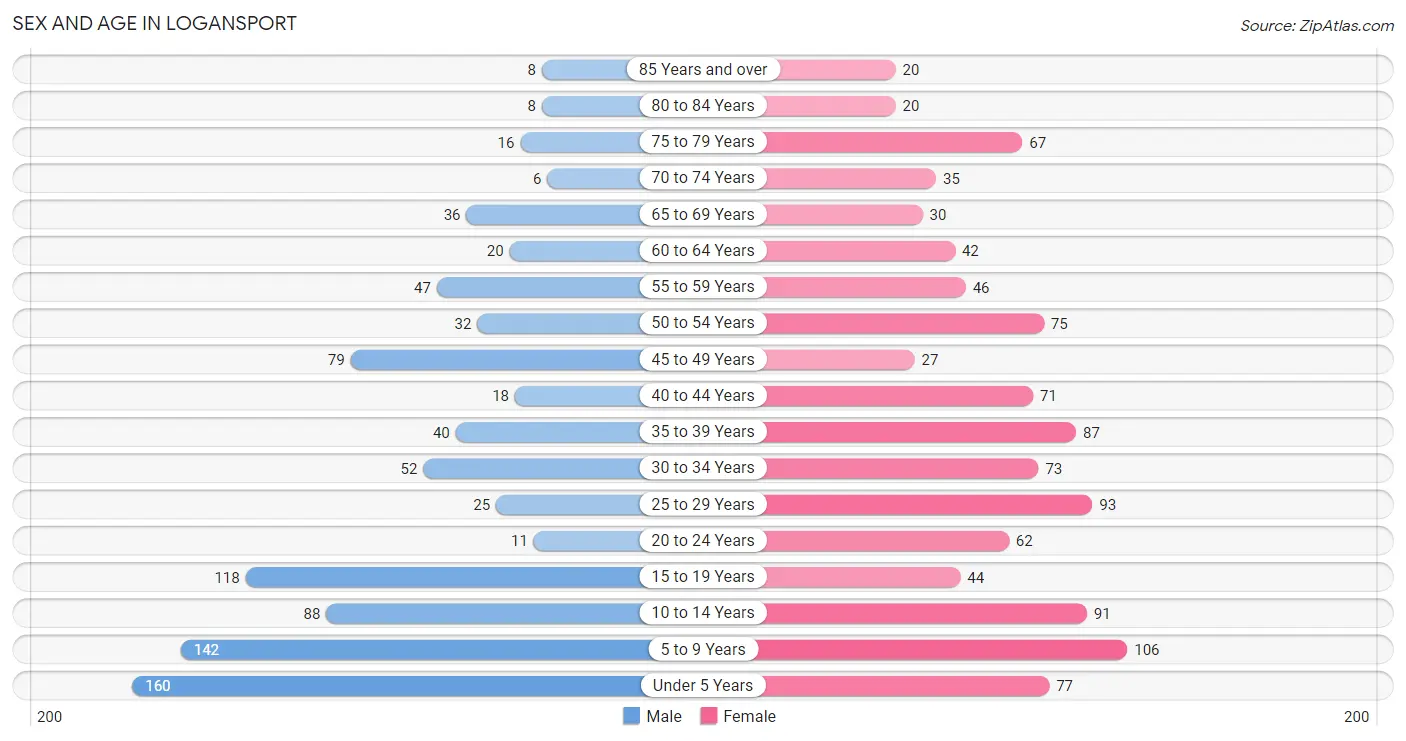
The most populous age groups in Logansport are Under 5 Years (160 | 17.7%) for men and 5 to 9 Years (106 | 9.9%) for women.
| Age Bracket | Male | Female |
| Under 5 Years | 160 (17.7%) | 77 (7.2%) |
| 5 to 9 Years | 142 (15.7%) | 106 (9.9%) |
| 10 to 14 Years | 88 (9.7%) | 91 (8.5%) |
| 15 to 19 Years | 118 (13.0%) | 44 (4.1%) |
| 20 to 24 Years | 11 (1.2%) | 62 (5.8%) |
| 25 to 29 Years | 25 (2.8%) | 93 (8.7%) |
| 30 to 34 Years | 52 (5.7%) | 73 (6.9%) |
| 35 to 39 Years | 40 (4.4%) | 87 (8.2%) |
| 40 to 44 Years | 18 (2.0%) | 71 (6.7%) |
| 45 to 49 Years | 79 (8.7%) | 27 (2.5%) |
| 50 to 54 Years | 32 (3.5%) | 75 (7.0%) |
| 55 to 59 Years | 47 (5.2%) | 46 (4.3%) |
| 60 to 64 Years | 20 (2.2%) | 42 (3.9%) |
| 65 to 69 Years | 36 (4.0%) | 30 (2.8%) |
| 70 to 74 Years | 6 (0.7%) | 35 (3.3%) |
| 75 to 79 Years | 16 (1.8%) | 67 (6.3%) |
| 80 to 84 Years | 8 (0.9%) | 20 (1.9%) |
| 85 Years and over | 8 (0.9%) | 20 (1.9%) |
| Total | 906 (100.0%) | 1,066 (100.0%) |
Families and Households in Logansport
Median Family Size in Logansport
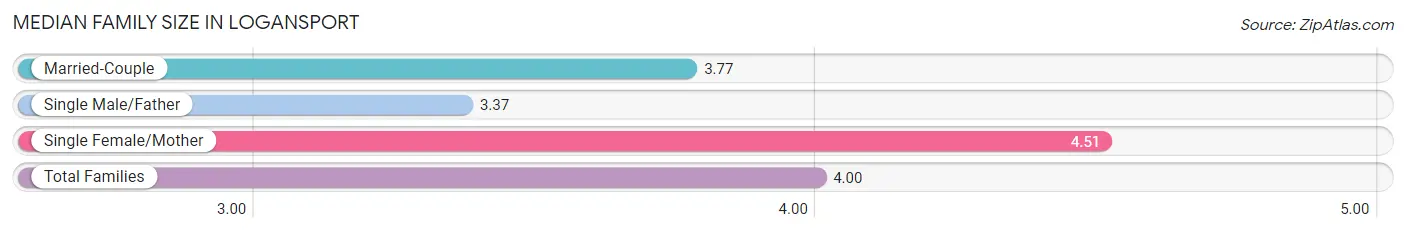
The median family size in Logansport is 4.00 persons per family, with single female/mother families (156 | 37.0%) accounting for the largest median family size of 4.51 persons per family. On the other hand, single male/father families (51 | 12.1%) represent the smallest median family size with 3.37 persons per family.
| Family Type | # Families | Family Size |
| Married-Couple | 215 (50.9%) | 3.77 |
| Single Male/Father | 51 (12.1%) | 3.37 |
| Single Female/Mother | 156 (37.0%) | 4.51 |
| Total Families | 422 (100.0%) | 4.00 |
Median Household Size in Logansport
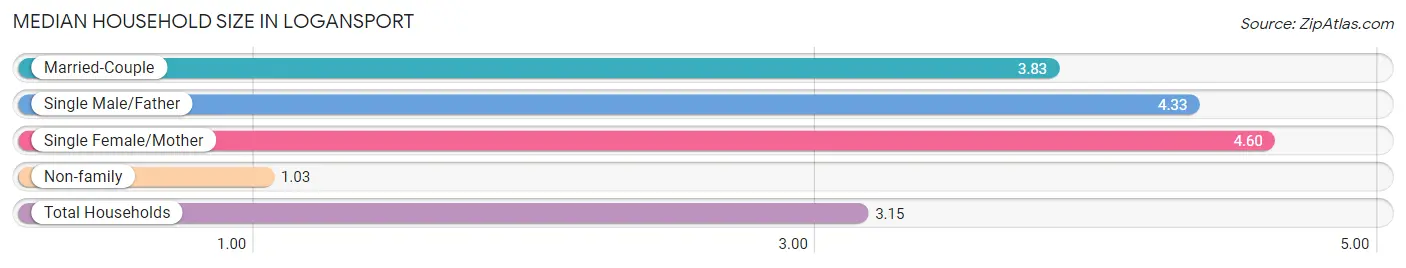
The median household size in Logansport is 3.15 persons per household, with single female/mother households (156 | 24.9%) accounting for the largest median household size of 4.6 persons per household. non-family households (205 | 32.7%) represent the smallest median household size with 1.03 persons per household.
| Household Type | # Households | Household Size |
| Married-Couple | 215 (34.3%) | 3.83 |
| Single Male/Father | 51 (8.1%) | 4.33 |
| Single Female/Mother | 156 (24.9%) | 4.60 |
| Non-family | 205 (32.7%) | 1.03 |
| Total Households | 627 (100.0%) | 3.15 |
Household Size by Marriage Status in Logansport
Out of a total of 627 households in Logansport, 422 (67.3%) are family households, while 205 (32.7%) are nonfamily households. The most numerous type of family households are 2-person households, comprising 128, and the most common type of nonfamily households are 1-person households, comprising 192.
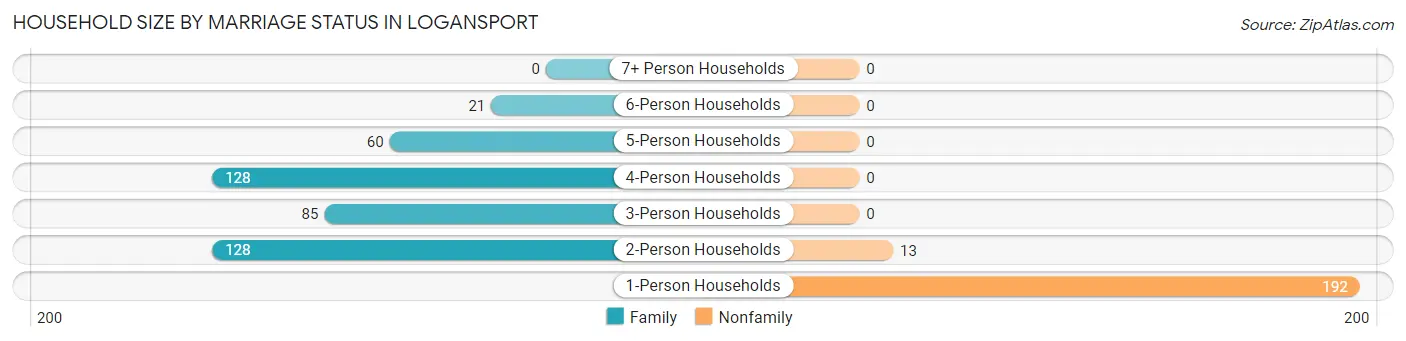
| Household Size | Family Households | Nonfamily Households |
| 1-Person Households | - | 192 (30.6%) |
| 2-Person Households | 128 (20.4%) | 13 (2.1%) |
| 3-Person Households | 85 (13.6%) | 0 (0.0%) |
| 4-Person Households | 128 (20.4%) | 0 (0.0%) |
| 5-Person Households | 60 (9.6%) | 0 (0.0%) |
| 6-Person Households | 21 (3.4%) | 0 (0.0%) |
| 7+ Person Households | 0 (0.0%) | 0 (0.0%) |
| Total | 422 (67.3%) | 205 (32.7%) |
Female Fertility in Logansport
Fertility by Age in Logansport
Average fertility rate in Logansport is 118.0 births per 1,000 women. Women in the age bracket of 20 to 34 years have the highest fertility rate with 237.0 births per 1,000 women. Women in the age bracket of 20 to 34 years acount for 100.0% of all women with births.
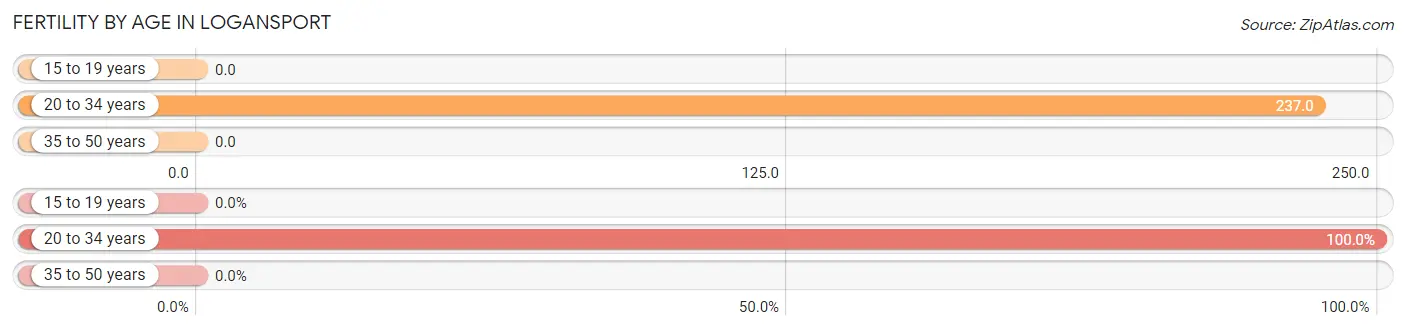
| Age Bracket | Women with Births | Births / 1,000 Women |
| 15 to 19 years | 0 (0.0%) | 0.0 |
| 20 to 34 years | 54 (100.0%) | 237.0 |
| 35 to 50 years | 0 (0.0%) | 0.0 |
| Total | 54 (100.0%) | 118.0 |
Fertility by Age by Marriage Status in Logansport
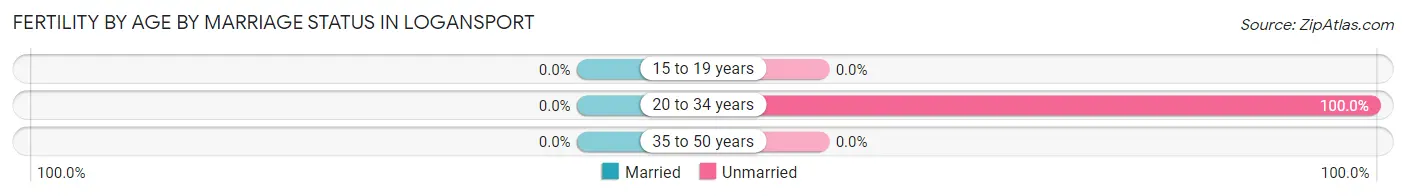
| Age Bracket | Married | Unmarried |
| 15 to 19 years | 0 (0.0%) | 0 (0.0%) |
| 20 to 34 years | 0 (0.0%) | 54 (100.0%) |
| 35 to 50 years | 0 (0.0%) | 0 (0.0%) |
| Total | 0 (0.0%) | 54 (100.0%) |
Fertility by Education in Logansport
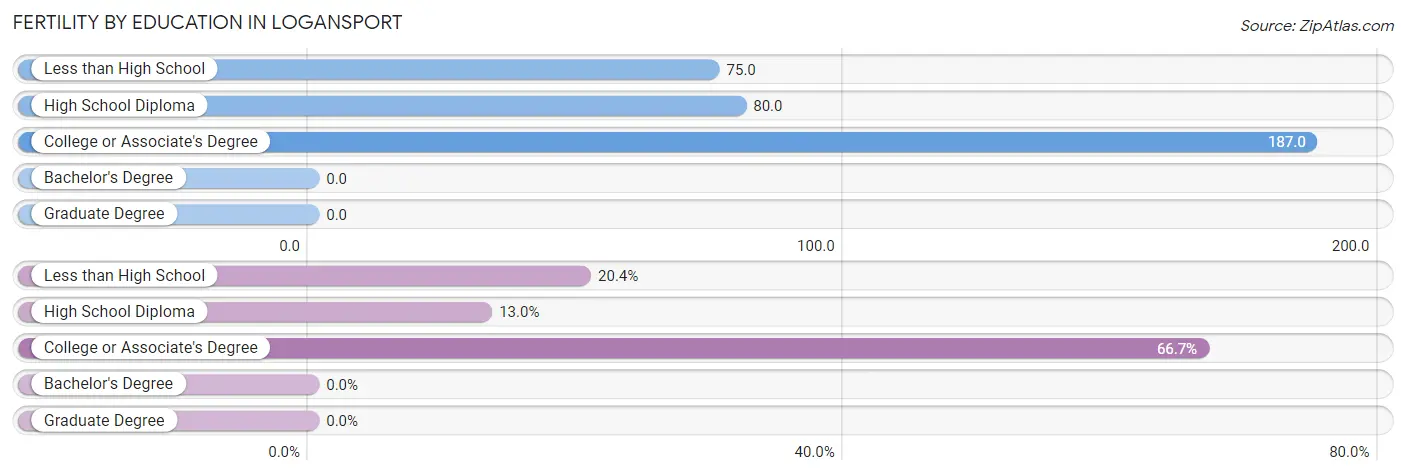
| Educational Attainment | Women with Births | Births / 1,000 Women |
| Less than High School | 11 (20.4%) | 75.0 |
| High School Diploma | 7 (13.0%) | 80.0 |
| College or Associate's Degree | 36 (66.7%) | 187.0 |
| Bachelor's Degree | 0 (0.0%) | 0.0 |
| Graduate Degree | 0 (0.0%) | 0.0 |
| Total | 54 (100.0%) | 118.0 |
Fertility by Education by Marriage Status in Logansport
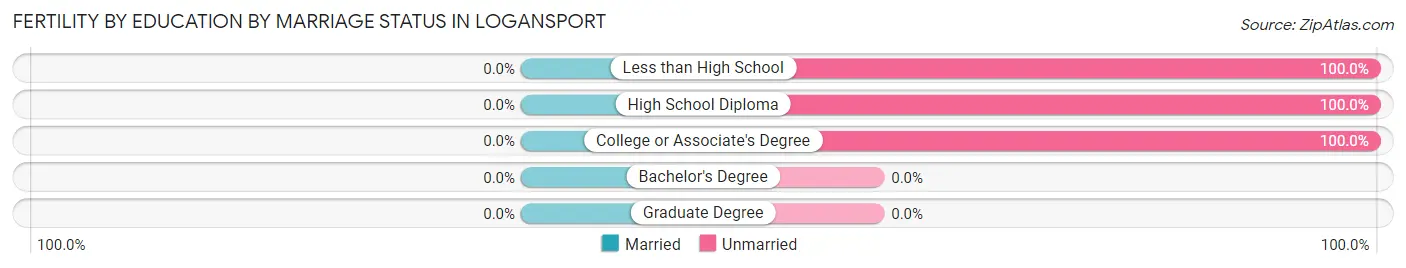
| Educational Attainment | Married | Unmarried |
| Less than High School | 0 (0.0%) | 11 (100.0%) |
| High School Diploma | 0 (0.0%) | 7 (100.0%) |
| College or Associate's Degree | 0 (0.0%) | 36 (100.0%) |
| Bachelor's Degree | 0 (0.0%) | 0 (0.0%) |
| Graduate Degree | 0 (0.0%) | 0 (0.0%) |
| Total | 0 (0.0%) | 54 (100.0%) |
Employment Characteristics in Logansport
Employment by Class of Employer in Logansport
Among the 611 employed individuals in Logansport, private company employees (438 | 71.7%), local government employees (68 | 11.1%), and state government employees (45 | 7.4%) make up the most common classes of employment.
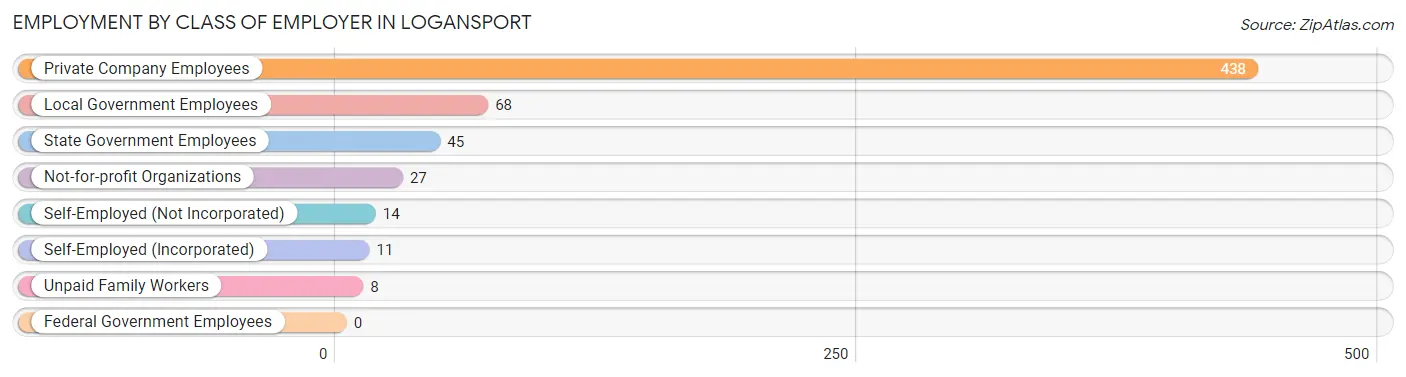
| Employer Class | # Employees | % Employees |
| Private Company Employees | 438 | 71.7% |
| Self-Employed (Incorporated) | 11 | 1.8% |
| Self-Employed (Not Incorporated) | 14 | 2.3% |
| Not-for-profit Organizations | 27 | 4.4% |
| Local Government Employees | 68 | 11.1% |
| State Government Employees | 45 | 7.4% |
| Federal Government Employees | 0 | 0.0% |
| Unpaid Family Workers | 8 | 1.3% |
| Total | 611 | 100.0% |
Employment Status by Age in Logansport
According to the labor force statistics for Logansport, out of the total population over 16 years of age (1,294), 52.9% or 685 individuals are in the labor force, with 7.9% or 54 of them unemployed. The age group with the highest labor force participation rate is 30 to 34 years, with 91.2% or 114 individuals in the labor force. Within the labor force, the 35 to 44 years age range has the highest percentage of unemployed individuals, with 23.4% or 39 of them being unemployed.
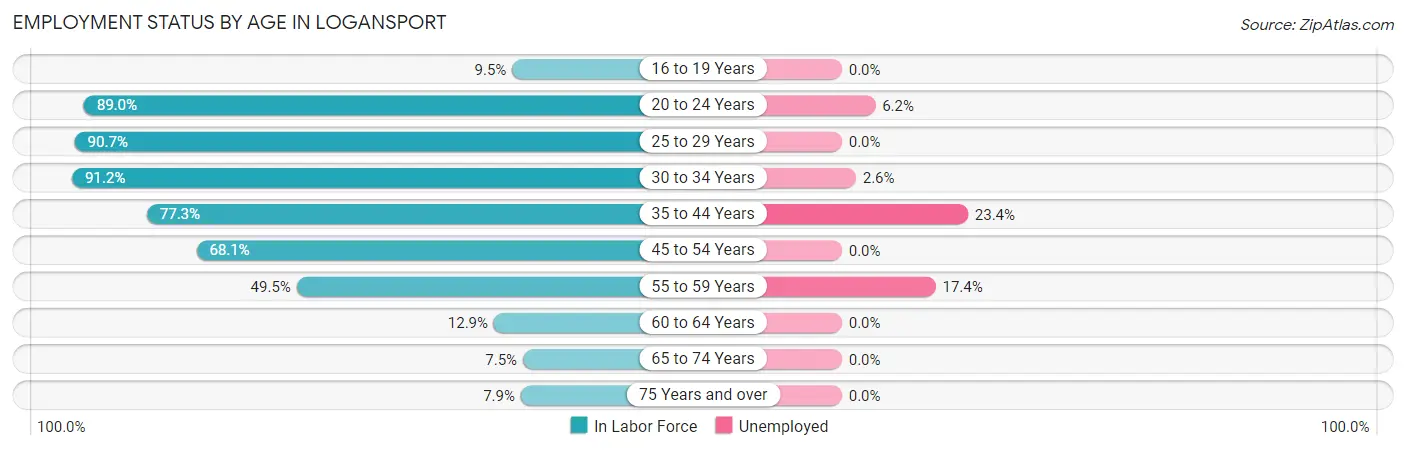
| Age Bracket | In Labor Force | Unemployed |
| 16 to 19 Years | 14 (9.5%) | 0 (0.0%) |
| 20 to 24 Years | 65 (89.0%) | 4 (6.2%) |
| 25 to 29 Years | 107 (90.7%) | 0 (0.0%) |
| 30 to 34 Years | 114 (91.2%) | 3 (2.6%) |
| 35 to 44 Years | 167 (77.3%) | 39 (23.4%) |
| 45 to 54 Years | 145 (68.1%) | 0 (0.0%) |
| 55 to 59 Years | 46 (49.5%) | 8 (17.4%) |
| 60 to 64 Years | 8 (12.9%) | 0 (0.0%) |
| 65 to 74 Years | 8 (7.5%) | 0 (0.0%) |
| 75 Years and over | 11 (7.9%) | 0 (0.0%) |
| Total | 685 (52.9%) | 54 (7.9%) |
Employment Status by Educational Attainment in Logansport
According to labor force statistics for Logansport, 71.0% of individuals (587) out of the total population between 25 and 64 years of age (827) are in the labor force, with 8.5% or 50 of them being unemployed. The group with the highest labor force participation rate are those with the educational attainment of bachelor's degree or higher, with 87.1% or 54 individuals in the labor force. Within the labor force, individuals with less than high school education have the highest percentage of unemployment, with 11.9% or 23 of them being unemployed.
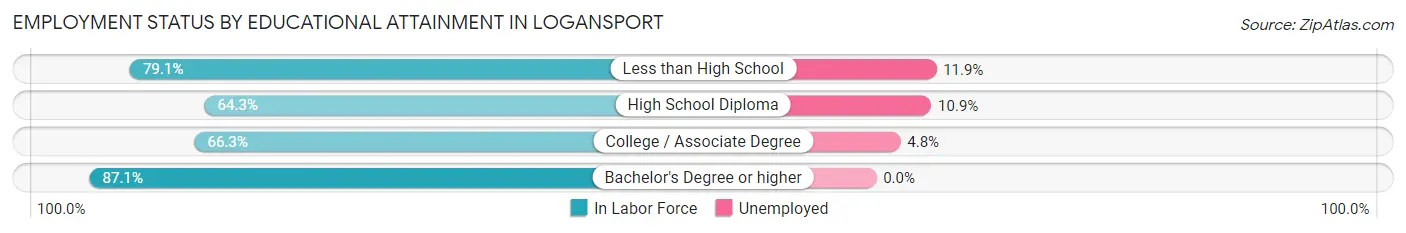
| Educational Attainment | In Labor Force | Unemployed |
| Less than High School | 193 (79.1%) | 29 (11.9%) |
| High School Diploma | 175 (64.3%) | 30 (10.9%) |
| College / Associate Degree | 165 (66.3%) | 12 (4.8%) |
| Bachelor's Degree or higher | 54 (87.1%) | 0 (0.0%) |
| Total | 587 (71.0%) | 70 (8.5%) |
Employment Occupations by Sex in Logansport
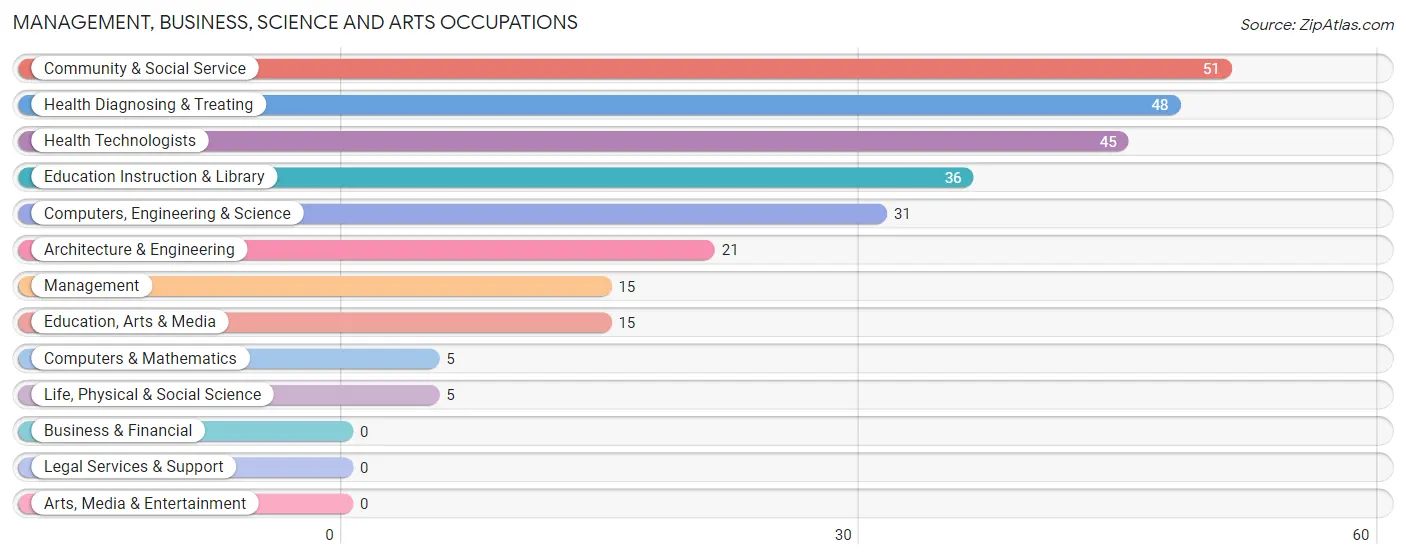
Management, Business, Science and Arts Occupations
The most common Management, Business, Science and Arts occupations in Logansport are Community & Social Service (51 | 8.1%), Health Diagnosing & Treating (48 | 7.6%), Health Technologists (45 | 7.1%), Education Instruction & Library (36 | 5.7%), and Computers, Engineering & Science (31 | 4.9%).
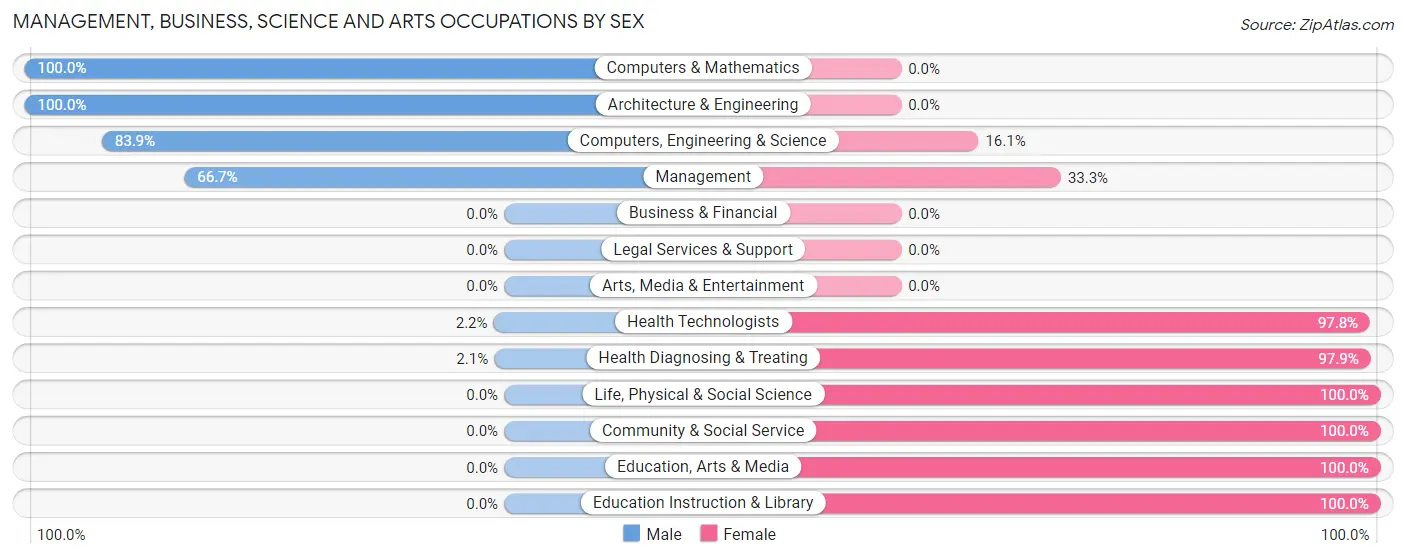
Management, Business, Science and Arts Occupations by Sex
Within the Management, Business, Science and Arts occupations in Logansport, the most male-oriented occupations are Computers & Mathematics (100.0%), Architecture & Engineering (100.0%), and Computers, Engineering & Science (83.9%), while the most female-oriented occupations are Life, Physical & Social Science (100.0%), Community & Social Service (100.0%), and Education, Arts & Media (100.0%).
| Occupation | Male | Female |
| Management | 10 (66.7%) | 5 (33.3%) |
| Business & Financial | 0 (0.0%) | 0 (0.0%) |
| Computers, Engineering & Science | 26 (83.9%) | 5 (16.1%) |
| Computers & Mathematics | 5 (100.0%) | 0 (0.0%) |
| Architecture & Engineering | 21 (100.0%) | 0 (0.0%) |
| Life, Physical & Social Science | 0 (0.0%) | 5 (100.0%) |
| Community & Social Service | 0 (0.0%) | 51 (100.0%) |
| Education, Arts & Media | 0 (0.0%) | 15 (100.0%) |
| Legal Services & Support | 0 (0.0%) | 0 (0.0%) |
| Education Instruction & Library | 0 (0.0%) | 36 (100.0%) |
| Arts, Media & Entertainment | 0 (0.0%) | 0 (0.0%) |
| Health Diagnosing & Treating | 1 (2.1%) | 47 (97.9%) |
| Health Technologists | 1 (2.2%) | 44 (97.8%) |
| Total (Category) | 37 (25.5%) | 108 (74.5%) |
| Total (Overall) | 223 (35.3%) | 408 (64.7%) |
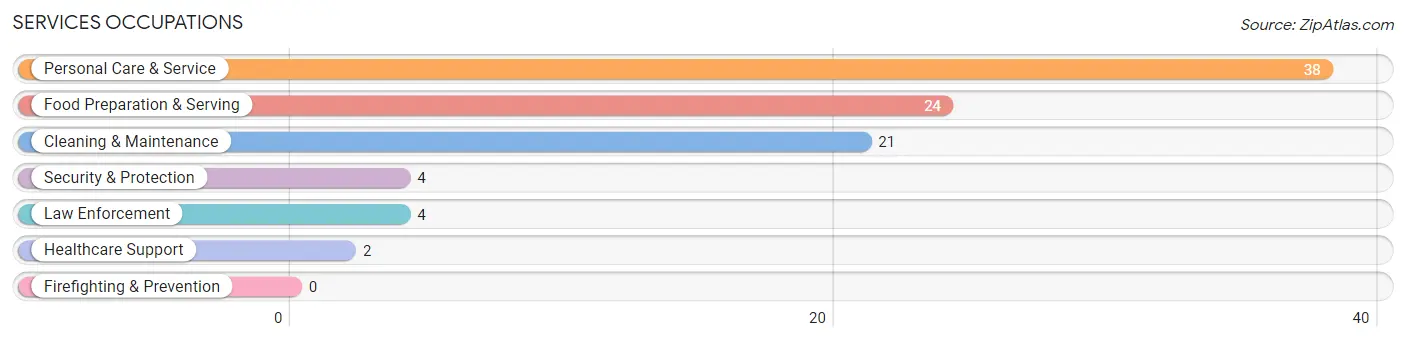
Services Occupations
The most common Services occupations in Logansport are Personal Care & Service (38 | 6.0%), Food Preparation & Serving (24 | 3.8%), Cleaning & Maintenance (21 | 3.3%), Security & Protection (4 | 0.6%), and Law Enforcement (4 | 0.6%).
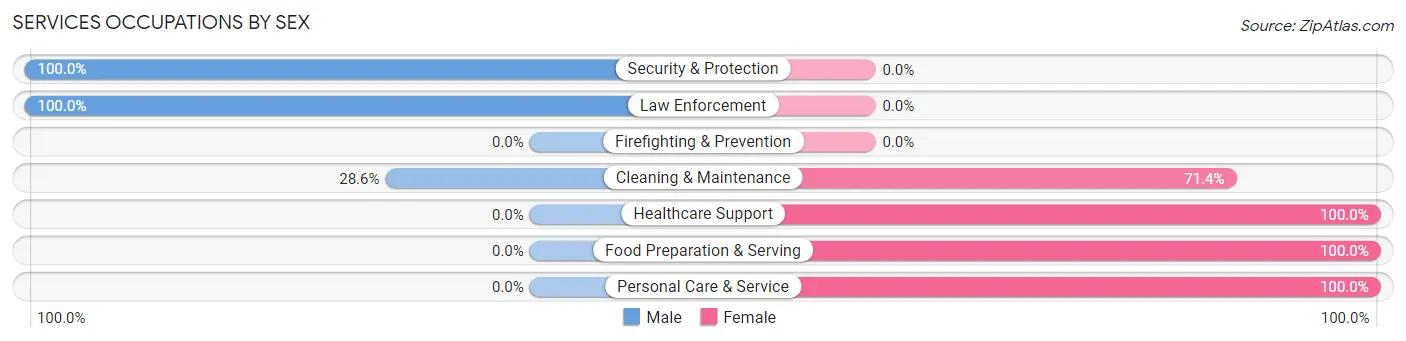
Services Occupations by Sex
Within the Services occupations in Logansport, the most male-oriented occupations are Security & Protection (100.0%), Law Enforcement (100.0%), and Cleaning & Maintenance (28.6%), while the most female-oriented occupations are Healthcare Support (100.0%), Food Preparation & Serving (100.0%), and Personal Care & Service (100.0%).
| Occupation | Male | Female |
| Healthcare Support | 0 (0.0%) | 2 (100.0%) |
| Security & Protection | 4 (100.0%) | 0 (0.0%) |
| Firefighting & Prevention | 0 (0.0%) | 0 (0.0%) |
| Law Enforcement | 4 (100.0%) | 0 (0.0%) |
| Food Preparation & Serving | 0 (0.0%) | 24 (100.0%) |
| Cleaning & Maintenance | 6 (28.6%) | 15 (71.4%) |
| Personal Care & Service | 0 (0.0%) | 38 (100.0%) |
| Total (Category) | 10 (11.2%) | 79 (88.8%) |
| Total (Overall) | 223 (35.3%) | 408 (64.7%) |
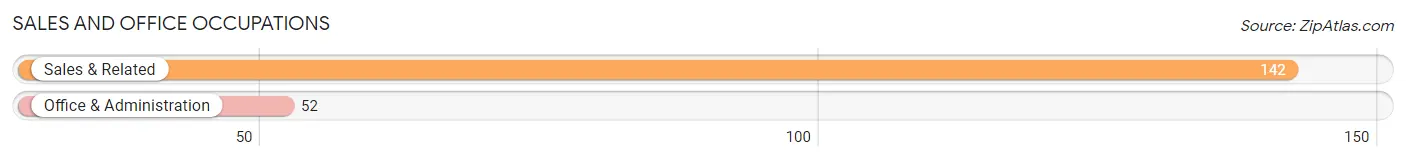
Sales and Office Occupations
The most common Sales and Office occupations in Logansport are Sales & Related (142 | 22.5%), and Office & Administration (52 | 8.2%).
Sales and Office Occupations by Sex
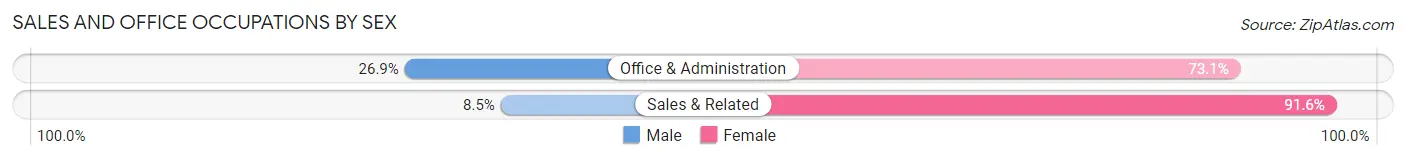
| Occupation | Male | Female |
| Sales & Related | 12 (8.5%) | 130 (91.5%) |
| Office & Administration | 14 (26.9%) | 38 (73.1%) |
| Total (Category) | 26 (13.4%) | 168 (86.6%) |
| Total (Overall) | 223 (35.3%) | 408 (64.7%) |
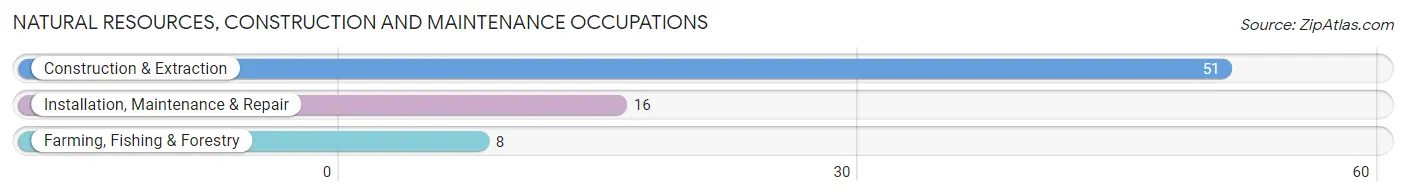
Natural Resources, Construction and Maintenance Occupations
The most common Natural Resources, Construction and Maintenance occupations in Logansport are Construction & Extraction (51 | 8.1%), Installation, Maintenance & Repair (16 | 2.5%), and Farming, Fishing & Forestry (8 | 1.3%).
Natural Resources, Construction and Maintenance Occupations by Sex
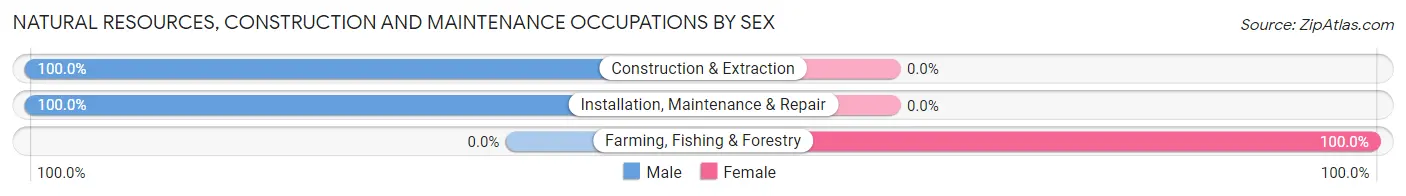
| Occupation | Male | Female |
| Farming, Fishing & Forestry | 0 (0.0%) | 8 (100.0%) |
| Construction & Extraction | 51 (100.0%) | 0 (0.0%) |
| Installation, Maintenance & Repair | 16 (100.0%) | 0 (0.0%) |
| Total (Category) | 67 (89.3%) | 8 (10.7%) |
| Total (Overall) | 223 (35.3%) | 408 (64.7%) |
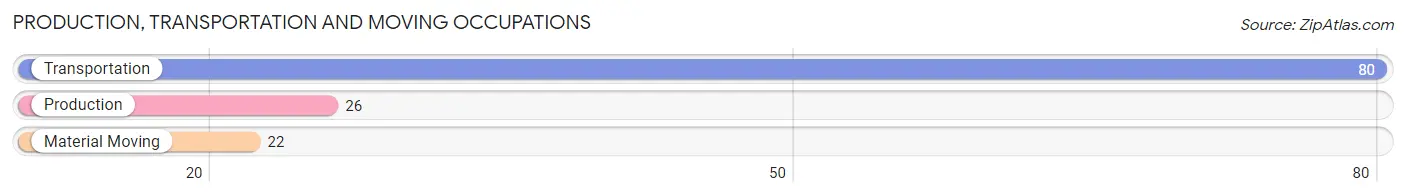
Production, Transportation and Moving Occupations
The most common Production, Transportation and Moving occupations in Logansport are Transportation (80 | 12.7%), Production (26 | 4.1%), and Material Moving (22 | 3.5%).
Production, Transportation and Moving Occupations by Sex
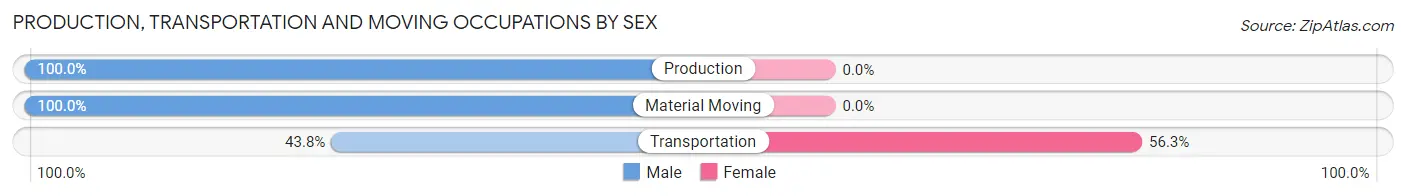
| Occupation | Male | Female |
| Production | 26 (100.0%) | 0 (0.0%) |
| Transportation | 35 (43.8%) | 45 (56.2%) |
| Material Moving | 22 (100.0%) | 0 (0.0%) |
| Total (Category) | 83 (64.8%) | 45 (35.2%) |
| Total (Overall) | 223 (35.3%) | 408 (64.7%) |
Employment Industries by Sex in Logansport
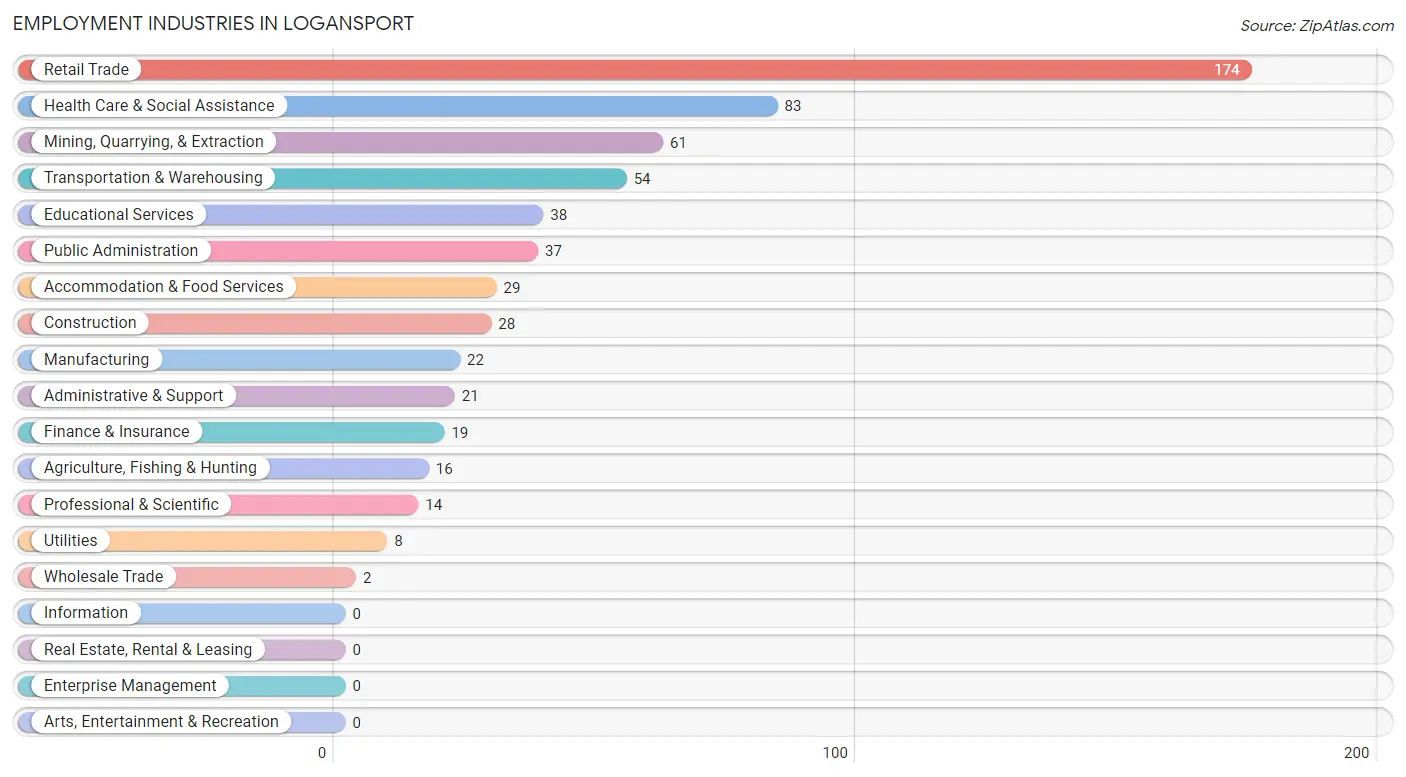
Employment Industries in Logansport
The major employment industries in Logansport include Retail Trade (174 | 27.6%), Health Care & Social Assistance (83 | 13.2%), Mining, Quarrying, & Extraction (61 | 9.7%), Transportation & Warehousing (54 | 8.6%), and Educational Services (38 | 6.0%).
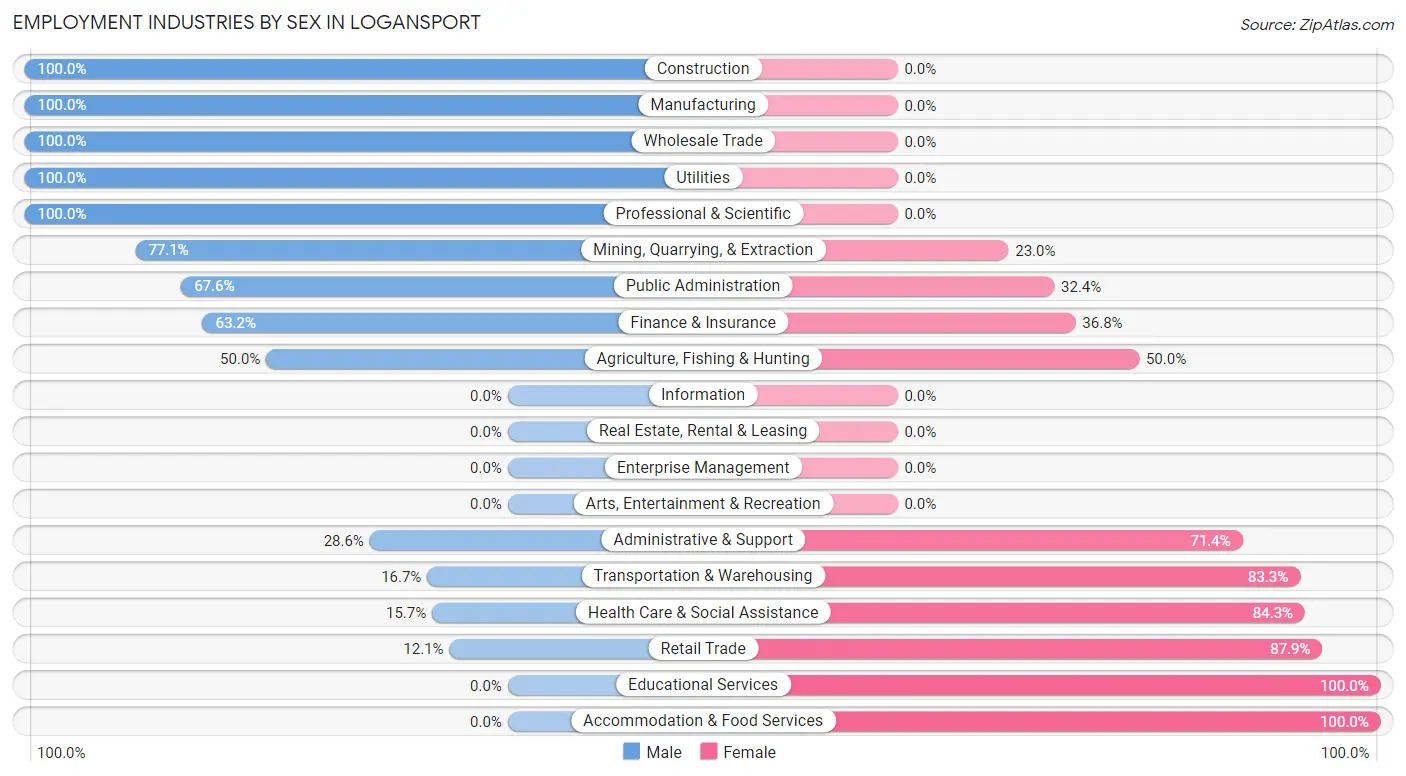
Employment Industries by Sex in Logansport
The Logansport industries that see more men than women are Construction (100.0%), Manufacturing (100.0%), and Wholesale Trade (100.0%), whereas the industries that tend to have a higher number of women are Educational Services (100.0%), Accommodation & Food Services (100.0%), and Retail Trade (87.9%).
| Industry | Male | Female |
| Agriculture, Fishing & Hunting | 8 (50.0%) | 8 (50.0%) |
| Mining, Quarrying, & Extraction | 47 (77.0%) | 14 (23.0%) |
| Construction | 28 (100.0%) | 0 (0.0%) |
| Manufacturing | 22 (100.0%) | 0 (0.0%) |
| Wholesale Trade | 2 (100.0%) | 0 (0.0%) |
| Retail Trade | 21 (12.1%) | 153 (87.9%) |
| Transportation & Warehousing | 9 (16.7%) | 45 (83.3%) |
| Utilities | 8 (100.0%) | 0 (0.0%) |
| Information | 0 (0.0%) | 0 (0.0%) |
| Finance & Insurance | 12 (63.2%) | 7 (36.8%) |
| Real Estate, Rental & Leasing | 0 (0.0%) | 0 (0.0%) |
| Professional & Scientific | 14 (100.0%) | 0 (0.0%) |
| Enterprise Management | 0 (0.0%) | 0 (0.0%) |
| Administrative & Support | 6 (28.6%) | 15 (71.4%) |
| Educational Services | 0 (0.0%) | 38 (100.0%) |
| Health Care & Social Assistance | 13 (15.7%) | 70 (84.3%) |
| Arts, Entertainment & Recreation | 0 (0.0%) | 0 (0.0%) |
| Accommodation & Food Services | 0 (0.0%) | 29 (100.0%) |
| Public Administration | 25 (67.6%) | 12 (32.4%) |
| Total | 223 (35.3%) | 408 (64.7%) |
Education in Logansport
School Enrollment in Logansport
The most common levels of schooling among the 693 students in Logansport are elementary school (204 | 29.4%), middle school (171 | 24.7%), and high school (150 | 21.6%).
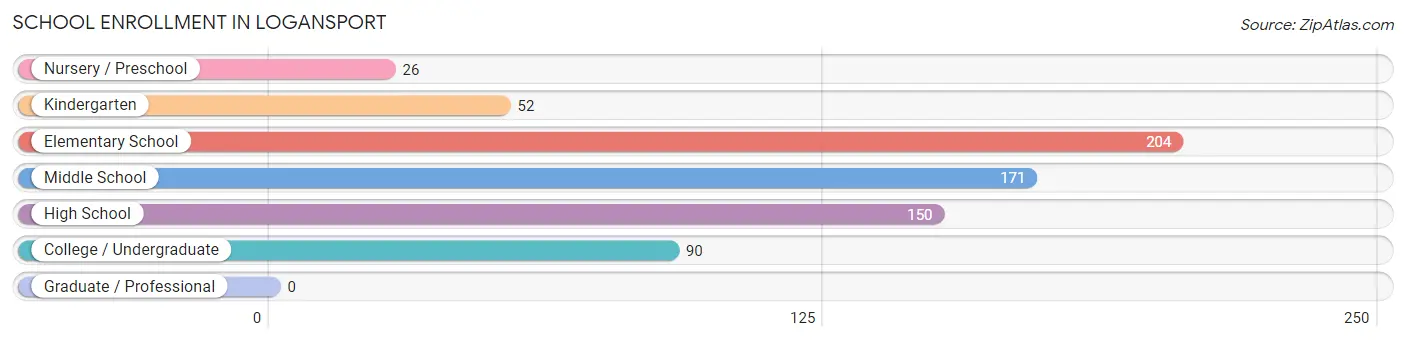
| School Level | # Students | % Students |
| Nursery / Preschool | 26 | 3.7% |
| Kindergarten | 52 | 7.5% |
| Elementary School | 204 | 29.4% |
| Middle School | 171 | 24.7% |
| High School | 150 | 21.6% |
| College / Undergraduate | 90 | 13.0% |
| Graduate / Professional | 0 | 0.0% |
| Total | 693 | 100.0% |
School Enrollment by Age by Funding Source in Logansport
Out of a total of 693 students who are enrolled in schools in Logansport, 33 (4.8%) attend a private institution, while the remaining 660 (95.2%) are enrolled in public schools. The age group of 25 to 34 year olds has the highest likelihood of being enrolled in private schools, with 5 (7.2% in the age bracket) enrolled. Conversely, the age group of 3 to 4 year olds has the lowest likelihood of being enrolled in a private school, with 26 (100.0% in the age bracket) attending a public institution.
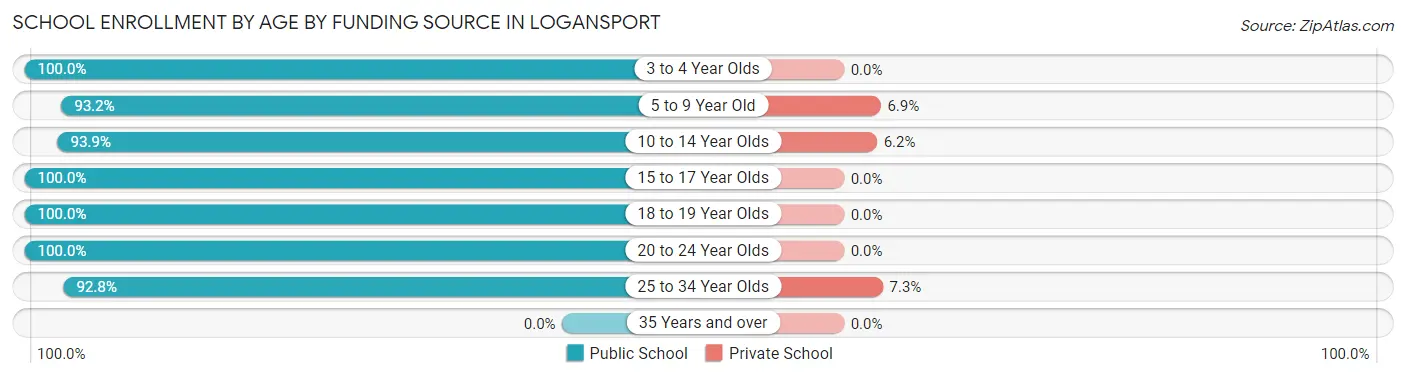
| Age Bracket | Public School | Private School |
| 3 to 4 Year Olds | 26 (100.0%) | 0 (0.0%) |
| 5 to 9 Year Old | 231 (93.1%) | 17 (6.9%) |
| 10 to 14 Year Olds | 168 (93.9%) | 11 (6.1%) |
| 15 to 17 Year Olds | 111 (100.0%) | 0 (0.0%) |
| 18 to 19 Year Olds | 51 (100.0%) | 0 (0.0%) |
| 20 to 24 Year Olds | 9 (100.0%) | 0 (0.0%) |
| 25 to 34 Year Olds | 64 (92.7%) | 5 (7.2%) |
| 35 Years and over | 0 (0.0%) | 0 (0.0%) |
| Total | 660 (95.2%) | 33 (4.8%) |
Educational Attainment by Field of Study in Logansport
Education (54 | 62.1%), bio, nature & agricultural (10 | 11.5%), communications (9 | 10.3%), social sciences (6 | 6.9%), and science & technology (3 | 3.5%) are the most common fields of study among 87 individuals in Logansport who have obtained a bachelor's degree or higher.
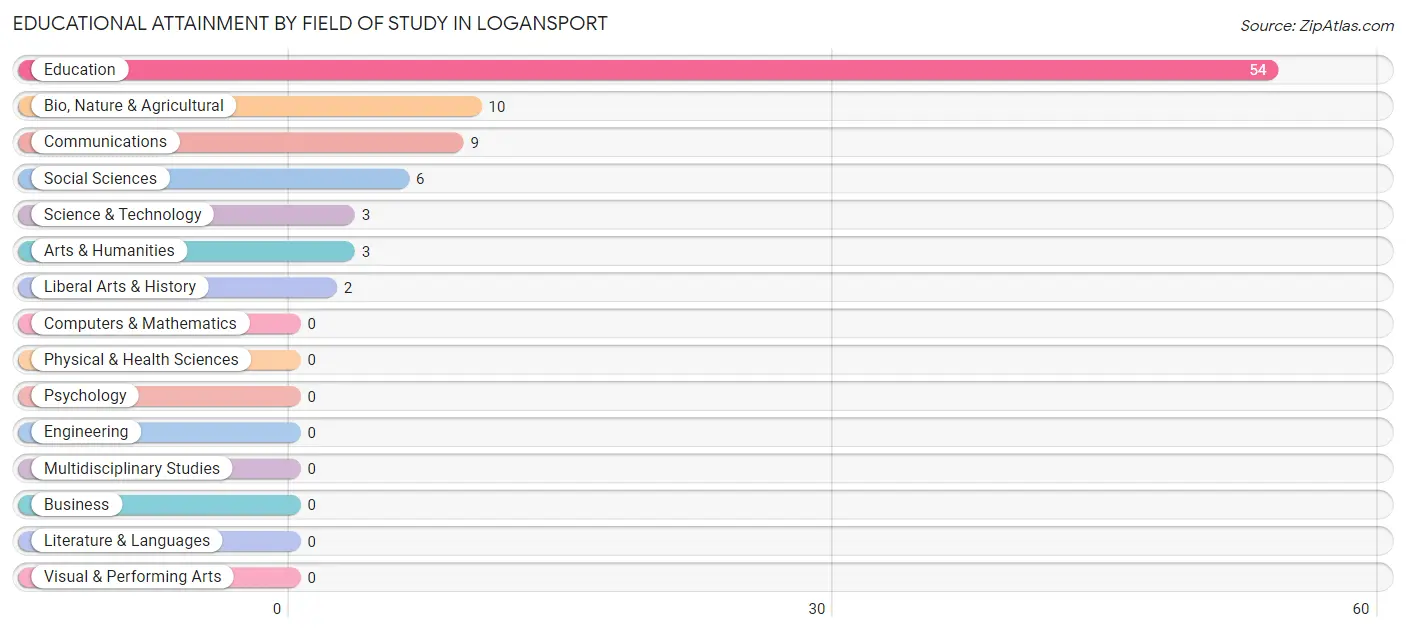
| Field of Study | # Graduates | % Graduates |
| Computers & Mathematics | 0 | 0.0% |
| Bio, Nature & Agricultural | 10 | 11.5% |
| Physical & Health Sciences | 0 | 0.0% |
| Psychology | 0 | 0.0% |
| Social Sciences | 6 | 6.9% |
| Engineering | 0 | 0.0% |
| Multidisciplinary Studies | 0 | 0.0% |
| Science & Technology | 3 | 3.5% |
| Business | 0 | 0.0% |
| Education | 54 | 62.1% |
| Literature & Languages | 0 | 0.0% |
| Liberal Arts & History | 2 | 2.3% |
| Visual & Performing Arts | 0 | 0.0% |
| Communications | 9 | 10.3% |
| Arts & Humanities | 3 | 3.5% |
| Total | 87 | 100.0% |
Transportation & Commute in Logansport
Vehicle Availability by Sex in Logansport
The most prevalent vehicle ownership categories in Logansport are males with 2 vehicles (99, accounting for 45.4%) and females with 2 vehicles (187, making up 25.2%).
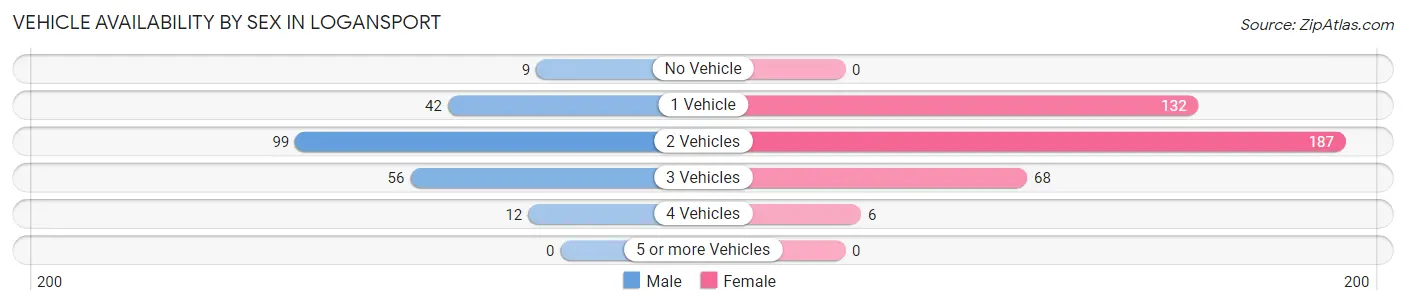
| Vehicles Available | Male | Female |
| No Vehicle | 9 (4.1%) | 0 (0.0%) |
| 1 Vehicle | 42 (19.3%) | 132 (33.6%) |
| 2 Vehicles | 99 (45.4%) | 187 (47.6%) |
| 3 Vehicles | 56 (25.7%) | 68 (17.3%) |
| 4 Vehicles | 12 (5.5%) | 6 (1.5%) |
| 5 or more Vehicles | 0 (0.0%) | 0 (0.0%) |
| Total | 218 (100.0%) | 393 (100.0%) |
Commute Time in Logansport
The most frequently occuring commute durations in Logansport are 5 to 9 minutes (180 commuters, 31.4%), 15 to 19 minutes (108 commuters, 18.9%), and 30 to 34 minutes (63 commuters, 11.0%).
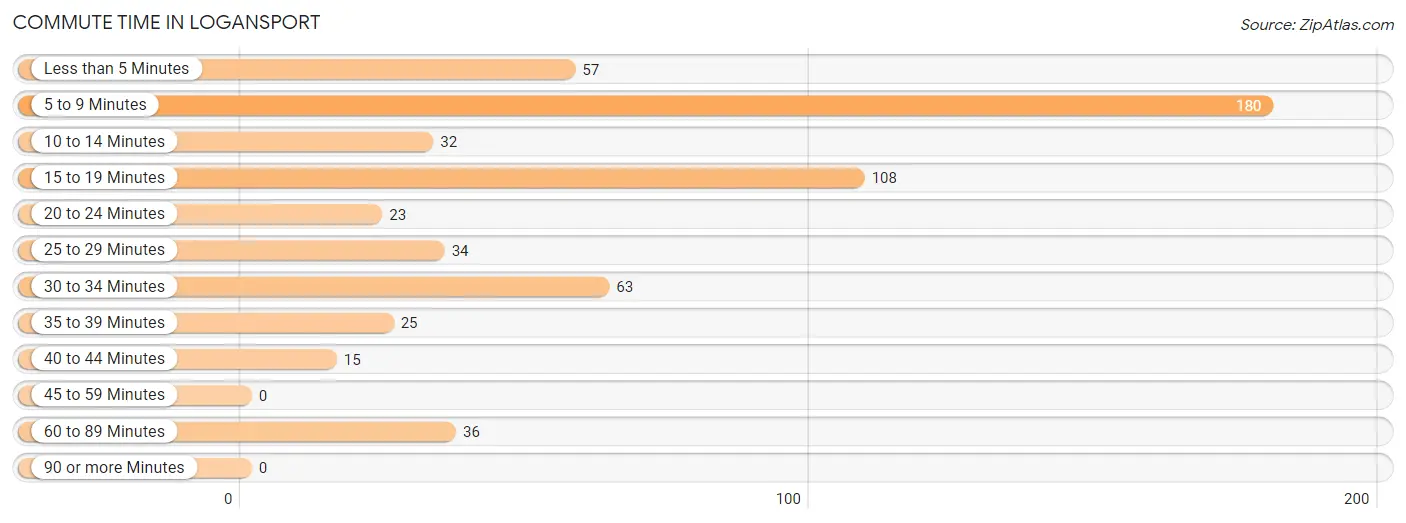
| Commute Time | # Commuters | % Commuters |
| Less than 5 Minutes | 57 | 10.0% |
| 5 to 9 Minutes | 180 | 31.4% |
| 10 to 14 Minutes | 32 | 5.6% |
| 15 to 19 Minutes | 108 | 18.9% |
| 20 to 24 Minutes | 23 | 4.0% |
| 25 to 29 Minutes | 34 | 5.9% |
| 30 to 34 Minutes | 63 | 11.0% |
| 35 to 39 Minutes | 25 | 4.4% |
| 40 to 44 Minutes | 15 | 2.6% |
| 45 to 59 Minutes | 0 | 0.0% |
| 60 to 89 Minutes | 36 | 6.3% |
| 90 or more Minutes | 0 | 0.0% |
Commute Time by Sex in Logansport
The most common commute times in Logansport are 30 to 34 minutes (40 commuters, 20.5%) for males and 5 to 9 minutes (159 commuters, 42.1%) for females.
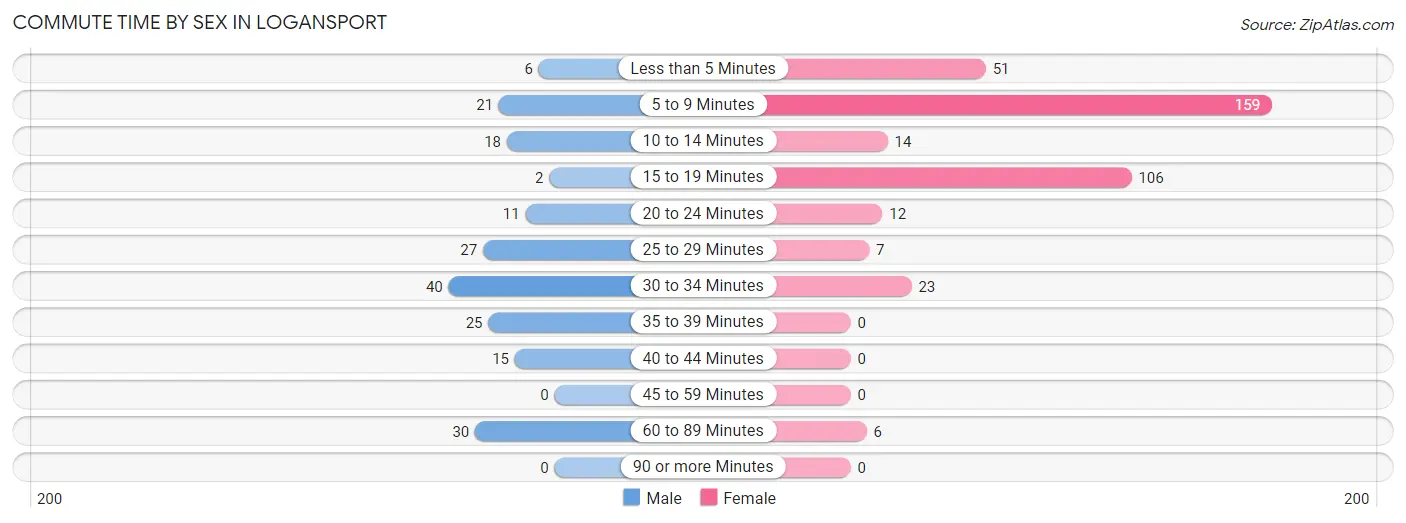
| Commute Time | Male | Female |
| Less than 5 Minutes | 6 (3.1%) | 51 (13.5%) |
| 5 to 9 Minutes | 21 (10.8%) | 159 (42.1%) |
| 10 to 14 Minutes | 18 (9.2%) | 14 (3.7%) |
| 15 to 19 Minutes | 2 (1.0%) | 106 (28.0%) |
| 20 to 24 Minutes | 11 (5.6%) | 12 (3.2%) |
| 25 to 29 Minutes | 27 (13.9%) | 7 (1.8%) |
| 30 to 34 Minutes | 40 (20.5%) | 23 (6.1%) |
| 35 to 39 Minutes | 25 (12.8%) | 0 (0.0%) |
| 40 to 44 Minutes | 15 (7.7%) | 0 (0.0%) |
| 45 to 59 Minutes | 0 (0.0%) | 0 (0.0%) |
| 60 to 89 Minutes | 30 (15.4%) | 6 (1.6%) |
| 90 or more Minutes | 0 (0.0%) | 0 (0.0%) |
Time of Departure to Work by Sex in Logansport
The most frequent times of departure to work in Logansport are 5:30 AM to 5:59 AM (36, 18.5%) for males and 12:00 PM to 3:59 PM (89, 23.5%) for females.
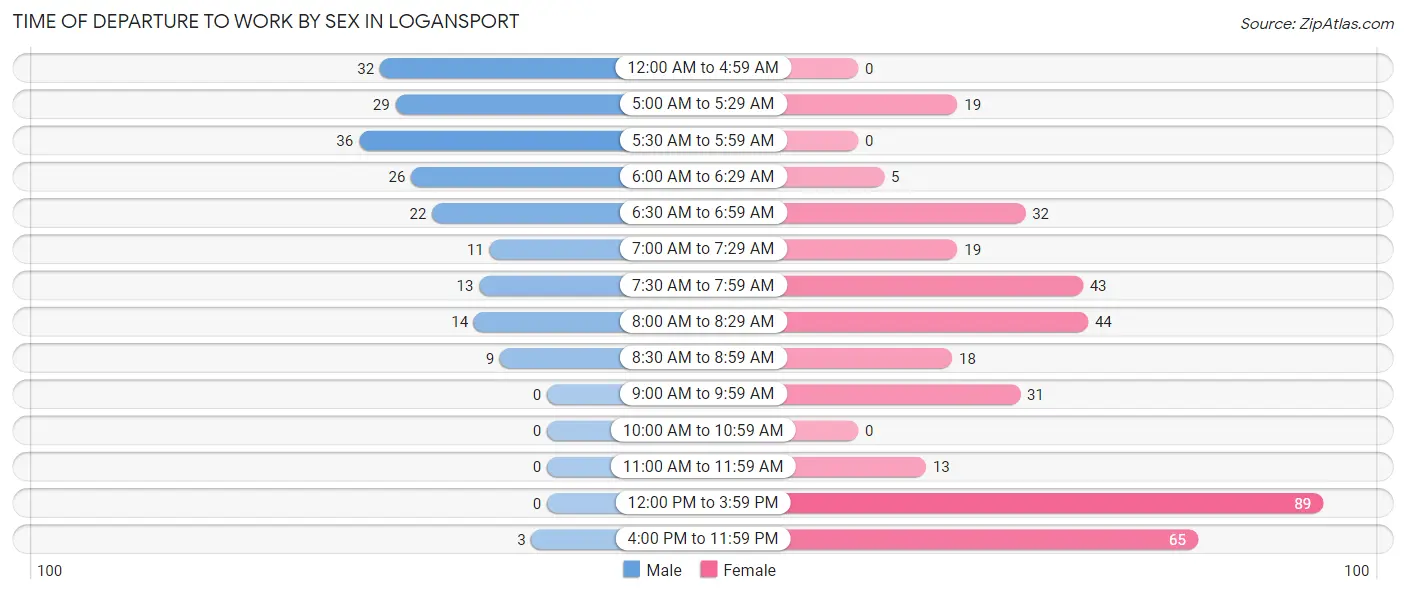
| Time of Departure | Male | Female |
| 12:00 AM to 4:59 AM | 32 (16.4%) | 0 (0.0%) |
| 5:00 AM to 5:29 AM | 29 (14.9%) | 19 (5.0%) |
| 5:30 AM to 5:59 AM | 36 (18.5%) | 0 (0.0%) |
| 6:00 AM to 6:29 AM | 26 (13.3%) | 5 (1.3%) |
| 6:30 AM to 6:59 AM | 22 (11.3%) | 32 (8.5%) |
| 7:00 AM to 7:29 AM | 11 (5.6%) | 19 (5.0%) |
| 7:30 AM to 7:59 AM | 13 (6.7%) | 43 (11.4%) |
| 8:00 AM to 8:29 AM | 14 (7.2%) | 44 (11.6%) |
| 8:30 AM to 8:59 AM | 9 (4.6%) | 18 (4.8%) |
| 9:00 AM to 9:59 AM | 0 (0.0%) | 31 (8.2%) |
| 10:00 AM to 10:59 AM | 0 (0.0%) | 0 (0.0%) |
| 11:00 AM to 11:59 AM | 0 (0.0%) | 13 (3.4%) |
| 12:00 PM to 3:59 PM | 0 (0.0%) | 89 (23.5%) |
| 4:00 PM to 11:59 PM | 3 (1.5%) | 65 (17.2%) |
| Total | 195 (100.0%) | 378 (100.0%) |
Housing Occupancy in Logansport
Occupancy by Ownership in Logansport
Of the total 627 dwellings in Logansport, owner-occupied units account for 313 (49.9%), while renter-occupied units make up 314 (50.1%).
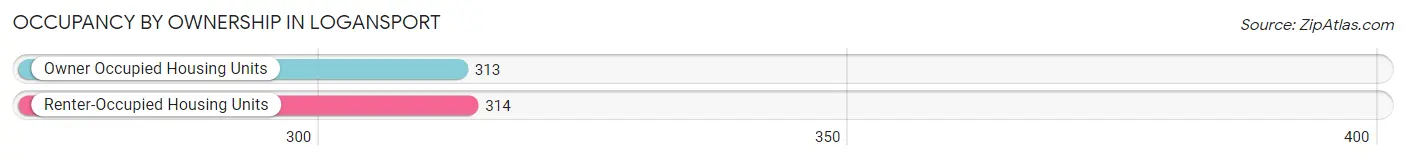
| Occupancy | # Housing Units | % Housing Units |
| Owner Occupied Housing Units | 313 | 49.9% |
| Renter-Occupied Housing Units | 314 | 50.1% |
| Total Occupied Housing Units | 627 | 100.0% |
Occupancy by Household Size in Logansport
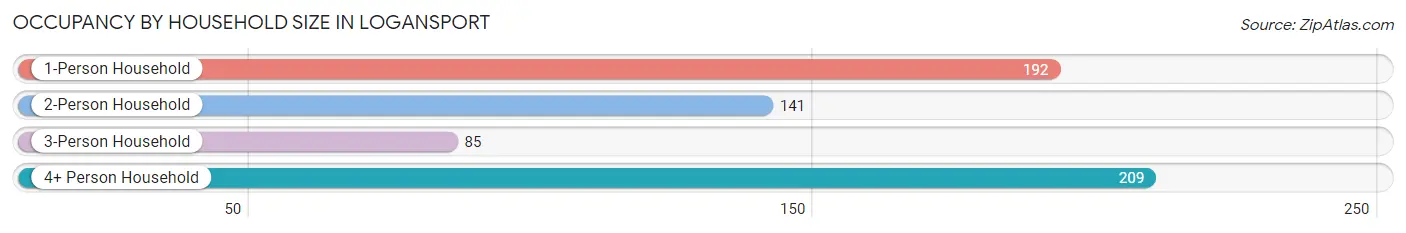
| Household Size | # Housing Units | % Housing Units |
| 1-Person Household | 192 | 30.6% |
| 2-Person Household | 141 | 22.5% |
| 3-Person Household | 85 | 13.6% |
| 4+ Person Household | 209 | 33.3% |
| Total Housing Units | 627 | 100.0% |
Occupancy by Ownership by Household Size in Logansport
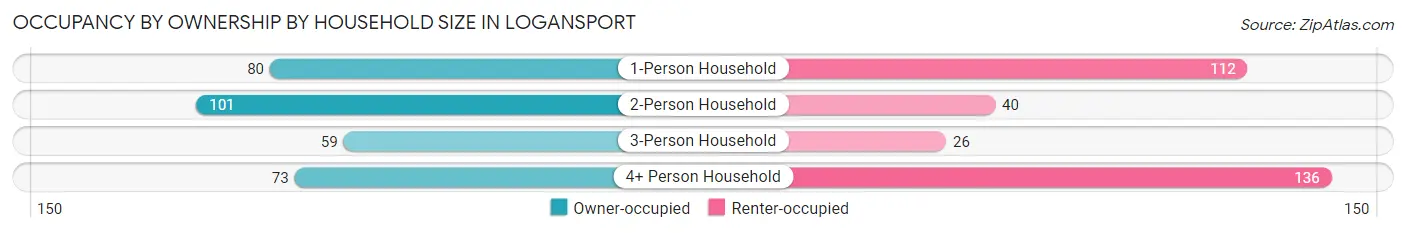
| Household Size | Owner-occupied | Renter-occupied |
| 1-Person Household | 80 (41.7%) | 112 (58.3%) |
| 2-Person Household | 101 (71.6%) | 40 (28.4%) |
| 3-Person Household | 59 (69.4%) | 26 (30.6%) |
| 4+ Person Household | 73 (34.9%) | 136 (65.1%) |
| Total Housing Units | 313 (49.9%) | 314 (50.1%) |
Occupancy by Educational Attainment in Logansport
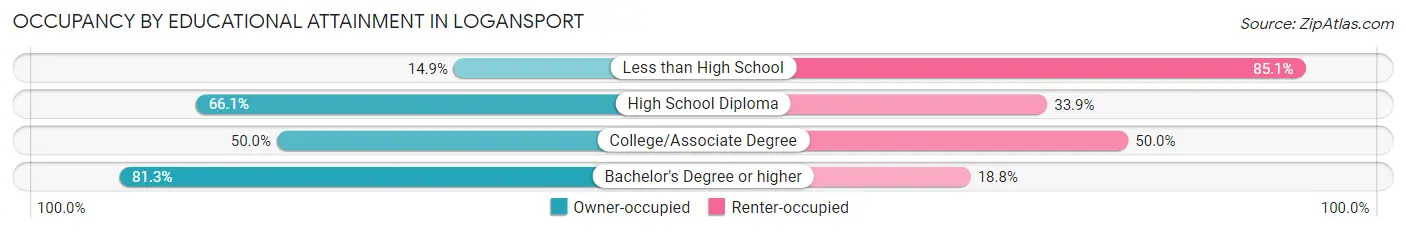
| Household Size | Owner-occupied | Renter-occupied |
| Less than High School | 24 (14.9%) | 137 (85.1%) |
| High School Diploma | 148 (66.1%) | 76 (33.9%) |
| College/Associate Degree | 89 (50.0%) | 89 (50.0%) |
| Bachelor's Degree or higher | 52 (81.2%) | 12 (18.8%) |
Occupancy by Age of Householder in Logansport
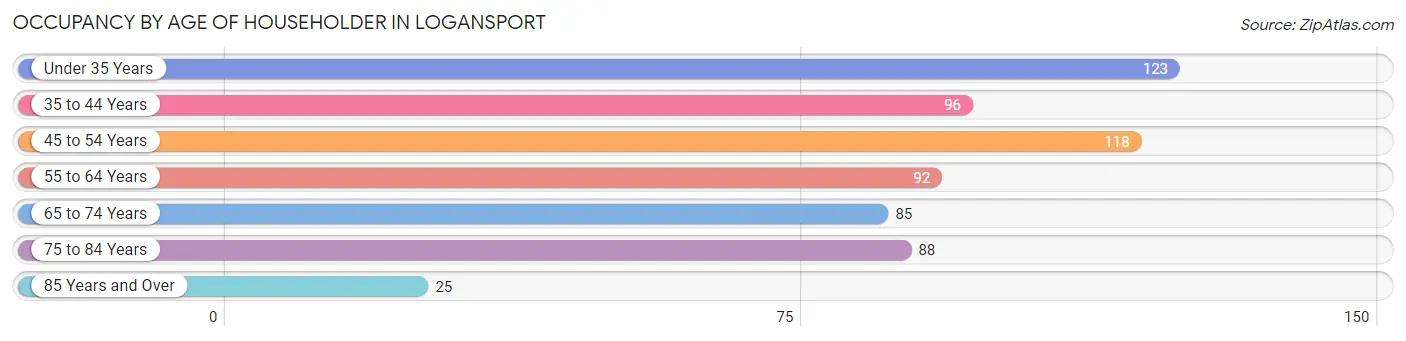
| Age Bracket | # Households | % Households |
| Under 35 Years | 123 | 19.6% |
| 35 to 44 Years | 96 | 15.3% |
| 45 to 54 Years | 118 | 18.8% |
| 55 to 64 Years | 92 | 14.7% |
| 65 to 74 Years | 85 | 13.6% |
| 75 to 84 Years | 88 | 14.0% |
| 85 Years and Over | 25 | 4.0% |
| Total | 627 | 100.0% |
Housing Finances in Logansport
Median Income by Occupancy in Logansport
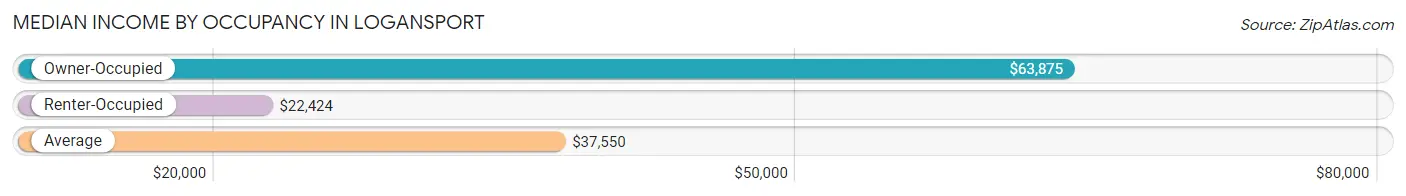
| Occupancy Type | # Households | Median Income |
| Owner-Occupied | 313 (49.9%) | $63,875 |
| Renter-Occupied | 314 (50.1%) | $22,424 |
| Average | 627 (100.0%) | $37,550 |
Occupancy by Householder Income Bracket in Logansport
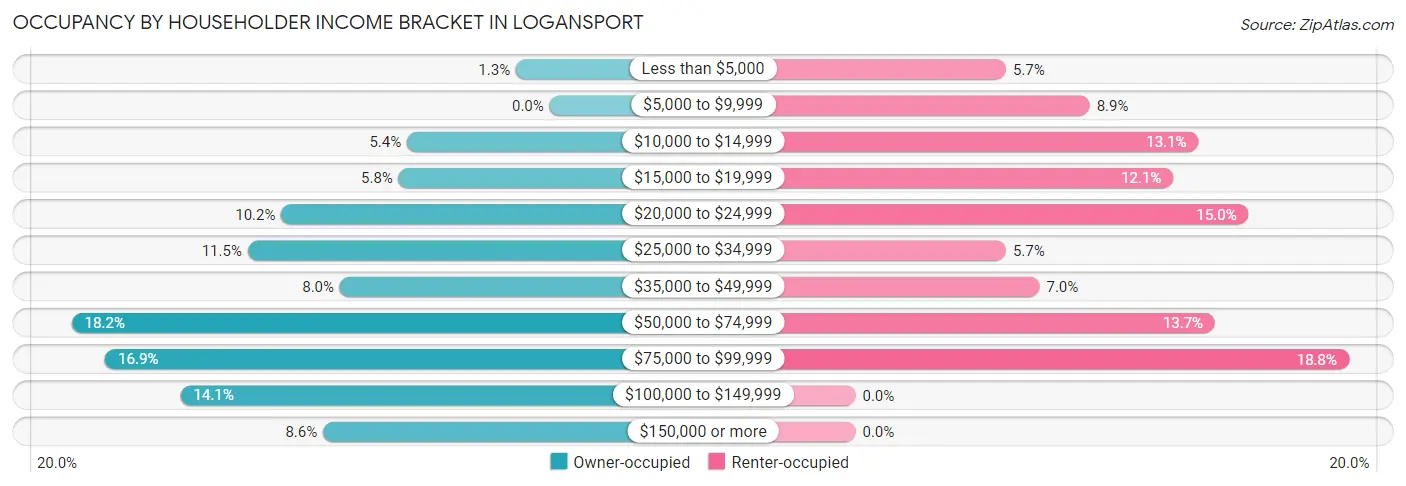
| Income Bracket | Owner-occupied | Renter-occupied |
| Less than $5,000 | 4 (1.3%) | 18 (5.7%) |
| $5,000 to $9,999 | 0 (0.0%) | 28 (8.9%) |
| $10,000 to $14,999 | 17 (5.4%) | 41 (13.1%) |
| $15,000 to $19,999 | 18 (5.8%) | 38 (12.1%) |
| $20,000 to $24,999 | 32 (10.2%) | 47 (15.0%) |
| $25,000 to $34,999 | 36 (11.5%) | 18 (5.7%) |
| $35,000 to $49,999 | 25 (8.0%) | 22 (7.0%) |
| $50,000 to $74,999 | 57 (18.2%) | 43 (13.7%) |
| $75,000 to $99,999 | 53 (16.9%) | 59 (18.8%) |
| $100,000 to $149,999 | 44 (14.1%) | 0 (0.0%) |
| $150,000 or more | 27 (8.6%) | 0 (0.0%) |
| Total | 313 (100.0%) | 314 (100.0%) |
Monthly Housing Cost Tiers in Logansport
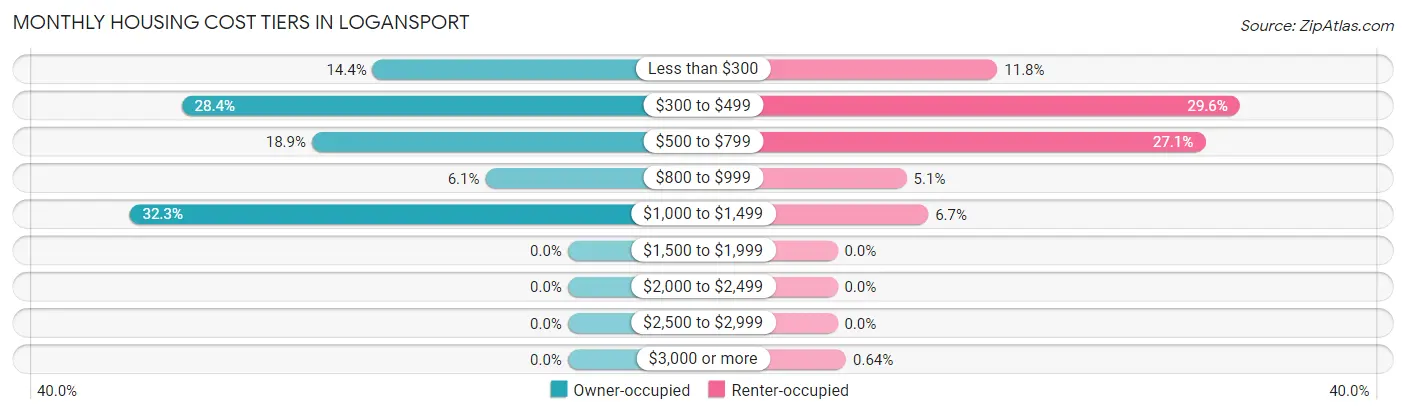
| Monthly Cost | Owner-occupied | Renter-occupied |
| Less than $300 | 45 (14.4%) | 37 (11.8%) |
| $300 to $499 | 89 (28.4%) | 93 (29.6%) |
| $500 to $799 | 59 (18.9%) | 85 (27.1%) |
| $800 to $999 | 19 (6.1%) | 16 (5.1%) |
| $1,000 to $1,499 | 101 (32.3%) | 21 (6.7%) |
| $1,500 to $1,999 | 0 (0.0%) | 0 (0.0%) |
| $2,000 to $2,499 | 0 (0.0%) | 0 (0.0%) |
| $2,500 to $2,999 | 0 (0.0%) | 0 (0.0%) |
| $3,000 or more | 0 (0.0%) | 2 (0.6%) |
| Total | 313 (100.0%) | 314 (100.0%) |
Physical Housing Characteristics in Logansport
Housing Structures in Logansport
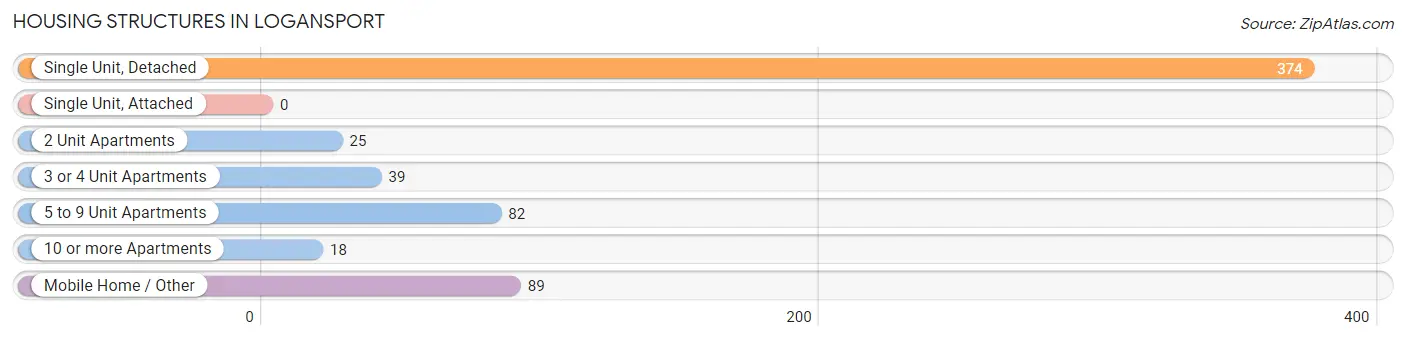
| Structure Type | # Housing Units | % Housing Units |
| Single Unit, Detached | 374 | 59.7% |
| Single Unit, Attached | 0 | 0.0% |
| 2 Unit Apartments | 25 | 4.0% |
| 3 or 4 Unit Apartments | 39 | 6.2% |
| 5 to 9 Unit Apartments | 82 | 13.1% |
| 10 or more Apartments | 18 | 2.9% |
| Mobile Home / Other | 89 | 14.2% |
| Total | 627 | 100.0% |
Housing Structures by Occupancy in Logansport
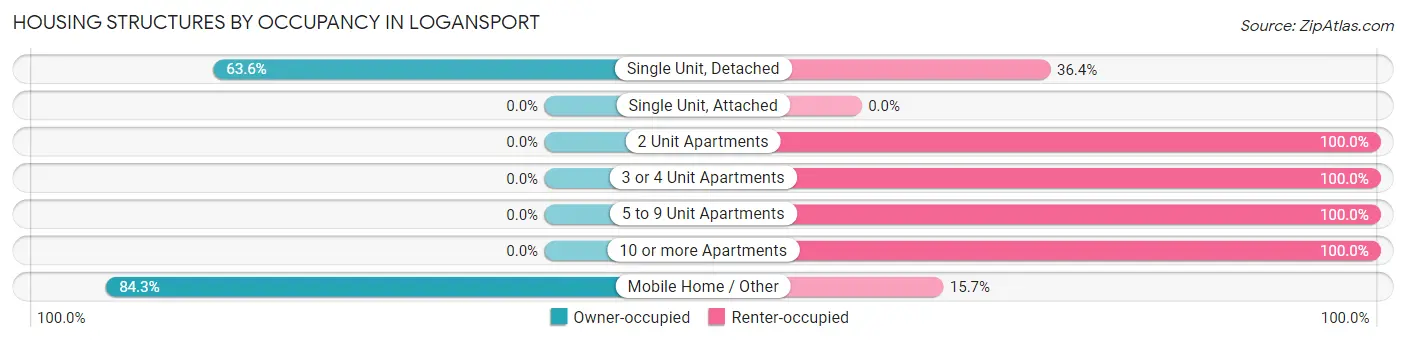
| Structure Type | Owner-occupied | Renter-occupied |
| Single Unit, Detached | 238 (63.6%) | 136 (36.4%) |
| Single Unit, Attached | 0 (0.0%) | 0 (0.0%) |
| 2 Unit Apartments | 0 (0.0%) | 25 (100.0%) |
| 3 or 4 Unit Apartments | 0 (0.0%) | 39 (100.0%) |
| 5 to 9 Unit Apartments | 0 (0.0%) | 82 (100.0%) |
| 10 or more Apartments | 0 (0.0%) | 18 (100.0%) |
| Mobile Home / Other | 75 (84.3%) | 14 (15.7%) |
| Total | 313 (49.9%) | 314 (50.1%) |
Housing Structures by Number of Rooms in Logansport
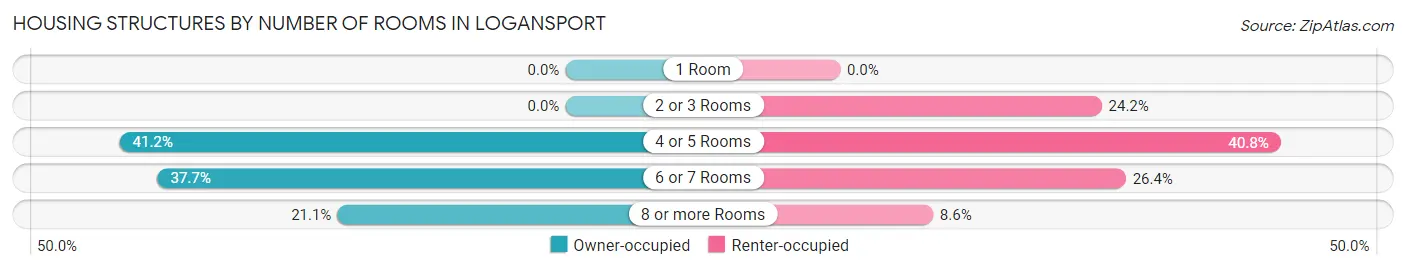
| Number of Rooms | Owner-occupied | Renter-occupied |
| 1 Room | 0 (0.0%) | 0 (0.0%) |
| 2 or 3 Rooms | 0 (0.0%) | 76 (24.2%) |
| 4 or 5 Rooms | 129 (41.2%) | 128 (40.8%) |
| 6 or 7 Rooms | 118 (37.7%) | 83 (26.4%) |
| 8 or more Rooms | 66 (21.1%) | 27 (8.6%) |
| Total | 313 (100.0%) | 314 (100.0%) |
Housing Structure by Heating Type in Logansport
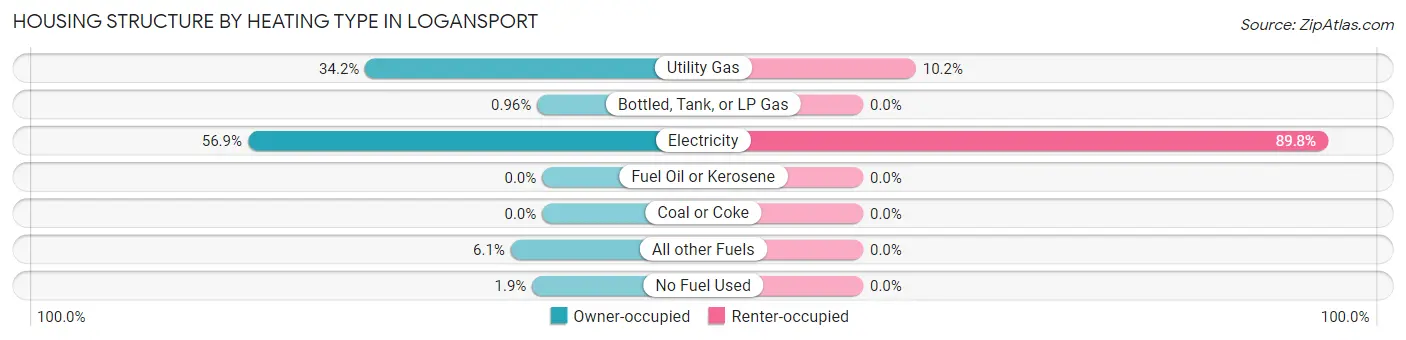
| Heating Type | Owner-occupied | Renter-occupied |
| Utility Gas | 107 (34.2%) | 32 (10.2%) |
| Bottled, Tank, or LP Gas | 3 (1.0%) | 0 (0.0%) |
| Electricity | 178 (56.9%) | 282 (89.8%) |
| Fuel Oil or Kerosene | 0 (0.0%) | 0 (0.0%) |
| Coal or Coke | 0 (0.0%) | 0 (0.0%) |
| All other Fuels | 19 (6.1%) | 0 (0.0%) |
| No Fuel Used | 6 (1.9%) | 0 (0.0%) |
| Total | 313 (100.0%) | 314 (100.0%) |
Household Vehicle Usage in Logansport
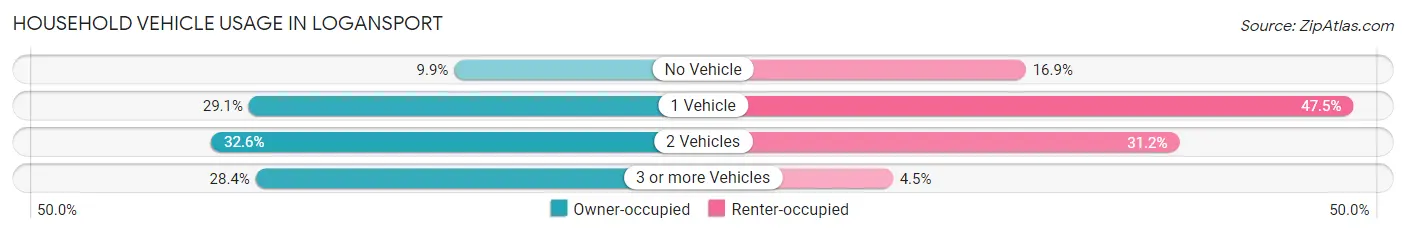
| Vehicles per Household | Owner-occupied | Renter-occupied |
| No Vehicle | 31 (9.9%) | 53 (16.9%) |
| 1 Vehicle | 91 (29.1%) | 149 (47.4%) |
| 2 Vehicles | 102 (32.6%) | 98 (31.2%) |
| 3 or more Vehicles | 89 (28.4%) | 14 (4.5%) |
| Total | 313 (100.0%) | 314 (100.0%) |
Real Estate & Mortgages in Logansport
Real Estate and Mortgage Overview in Logansport
| Characteristic | Without Mortgage | With Mortgage |
| Housing Units | 165 | 148 |
| Median Property Value | $102,500 | $126,900 |
| Median Household Income | $39,896 | $18 |
| Monthly Housing Costs | $353 | $0 |
| Real Estate Taxes | $199 | $36 |
Property Value by Mortgage Status in Logansport
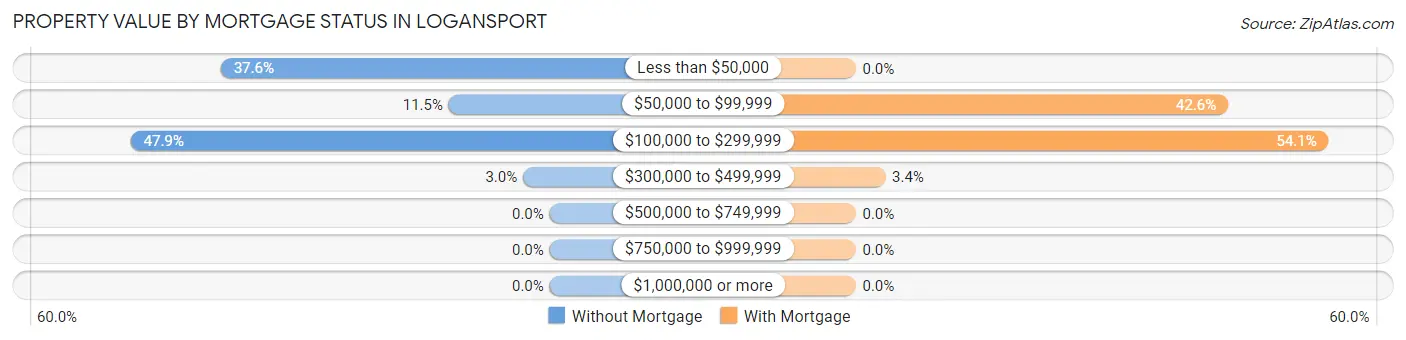
| Property Value | Without Mortgage | With Mortgage |
| Less than $50,000 | 62 (37.6%) | 0 (0.0%) |
| $50,000 to $99,999 | 19 (11.5%) | 63 (42.6%) |
| $100,000 to $299,999 | 79 (47.9%) | 80 (54.0%) |
| $300,000 to $499,999 | 5 (3.0%) | 5 (3.4%) |
| $500,000 to $749,999 | 0 (0.0%) | 0 (0.0%) |
| $750,000 to $999,999 | 0 (0.0%) | 0 (0.0%) |
| $1,000,000 or more | 0 (0.0%) | 0 (0.0%) |
| Total | 165 (100.0%) | 148 (100.0%) |
Household Income by Mortgage Status in Logansport
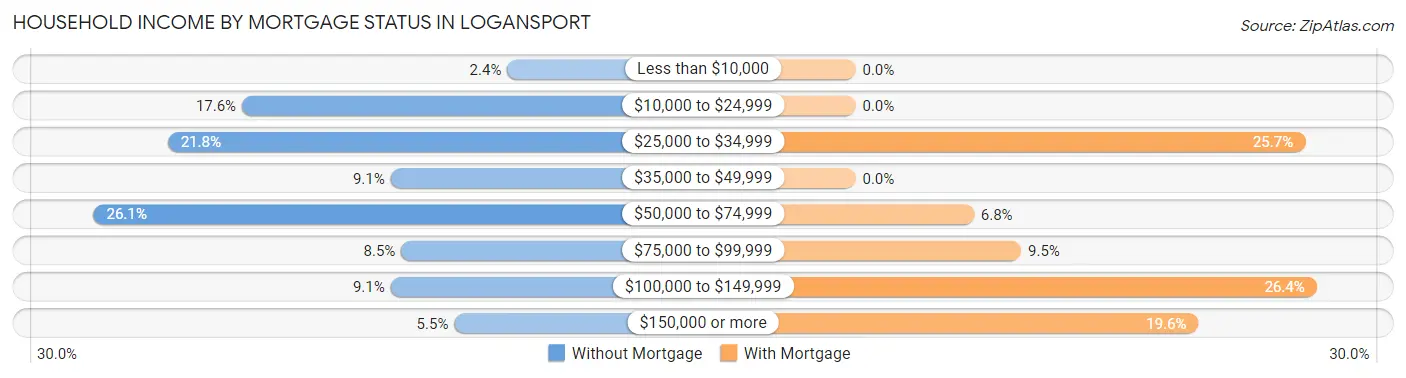
| Household Income | Without Mortgage | With Mortgage |
| Less than $10,000 | 4 (2.4%) | 0 (0.0%) |
| $10,000 to $24,999 | 29 (17.6%) | 0 (0.0%) |
| $25,000 to $34,999 | 36 (21.8%) | 38 (25.7%) |
| $35,000 to $49,999 | 15 (9.1%) | 0 (0.0%) |
| $50,000 to $74,999 | 43 (26.1%) | 10 (6.8%) |
| $75,000 to $99,999 | 14 (8.5%) | 14 (9.5%) |
| $100,000 to $149,999 | 15 (9.1%) | 39 (26.4%) |
| $150,000 or more | 9 (5.4%) | 29 (19.6%) |
| Total | 165 (100.0%) | 148 (100.0%) |
Property Value to Household Income Ratio in Logansport
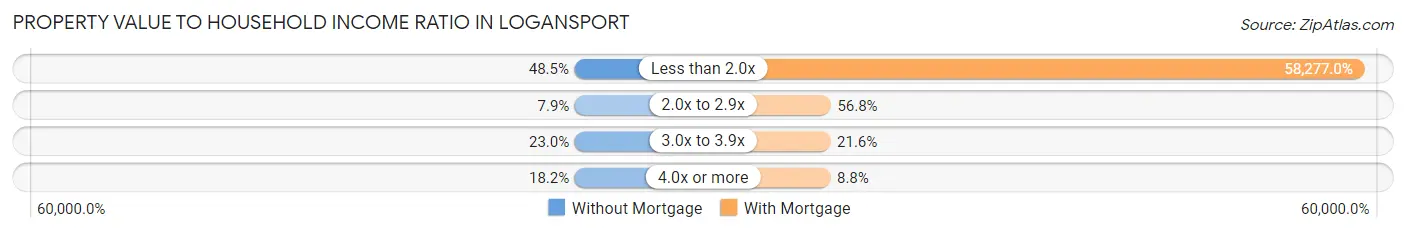
| Value-to-Income Ratio | Without Mortgage | With Mortgage |
| Less than 2.0x | 80 (48.5%) | 86,250 (58,277.0%) |
| 2.0x to 2.9x | 13 (7.9%) | 84 (56.8%) |
| 3.0x to 3.9x | 38 (23.0%) | 32 (21.6%) |
| 4.0x or more | 30 (18.2%) | 13 (8.8%) |
| Total | 165 (100.0%) | 148 (100.0%) |
Real Estate Taxes by Mortgage Status in Logansport
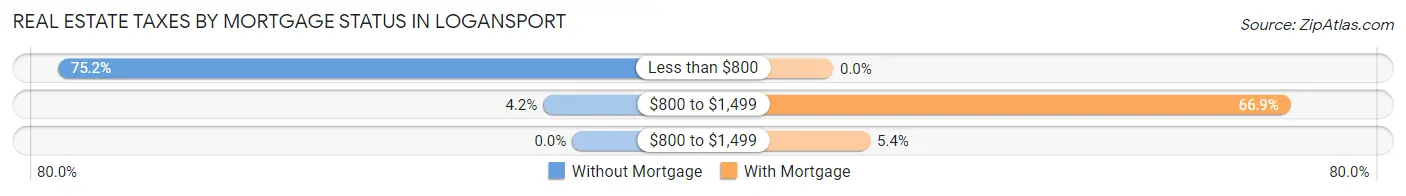
| Property Taxes | Without Mortgage | With Mortgage |
| Less than $800 | 124 (75.1%) | 0 (0.0%) |
| $800 to $1,499 | 7 (4.2%) | 99 (66.9%) |
| $800 to $1,499 | 0 (0.0%) | 8 (5.4%) |
| Total | 165 (100.0%) | 148 (100.0%) |
Health & Disability in Logansport
Health Insurance Coverage by Age in Logansport
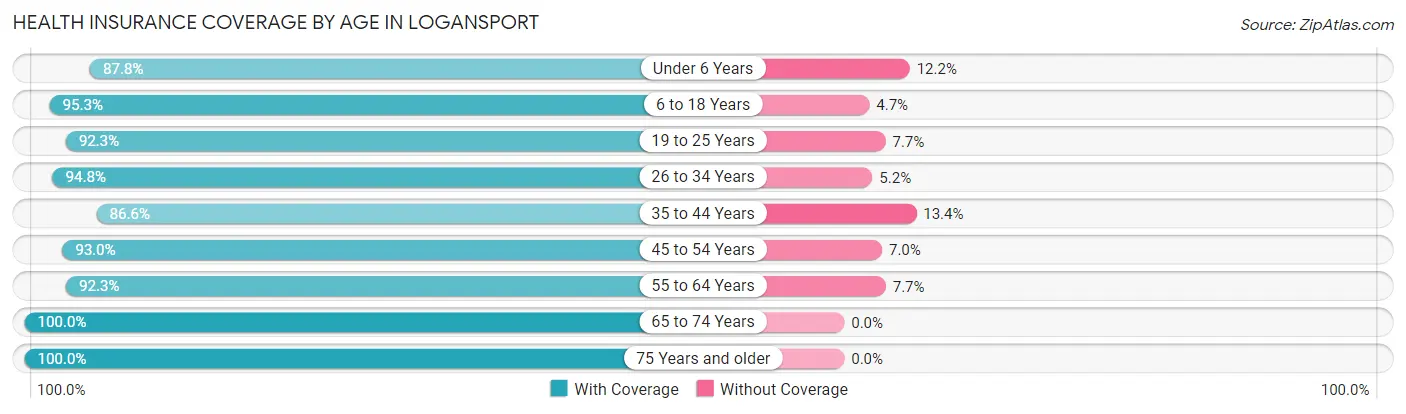
| Age Bracket | With Coverage | Without Coverage |
| Under 6 Years | 216 (87.8%) | 30 (12.2%) |
| 6 to 18 Years | 530 (95.3%) | 26 (4.7%) |
| 19 to 25 Years | 120 (92.3%) | 10 (7.7%) |
| 26 to 34 Years | 199 (94.8%) | 11 (5.2%) |
| 35 to 44 Years | 187 (86.6%) | 29 (13.4%) |
| 45 to 54 Years | 198 (93.0%) | 15 (7.0%) |
| 55 to 64 Years | 143 (92.3%) | 12 (7.7%) |
| 65 to 74 Years | 107 (100.0%) | 0 (0.0%) |
| 75 Years and older | 139 (100.0%) | 0 (0.0%) |
| Total | 1,839 (93.3%) | 133 (6.7%) |
Health Insurance Coverage by Citizenship Status in Logansport
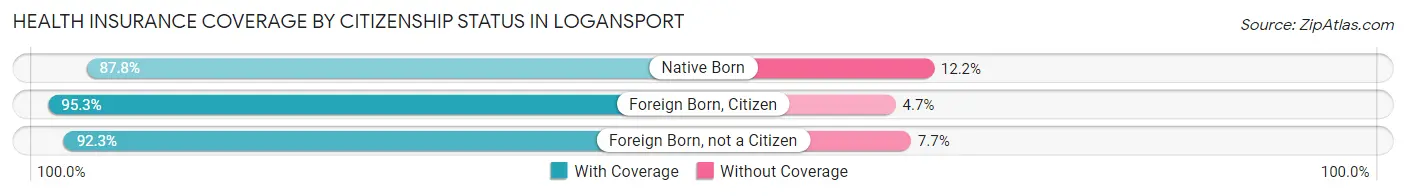
| Citizenship Status | With Coverage | Without Coverage |
| Native Born | 216 (87.8%) | 30 (12.2%) |
| Foreign Born, Citizen | 530 (95.3%) | 26 (4.7%) |
| Foreign Born, not a Citizen | 120 (92.3%) | 10 (7.7%) |
Health Insurance Coverage by Household Income in Logansport
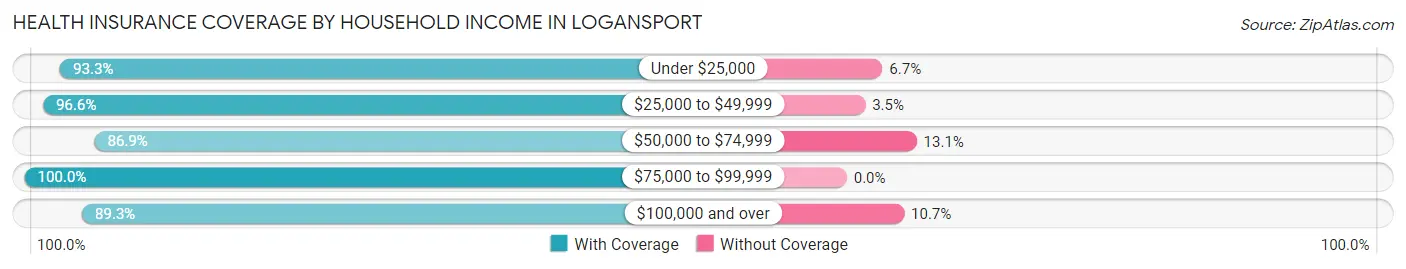
| Household Income | With Coverage | Without Coverage |
| Under $25,000 | 602 (93.3%) | 43 (6.7%) |
| $25,000 to $49,999 | 168 (96.6%) | 6 (3.5%) |
| $50,000 to $74,999 | 385 (86.9%) | 58 (13.1%) |
| $75,000 to $99,999 | 468 (100.0%) | 0 (0.0%) |
| $100,000 and over | 216 (89.3%) | 26 (10.7%) |
Public vs Private Health Insurance Coverage by Age in Logansport
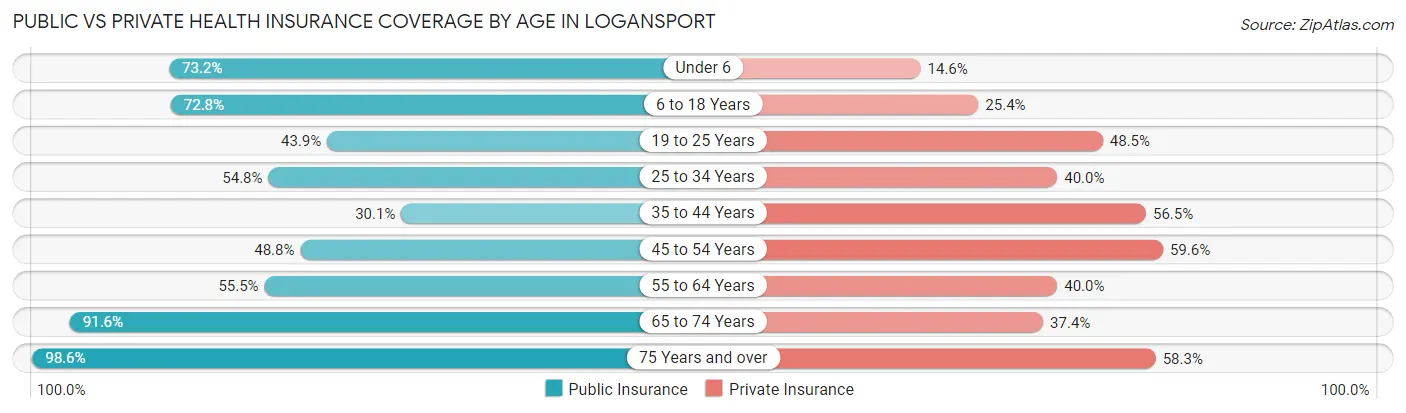
| Age Bracket | Public Insurance | Private Insurance |
| Under 6 | 180 (73.2%) | 36 (14.6%) |
| 6 to 18 Years | 405 (72.8%) | 141 (25.4%) |
| 19 to 25 Years | 57 (43.9%) | 63 (48.5%) |
| 25 to 34 Years | 115 (54.8%) | 84 (40.0%) |
| 35 to 44 Years | 65 (30.1%) | 122 (56.5%) |
| 45 to 54 Years | 104 (48.8%) | 127 (59.6%) |
| 55 to 64 Years | 86 (55.5%) | 62 (40.0%) |
| 65 to 74 Years | 98 (91.6%) | 40 (37.4%) |
| 75 Years and over | 137 (98.6%) | 81 (58.3%) |
| Total | 1,247 (63.2%) | 756 (38.3%) |
Disability Status by Sex by Age in Logansport
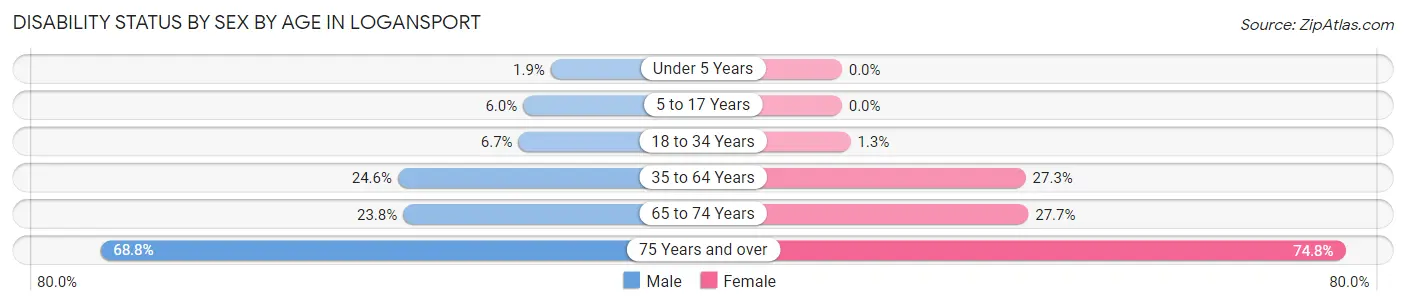
| Age Bracket | Male | Female |
| Under 5 Years | 3 (1.9%) | 0 (0.0%) |
| 5 to 17 Years | 18 (6.0%) | 0 (0.0%) |
| 18 to 34 Years | 9 (6.7%) | 3 (1.3%) |
| 35 to 64 Years | 58 (24.6%) | 95 (27.3%) |
| 65 to 74 Years | 10 (23.8%) | 18 (27.7%) |
| 75 Years and over | 22 (68.8%) | 80 (74.8%) |
Disability Class by Sex by Age in Logansport
Disability Class: Hearing Difficulty
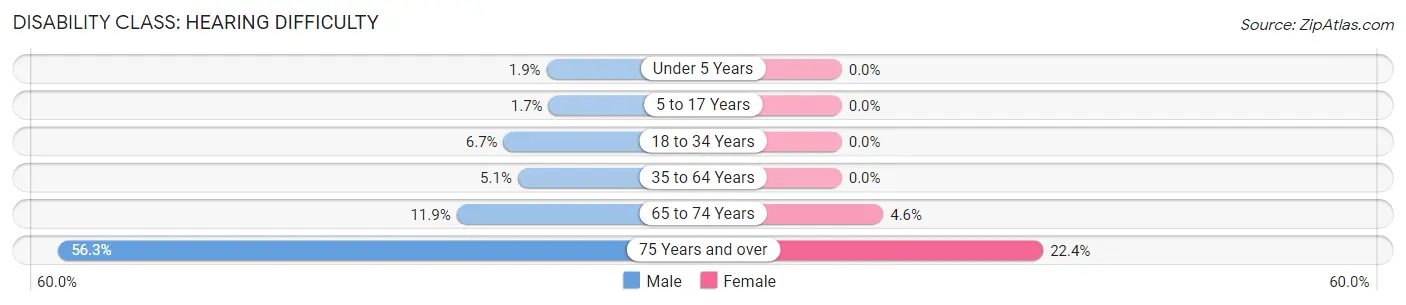
| Age Bracket | Male | Female |
| Under 5 Years | 3 (1.9%) | 0 (0.0%) |
| 5 to 17 Years | 5 (1.7%) | 0 (0.0%) |
| 18 to 34 Years | 9 (6.7%) | 0 (0.0%) |
| 35 to 64 Years | 12 (5.1%) | 0 (0.0%) |
| 65 to 74 Years | 5 (11.9%) | 3 (4.6%) |
| 75 Years and over | 18 (56.2%) | 24 (22.4%) |
Disability Class: Vision Difficulty
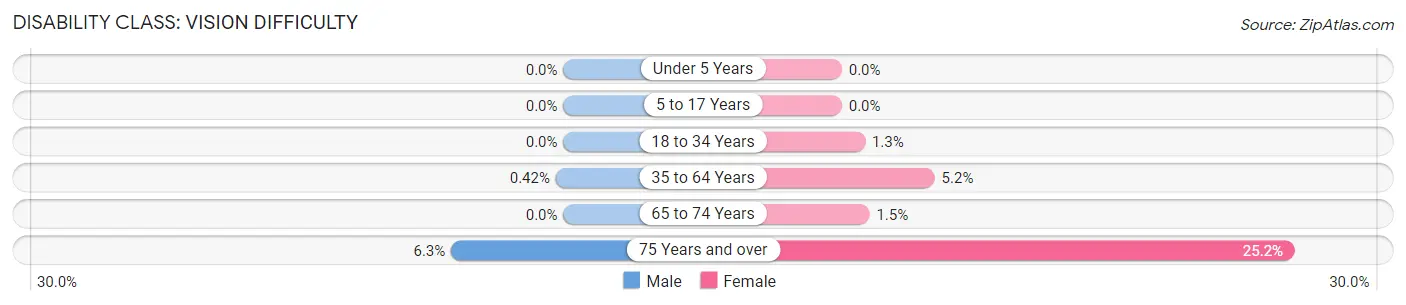
| Age Bracket | Male | Female |
| Under 5 Years | 0 (0.0%) | 0 (0.0%) |
| 5 to 17 Years | 0 (0.0%) | 0 (0.0%) |
| 18 to 34 Years | 0 (0.0%) | 3 (1.3%) |
| 35 to 64 Years | 1 (0.4%) | 18 (5.2%) |
| 65 to 74 Years | 0 (0.0%) | 1 (1.5%) |
| 75 Years and over | 2 (6.2%) | 27 (25.2%) |
Disability Class: Cognitive Difficulty
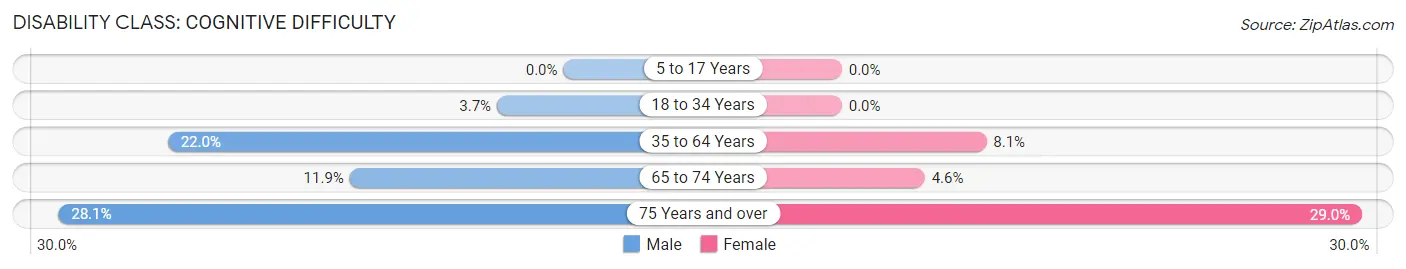
| Age Bracket | Male | Female |
| 5 to 17 Years | 0 (0.0%) | 0 (0.0%) |
| 18 to 34 Years | 5 (3.7%) | 0 (0.0%) |
| 35 to 64 Years | 52 (22.0%) | 28 (8.1%) |
| 65 to 74 Years | 5 (11.9%) | 3 (4.6%) |
| 75 Years and over | 9 (28.1%) | 31 (29.0%) |
Disability Class: Ambulatory Difficulty
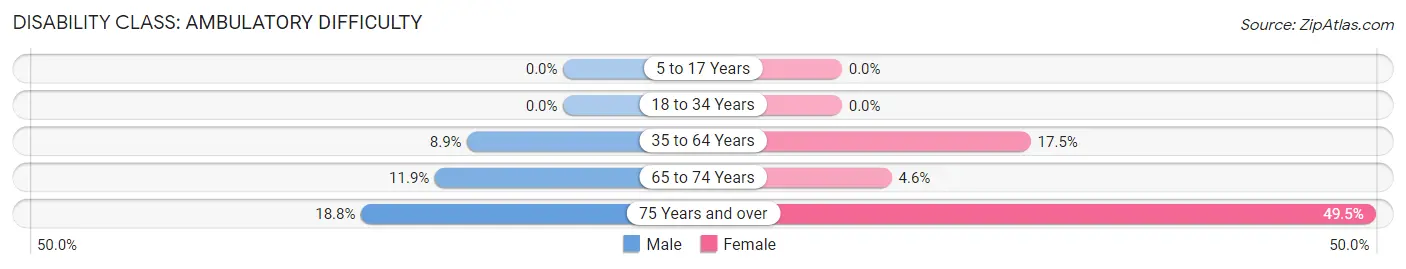
| Age Bracket | Male | Female |
| 5 to 17 Years | 0 (0.0%) | 0 (0.0%) |
| 18 to 34 Years | 0 (0.0%) | 0 (0.0%) |
| 35 to 64 Years | 21 (8.9%) | 61 (17.5%) |
| 65 to 74 Years | 5 (11.9%) | 3 (4.6%) |
| 75 Years and over | 6 (18.8%) | 53 (49.5%) |
Disability Class: Self-Care Difficulty
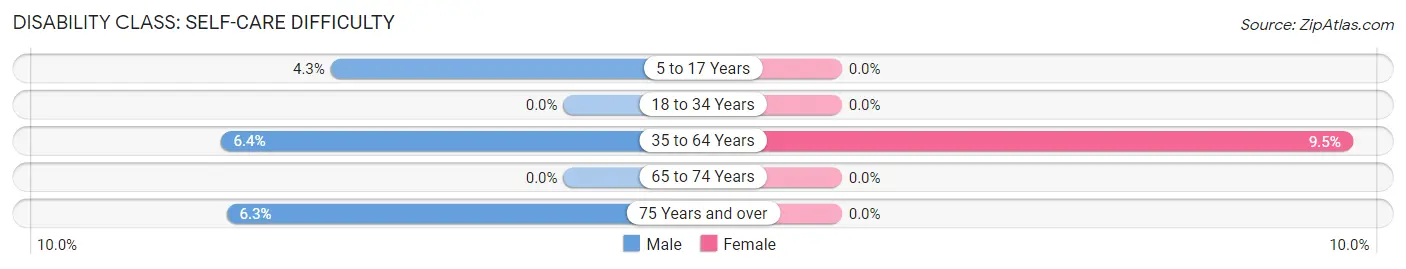
| Age Bracket | Male | Female |
| 5 to 17 Years | 13 (4.3%) | 0 (0.0%) |
| 18 to 34 Years | 0 (0.0%) | 0 (0.0%) |
| 35 to 64 Years | 15 (6.4%) | 33 (9.5%) |
| 65 to 74 Years | 0 (0.0%) | 0 (0.0%) |
| 75 Years and over | 2 (6.2%) | 0 (0.0%) |
Technology Access in Logansport
Computing Device Access in Logansport
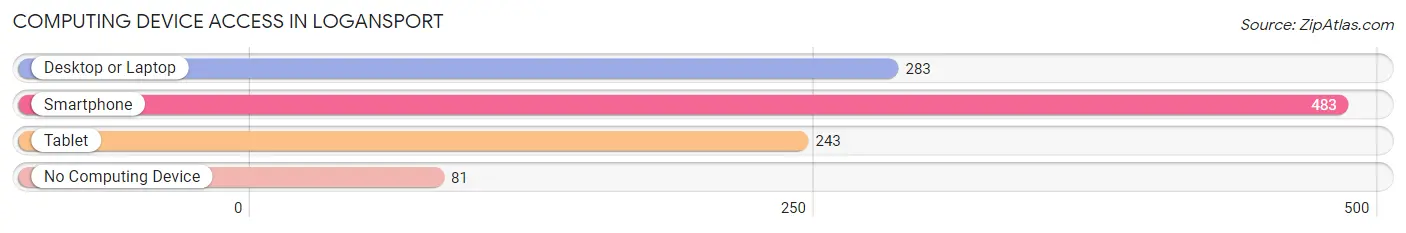
| Device Type | # Households | % Households |
| Desktop or Laptop | 283 | 45.1% |
| Smartphone | 483 | 77.0% |
| Tablet | 243 | 38.8% |
| No Computing Device | 81 | 12.9% |
| Total | 627 | 100.0% |
Internet Access in Logansport
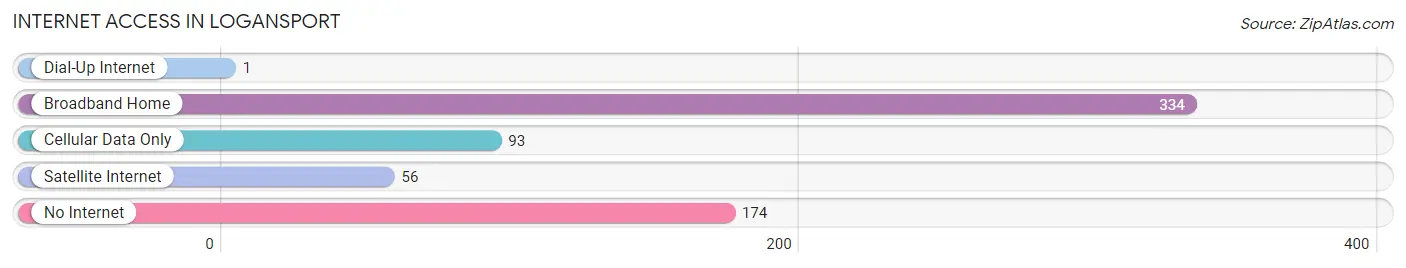
| Internet Type | # Households | % Households |
| Dial-Up Internet | 1 | 0.2% |
| Broadband Home | 334 | 53.3% |
| Cellular Data Only | 93 | 14.8% |
| Satellite Internet | 56 | 8.9% |
| No Internet | 174 | 27.8% |
| Total | 627 | 100.0% |
Logansport Summary
Logansport is a small town located in DeSoto Parish, Louisiana. It is situated on the banks of the Red River, approximately 30 miles south of Shreveport. The town was founded in 1845 and named after the Logan family, who were among the first settlers in the area. The population of Logansport was 1,845 at the 2010 census.
History
Logansport was founded in 1845 by the Logan family, who were among the first settlers in the area. The town was named after the Logan family, who were among the first settlers in the area. The town was originally a small farming community, but it soon grew to become a bustling center of commerce. The town was incorporated in 1871 and was the first town in DeSoto Parish.
In the late 19th century, Logansport was a major stop on the Texas and Pacific Railway. The town was also home to a number of businesses, including a cotton gin, a sawmill, and a gristmill. The town also had a number of churches, including the First Baptist Church, which was founded in 1871.
In the early 20th century, Logansport experienced a period of growth and prosperity. The town was home to a number of businesses, including a bank, a hotel, a movie theater, and a number of stores. The town also had a number of churches, including the First Baptist Church, which was founded in 1871.
Geography
Logansport is located in DeSoto Parish, Louisiana, approximately 30 miles south of Shreveport. The town is situated on the banks of the Red River. The town is surrounded by a number of small towns and villages, including Frierson, Grand Cane, and Mansfield. The town is also located near the Sabine National Forest.
Economy
Logansport is a small town with a population of 1,845 at the 2010 census. The town is home to a number of businesses, including a bank, a hotel, a movie theater, and a number of stores. The town also has a number of churches, including the First Baptist Church, which was founded in 1871.
The town is also home to a number of manufacturing and industrial businesses, including a paper mill, a lumber mill, and a chemical plant. The town is also home to a number of agricultural businesses, including a cotton gin, a sawmill, and a gristmill.
Demographics
As of the 2010 census, Logansport had a population of 1,845. The racial makeup of the town was 79.3% White, 17.2% African American, 0.7% Native American, 0.3% Asian, 0.1% Pacific Islander, and 2.4% from other races. The median household income was $30,938, and the median family income was $37,500. The per capita income was $15,945.
Conclusion
Logansport is a small town located in DeSoto Parish, Louisiana. It is situated on the banks of the Red River, approximately 30 miles south of Shreveport. The town was founded in 1845 and named after the Logan family, who were among the first settlers in the area. The population of Logansport was 1,845 at the 2010 census. The town is home to a number of businesses, including a bank, a hotel, a movie theater, and a number of stores. The town also has a number of churches, including the First Baptist Church, which was founded in 1871. The town is also home to a number of manufacturing and industrial businesses, including a paper mill, a lumber mill, and a chemical plant. The town is also home to a number of agricultural businesses, including a cotton gin, a sawmill, and a gristmill. The racial makeup of the town was 79.3% White, 17.2% African American, 0.7% Native American, 0.3% Asian, 0.1% Pacific Islander, and 2.4% from other races. The median household income was $30,938, and the median family income was $37,500. The per capita income was $15,945. Logansport is a small town with a rich history and a vibrant economy.
Common Questions
What is Per Capita Income in Logansport?
Per Capita income in Logansport is $18,837.
What is the Median Family Income in Logansport?
Median Family Income in Logansport is $54,038.
What is the Median Household income in Logansport?
Median Household Income in Logansport is $37,550.
What is Income or Wage Gap in Logansport?
Income or Wage Gap in Logansport is 58.4%.
Women in Logansport earn 41.6 cents for every dollar earned by a man.
What is Family Income Deficit in Logansport?
Family Income Deficit in Logansport is $10,685.
Families that are below poverty line in Logansport earn $10,685 less on average than the poverty threshold level.
What is Inequality or Gini Index in Logansport?
Inequality or Gini Index in Logansport is 0.46.
What is the Total Population of Logansport?
Total Population of Logansport is 1,972.
What is the Total Male Population of Logansport?
Total Male Population of Logansport is 906.
What is the Total Female Population of Logansport?
Total Female Population of Logansport is 1,066.
What is the Ratio of Males per 100 Females in Logansport?
There are 84.99 Males per 100 Females in Logansport.
What is the Ratio of Females per 100 Males in Logansport?
There are 117.66 Females per 100 Males in Logansport.
What is the Median Population Age in Logansport?
Median Population Age in Logansport is 27.7 Years.
What is the Average Family Size in Logansport
Average Family Size in Logansport is 4.0 People.
What is the Average Household Size in Logansport
Average Household Size in Logansport is 3.1 People.
How Large is the Labor Force in Logansport?
There are 685 People in the Labor Forcein in Logansport.
What is the Percentage of People in the Labor Force in Logansport?
52.9% of People are in the Labor Force in Logansport.
What is the Unemployment Rate in Logansport?
Unemployment Rate in Logansport is 7.9%.