Lake Providence, LA Map & Demographics
Lake Providence Map
Lake Providence Overview
$19,897
PER CAPITA INCOME
$30,953
AVG FAMILY INCOME
$25,614
AVG HOUSEHOLD INCOME
25.7%
WAGE / INCOME GAP [ % ]
74.3¢/ $1
WAGE / INCOME GAP [ $ ]
0.64
INEQUALITY / GINI INDEX
3,542
TOTAL POPULATION
1,497
MALE POPULATION
2,045
FEMALE POPULATION
73.20
MALES / 100 FEMALES
136.61
FEMALES / 100 MALES
28.2
MEDIAN AGE
3.2
AVG FAMILY SIZE
2.5
AVG HOUSEHOLD SIZE
1,174
LABOR FORCE [ PEOPLE ]
49.6%
PERCENT IN LABOR FORCE
13.6%
UNEMPLOYMENT RATE
Lake Providence Zip Codes
Lake Providence Area Codes
Income in Lake Providence
Income Overview in Lake Providence
Per Capita Income in Lake Providence is $19,897, while median incomes of families and households are $30,953 and $25,614 respectively.
| Characteristic | Number | Measure |
| Per Capita Income | 3,542 | $19,897 |
| Median Family Income | 937 | $30,953 |
| Mean Family Income | 937 | $65,362 |
| Median Household Income | 1,388 | $25,614 |
| Mean Household Income | 1,388 | $53,282 |
| Income Deficit | 937 | $0 |
| Wage / Income Gap (%) | 3,542 | 25.69% |
| Wage / Income Gap ($) | 3,542 | 74.31¢ per $1 |
| Gini / Inequality Index | 3,542 | 0.64 |
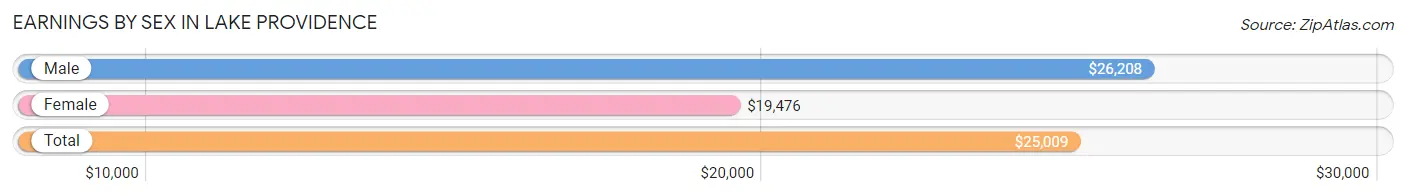
Earnings by Sex in Lake Providence
Average Earnings in Lake Providence are $25,009, $26,208 for men and $19,476 for women, a difference of 25.7%.
| Sex | Number | Average Earnings |
| Male | 550 (47.3%) | $26,208 |
| Female | 613 (52.7%) | $19,476 |
| Total | 1,163 (100.0%) | $25,009 |
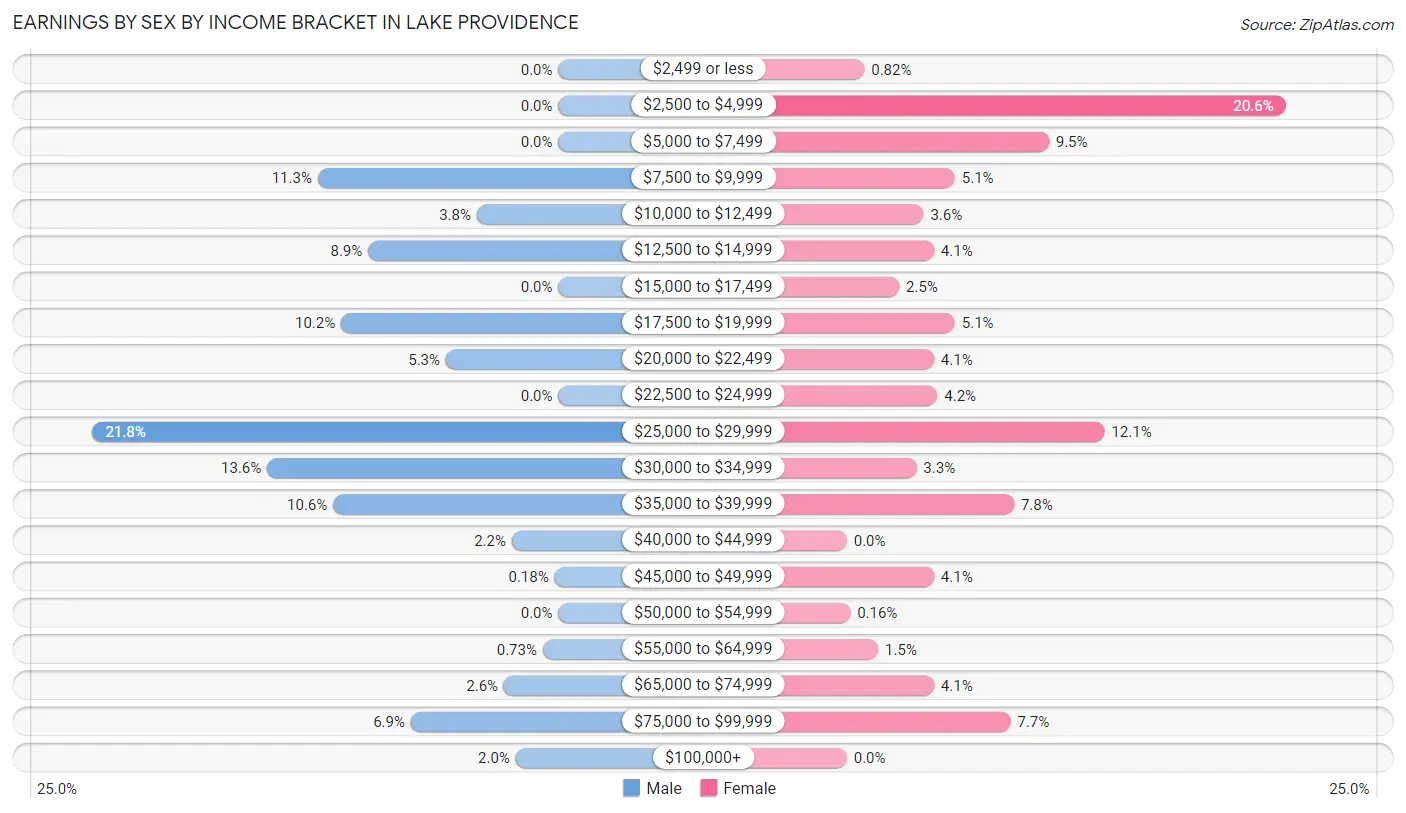
Earnings by Sex by Income Bracket in Lake Providence
The most common earnings brackets in Lake Providence are $25,000 to $29,999 for men (120 | 21.8%) and $2,500 to $4,999 for women (126 | 20.5%).
| Income | Male | Female |
| $2,499 or less | 0 (0.0%) | 5 (0.8%) |
| $2,500 to $4,999 | 0 (0.0%) | 126 (20.5%) |
| $5,000 to $7,499 | 0 (0.0%) | 58 (9.5%) |
| $7,500 to $9,999 | 62 (11.3%) | 31 (5.1%) |
| $10,000 to $12,499 | 21 (3.8%) | 22 (3.6%) |
| $12,500 to $14,999 | 49 (8.9%) | 25 (4.1%) |
| $15,000 to $17,499 | 0 (0.0%) | 15 (2.5%) |
| $17,500 to $19,999 | 56 (10.2%) | 31 (5.1%) |
| $20,000 to $22,499 | 29 (5.3%) | 25 (4.1%) |
| $22,500 to $24,999 | 0 (0.0%) | 26 (4.2%) |
| $25,000 to $29,999 | 120 (21.8%) | 74 (12.1%) |
| $30,000 to $34,999 | 75 (13.6%) | 20 (3.3%) |
| $35,000 to $39,999 | 58 (10.5%) | 48 (7.8%) |
| $40,000 to $44,999 | 12 (2.2%) | 0 (0.0%) |
| $45,000 to $49,999 | 1 (0.2%) | 25 (4.1%) |
| $50,000 to $54,999 | 0 (0.0%) | 1 (0.2%) |
| $55,000 to $64,999 | 4 (0.7%) | 9 (1.5%) |
| $65,000 to $74,999 | 14 (2.5%) | 25 (4.1%) |
| $75,000 to $99,999 | 38 (6.9%) | 47 (7.7%) |
| $100,000+ | 11 (2.0%) | 0 (0.0%) |
| Total | 550 (100.0%) | 613 (100.0%) |
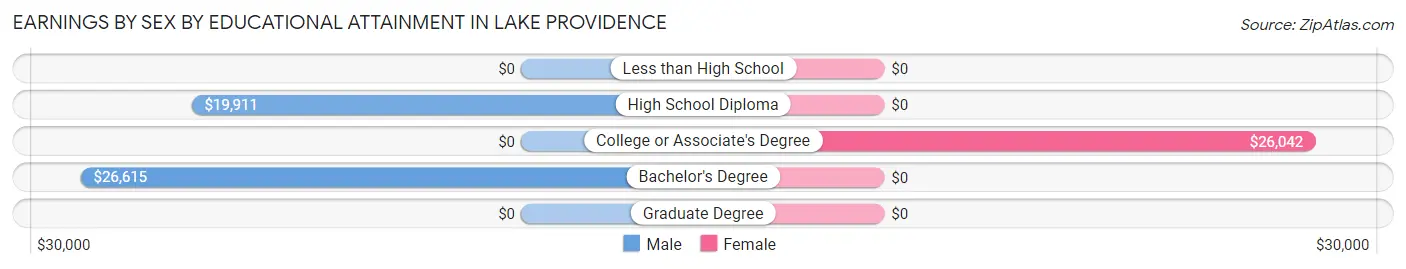
Earnings by Sex by Educational Attainment in Lake Providence
Average earnings in Lake Providence are $26,375 for men and $21,800 for women, a difference of 17.3%. Men with an educational attainment of bachelor's degree enjoy the highest average annual earnings of $26,615, while those with high school diploma education earn the least with $19,911. Women with an educational attainment of college or associate's degree earn the most with the average annual earnings of $26,042, while those with college or associate's degree education have the smallest earnings of $26,042.
| Educational Attainment | Male Income | Female Income |
| Less than High School | - | - |
| High School Diploma | $19,911 | $0 |
| College or Associate's Degree | - | - |
| Bachelor's Degree | $26,615 | $0 |
| Graduate Degree | - | - |
| Total | $26,375 | $21,800 |
Family Income in Lake Providence
Family Income Brackets in Lake Providence
According to the Lake Providence family income data, there are 280 families falling into the less than $10,000 income range, which is the most common income bracket and makes up 29.9% of all families. Conversely, the $200,000+ income bracket is the least frequent group with only 10 families (1.1%) belonging to this category.
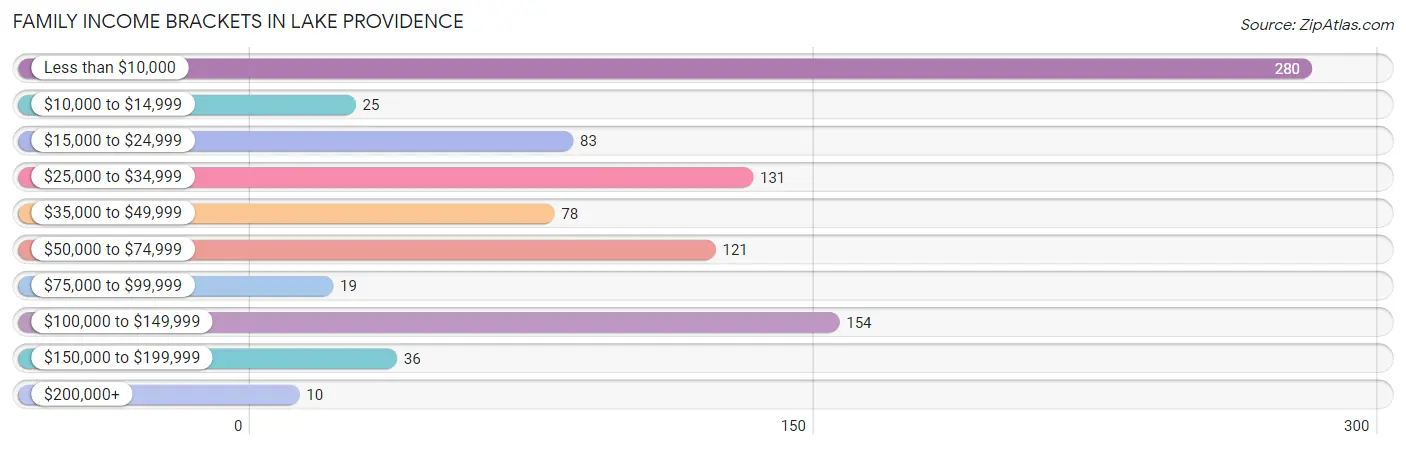
| Income Bracket | # Families | % Families |
| Less than $10,000 | 280 | 29.9% |
| $10,000 to $14,999 | 25 | 2.7% |
| $15,000 to $24,999 | 83 | 8.9% |
| $25,000 to $34,999 | 131 | 14.0% |
| $35,000 to $49,999 | 78 | 8.3% |
| $50,000 to $74,999 | 121 | 12.9% |
| $75,000 to $99,999 | 19 | 2.0% |
| $100,000 to $149,999 | 154 | 16.4% |
| $150,000 to $199,999 | 36 | 3.8% |
| $200,000+ | 10 | 1.1% |
Family Income by Famaliy Size in Lake Providence
4-person families (244 | 26.0%) account for the highest median family income in Lake Providence with $127,771 per family, while 4-person families (244 | 26.0%) have the highest median income of $31,943 per family member.
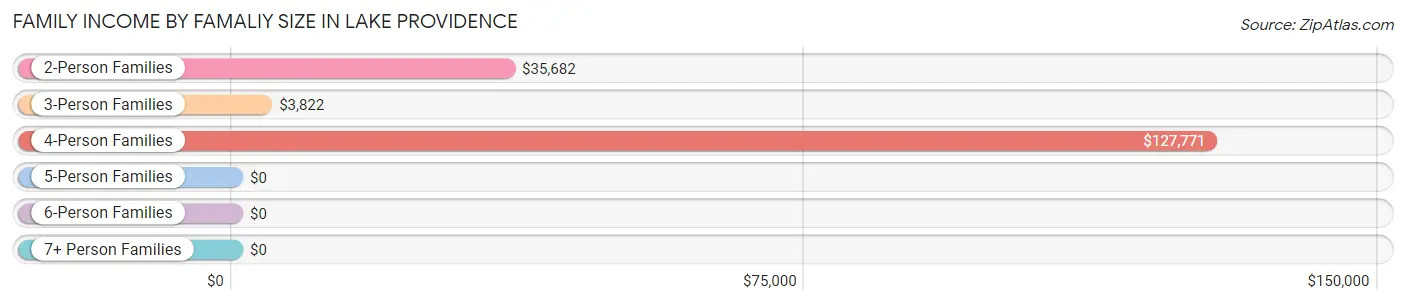
| Income Bracket | # Families | Median Income |
| 2-Person Families | 274 (29.2%) | $35,682 |
| 3-Person Families | 372 (39.7%) | $3,822 |
| 4-Person Families | 244 (26.0%) | $127,771 |
| 5-Person Families | 41 (4.4%) | $0 |
| 6-Person Families | 6 (0.6%) | $0 |
| 7+ Person Families | 0 (0.0%) | $0 |
| Total | 937 (100.0%) | $30,953 |
Family Income by Number of Earners in Lake Providence
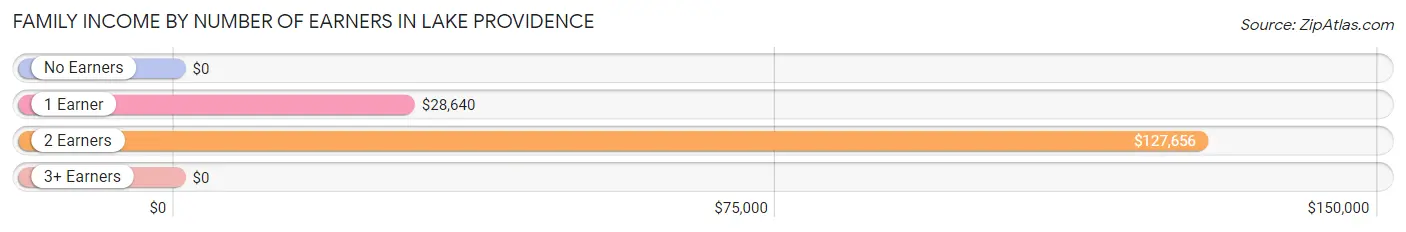
| Number of Earners | # Families | Median Income |
| No Earners | 315 (33.6%) | $0 |
| 1 Earner | 325 (34.7%) | $28,640 |
| 2 Earners | 287 (30.6%) | $127,656 |
| 3+ Earners | 10 (1.1%) | $0 |
| Total | 937 (100.0%) | $30,953 |
Household Income in Lake Providence
Household Income Brackets in Lake Providence
With 412 households falling in the category, the less than $10,000 income range is the most frequent in Lake Providence, accounting for 29.7% of all households. In contrast, only 10 households (0.7%) fall into the $200,000+ income bracket, making it the least populous group.
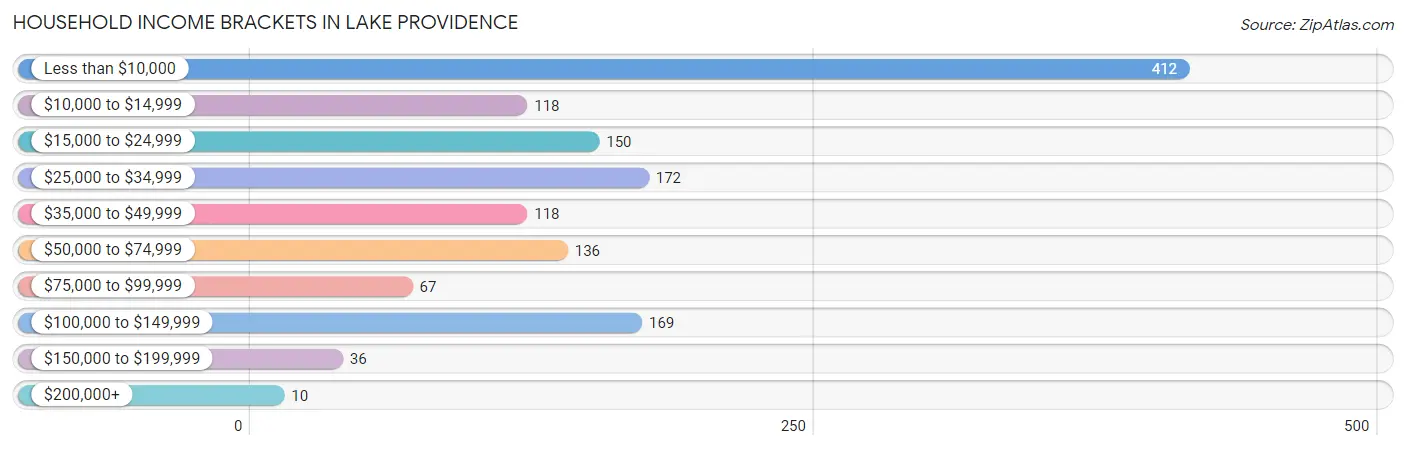
| Income Bracket | # Households | % Households |
| Less than $10,000 | 412 | 29.7% |
| $10,000 to $14,999 | 118 | 8.5% |
| $15,000 to $24,999 | 150 | 10.8% |
| $25,000 to $34,999 | 172 | 12.4% |
| $35,000 to $49,999 | 118 | 8.5% |
| $50,000 to $74,999 | 136 | 9.8% |
| $75,000 to $99,999 | 67 | 4.8% |
| $100,000 to $149,999 | 169 | 12.2% |
| $150,000 to $199,999 | 36 | 2.6% |
| $200,000+ | 10 | 0.7% |
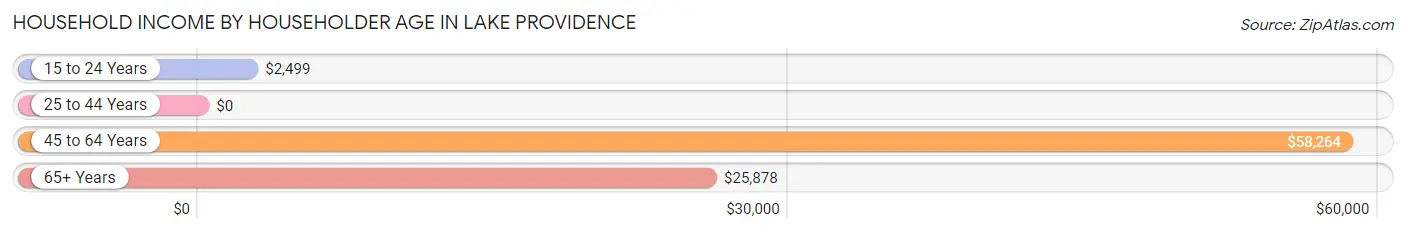
Household Income by Householder Age in Lake Providence
The median household income in Lake Providence is $25,614, with the highest median household income of $58,264 found in the 45 to 64 years age bracket for the primary householder. A total of 545 households (39.3%) fall into this category. Meanwhile, the 25 to 44 years age bracket for the primary householder has the lowest median household income of $0, with 318 households (22.9%) in this group.
| Income Bracket | # Households | Median Income |
| 15 to 24 Years | 161 (11.6%) | $2,499 |
| 25 to 44 Years | 318 (22.9%) | $0 |
| 45 to 64 Years | 545 (39.3%) | $58,264 |
| 65+ Years | 364 (26.2%) | $25,878 |
| Total | 1,388 (100.0%) | $25,614 |
Poverty in Lake Providence
Income Below Poverty by Sex and Age in Lake Providence
With 41.4% poverty level for males and 55.0% for females among the residents of Lake Providence, 5 year old males and under 5 year old females are the most vulnerable to poverty, with 33 males (100.0%) and 153 females (100.0%) in their respective age groups living below the poverty level.
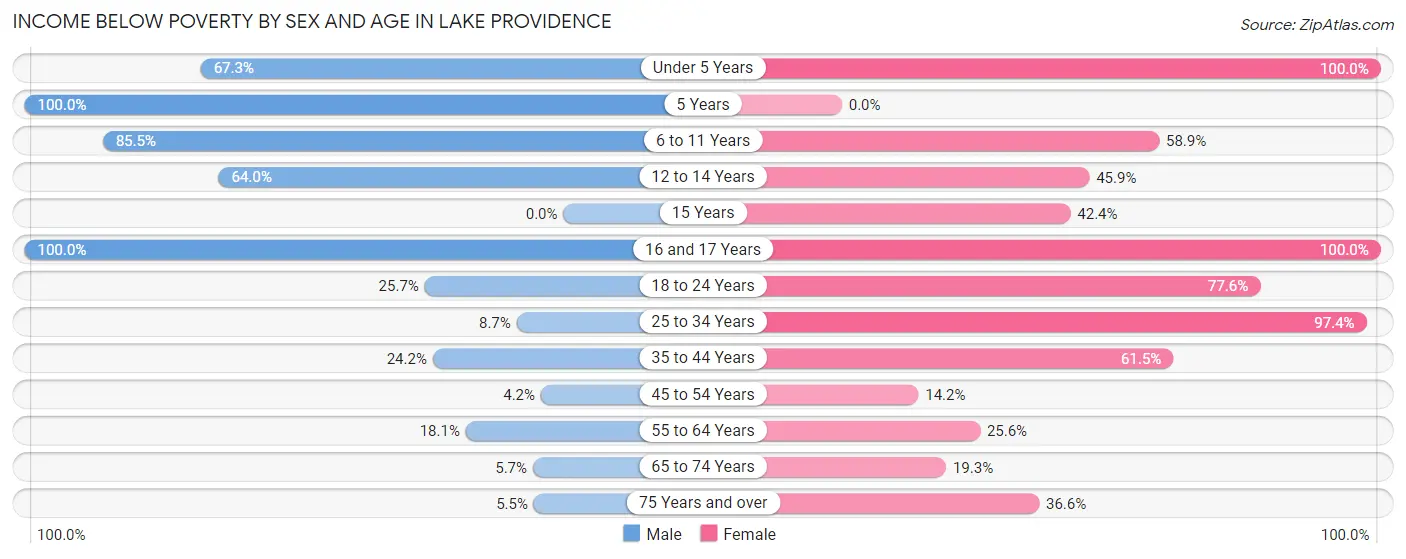
| Age Bracket | Male | Female |
| Under 5 Years | 35 (67.3%) | 153 (100.0%) |
| 5 Years | 33 (100.0%) | 0 (0.0%) |
| 6 to 11 Years | 289 (85.5%) | 159 (58.9%) |
| 12 to 14 Years | 80 (64.0%) | 79 (45.9%) |
| 15 Years | 0 (0.0%) | 14 (42.4%) |
| 16 and 17 Years | 63 (100.0%) | 69 (100.0%) |
| 18 to 24 Years | 26 (25.7%) | 170 (77.6%) |
| 25 to 34 Years | 13 (8.7%) | 185 (97.4%) |
| 35 to 44 Years | 16 (24.2%) | 115 (61.5%) |
| 45 to 54 Years | 4 (4.2%) | 23 (14.2%) |
| 55 to 64 Years | 50 (18.1%) | 50 (25.6%) |
| 65 to 74 Years | 6 (5.7%) | 41 (19.3%) |
| 75 Years and over | 5 (5.5%) | 67 (36.6%) |
| Total | 620 (41.4%) | 1,125 (55.0%) |
Income Above Poverty by Sex and Age in Lake Providence
According to the poverty statistics in Lake Providence, males aged 45 to 54 years and females aged 45 to 54 years are the age groups that are most secure financially, with 95.8% of males and 85.8% of females in these age groups living above the poverty line.
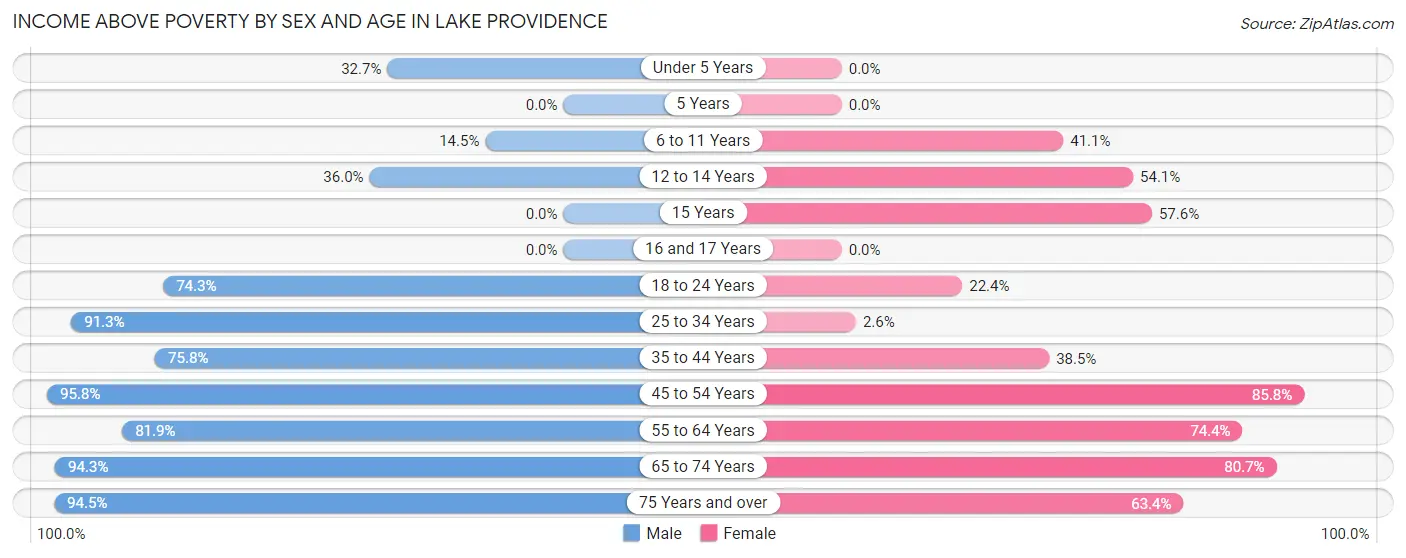
| Age Bracket | Male | Female |
| Under 5 Years | 17 (32.7%) | 0 (0.0%) |
| 5 Years | 0 (0.0%) | 0 (0.0%) |
| 6 to 11 Years | 49 (14.5%) | 111 (41.1%) |
| 12 to 14 Years | 45 (36.0%) | 93 (54.1%) |
| 15 Years | 0 (0.0%) | 19 (57.6%) |
| 16 and 17 Years | 0 (0.0%) | 0 (0.0%) |
| 18 to 24 Years | 75 (74.3%) | 49 (22.4%) |
| 25 to 34 Years | 137 (91.3%) | 5 (2.6%) |
| 35 to 44 Years | 50 (75.8%) | 72 (38.5%) |
| 45 to 54 Years | 92 (95.8%) | 139 (85.8%) |
| 55 to 64 Years | 226 (81.9%) | 145 (74.4%) |
| 65 to 74 Years | 100 (94.3%) | 171 (80.7%) |
| 75 Years and over | 86 (94.5%) | 116 (63.4%) |
| Total | 877 (58.6%) | 920 (45.0%) |
Income Below Poverty Among Married-Couple Families in Lake Providence
The poverty statistics for married-couple families in Lake Providence show that 7.7% or 32 of the total 416 families live below the poverty line. Families with no children have the highest poverty rate of 14.2%, comprising of 32 families. On the other hand, families with 1 or 2 children have the lowest poverty rate of 0.0%, which includes 0 families.
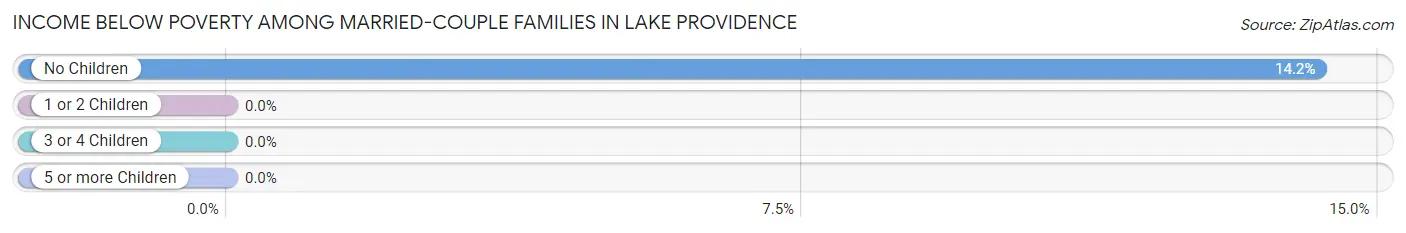
| Children | Above Poverty | Below Poverty |
| No Children | 193 (85.8%) | 32 (14.2%) |
| 1 or 2 Children | 177 (100.0%) | 0 (0.0%) |
| 3 or 4 Children | 14 (100.0%) | 0 (0.0%) |
| 5 or more Children | 0 (0.0%) | 0 (0.0%) |
| Total | 384 (92.3%) | 32 (7.7%) |
Income Below Poverty Among Single-Parent Households in Lake Providence
According to the poverty data in Lake Providence, 24.0% or 6 single-father households and 70.2% or 348 single-mother households are living below the poverty line. Among single-father households, those with 3 or 4 children have the highest poverty rate, with 6 households (100.0%) experiencing poverty. Likewise, among single-mother households, those with 3 or 4 children have the highest poverty rate, with 29 households (100.0%) falling below the poverty line.
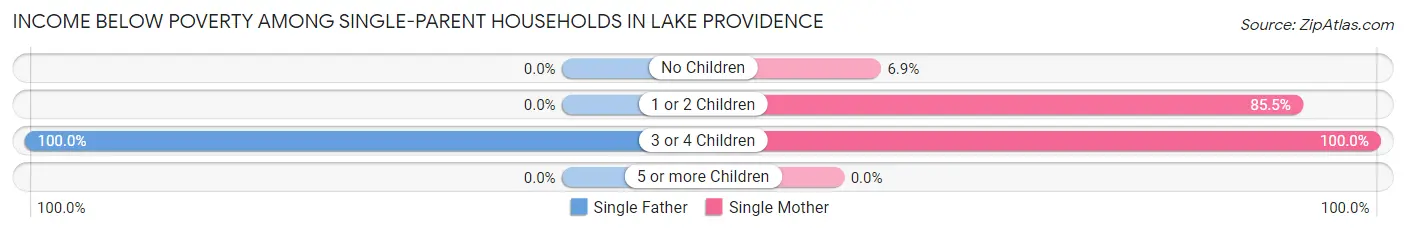
| Children | Single Father | Single Mother |
| No Children | 0 (0.0%) | 7 (6.9%) |
| 1 or 2 Children | 0 (0.0%) | 312 (85.5%) |
| 3 or 4 Children | 6 (100.0%) | 29 (100.0%) |
| 5 or more Children | 0 (0.0%) | 0 (0.0%) |
| Total | 6 (24.0%) | 348 (70.2%) |
Income Below Poverty Among Married-Couple vs Single-Parent Households in Lake Providence
The poverty data for Lake Providence shows that 32 of the married-couple family households (7.7%) and 354 of the single-parent households (67.9%) are living below the poverty level. Within the married-couple family households, those with no children have the highest poverty rate, with 32 households (14.2%) falling below the poverty line. Among the single-parent households, those with 3 or 4 children have the highest poverty rate, with 35 household (100.0%) living below poverty.
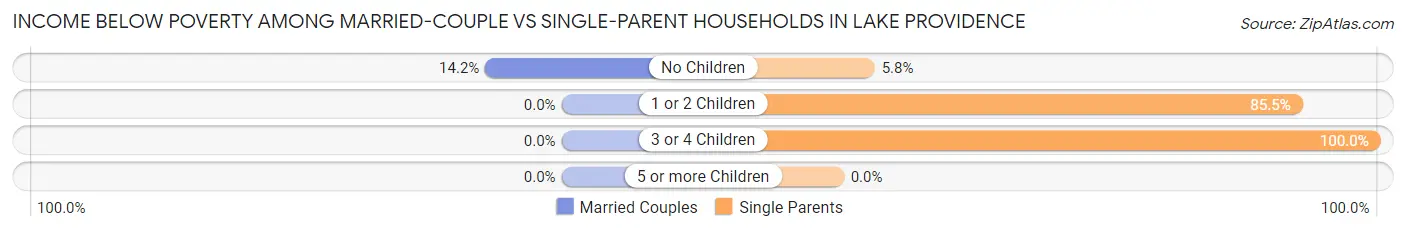
| Children | Married-Couple Families | Single-Parent Households |
| No Children | 32 (14.2%) | 7 (5.8%) |
| 1 or 2 Children | 0 (0.0%) | 312 (85.5%) |
| 3 or 4 Children | 0 (0.0%) | 35 (100.0%) |
| 5 or more Children | 0 (0.0%) | 0 (0.0%) |
| Total | 32 (7.7%) | 354 (67.9%) |
Race in Lake Providence
The most populous races in Lake Providence are Black / African American (2,839 | 80.1%), White / Caucasian (671 | 18.9%), and Two or more Races (32 | 0.9%).
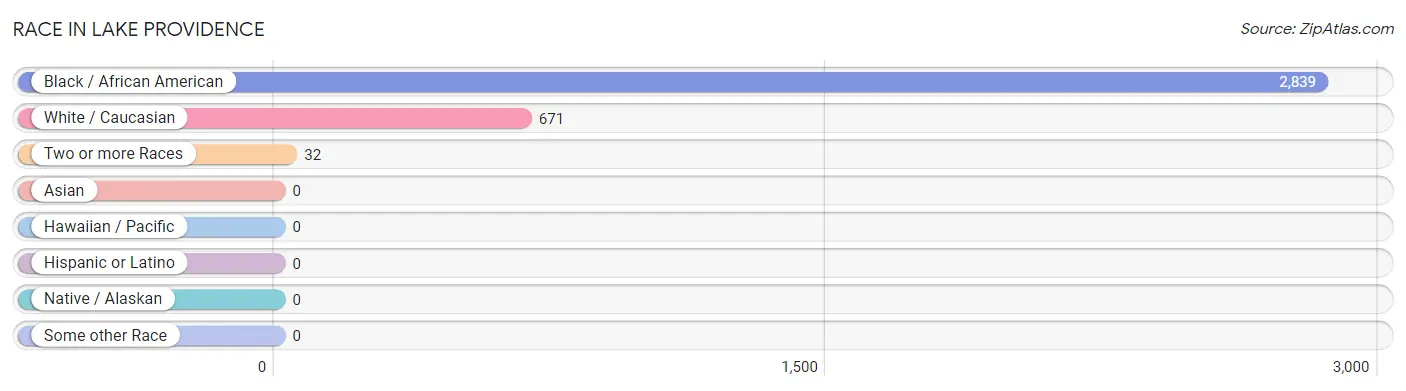
| Race | # Population | % Population |
| Asian | 0 | 0.0% |
| Black / African American | 2,839 | 80.1% |
| Hawaiian / Pacific | 0 | 0.0% |
| Hispanic or Latino | 0 | 0.0% |
| Native / Alaskan | 0 | 0.0% |
| White / Caucasian | 671 | 18.9% |
| Two or more Races | 32 | 0.9% |
| Some other Race | 0 | 0.0% |
| Total | 3,542 | 100.0% |
Ancestry in Lake Providence
The most populous ancestries reported in Lake Providence are English (152 | 4.3%), American (114 | 3.2%), German (57 | 1.6%), Irish (46 | 1.3%), and Dutch (16 | 0.4%), together accounting for 10.9% of all Lake Providence residents.
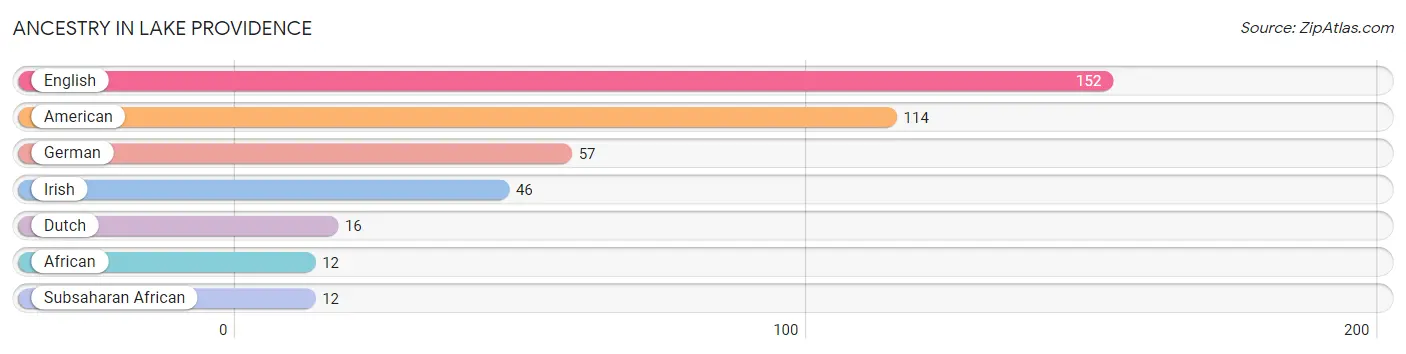
| Ancestry | # Population | % Population |
| African | 12 | 0.3% |
| American | 114 | 3.2% |
| Dutch | 16 | 0.4% |
| English | 152 | 4.3% |
| German | 57 | 1.6% |
| Irish | 46 | 1.3% |
| Subsaharan African | 12 | 0.3% | View All 7 Rows |
Immigrants in Lake Providence

| Immigration Origin | # Population | % Population | View All 0 Rows |
Sex and Age in Lake Providence
Sex and Age in Lake Providence
The most populous age groups in Lake Providence are 10 to 14 Years (263 | 17.6%) for men and 10 to 14 Years (364 | 17.8%) for women.
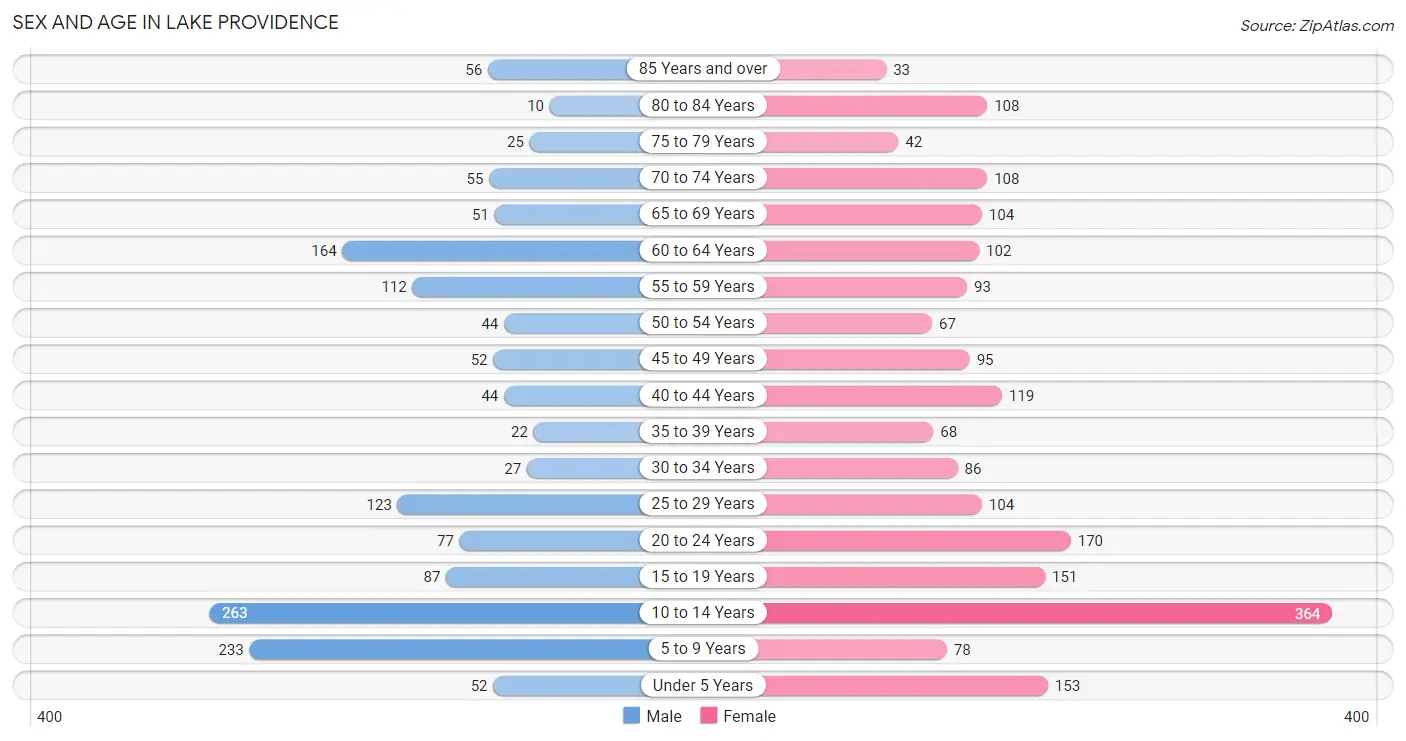
| Age Bracket | Male | Female |
| Under 5 Years | 52 (3.5%) | 153 (7.5%) |
| 5 to 9 Years | 233 (15.6%) | 78 (3.8%) |
| 10 to 14 Years | 263 (17.6%) | 364 (17.8%) |
| 15 to 19 Years | 87 (5.8%) | 151 (7.4%) |
| 20 to 24 Years | 77 (5.1%) | 170 (8.3%) |
| 25 to 29 Years | 123 (8.2%) | 104 (5.1%) |
| 30 to 34 Years | 27 (1.8%) | 86 (4.2%) |
| 35 to 39 Years | 22 (1.5%) | 68 (3.3%) |
| 40 to 44 Years | 44 (2.9%) | 119 (5.8%) |
| 45 to 49 Years | 52 (3.5%) | 95 (4.6%) |
| 50 to 54 Years | 44 (2.9%) | 67 (3.3%) |
| 55 to 59 Years | 112 (7.5%) | 93 (4.5%) |
| 60 to 64 Years | 164 (11.0%) | 102 (5.0%) |
| 65 to 69 Years | 51 (3.4%) | 104 (5.1%) |
| 70 to 74 Years | 55 (3.7%) | 108 (5.3%) |
| 75 to 79 Years | 25 (1.7%) | 42 (2.1%) |
| 80 to 84 Years | 10 (0.7%) | 108 (5.3%) |
| 85 Years and over | 56 (3.7%) | 33 (1.6%) |
| Total | 1,497 (100.0%) | 2,045 (100.0%) |
Families and Households in Lake Providence
Median Family Size in Lake Providence
The median family size in Lake Providence is 3.25 persons per family, with single female/mother families (496 | 52.9%) accounting for the largest median family size of 3.72 persons per family. On the other hand, married-couple families (416 | 44.4%) represent the smallest median family size with 2.69 persons per family.
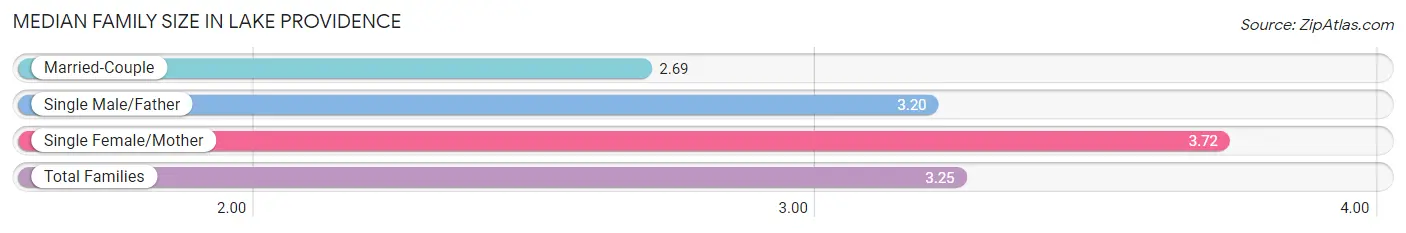
| Family Type | # Families | Family Size |
| Married-Couple | 416 (44.4%) | 2.69 |
| Single Male/Father | 25 (2.7%) | 3.20 |
| Single Female/Mother | 496 (52.9%) | 3.72 |
| Total Families | 937 (100.0%) | 3.25 |
Median Household Size in Lake Providence
The median household size in Lake Providence is 2.55 persons per household, with single female/mother households (496 | 35.7%) accounting for the largest median household size of 3.72 persons per household. non-family households (451 | 32.5%) represent the smallest median household size with 1.11 persons per household.
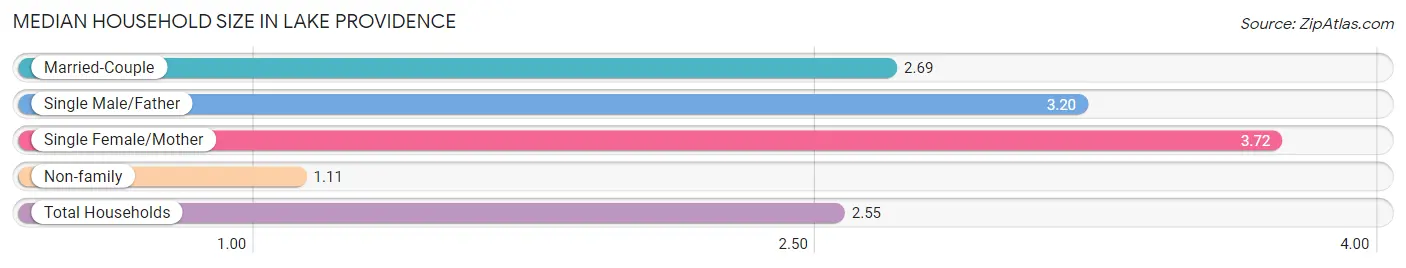
| Household Type | # Households | Household Size |
| Married-Couple | 416 (30.0%) | 2.69 |
| Single Male/Father | 25 (1.8%) | 3.20 |
| Single Female/Mother | 496 (35.7%) | 3.72 |
| Non-family | 451 (32.5%) | 1.11 |
| Total Households | 1,388 (100.0%) | 2.55 |
Household Size by Marriage Status in Lake Providence
Out of a total of 1,388 households in Lake Providence, 937 (67.5%) are family households, while 451 (32.5%) are nonfamily households. The most numerous type of family households are 3-person households, comprising 372, and the most common type of nonfamily households are 1-person households, comprising 368.
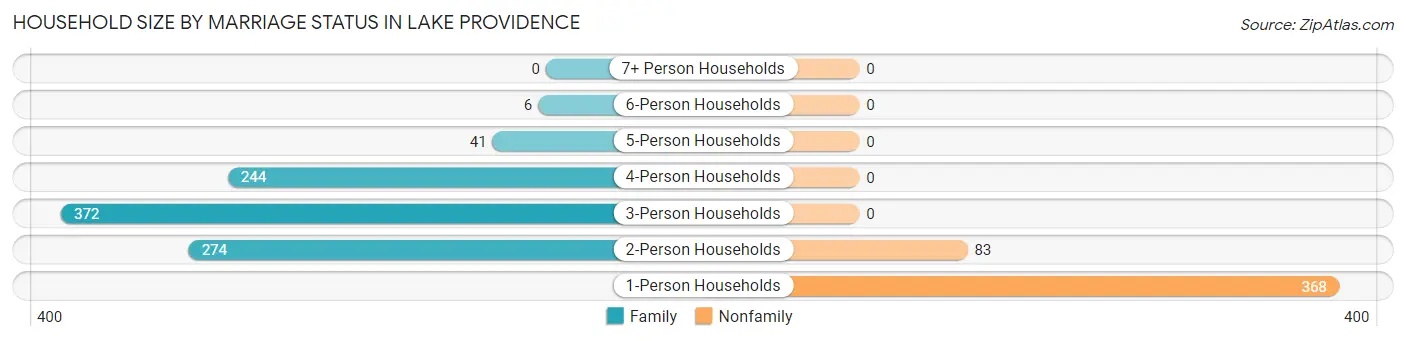
| Household Size | Family Households | Nonfamily Households |
| 1-Person Households | - | 368 (26.5%) |
| 2-Person Households | 274 (19.7%) | 83 (6.0%) |
| 3-Person Households | 372 (26.8%) | 0 (0.0%) |
| 4-Person Households | 244 (17.6%) | 0 (0.0%) |
| 5-Person Households | 41 (2.9%) | 0 (0.0%) |
| 6-Person Households | 6 (0.4%) | 0 (0.0%) |
| 7+ Person Households | 0 (0.0%) | 0 (0.0%) |
| Total | 937 (67.5%) | 451 (32.5%) |
Female Fertility in Lake Providence
Fertility by Age in Lake Providence
Average fertility rate in Lake Providence is 165.0 births per 1,000 women. Women in the age bracket of 20 to 34 years have the highest fertility rate with 372.0 births per 1,000 women. Women in the age bracket of 20 to 34 years acount for 100.0% of all women with births.
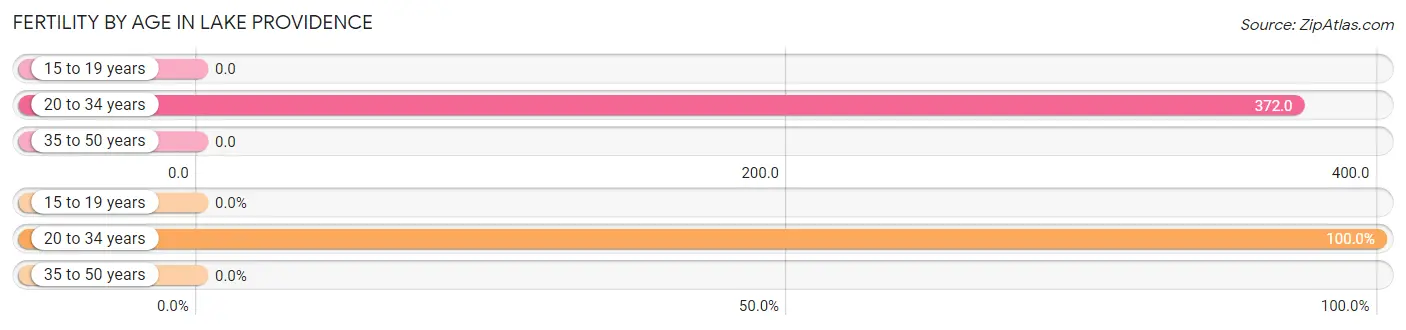
| Age Bracket | Women with Births | Births / 1,000 Women |
| 15 to 19 years | 0 (0.0%) | 0.0 |
| 20 to 34 years | 134 (100.0%) | 372.0 |
| 35 to 50 years | 0 (0.0%) | 0.0 |
| Total | 134 (100.0%) | 165.0 |
Fertility by Age by Marriage Status in Lake Providence
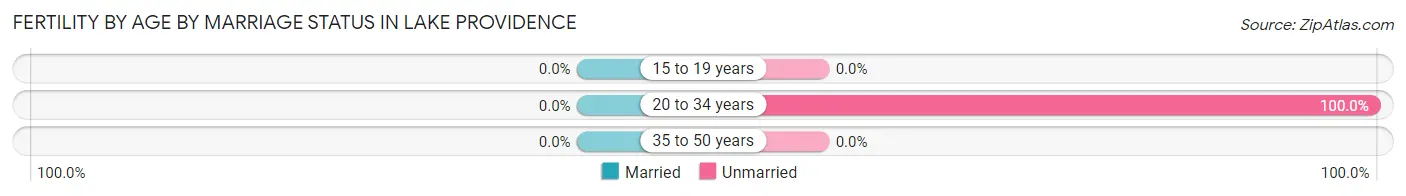
| Age Bracket | Married | Unmarried |
| 15 to 19 years | 0 (0.0%) | 0 (0.0%) |
| 20 to 34 years | 0 (0.0%) | 134 (100.0%) |
| 35 to 50 years | 0 (0.0%) | 0 (0.0%) |
| Total | 0 (0.0%) | 134 (100.0%) |
Fertility by Education in Lake Providence
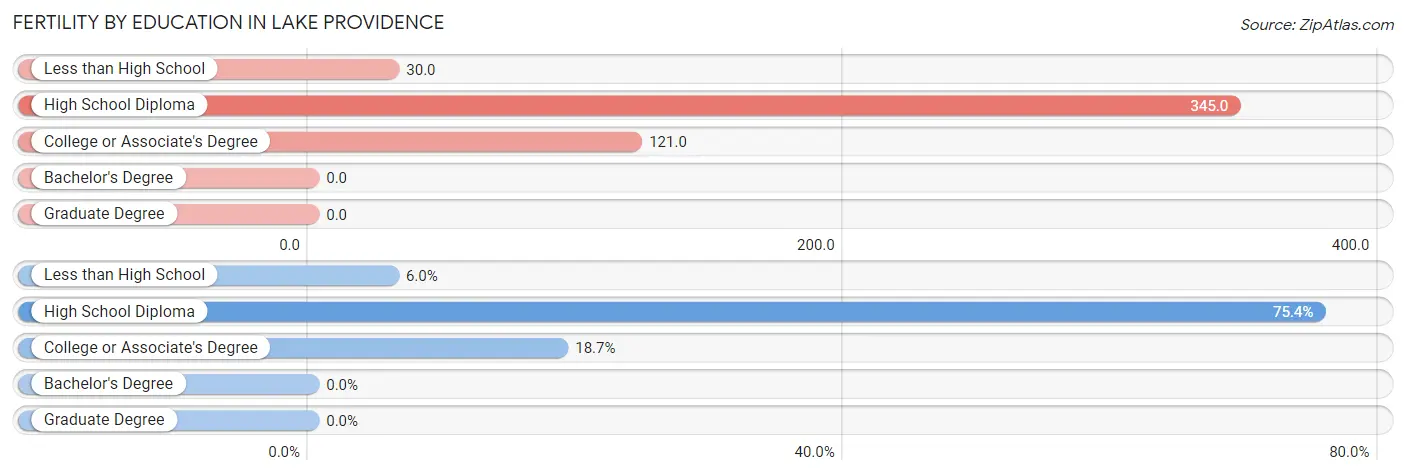
| Educational Attainment | Women with Births | Births / 1,000 Women |
| Less than High School | 8 (6.0%) | 30.0 |
| High School Diploma | 101 (75.4%) | 345.0 |
| College or Associate's Degree | 25 (18.7%) | 121.0 |
| Bachelor's Degree | 0 (0.0%) | 0.0 |
| Graduate Degree | 0 (0.0%) | 0.0 |
| Total | 134 (100.0%) | 165.0 |
Fertility by Education by Marriage Status in Lake Providence
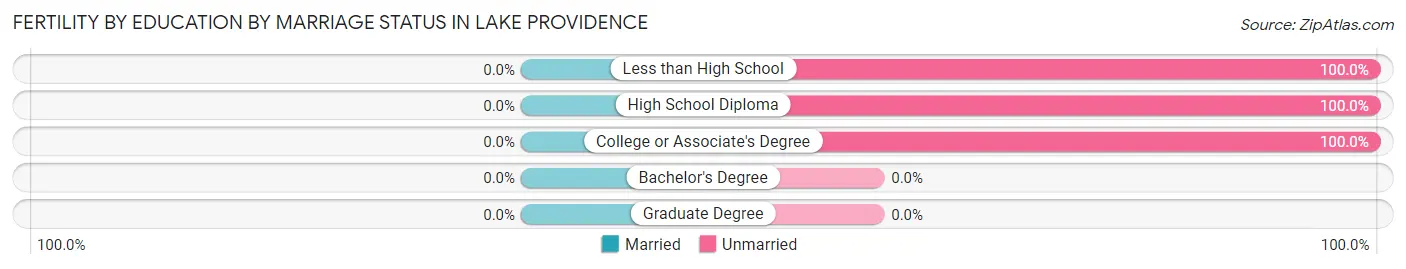
| Educational Attainment | Married | Unmarried |
| Less than High School | 0 (0.0%) | 8 (100.0%) |
| High School Diploma | 0 (0.0%) | 101 (100.0%) |
| College or Associate's Degree | 0 (0.0%) | 25 (100.0%) |
| Bachelor's Degree | 0 (0.0%) | 0 (0.0%) |
| Graduate Degree | 0 (0.0%) | 0 (0.0%) |
| Total | 0 (0.0%) | 134 (100.0%) |
Employment Characteristics in Lake Providence
Employment by Class of Employer in Lake Providence
Among the 943 employed individuals in Lake Providence, private company employees (526 | 55.8%), federal government employees (139 | 14.7%), and local government employees (99 | 10.5%) make up the most common classes of employment.
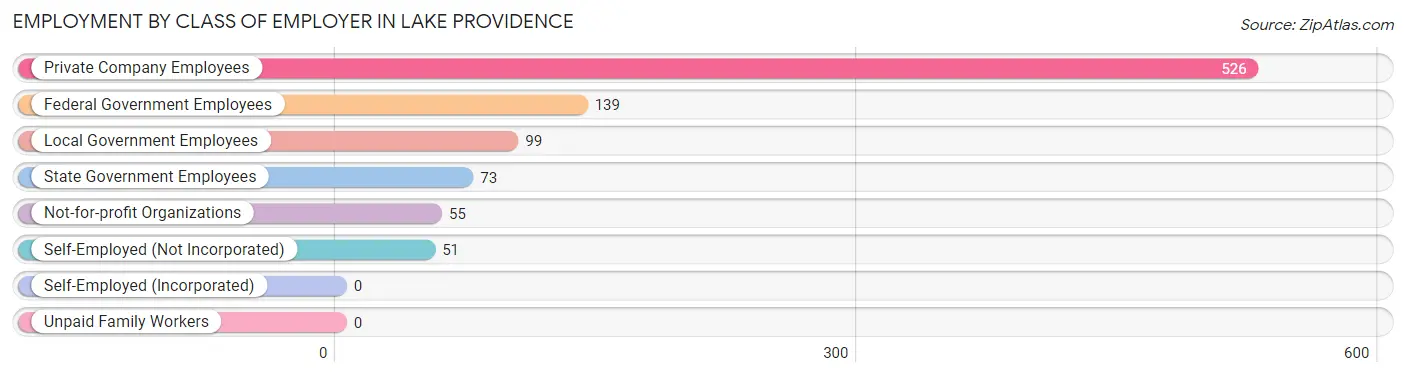
| Employer Class | # Employees | % Employees |
| Private Company Employees | 526 | 55.8% |
| Self-Employed (Incorporated) | 0 | 0.0% |
| Self-Employed (Not Incorporated) | 51 | 5.4% |
| Not-for-profit Organizations | 55 | 5.8% |
| Local Government Employees | 99 | 10.5% |
| State Government Employees | 73 | 7.7% |
| Federal Government Employees | 139 | 14.7% |
| Unpaid Family Workers | 0 | 0.0% |
| Total | 943 | 100.0% |
Employment Status by Age in Lake Providence
According to the labor force statistics for Lake Providence, out of the total population over 16 years of age (2,366), 49.6% or 1,174 individuals are in the labor force, with 13.6% or 160 of them unemployed. The age group with the highest labor force participation rate is 45 to 54 years, with 96.9% or 250 individuals in the labor force. Within the labor force, the 25 to 29 years age range has the highest percentage of unemployed individuals, with 86.2% or 137 of them being unemployed.
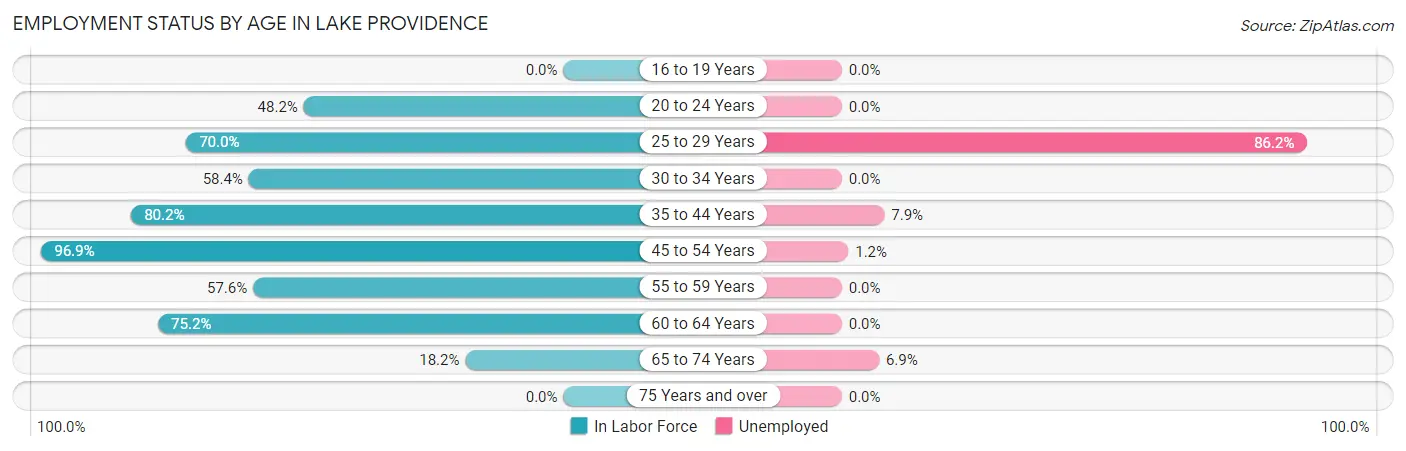
| Age Bracket | In Labor Force | Unemployed |
| 16 to 19 Years | 0 (0.0%) | 0 (0.0%) |
| 20 to 24 Years | 119 (48.2%) | 0 (0.0%) |
| 25 to 29 Years | 159 (70.0%) | 137 (86.2%) |
| 30 to 34 Years | 66 (58.4%) | 0 (0.0%) |
| 35 to 44 Years | 203 (80.2%) | 16 (7.9%) |
| 45 to 54 Years | 250 (96.9%) | 3 (1.2%) |
| 55 to 59 Years | 118 (57.6%) | 0 (0.0%) |
| 60 to 64 Years | 200 (75.2%) | 0 (0.0%) |
| 65 to 74 Years | 58 (18.2%) | 4 (6.9%) |
| 75 Years and over | 0 (0.0%) | 0 (0.0%) |
| Total | 1,174 (49.6%) | 160 (13.6%) |
Employment Status by Educational Attainment in Lake Providence
According to labor force statistics for Lake Providence, 75.3% of individuals (995) out of the total population between 25 and 64 years of age (1,322) are in the labor force, with 15.7% or 156 of them being unemployed. The group with the highest labor force participation rate are those with the educational attainment of bachelor's degree or higher, with 98.2% or 215 individuals in the labor force. Within the labor force, individuals with college / associate degree education have the highest percentage of unemployment, with 27.6% or 85 of them being unemployed.
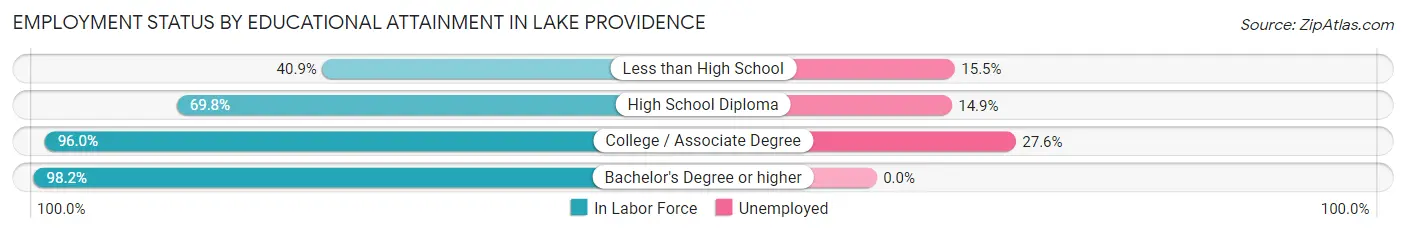
| Educational Attainment | In Labor Force | Unemployed |
| Less than High School | 103 (40.9%) | 39 (15.5%) |
| High School Diploma | 370 (69.8%) | 79 (14.9%) |
| College / Associate Degree | 308 (96.0%) | 89 (27.6%) |
| Bachelor's Degree or higher | 215 (98.2%) | 0 (0.0%) |
| Total | 995 (75.3%) | 208 (15.7%) |
Employment Occupations by Sex in Lake Providence
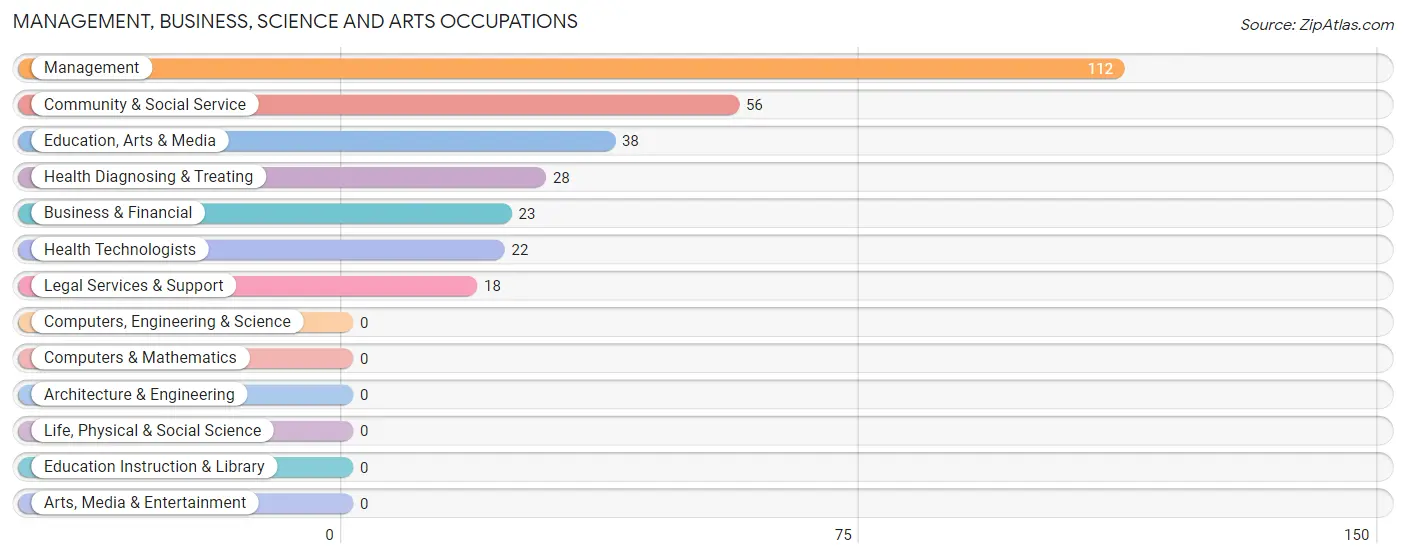
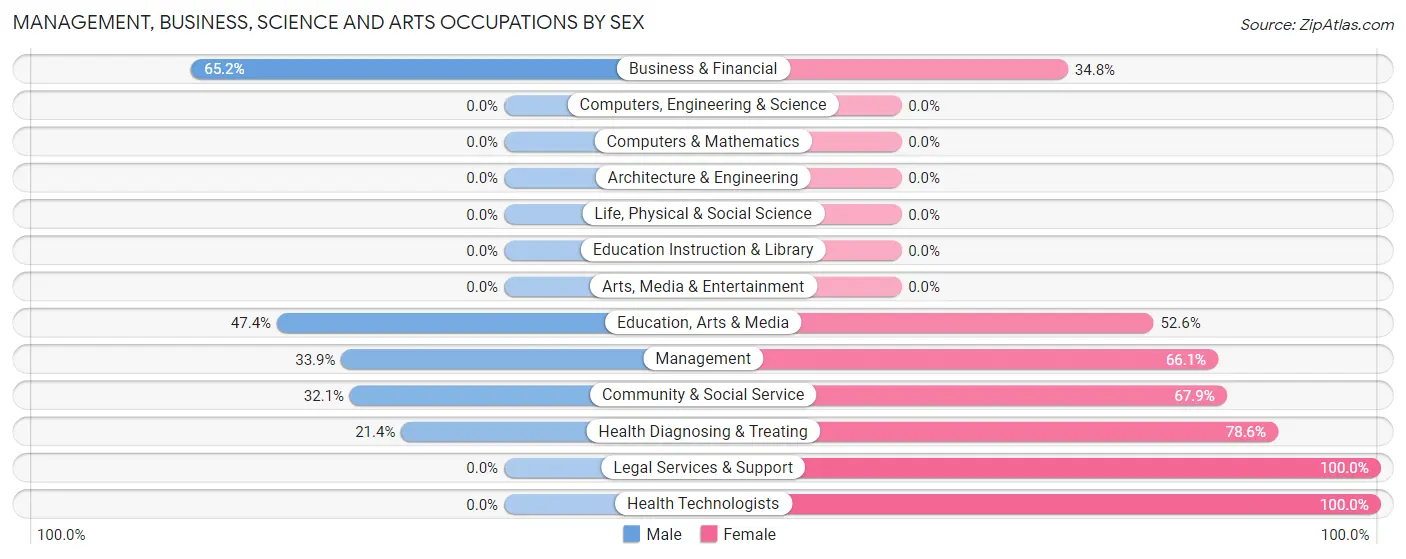
Management, Business, Science and Arts Occupations
The most common Management, Business, Science and Arts occupations in Lake Providence are Management (112 | 11.1%), Community & Social Service (56 | 5.5%), Education, Arts & Media (38 | 3.7%), Health Diagnosing & Treating (28 | 2.8%), and Business & Financial (23 | 2.3%).
Management, Business, Science and Arts Occupations by Sex
Within the Management, Business, Science and Arts occupations in Lake Providence, the most male-oriented occupations are Business & Financial (65.2%), Education, Arts & Media (47.4%), and Management (33.9%), while the most female-oriented occupations are Legal Services & Support (100.0%), Health Technologists (100.0%), and Health Diagnosing & Treating (78.6%).
| Occupation | Male | Female |
| Management | 38 (33.9%) | 74 (66.1%) |
| Business & Financial | 15 (65.2%) | 8 (34.8%) |
| Computers, Engineering & Science | 0 (0.0%) | 0 (0.0%) |
| Computers & Mathematics | 0 (0.0%) | 0 (0.0%) |
| Architecture & Engineering | 0 (0.0%) | 0 (0.0%) |
| Life, Physical & Social Science | 0 (0.0%) | 0 (0.0%) |
| Community & Social Service | 18 (32.1%) | 38 (67.9%) |
| Education, Arts & Media | 18 (47.4%) | 20 (52.6%) |
| Legal Services & Support | 0 (0.0%) | 18 (100.0%) |
| Education Instruction & Library | 0 (0.0%) | 0 (0.0%) |
| Arts, Media & Entertainment | 0 (0.0%) | 0 (0.0%) |
| Health Diagnosing & Treating | 6 (21.4%) | 22 (78.6%) |
| Health Technologists | 0 (0.0%) | 22 (100.0%) |
| Total (Category) | 77 (35.2%) | 142 (64.8%) |
| Total (Overall) | 490 (48.4%) | 523 (51.6%) |
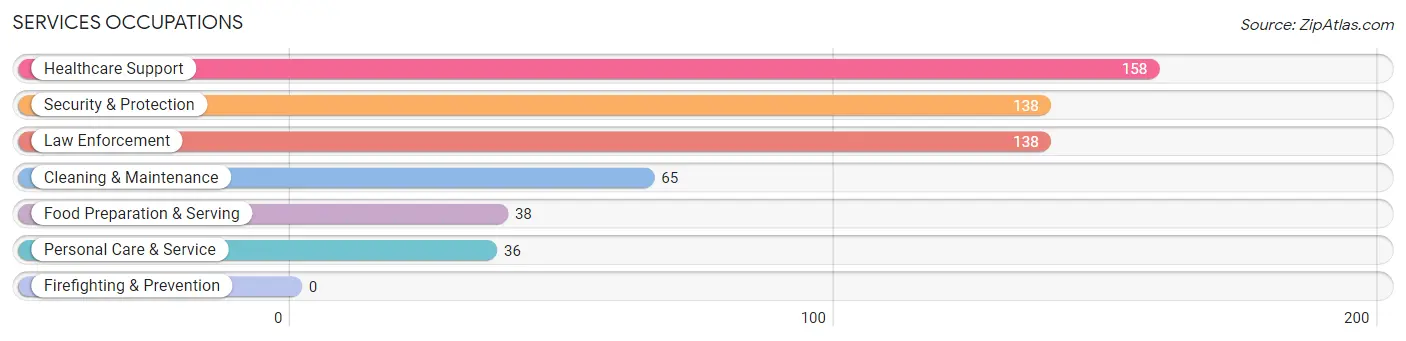
Services Occupations
The most common Services occupations in Lake Providence are Healthcare Support (158 | 15.6%), Security & Protection (138 | 13.6%), Law Enforcement (138 | 13.6%), Cleaning & Maintenance (65 | 6.4%), and Food Preparation & Serving (38 | 3.7%).
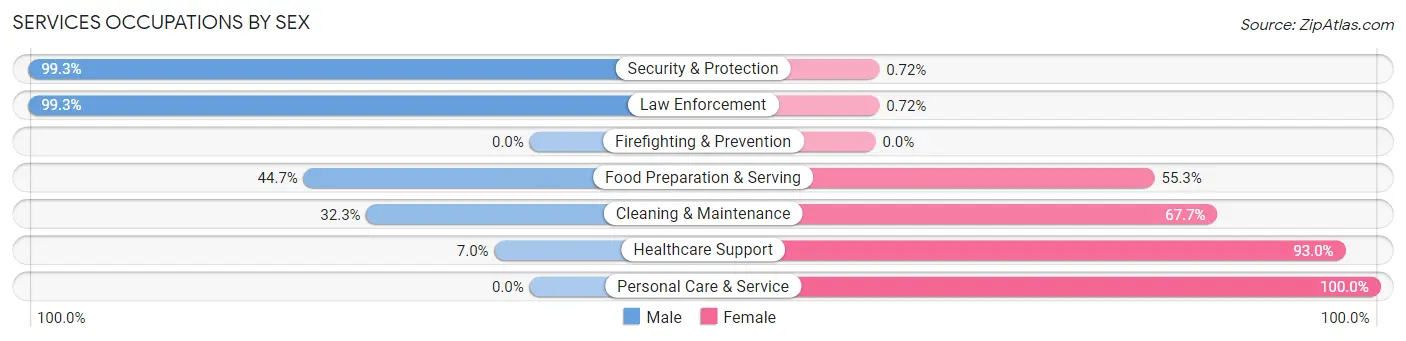
Services Occupations by Sex
Within the Services occupations in Lake Providence, the most male-oriented occupations are Security & Protection (99.3%), Law Enforcement (99.3%), and Food Preparation & Serving (44.7%), while the most female-oriented occupations are Personal Care & Service (100.0%), Healthcare Support (93.0%), and Cleaning & Maintenance (67.7%).
| Occupation | Male | Female |
| Healthcare Support | 11 (7.0%) | 147 (93.0%) |
| Security & Protection | 137 (99.3%) | 1 (0.7%) |
| Firefighting & Prevention | 0 (0.0%) | 0 (0.0%) |
| Law Enforcement | 137 (99.3%) | 1 (0.7%) |
| Food Preparation & Serving | 17 (44.7%) | 21 (55.3%) |
| Cleaning & Maintenance | 21 (32.3%) | 44 (67.7%) |
| Personal Care & Service | 0 (0.0%) | 36 (100.0%) |
| Total (Category) | 186 (42.8%) | 249 (57.2%) |
| Total (Overall) | 490 (48.4%) | 523 (51.6%) |
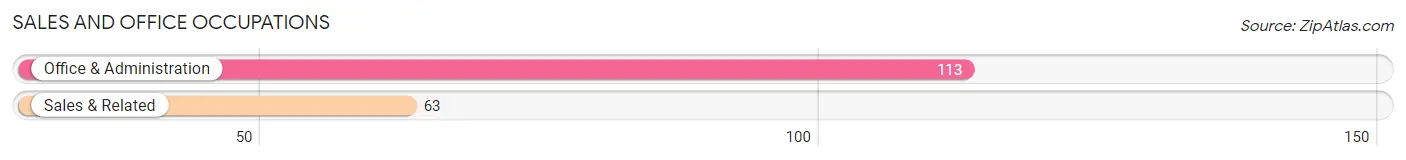
Sales and Office Occupations
The most common Sales and Office occupations in Lake Providence are Office & Administration (113 | 11.2%), and Sales & Related (63 | 6.2%).
Sales and Office Occupations by Sex
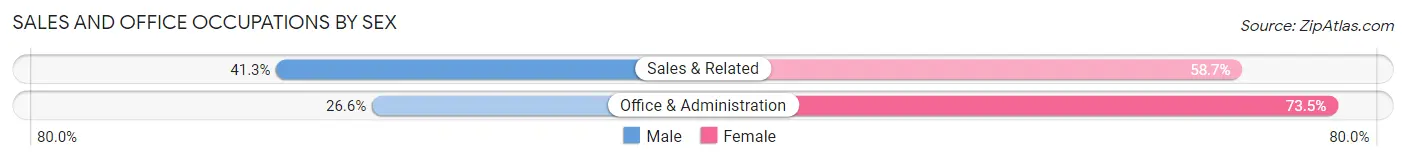
| Occupation | Male | Female |
| Sales & Related | 26 (41.3%) | 37 (58.7%) |
| Office & Administration | 30 (26.6%) | 83 (73.5%) |
| Total (Category) | 56 (31.8%) | 120 (68.2%) |
| Total (Overall) | 490 (48.4%) | 523 (51.6%) |
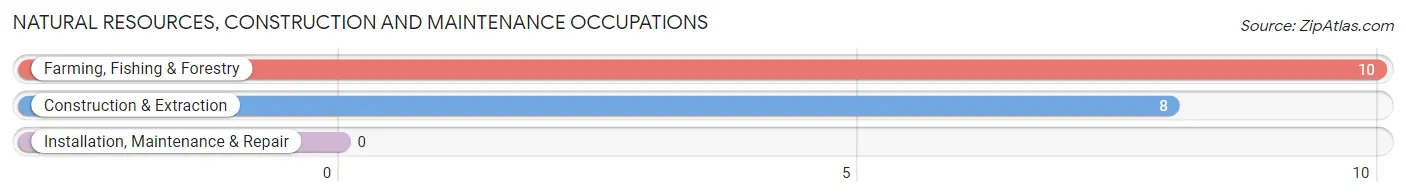
Natural Resources, Construction and Maintenance Occupations
The most common Natural Resources, Construction and Maintenance occupations in Lake Providence are Farming, Fishing & Forestry (10 | 1.0%), and Construction & Extraction (8 | 0.8%).
Natural Resources, Construction and Maintenance Occupations by Sex
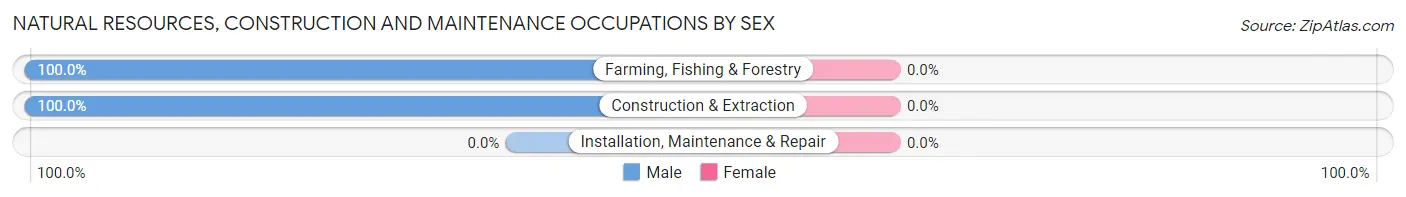
| Occupation | Male | Female |
| Farming, Fishing & Forestry | 10 (100.0%) | 0 (0.0%) |
| Construction & Extraction | 8 (100.0%) | 0 (0.0%) |
| Installation, Maintenance & Repair | 0 (0.0%) | 0 (0.0%) |
| Total (Category) | 18 (100.0%) | 0 (0.0%) |
| Total (Overall) | 490 (48.4%) | 523 (51.6%) |
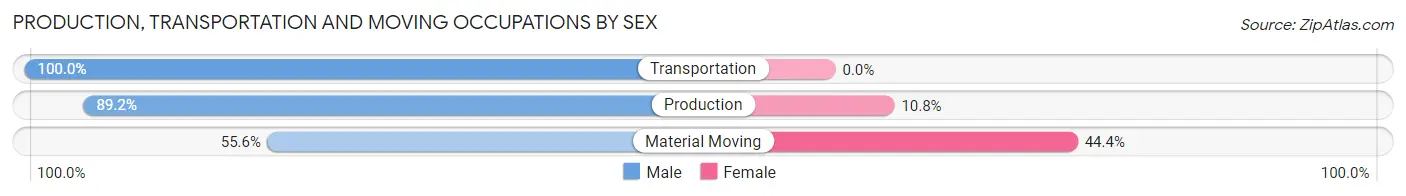
Production, Transportation and Moving Occupations
The most common Production, Transportation and Moving occupations in Lake Providence are Transportation (82 | 8.1%), Production (74 | 7.3%), and Material Moving (9 | 0.9%).
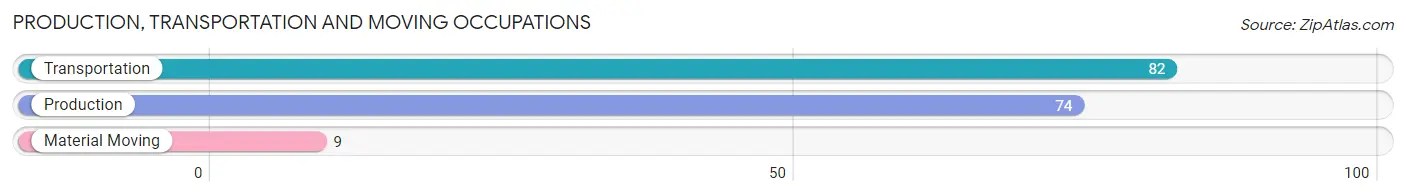
Production, Transportation and Moving Occupations by Sex
| Occupation | Male | Female |
| Production | 66 (89.2%) | 8 (10.8%) |
| Transportation | 82 (100.0%) | 0 (0.0%) |
| Material Moving | 5 (55.6%) | 4 (44.4%) |
| Total (Category) | 153 (92.7%) | 12 (7.3%) |
| Total (Overall) | 490 (48.4%) | 523 (51.6%) |
Employment Industries by Sex in Lake Providence
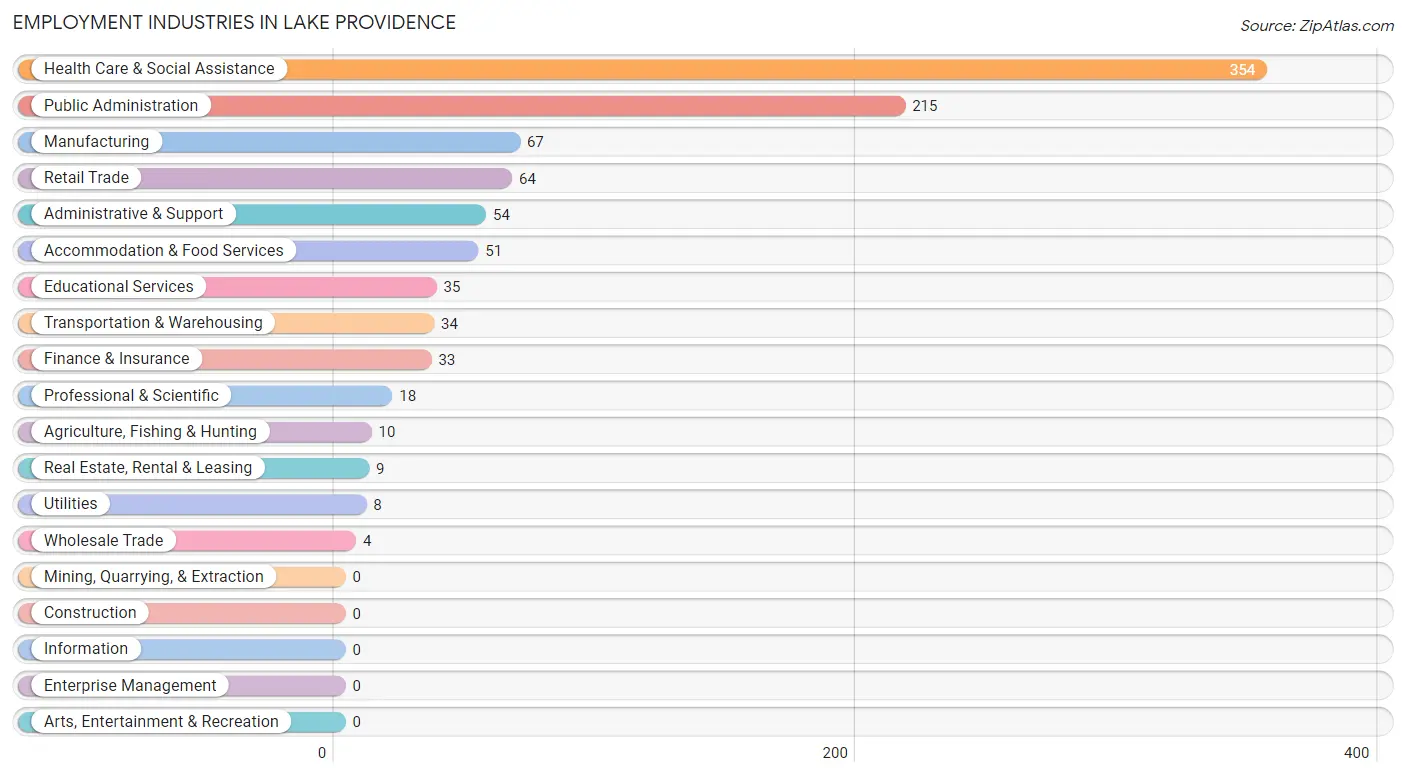
Employment Industries in Lake Providence
The major employment industries in Lake Providence include Health Care & Social Assistance (354 | 34.9%), Public Administration (215 | 21.2%), Manufacturing (67 | 6.6%), Retail Trade (64 | 6.3%), and Administrative & Support (54 | 5.3%).
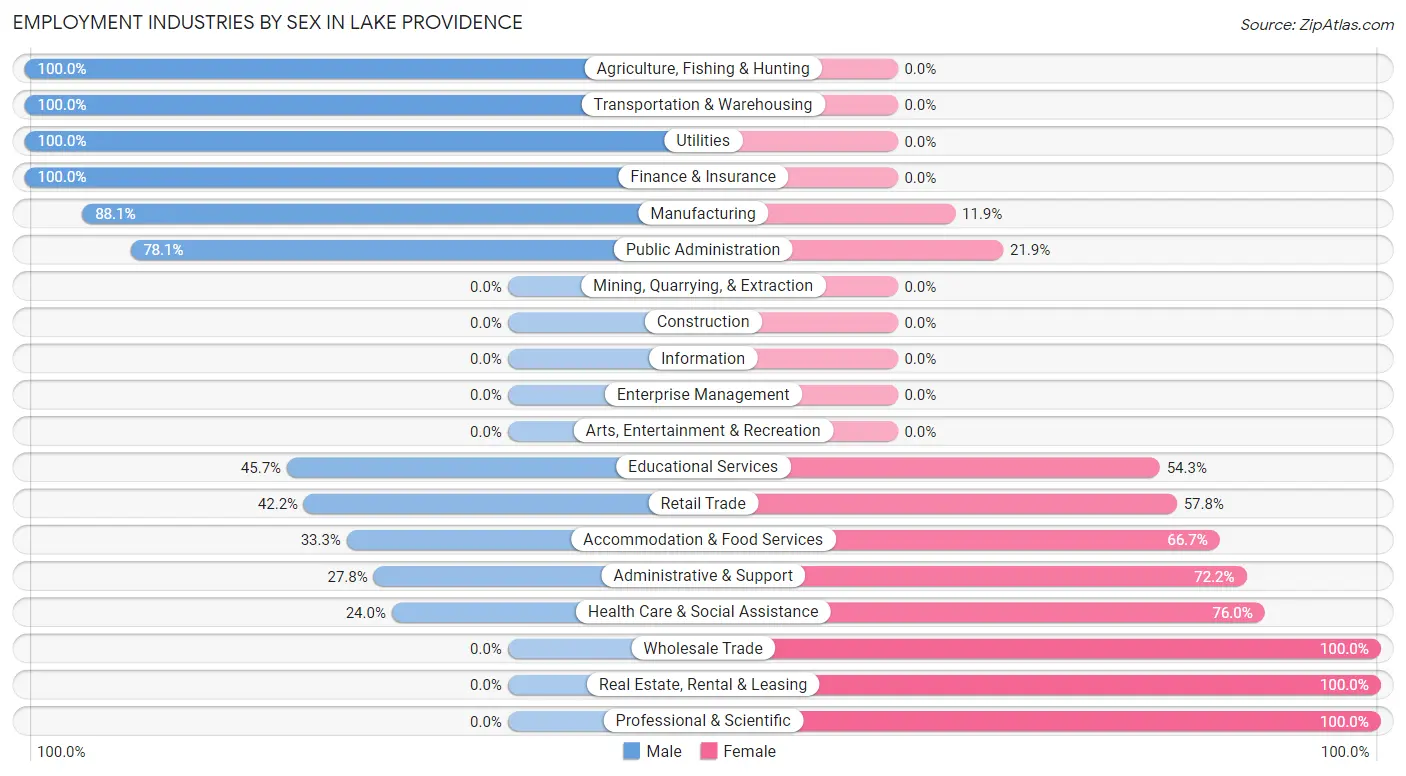
Employment Industries by Sex in Lake Providence
The Lake Providence industries that see more men than women are Agriculture, Fishing & Hunting (100.0%), Transportation & Warehousing (100.0%), and Utilities (100.0%), whereas the industries that tend to have a higher number of women are Wholesale Trade (100.0%), Real Estate, Rental & Leasing (100.0%), and Professional & Scientific (100.0%).
| Industry | Male | Female |
| Agriculture, Fishing & Hunting | 10 (100.0%) | 0 (0.0%) |
| Mining, Quarrying, & Extraction | 0 (0.0%) | 0 (0.0%) |
| Construction | 0 (0.0%) | 0 (0.0%) |
| Manufacturing | 59 (88.1%) | 8 (11.9%) |
| Wholesale Trade | 0 (0.0%) | 4 (100.0%) |
| Retail Trade | 27 (42.2%) | 37 (57.8%) |
| Transportation & Warehousing | 34 (100.0%) | 0 (0.0%) |
| Utilities | 8 (100.0%) | 0 (0.0%) |
| Information | 0 (0.0%) | 0 (0.0%) |
| Finance & Insurance | 33 (100.0%) | 0 (0.0%) |
| Real Estate, Rental & Leasing | 0 (0.0%) | 9 (100.0%) |
| Professional & Scientific | 0 (0.0%) | 18 (100.0%) |
| Enterprise Management | 0 (0.0%) | 0 (0.0%) |
| Administrative & Support | 15 (27.8%) | 39 (72.2%) |
| Educational Services | 16 (45.7%) | 19 (54.3%) |
| Health Care & Social Assistance | 85 (24.0%) | 269 (76.0%) |
| Arts, Entertainment & Recreation | 0 (0.0%) | 0 (0.0%) |
| Accommodation & Food Services | 17 (33.3%) | 34 (66.7%) |
| Public Administration | 168 (78.1%) | 47 (21.9%) |
| Total | 490 (48.4%) | 523 (51.6%) |
Education in Lake Providence
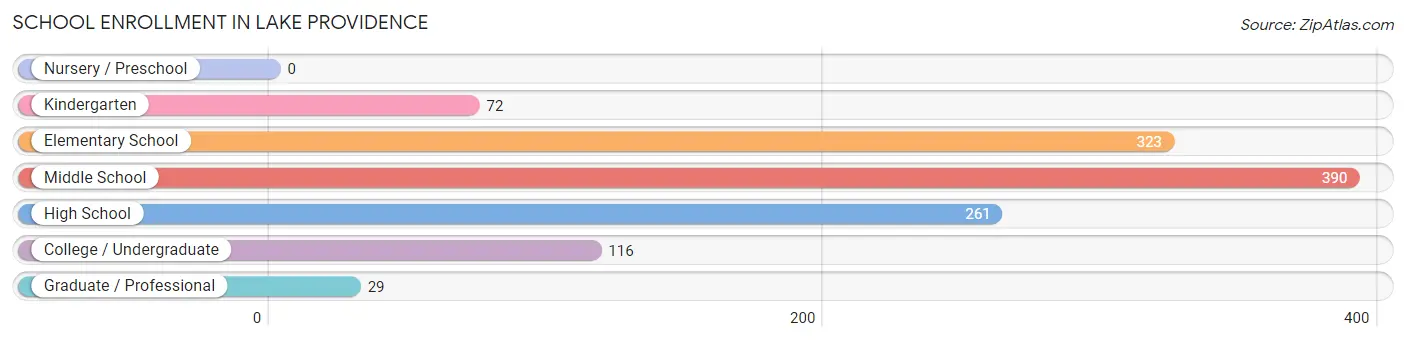
School Enrollment in Lake Providence
The most common levels of schooling among the 1,191 students in Lake Providence are middle school (390 | 32.8%), elementary school (323 | 27.1%), and high school (261 | 21.9%).
| School Level | # Students | % Students |
| Nursery / Preschool | 0 | 0.0% |
| Kindergarten | 72 | 6.0% |
| Elementary School | 323 | 27.1% |
| Middle School | 390 | 32.8% |
| High School | 261 | 21.9% |
| College / Undergraduate | 116 | 9.7% |
| Graduate / Professional | 29 | 2.4% |
| Total | 1,191 | 100.0% |
School Enrollment by Age by Funding Source in Lake Providence
Out of a total of 1,191 students who are enrolled in schools in Lake Providence, 138 (11.6%) attend a private institution, while the remaining 1,053 (88.4%) are enrolled in public schools. The age group of 10 to 14 year olds has the highest likelihood of being enrolled in private schools, with 120 (20.2% in the age bracket) enrolled. Conversely, the age group of 15 to 17 year olds has the lowest likelihood of being enrolled in a private school, with 134 (100.0% in the age bracket) attending a public institution.
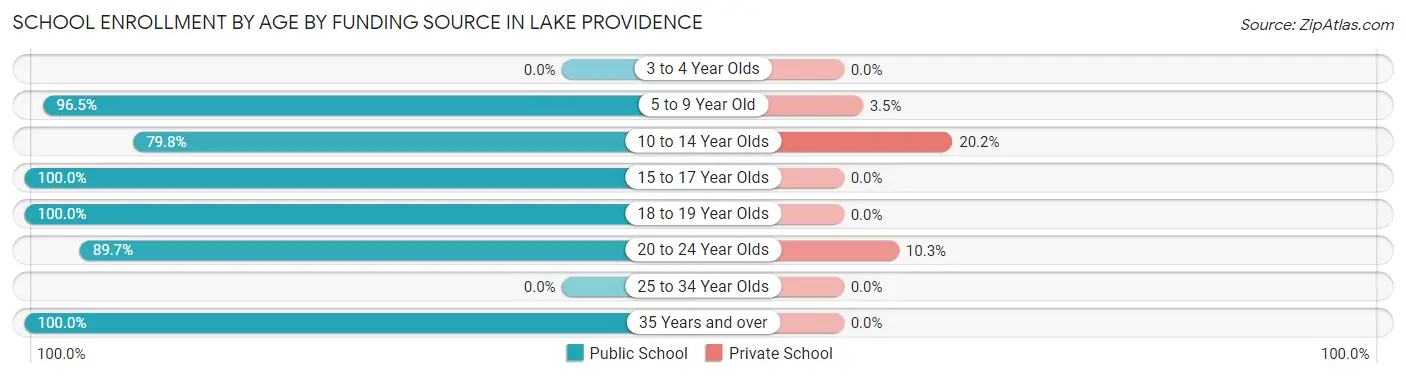
| Age Bracket | Public School | Private School |
| 3 to 4 Year Olds | 0 (0.0%) | 0 (0.0%) |
| 5 to 9 Year Old | 300 (96.5%) | 11 (3.5%) |
| 10 to 14 Year Olds | 473 (79.8%) | 120 (20.2%) |
| 15 to 17 Year Olds | 134 (100.0%) | 0 (0.0%) |
| 18 to 19 Year Olds | 49 (100.0%) | 0 (0.0%) |
| 20 to 24 Year Olds | 61 (89.7%) | 7 (10.3%) |
| 25 to 34 Year Olds | 0 (0.0%) | 0 (0.0%) |
| 35 Years and over | 36 (100.0%) | 0 (0.0%) |
| Total | 1,053 (88.4%) | 138 (11.6%) |
Educational Attainment by Field of Study in Lake Providence
Social sciences (142 | 39.7%), business (56 | 15.6%), computers & mathematics (41 | 11.5%), science & technology (30 | 8.4%), and education (21 | 5.9%) are the most common fields of study among 358 individuals in Lake Providence who have obtained a bachelor's degree or higher.
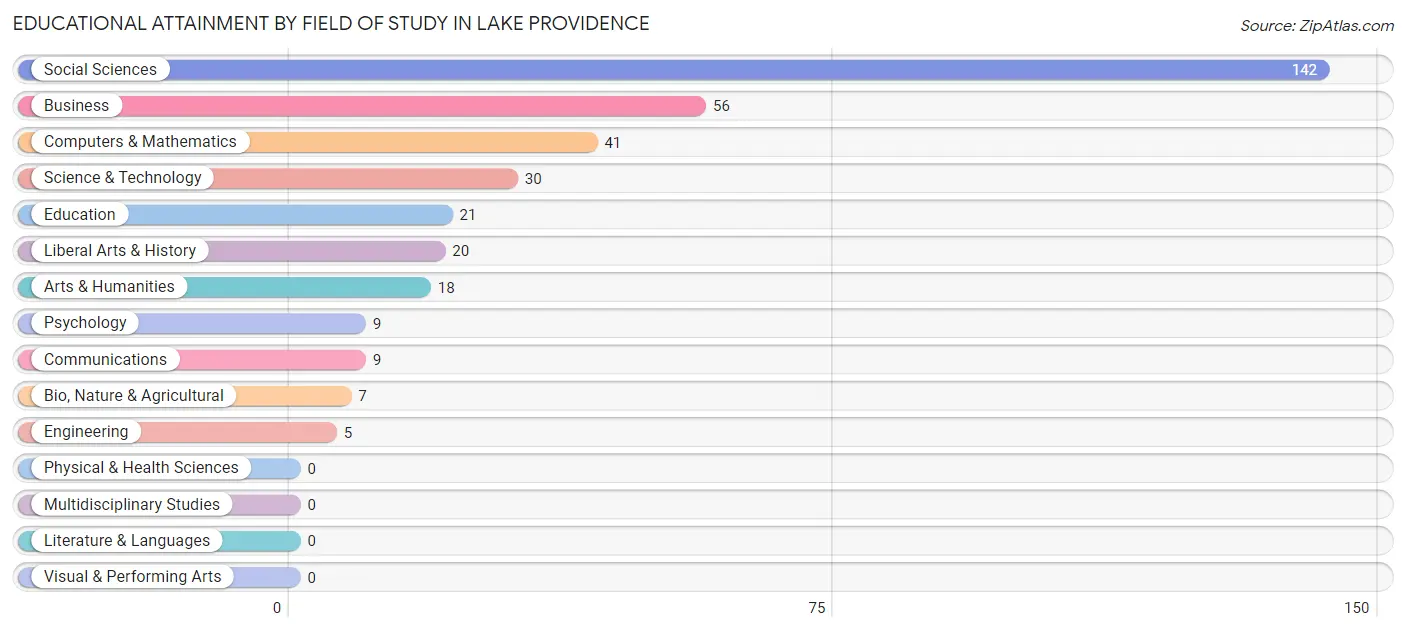
| Field of Study | # Graduates | % Graduates |
| Computers & Mathematics | 41 | 11.5% |
| Bio, Nature & Agricultural | 7 | 2.0% |
| Physical & Health Sciences | 0 | 0.0% |
| Psychology | 9 | 2.5% |
| Social Sciences | 142 | 39.7% |
| Engineering | 5 | 1.4% |
| Multidisciplinary Studies | 0 | 0.0% |
| Science & Technology | 30 | 8.4% |
| Business | 56 | 15.6% |
| Education | 21 | 5.9% |
| Literature & Languages | 0 | 0.0% |
| Liberal Arts & History | 20 | 5.6% |
| Visual & Performing Arts | 0 | 0.0% |
| Communications | 9 | 2.5% |
| Arts & Humanities | 18 | 5.0% |
| Total | 358 | 100.0% |
Transportation & Commute in Lake Providence
Vehicle Availability by Sex in Lake Providence
The most prevalent vehicle ownership categories in Lake Providence are males with 2 vehicles (266, accounting for 54.3%) and females with 2 vehicles (180, making up 58.7%).
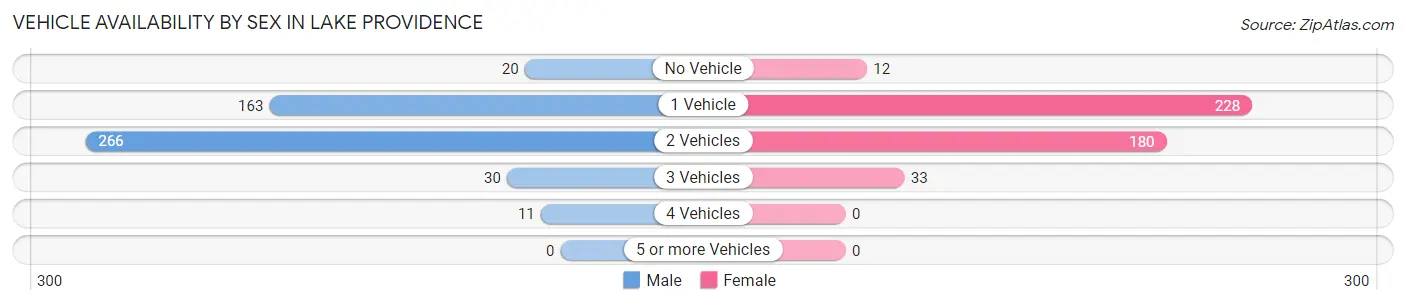
| Vehicles Available | Male | Female |
| No Vehicle | 20 (4.1%) | 12 (2.6%) |
| 1 Vehicle | 163 (33.3%) | 228 (50.3%) |
| 2 Vehicles | 266 (54.3%) | 180 (39.7%) |
| 3 Vehicles | 30 (6.1%) | 33 (7.3%) |
| 4 Vehicles | 11 (2.2%) | 0 (0.0%) |
| 5 or more Vehicles | 0 (0.0%) | 0 (0.0%) |
| Total | 490 (100.0%) | 453 (100.0%) |
Commute Time in Lake Providence
The most frequently occuring commute durations in Lake Providence are 10 to 14 minutes (283 commuters, 30.0%), 5 to 9 minutes (243 commuters, 25.8%), and 15 to 19 minutes (131 commuters, 13.9%).
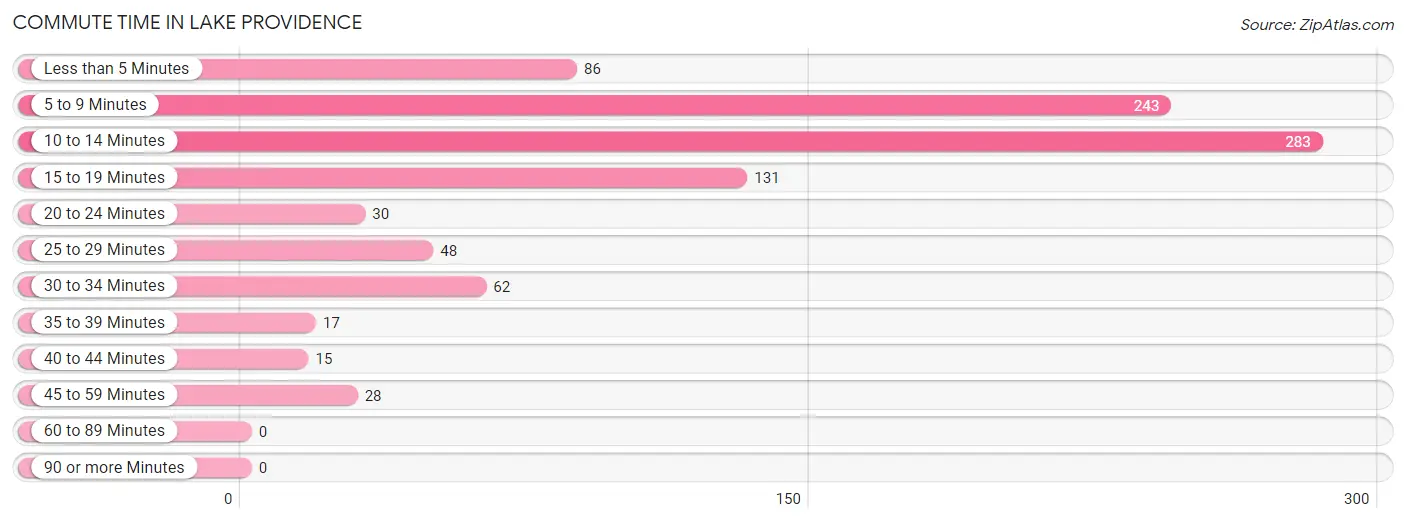
| Commute Time | # Commuters | % Commuters |
| Less than 5 Minutes | 86 | 9.1% |
| 5 to 9 Minutes | 243 | 25.8% |
| 10 to 14 Minutes | 283 | 30.0% |
| 15 to 19 Minutes | 131 | 13.9% |
| 20 to 24 Minutes | 30 | 3.2% |
| 25 to 29 Minutes | 48 | 5.1% |
| 30 to 34 Minutes | 62 | 6.6% |
| 35 to 39 Minutes | 17 | 1.8% |
| 40 to 44 Minutes | 15 | 1.6% |
| 45 to 59 Minutes | 28 | 3.0% |
| 60 to 89 Minutes | 0 | 0.0% |
| 90 or more Minutes | 0 | 0.0% |
Commute Time by Sex in Lake Providence
The most common commute times in Lake Providence are 10 to 14 minutes (167 commuters, 34.1%) for males and 5 to 9 minutes (194 commuters, 42.8%) for females.
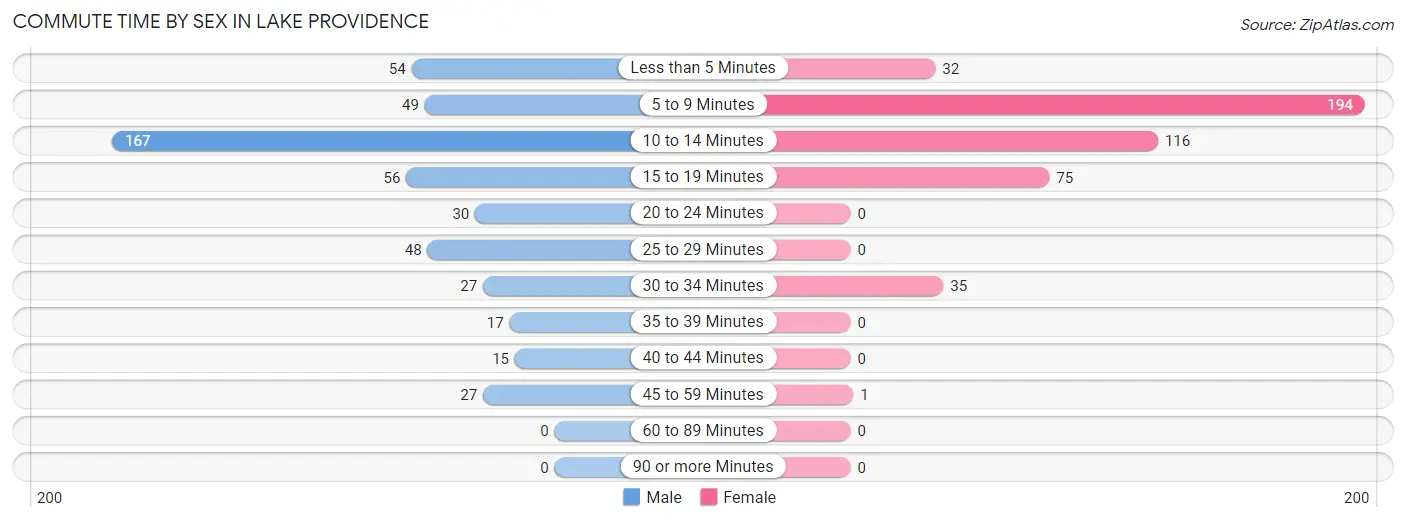
| Commute Time | Male | Female |
| Less than 5 Minutes | 54 (11.0%) | 32 (7.1%) |
| 5 to 9 Minutes | 49 (10.0%) | 194 (42.8%) |
| 10 to 14 Minutes | 167 (34.1%) | 116 (25.6%) |
| 15 to 19 Minutes | 56 (11.4%) | 75 (16.6%) |
| 20 to 24 Minutes | 30 (6.1%) | 0 (0.0%) |
| 25 to 29 Minutes | 48 (9.8%) | 0 (0.0%) |
| 30 to 34 Minutes | 27 (5.5%) | 35 (7.7%) |
| 35 to 39 Minutes | 17 (3.5%) | 0 (0.0%) |
| 40 to 44 Minutes | 15 (3.1%) | 0 (0.0%) |
| 45 to 59 Minutes | 27 (5.5%) | 1 (0.2%) |
| 60 to 89 Minutes | 0 (0.0%) | 0 (0.0%) |
| 90 or more Minutes | 0 (0.0%) | 0 (0.0%) |
Time of Departure to Work by Sex in Lake Providence
The most frequent times of departure to work in Lake Providence are 7:00 AM to 7:29 AM (140, 28.6%) for males and 7:00 AM to 7:29 AM (109, 24.1%) for females.
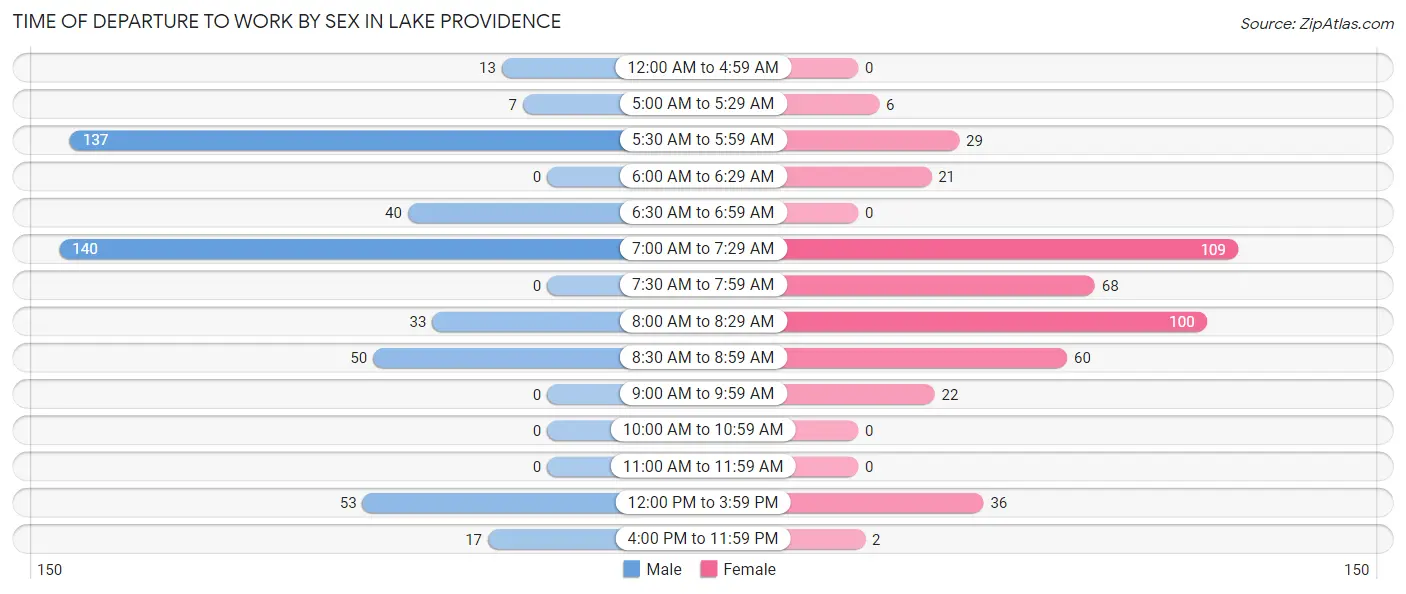
| Time of Departure | Male | Female |
| 12:00 AM to 4:59 AM | 13 (2.6%) | 0 (0.0%) |
| 5:00 AM to 5:29 AM | 7 (1.4%) | 6 (1.3%) |
| 5:30 AM to 5:59 AM | 137 (28.0%) | 29 (6.4%) |
| 6:00 AM to 6:29 AM | 0 (0.0%) | 21 (4.6%) |
| 6:30 AM to 6:59 AM | 40 (8.2%) | 0 (0.0%) |
| 7:00 AM to 7:29 AM | 140 (28.6%) | 109 (24.1%) |
| 7:30 AM to 7:59 AM | 0 (0.0%) | 68 (15.0%) |
| 8:00 AM to 8:29 AM | 33 (6.7%) | 100 (22.1%) |
| 8:30 AM to 8:59 AM | 50 (10.2%) | 60 (13.3%) |
| 9:00 AM to 9:59 AM | 0 (0.0%) | 22 (4.9%) |
| 10:00 AM to 10:59 AM | 0 (0.0%) | 0 (0.0%) |
| 11:00 AM to 11:59 AM | 0 (0.0%) | 0 (0.0%) |
| 12:00 PM to 3:59 PM | 53 (10.8%) | 36 (8.0%) |
| 4:00 PM to 11:59 PM | 17 (3.5%) | 2 (0.4%) |
| Total | 490 (100.0%) | 453 (100.0%) |
Housing Occupancy in Lake Providence
Occupancy by Ownership in Lake Providence
Of the total 1,388 dwellings in Lake Providence, owner-occupied units account for 677 (48.8%), while renter-occupied units make up 711 (51.2%).
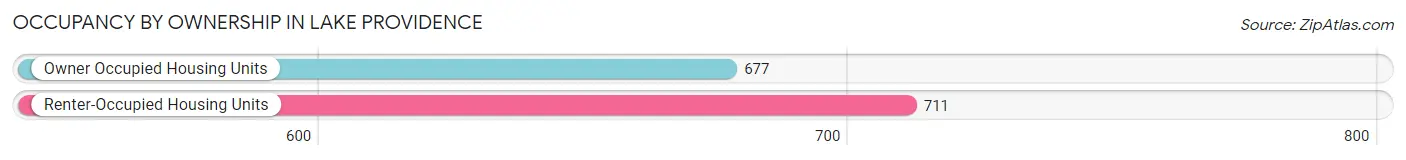
| Occupancy | # Housing Units | % Housing Units |
| Owner Occupied Housing Units | 677 | 48.8% |
| Renter-Occupied Housing Units | 711 | 51.2% |
| Total Occupied Housing Units | 1,388 | 100.0% |
Occupancy by Household Size in Lake Providence
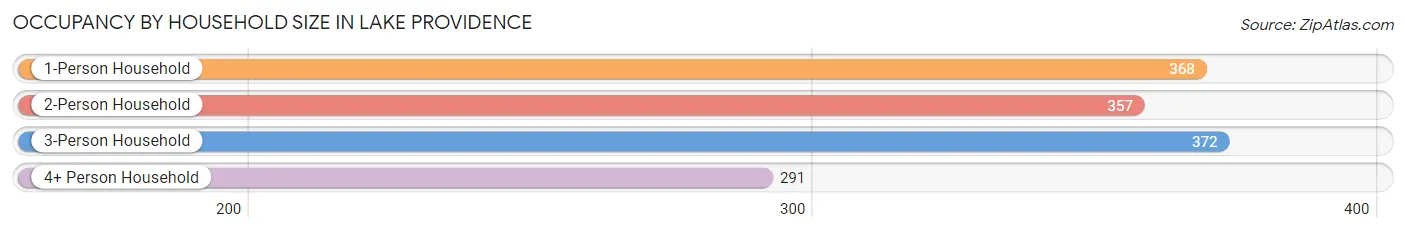
| Household Size | # Housing Units | % Housing Units |
| 1-Person Household | 368 | 26.5% |
| 2-Person Household | 357 | 25.7% |
| 3-Person Household | 372 | 26.8% |
| 4+ Person Household | 291 | 21.0% |
| Total Housing Units | 1,388 | 100.0% |
Occupancy by Ownership by Household Size in Lake Providence
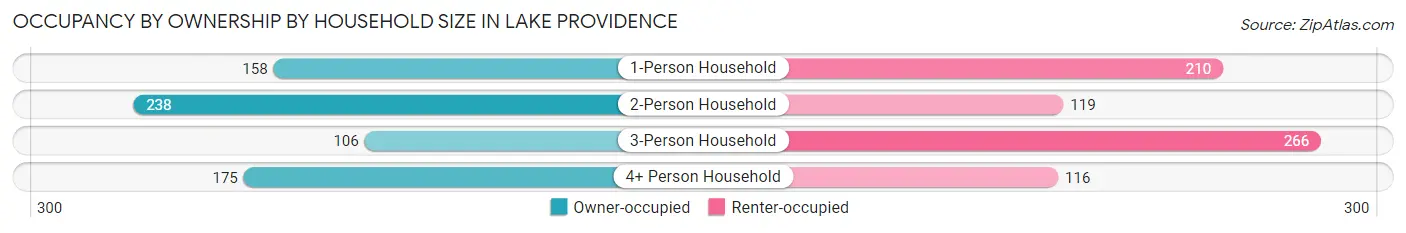
| Household Size | Owner-occupied | Renter-occupied |
| 1-Person Household | 158 (42.9%) | 210 (57.1%) |
| 2-Person Household | 238 (66.7%) | 119 (33.3%) |
| 3-Person Household | 106 (28.5%) | 266 (71.5%) |
| 4+ Person Household | 175 (60.1%) | 116 (39.9%) |
| Total Housing Units | 677 (48.8%) | 711 (51.2%) |
Occupancy by Educational Attainment in Lake Providence
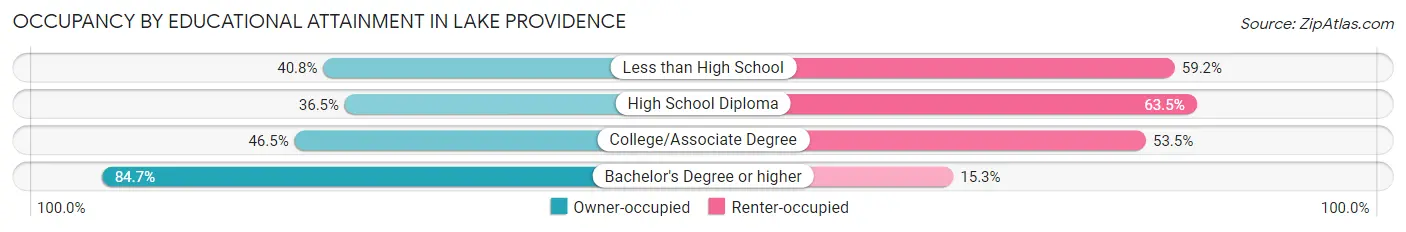
| Household Size | Owner-occupied | Renter-occupied |
| Less than High School | 157 (40.8%) | 228 (59.2%) |
| High School Diploma | 196 (36.5%) | 341 (63.5%) |
| College/Associate Degree | 86 (46.5%) | 99 (53.5%) |
| Bachelor's Degree or higher | 238 (84.7%) | 43 (15.3%) |
Occupancy by Age of Householder in Lake Providence
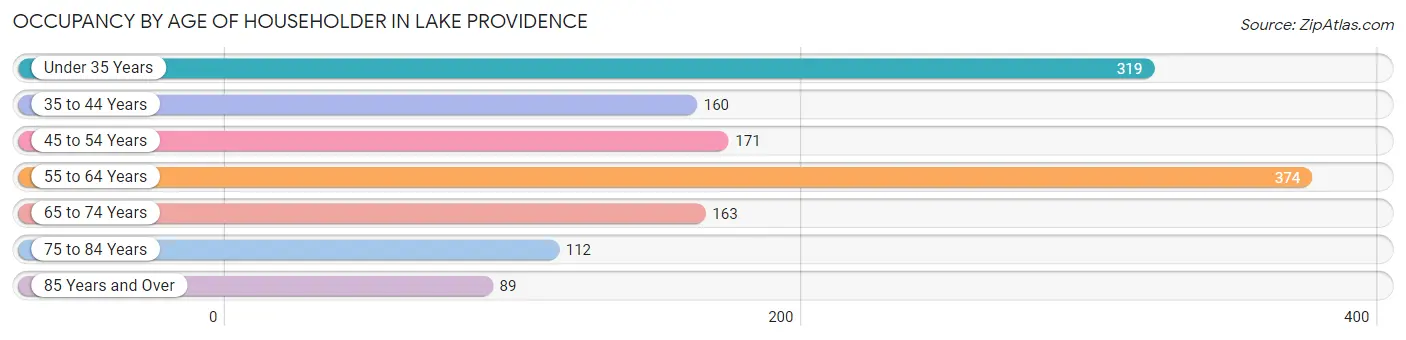
| Age Bracket | # Households | % Households |
| Under 35 Years | 319 | 23.0% |
| 35 to 44 Years | 160 | 11.5% |
| 45 to 54 Years | 171 | 12.3% |
| 55 to 64 Years | 374 | 27.0% |
| 65 to 74 Years | 163 | 11.7% |
| 75 to 84 Years | 112 | 8.1% |
| 85 Years and Over | 89 | 6.4% |
| Total | 1,388 | 100.0% |
Housing Finances in Lake Providence
Median Income by Occupancy in Lake Providence
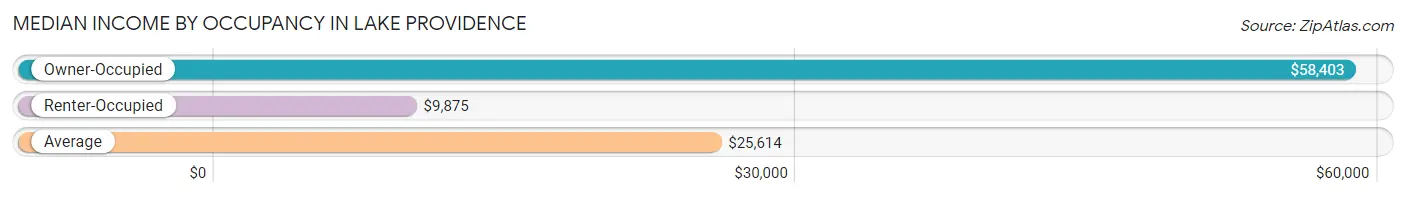
| Occupancy Type | # Households | Median Income |
| Owner-Occupied | 677 (48.8%) | $58,403 |
| Renter-Occupied | 711 (51.2%) | $9,875 |
| Average | 1,388 (100.0%) | $25,614 |
Occupancy by Householder Income Bracket in Lake Providence
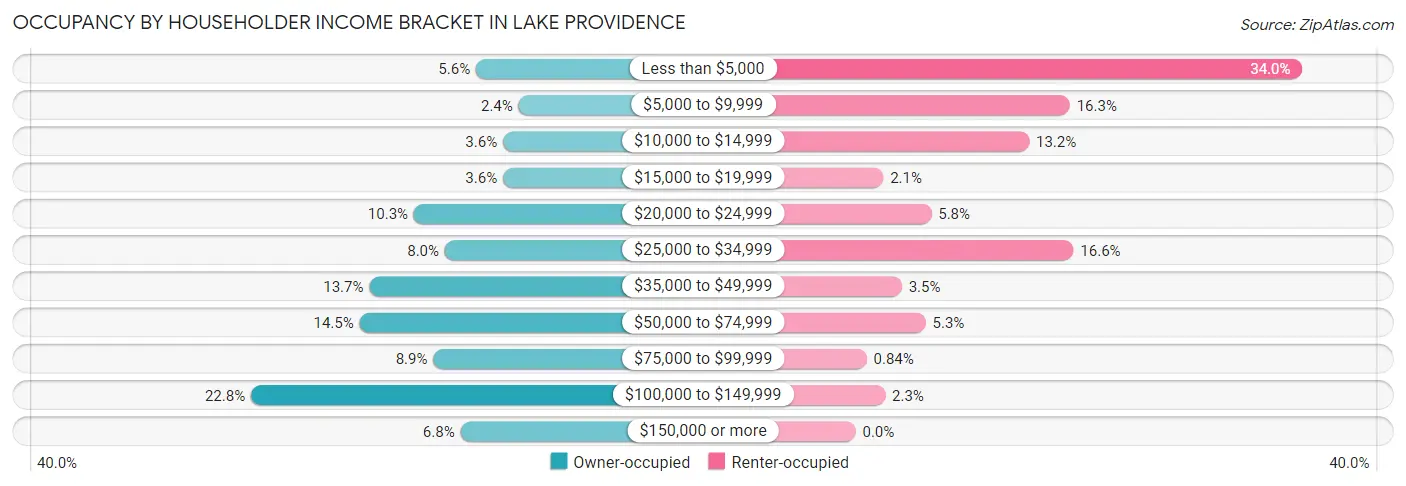
| Income Bracket | Owner-occupied | Renter-occupied |
| Less than $5,000 | 38 (5.6%) | 242 (34.0%) |
| $5,000 to $9,999 | 16 (2.4%) | 116 (16.3%) |
| $10,000 to $14,999 | 24 (3.5%) | 94 (13.2%) |
| $15,000 to $19,999 | 24 (3.5%) | 15 (2.1%) |
| $20,000 to $24,999 | 70 (10.3%) | 41 (5.8%) |
| $25,000 to $34,999 | 54 (8.0%) | 118 (16.6%) |
| $35,000 to $49,999 | 93 (13.7%) | 25 (3.5%) |
| $50,000 to $74,999 | 98 (14.5%) | 38 (5.3%) |
| $75,000 to $99,999 | 60 (8.9%) | 6 (0.8%) |
| $100,000 to $149,999 | 154 (22.8%) | 16 (2.2%) |
| $150,000 or more | 46 (6.8%) | 0 (0.0%) |
| Total | 677 (100.0%) | 711 (100.0%) |
Monthly Housing Cost Tiers in Lake Providence
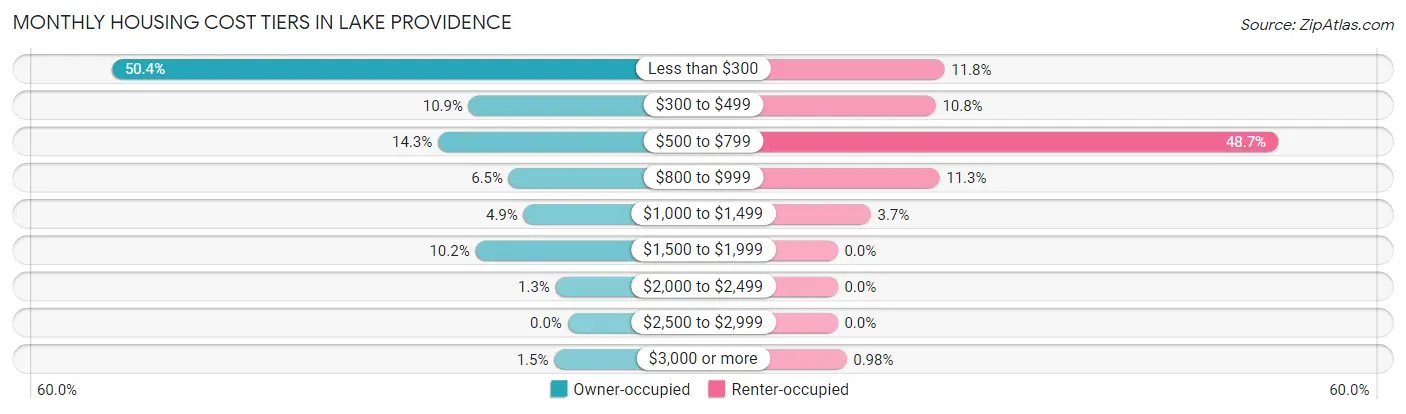
| Monthly Cost | Owner-occupied | Renter-occupied |
| Less than $300 | 341 (50.4%) | 84 (11.8%) |
| $300 to $499 | 74 (10.9%) | 77 (10.8%) |
| $500 to $799 | 97 (14.3%) | 346 (48.7%) |
| $800 to $999 | 44 (6.5%) | 80 (11.3%) |
| $1,000 to $1,499 | 33 (4.9%) | 26 (3.7%) |
| $1,500 to $1,999 | 69 (10.2%) | 0 (0.0%) |
| $2,000 to $2,499 | 9 (1.3%) | 0 (0.0%) |
| $2,500 to $2,999 | 0 (0.0%) | 0 (0.0%) |
| $3,000 or more | 10 (1.5%) | 7 (1.0%) |
| Total | 677 (100.0%) | 711 (100.0%) |
Physical Housing Characteristics in Lake Providence
Housing Structures in Lake Providence
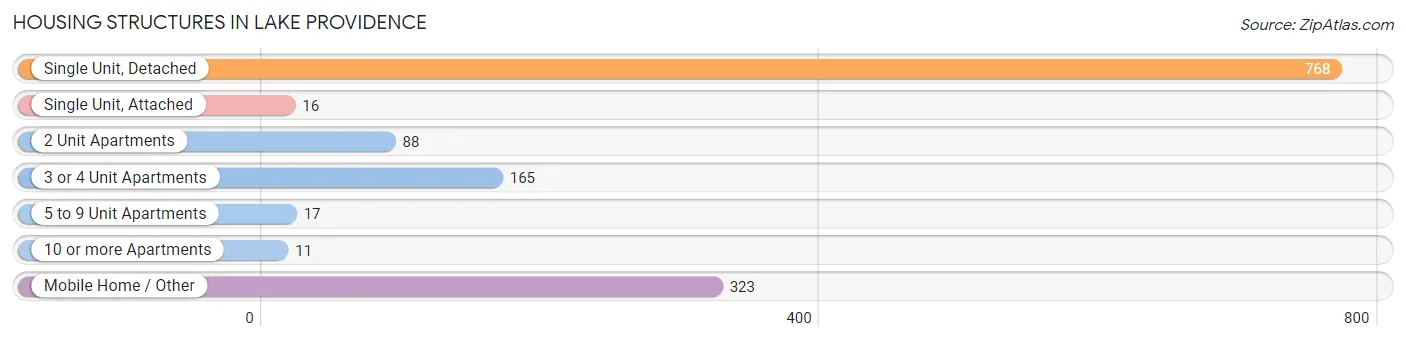
| Structure Type | # Housing Units | % Housing Units |
| Single Unit, Detached | 768 | 55.3% |
| Single Unit, Attached | 16 | 1.1% |
| 2 Unit Apartments | 88 | 6.3% |
| 3 or 4 Unit Apartments | 165 | 11.9% |
| 5 to 9 Unit Apartments | 17 | 1.2% |
| 10 or more Apartments | 11 | 0.8% |
| Mobile Home / Other | 323 | 23.3% |
| Total | 1,388 | 100.0% |
Housing Structures by Occupancy in Lake Providence
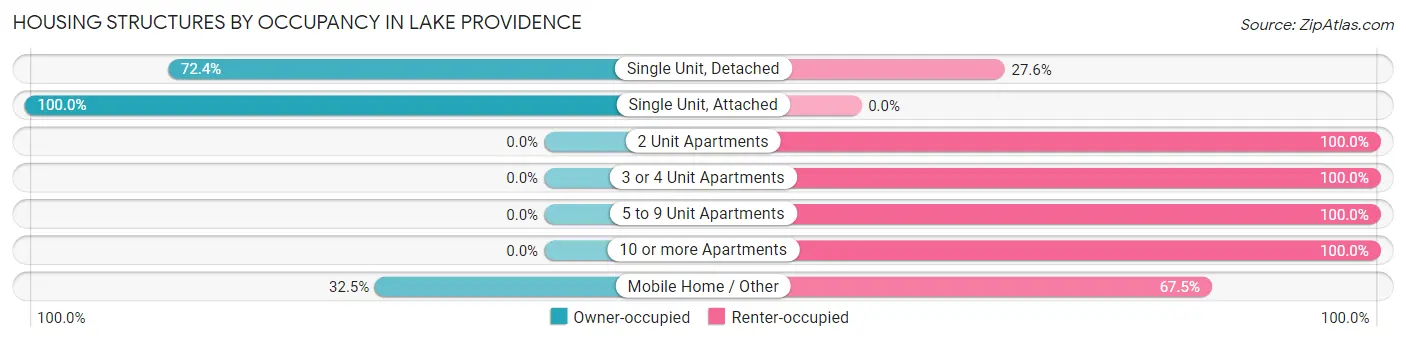
| Structure Type | Owner-occupied | Renter-occupied |
| Single Unit, Detached | 556 (72.4%) | 212 (27.6%) |
| Single Unit, Attached | 16 (100.0%) | 0 (0.0%) |
| 2 Unit Apartments | 0 (0.0%) | 88 (100.0%) |
| 3 or 4 Unit Apartments | 0 (0.0%) | 165 (100.0%) |
| 5 to 9 Unit Apartments | 0 (0.0%) | 17 (100.0%) |
| 10 or more Apartments | 0 (0.0%) | 11 (100.0%) |
| Mobile Home / Other | 105 (32.5%) | 218 (67.5%) |
| Total | 677 (48.8%) | 711 (51.2%) |
Housing Structures by Number of Rooms in Lake Providence
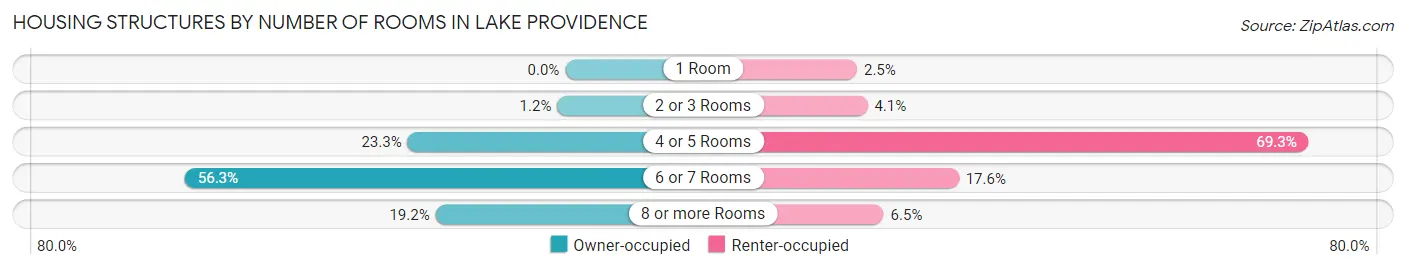
| Number of Rooms | Owner-occupied | Renter-occupied |
| 1 Room | 0 (0.0%) | 18 (2.5%) |
| 2 or 3 Rooms | 8 (1.2%) | 29 (4.1%) |
| 4 or 5 Rooms | 158 (23.3%) | 493 (69.3%) |
| 6 or 7 Rooms | 381 (56.3%) | 125 (17.6%) |
| 8 or more Rooms | 130 (19.2%) | 46 (6.5%) |
| Total | 677 (100.0%) | 711 (100.0%) |
Housing Structure by Heating Type in Lake Providence
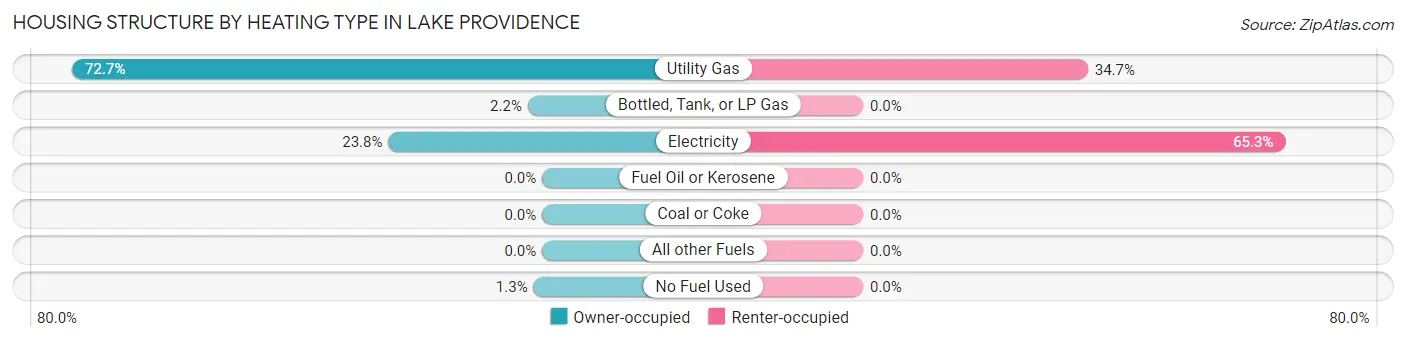
| Heating Type | Owner-occupied | Renter-occupied |
| Utility Gas | 492 (72.7%) | 247 (34.7%) |
| Bottled, Tank, or LP Gas | 15 (2.2%) | 0 (0.0%) |
| Electricity | 161 (23.8%) | 464 (65.3%) |
| Fuel Oil or Kerosene | 0 (0.0%) | 0 (0.0%) |
| Coal or Coke | 0 (0.0%) | 0 (0.0%) |
| All other Fuels | 0 (0.0%) | 0 (0.0%) |
| No Fuel Used | 9 (1.3%) | 0 (0.0%) |
| Total | 677 (100.0%) | 711 (100.0%) |
Household Vehicle Usage in Lake Providence
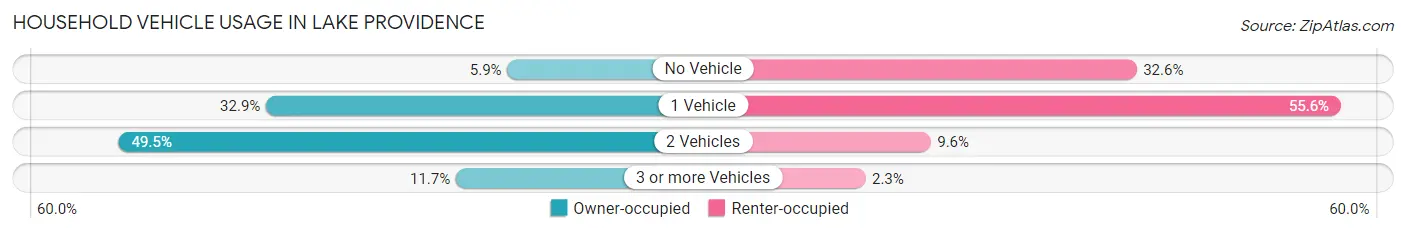
| Vehicles per Household | Owner-occupied | Renter-occupied |
| No Vehicle | 40 (5.9%) | 232 (32.6%) |
| 1 Vehicle | 223 (32.9%) | 395 (55.6%) |
| 2 Vehicles | 335 (49.5%) | 68 (9.6%) |
| 3 or more Vehicles | 79 (11.7%) | 16 (2.2%) |
| Total | 677 (100.0%) | 711 (100.0%) |
Real Estate & Mortgages in Lake Providence
Real Estate and Mortgage Overview in Lake Providence
| Characteristic | Without Mortgage | With Mortgage |
| Housing Units | 521 | 156 |
| Median Property Value | $35,400 | $161,100 |
| Median Household Income | $49,102 | $19 |
| Monthly Housing Costs | $258 | $0 |
| Real Estate Taxes | $199 | $53 |
Property Value by Mortgage Status in Lake Providence
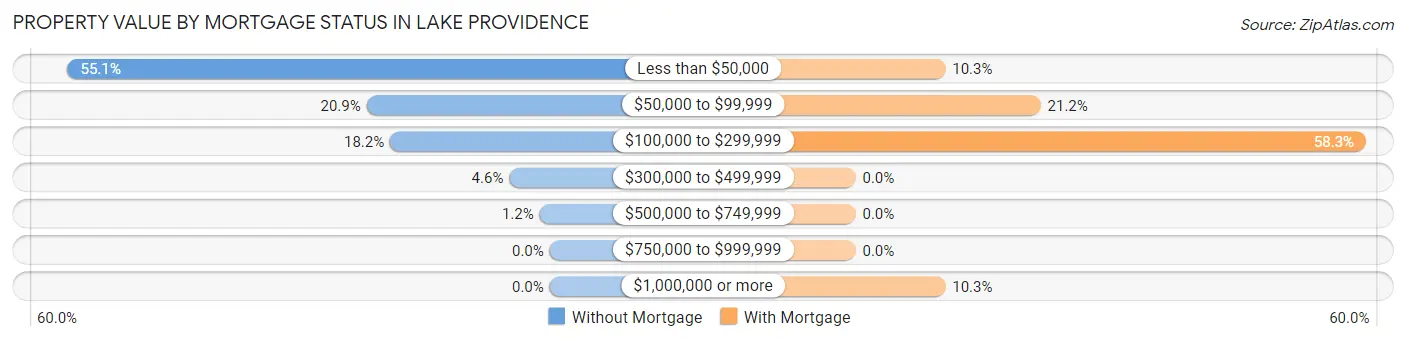
| Property Value | Without Mortgage | With Mortgage |
| Less than $50,000 | 287 (55.1%) | 16 (10.3%) |
| $50,000 to $99,999 | 109 (20.9%) | 33 (21.1%) |
| $100,000 to $299,999 | 95 (18.2%) | 91 (58.3%) |
| $300,000 to $499,999 | 24 (4.6%) | 0 (0.0%) |
| $500,000 to $749,999 | 6 (1.1%) | 0 (0.0%) |
| $750,000 to $999,999 | 0 (0.0%) | 0 (0.0%) |
| $1,000,000 or more | 0 (0.0%) | 16 (10.3%) |
| Total | 521 (100.0%) | 156 (100.0%) |
Household Income by Mortgage Status in Lake Providence
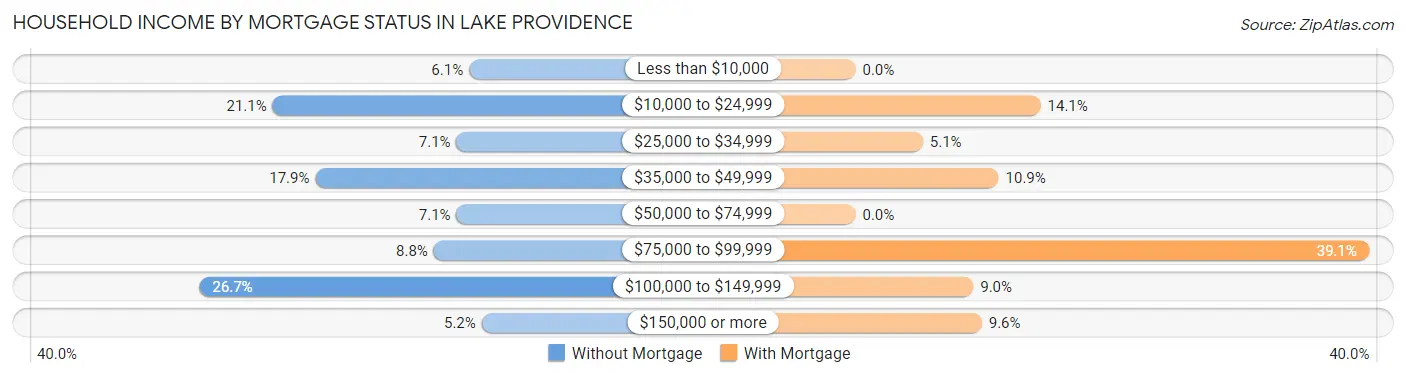
| Household Income | Without Mortgage | With Mortgage |
| Less than $10,000 | 32 (6.1%) | 0 (0.0%) |
| $10,000 to $24,999 | 110 (21.1%) | 22 (14.1%) |
| $25,000 to $34,999 | 37 (7.1%) | 8 (5.1%) |
| $35,000 to $49,999 | 93 (17.8%) | 17 (10.9%) |
| $50,000 to $74,999 | 37 (7.1%) | 0 (0.0%) |
| $75,000 to $99,999 | 46 (8.8%) | 61 (39.1%) |
| $100,000 to $149,999 | 139 (26.7%) | 14 (9.0%) |
| $150,000 or more | 27 (5.2%) | 15 (9.6%) |
| Total | 521 (100.0%) | 156 (100.0%) |
Property Value to Household Income Ratio in Lake Providence
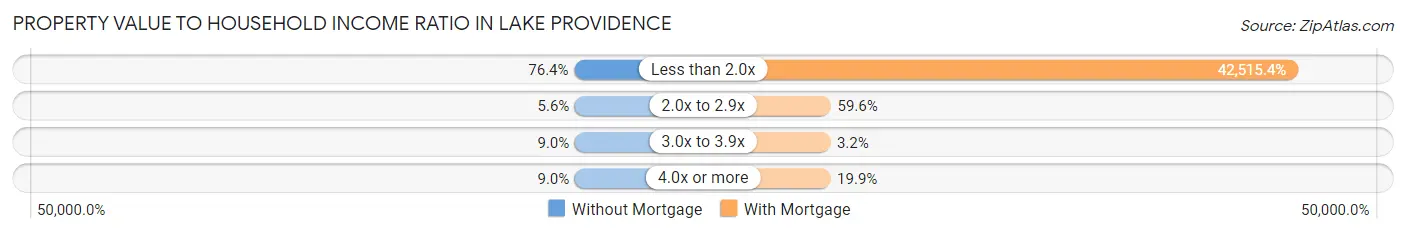
| Value-to-Income Ratio | Without Mortgage | With Mortgage |
| Less than 2.0x | 398 (76.4%) | 66,324 (42,515.4%) |
| 2.0x to 2.9x | 29 (5.6%) | 93 (59.6%) |
| 3.0x to 3.9x | 47 (9.0%) | 5 (3.2%) |
| 4.0x or more | 47 (9.0%) | 31 (19.9%) |
| Total | 521 (100.0%) | 156 (100.0%) |
Real Estate Taxes by Mortgage Status in Lake Providence
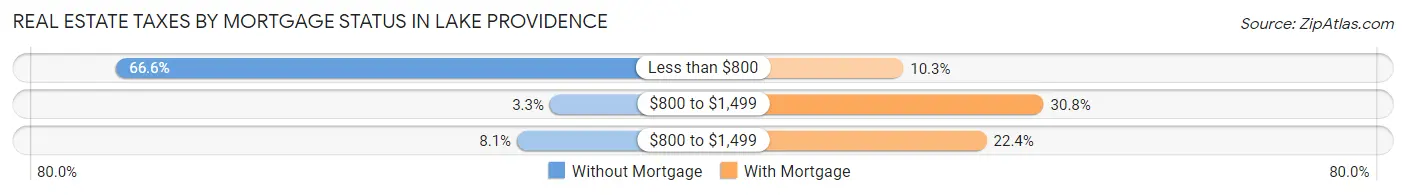
| Property Taxes | Without Mortgage | With Mortgage |
| Less than $800 | 347 (66.6%) | 16 (10.3%) |
| $800 to $1,499 | 17 (3.3%) | 48 (30.8%) |
| $800 to $1,499 | 42 (8.1%) | 35 (22.4%) |
| Total | 521 (100.0%) | 156 (100.0%) |
Health & Disability in Lake Providence
Health Insurance Coverage by Age in Lake Providence
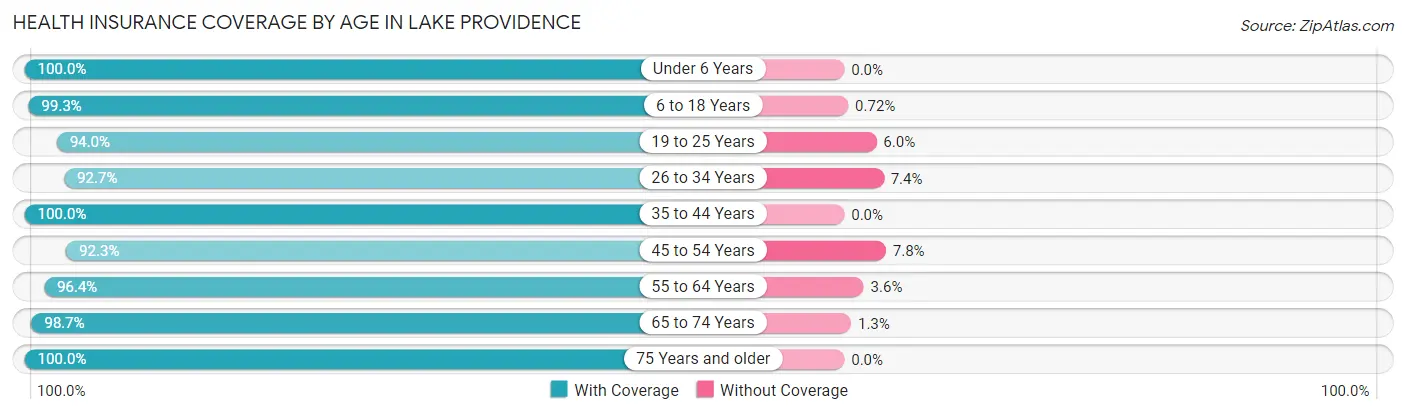
| Age Bracket | With Coverage | Without Coverage |
| Under 6 Years | 238 (100.0%) | 0 (0.0%) |
| 6 to 18 Years | 1,098 (99.3%) | 8 (0.7%) |
| 19 to 25 Years | 267 (94.0%) | 17 (6.0%) |
| 26 to 34 Years | 315 (92.6%) | 25 (7.3%) |
| 35 to 44 Years | 253 (100.0%) | 0 (0.0%) |
| 45 to 54 Years | 238 (92.2%) | 20 (7.7%) |
| 55 to 64 Years | 454 (96.4%) | 17 (3.6%) |
| 65 to 74 Years | 314 (98.7%) | 4 (1.3%) |
| 75 Years and older | 274 (100.0%) | 0 (0.0%) |
| Total | 3,451 (97.4%) | 91 (2.6%) |
Health Insurance Coverage by Citizenship Status in Lake Providence
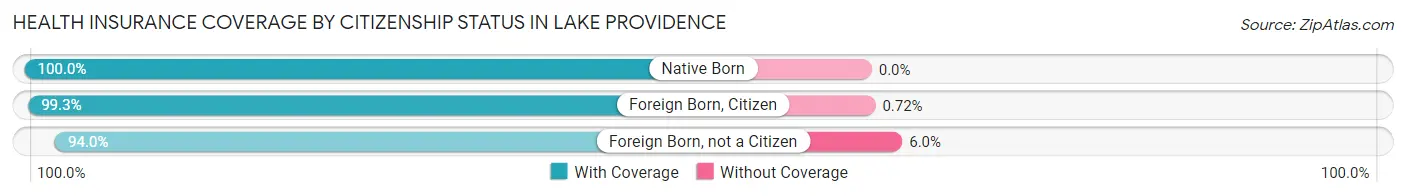
| Citizenship Status | With Coverage | Without Coverage |
| Native Born | 238 (100.0%) | 0 (0.0%) |
| Foreign Born, Citizen | 1,098 (99.3%) | 8 (0.7%) |
| Foreign Born, not a Citizen | 267 (94.0%) | 17 (6.0%) |
Health Insurance Coverage by Household Income in Lake Providence
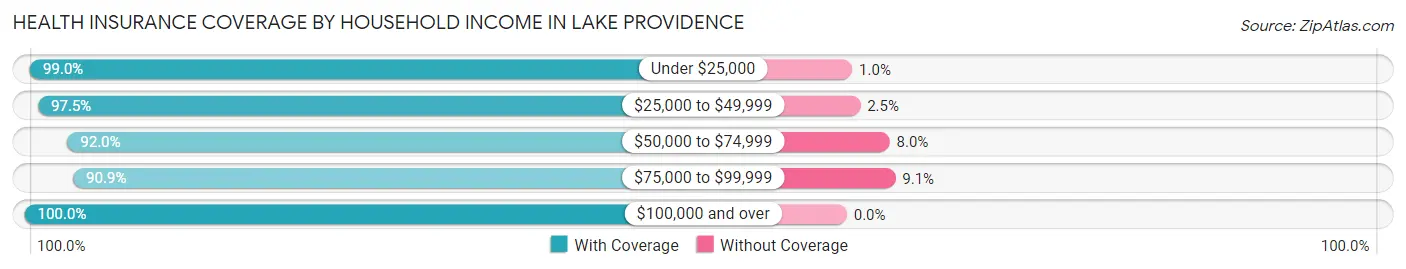
| Household Income | With Coverage | Without Coverage |
| Under $25,000 | 1,583 (99.0%) | 16 (1.0%) |
| $25,000 to $49,999 | 817 (97.5%) | 21 (2.5%) |
| $50,000 to $74,999 | 413 (92.0%) | 36 (8.0%) |
| $75,000 to $99,999 | 180 (90.9%) | 18 (9.1%) |
| $100,000 and over | 458 (100.0%) | 0 (0.0%) |
Public vs Private Health Insurance Coverage by Age in Lake Providence
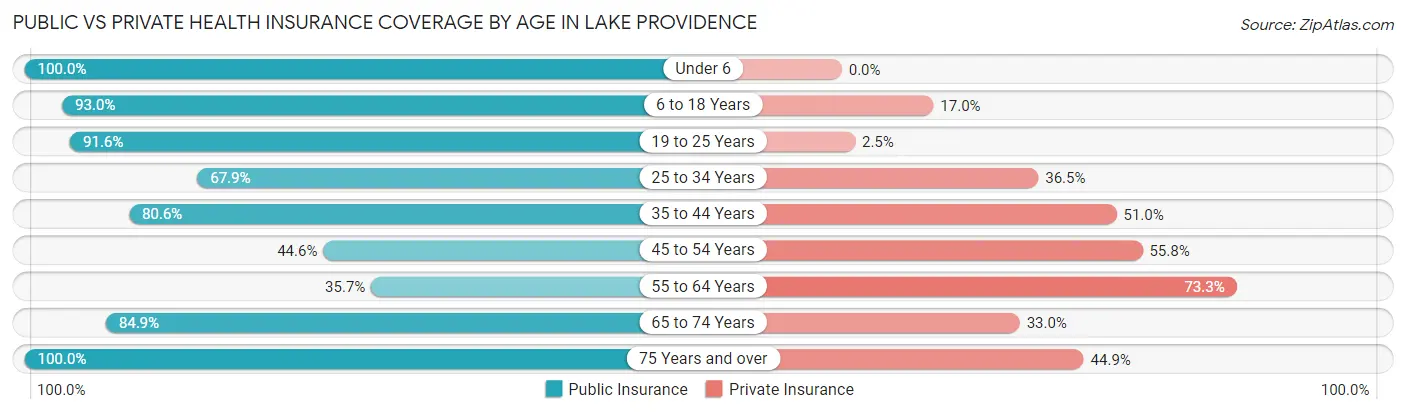
| Age Bracket | Public Insurance | Private Insurance |
| Under 6 | 238 (100.0%) | 0 (0.0%) |
| 6 to 18 Years | 1,029 (93.0%) | 188 (17.0%) |
| 19 to 25 Years | 260 (91.5%) | 7 (2.5%) |
| 25 to 34 Years | 231 (67.9%) | 124 (36.5%) |
| 35 to 44 Years | 204 (80.6%) | 129 (51.0%) |
| 45 to 54 Years | 115 (44.6%) | 144 (55.8%) |
| 55 to 64 Years | 168 (35.7%) | 345 (73.3%) |
| 65 to 74 Years | 270 (84.9%) | 105 (33.0%) |
| 75 Years and over | 274 (100.0%) | 123 (44.9%) |
| Total | 2,789 (78.7%) | 1,165 (32.9%) |
Disability Status by Sex by Age in Lake Providence
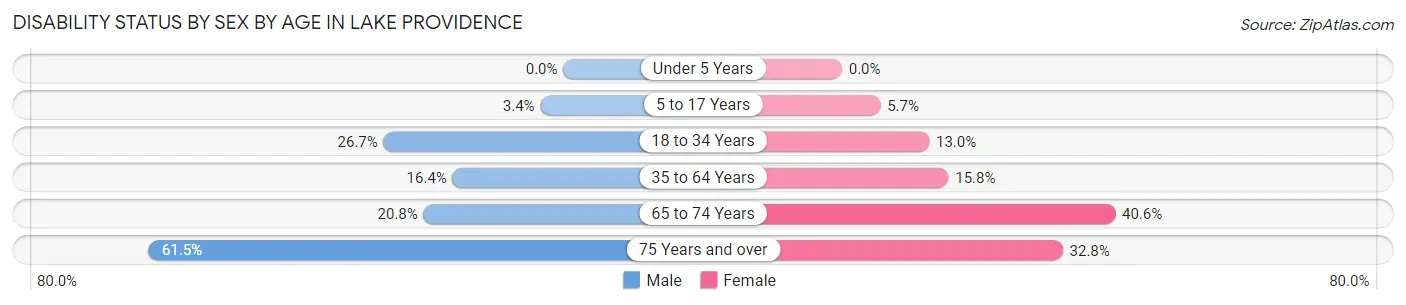
| Age Bracket | Male | Female |
| Under 5 Years | 0 (0.0%) | 0 (0.0%) |
| 5 to 17 Years | 19 (3.4%) | 31 (5.7%) |
| 18 to 34 Years | 67 (26.7%) | 53 (13.0%) |
| 35 to 64 Years | 72 (16.4%) | 86 (15.8%) |
| 65 to 74 Years | 22 (20.7%) | 86 (40.6%) |
| 75 Years and over | 56 (61.5%) | 60 (32.8%) |
Disability Class by Sex by Age in Lake Providence
Disability Class: Hearing Difficulty
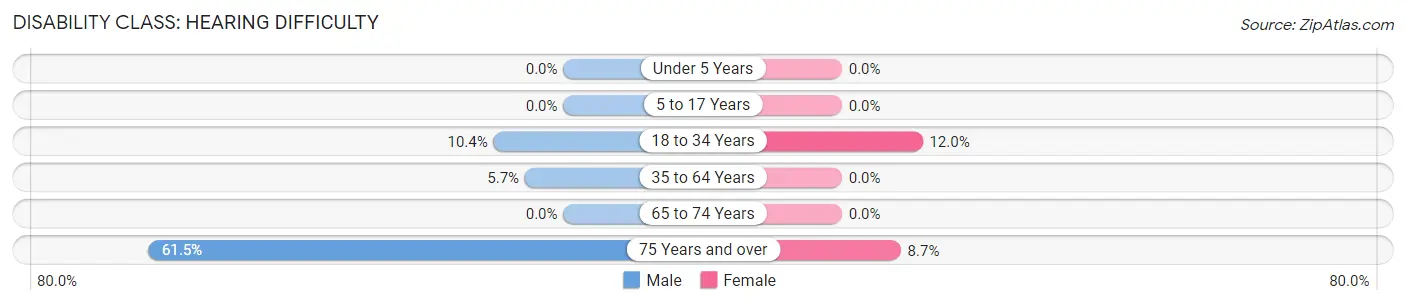
| Age Bracket | Male | Female |
| Under 5 Years | 0 (0.0%) | 0 (0.0%) |
| 5 to 17 Years | 0 (0.0%) | 0 (0.0%) |
| 18 to 34 Years | 26 (10.4%) | 49 (12.0%) |
| 35 to 64 Years | 25 (5.7%) | 0 (0.0%) |
| 65 to 74 Years | 0 (0.0%) | 0 (0.0%) |
| 75 Years and over | 56 (61.5%) | 16 (8.7%) |
Disability Class: Vision Difficulty
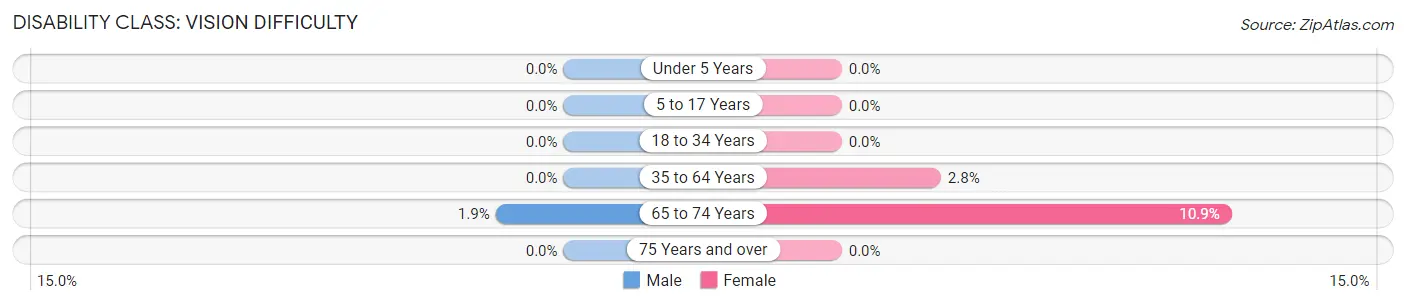
| Age Bracket | Male | Female |
| Under 5 Years | 0 (0.0%) | 0 (0.0%) |
| 5 to 17 Years | 0 (0.0%) | 0 (0.0%) |
| 18 to 34 Years | 0 (0.0%) | 0 (0.0%) |
| 35 to 64 Years | 0 (0.0%) | 15 (2.8%) |
| 65 to 74 Years | 2 (1.9%) | 23 (10.8%) |
| 75 Years and over | 0 (0.0%) | 0 (0.0%) |
Disability Class: Cognitive Difficulty
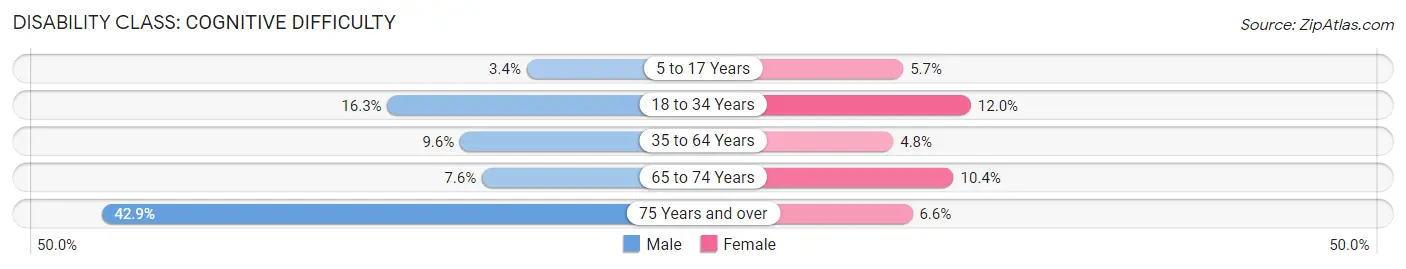
| Age Bracket | Male | Female |
| 5 to 17 Years | 19 (3.4%) | 31 (5.7%) |
| 18 to 34 Years | 41 (16.3%) | 49 (12.0%) |
| 35 to 64 Years | 42 (9.6%) | 26 (4.8%) |
| 65 to 74 Years | 8 (7.5%) | 22 (10.4%) |
| 75 Years and over | 39 (42.9%) | 12 (6.6%) |
Disability Class: Ambulatory Difficulty
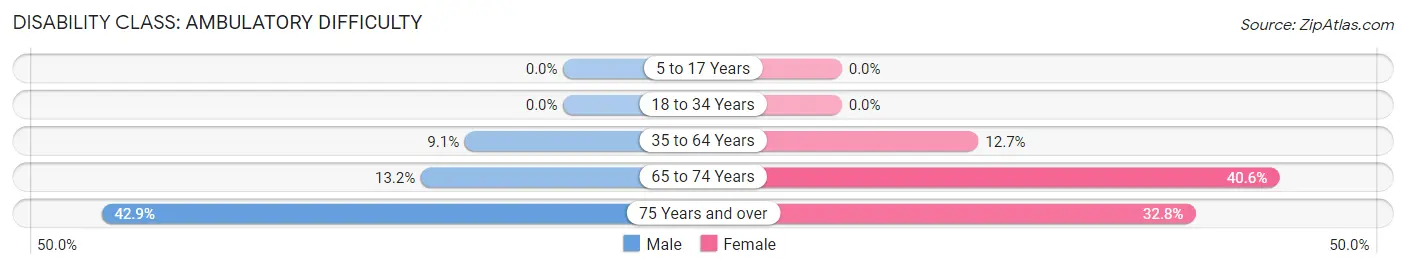
| Age Bracket | Male | Female |
| 5 to 17 Years | 0 (0.0%) | 0 (0.0%) |
| 18 to 34 Years | 0 (0.0%) | 0 (0.0%) |
| 35 to 64 Years | 40 (9.1%) | 69 (12.7%) |
| 65 to 74 Years | 14 (13.2%) | 86 (40.6%) |
| 75 Years and over | 39 (42.9%) | 60 (32.8%) |
Disability Class: Self-Care Difficulty
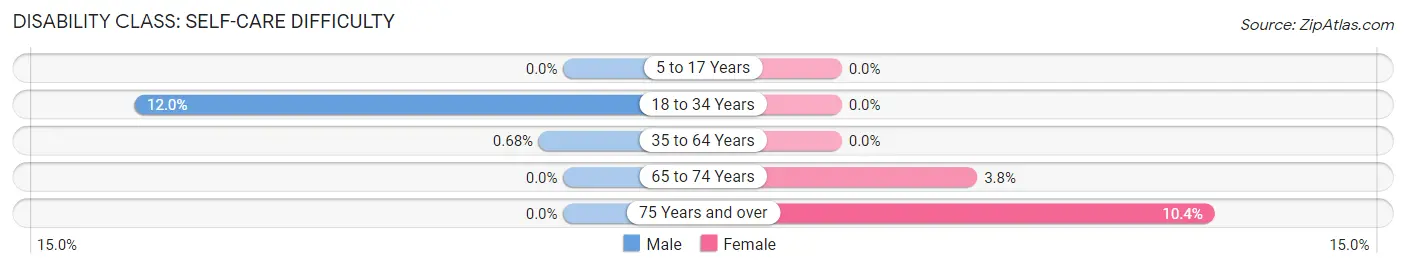
| Age Bracket | Male | Female |
| 5 to 17 Years | 0 (0.0%) | 0 (0.0%) |
| 18 to 34 Years | 30 (11.9%) | 0 (0.0%) |
| 35 to 64 Years | 3 (0.7%) | 0 (0.0%) |
| 65 to 74 Years | 0 (0.0%) | 8 (3.8%) |
| 75 Years and over | 0 (0.0%) | 19 (10.4%) |
Technology Access in Lake Providence
Computing Device Access in Lake Providence
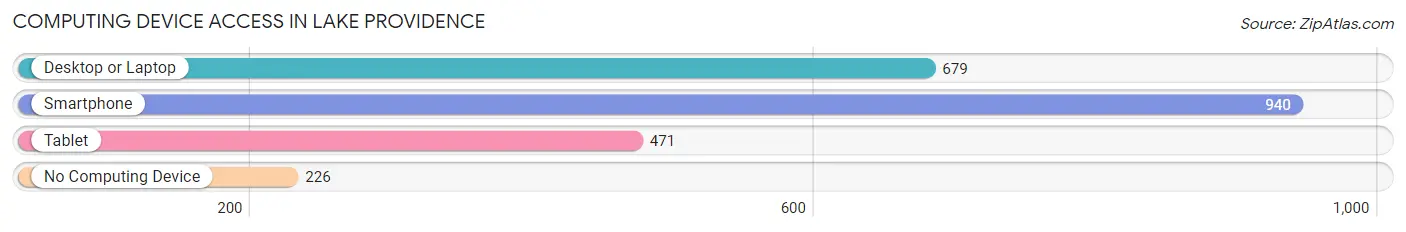
| Device Type | # Households | % Households |
| Desktop or Laptop | 679 | 48.9% |
| Smartphone | 940 | 67.7% |
| Tablet | 471 | 33.9% |
| No Computing Device | 226 | 16.3% |
| Total | 1,388 | 100.0% |
Internet Access in Lake Providence
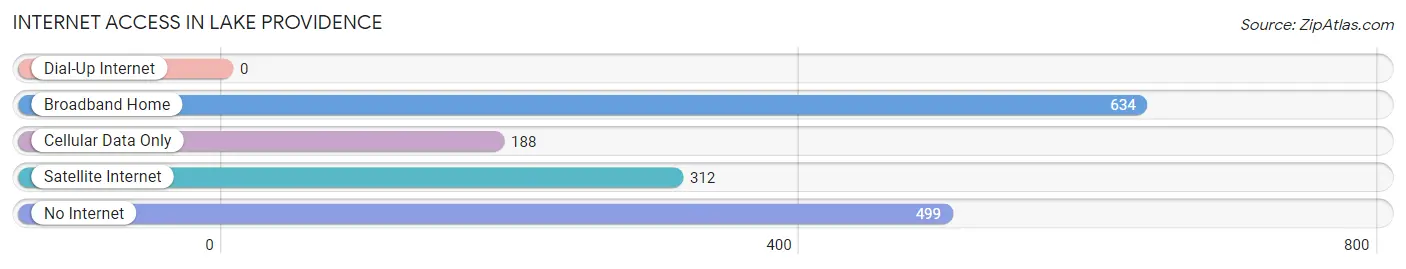
| Internet Type | # Households | % Households |
| Dial-Up Internet | 0 | 0.0% |
| Broadband Home | 634 | 45.7% |
| Cellular Data Only | 188 | 13.5% |
| Satellite Internet | 312 | 22.5% |
| No Internet | 499 | 35.9% |
| Total | 1,388 | 100.0% |
Lake Providence Summary
Introduction
Lake Providence is a small town located in the northeast corner of Louisiana, in the United States. It is the parish seat of East Carroll Parish and is situated on the banks of the Mississippi River. The town has a population of around 3,000 people and is known for its rich history, diverse geography, and vibrant economy. This paper will explore the history, geography, economy, and demographics of Lake Providence in 2000 words.
History
Lake Providence was founded in 1820 by a group of settlers from the nearby town of Providence. The town was originally known as “Providence Landing” and was a trading post for the local Native American tribes. In 1821, the town was renamed “Lake Providence” after the nearby lake. The town was incorporated in 1824 and quickly became a major port for the cotton trade. During the Civil War, the town was occupied by Union forces and served as a supply depot. After the war, the town experienced a period of growth and prosperity. In the late 19th century, the town was home to several large plantations and was a major center for the cotton industry.
Geography
Lake Providence is located in the northeast corner of Louisiana, in the United States. It is situated on the banks of the Mississippi River, near the border with Arkansas. The town is surrounded by a number of small lakes, including Lake Providence, Lake St. John, and Lake Bruin. The town is located in a flat, low-lying area and is prone to flooding. The climate is humid subtropical, with hot, humid summers and mild winters.
Economy
The economy of Lake Providence is largely based on agriculture and tourism. The town is home to several large farms and ranches, which produce a variety of crops, including cotton, soybeans, corn, and wheat. The town is also home to several small businesses, including restaurants, shops, and hotels. Tourism is an important part of the local economy, with visitors coming to the town to enjoy the nearby lakes and rivers.
Demographics
As of the 2010 census, the population of Lake Providence was 3,042. The racial makeup of the town was 57.3% African American, 37.2% White, 0.7% Native American, 0.3% Asian, and 4.5% from other races. The median household income was $25,938, and the median family income was $31,250. The per capita income was $14,945.
Conclusion
Lake Providence is a small town located in the northeast corner of Louisiana, in the United States. It is the parish seat of East Carroll Parish and is situated on the banks of the Mississippi River. The town has a rich history, diverse geography, and vibrant economy. The economy of Lake Providence is largely based on agriculture and tourism, and the town is home to a diverse population. This paper has explored the history, geography, economy, and demographics of Lake Providence in 2000 words.
Common Questions
What is Per Capita Income in Lake Providence?
Per Capita income in Lake Providence is $19,897.
What is the Median Family Income in Lake Providence?
Median Family Income in Lake Providence is $30,953.
What is the Median Household income in Lake Providence?
Median Household Income in Lake Providence is $25,614.
What is Income or Wage Gap in Lake Providence?
Income or Wage Gap in Lake Providence is 25.7%.
Women in Lake Providence earn 74.3 cents for every dollar earned by a man.
What is Inequality or Gini Index in Lake Providence?
Inequality or Gini Index in Lake Providence is 0.64.
What is the Total Population of Lake Providence?
Total Population of Lake Providence is 3,542.
What is the Total Male Population of Lake Providence?
Total Male Population of Lake Providence is 1,497.
What is the Total Female Population of Lake Providence?
Total Female Population of Lake Providence is 2,045.
What is the Ratio of Males per 100 Females in Lake Providence?
There are 73.20 Males per 100 Females in Lake Providence.
What is the Ratio of Females per 100 Males in Lake Providence?
There are 136.61 Females per 100 Males in Lake Providence.
What is the Median Population Age in Lake Providence?
Median Population Age in Lake Providence is 28.2 Years.
What is the Average Family Size in Lake Providence
Average Family Size in Lake Providence is 3.2 People.
What is the Average Household Size in Lake Providence
Average Household Size in Lake Providence is 2.5 People.
How Large is the Labor Force in Lake Providence?
There are 1,174 People in the Labor Forcein in Lake Providence.
What is the Percentage of People in the Labor Force in Lake Providence?
49.6% of People are in the Labor Force in Lake Providence.
What is the Unemployment Rate in Lake Providence?
Unemployment Rate in Lake Providence is 13.6%.