Jonesville, LA Map & Demographics
Jonesville Map
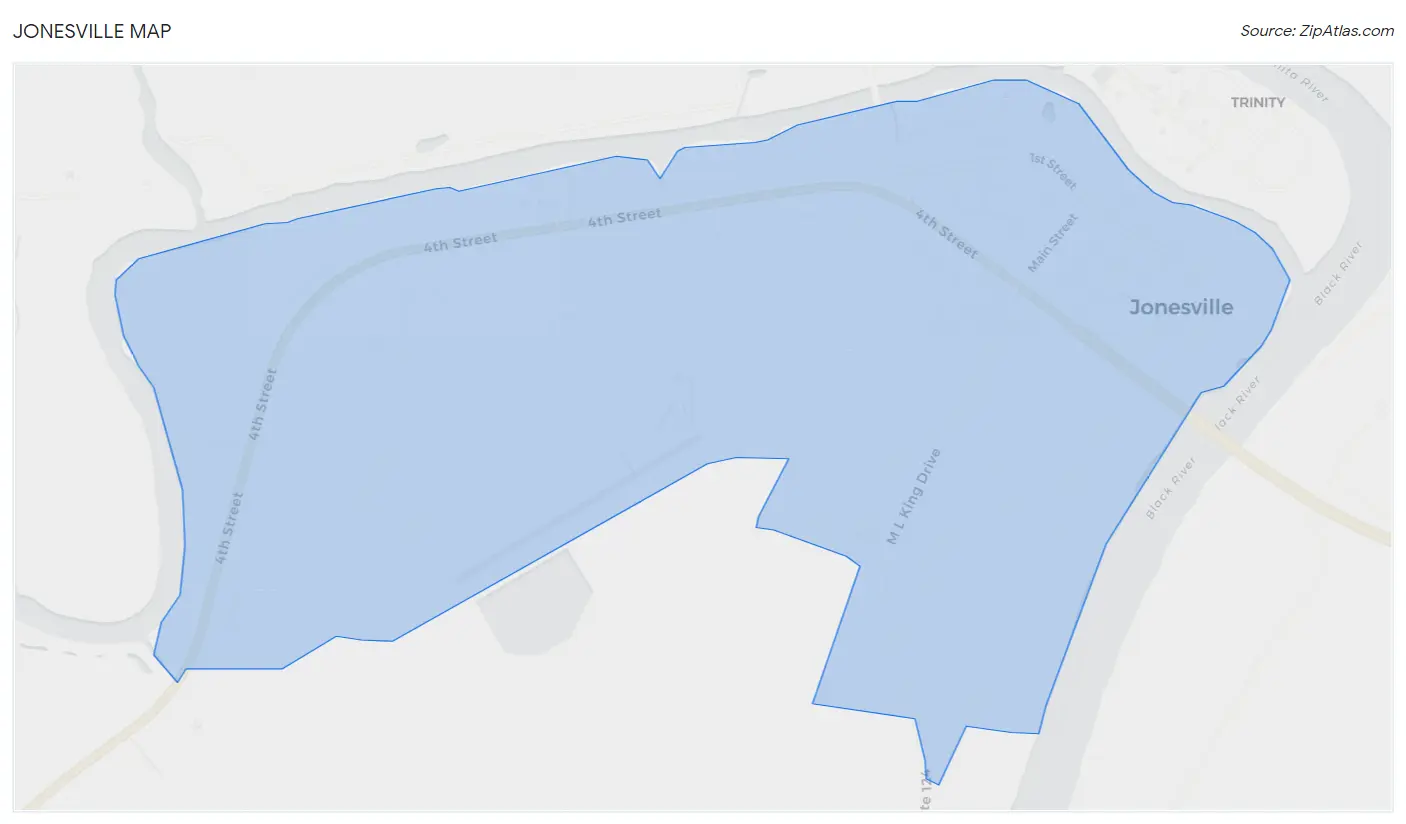
Jonesville Overview
$24,405
PER CAPITA INCOME
$68,083
AVG FAMILY INCOME
$40,875
AVG HOUSEHOLD INCOME
9.1%
WAGE / INCOME GAP [ % ]
90.9¢/ $1
WAGE / INCOME GAP [ $ ]
$8,753
FAMILY INCOME DEFICIT
0.40
INEQUALITY / GINI INDEX
1,252
TOTAL POPULATION
483
MALE POPULATION
769
FEMALE POPULATION
62.81
MALES / 100 FEMALES
159.21
FEMALES / 100 MALES
57.2
MEDIAN AGE
2.5
AVG FAMILY SIZE
2.1
AVG HOUSEHOLD SIZE
443
LABOR FORCE [ PEOPLE ]
43.1%
PERCENT IN LABOR FORCE
7.9%
UNEMPLOYMENT RATE
Jonesville Zip Codes
Jonesville Area Codes
Income in Jonesville
Income Overview in Jonesville
Per Capita Income in Jonesville is $24,405, while median incomes of families and households are $68,083 and $40,875 respectively.
| Characteristic | Number | Measure |
| Per Capita Income | 1,252 | $24,405 |
| Median Family Income | 400 | $68,083 |
| Mean Family Income | 400 | $64,347 |
| Median Household Income | 565 | $40,875 |
| Mean Household Income | 565 | $53,212 |
| Income Deficit | 400 | $8,753 |
| Wage / Income Gap (%) | 1,252 | 9.13% |
| Wage / Income Gap ($) | 1,252 | 90.87¢ per $1 |
| Gini / Inequality Index | 1,252 | 0.40 |
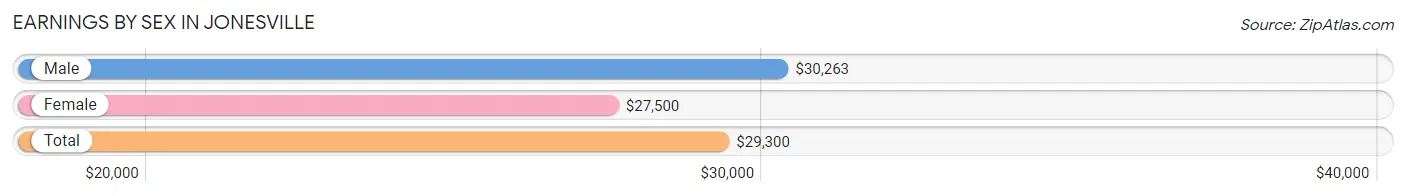
Earnings by Sex in Jonesville
Average Earnings in Jonesville are $29,300, $30,263 for men and $27,500 for women, a difference of 9.1%.
| Sex | Number | Average Earnings |
| Male | 138 (29.5%) | $30,263 |
| Female | 330 (70.5%) | $27,500 |
| Total | 468 (100.0%) | $29,300 |
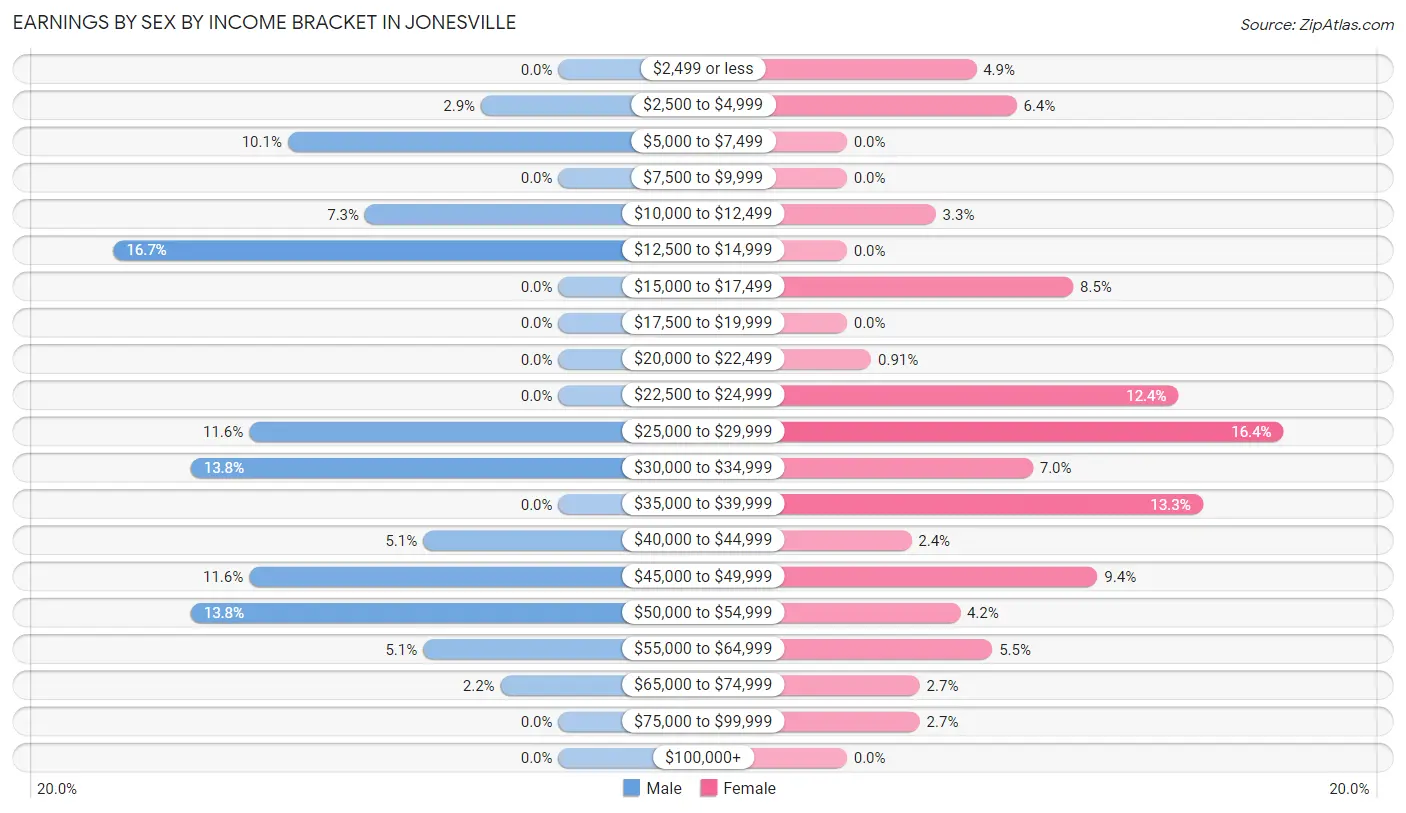
Earnings by Sex by Income Bracket in Jonesville
The most common earnings brackets in Jonesville are $12,500 to $14,999 for men (23 | 16.7%) and $25,000 to $29,999 for women (54 | 16.4%).
| Income | Male | Female |
| $2,499 or less | 0 (0.0%) | 16 (4.9%) |
| $2,500 to $4,999 | 4 (2.9%) | 21 (6.4%) |
| $5,000 to $7,499 | 14 (10.1%) | 0 (0.0%) |
| $7,500 to $9,999 | 0 (0.0%) | 0 (0.0%) |
| $10,000 to $12,499 | 10 (7.2%) | 11 (3.3%) |
| $12,500 to $14,999 | 23 (16.7%) | 0 (0.0%) |
| $15,000 to $17,499 | 0 (0.0%) | 28 (8.5%) |
| $17,500 to $19,999 | 0 (0.0%) | 0 (0.0%) |
| $20,000 to $22,499 | 0 (0.0%) | 3 (0.9%) |
| $22,500 to $24,999 | 0 (0.0%) | 41 (12.4%) |
| $25,000 to $29,999 | 16 (11.6%) | 54 (16.4%) |
| $30,000 to $34,999 | 19 (13.8%) | 23 (7.0%) |
| $35,000 to $39,999 | 0 (0.0%) | 44 (13.3%) |
| $40,000 to $44,999 | 7 (5.1%) | 8 (2.4%) |
| $45,000 to $49,999 | 16 (11.6%) | 31 (9.4%) |
| $50,000 to $54,999 | 19 (13.8%) | 14 (4.2%) |
| $55,000 to $64,999 | 7 (5.1%) | 18 (5.4%) |
| $65,000 to $74,999 | 3 (2.2%) | 9 (2.7%) |
| $75,000 to $99,999 | 0 (0.0%) | 9 (2.7%) |
| $100,000+ | 0 (0.0%) | 0 (0.0%) |
| Total | 138 (100.0%) | 330 (100.0%) |
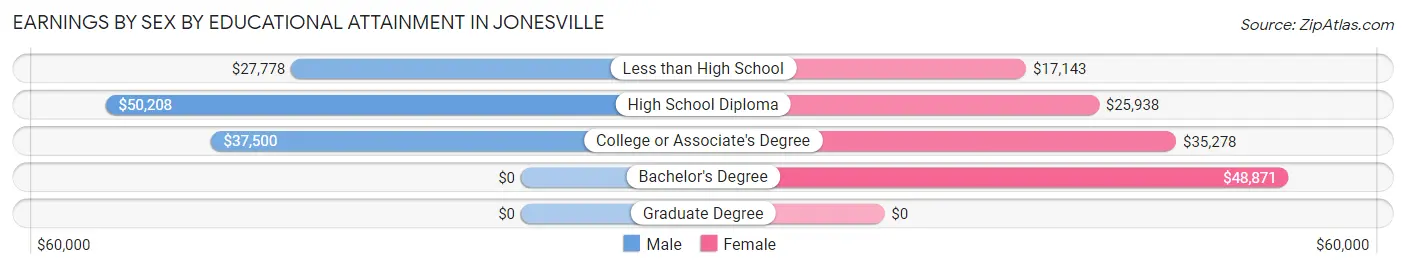
Earnings by Sex by Educational Attainment in Jonesville
Average earnings in Jonesville are $31,184 for men and $29,583 for women, a difference of 5.1%. Men with an educational attainment of high school diploma enjoy the highest average annual earnings of $50,208, while those with less than high school education earn the least with $27,778. Women with an educational attainment of bachelor's degree earn the most with the average annual earnings of $48,871, while those with less than high school education have the smallest earnings of $17,143.
| Educational Attainment | Male Income | Female Income |
| Less than High School | $27,778 | $17,143 |
| High School Diploma | $50,208 | $25,938 |
| College or Associate's Degree | $37,500 | $35,278 |
| Bachelor's Degree | - | - |
| Graduate Degree | - | - |
| Total | $31,184 | $29,583 |
Family Income in Jonesville
Family Income Brackets in Jonesville
According to the Jonesville family income data, there are 185 families falling into the $50,000 to $74,999 income range, which is the most common income bracket and makes up 46.3% of all families.
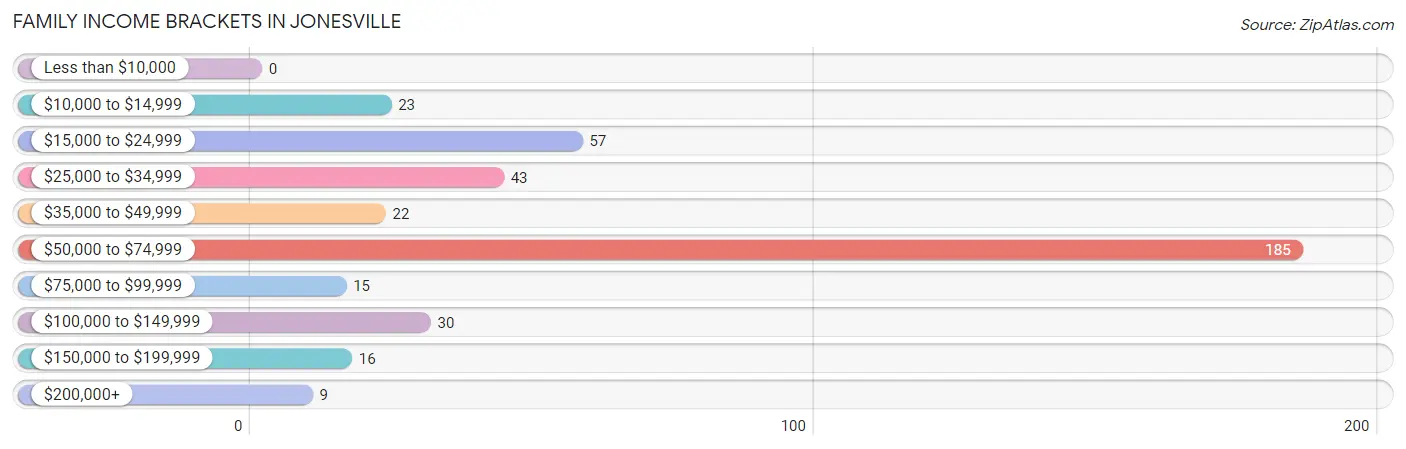
| Income Bracket | # Families | % Families |
| Less than $10,000 | 0 | 0.0% |
| $10,000 to $14,999 | 23 | 5.8% |
| $15,000 to $24,999 | 57 | 14.3% |
| $25,000 to $34,999 | 43 | 10.8% |
| $35,000 to $49,999 | 22 | 5.5% |
| $50,000 to $74,999 | 185 | 46.3% |
| $75,000 to $99,999 | 15 | 3.8% |
| $100,000 to $149,999 | 30 | 7.5% |
| $150,000 to $199,999 | 16 | 4.0% |
| $200,000+ | 9 | 2.3% |
Family Income by Famaliy Size in Jonesville
2-person families (270 | 67.5%) account for the highest median family income in Jonesville with $70,134 per family, while 2-person families (270 | 67.5%) have the highest median income of $35,067 per family member.
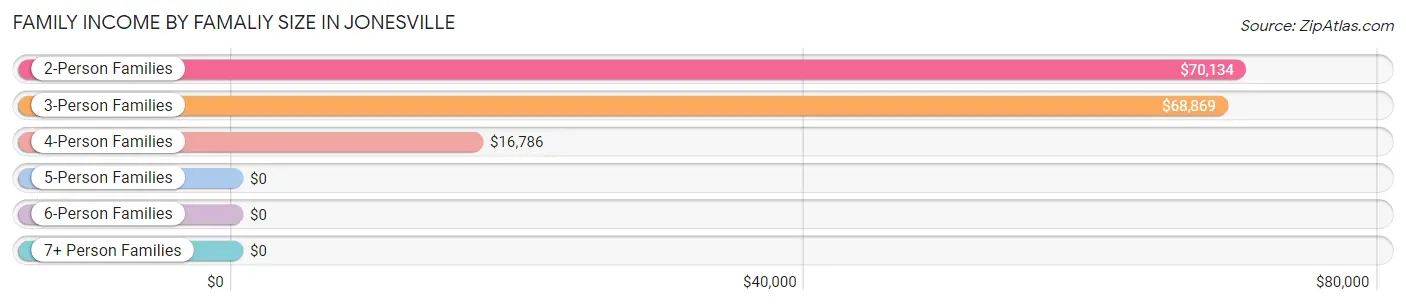
| Income Bracket | # Families | Median Income |
| 2-Person Families | 270 (67.5%) | $70,134 |
| 3-Person Families | 53 (13.3%) | $68,869 |
| 4-Person Families | 48 (12.0%) | $16,786 |
| 5-Person Families | 28 (7.0%) | $0 |
| 6-Person Families | 1 (0.3%) | $0 |
| 7+ Person Families | 0 (0.0%) | $0 |
| Total | 400 (100.0%) | $68,083 |
Family Income by Number of Earners in Jonesville
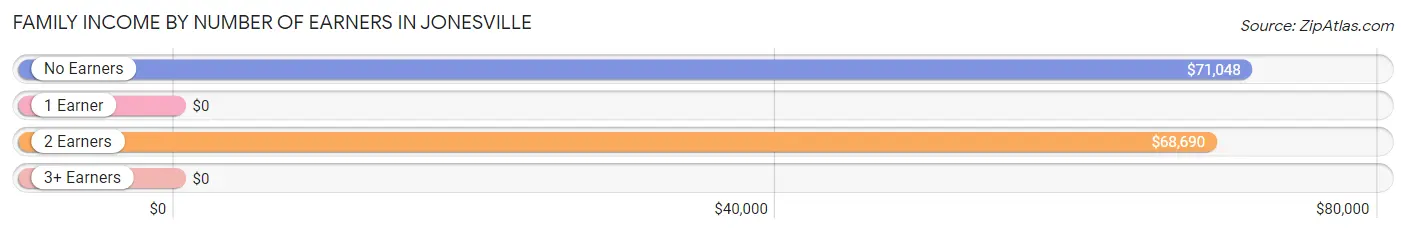
| Number of Earners | # Families | Median Income |
| No Earners | 134 (33.5%) | $71,048 |
| 1 Earner | 146 (36.5%) | $0 |
| 2 Earners | 108 (27.0%) | $68,690 |
| 3+ Earners | 12 (3.0%) | $0 |
| Total | 400 (100.0%) | $68,083 |
Household Income in Jonesville
Household Income Brackets in Jonesville
With 176 households falling in the category, the $50,000 to $74,999 income range is the most frequent in Jonesville, accounting for 31.1% of all households. In contrast, only 9 households (1.6%) fall into the $200,000+ income bracket, making it the least populous group.
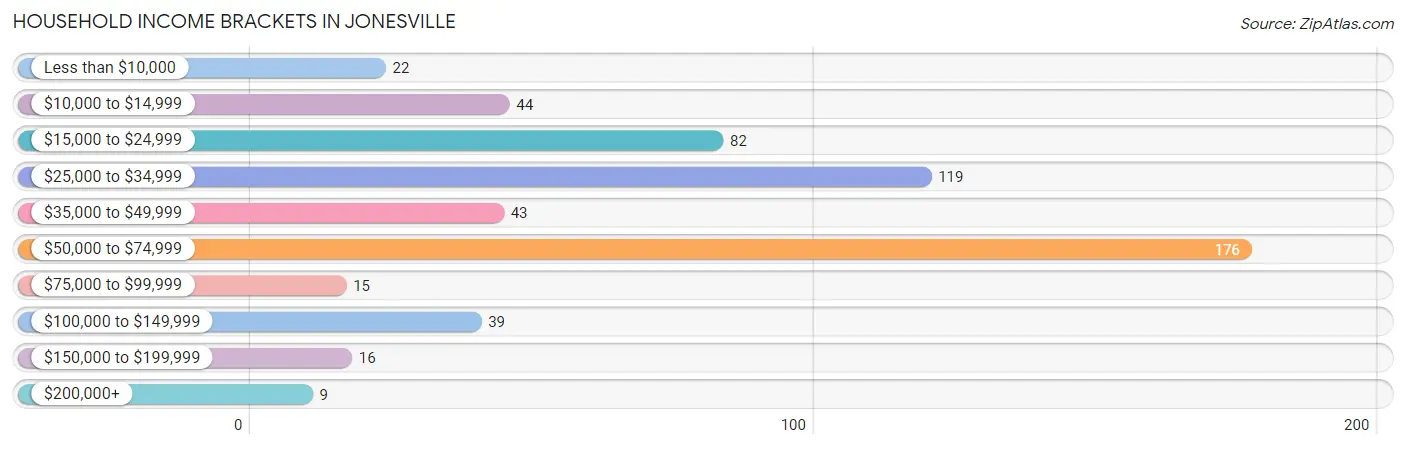
| Income Bracket | # Households | % Households |
| Less than $10,000 | 22 | 3.9% |
| $10,000 to $14,999 | 44 | 7.8% |
| $15,000 to $24,999 | 82 | 14.5% |
| $25,000 to $34,999 | 119 | 21.1% |
| $35,000 to $49,999 | 43 | 7.6% |
| $50,000 to $74,999 | 176 | 31.2% |
| $75,000 to $99,999 | 15 | 2.7% |
| $100,000 to $149,999 | 39 | 6.9% |
| $150,000 to $199,999 | 16 | 2.8% |
| $200,000+ | 9 | 1.6% |
Household Income by Householder Age in Jonesville
The median household income in Jonesville is $40,875, with the highest median household income of $69,524 found in the 45 to 64 years age bracket for the primary householder. A total of 288 households (51.0%) fall into this category. Meanwhile, the 15 to 24 years age bracket for the primary householder has the lowest median household income of $0, with 10 households (1.8%) in this group.
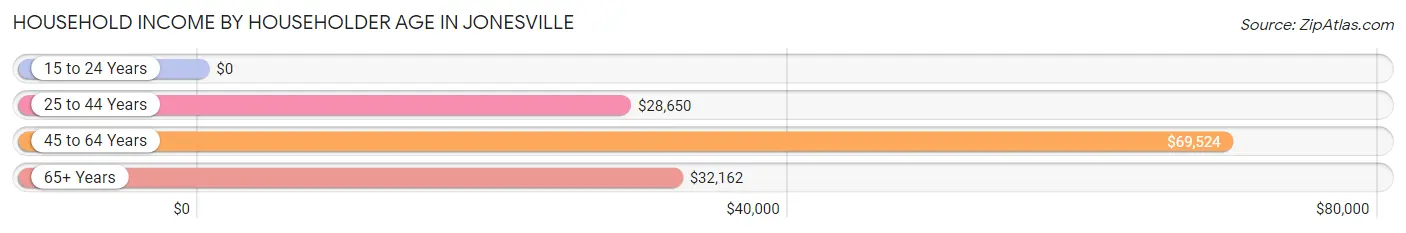
| Income Bracket | # Households | Median Income |
| 15 to 24 Years | 10 (1.8%) | $0 |
| 25 to 44 Years | 95 (16.8%) | $28,650 |
| 45 to 64 Years | 288 (51.0%) | $69,524 |
| 65+ Years | 172 (30.4%) | $32,162 |
| Total | 565 (100.0%) | $40,875 |
Poverty in Jonesville
Income Below Poverty by Sex and Age in Jonesville
With 35.7% poverty level for males and 24.2% for females among the residents of Jonesville, under 5 year old males and under 5 year old females are the most vulnerable to poverty, with 61 males (100.0%) and 14 females (100.0%) in their respective age groups living below the poverty level.
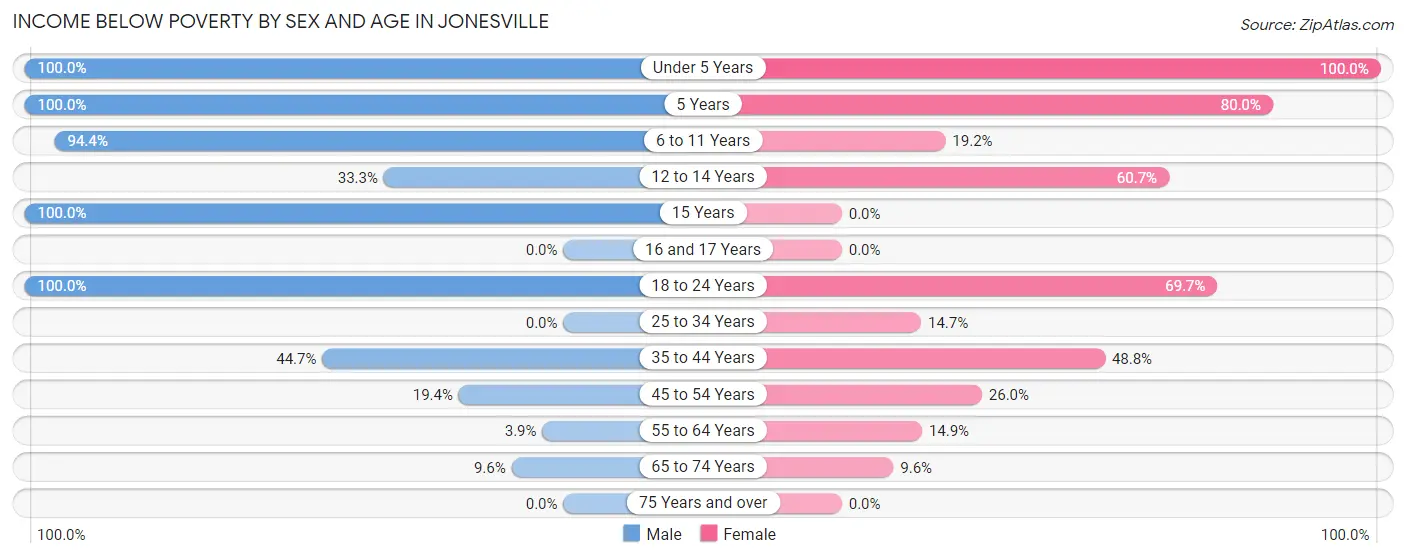
| Age Bracket | Male | Female |
| Under 5 Years | 61 (100.0%) | 14 (100.0%) |
| 5 Years | 13 (100.0%) | 4 (80.0%) |
| 6 to 11 Years | 17 (94.4%) | 5 (19.2%) |
| 12 to 14 Years | 6 (33.3%) | 17 (60.7%) |
| 15 Years | 14 (100.0%) | 0 (0.0%) |
| 16 and 17 Years | 0 (0.0%) | 0 (0.0%) |
| 18 to 24 Years | 14 (100.0%) | 23 (69.7%) |
| 25 to 34 Years | 0 (0.0%) | 10 (14.7%) |
| 35 to 44 Years | 17 (44.7%) | 42 (48.8%) |
| 45 to 54 Years | 13 (19.4%) | 13 (26.0%) |
| 55 to 64 Years | 3 (3.9%) | 36 (14.9%) |
| 65 to 74 Years | 5 (9.6%) | 9 (9.6%) |
| 75 Years and over | 0 (0.0%) | 0 (0.0%) |
| Total | 163 (35.7%) | 173 (24.2%) |
Income Above Poverty by Sex and Age in Jonesville
According to the poverty statistics in Jonesville, males aged 16 and 17 years and females aged 15 years are the age groups that are most secure financially, with 100.0% of males and 100.0% of females in these age groups living above the poverty line.
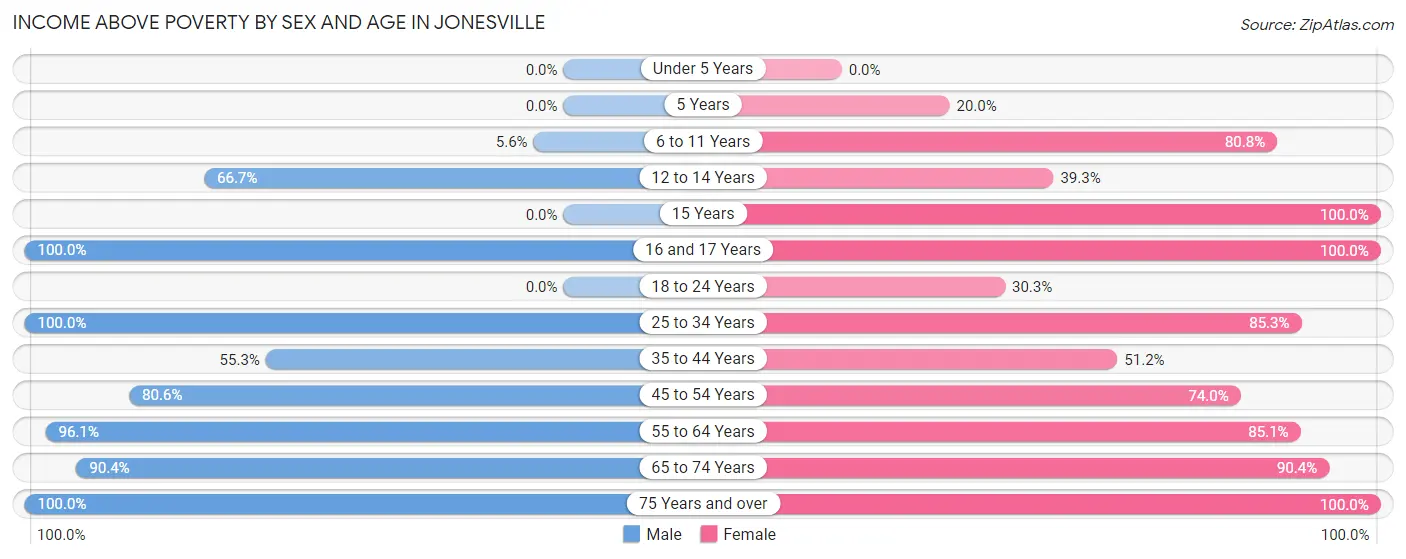
| Age Bracket | Male | Female |
| Under 5 Years | 0 (0.0%) | 0 (0.0%) |
| 5 Years | 0 (0.0%) | 1 (20.0%) |
| 6 to 11 Years | 1 (5.6%) | 21 (80.8%) |
| 12 to 14 Years | 12 (66.7%) | 11 (39.3%) |
| 15 Years | 0 (0.0%) | 26 (100.0%) |
| 16 and 17 Years | 10 (100.0%) | 15 (100.0%) |
| 18 to 24 Years | 0 (0.0%) | 10 (30.3%) |
| 25 to 34 Years | 5 (100.0%) | 58 (85.3%) |
| 35 to 44 Years | 21 (55.3%) | 44 (51.2%) |
| 45 to 54 Years | 54 (80.6%) | 37 (74.0%) |
| 55 to 64 Years | 74 (96.1%) | 206 (85.1%) |
| 65 to 74 Years | 47 (90.4%) | 85 (90.4%) |
| 75 Years and over | 70 (100.0%) | 28 (100.0%) |
| Total | 294 (64.3%) | 542 (75.8%) |
Income Below Poverty Among Married-Couple Families in Jonesville
The poverty statistics for married-couple families in Jonesville show that 11.5% or 30 of the total 262 families live below the poverty line. Families with 1 or 2 children have the highest poverty rate of 100.0%, comprising of 26 families. On the other hand, families with 3 or 4 children have the lowest poverty rate of 0.0%, which includes 0 families.
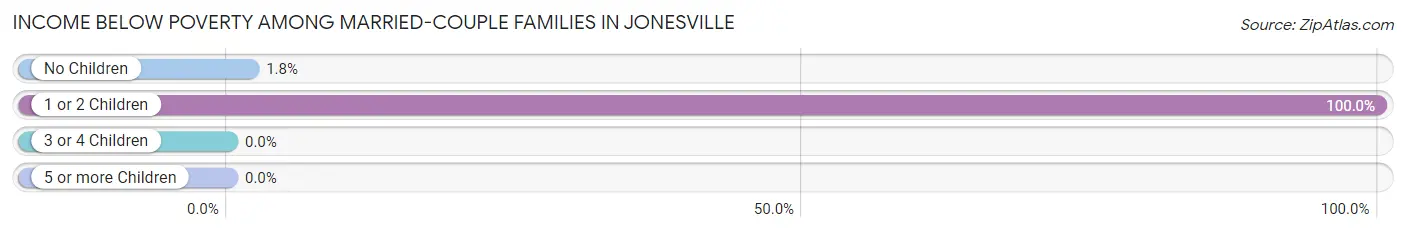
| Children | Above Poverty | Below Poverty |
| No Children | 213 (98.2%) | 4 (1.8%) |
| 1 or 2 Children | 0 (0.0%) | 26 (100.0%) |
| 3 or 4 Children | 19 (100.0%) | 0 (0.0%) |
| 5 or more Children | 0 (0.0%) | 0 (0.0%) |
| Total | 232 (88.5%) | 30 (11.5%) |
Income Below Poverty Among Single-Parent Households in Jonesville
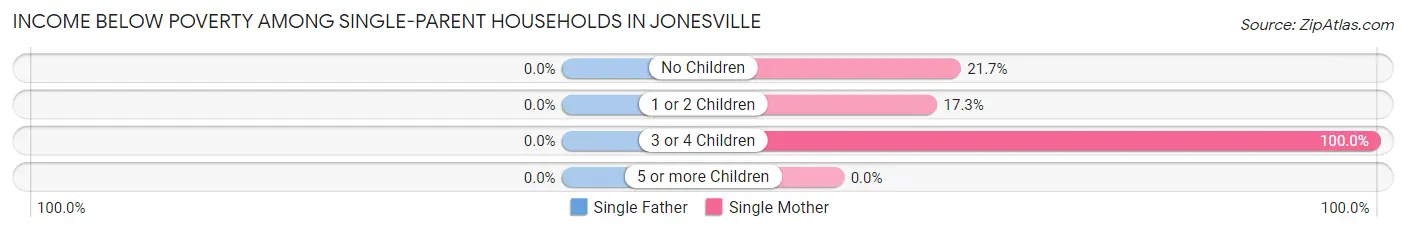
| Children | Single Father | Single Mother |
| No Children | 0 (0.0%) | 5 (21.7%) |
| 1 or 2 Children | 0 (0.0%) | 9 (17.3%) |
| 3 or 4 Children | 0 (0.0%) | 31 (100.0%) |
| 5 or more Children | 0 (0.0%) | 0 (0.0%) |
| Total | 0 (0.0%) | 45 (42.4%) |
Income Below Poverty Among Married-Couple vs Single-Parent Households in Jonesville
The poverty data for Jonesville shows that 30 of the married-couple family households (11.5%) and 45 of the single-parent households (32.6%) are living below the poverty level. Within the married-couple family households, those with 1 or 2 children have the highest poverty rate, with 26 households (100.0%) falling below the poverty line. Among the single-parent households, those with 3 or 4 children have the highest poverty rate, with 31 household (100.0%) living below poverty.
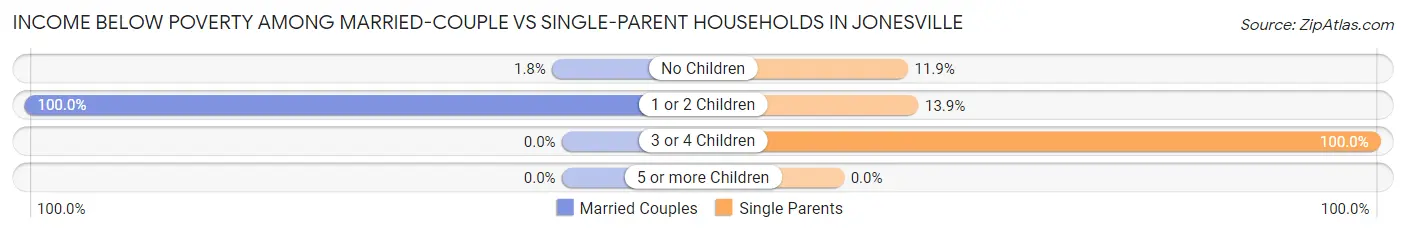
| Children | Married-Couple Families | Single-Parent Households |
| No Children | 4 (1.8%) | 5 (11.9%) |
| 1 or 2 Children | 26 (100.0%) | 9 (13.9%) |
| 3 or 4 Children | 0 (0.0%) | 31 (100.0%) |
| 5 or more Children | 0 (0.0%) | 0 (0.0%) |
| Total | 30 (11.5%) | 45 (32.6%) |
Race in Jonesville
The most populous races in Jonesville are Black / African American (839 | 67.0%), White / Caucasian (384 | 30.7%), and Two or more Races (29 | 2.3%).
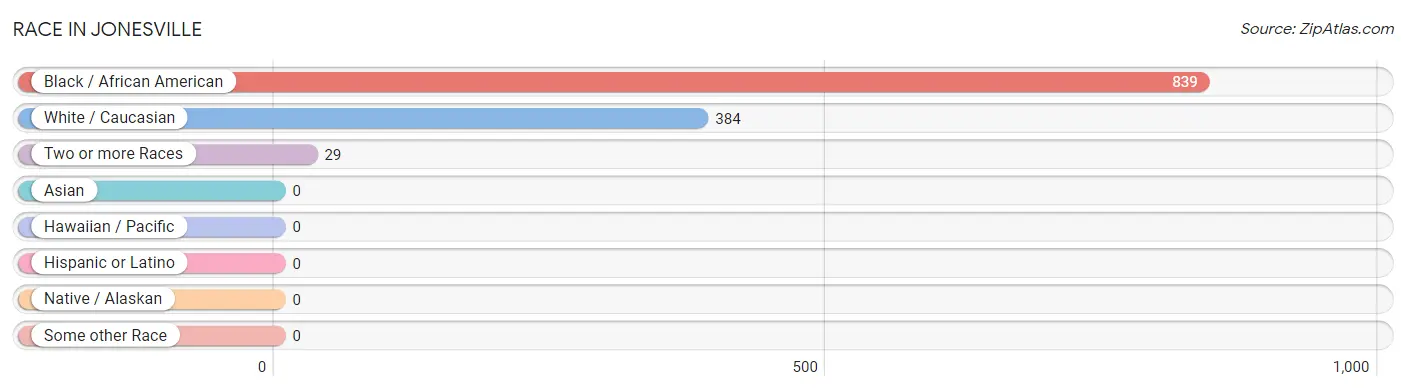
| Race | # Population | % Population |
| Asian | 0 | 0.0% |
| Black / African American | 839 | 67.0% |
| Hawaiian / Pacific | 0 | 0.0% |
| Hispanic or Latino | 0 | 0.0% |
| Native / Alaskan | 0 | 0.0% |
| White / Caucasian | 384 | 30.7% |
| Two or more Races | 29 | 2.3% |
| Some other Race | 0 | 0.0% |
| Total | 1,252 | 100.0% |
Ancestry in Jonesville
The most populous ancestries reported in Jonesville are English (102 | 8.2%), Scottish (93 | 7.4%), American (65 | 5.2%), African (63 | 5.0%), and Subsaharan African (63 | 5.0%), together accounting for 30.8% of all Jonesville residents.
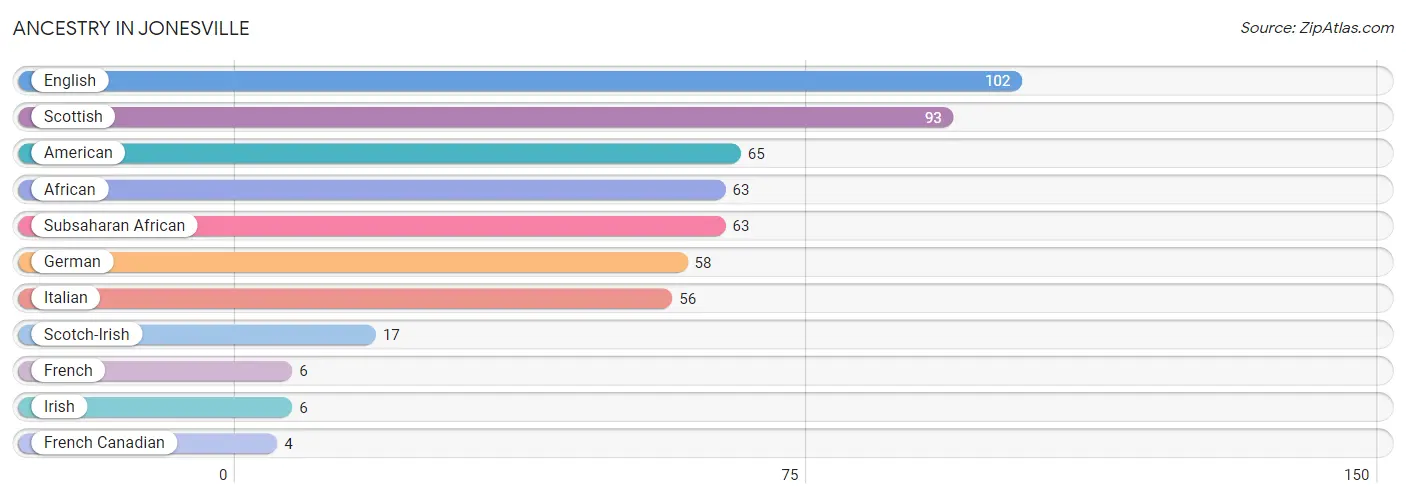
| Ancestry | # Population | % Population |
| African | 63 | 5.0% |
| American | 65 | 5.2% |
| English | 102 | 8.2% |
| French | 6 | 0.5% |
| French Canadian | 4 | 0.3% |
| German | 58 | 4.6% |
| Irish | 6 | 0.5% |
| Italian | 56 | 4.5% |
| Scotch-Irish | 17 | 1.4% |
| Scottish | 93 | 7.4% |
| Subsaharan African | 63 | 5.0% | View All 11 Rows |
Immigrants in Jonesville

| Immigration Origin | # Population | % Population | View All 0 Rows |
Sex and Age in Jonesville
Sex and Age in Jonesville
The most populous age groups in Jonesville are 60 to 64 Years (62 | 12.8%) for men and 60 to 64 Years (195 | 25.4%) for women.
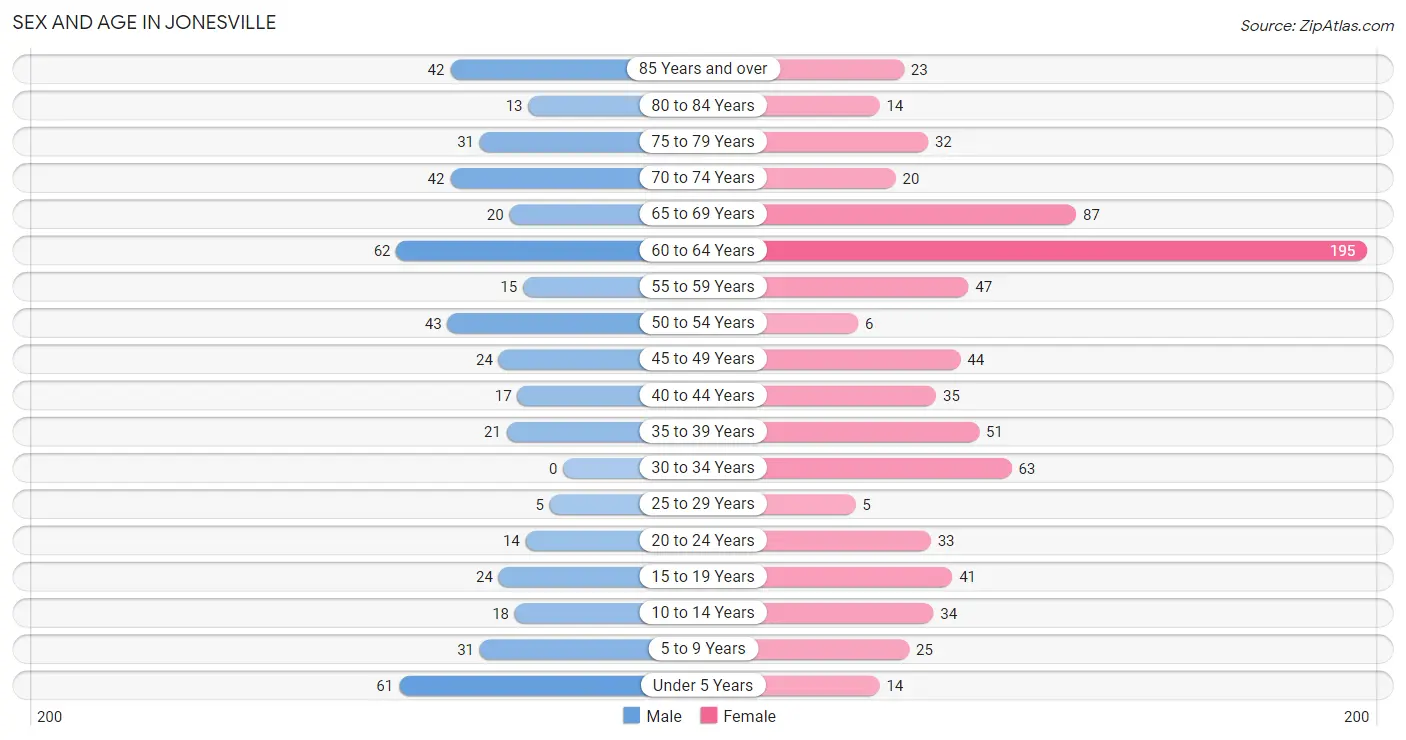
| Age Bracket | Male | Female |
| Under 5 Years | 61 (12.6%) | 14 (1.8%) |
| 5 to 9 Years | 31 (6.4%) | 25 (3.3%) |
| 10 to 14 Years | 18 (3.7%) | 34 (4.4%) |
| 15 to 19 Years | 24 (5.0%) | 41 (5.3%) |
| 20 to 24 Years | 14 (2.9%) | 33 (4.3%) |
| 25 to 29 Years | 5 (1.0%) | 5 (0.6%) |
| 30 to 34 Years | 0 (0.0%) | 63 (8.2%) |
| 35 to 39 Years | 21 (4.3%) | 51 (6.6%) |
| 40 to 44 Years | 17 (3.5%) | 35 (4.5%) |
| 45 to 49 Years | 24 (5.0%) | 44 (5.7%) |
| 50 to 54 Years | 43 (8.9%) | 6 (0.8%) |
| 55 to 59 Years | 15 (3.1%) | 47 (6.1%) |
| 60 to 64 Years | 62 (12.8%) | 195 (25.4%) |
| 65 to 69 Years | 20 (4.1%) | 87 (11.3%) |
| 70 to 74 Years | 42 (8.7%) | 20 (2.6%) |
| 75 to 79 Years | 31 (6.4%) | 32 (4.2%) |
| 80 to 84 Years | 13 (2.7%) | 14 (1.8%) |
| 85 Years and over | 42 (8.7%) | 23 (3.0%) |
| Total | 483 (100.0%) | 769 (100.0%) |
Families and Households in Jonesville
Median Family Size in Jonesville
The median family size in Jonesville is 2.45 persons per family, with single female/mother families (106 | 26.5%) accounting for the largest median family size of 3.03 persons per family. On the other hand, married-couple families (262 | 65.5%) represent the smallest median family size with 2.23 persons per family.
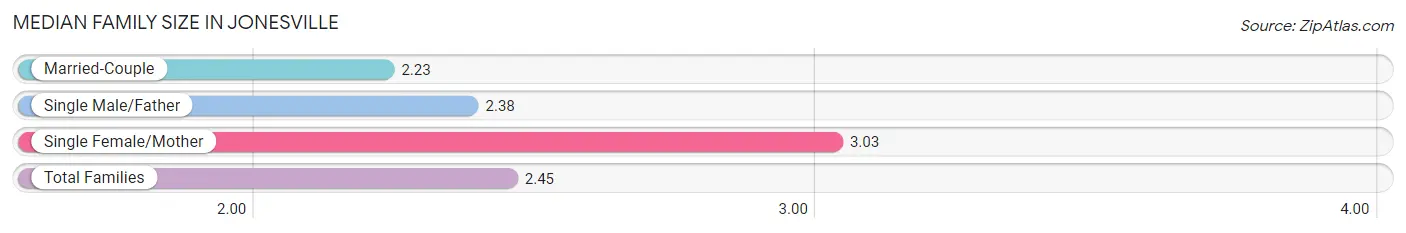
| Family Type | # Families | Family Size |
| Married-Couple | 262 (65.5%) | 2.23 |
| Single Male/Father | 32 (8.0%) | 2.38 |
| Single Female/Mother | 106 (26.5%) | 3.03 |
| Total Families | 400 (100.0%) | 2.45 |
Median Household Size in Jonesville
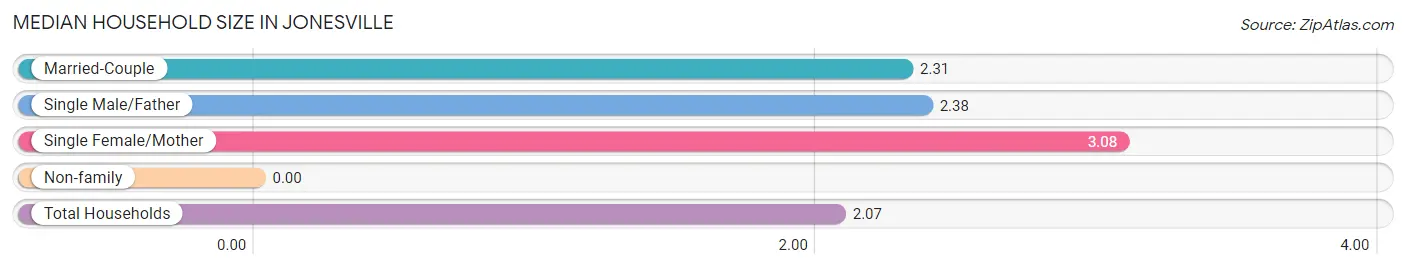
| Household Type | # Households | Household Size |
| Married-Couple | 262 (46.4%) | 2.31 |
| Single Male/Father | 32 (5.7%) | 2.38 |
| Single Female/Mother | 106 (18.8%) | 3.08 |
| Non-family | 165 (29.2%) | - |
| Total Households | 565 (100.0%) | 2.07 |
Household Size by Marriage Status in Jonesville
Out of a total of 565 households in Jonesville, 400 (70.8%) are family households, while 165 (29.2%) are nonfamily households. The most numerous type of family households are 2-person households, comprising 248, and the most common type of nonfamily households are 1-person households, comprising 165.
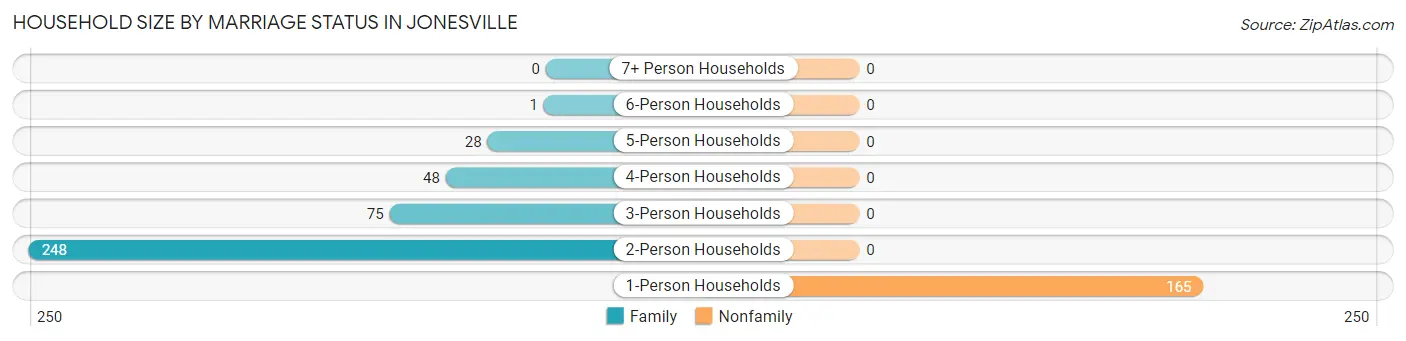
| Household Size | Family Households | Nonfamily Households |
| 1-Person Households | - | 165 (29.2%) |
| 2-Person Households | 248 (43.9%) | 0 (0.0%) |
| 3-Person Households | 75 (13.3%) | 0 (0.0%) |
| 4-Person Households | 48 (8.5%) | 0 (0.0%) |
| 5-Person Households | 28 (5.0%) | 0 (0.0%) |
| 6-Person Households | 1 (0.2%) | 0 (0.0%) |
| 7+ Person Households | 0 (0.0%) | 0 (0.0%) |
| Total | 400 (70.8%) | 165 (29.2%) |
Female Fertility in Jonesville
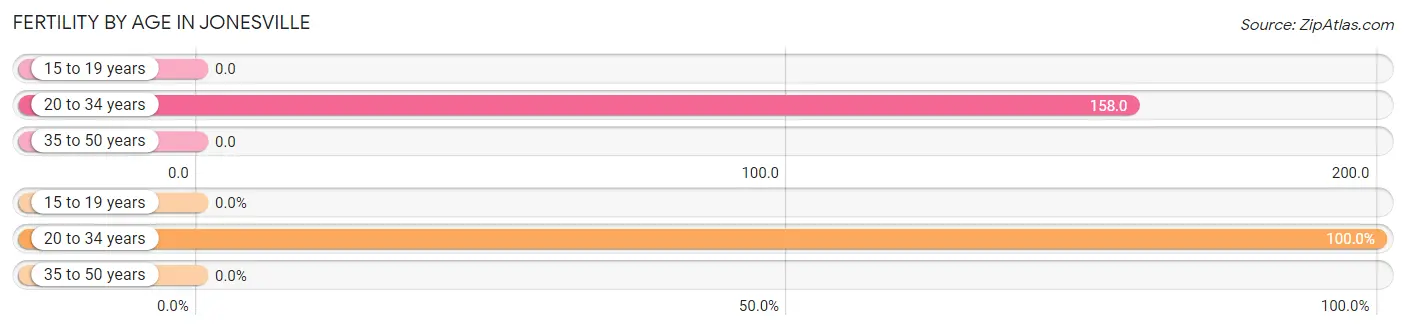
Fertility by Age in Jonesville
Average fertility rate in Jonesville is 59.0 births per 1,000 women. Women in the age bracket of 20 to 34 years have the highest fertility rate with 158.0 births per 1,000 women. Women in the age bracket of 20 to 34 years acount for 100.0% of all women with births.
| Age Bracket | Women with Births | Births / 1,000 Women |
| 15 to 19 years | 0 (0.0%) | 0.0 |
| 20 to 34 years | 16 (100.0%) | 158.0 |
| 35 to 50 years | 0 (0.0%) | 0.0 |
| Total | 16 (100.0%) | 59.0 |
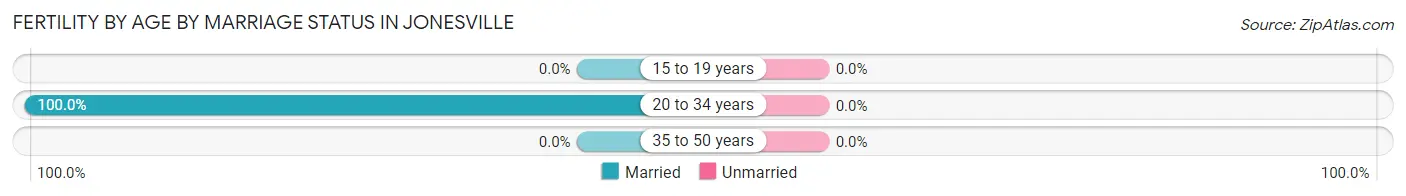
Fertility by Age by Marriage Status in Jonesville
| Age Bracket | Married | Unmarried |
| 15 to 19 years | 0 (0.0%) | 0 (0.0%) |
| 20 to 34 years | 16 (100.0%) | 0 (0.0%) |
| 35 to 50 years | 0 (0.0%) | 0 (0.0%) |
| Total | 16 (100.0%) | 0 (0.0%) |
Fertility by Education in Jonesville
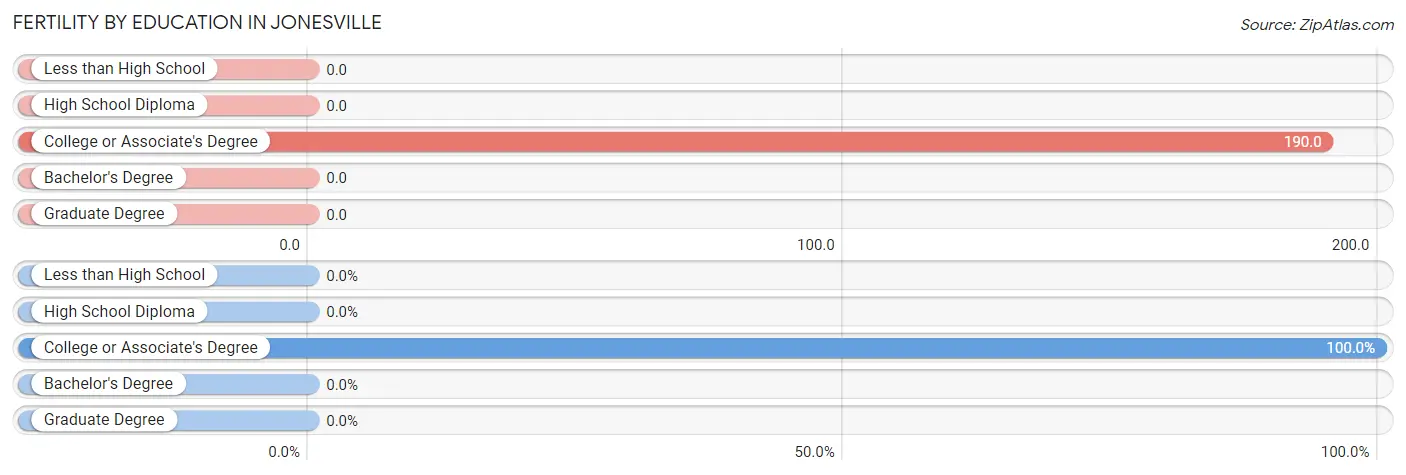
| Educational Attainment | Women with Births | Births / 1,000 Women |
| Less than High School | 0 (0.0%) | 0.0 |
| High School Diploma | 0 (0.0%) | 0.0 |
| College or Associate's Degree | 16 (100.0%) | 190.0 |
| Bachelor's Degree | 0 (0.0%) | 0.0 |
| Graduate Degree | 0 (0.0%) | 0.0 |
| Total | 16 (100.0%) | 59.0 |
Fertility by Education by Marriage Status in Jonesville
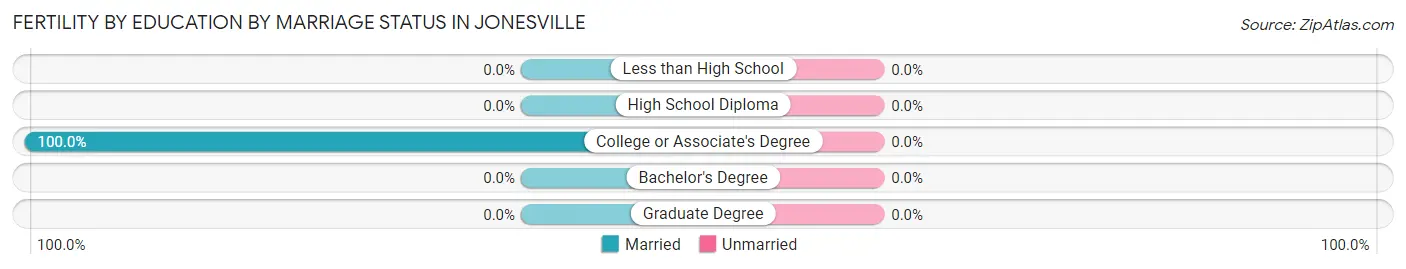
| Educational Attainment | Married | Unmarried |
| Less than High School | 0 (0.0%) | 0 (0.0%) |
| High School Diploma | 0 (0.0%) | 0 (0.0%) |
| College or Associate's Degree | 16 (100.0%) | 0 (0.0%) |
| Bachelor's Degree | 0 (0.0%) | 0 (0.0%) |
| Graduate Degree | 0 (0.0%) | 0 (0.0%) |
| Total | 16 (100.0%) | 0 (0.0%) |
Employment Characteristics in Jonesville
Employment by Class of Employer in Jonesville
Among the 408 employed individuals in Jonesville, private company employees (270 | 66.2%), local government employees (95 | 23.3%), and self-employed (not incorporated) (14 | 3.4%) make up the most common classes of employment.
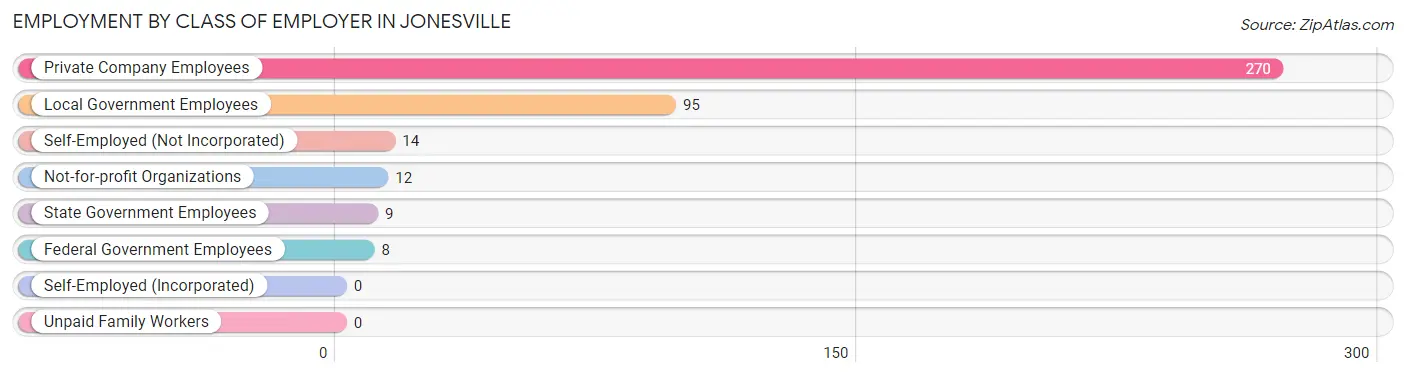
| Employer Class | # Employees | % Employees |
| Private Company Employees | 270 | 66.2% |
| Self-Employed (Incorporated) | 0 | 0.0% |
| Self-Employed (Not Incorporated) | 14 | 3.4% |
| Not-for-profit Organizations | 12 | 2.9% |
| Local Government Employees | 95 | 23.3% |
| State Government Employees | 9 | 2.2% |
| Federal Government Employees | 8 | 2.0% |
| Unpaid Family Workers | 0 | 0.0% |
| Total | 408 | 100.0% |
Employment Status by Age in Jonesville
According to the labor force statistics for Jonesville, out of the total population over 16 years of age (1,029), 43.1% or 443 individuals are in the labor force, with 7.9% or 35 of them unemployed. The age group with the highest labor force participation rate is 30 to 34 years, with 100.0% or 63 individuals in the labor force. Within the labor force, the 16 to 19 years age range has the highest percentage of unemployed individuals, with 100.0% or 15 of them being unemployed.
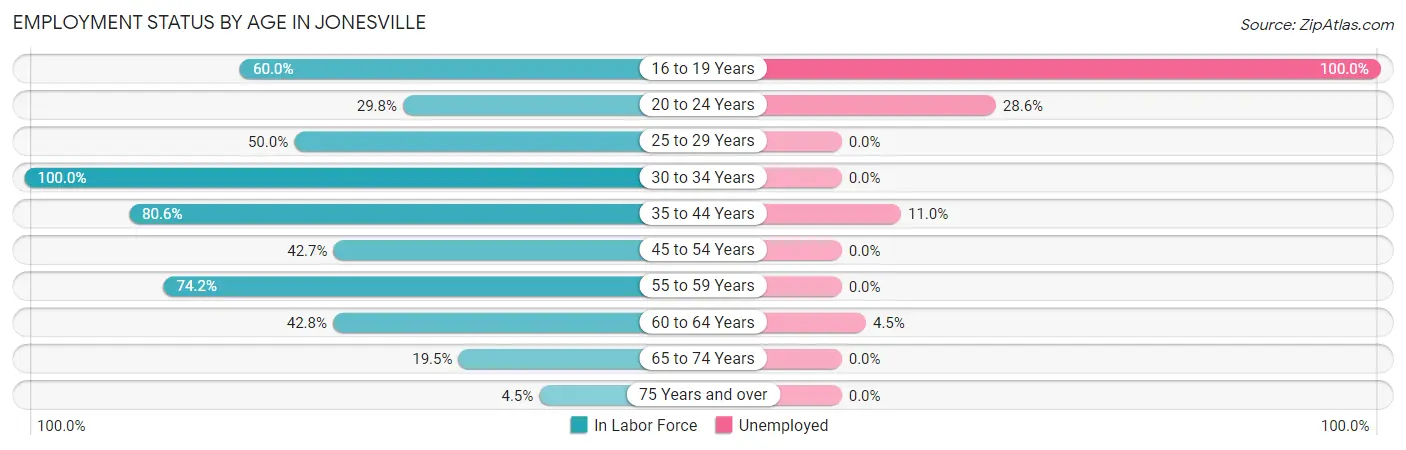
| Age Bracket | In Labor Force | Unemployed |
| 16 to 19 Years | 15 (60.0%) | 15 (100.0%) |
| 20 to 24 Years | 14 (29.8%) | 4 (28.6%) |
| 25 to 29 Years | 5 (50.0%) | 0 (0.0%) |
| 30 to 34 Years | 63 (100.0%) | 0 (0.0%) |
| 35 to 44 Years | 100 (80.6%) | 11 (11.0%) |
| 45 to 54 Years | 50 (42.7%) | 0 (0.0%) |
| 55 to 59 Years | 46 (74.2%) | 0 (0.0%) |
| 60 to 64 Years | 110 (42.8%) | 5 (4.5%) |
| 65 to 74 Years | 33 (19.5%) | 0 (0.0%) |
| 75 Years and over | 7 (4.5%) | 0 (0.0%) |
| Total | 443 (43.1%) | 35 (7.9%) |
Employment Status by Educational Attainment in Jonesville
According to labor force statistics for Jonesville, 59.1% of individuals (374) out of the total population between 25 and 64 years of age (633) are in the labor force, with 4.3% or 16 of them being unemployed. The group with the highest labor force participation rate are those with the educational attainment of college / associate degree, with 84.8% or 106 individuals in the labor force. Within the labor force, individuals with college / associate degree education have the highest percentage of unemployment, with 10.4% or 11 of them being unemployed.
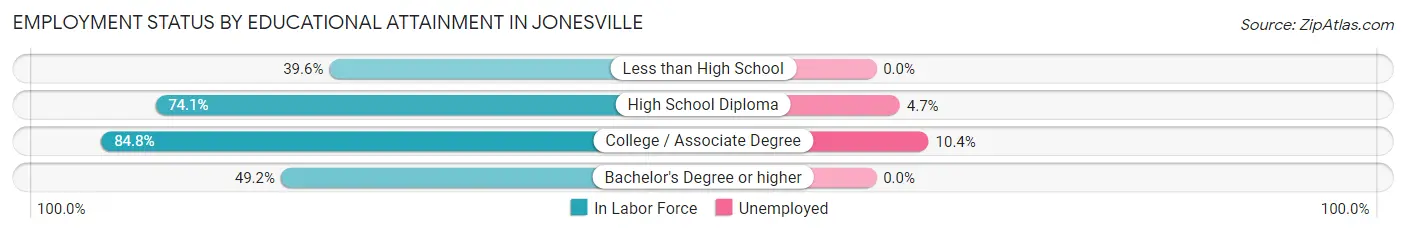
| Educational Attainment | In Labor Force | Unemployed |
| Less than High School | 72 (39.6%) | 0 (0.0%) |
| High School Diploma | 106 (74.1%) | 7 (4.7%) |
| College / Associate Degree | 106 (84.8%) | 13 (10.4%) |
| Bachelor's Degree or higher | 90 (49.2%) | 0 (0.0%) |
| Total | 374 (59.1%) | 27 (4.3%) |
Employment Occupations by Sex in Jonesville
Management, Business, Science and Arts Occupations
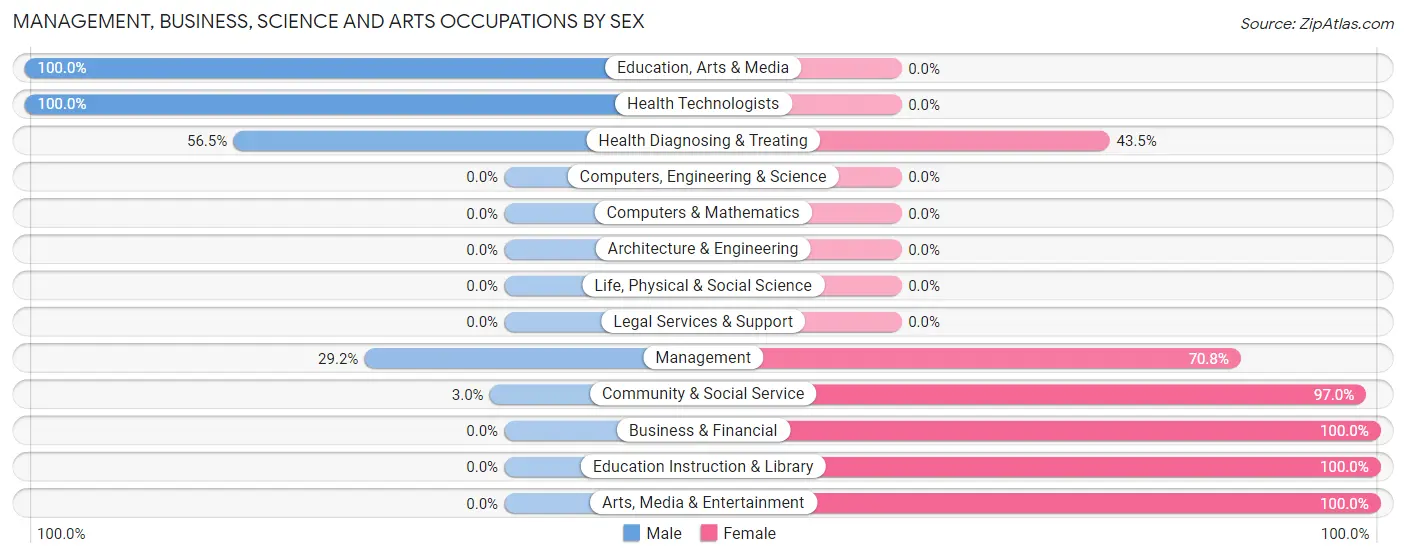
The most common Management, Business, Science and Arts occupations in Jonesville are Community & Social Service (33 | 8.1%), Education Instruction & Library (31 | 7.6%), Management (24 | 5.9%), Health Diagnosing & Treating (23 | 5.6%), and Business & Financial (18 | 4.4%).
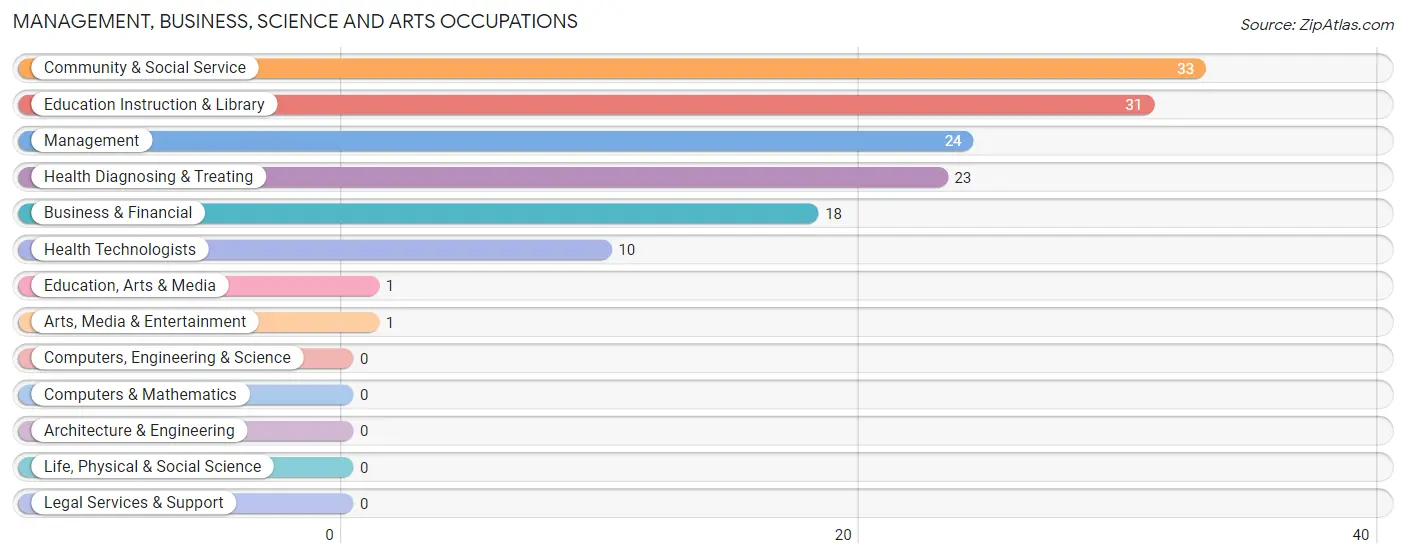
Management, Business, Science and Arts Occupations by Sex
Within the Management, Business, Science and Arts occupations in Jonesville, the most male-oriented occupations are Education, Arts & Media (100.0%), Health Technologists (100.0%), and Health Diagnosing & Treating (56.5%), while the most female-oriented occupations are Business & Financial (100.0%), Education Instruction & Library (100.0%), and Arts, Media & Entertainment (100.0%).
| Occupation | Male | Female |
| Management | 7 (29.2%) | 17 (70.8%) |
| Business & Financial | 0 (0.0%) | 18 (100.0%) |
| Computers, Engineering & Science | 0 (0.0%) | 0 (0.0%) |
| Computers & Mathematics | 0 (0.0%) | 0 (0.0%) |
| Architecture & Engineering | 0 (0.0%) | 0 (0.0%) |
| Life, Physical & Social Science | 0 (0.0%) | 0 (0.0%) |
| Community & Social Service | 1 (3.0%) | 32 (97.0%) |
| Education, Arts & Media | 1 (100.0%) | 0 (0.0%) |
| Legal Services & Support | 0 (0.0%) | 0 (0.0%) |
| Education Instruction & Library | 0 (0.0%) | 31 (100.0%) |
| Arts, Media & Entertainment | 0 (0.0%) | 1 (100.0%) |
| Health Diagnosing & Treating | 13 (56.5%) | 10 (43.5%) |
| Health Technologists | 10 (100.0%) | 0 (0.0%) |
| Total (Category) | 21 (21.4%) | 77 (78.6%) |
| Total (Overall) | 110 (27.0%) | 298 (73.0%) |
Services Occupations
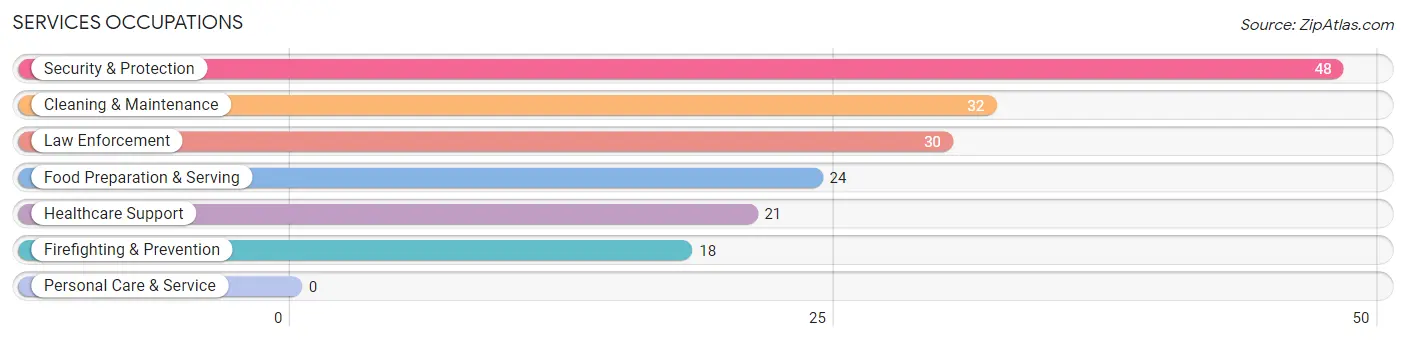
The most common Services occupations in Jonesville are Security & Protection (48 | 11.8%), Cleaning & Maintenance (32 | 7.8%), Law Enforcement (30 | 7.3%), Food Preparation & Serving (24 | 5.9%), and Healthcare Support (21 | 5.1%).
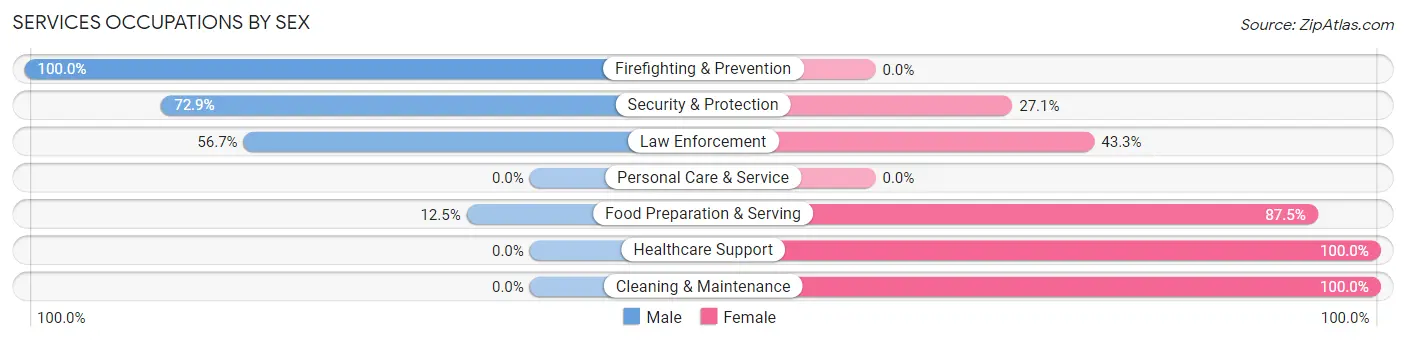
Services Occupations by Sex
Within the Services occupations in Jonesville, the most male-oriented occupations are Firefighting & Prevention (100.0%), Security & Protection (72.9%), and Law Enforcement (56.7%), while the most female-oriented occupations are Healthcare Support (100.0%), Cleaning & Maintenance (100.0%), and Food Preparation & Serving (87.5%).
| Occupation | Male | Female |
| Healthcare Support | 0 (0.0%) | 21 (100.0%) |
| Security & Protection | 35 (72.9%) | 13 (27.1%) |
| Firefighting & Prevention | 18 (100.0%) | 0 (0.0%) |
| Law Enforcement | 17 (56.7%) | 13 (43.3%) |
| Food Preparation & Serving | 3 (12.5%) | 21 (87.5%) |
| Cleaning & Maintenance | 0 (0.0%) | 32 (100.0%) |
| Personal Care & Service | 0 (0.0%) | 0 (0.0%) |
| Total (Category) | 38 (30.4%) | 87 (69.6%) |
| Total (Overall) | 110 (27.0%) | 298 (73.0%) |
Sales and Office Occupations
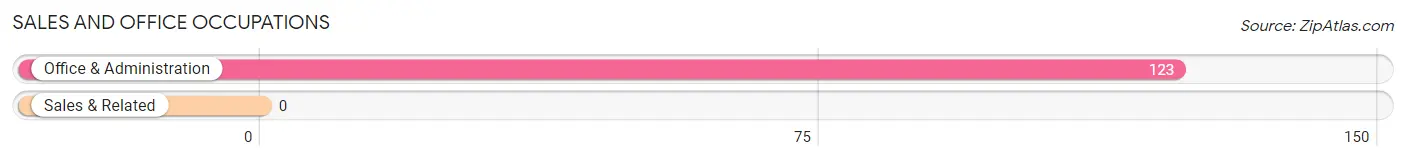
The most common Sales and Office occupations in Jonesville are , and Office & Administration (123 | 30.1%).
Sales and Office Occupations by Sex

| Occupation | Male | Female |
| Sales & Related | 0 (0.0%) | 0 (0.0%) |
| Office & Administration | 22 (17.9%) | 101 (82.1%) |
| Total (Category) | 22 (17.9%) | 101 (82.1%) |
| Total (Overall) | 110 (27.0%) | 298 (73.0%) |
Natural Resources, Construction and Maintenance Occupations
The most common Natural Resources, Construction and Maintenance occupations in Jonesville are Construction & Extraction (16 | 3.9%), and Installation, Maintenance & Repair (7 | 1.7%).
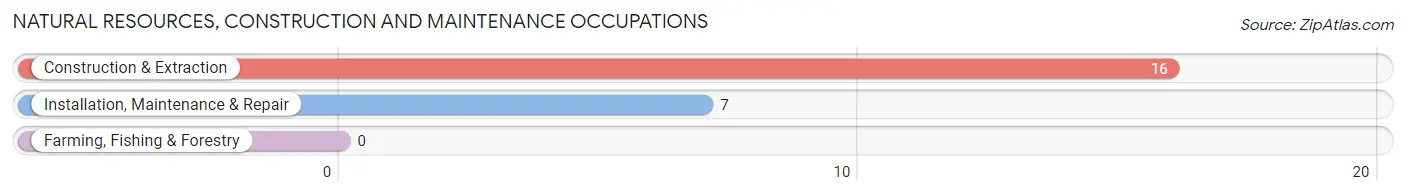
Natural Resources, Construction and Maintenance Occupations by Sex

| Occupation | Male | Female |
| Farming, Fishing & Forestry | 0 (0.0%) | 0 (0.0%) |
| Construction & Extraction | 16 (100.0%) | 0 (0.0%) |
| Installation, Maintenance & Repair | 7 (100.0%) | 0 (0.0%) |
| Total (Category) | 23 (100.0%) | 0 (0.0%) |
| Total (Overall) | 110 (27.0%) | 298 (73.0%) |
Production, Transportation and Moving Occupations
The most common Production, Transportation and Moving occupations in Jonesville are Production (33 | 8.1%), and Material Moving (6 | 1.5%).
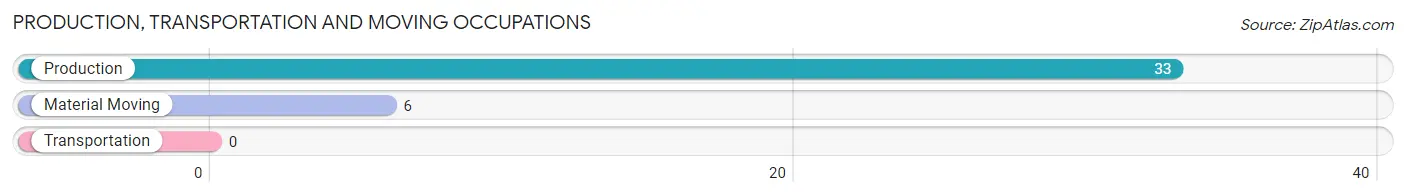
Production, Transportation and Moving Occupations by Sex
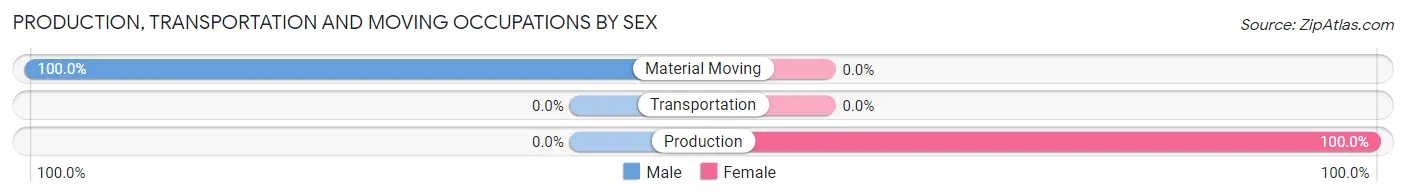
| Occupation | Male | Female |
| Production | 0 (0.0%) | 33 (100.0%) |
| Transportation | 0 (0.0%) | 0 (0.0%) |
| Material Moving | 6 (100.0%) | 0 (0.0%) |
| Total (Category) | 6 (15.4%) | 33 (84.6%) |
| Total (Overall) | 110 (27.0%) | 298 (73.0%) |
Employment Industries by Sex in Jonesville
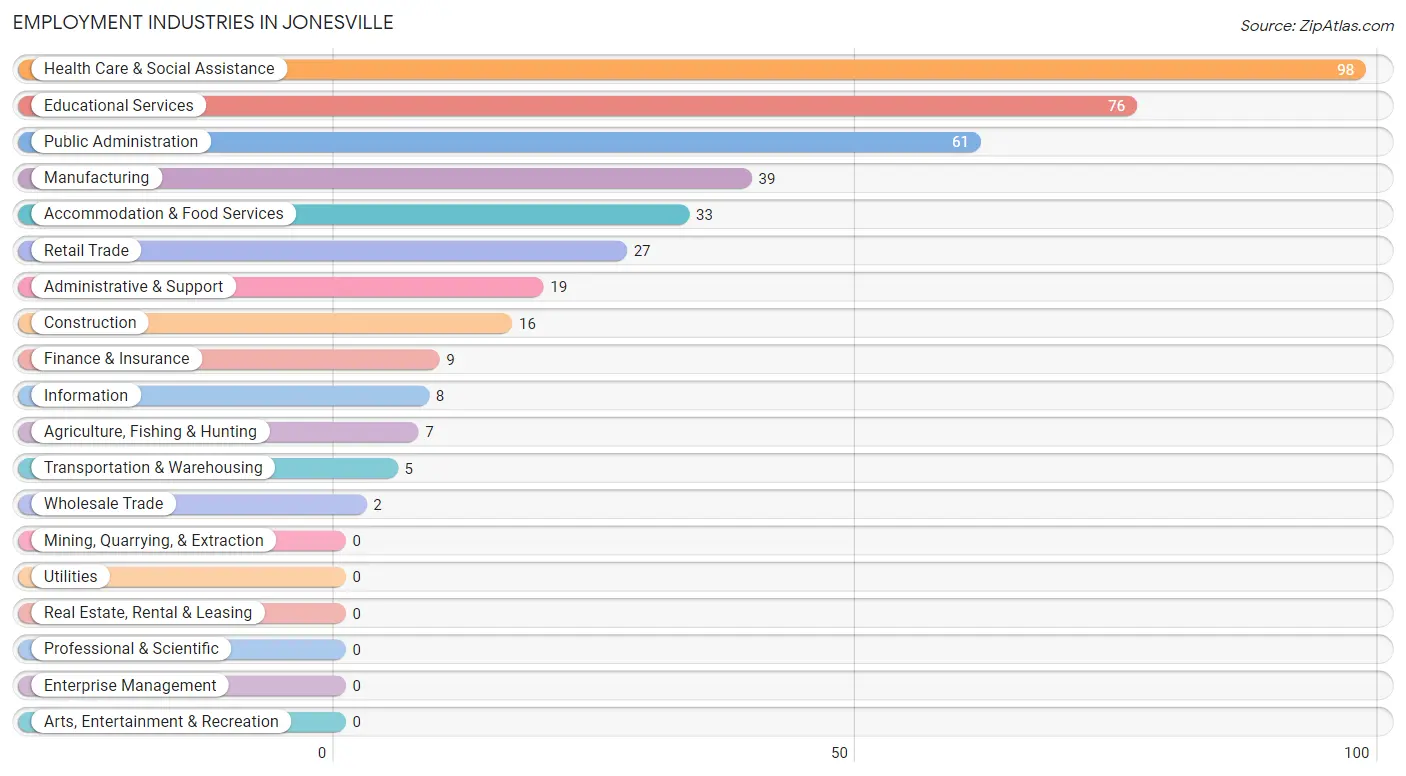
Employment Industries in Jonesville
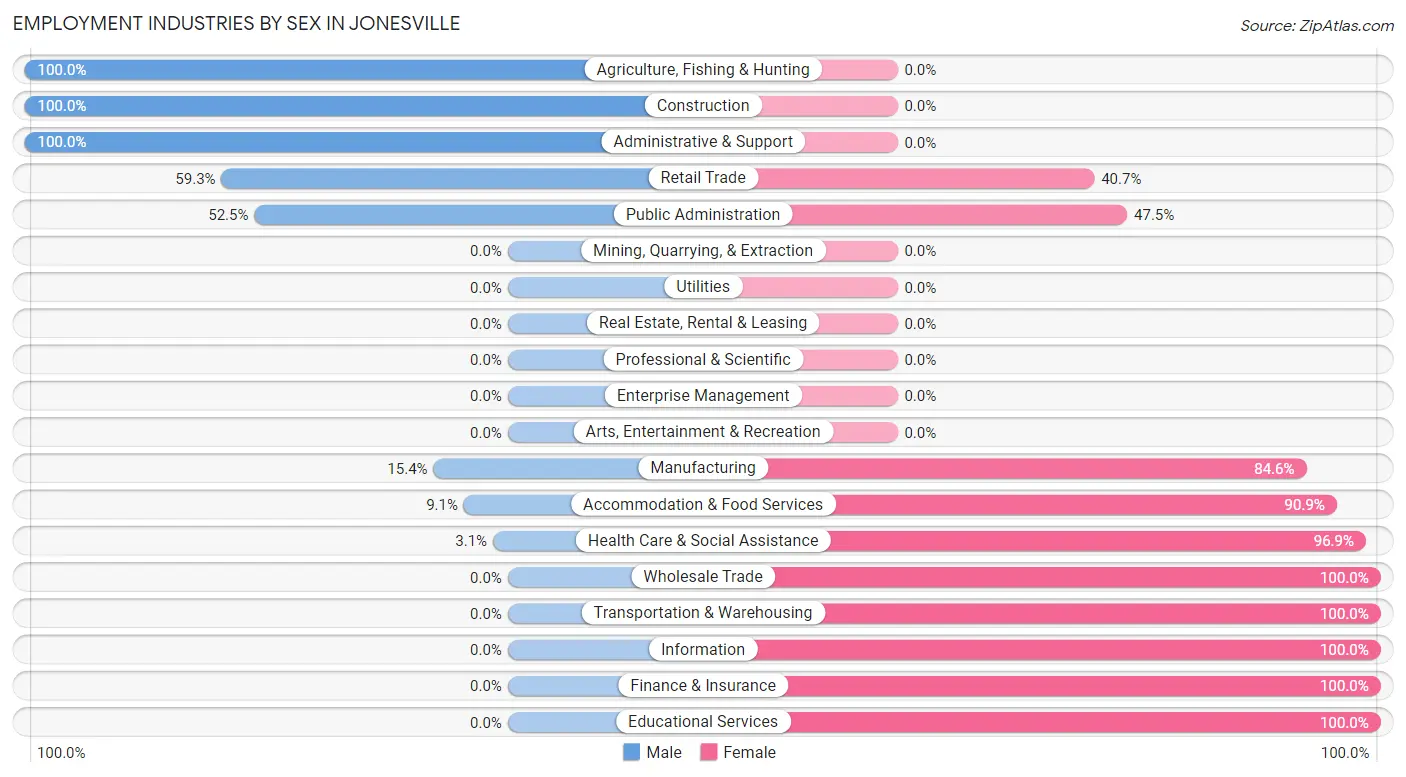
The major employment industries in Jonesville include Health Care & Social Assistance (98 | 24.0%), Educational Services (76 | 18.6%), Public Administration (61 | 14.9%), Manufacturing (39 | 9.6%), and Accommodation & Food Services (33 | 8.1%).
Employment Industries by Sex in Jonesville
The Jonesville industries that see more men than women are Agriculture, Fishing & Hunting (100.0%), Construction (100.0%), and Administrative & Support (100.0%), whereas the industries that tend to have a higher number of women are Wholesale Trade (100.0%), Transportation & Warehousing (100.0%), and Information (100.0%).
| Industry | Male | Female |
| Agriculture, Fishing & Hunting | 7 (100.0%) | 0 (0.0%) |
| Mining, Quarrying, & Extraction | 0 (0.0%) | 0 (0.0%) |
| Construction | 16 (100.0%) | 0 (0.0%) |
| Manufacturing | 6 (15.4%) | 33 (84.6%) |
| Wholesale Trade | 0 (0.0%) | 2 (100.0%) |
| Retail Trade | 16 (59.3%) | 11 (40.7%) |
| Transportation & Warehousing | 0 (0.0%) | 5 (100.0%) |
| Utilities | 0 (0.0%) | 0 (0.0%) |
| Information | 0 (0.0%) | 8 (100.0%) |
| Finance & Insurance | 0 (0.0%) | 9 (100.0%) |
| Real Estate, Rental & Leasing | 0 (0.0%) | 0 (0.0%) |
| Professional & Scientific | 0 (0.0%) | 0 (0.0%) |
| Enterprise Management | 0 (0.0%) | 0 (0.0%) |
| Administrative & Support | 19 (100.0%) | 0 (0.0%) |
| Educational Services | 0 (0.0%) | 76 (100.0%) |
| Health Care & Social Assistance | 3 (3.1%) | 95 (96.9%) |
| Arts, Entertainment & Recreation | 0 (0.0%) | 0 (0.0%) |
| Accommodation & Food Services | 3 (9.1%) | 30 (90.9%) |
| Public Administration | 32 (52.5%) | 29 (47.5%) |
| Total | 110 (27.0%) | 298 (73.0%) |
Education in Jonesville
School Enrollment in Jonesville
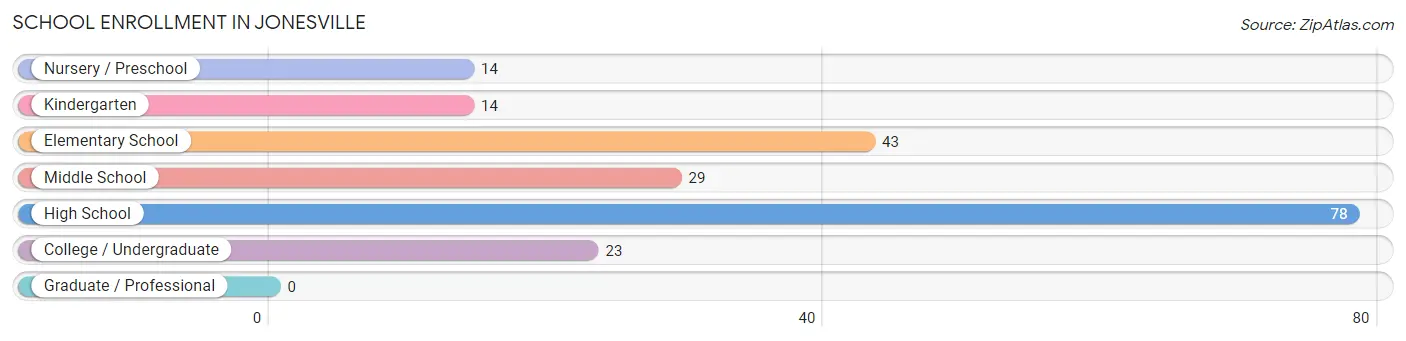
The most common levels of schooling among the 201 students in Jonesville are high school (78 | 38.8%), elementary school (43 | 21.4%), and middle school (29 | 14.4%).
| School Level | # Students | % Students |
| Nursery / Preschool | 14 | 7.0% |
| Kindergarten | 14 | 7.0% |
| Elementary School | 43 | 21.4% |
| Middle School | 29 | 14.4% |
| High School | 78 | 38.8% |
| College / Undergraduate | 23 | 11.4% |
| Graduate / Professional | 0 | 0.0% |
| Total | 201 | 100.0% |
School Enrollment by Age by Funding Source in Jonesville
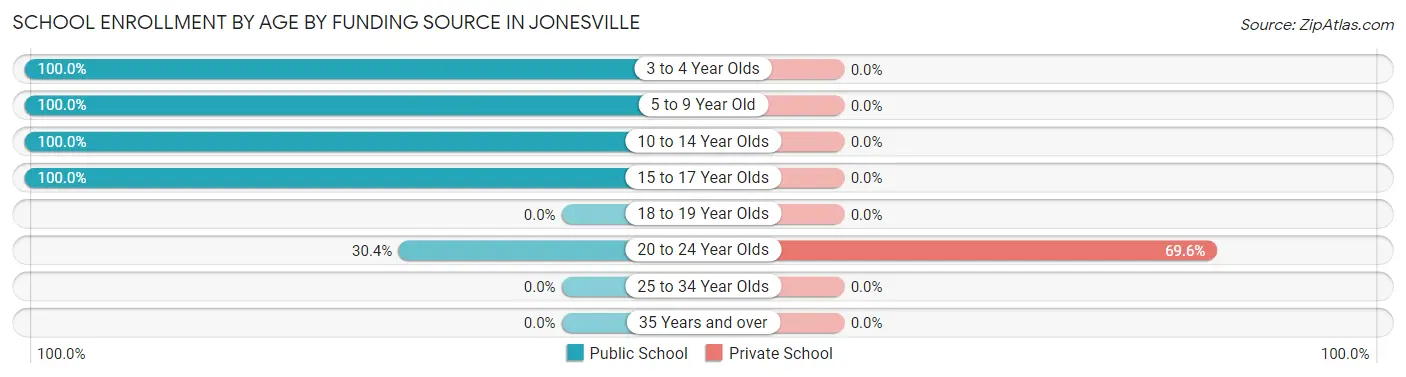
Out of a total of 201 students who are enrolled in schools in Jonesville, 16 (8.0%) attend a private institution, while the remaining 185 (92.0%) are enrolled in public schools. The age group of 20 to 24 year olds has the highest likelihood of being enrolled in private schools, with 16 (69.6% in the age bracket) enrolled. Conversely, the age group of 3 to 4 year olds has the lowest likelihood of being enrolled in a private school, with 14 (100.0% in the age bracket) attending a public institution.
| Age Bracket | Public School | Private School |
| 3 to 4 Year Olds | 14 (100.0%) | 0 (0.0%) |
| 5 to 9 Year Old | 52 (100.0%) | 0 (0.0%) |
| 10 to 14 Year Olds | 47 (100.0%) | 0 (0.0%) |
| 15 to 17 Year Olds | 65 (100.0%) | 0 (0.0%) |
| 18 to 19 Year Olds | 0 (0.0%) | 0 (0.0%) |
| 20 to 24 Year Olds | 7 (30.4%) | 16 (69.6%) |
| 25 to 34 Year Olds | 0 (0.0%) | 0 (0.0%) |
| 35 Years and over | 0 (0.0%) | 0 (0.0%) |
| Total | 185 (92.0%) | 16 (8.0%) |
Educational Attainment by Field of Study in Jonesville
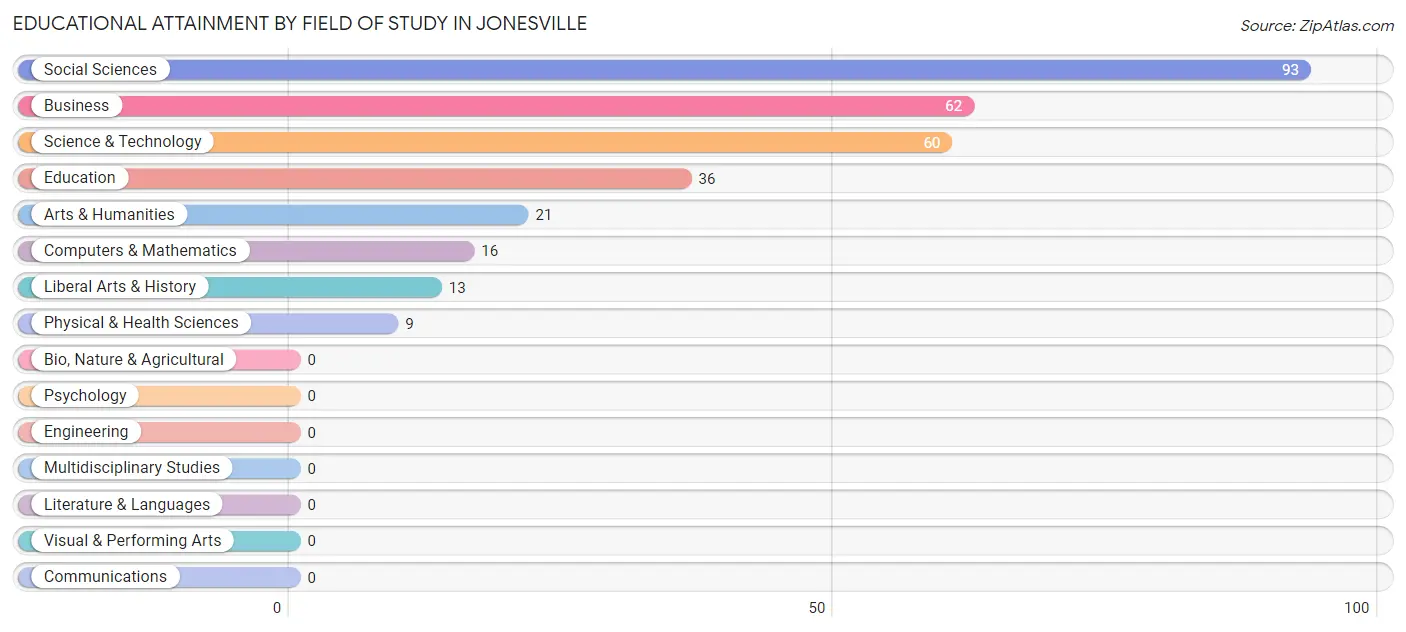
Social sciences (93 | 30.0%), business (62 | 20.0%), science & technology (60 | 19.4%), education (36 | 11.6%), and arts & humanities (21 | 6.8%) are the most common fields of study among 310 individuals in Jonesville who have obtained a bachelor's degree or higher.
| Field of Study | # Graduates | % Graduates |
| Computers & Mathematics | 16 | 5.2% |
| Bio, Nature & Agricultural | 0 | 0.0% |
| Physical & Health Sciences | 9 | 2.9% |
| Psychology | 0 | 0.0% |
| Social Sciences | 93 | 30.0% |
| Engineering | 0 | 0.0% |
| Multidisciplinary Studies | 0 | 0.0% |
| Science & Technology | 60 | 19.4% |
| Business | 62 | 20.0% |
| Education | 36 | 11.6% |
| Literature & Languages | 0 | 0.0% |
| Liberal Arts & History | 13 | 4.2% |
| Visual & Performing Arts | 0 | 0.0% |
| Communications | 0 | 0.0% |
| Arts & Humanities | 21 | 6.8% |
| Total | 310 | 100.0% |
Transportation & Commute in Jonesville
Vehicle Availability by Sex in Jonesville
The most prevalent vehicle ownership categories in Jonesville are males with 2 vehicles (61, accounting for 55.4%) and females with 2 vehicles (152, making up 20.5%).
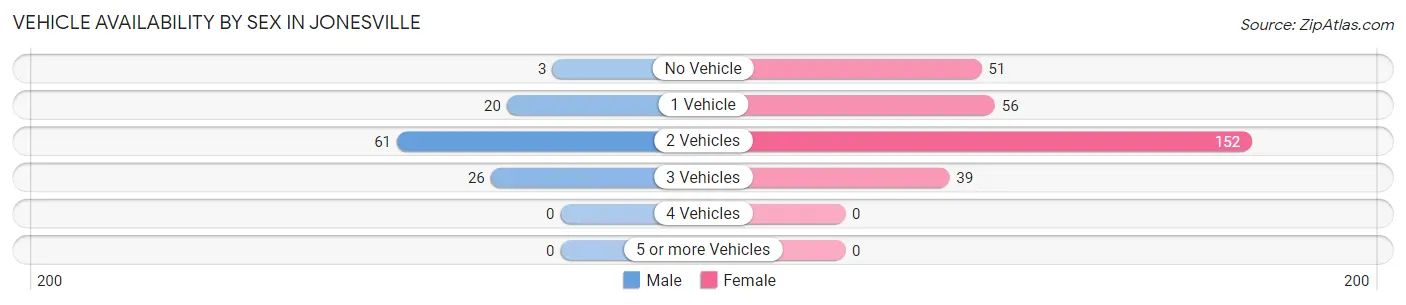
| Vehicles Available | Male | Female |
| No Vehicle | 3 (2.7%) | 51 (17.1%) |
| 1 Vehicle | 20 (18.2%) | 56 (18.8%) |
| 2 Vehicles | 61 (55.4%) | 152 (51.0%) |
| 3 Vehicles | 26 (23.6%) | 39 (13.1%) |
| 4 Vehicles | 0 (0.0%) | 0 (0.0%) |
| 5 or more Vehicles | 0 (0.0%) | 0 (0.0%) |
| Total | 110 (100.0%) | 298 (100.0%) |
Commute Time in Jonesville
The most frequently occuring commute durations in Jonesville are 30 to 34 minutes (125 commuters, 31.2%), 10 to 14 minutes (93 commuters, 23.3%), and 15 to 19 minutes (71 commuters, 17.7%).
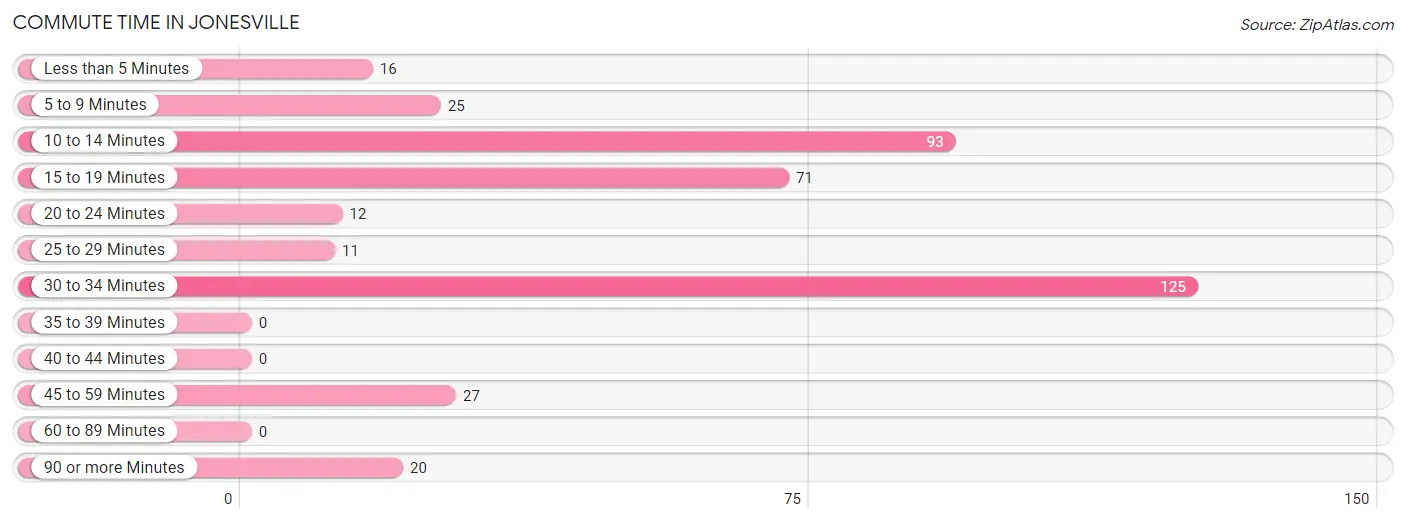
| Commute Time | # Commuters | % Commuters |
| Less than 5 Minutes | 16 | 4.0% |
| 5 to 9 Minutes | 25 | 6.2% |
| 10 to 14 Minutes | 93 | 23.3% |
| 15 to 19 Minutes | 71 | 17.7% |
| 20 to 24 Minutes | 12 | 3.0% |
| 25 to 29 Minutes | 11 | 2.8% |
| 30 to 34 Minutes | 125 | 31.2% |
| 35 to 39 Minutes | 0 | 0.0% |
| 40 to 44 Minutes | 0 | 0.0% |
| 45 to 59 Minutes | 27 | 6.8% |
| 60 to 89 Minutes | 0 | 0.0% |
| 90 or more Minutes | 20 | 5.0% |
Commute Time by Sex in Jonesville
The most common commute times in Jonesville are 10 to 14 minutes (35 commuters, 31.8%) for males and 30 to 34 minutes (106 commuters, 36.5%) for females.
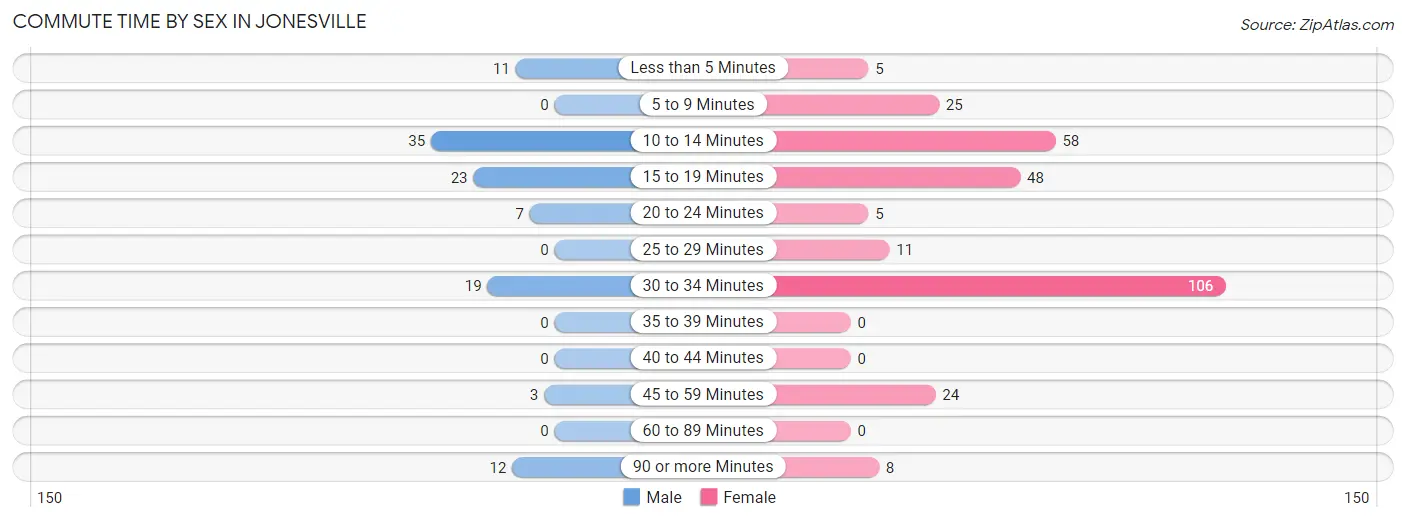
| Commute Time | Male | Female |
| Less than 5 Minutes | 11 (10.0%) | 5 (1.7%) |
| 5 to 9 Minutes | 0 (0.0%) | 25 (8.6%) |
| 10 to 14 Minutes | 35 (31.8%) | 58 (20.0%) |
| 15 to 19 Minutes | 23 (20.9%) | 48 (16.6%) |
| 20 to 24 Minutes | 7 (6.4%) | 5 (1.7%) |
| 25 to 29 Minutes | 0 (0.0%) | 11 (3.8%) |
| 30 to 34 Minutes | 19 (17.3%) | 106 (36.5%) |
| 35 to 39 Minutes | 0 (0.0%) | 0 (0.0%) |
| 40 to 44 Minutes | 0 (0.0%) | 0 (0.0%) |
| 45 to 59 Minutes | 3 (2.7%) | 24 (8.3%) |
| 60 to 89 Minutes | 0 (0.0%) | 0 (0.0%) |
| 90 or more Minutes | 12 (10.9%) | 8 (2.8%) |
Time of Departure to Work by Sex in Jonesville
The most frequent times of departure to work in Jonesville are 7:00 AM to 7:29 AM (36, 32.7%) for males and 7:30 AM to 7:59 AM (120, 41.4%) for females.
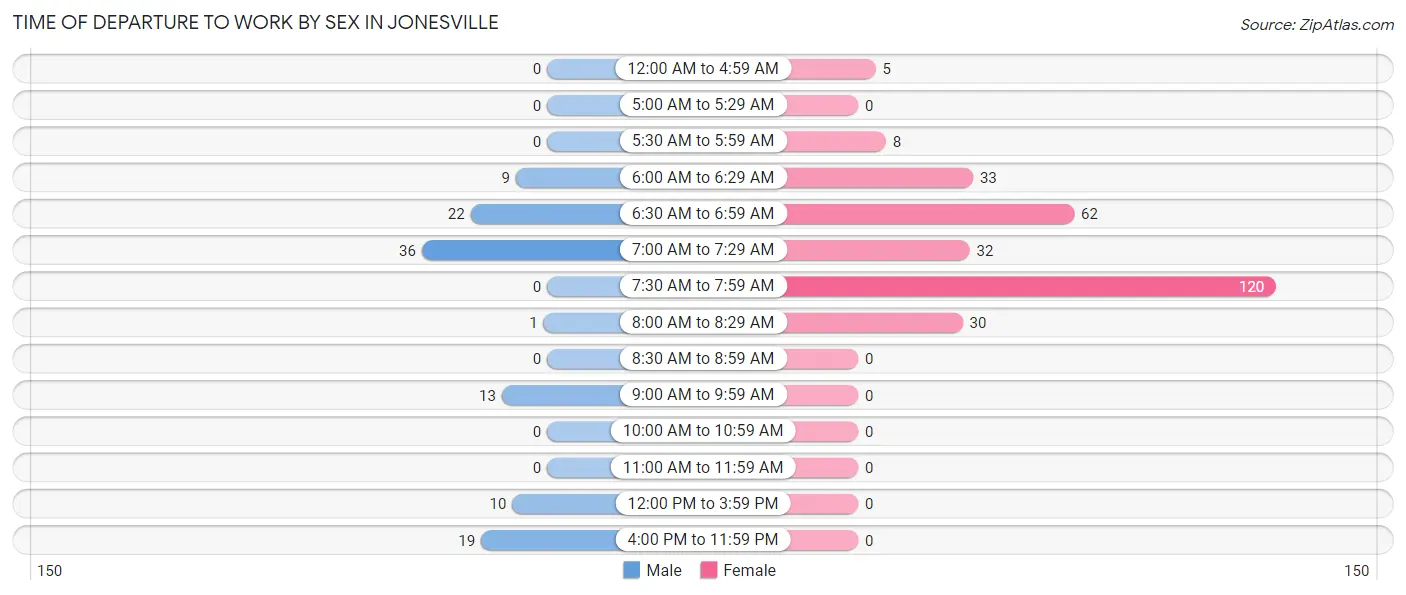
| Time of Departure | Male | Female |
| 12:00 AM to 4:59 AM | 0 (0.0%) | 5 (1.7%) |
| 5:00 AM to 5:29 AM | 0 (0.0%) | 0 (0.0%) |
| 5:30 AM to 5:59 AM | 0 (0.0%) | 8 (2.8%) |
| 6:00 AM to 6:29 AM | 9 (8.2%) | 33 (11.4%) |
| 6:30 AM to 6:59 AM | 22 (20.0%) | 62 (21.4%) |
| 7:00 AM to 7:29 AM | 36 (32.7%) | 32 (11.0%) |
| 7:30 AM to 7:59 AM | 0 (0.0%) | 120 (41.4%) |
| 8:00 AM to 8:29 AM | 1 (0.9%) | 30 (10.3%) |
| 8:30 AM to 8:59 AM | 0 (0.0%) | 0 (0.0%) |
| 9:00 AM to 9:59 AM | 13 (11.8%) | 0 (0.0%) |
| 10:00 AM to 10:59 AM | 0 (0.0%) | 0 (0.0%) |
| 11:00 AM to 11:59 AM | 0 (0.0%) | 0 (0.0%) |
| 12:00 PM to 3:59 PM | 10 (9.1%) | 0 (0.0%) |
| 4:00 PM to 11:59 PM | 19 (17.3%) | 0 (0.0%) |
| Total | 110 (100.0%) | 290 (100.0%) |
Housing Occupancy in Jonesville
Occupancy by Ownership in Jonesville
Of the total 565 dwellings in Jonesville, owner-occupied units account for 412 (72.9%), while renter-occupied units make up 153 (27.1%).
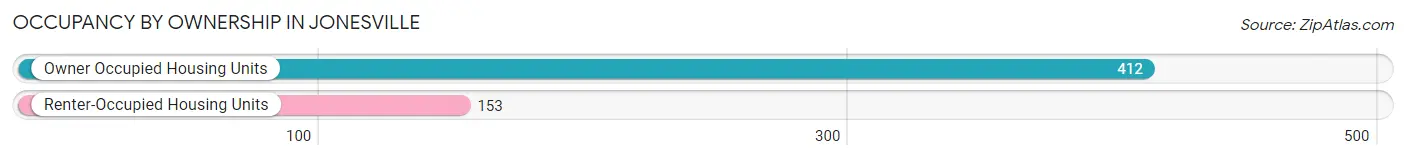
| Occupancy | # Housing Units | % Housing Units |
| Owner Occupied Housing Units | 412 | 72.9% |
| Renter-Occupied Housing Units | 153 | 27.1% |
| Total Occupied Housing Units | 565 | 100.0% |
Occupancy by Household Size in Jonesville
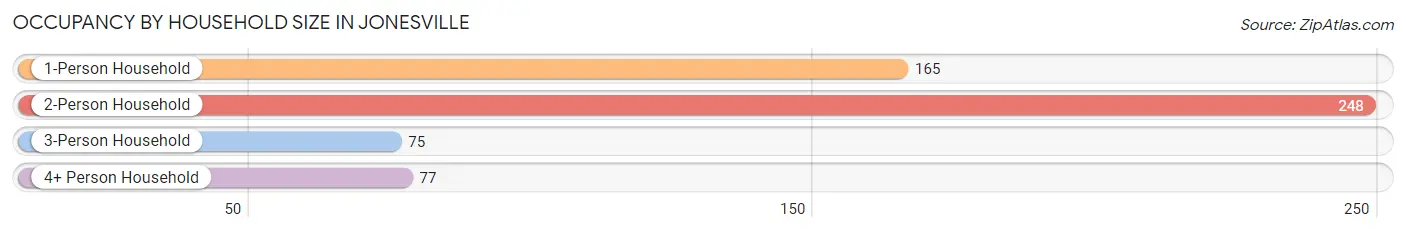
| Household Size | # Housing Units | % Housing Units |
| 1-Person Household | 165 | 29.2% |
| 2-Person Household | 248 | 43.9% |
| 3-Person Household | 75 | 13.3% |
| 4+ Person Household | 77 | 13.6% |
| Total Housing Units | 565 | 100.0% |
Occupancy by Ownership by Household Size in Jonesville
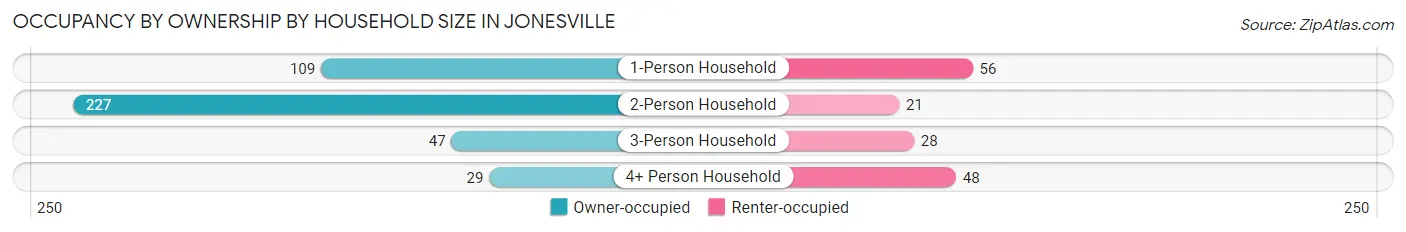
| Household Size | Owner-occupied | Renter-occupied |
| 1-Person Household | 109 (66.1%) | 56 (33.9%) |
| 2-Person Household | 227 (91.5%) | 21 (8.5%) |
| 3-Person Household | 47 (62.7%) | 28 (37.3%) |
| 4+ Person Household | 29 (37.7%) | 48 (62.3%) |
| Total Housing Units | 412 (72.9%) | 153 (27.1%) |
Occupancy by Educational Attainment in Jonesville
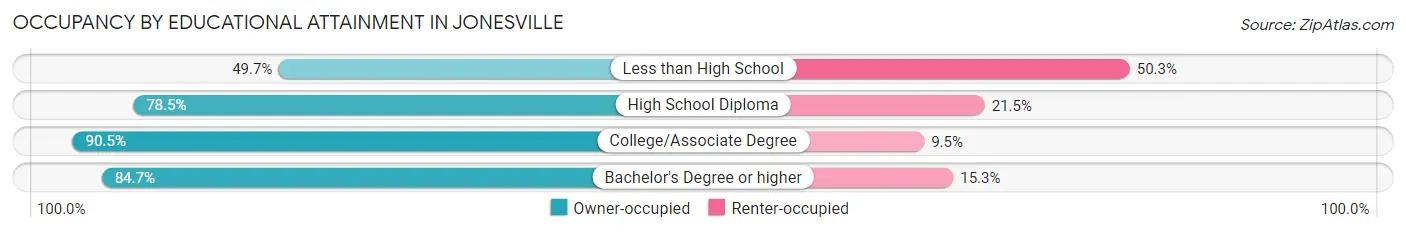
| Household Size | Owner-occupied | Renter-occupied |
| Less than High School | 90 (49.7%) | 91 (50.3%) |
| High School Diploma | 102 (78.5%) | 28 (21.5%) |
| College/Associate Degree | 76 (90.5%) | 8 (9.5%) |
| Bachelor's Degree or higher | 144 (84.7%) | 26 (15.3%) |
Occupancy by Age of Householder in Jonesville
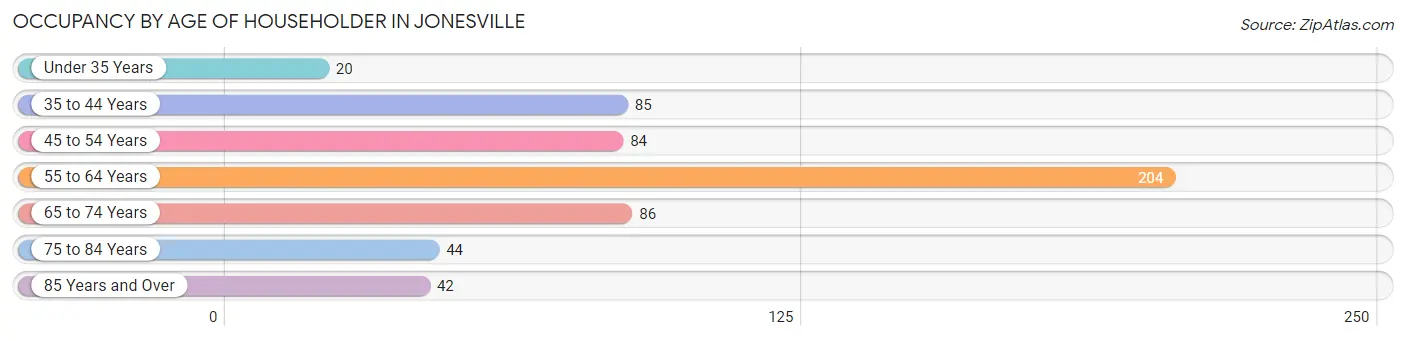
| Age Bracket | # Households | % Households |
| Under 35 Years | 20 | 3.5% |
| 35 to 44 Years | 85 | 15.0% |
| 45 to 54 Years | 84 | 14.9% |
| 55 to 64 Years | 204 | 36.1% |
| 65 to 74 Years | 86 | 15.2% |
| 75 to 84 Years | 44 | 7.8% |
| 85 Years and Over | 42 | 7.4% |
| Total | 565 | 100.0% |
Housing Finances in Jonesville
Median Income by Occupancy in Jonesville
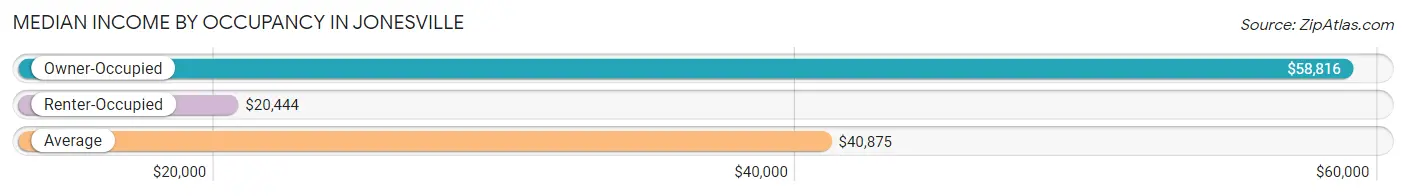
| Occupancy Type | # Households | Median Income |
| Owner-Occupied | 412 (72.9%) | $58,816 |
| Renter-Occupied | 153 (27.1%) | $20,444 |
| Average | 565 (100.0%) | $40,875 |
Occupancy by Householder Income Bracket in Jonesville
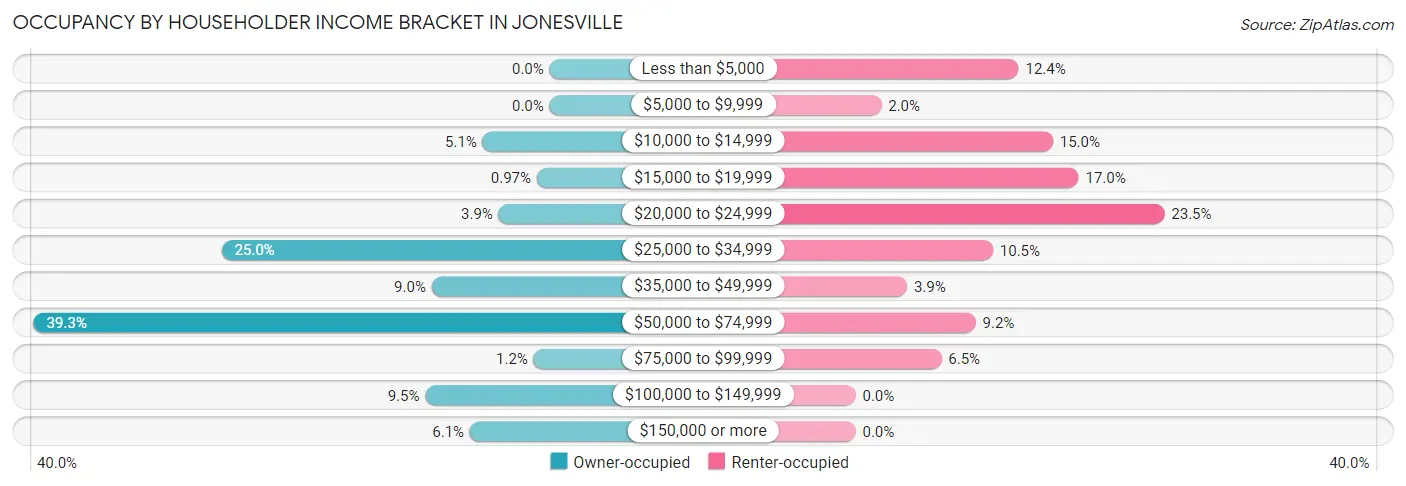
| Income Bracket | Owner-occupied | Renter-occupied |
| Less than $5,000 | 0 (0.0%) | 19 (12.4%) |
| $5,000 to $9,999 | 0 (0.0%) | 3 (2.0%) |
| $10,000 to $14,999 | 21 (5.1%) | 23 (15.0%) |
| $15,000 to $19,999 | 4 (1.0%) | 26 (17.0%) |
| $20,000 to $24,999 | 16 (3.9%) | 36 (23.5%) |
| $25,000 to $34,999 | 103 (25.0%) | 16 (10.5%) |
| $35,000 to $49,999 | 37 (9.0%) | 6 (3.9%) |
| $50,000 to $74,999 | 162 (39.3%) | 14 (9.1%) |
| $75,000 to $99,999 | 5 (1.2%) | 10 (6.5%) |
| $100,000 to $149,999 | 39 (9.5%) | 0 (0.0%) |
| $150,000 or more | 25 (6.1%) | 0 (0.0%) |
| Total | 412 (100.0%) | 153 (100.0%) |
Monthly Housing Cost Tiers in Jonesville
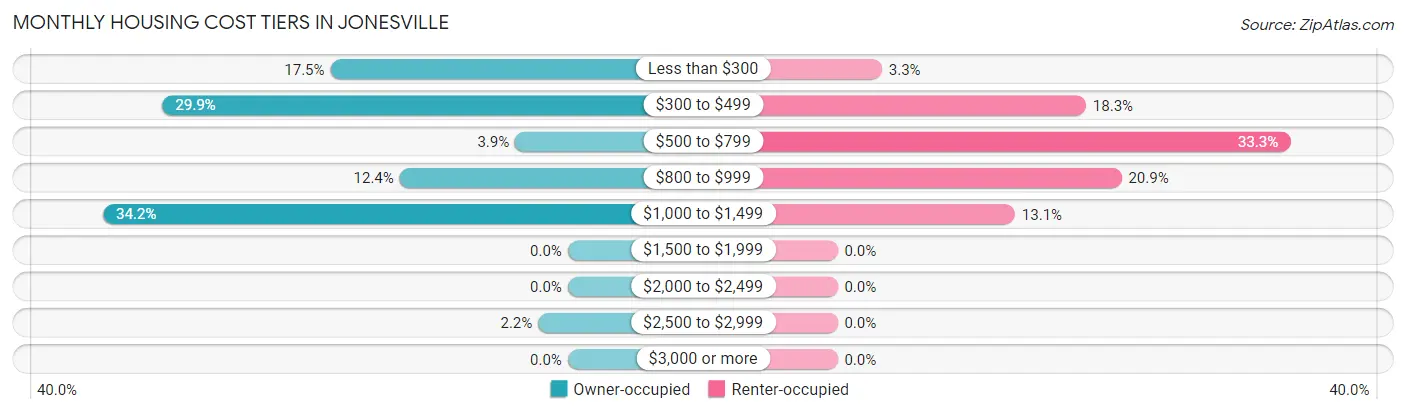
| Monthly Cost | Owner-occupied | Renter-occupied |
| Less than $300 | 72 (17.5%) | 5 (3.3%) |
| $300 to $499 | 123 (29.8%) | 28 (18.3%) |
| $500 to $799 | 16 (3.9%) | 51 (33.3%) |
| $800 to $999 | 51 (12.4%) | 32 (20.9%) |
| $1,000 to $1,499 | 141 (34.2%) | 20 (13.1%) |
| $1,500 to $1,999 | 0 (0.0%) | 0 (0.0%) |
| $2,000 to $2,499 | 0 (0.0%) | 0 (0.0%) |
| $2,500 to $2,999 | 9 (2.2%) | 0 (0.0%) |
| $3,000 or more | 0 (0.0%) | 0 (0.0%) |
| Total | 412 (100.0%) | 153 (100.0%) |
Physical Housing Characteristics in Jonesville
Housing Structures in Jonesville
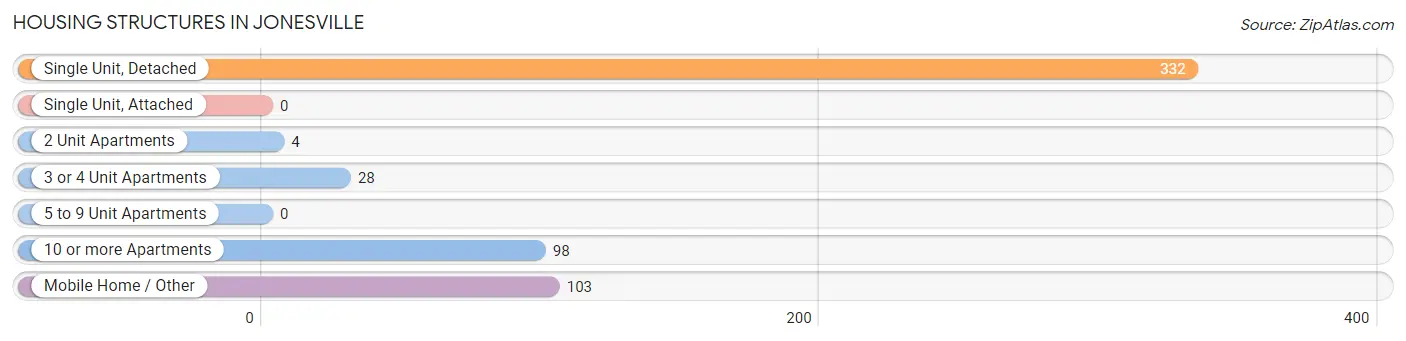
| Structure Type | # Housing Units | % Housing Units |
| Single Unit, Detached | 332 | 58.8% |
| Single Unit, Attached | 0 | 0.0% |
| 2 Unit Apartments | 4 | 0.7% |
| 3 or 4 Unit Apartments | 28 | 5.0% |
| 5 to 9 Unit Apartments | 0 | 0.0% |
| 10 or more Apartments | 98 | 17.3% |
| Mobile Home / Other | 103 | 18.2% |
| Total | 565 | 100.0% |
Housing Structures by Occupancy in Jonesville
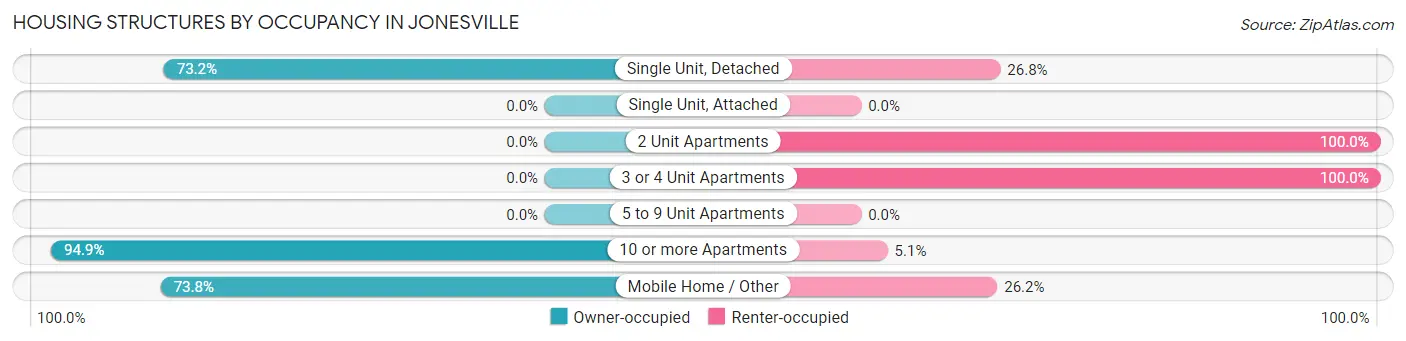
| Structure Type | Owner-occupied | Renter-occupied |
| Single Unit, Detached | 243 (73.2%) | 89 (26.8%) |
| Single Unit, Attached | 0 (0.0%) | 0 (0.0%) |
| 2 Unit Apartments | 0 (0.0%) | 4 (100.0%) |
| 3 or 4 Unit Apartments | 0 (0.0%) | 28 (100.0%) |
| 5 to 9 Unit Apartments | 0 (0.0%) | 0 (0.0%) |
| 10 or more Apartments | 93 (94.9%) | 5 (5.1%) |
| Mobile Home / Other | 76 (73.8%) | 27 (26.2%) |
| Total | 412 (72.9%) | 153 (27.1%) |
Housing Structures by Number of Rooms in Jonesville
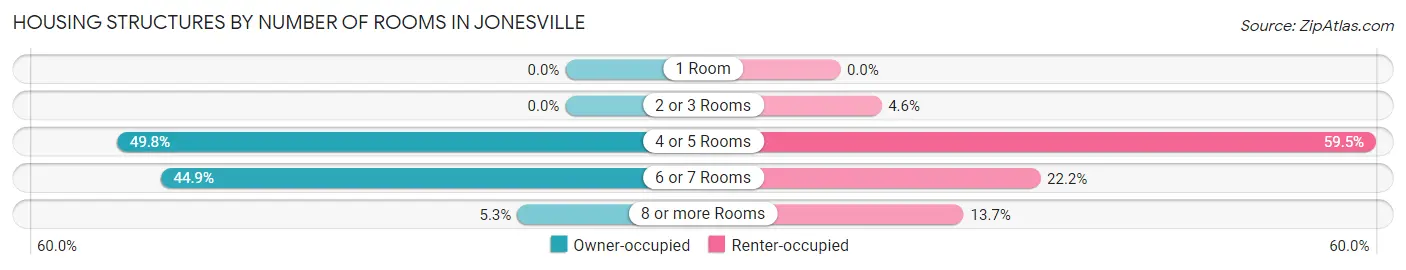
| Number of Rooms | Owner-occupied | Renter-occupied |
| 1 Room | 0 (0.0%) | 0 (0.0%) |
| 2 or 3 Rooms | 0 (0.0%) | 7 (4.6%) |
| 4 or 5 Rooms | 205 (49.8%) | 91 (59.5%) |
| 6 or 7 Rooms | 185 (44.9%) | 34 (22.2%) |
| 8 or more Rooms | 22 (5.3%) | 21 (13.7%) |
| Total | 412 (100.0%) | 153 (100.0%) |
Housing Structure by Heating Type in Jonesville
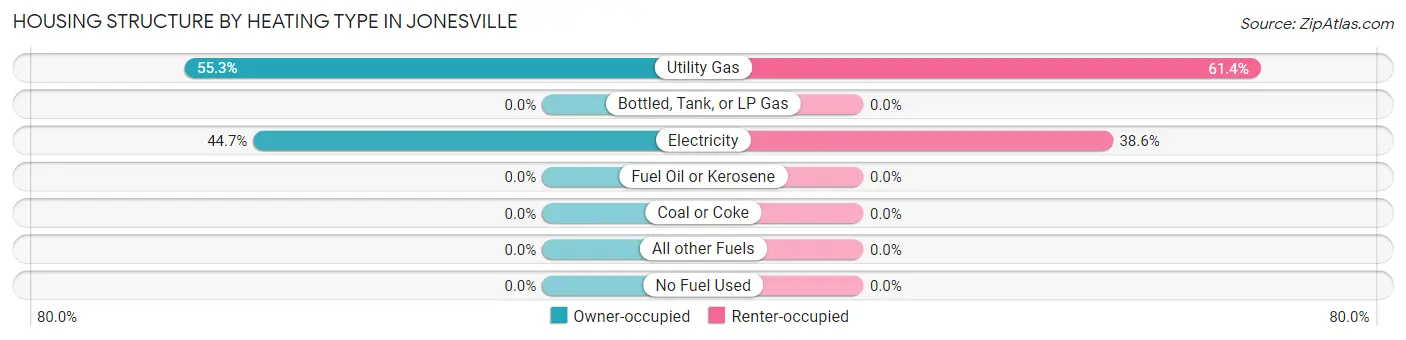
| Heating Type | Owner-occupied | Renter-occupied |
| Utility Gas | 228 (55.3%) | 94 (61.4%) |
| Bottled, Tank, or LP Gas | 0 (0.0%) | 0 (0.0%) |
| Electricity | 184 (44.7%) | 59 (38.6%) |
| Fuel Oil or Kerosene | 0 (0.0%) | 0 (0.0%) |
| Coal or Coke | 0 (0.0%) | 0 (0.0%) |
| All other Fuels | 0 (0.0%) | 0 (0.0%) |
| No Fuel Used | 0 (0.0%) | 0 (0.0%) |
| Total | 412 (100.0%) | 153 (100.0%) |
Household Vehicle Usage in Jonesville
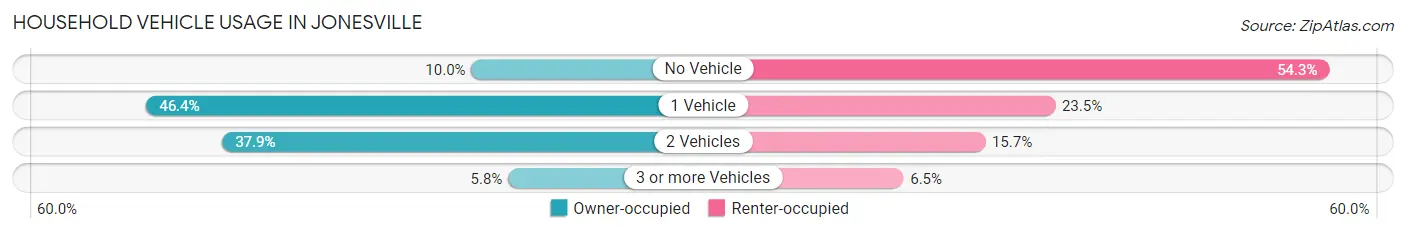
| Vehicles per Household | Owner-occupied | Renter-occupied |
| No Vehicle | 41 (10.0%) | 83 (54.2%) |
| 1 Vehicle | 191 (46.4%) | 36 (23.5%) |
| 2 Vehicles | 156 (37.9%) | 24 (15.7%) |
| 3 or more Vehicles | 24 (5.8%) | 10 (6.5%) |
| Total | 412 (100.0%) | 153 (100.0%) |
Real Estate & Mortgages in Jonesville
Real Estate and Mortgage Overview in Jonesville
| Characteristic | Without Mortgage | With Mortgage |
| Housing Units | 329 | 83 |
| Median Property Value | $84,600 | $91,900 |
| Median Household Income | $58,882 | $9 |
| Monthly Housing Costs | $398 | $0 |
| Real Estate Taxes | $199 | $17 |
Property Value by Mortgage Status in Jonesville
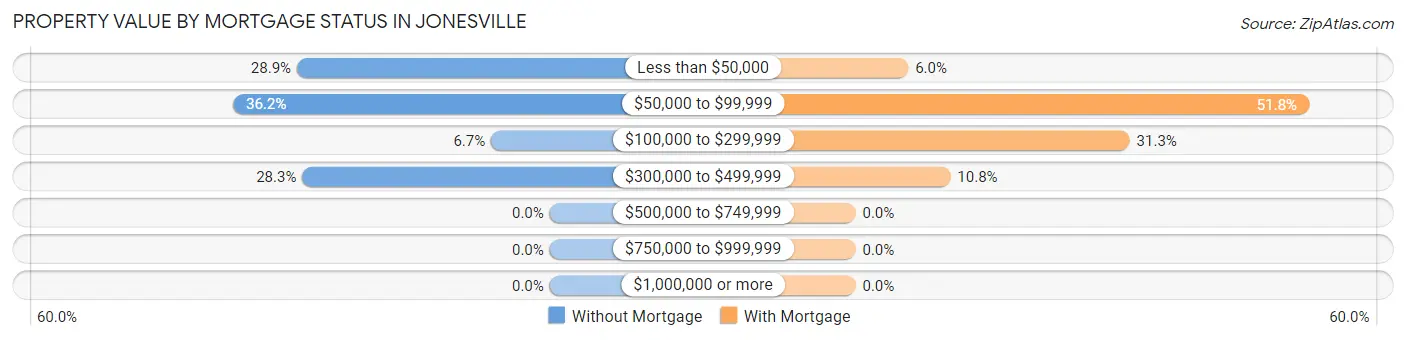
| Property Value | Without Mortgage | With Mortgage |
| Less than $50,000 | 95 (28.9%) | 5 (6.0%) |
| $50,000 to $99,999 | 119 (36.2%) | 43 (51.8%) |
| $100,000 to $299,999 | 22 (6.7%) | 26 (31.3%) |
| $300,000 to $499,999 | 93 (28.3%) | 9 (10.8%) |
| $500,000 to $749,999 | 0 (0.0%) | 0 (0.0%) |
| $750,000 to $999,999 | 0 (0.0%) | 0 (0.0%) |
| $1,000,000 or more | 0 (0.0%) | 0 (0.0%) |
| Total | 329 (100.0%) | 83 (100.0%) |
Household Income by Mortgage Status in Jonesville
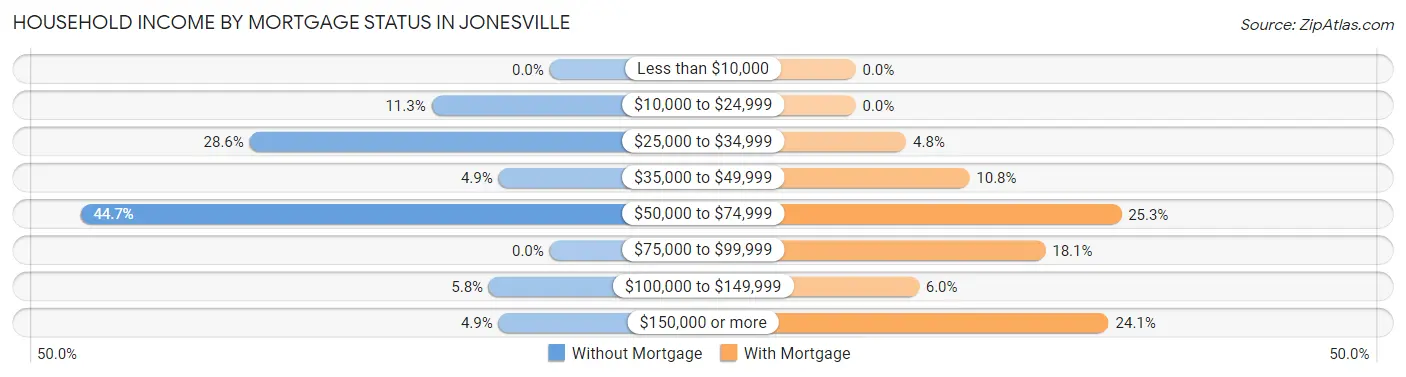
| Household Income | Without Mortgage | With Mortgage |
| Less than $10,000 | 0 (0.0%) | 0 (0.0%) |
| $10,000 to $24,999 | 37 (11.3%) | 0 (0.0%) |
| $25,000 to $34,999 | 94 (28.6%) | 4 (4.8%) |
| $35,000 to $49,999 | 16 (4.9%) | 9 (10.8%) |
| $50,000 to $74,999 | 147 (44.7%) | 21 (25.3%) |
| $75,000 to $99,999 | 0 (0.0%) | 15 (18.1%) |
| $100,000 to $149,999 | 19 (5.8%) | 5 (6.0%) |
| $150,000 or more | 16 (4.9%) | 20 (24.1%) |
| Total | 329 (100.0%) | 83 (100.0%) |
Property Value to Household Income Ratio in Jonesville
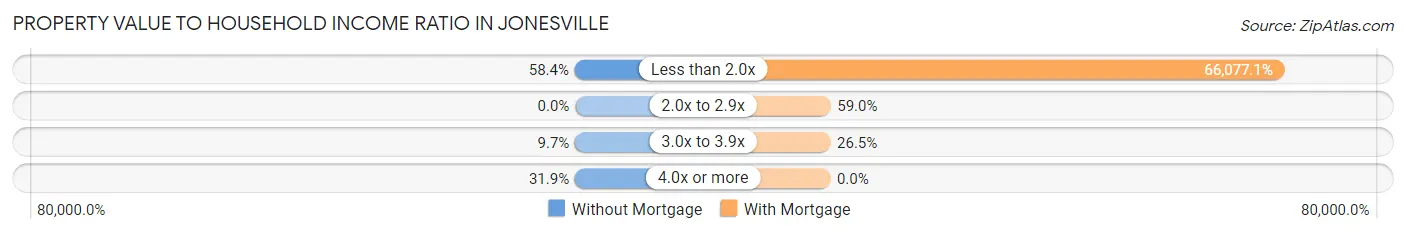
| Value-to-Income Ratio | Without Mortgage | With Mortgage |
| Less than 2.0x | 192 (58.4%) | 54,844 (66,077.1%) |
| 2.0x to 2.9x | 0 (0.0%) | 49 (59.0%) |
| 3.0x to 3.9x | 32 (9.7%) | 22 (26.5%) |
| 4.0x or more | 105 (31.9%) | 0 (0.0%) |
| Total | 329 (100.0%) | 83 (100.0%) |
Real Estate Taxes by Mortgage Status in Jonesville
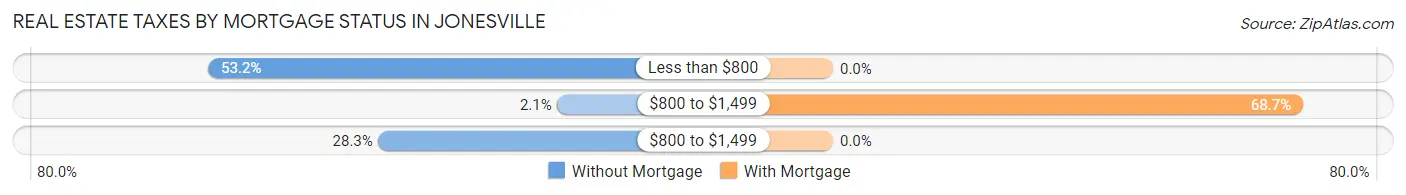
| Property Taxes | Without Mortgage | With Mortgage |
| Less than $800 | 175 (53.2%) | 0 (0.0%) |
| $800 to $1,499 | 7 (2.1%) | 57 (68.7%) |
| $800 to $1,499 | 93 (28.3%) | 0 (0.0%) |
| Total | 329 (100.0%) | 83 (100.0%) |
Health & Disability in Jonesville
Health Insurance Coverage by Age in Jonesville
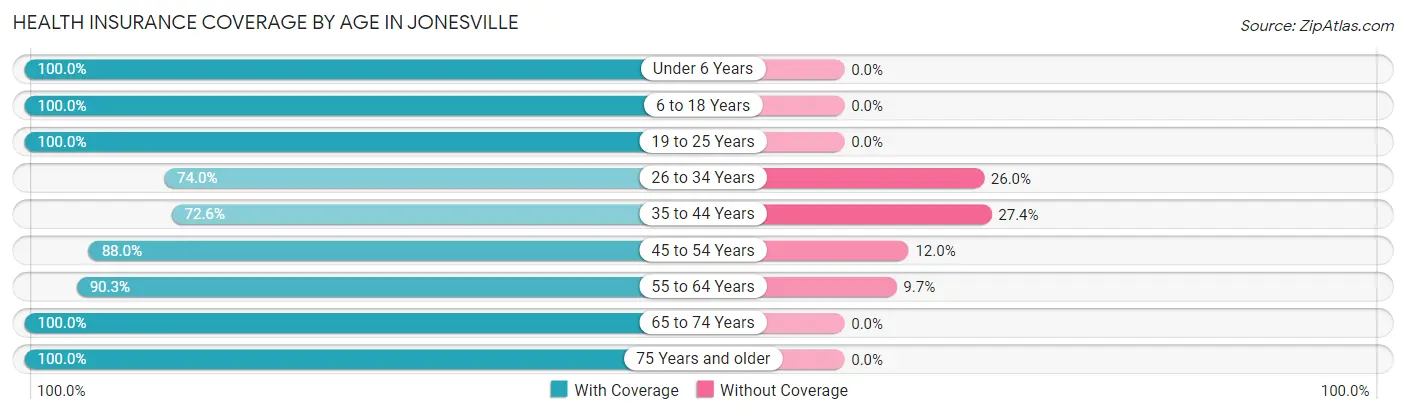
| Age Bracket | With Coverage | Without Coverage |
| Under 6 Years | 93 (100.0%) | 0 (0.0%) |
| 6 to 18 Years | 155 (100.0%) | 0 (0.0%) |
| 19 to 25 Years | 47 (100.0%) | 0 (0.0%) |
| 26 to 34 Years | 54 (74.0%) | 19 (26.0%) |
| 35 to 44 Years | 90 (72.6%) | 34 (27.4%) |
| 45 to 54 Years | 103 (88.0%) | 14 (12.0%) |
| 55 to 64 Years | 288 (90.3%) | 31 (9.7%) |
| 65 to 74 Years | 146 (100.0%) | 0 (0.0%) |
| 75 Years and older | 98 (100.0%) | 0 (0.0%) |
| Total | 1,074 (91.6%) | 98 (8.4%) |
Health Insurance Coverage by Citizenship Status in Jonesville
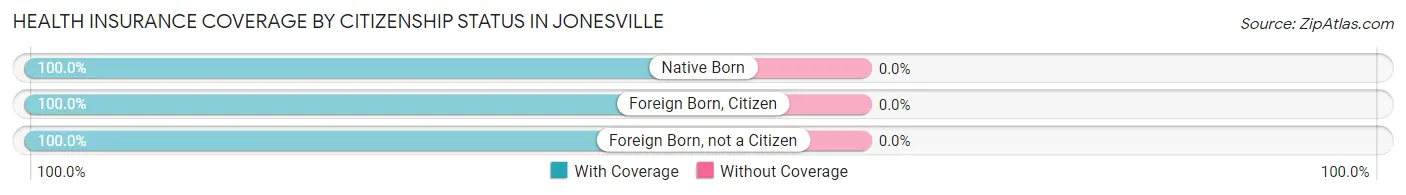
| Citizenship Status | With Coverage | Without Coverage |
| Native Born | 93 (100.0%) | 0 (0.0%) |
| Foreign Born, Citizen | 155 (100.0%) | 0 (0.0%) |
| Foreign Born, not a Citizen | 47 (100.0%) | 0 (0.0%) |
Health Insurance Coverage by Household Income in Jonesville
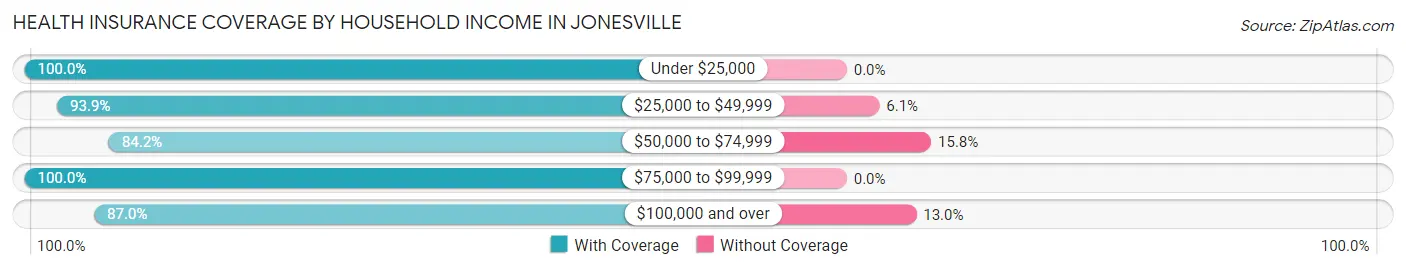
| Household Income | With Coverage | Without Coverage |
| Under $25,000 | 338 (100.0%) | 0 (0.0%) |
| $25,000 to $49,999 | 231 (93.9%) | 15 (6.1%) |
| $50,000 to $74,999 | 309 (84.2%) | 58 (15.8%) |
| $75,000 to $99,999 | 29 (100.0%) | 0 (0.0%) |
| $100,000 and over | 167 (87.0%) | 25 (13.0%) |
Public vs Private Health Insurance Coverage by Age in Jonesville
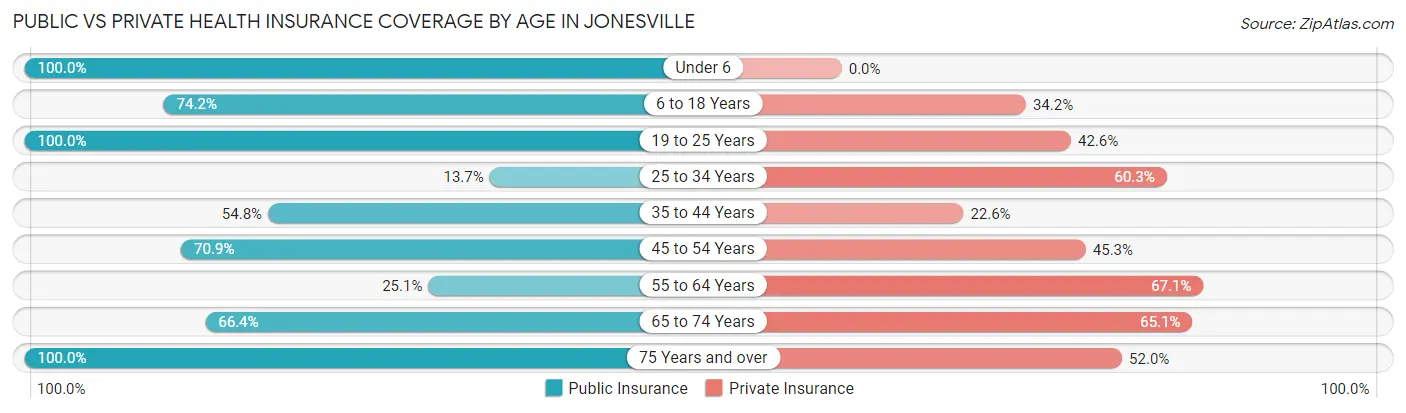
| Age Bracket | Public Insurance | Private Insurance |
| Under 6 | 93 (100.0%) | 0 (0.0%) |
| 6 to 18 Years | 115 (74.2%) | 53 (34.2%) |
| 19 to 25 Years | 47 (100.0%) | 20 (42.5%) |
| 25 to 34 Years | 10 (13.7%) | 44 (60.3%) |
| 35 to 44 Years | 68 (54.8%) | 28 (22.6%) |
| 45 to 54 Years | 83 (70.9%) | 53 (45.3%) |
| 55 to 64 Years | 80 (25.1%) | 214 (67.1%) |
| 65 to 74 Years | 97 (66.4%) | 95 (65.1%) |
| 75 Years and over | 98 (100.0%) | 51 (52.0%) |
| Total | 691 (59.0%) | 558 (47.6%) |
Disability Status by Sex by Age in Jonesville
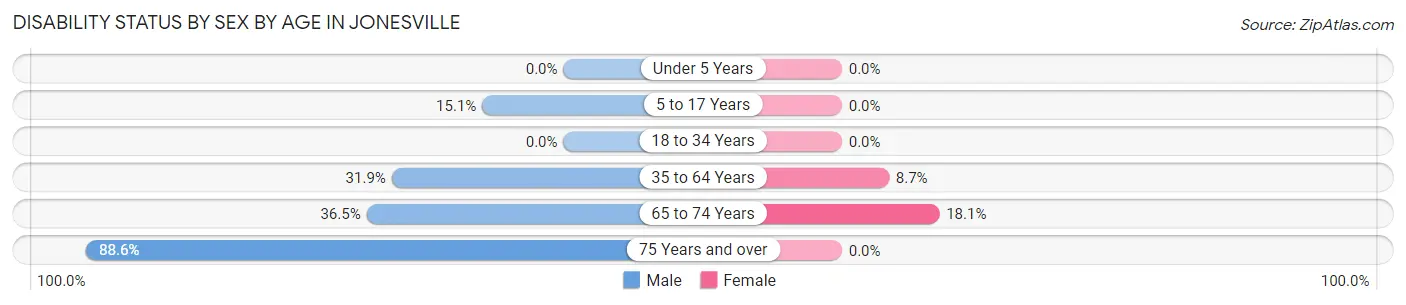
| Age Bracket | Male | Female |
| Under 5 Years | 0 (0.0%) | 0 (0.0%) |
| 5 to 17 Years | 11 (15.1%) | 0 (0.0%) |
| 18 to 34 Years | 0 (0.0%) | 0 (0.0%) |
| 35 to 64 Years | 58 (31.9%) | 33 (8.7%) |
| 65 to 74 Years | 19 (36.5%) | 17 (18.1%) |
| 75 Years and over | 62 (88.6%) | 0 (0.0%) |
Disability Class by Sex by Age in Jonesville
Disability Class: Hearing Difficulty
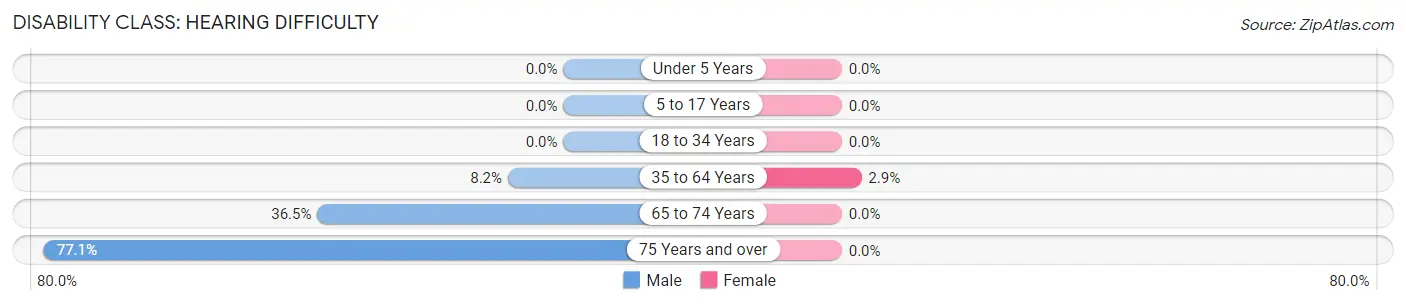
| Age Bracket | Male | Female |
| Under 5 Years | 0 (0.0%) | 0 (0.0%) |
| 5 to 17 Years | 0 (0.0%) | 0 (0.0%) |
| 18 to 34 Years | 0 (0.0%) | 0 (0.0%) |
| 35 to 64 Years | 15 (8.2%) | 11 (2.9%) |
| 65 to 74 Years | 19 (36.5%) | 0 (0.0%) |
| 75 Years and over | 54 (77.1%) | 0 (0.0%) |
Disability Class: Vision Difficulty
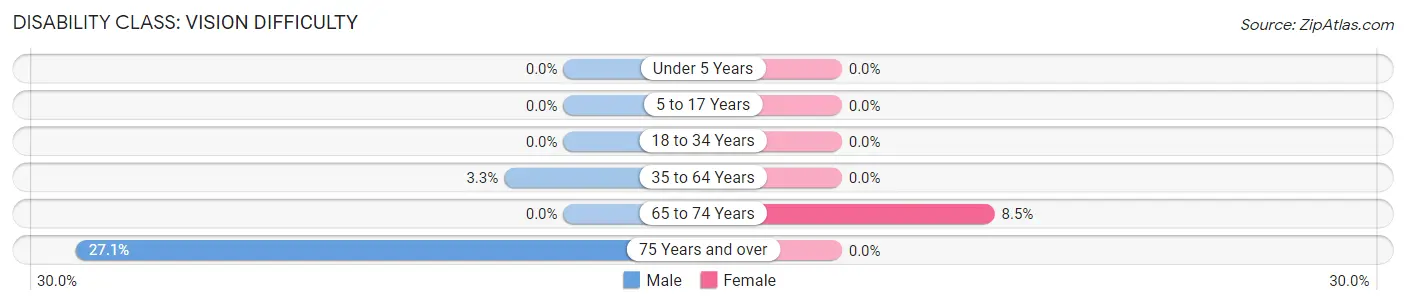
| Age Bracket | Male | Female |
| Under 5 Years | 0 (0.0%) | 0 (0.0%) |
| 5 to 17 Years | 0 (0.0%) | 0 (0.0%) |
| 18 to 34 Years | 0 (0.0%) | 0 (0.0%) |
| 35 to 64 Years | 6 (3.3%) | 0 (0.0%) |
| 65 to 74 Years | 0 (0.0%) | 8 (8.5%) |
| 75 Years and over | 19 (27.1%) | 0 (0.0%) |
Disability Class: Cognitive Difficulty
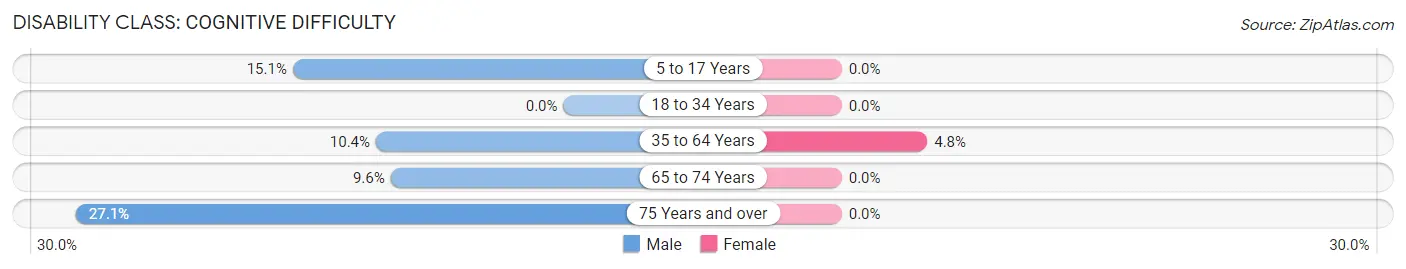
| Age Bracket | Male | Female |
| 5 to 17 Years | 11 (15.1%) | 0 (0.0%) |
| 18 to 34 Years | 0 (0.0%) | 0 (0.0%) |
| 35 to 64 Years | 19 (10.4%) | 18 (4.8%) |
| 65 to 74 Years | 5 (9.6%) | 0 (0.0%) |
| 75 Years and over | 19 (27.1%) | 0 (0.0%) |
Disability Class: Ambulatory Difficulty
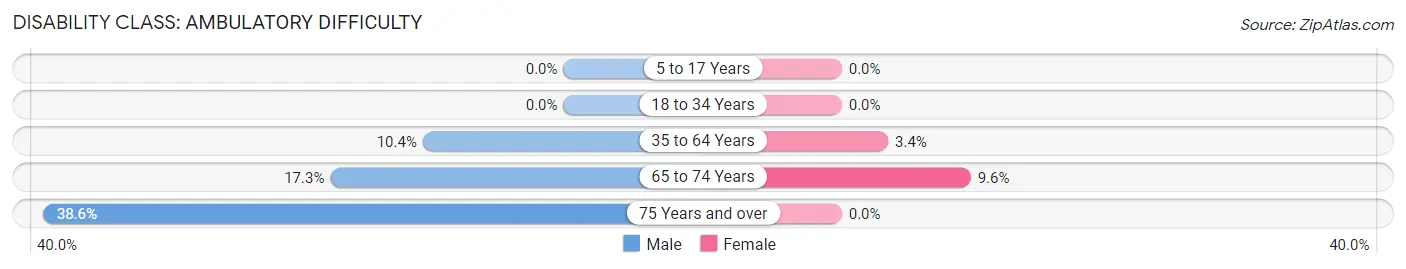
| Age Bracket | Male | Female |
| 5 to 17 Years | 0 (0.0%) | 0 (0.0%) |
| 18 to 34 Years | 0 (0.0%) | 0 (0.0%) |
| 35 to 64 Years | 19 (10.4%) | 13 (3.4%) |
| 65 to 74 Years | 9 (17.3%) | 9 (9.6%) |
| 75 Years and over | 27 (38.6%) | 0 (0.0%) |
Disability Class: Self-Care Difficulty
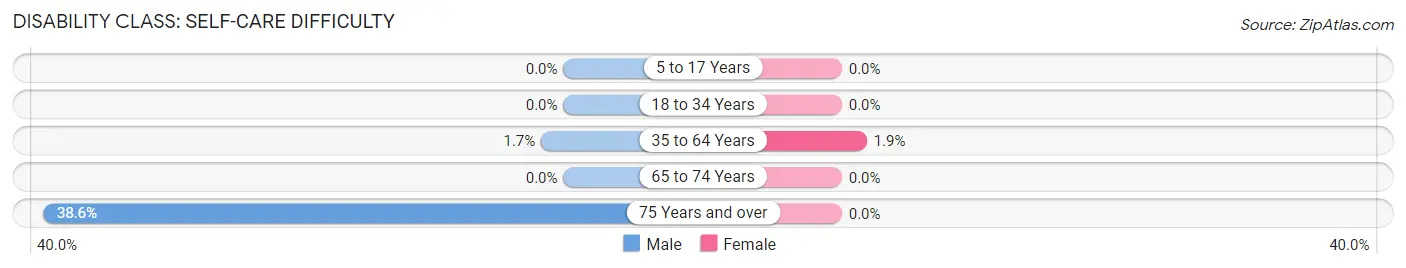
| Age Bracket | Male | Female |
| 5 to 17 Years | 0 (0.0%) | 0 (0.0%) |
| 18 to 34 Years | 0 (0.0%) | 0 (0.0%) |
| 35 to 64 Years | 3 (1.7%) | 7 (1.8%) |
| 65 to 74 Years | 0 (0.0%) | 0 (0.0%) |
| 75 Years and over | 27 (38.6%) | 0 (0.0%) |
Technology Access in Jonesville
Computing Device Access in Jonesville
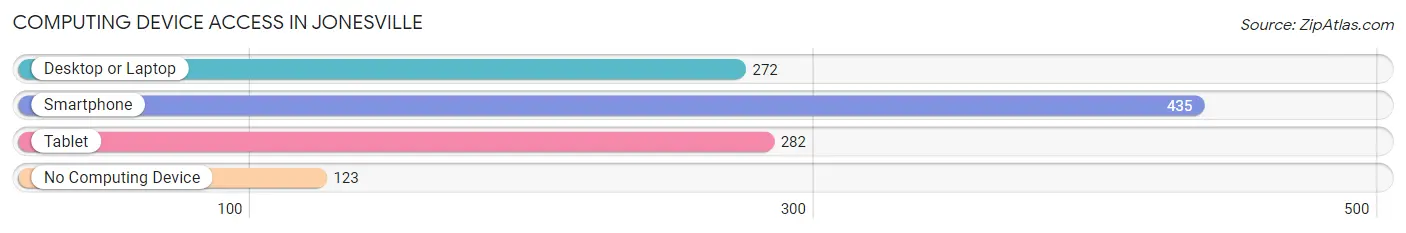
| Device Type | # Households | % Households |
| Desktop or Laptop | 272 | 48.1% |
| Smartphone | 435 | 77.0% |
| Tablet | 282 | 49.9% |
| No Computing Device | 123 | 21.8% |
| Total | 565 | 100.0% |
Internet Access in Jonesville
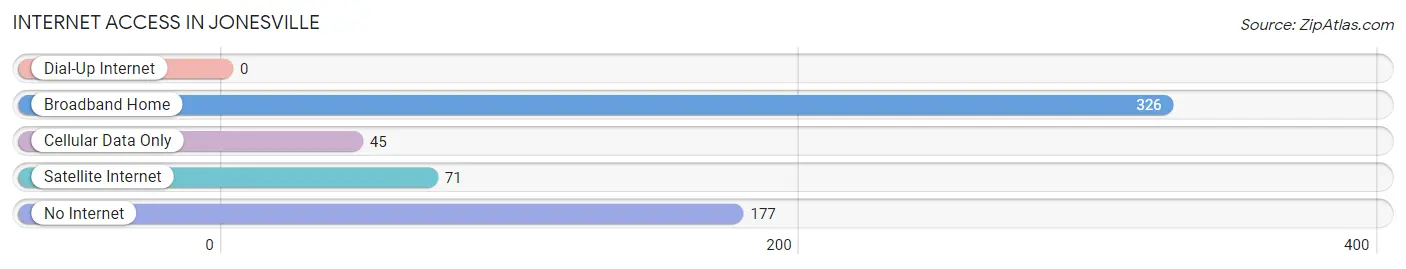
| Internet Type | # Households | % Households |
| Dial-Up Internet | 0 | 0.0% |
| Broadband Home | 326 | 57.7% |
| Cellular Data Only | 45 | 8.0% |
| Satellite Internet | 71 | 12.6% |
| No Internet | 177 | 31.3% |
| Total | 565 | 100.0% |
Jonesville Summary
Jonesville is a small town located in Catahoula Parish, Louisiana. It is situated on the banks of the Ouachita River, approximately 20 miles south of the state capital, Baton Rouge. The town has a population of approximately 1,500 people and is the parish seat of Catahoula Parish.
History
Jonesville was founded in 1845 by William Jones, a former slave who had purchased his freedom. Jones had been a slave on a plantation near the town of Harrisonburg, Louisiana. After purchasing his freedom, he moved to the area that is now Jonesville and established a small farm. He named the town after himself and it quickly grew into a thriving community.
In 1848, Jonesville was incorporated as a town and the first mayor was elected. The town quickly grew and by the late 1800s, it had become a major trading center for the surrounding area. The town was also home to several businesses, including a sawmill, a cotton gin, and a gristmill.
In the early 1900s, Jonesville was a major stop on the railroad line that ran from New Orleans to Shreveport. This allowed the town to become a major shipping center for the region. The town also had a thriving lumber industry, with several sawmills located in the area.
Geography
Jonesville is located in the southeastern part of Catahoula Parish, approximately 20 miles south of the state capital, Baton Rouge. The town is situated on the banks of the Ouachita River and is surrounded by rolling hills and forests. The town is located in a humid subtropical climate zone, with hot, humid summers and mild winters.
Economy
The economy of Jonesville is largely based on agriculture and forestry. The town is home to several farms, which produce a variety of crops, including cotton, corn, soybeans, and wheat. The town also has several sawmills, which produce lumber for the local market.
In addition to agriculture and forestry, Jonesville is also home to several small businesses, including restaurants, retail stores, and service providers. The town is also home to a small manufacturing sector, which produces a variety of products, including furniture, clothing, and food products.
Demographics
As of the 2010 census, Jonesville had a population of 1,500 people. The racial makeup of the town was 79.3% White, 17.3% African American, 0.7% Native American, 0.3% Asian, and 2.3% from other races. The median household income was $30,000 and the median family income was $35,000.
Conclusion
Jonesville is a small town located in Catahoula Parish, Louisiana. It is situated on the banks of the Ouachita River and has a population of approximately 1,500 people. The town was founded in 1845 by William Jones, a former slave who had purchased his freedom. The economy of Jonesville is largely based on agriculture and forestry, with several farms and sawmills located in the area. The town is also home to several small businesses, including restaurants, retail stores, and service providers. As of the 2010 census, the racial makeup of the town was 79.3% White, 17.3% African American, 0.7% Native American, 0.3% Asian, and 2.3% from other races.
Common Questions
What is Per Capita Income in Jonesville?
Per Capita income in Jonesville is $24,405.
What is the Median Family Income in Jonesville?
Median Family Income in Jonesville is $68,083.
What is the Median Household income in Jonesville?
Median Household Income in Jonesville is $40,875.
What is Income or Wage Gap in Jonesville?
Income or Wage Gap in Jonesville is 9.1%.
Women in Jonesville earn 90.9 cents for every dollar earned by a man.
What is Family Income Deficit in Jonesville?
Family Income Deficit in Jonesville is $8,753.
Families that are below poverty line in Jonesville earn $8,753 less on average than the poverty threshold level.
What is Inequality or Gini Index in Jonesville?
Inequality or Gini Index in Jonesville is 0.40.
What is the Total Population of Jonesville?
Total Population of Jonesville is 1,252.
What is the Total Male Population of Jonesville?
Total Male Population of Jonesville is 483.
What is the Total Female Population of Jonesville?
Total Female Population of Jonesville is 769.
What is the Ratio of Males per 100 Females in Jonesville?
There are 62.81 Males per 100 Females in Jonesville.
What is the Ratio of Females per 100 Males in Jonesville?
There are 159.21 Females per 100 Males in Jonesville.
What is the Median Population Age in Jonesville?
Median Population Age in Jonesville is 57.2 Years.
What is the Average Family Size in Jonesville
Average Family Size in Jonesville is 2.5 People.
What is the Average Household Size in Jonesville
Average Household Size in Jonesville is 2.1 People.
How Large is the Labor Force in Jonesville?
There are 443 People in the Labor Forcein in Jonesville.
What is the Percentage of People in the Labor Force in Jonesville?
43.1% of People are in the Labor Force in Jonesville.
What is the Unemployment Rate in Jonesville?
Unemployment Rate in Jonesville is 7.9%.