Jonesboro, LA Map & Demographics
Jonesboro Map
Jonesboro Overview
$16,716
PER CAPITA INCOME
$36,062
AVG FAMILY INCOME
$28,963
AVG HOUSEHOLD INCOME
32.0%
WAGE / INCOME GAP [ % ]
68.0¢/ $1
WAGE / INCOME GAP [ $ ]
$8,713
FAMILY INCOME DEFICIT
0.49
INEQUALITY / GINI INDEX
4,135
TOTAL POPULATION
2,220
MALE POPULATION
1,915
FEMALE POPULATION
115.93
MALES / 100 FEMALES
86.26
FEMALES / 100 MALES
36.5
MEDIAN AGE
3.2
AVG FAMILY SIZE
2.5
AVG HOUSEHOLD SIZE
1,163
LABOR FORCE [ PEOPLE ]
34.5%
PERCENT IN LABOR FORCE
1.5%
UNEMPLOYMENT RATE
Jonesboro Zip Codes
Jonesboro Area Codes
Income in Jonesboro
Income Overview in Jonesboro
Per Capita Income in Jonesboro is $16,716, while median incomes of families and households are $36,062 and $28,963 respectively.
| Characteristic | Number | Measure |
| Per Capita Income | 4,135 | $16,716 |
| Median Family Income | 764 | $36,062 |
| Mean Family Income | 764 | $46,972 |
| Median Household Income | 1,311 | $28,963 |
| Mean Household Income | 1,311 | $42,621 |
| Income Deficit | 764 | $8,713 |
| Wage / Income Gap (%) | 4,135 | 31.97% |
| Wage / Income Gap ($) | 4,135 | 68.03¢ per $1 |
| Gini / Inequality Index | 4,135 | 0.49 |
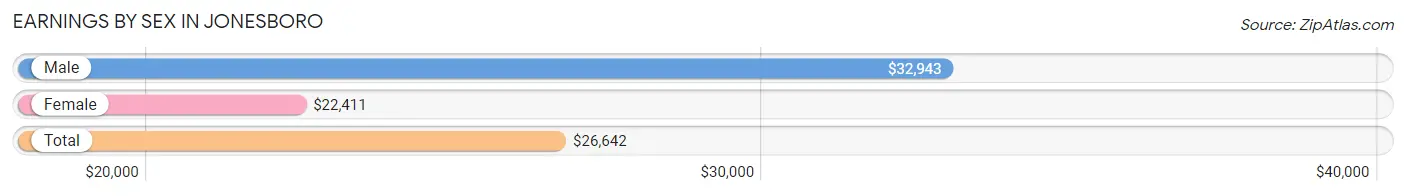
Earnings by Sex in Jonesboro
Average Earnings in Jonesboro are $26,642, $32,943 for men and $22,411 for women, a difference of 32.0%.
| Sex | Number | Average Earnings |
| Male | 664 (50.8%) | $32,943 |
| Female | 643 (49.2%) | $22,411 |
| Total | 1,307 (100.0%) | $26,642 |
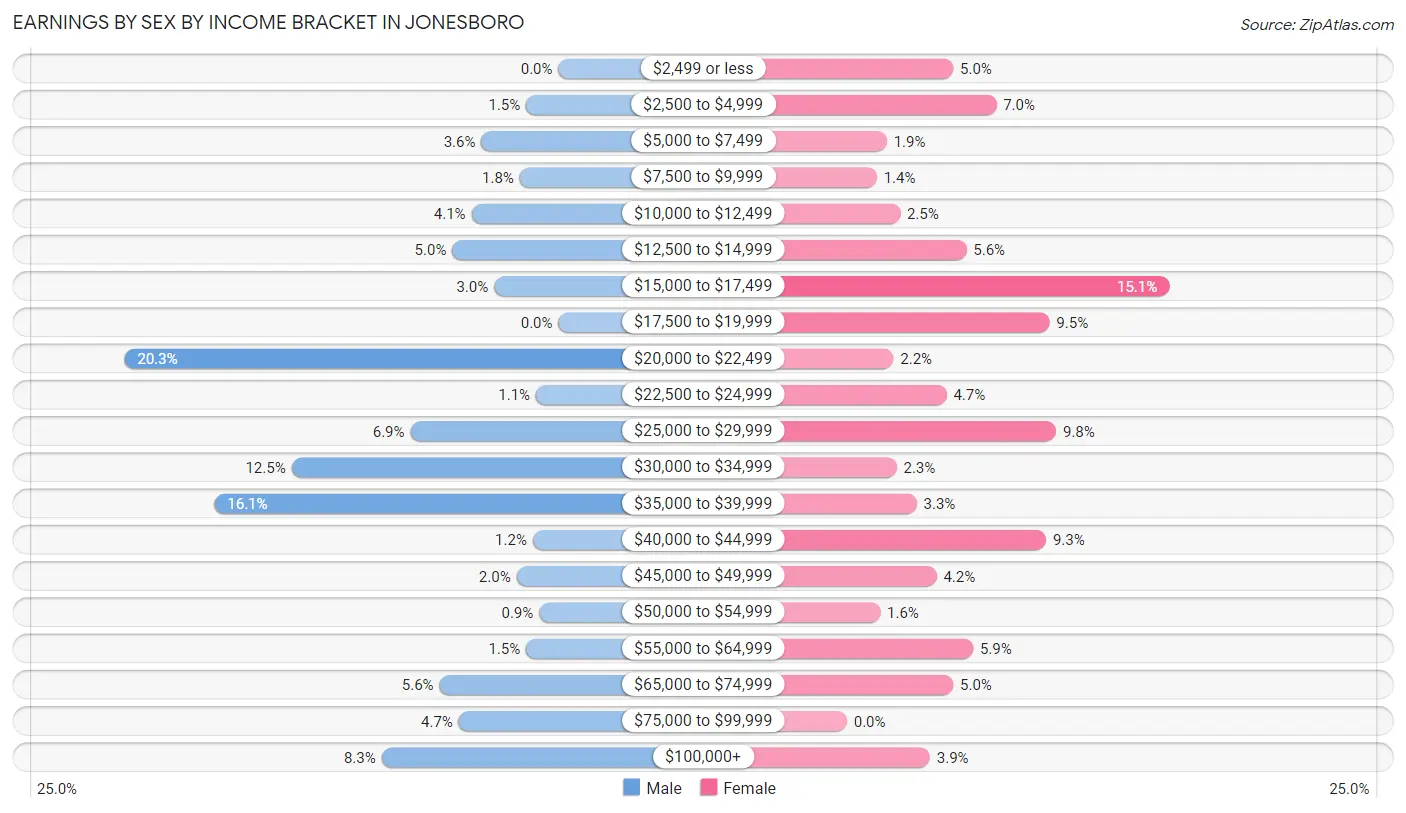
Earnings by Sex by Income Bracket in Jonesboro
The most common earnings brackets in Jonesboro are $20,000 to $22,499 for men (135 | 20.3%) and $15,000 to $17,499 for women (97 | 15.1%).
| Income | Male | Female |
| $2,499 or less | 0 (0.0%) | 32 (5.0%) |
| $2,500 to $4,999 | 10 (1.5%) | 45 (7.0%) |
| $5,000 to $7,499 | 24 (3.6%) | 12 (1.9%) |
| $7,500 to $9,999 | 12 (1.8%) | 9 (1.4%) |
| $10,000 to $12,499 | 27 (4.1%) | 16 (2.5%) |
| $12,500 to $14,999 | 33 (5.0%) | 36 (5.6%) |
| $15,000 to $17,499 | 20 (3.0%) | 97 (15.1%) |
| $17,500 to $19,999 | 0 (0.0%) | 61 (9.5%) |
| $20,000 to $22,499 | 135 (20.3%) | 14 (2.2%) |
| $22,500 to $24,999 | 7 (1.1%) | 30 (4.7%) |
| $25,000 to $29,999 | 46 (6.9%) | 63 (9.8%) |
| $30,000 to $34,999 | 83 (12.5%) | 15 (2.3%) |
| $35,000 to $39,999 | 107 (16.1%) | 21 (3.3%) |
| $40,000 to $44,999 | 8 (1.2%) | 60 (9.3%) |
| $45,000 to $49,999 | 13 (2.0%) | 27 (4.2%) |
| $50,000 to $54,999 | 6 (0.9%) | 10 (1.6%) |
| $55,000 to $64,999 | 10 (1.5%) | 38 (5.9%) |
| $65,000 to $74,999 | 37 (5.6%) | 32 (5.0%) |
| $75,000 to $99,999 | 31 (4.7%) | 0 (0.0%) |
| $100,000+ | 55 (8.3%) | 25 (3.9%) |
| Total | 664 (100.0%) | 643 (100.0%) |
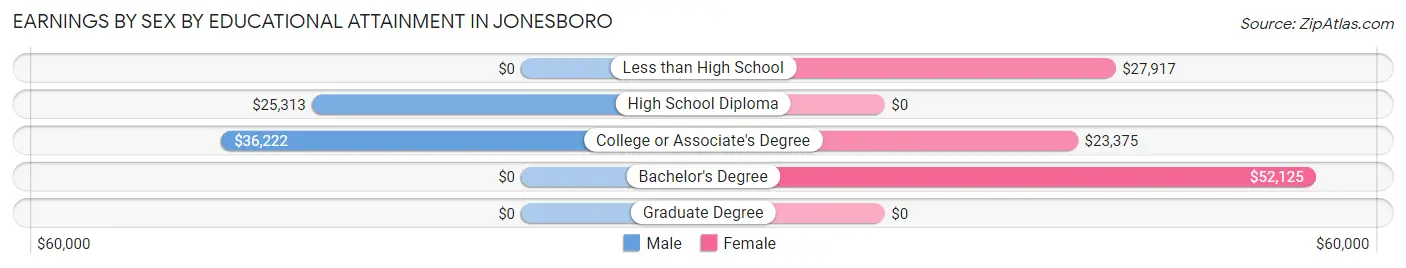
Earnings by Sex by Educational Attainment in Jonesboro
Average earnings in Jonesboro are $33,390 for men and $23,250 for women, a difference of 30.4%. Men with an educational attainment of college or associate's degree enjoy the highest average annual earnings of $36,222, while those with high school diploma education earn the least with $25,313. Women with an educational attainment of bachelor's degree earn the most with the average annual earnings of $52,125, while those with college or associate's degree education have the smallest earnings of $23,375.
| Educational Attainment | Male Income | Female Income |
| Less than High School | - | - |
| High School Diploma | $25,313 | $0 |
| College or Associate's Degree | $36,222 | $23,375 |
| Bachelor's Degree | - | - |
| Graduate Degree | - | - |
| Total | $33,390 | $23,250 |
Family Income in Jonesboro
Family Income Brackets in Jonesboro
According to the Jonesboro family income data, there are 151 families falling into the $35,000 to $49,999 income range, which is the most common income bracket and makes up 19.8% of all families.
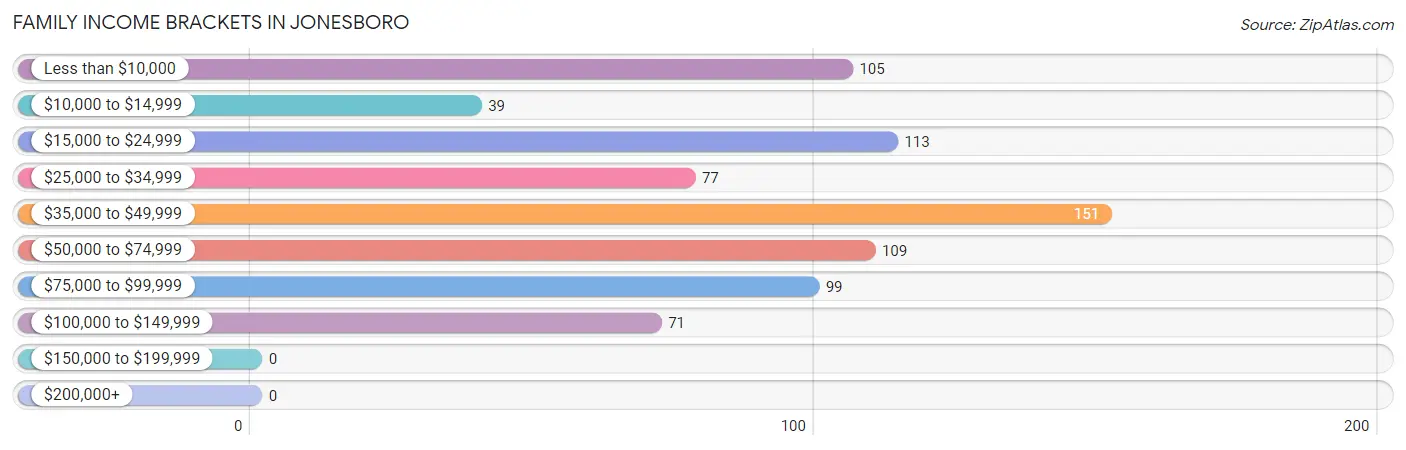
| Income Bracket | # Families | % Families |
| Less than $10,000 | 105 | 13.7% |
| $10,000 to $14,999 | 39 | 5.1% |
| $15,000 to $24,999 | 113 | 14.8% |
| $25,000 to $34,999 | 77 | 10.1% |
| $35,000 to $49,999 | 151 | 19.8% |
| $50,000 to $74,999 | 109 | 14.3% |
| $75,000 to $99,999 | 99 | 13.0% |
| $100,000 to $149,999 | 71 | 9.3% |
| $150,000 to $199,999 | 0 | 0.0% |
| $200,000+ | 0 | 0.0% |
Family Income by Famaliy Size in Jonesboro
2-person families (300 | 39.3%) account for the highest median family income in Jonesboro with $36,100 per family, while 2-person families (300 | 39.3%) have the highest median income of $18,050 per family member.
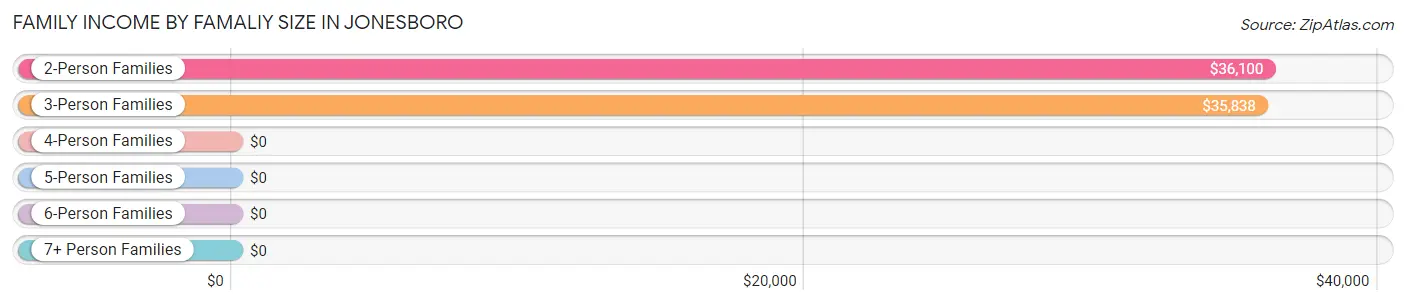
| Income Bracket | # Families | Median Income |
| 2-Person Families | 300 (39.3%) | $36,100 |
| 3-Person Families | 327 (42.8%) | $35,838 |
| 4-Person Families | 130 (17.0%) | $0 |
| 5-Person Families | 1 (0.1%) | $0 |
| 6-Person Families | 6 (0.8%) | $0 |
| 7+ Person Families | 0 (0.0%) | $0 |
| Total | 764 (100.0%) | $36,062 |
Family Income by Number of Earners in Jonesboro
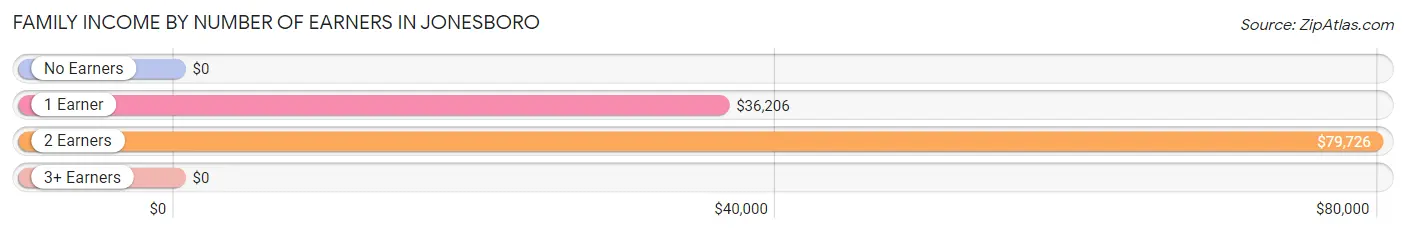
| Number of Earners | # Families | Median Income |
| No Earners | 188 (24.6%) | $0 |
| 1 Earner | 367 (48.0%) | $36,206 |
| 2 Earners | 199 (26.1%) | $79,726 |
| 3+ Earners | 10 (1.3%) | $0 |
| Total | 764 (100.0%) | $36,062 |
Household Income in Jonesboro
Household Income Brackets in Jonesboro
With 233 households falling in the category, the $10,000 to $14,999 income range is the most frequent in Jonesboro, accounting for 17.8% of all households.
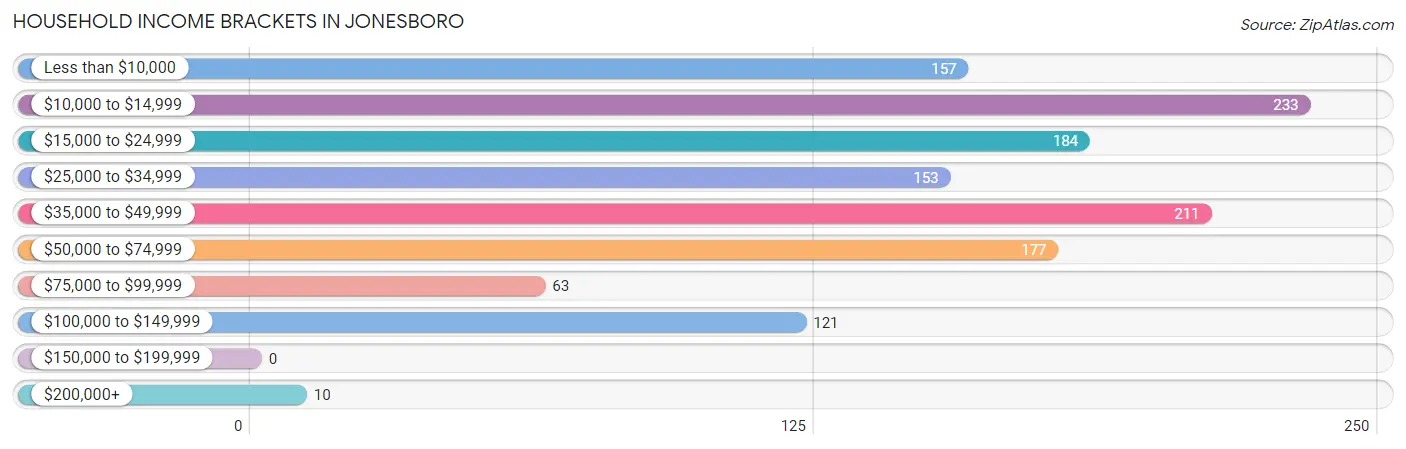
| Income Bracket | # Households | % Households |
| Less than $10,000 | 157 | 12.0% |
| $10,000 to $14,999 | 233 | 17.8% |
| $15,000 to $24,999 | 184 | 14.0% |
| $25,000 to $34,999 | 153 | 11.7% |
| $35,000 to $49,999 | 211 | 16.1% |
| $50,000 to $74,999 | 177 | 13.5% |
| $75,000 to $99,999 | 63 | 4.8% |
| $100,000 to $149,999 | 121 | 9.2% |
| $150,000 to $199,999 | 0 | 0.0% |
| $200,000+ | 10 | 0.8% |
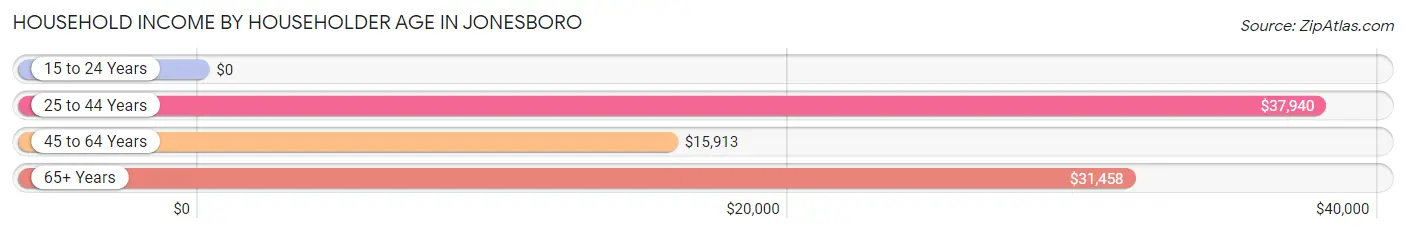
Household Income by Householder Age in Jonesboro
The median household income in Jonesboro is $28,963, with the highest median household income of $37,940 found in the 25 to 44 years age bracket for the primary householder. A total of 483 households (36.8%) fall into this category. Meanwhile, the 15 to 24 years age bracket for the primary householder has the lowest median household income of $0, with 29 households (2.2%) in this group.
| Income Bracket | # Households | Median Income |
| 15 to 24 Years | 29 (2.2%) | $0 |
| 25 to 44 Years | 483 (36.8%) | $37,940 |
| 45 to 64 Years | 446 (34.0%) | $15,913 |
| 65+ Years | 353 (26.9%) | $31,458 |
| Total | 1,311 (100.0%) | $28,963 |
Poverty in Jonesboro
Income Below Poverty by Sex and Age in Jonesboro
With 40.8% poverty level for males and 41.1% for females among the residents of Jonesboro, 6 to 11 year old males and 6 to 11 year old females are the most vulnerable to poverty, with 78 males (94.0%) and 117 females (97.5%) in their respective age groups living below the poverty level.
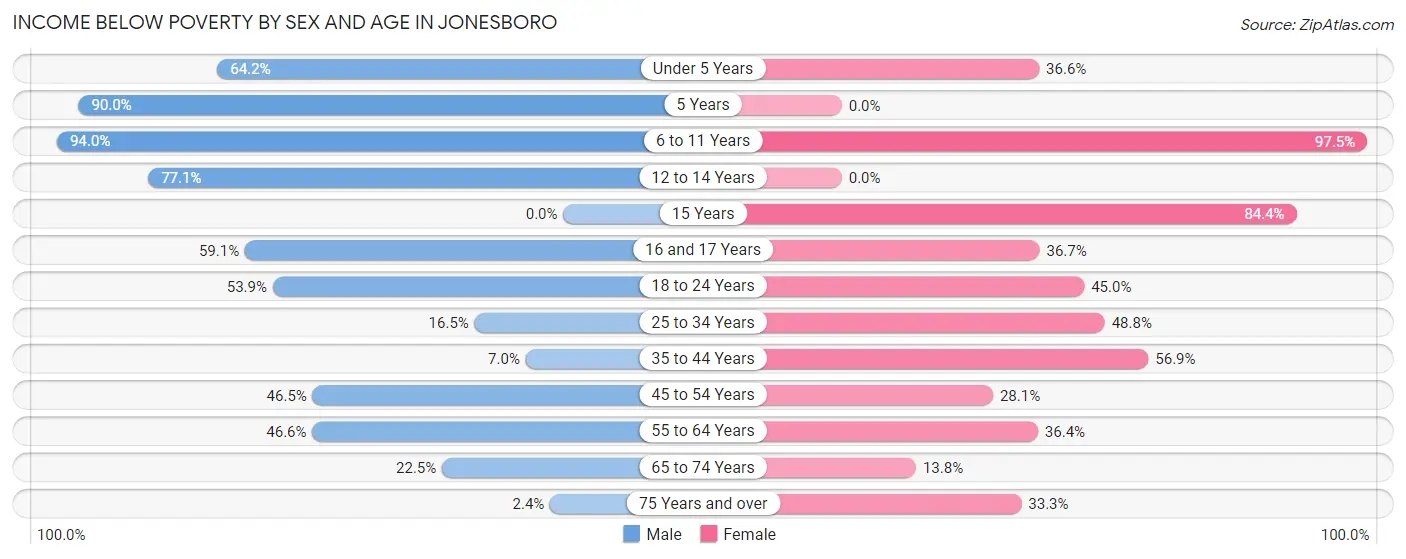
| Age Bracket | Male | Female |
| Under 5 Years | 88 (64.2%) | 74 (36.6%) |
| 5 Years | 9 (90.0%) | 0 (0.0%) |
| 6 to 11 Years | 78 (94.0%) | 117 (97.5%) |
| 12 to 14 Years | 94 (77.0%) | 0 (0.0%) |
| 15 Years | 0 (0.0%) | 27 (84.4%) |
| 16 and 17 Years | 13 (59.1%) | 29 (36.7%) |
| 18 to 24 Years | 48 (53.9%) | 9 (45.0%) |
| 25 to 34 Years | 54 (16.5%) | 144 (48.8%) |
| 35 to 44 Years | 3 (7.0%) | 136 (56.9%) |
| 45 to 54 Years | 47 (46.5%) | 39 (28.1%) |
| 55 to 64 Years | 130 (46.6%) | 83 (36.4%) |
| 65 to 74 Years | 27 (22.5%) | 34 (13.8%) |
| 75 Years and over | 3 (2.4%) | 43 (33.3%) |
| Total | 594 (40.8%) | 735 (41.1%) |
Income Above Poverty by Sex and Age in Jonesboro
According to the poverty statistics in Jonesboro, males aged 75 years and over and females aged 5 years are the age groups that are most secure financially, with 97.6% of males and 100.0% of females in these age groups living above the poverty line.
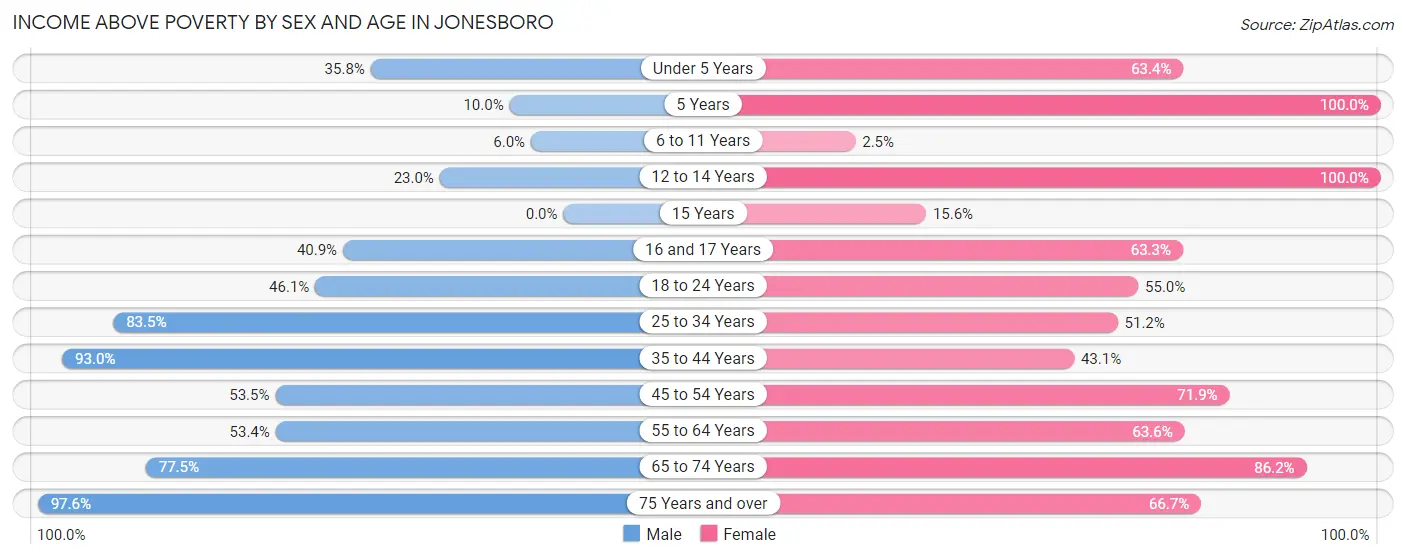
| Age Bracket | Male | Female |
| Under 5 Years | 49 (35.8%) | 128 (63.4%) |
| 5 Years | 1 (10.0%) | 5 (100.0%) |
| 6 to 11 Years | 5 (6.0%) | 3 (2.5%) |
| 12 to 14 Years | 28 (23.0%) | 52 (100.0%) |
| 15 Years | 0 (0.0%) | 5 (15.6%) |
| 16 and 17 Years | 9 (40.9%) | 50 (63.3%) |
| 18 to 24 Years | 41 (46.1%) | 11 (55.0%) |
| 25 to 34 Years | 274 (83.5%) | 151 (51.2%) |
| 35 to 44 Years | 40 (93.0%) | 103 (43.1%) |
| 45 to 54 Years | 54 (53.5%) | 100 (71.9%) |
| 55 to 64 Years | 149 (53.4%) | 145 (63.6%) |
| 65 to 74 Years | 93 (77.5%) | 213 (86.2%) |
| 75 Years and over | 120 (97.6%) | 86 (66.7%) |
| Total | 863 (59.2%) | 1,052 (58.9%) |
Income Below Poverty Among Married-Couple Families in Jonesboro
The poverty statistics for married-couple families in Jonesboro show that 22.3% or 65 of the total 291 families live below the poverty line. Families with 1 or 2 children have the highest poverty rate of 39.9%, comprising of 57 families. On the other hand, families with 3 or 4 children have the lowest poverty rate of 0.0%, which includes 0 families.
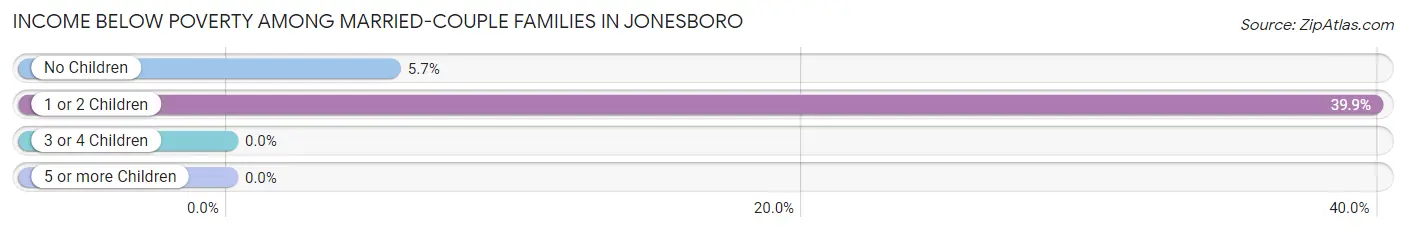
| Children | Above Poverty | Below Poverty |
| No Children | 133 (94.3%) | 8 (5.7%) |
| 1 or 2 Children | 86 (60.1%) | 57 (39.9%) |
| 3 or 4 Children | 7 (100.0%) | 0 (0.0%) |
| 5 or more Children | 0 (0.0%) | 0 (0.0%) |
| Total | 226 (77.7%) | 65 (22.3%) |
Income Below Poverty Among Single-Parent Households in Jonesboro
According to the poverty data in Jonesboro, 20.8% or 31 single-father households and 61.4% or 199 single-mother households are living below the poverty line. Among single-father households, those with no children have the highest poverty rate, with 8 households (21.0%) experiencing poverty. Likewise, among single-mother households, those with 3 or 4 children have the highest poverty rate, with 23 households (100.0%) falling below the poverty line.
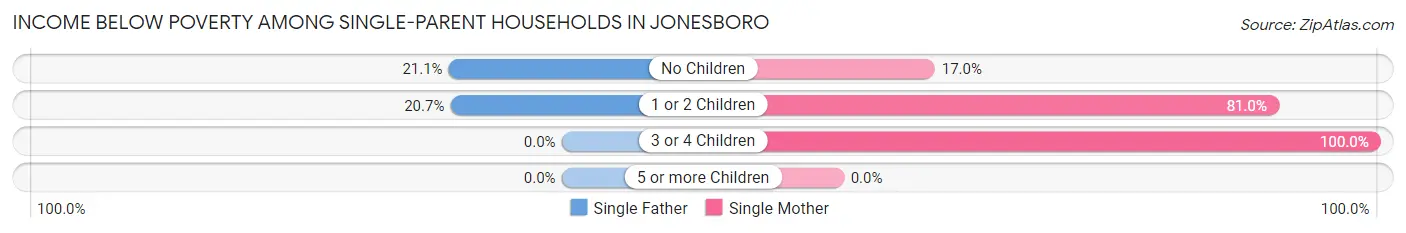
| Children | Single Father | Single Mother |
| No Children | 8 (21.0%) | 18 (17.0%) |
| 1 or 2 Children | 23 (20.7%) | 158 (81.0%) |
| 3 or 4 Children | 0 (0.0%) | 23 (100.0%) |
| 5 or more Children | 0 (0.0%) | 0 (0.0%) |
| Total | 31 (20.8%) | 199 (61.4%) |
Income Below Poverty Among Married-Couple vs Single-Parent Households in Jonesboro
The poverty data for Jonesboro shows that 65 of the married-couple family households (22.3%) and 230 of the single-parent households (48.6%) are living below the poverty level. Within the married-couple family households, those with 1 or 2 children have the highest poverty rate, with 57 households (39.9%) falling below the poverty line. Among the single-parent households, those with 3 or 4 children have the highest poverty rate, with 23 household (100.0%) living below poverty.
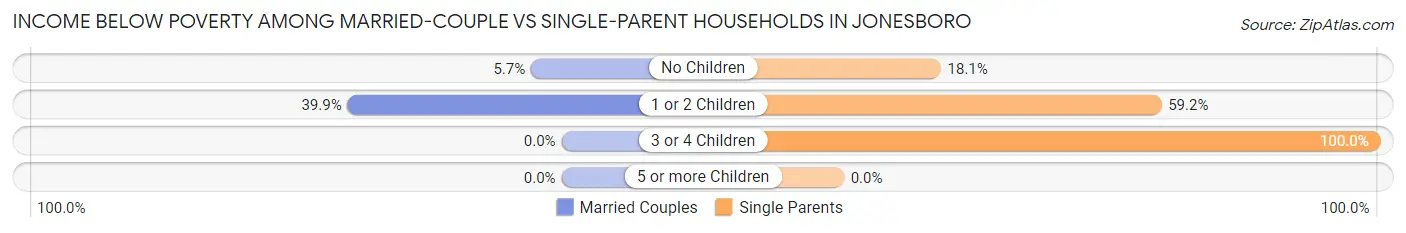
| Children | Married-Couple Families | Single-Parent Households |
| No Children | 8 (5.7%) | 26 (18.1%) |
| 1 or 2 Children | 57 (39.9%) | 181 (59.2%) |
| 3 or 4 Children | 0 (0.0%) | 23 (100.0%) |
| 5 or more Children | 0 (0.0%) | 0 (0.0%) |
| Total | 65 (22.3%) | 230 (48.6%) |
Race in Jonesboro
The most populous races in Jonesboro are White / Caucasian (1,942 | 47.0%), Black / African American (1,872 | 45.3%), and Two or more Races (195 | 4.7%).
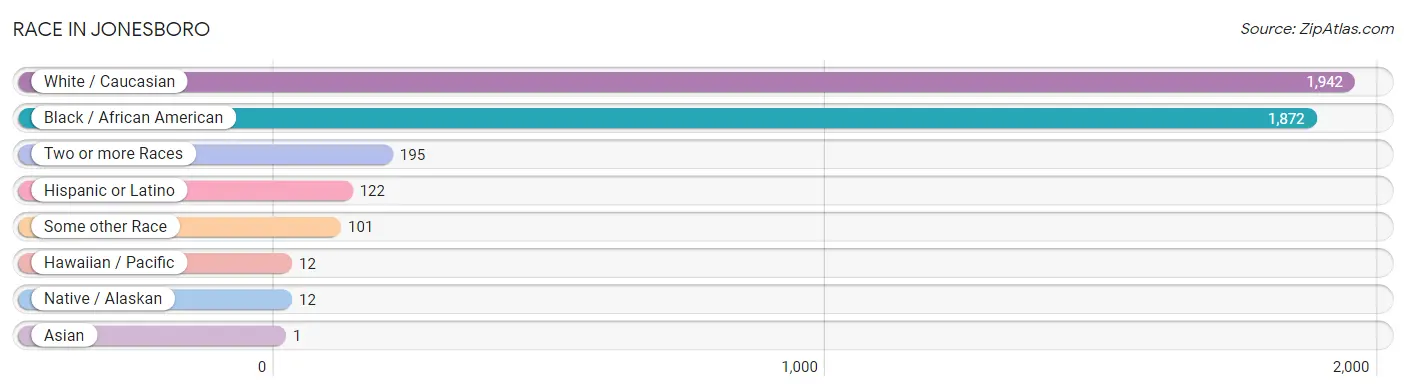
| Race | # Population | % Population |
| Asian | 1 | 0.0% |
| Black / African American | 1,872 | 45.3% |
| Hawaiian / Pacific | 12 | 0.3% |
| Hispanic or Latino | 122 | 2.9% |
| Native / Alaskan | 12 | 0.3% |
| White / Caucasian | 1,942 | 47.0% |
| Two or more Races | 195 | 4.7% |
| Some other Race | 101 | 2.4% |
| Total | 4,135 | 100.0% |
Ancestry in Jonesboro
The most populous ancestries reported in Jonesboro are American (408 | 9.9%), French (189 | 4.6%), Dutch (156 | 3.8%), German (156 | 3.8%), and Irish (138 | 3.3%), together accounting for 25.3% of all Jonesboro residents.
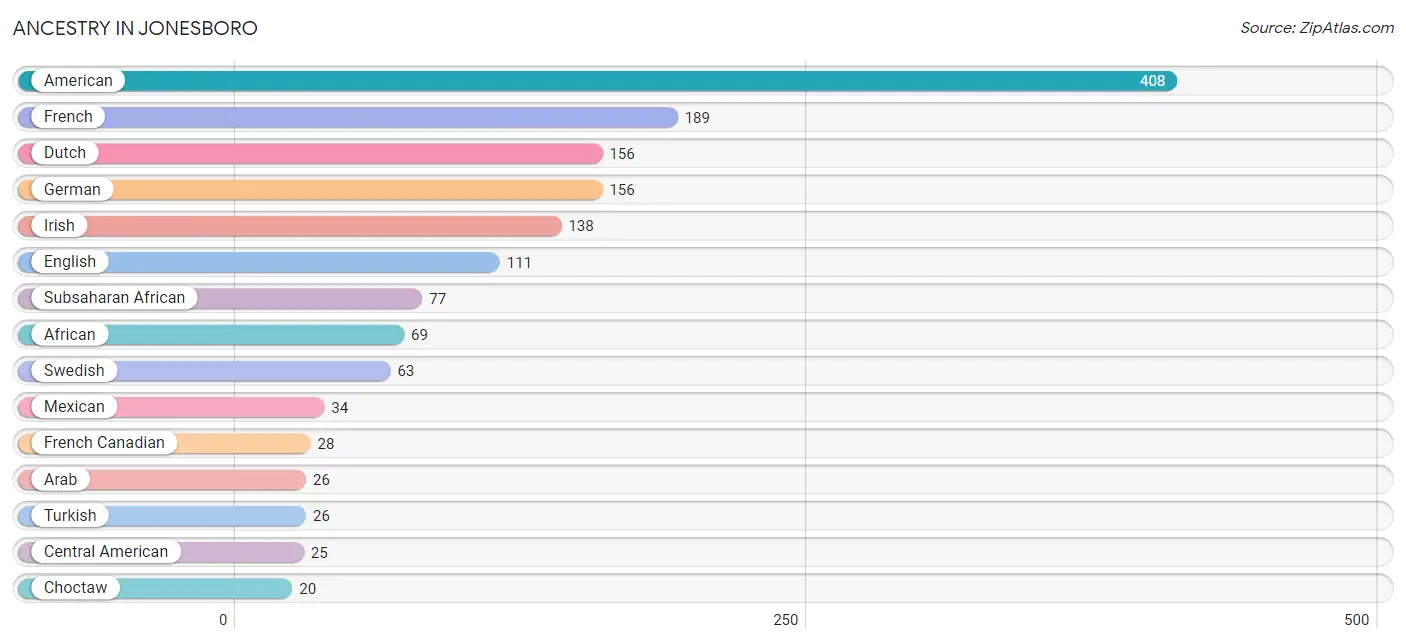
| Ancestry | # Population | % Population |
| African | 69 | 1.7% |
| American | 408 | 9.9% |
| Arab | 26 | 0.6% |
| Belgian | 5 | 0.1% |
| Central American | 25 | 0.6% |
| Choctaw | 20 | 0.5% |
| Colombian | 9 | 0.2% |
| Cuban | 1 | 0.0% |
| Danish | 10 | 0.2% |
| Dominican | 11 | 0.3% |
| Dutch | 156 | 3.8% |
| Ecuadorian | 9 | 0.2% |
| English | 111 | 2.7% |
| Ethiopian | 8 | 0.2% |
| French | 189 | 4.6% |
| French Canadian | 28 | 0.7% |
| German | 156 | 3.8% |
| Greek | 4 | 0.1% |
| Honduran | 16 | 0.4% |
| Hungarian | 3 | 0.1% |
| Irish | 138 | 3.3% |
| Italian | 9 | 0.2% |
| Korean | 1 | 0.0% |
| Mexican | 34 | 0.8% |
| Native Hawaiian | 12 | 0.3% |
| Nicaraguan | 9 | 0.2% |
| Norwegian | 4 | 0.1% |
| Palestinian | 11 | 0.3% |
| Puerto Rican | 9 | 0.2% |
| Scandinavian | 5 | 0.1% |
| Scottish | 16 | 0.4% |
| South American | 18 | 0.4% |
| Spaniard | 6 | 0.2% |
| Subsaharan African | 77 | 1.9% |
| Swedish | 63 | 1.5% |
| Syrian | 10 | 0.2% |
| Turkish | 26 | 0.6% |
| West Indian | 9 | 0.2% |
| Yugoslavian | 4 | 0.1% | View All 39 Rows |
Immigrants in Jonesboro
The most numerous immigrant groups reported in Jonesboro came from Latin America (70 | 1.7%), Central America (41 | 1.0%), Nicaragua (27 | 0.6%), Asia (26 | 0.6%), and Turkey (26 | 0.6%), together accounting for 4.6% of all Jonesboro residents.
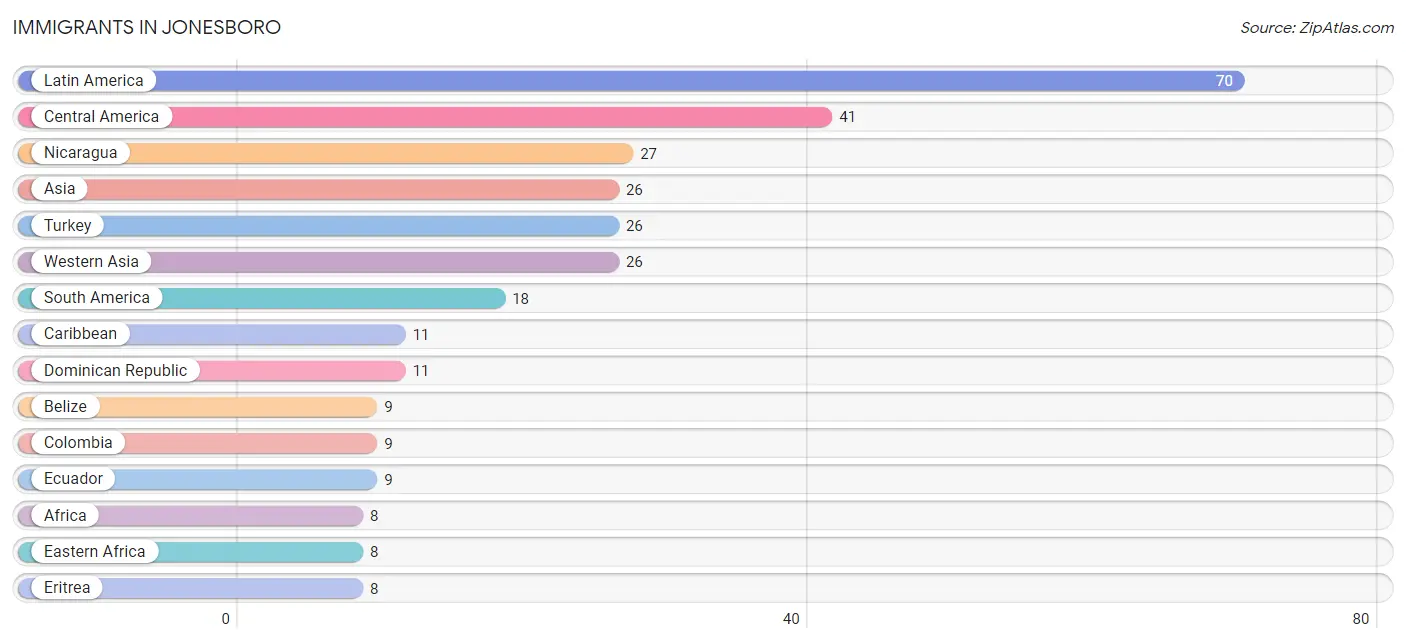
| Immigration Origin | # Population | % Population |
| Africa | 8 | 0.2% |
| Asia | 26 | 0.6% |
| Belize | 9 | 0.2% |
| Caribbean | 11 | 0.3% |
| Central America | 41 | 1.0% |
| Colombia | 9 | 0.2% |
| Dominican Republic | 11 | 0.3% |
| Eastern Africa | 8 | 0.2% |
| Ecuador | 9 | 0.2% |
| Eritrea | 8 | 0.2% |
| Europe | 8 | 0.2% |
| Germany | 8 | 0.2% |
| Latin America | 70 | 1.7% |
| Mexico | 5 | 0.1% |
| Nicaragua | 27 | 0.6% |
| South America | 18 | 0.4% |
| Turkey | 26 | 0.6% |
| Western Asia | 26 | 0.6% |
| Western Europe | 8 | 0.2% | View All 19 Rows |
Sex and Age in Jonesboro
Sex and Age in Jonesboro
The most populous age groups in Jonesboro are 30 to 34 Years (323 | 14.5%) for men and 25 to 29 Years (215 | 11.2%) for women.
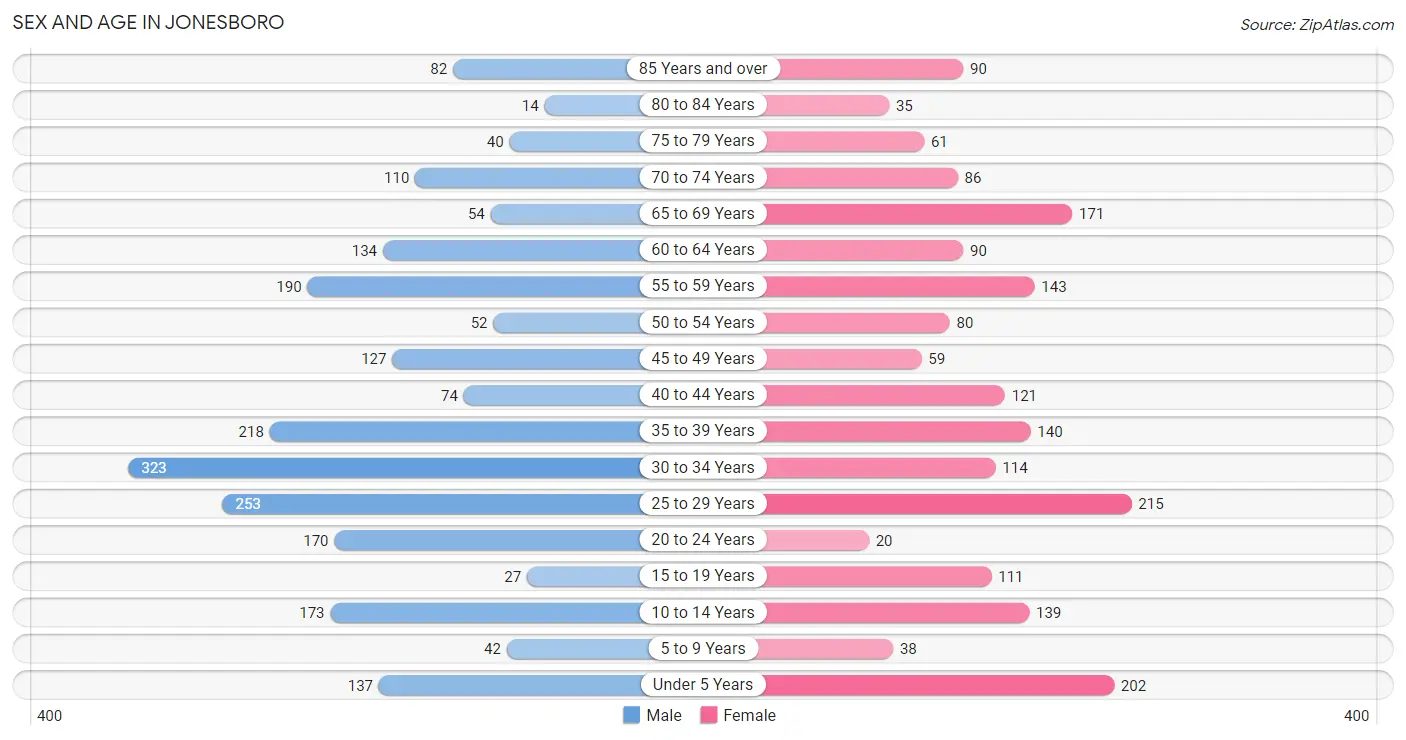
| Age Bracket | Male | Female |
| Under 5 Years | 137 (6.2%) | 202 (10.5%) |
| 5 to 9 Years | 42 (1.9%) | 38 (2.0%) |
| 10 to 14 Years | 173 (7.8%) | 139 (7.3%) |
| 15 to 19 Years | 27 (1.2%) | 111 (5.8%) |
| 20 to 24 Years | 170 (7.7%) | 20 (1.0%) |
| 25 to 29 Years | 253 (11.4%) | 215 (11.2%) |
| 30 to 34 Years | 323 (14.5%) | 114 (5.9%) |
| 35 to 39 Years | 218 (9.8%) | 140 (7.3%) |
| 40 to 44 Years | 74 (3.3%) | 121 (6.3%) |
| 45 to 49 Years | 127 (5.7%) | 59 (3.1%) |
| 50 to 54 Years | 52 (2.3%) | 80 (4.2%) |
| 55 to 59 Years | 190 (8.6%) | 143 (7.5%) |
| 60 to 64 Years | 134 (6.0%) | 90 (4.7%) |
| 65 to 69 Years | 54 (2.4%) | 171 (8.9%) |
| 70 to 74 Years | 110 (5.0%) | 86 (4.5%) |
| 75 to 79 Years | 40 (1.8%) | 61 (3.2%) |
| 80 to 84 Years | 14 (0.6%) | 35 (1.8%) |
| 85 Years and over | 82 (3.7%) | 90 (4.7%) |
| Total | 2,220 (100.0%) | 1,915 (100.0%) |
Families and Households in Jonesboro
Median Family Size in Jonesboro
The median family size in Jonesboro is 3.20 persons per family, with single female/mother families (324 | 42.4%) accounting for the largest median family size of 3.49 persons per family. On the other hand, single male/father families (149 | 19.5%) represent the smallest median family size with 2.28 persons per family.
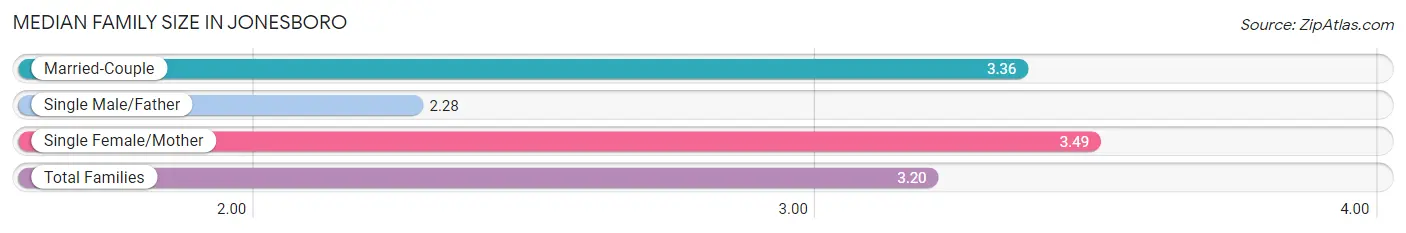
| Family Type | # Families | Family Size |
| Married-Couple | 291 (38.1%) | 3.36 |
| Single Male/Father | 149 (19.5%) | 2.28 |
| Single Female/Mother | 324 (42.4%) | 3.49 |
| Total Families | 764 (100.0%) | 3.20 |
Median Household Size in Jonesboro
The median household size in Jonesboro is 2.46 persons per household, with single female/mother households (324 | 24.7%) accounting for the largest median household size of 3.74 persons per household. non-family households (547 | 41.7%) represent the smallest median household size with 1.26 persons per household.
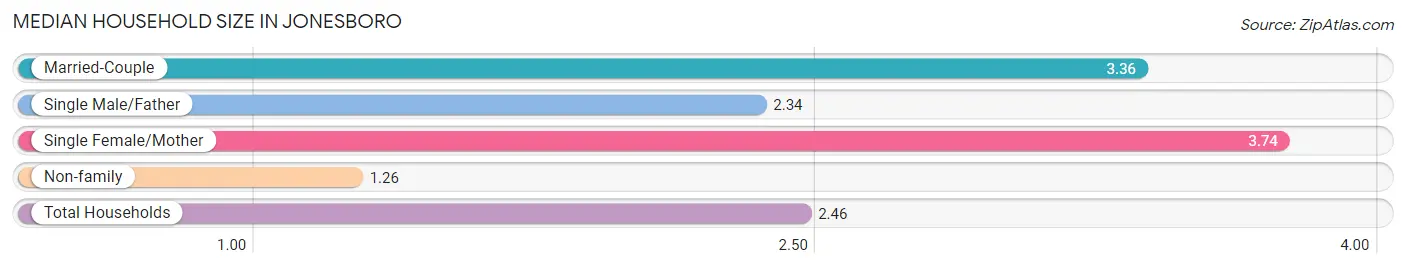
| Household Type | # Households | Household Size |
| Married-Couple | 291 (22.2%) | 3.36 |
| Single Male/Father | 149 (11.4%) | 2.34 |
| Single Female/Mother | 324 (24.7%) | 3.74 |
| Non-family | 547 (41.7%) | 1.26 |
| Total Households | 1,311 (100.0%) | 2.46 |
Household Size by Marriage Status in Jonesboro
Out of a total of 1,311 households in Jonesboro, 764 (58.3%) are family households, while 547 (41.7%) are nonfamily households. The most numerous type of family households are 2-person households, comprising 292, and the most common type of nonfamily households are 1-person households, comprising 468.
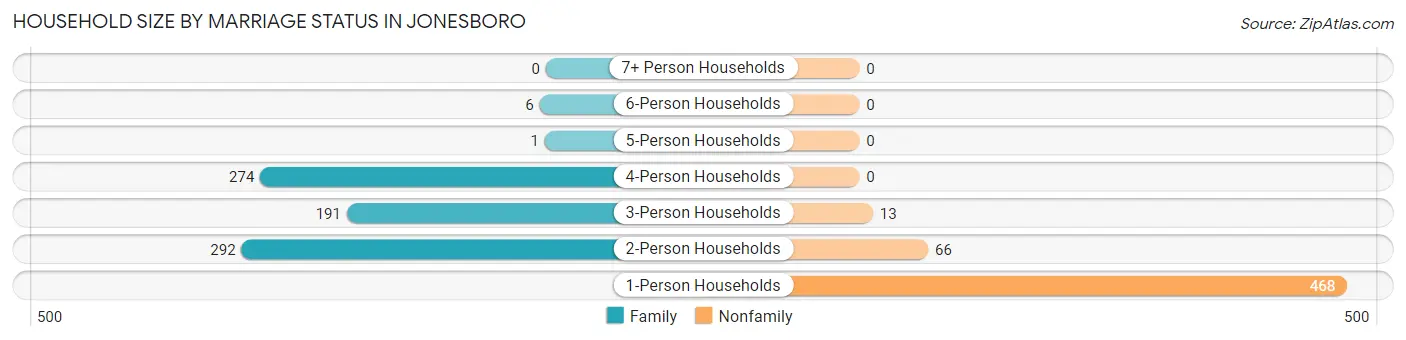
| Household Size | Family Households | Nonfamily Households |
| 1-Person Households | - | 468 (35.7%) |
| 2-Person Households | 292 (22.3%) | 66 (5.0%) |
| 3-Person Households | 191 (14.6%) | 13 (1.0%) |
| 4-Person Households | 274 (20.9%) | 0 (0.0%) |
| 5-Person Households | 1 (0.1%) | 0 (0.0%) |
| 6-Person Households | 6 (0.5%) | 0 (0.0%) |
| 7+ Person Households | 0 (0.0%) | 0 (0.0%) |
| Total | 764 (58.3%) | 547 (41.7%) |
Female Fertility in Jonesboro
Fertility by Age in Jonesboro
Average fertility rate in Jonesboro is 29.0 births per 1,000 women. Women in the age bracket of 20 to 34 years have the highest fertility rate with 66.0 births per 1,000 women. Women in the age bracket of 20 to 34 years acount for 100.0% of all women with births.
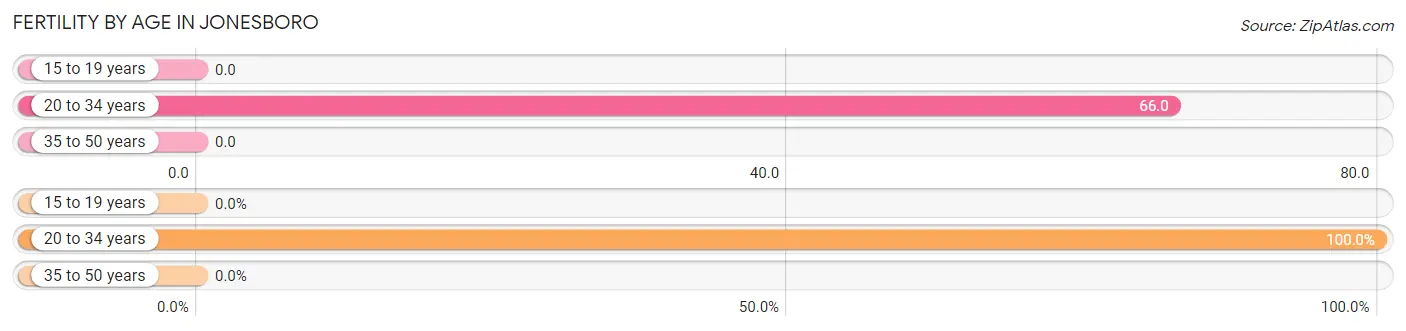
| Age Bracket | Women with Births | Births / 1,000 Women |
| 15 to 19 years | 0 (0.0%) | 0.0 |
| 20 to 34 years | 23 (100.0%) | 66.0 |
| 35 to 50 years | 0 (0.0%) | 0.0 |
| Total | 23 (100.0%) | 29.0 |
Fertility by Age by Marriage Status in Jonesboro
65.2% of women with births (23) in Jonesboro are married. The highest percentage of unmarried women with births falls into 20 to 34 years age bracket with 34.8% of them unmarried at the time of birth, while the lowest percentage of unmarried women with births belong to 20 to 34 years age bracket with 34.8% of them unmarried.
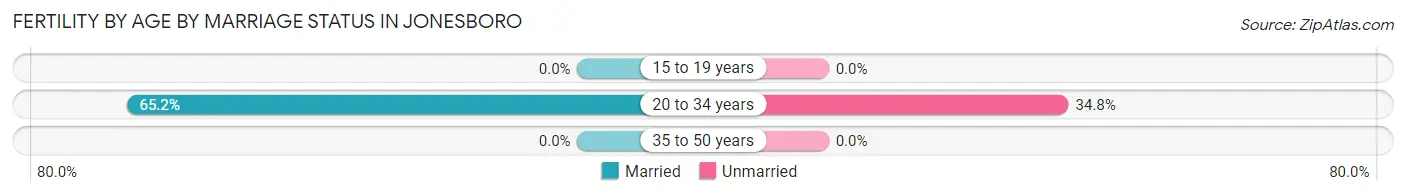
| Age Bracket | Married | Unmarried |
| 15 to 19 years | 0 (0.0%) | 0 (0.0%) |
| 20 to 34 years | 15 (65.2%) | 8 (34.8%) |
| 35 to 50 years | 0 (0.0%) | 0 (0.0%) |
| Total | 15 (65.2%) | 8 (34.8%) |
Fertility by Education in Jonesboro
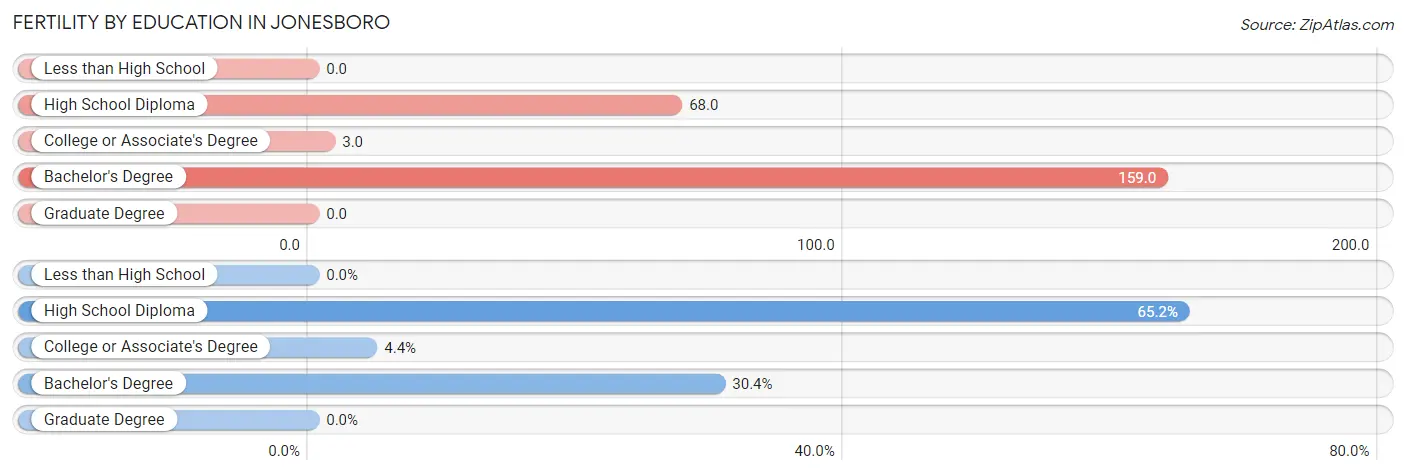
| Educational Attainment | Women with Births | Births / 1,000 Women |
| Less than High School | 0 (0.0%) | 0.0 |
| High School Diploma | 15 (65.2%) | 68.0 |
| College or Associate's Degree | 1 (4.3%) | 3.0 |
| Bachelor's Degree | 7 (30.4%) | 159.0 |
| Graduate Degree | 0 (0.0%) | 0.0 |
| Total | 23 (100.0%) | 29.0 |
Fertility by Education by Marriage Status in Jonesboro
34.8% of women with births in Jonesboro are unmarried. Women with the educational attainment of high school diploma are most likely to be married with 100.0% of them married at childbirth, while women with the educational attainment of college or associate's degree are least likely to be married with 100.0% of them unmarried at childbirth.
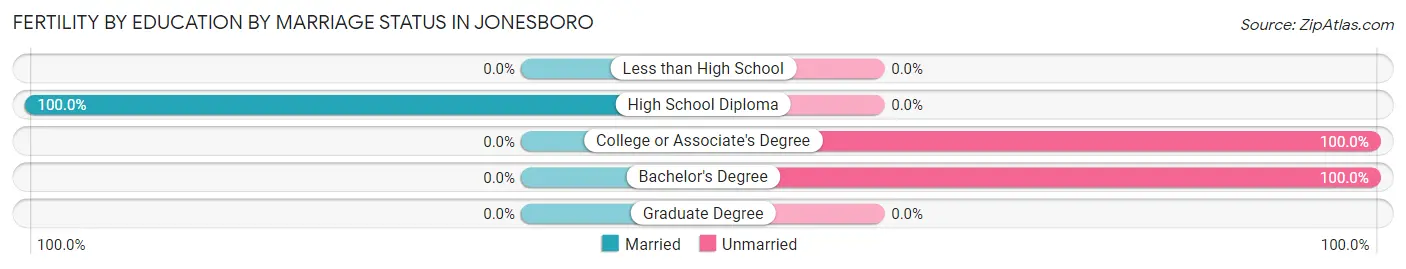
| Educational Attainment | Married | Unmarried |
| Less than High School | 0 (0.0%) | 0 (0.0%) |
| High School Diploma | 15 (100.0%) | 0 (0.0%) |
| College or Associate's Degree | 0 (0.0%) | 1 (100.0%) |
| Bachelor's Degree | 0 (0.0%) | 7 (100.0%) |
| Graduate Degree | 0 (0.0%) | 0 (0.0%) |
| Total | 15 (65.2%) | 8 (34.8%) |
Employment Characteristics in Jonesboro
Employment by Class of Employer in Jonesboro
Among the 1,136 employed individuals in Jonesboro, private company employees (711 | 62.6%), local government employees (208 | 18.3%), and state government employees (95 | 8.4%) make up the most common classes of employment.
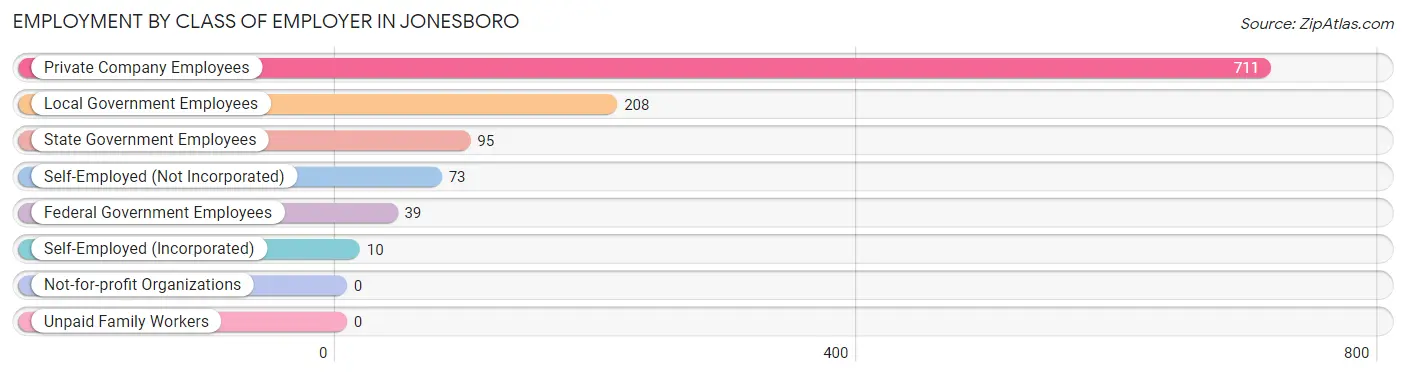
| Employer Class | # Employees | % Employees |
| Private Company Employees | 711 | 62.6% |
| Self-Employed (Incorporated) | 10 | 0.9% |
| Self-Employed (Not Incorporated) | 73 | 6.4% |
| Not-for-profit Organizations | 0 | 0.0% |
| Local Government Employees | 208 | 18.3% |
| State Government Employees | 95 | 8.4% |
| Federal Government Employees | 39 | 3.4% |
| Unpaid Family Workers | 0 | 0.0% |
| Total | 1,136 | 100.0% |
Employment Status by Age in Jonesboro
According to the labor force statistics for Jonesboro, out of the total population over 16 years of age (3,372), 34.5% or 1,163 individuals are in the labor force, with 1.5% or 17 of them unemployed. The age group with the highest labor force participation rate is 55 to 59 years, with 58.9% or 196 individuals in the labor force. Within the labor force, the 16 to 19 years age range has the highest percentage of unemployed individuals, with 25.0% or 3 of them being unemployed.
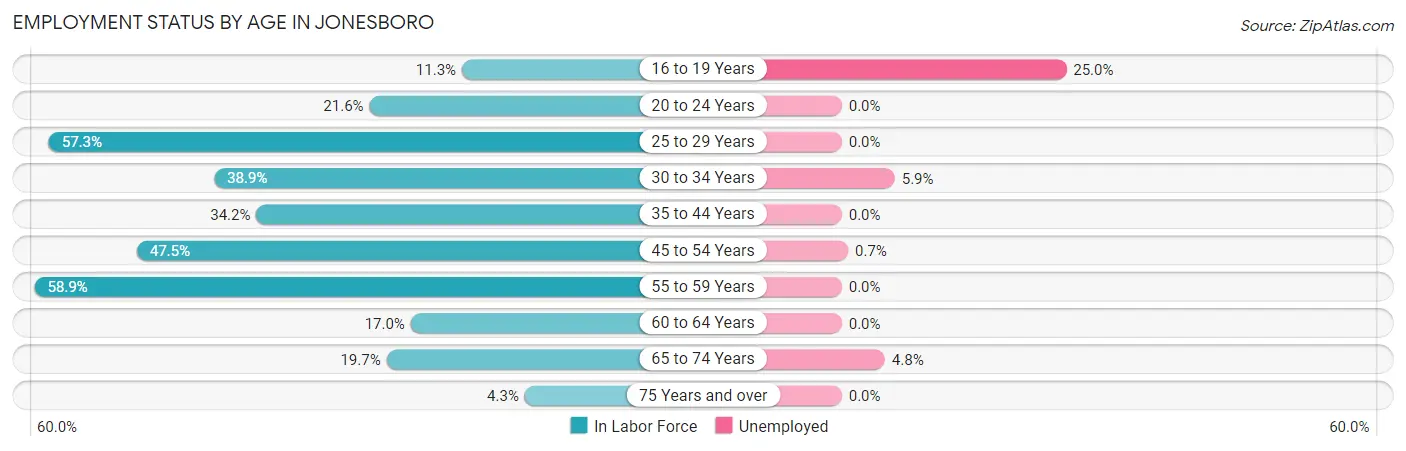
| Age Bracket | In Labor Force | Unemployed |
| 16 to 19 Years | 12 (11.3%) | 3 (25.0%) |
| 20 to 24 Years | 41 (21.6%) | 0 (0.0%) |
| 25 to 29 Years | 268 (57.3%) | 0 (0.0%) |
| 30 to 34 Years | 170 (38.9%) | 10 (5.9%) |
| 35 to 44 Years | 189 (34.2%) | 0 (0.0%) |
| 45 to 54 Years | 151 (47.5%) | 1 (0.7%) |
| 55 to 59 Years | 196 (58.9%) | 0 (0.0%) |
| 60 to 64 Years | 38 (17.0%) | 0 (0.0%) |
| 65 to 74 Years | 83 (19.7%) | 4 (4.8%) |
| 75 Years and over | 14 (4.3%) | 0 (0.0%) |
| Total | 1,163 (34.5%) | 17 (1.5%) |
Employment Status by Educational Attainment in Jonesboro
According to labor force statistics for Jonesboro, 43.4% of individuals (1,013) out of the total population between 25 and 64 years of age (2,333) are in the labor force, with 1.1% or 11 of them being unemployed. The group with the highest labor force participation rate are those with the educational attainment of bachelor's degree or higher, with 65.5% or 108 individuals in the labor force. Within the labor force, individuals with college / associate degree education have the highest percentage of unemployment, with 3.0% or 11 of them being unemployed.
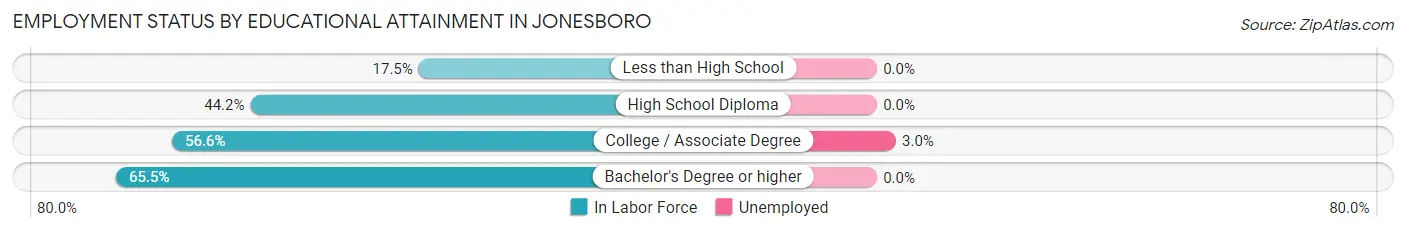
| Educational Attainment | In Labor Force | Unemployed |
| Less than High School | 88 (17.5%) | 0 (0.0%) |
| High School Diploma | 449 (44.2%) | 0 (0.0%) |
| College / Associate Degree | 367 (56.6%) | 19 (3.0%) |
| Bachelor's Degree or higher | 108 (65.5%) | 0 (0.0%) |
| Total | 1,013 (43.4%) | 26 (1.1%) |
Employment Occupations by Sex in Jonesboro
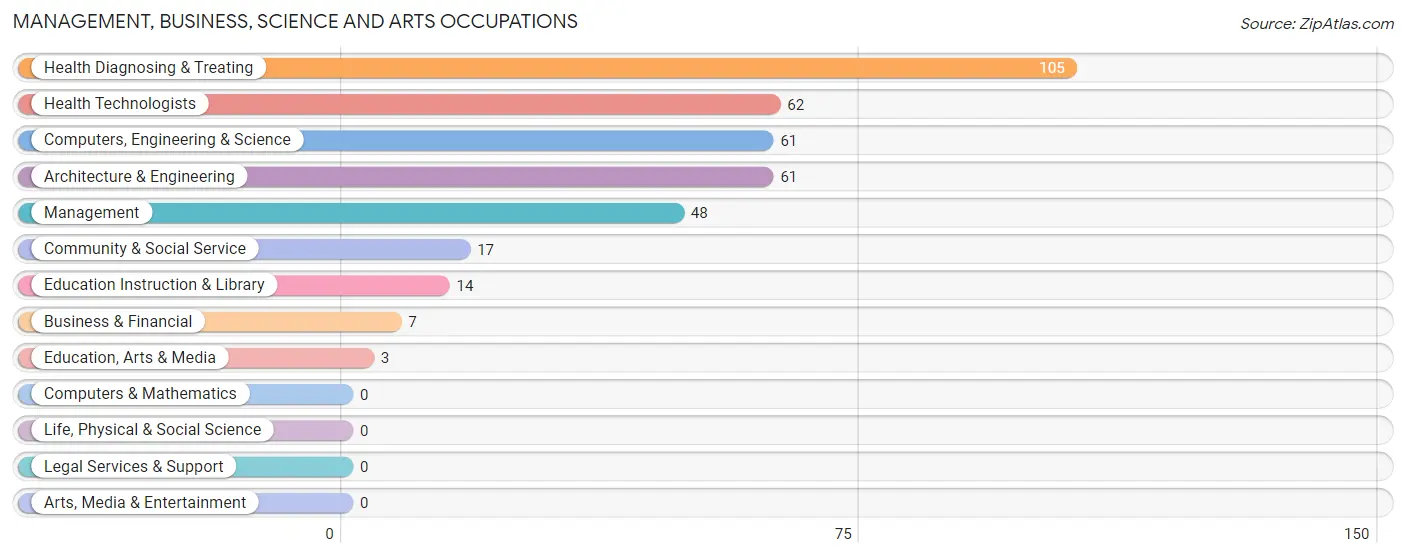
Management, Business, Science and Arts Occupations
The most common Management, Business, Science and Arts occupations in Jonesboro are Health Diagnosing & Treating (105 | 9.2%), Health Technologists (62 | 5.4%), Computers, Engineering & Science (61 | 5.3%), Architecture & Engineering (61 | 5.3%), and Management (48 | 4.2%).
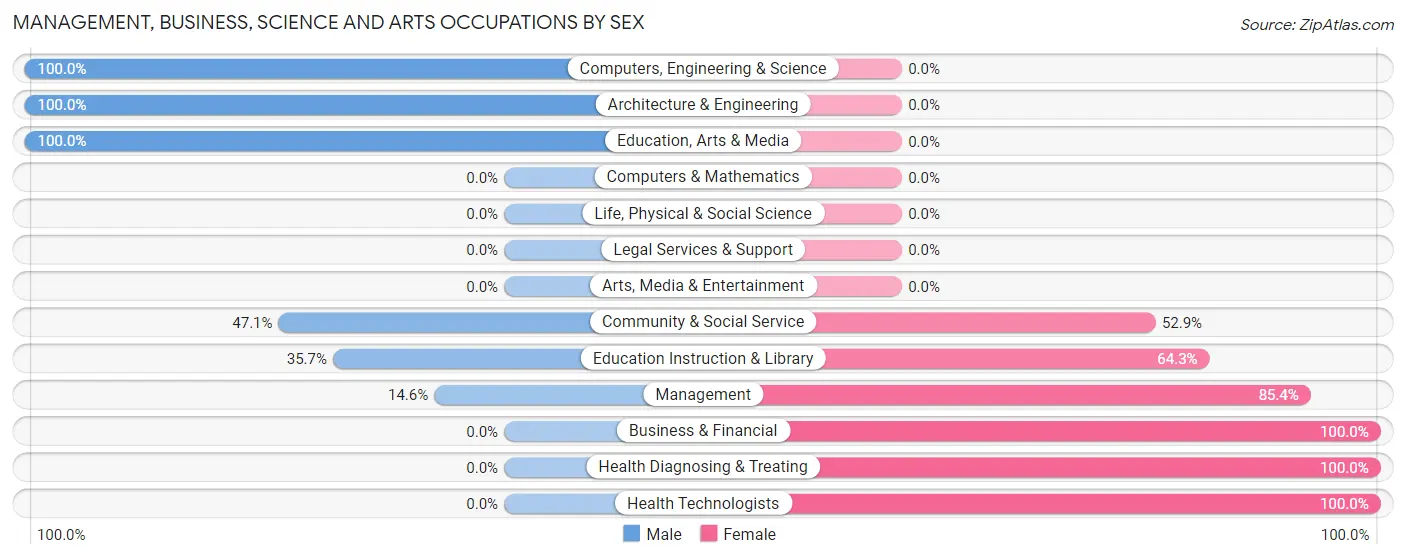
Management, Business, Science and Arts Occupations by Sex
Within the Management, Business, Science and Arts occupations in Jonesboro, the most male-oriented occupations are Computers, Engineering & Science (100.0%), Architecture & Engineering (100.0%), and Education, Arts & Media (100.0%), while the most female-oriented occupations are Business & Financial (100.0%), Health Diagnosing & Treating (100.0%), and Health Technologists (100.0%).
| Occupation | Male | Female |
| Management | 7 (14.6%) | 41 (85.4%) |
| Business & Financial | 0 (0.0%) | 7 (100.0%) |
| Computers, Engineering & Science | 61 (100.0%) | 0 (0.0%) |
| Computers & Mathematics | 0 (0.0%) | 0 (0.0%) |
| Architecture & Engineering | 61 (100.0%) | 0 (0.0%) |
| Life, Physical & Social Science | 0 (0.0%) | 0 (0.0%) |
| Community & Social Service | 8 (47.1%) | 9 (52.9%) |
| Education, Arts & Media | 3 (100.0%) | 0 (0.0%) |
| Legal Services & Support | 0 (0.0%) | 0 (0.0%) |
| Education Instruction & Library | 5 (35.7%) | 9 (64.3%) |
| Arts, Media & Entertainment | 0 (0.0%) | 0 (0.0%) |
| Health Diagnosing & Treating | 0 (0.0%) | 105 (100.0%) |
| Health Technologists | 0 (0.0%) | 62 (100.0%) |
| Total (Category) | 76 (31.9%) | 162 (68.1%) |
| Total (Overall) | 570 (49.8%) | 574 (50.2%) |
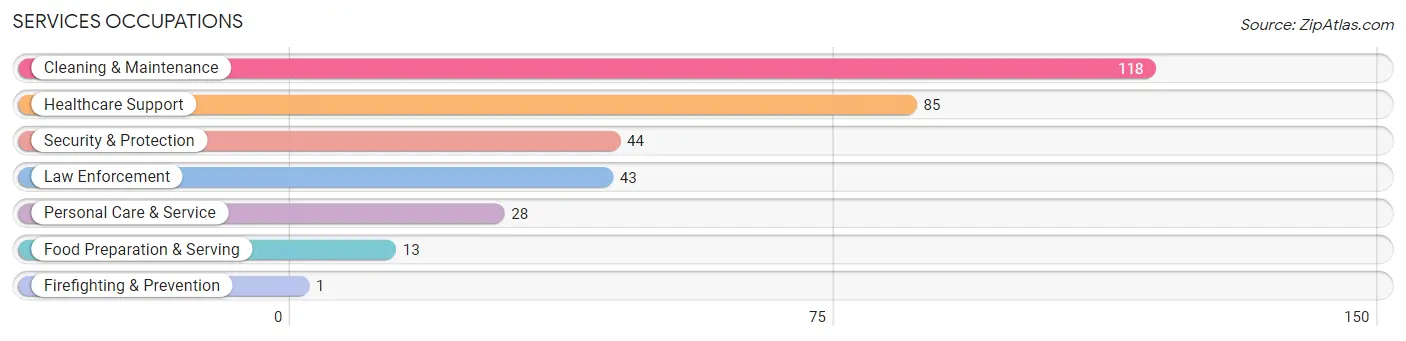
Services Occupations
The most common Services occupations in Jonesboro are Cleaning & Maintenance (118 | 10.3%), Healthcare Support (85 | 7.4%), Security & Protection (44 | 3.8%), Law Enforcement (43 | 3.8%), and Personal Care & Service (28 | 2.5%).
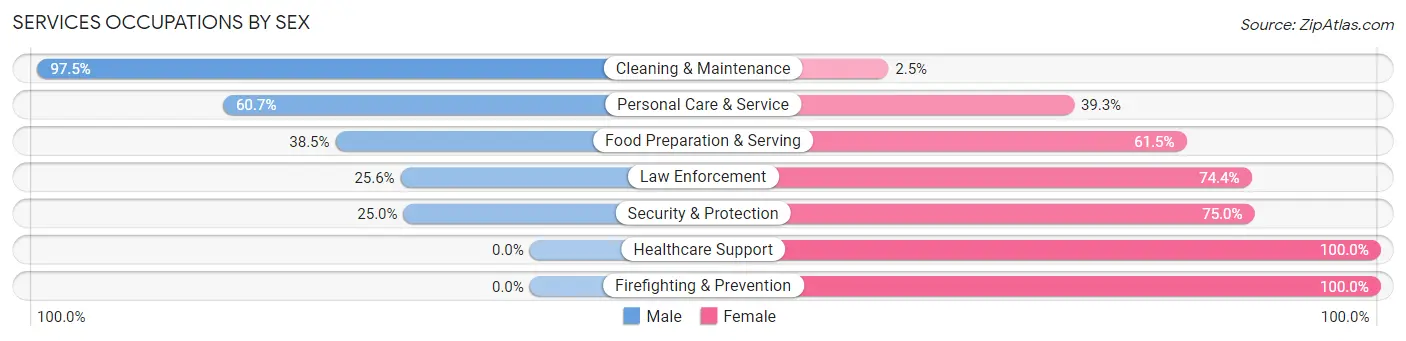
Services Occupations by Sex
Within the Services occupations in Jonesboro, the most male-oriented occupations are Cleaning & Maintenance (97.5%), Personal Care & Service (60.7%), and Food Preparation & Serving (38.5%), while the most female-oriented occupations are Healthcare Support (100.0%), Firefighting & Prevention (100.0%), and Security & Protection (75.0%).
| Occupation | Male | Female |
| Healthcare Support | 0 (0.0%) | 85 (100.0%) |
| Security & Protection | 11 (25.0%) | 33 (75.0%) |
| Firefighting & Prevention | 0 (0.0%) | 1 (100.0%) |
| Law Enforcement | 11 (25.6%) | 32 (74.4%) |
| Food Preparation & Serving | 5 (38.5%) | 8 (61.5%) |
| Cleaning & Maintenance | 115 (97.5%) | 3 (2.5%) |
| Personal Care & Service | 17 (60.7%) | 11 (39.3%) |
| Total (Category) | 148 (51.4%) | 140 (48.6%) |
| Total (Overall) | 570 (49.8%) | 574 (50.2%) |
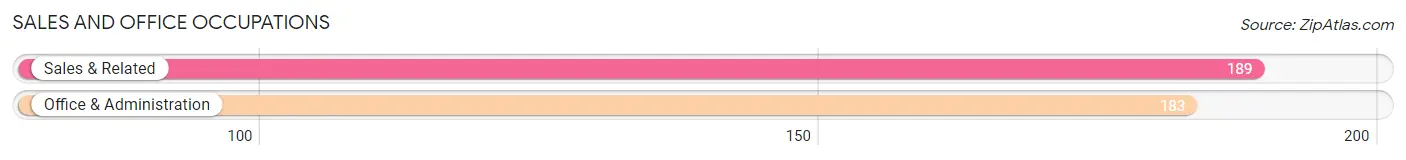
Sales and Office Occupations
The most common Sales and Office occupations in Jonesboro are Sales & Related (189 | 16.5%), and Office & Administration (183 | 16.0%).
Sales and Office Occupations by Sex
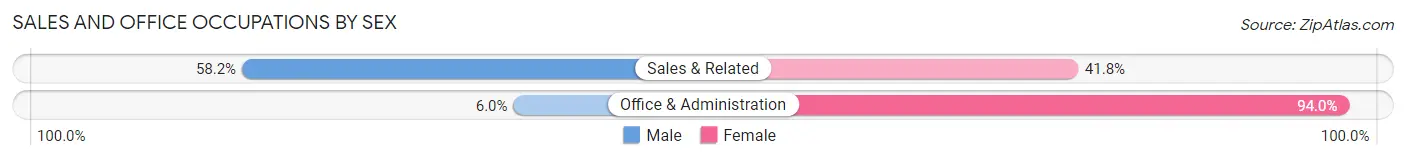
| Occupation | Male | Female |
| Sales & Related | 110 (58.2%) | 79 (41.8%) |
| Office & Administration | 11 (6.0%) | 172 (94.0%) |
| Total (Category) | 121 (32.5%) | 251 (67.5%) |
| Total (Overall) | 570 (49.8%) | 574 (50.2%) |
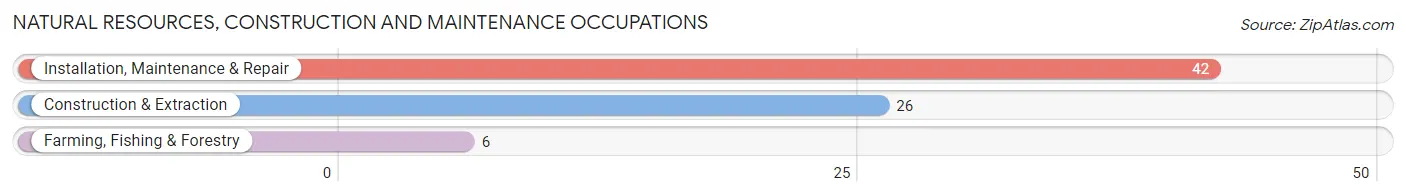
Natural Resources, Construction and Maintenance Occupations
The most common Natural Resources, Construction and Maintenance occupations in Jonesboro are Installation, Maintenance & Repair (42 | 3.7%), Construction & Extraction (26 | 2.3%), and Farming, Fishing & Forestry (6 | 0.5%).
Natural Resources, Construction and Maintenance Occupations by Sex
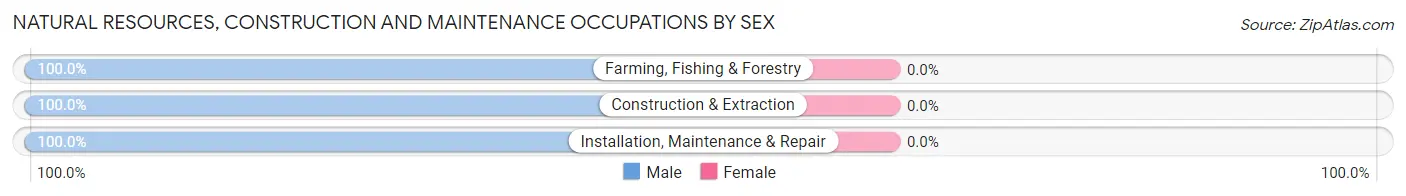
| Occupation | Male | Female |
| Farming, Fishing & Forestry | 6 (100.0%) | 0 (0.0%) |
| Construction & Extraction | 26 (100.0%) | 0 (0.0%) |
| Installation, Maintenance & Repair | 42 (100.0%) | 0 (0.0%) |
| Total (Category) | 74 (100.0%) | 0 (0.0%) |
| Total (Overall) | 570 (49.8%) | 574 (50.2%) |
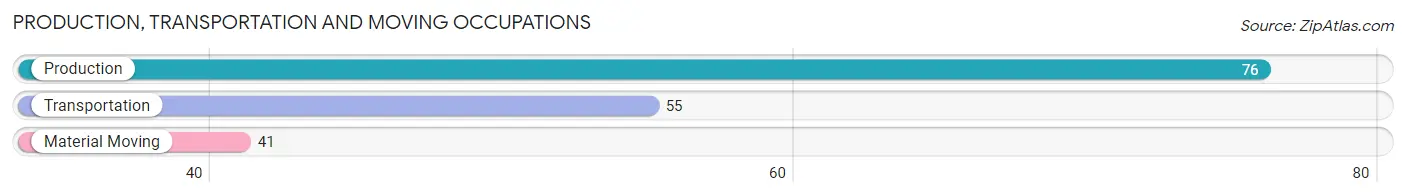
Production, Transportation and Moving Occupations
The most common Production, Transportation and Moving occupations in Jonesboro are Production (76 | 6.6%), Transportation (55 | 4.8%), and Material Moving (41 | 3.6%).
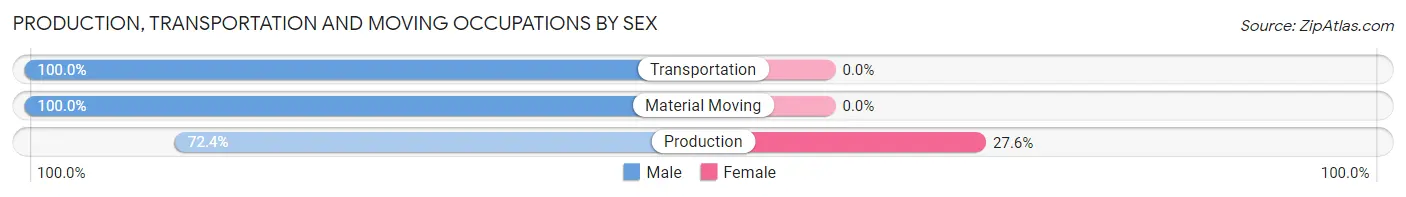
Production, Transportation and Moving Occupations by Sex
| Occupation | Male | Female |
| Production | 55 (72.4%) | 21 (27.6%) |
| Transportation | 55 (100.0%) | 0 (0.0%) |
| Material Moving | 41 (100.0%) | 0 (0.0%) |
| Total (Category) | 151 (87.8%) | 21 (12.2%) |
| Total (Overall) | 570 (49.8%) | 574 (50.2%) |
Employment Industries by Sex in Jonesboro
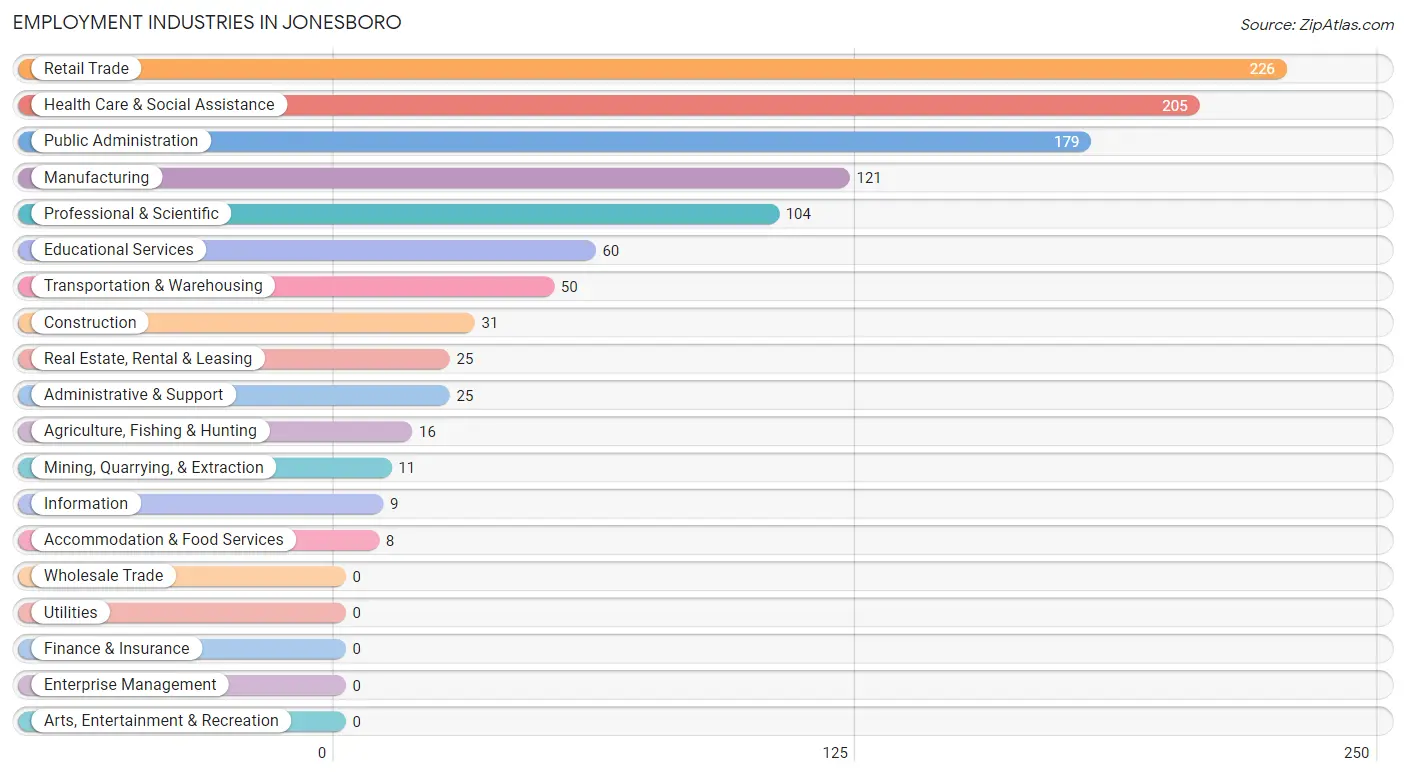
Employment Industries in Jonesboro
The major employment industries in Jonesboro include Retail Trade (226 | 19.8%), Health Care & Social Assistance (205 | 17.9%), Public Administration (179 | 15.7%), Manufacturing (121 | 10.6%), and Professional & Scientific (104 | 9.1%).
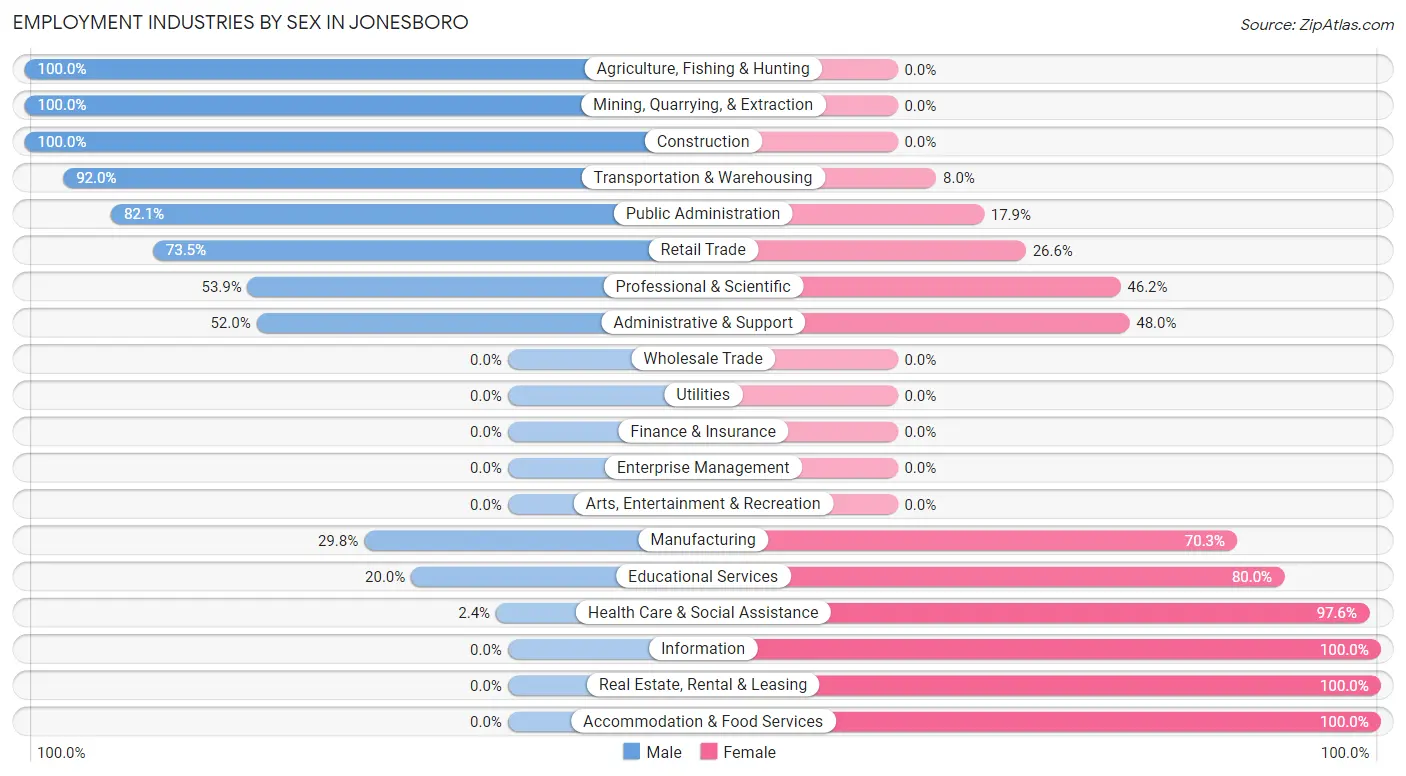
Employment Industries by Sex in Jonesboro
The Jonesboro industries that see more men than women are Agriculture, Fishing & Hunting (100.0%), Mining, Quarrying, & Extraction (100.0%), and Construction (100.0%), whereas the industries that tend to have a higher number of women are Information (100.0%), Real Estate, Rental & Leasing (100.0%), and Accommodation & Food Services (100.0%).
| Industry | Male | Female |
| Agriculture, Fishing & Hunting | 16 (100.0%) | 0 (0.0%) |
| Mining, Quarrying, & Extraction | 11 (100.0%) | 0 (0.0%) |
| Construction | 31 (100.0%) | 0 (0.0%) |
| Manufacturing | 36 (29.7%) | 85 (70.3%) |
| Wholesale Trade | 0 (0.0%) | 0 (0.0%) |
| Retail Trade | 166 (73.5%) | 60 (26.6%) |
| Transportation & Warehousing | 46 (92.0%) | 4 (8.0%) |
| Utilities | 0 (0.0%) | 0 (0.0%) |
| Information | 0 (0.0%) | 9 (100.0%) |
| Finance & Insurance | 0 (0.0%) | 0 (0.0%) |
| Real Estate, Rental & Leasing | 0 (0.0%) | 25 (100.0%) |
| Professional & Scientific | 56 (53.8%) | 48 (46.2%) |
| Enterprise Management | 0 (0.0%) | 0 (0.0%) |
| Administrative & Support | 13 (52.0%) | 12 (48.0%) |
| Educational Services | 12 (20.0%) | 48 (80.0%) |
| Health Care & Social Assistance | 5 (2.4%) | 200 (97.6%) |
| Arts, Entertainment & Recreation | 0 (0.0%) | 0 (0.0%) |
| Accommodation & Food Services | 0 (0.0%) | 8 (100.0%) |
| Public Administration | 147 (82.1%) | 32 (17.9%) |
| Total | 570 (49.8%) | 574 (50.2%) |
Education in Jonesboro
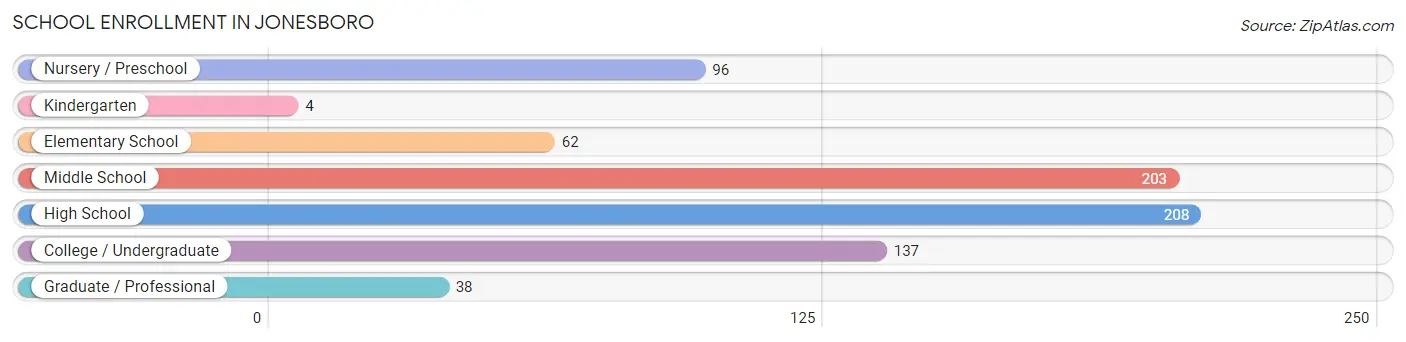
School Enrollment in Jonesboro
The most common levels of schooling among the 748 students in Jonesboro are high school (208 | 27.8%), middle school (203 | 27.1%), and college / undergraduate (137 | 18.3%).
| School Level | # Students | % Students |
| Nursery / Preschool | 96 | 12.8% |
| Kindergarten | 4 | 0.5% |
| Elementary School | 62 | 8.3% |
| Middle School | 203 | 27.1% |
| High School | 208 | 27.8% |
| College / Undergraduate | 137 | 18.3% |
| Graduate / Professional | 38 | 5.1% |
| Total | 748 | 100.0% |
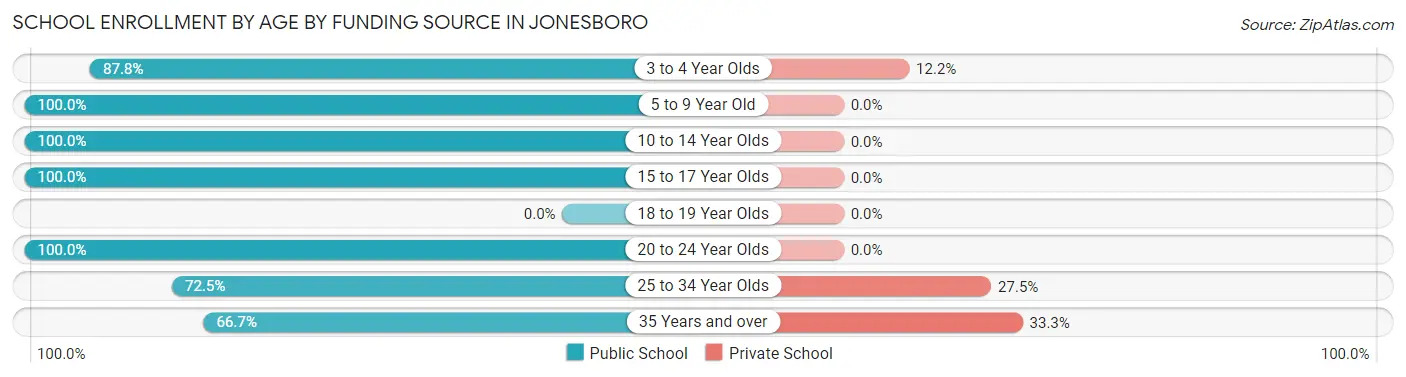
School Enrollment by Age by Funding Source in Jonesboro
Out of a total of 748 students who are enrolled in schools in Jonesboro, 53 (7.1%) attend a private institution, while the remaining 695 (92.9%) are enrolled in public schools. The age group of 35 years and over has the highest likelihood of being enrolled in private schools, with 18 (33.3% in the age bracket) enrolled. Conversely, the age group of 5 to 9 year old has the lowest likelihood of being enrolled in a private school, with 80 (100.0% in the age bracket) attending a public institution.
| Age Bracket | Public School | Private School |
| 3 to 4 Year Olds | 72 (87.8%) | 10 (12.2%) |
| 5 to 9 Year Old | 80 (100.0%) | 0 (0.0%) |
| 10 to 14 Year Olds | 281 (100.0%) | 0 (0.0%) |
| 15 to 17 Year Olds | 130 (100.0%) | 0 (0.0%) |
| 18 to 19 Year Olds | 0 (0.0%) | 0 (0.0%) |
| 20 to 24 Year Olds | 30 (100.0%) | 0 (0.0%) |
| 25 to 34 Year Olds | 66 (72.5%) | 25 (27.5%) |
| 35 Years and over | 36 (66.7%) | 18 (33.3%) |
| Total | 695 (92.9%) | 53 (7.1%) |
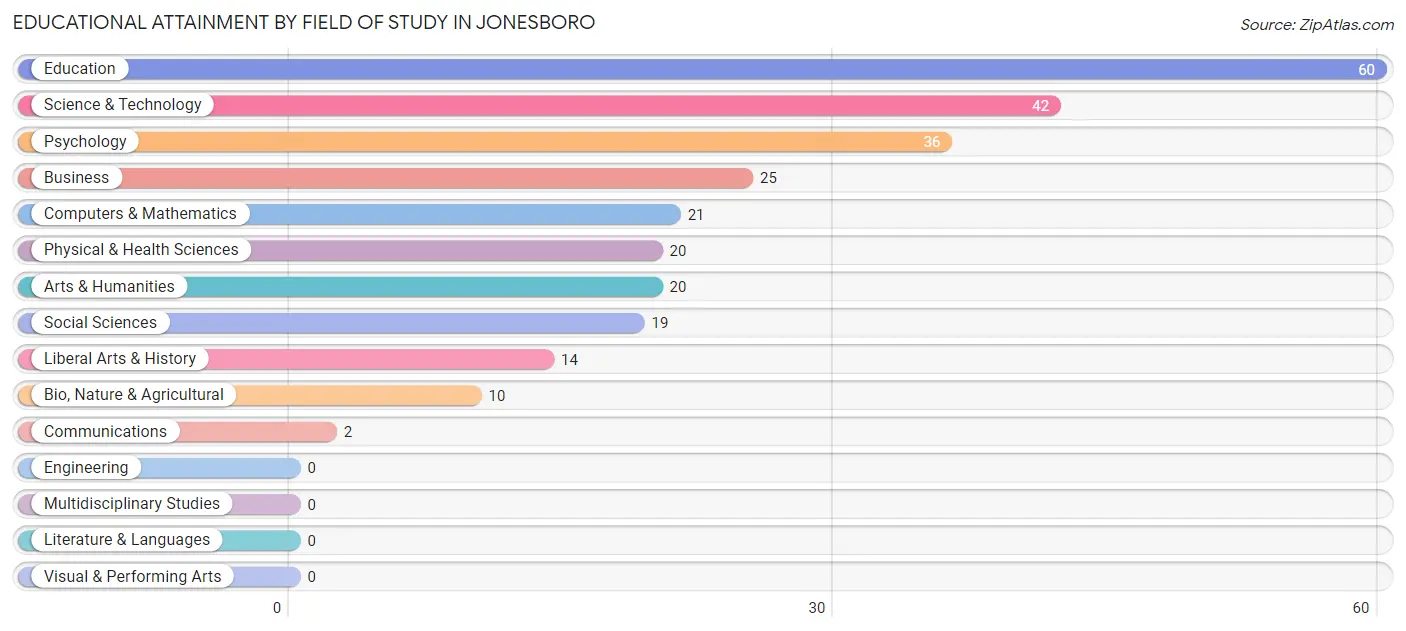
Educational Attainment by Field of Study in Jonesboro
Education (60 | 22.3%), science & technology (42 | 15.6%), psychology (36 | 13.4%), business (25 | 9.3%), and computers & mathematics (21 | 7.8%) are the most common fields of study among 269 individuals in Jonesboro who have obtained a bachelor's degree or higher.
| Field of Study | # Graduates | % Graduates |
| Computers & Mathematics | 21 | 7.8% |
| Bio, Nature & Agricultural | 10 | 3.7% |
| Physical & Health Sciences | 20 | 7.4% |
| Psychology | 36 | 13.4% |
| Social Sciences | 19 | 7.1% |
| Engineering | 0 | 0.0% |
| Multidisciplinary Studies | 0 | 0.0% |
| Science & Technology | 42 | 15.6% |
| Business | 25 | 9.3% |
| Education | 60 | 22.3% |
| Literature & Languages | 0 | 0.0% |
| Liberal Arts & History | 14 | 5.2% |
| Visual & Performing Arts | 0 | 0.0% |
| Communications | 2 | 0.7% |
| Arts & Humanities | 20 | 7.4% |
| Total | 269 | 100.0% |
Transportation & Commute in Jonesboro
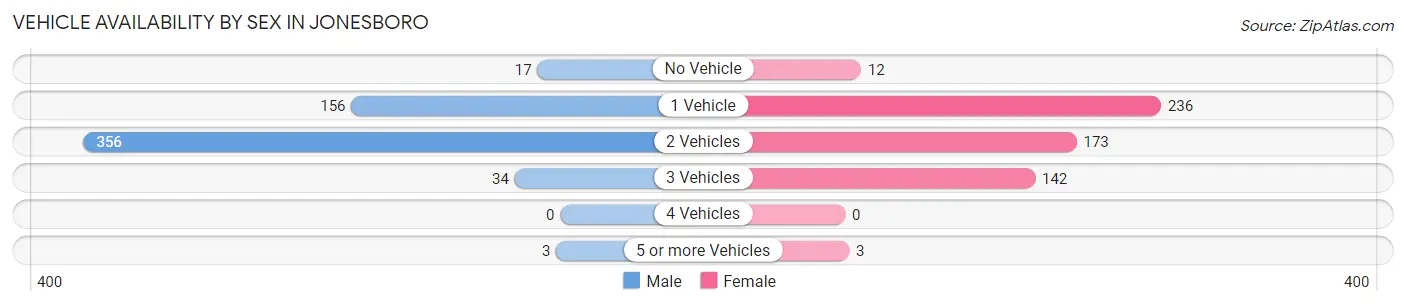
Vehicle Availability by Sex in Jonesboro
The most prevalent vehicle ownership categories in Jonesboro are males with 2 vehicles (356, accounting for 62.9%) and females with 2 vehicles (173, making up 62.9%).
| Vehicles Available | Male | Female |
| No Vehicle | 17 (3.0%) | 12 (2.1%) |
| 1 Vehicle | 156 (27.6%) | 236 (41.7%) |
| 2 Vehicles | 356 (62.9%) | 173 (30.6%) |
| 3 Vehicles | 34 (6.0%) | 142 (25.1%) |
| 4 Vehicles | 0 (0.0%) | 0 (0.0%) |
| 5 or more Vehicles | 3 (0.5%) | 3 (0.5%) |
| Total | 566 (100.0%) | 566 (100.0%) |
Commute Time in Jonesboro
The most frequently occuring commute durations in Jonesboro are 5 to 9 minutes (323 commuters, 29.3%), less than 5 minutes (205 commuters, 18.6%), and 30 to 34 minutes (168 commuters, 15.2%).
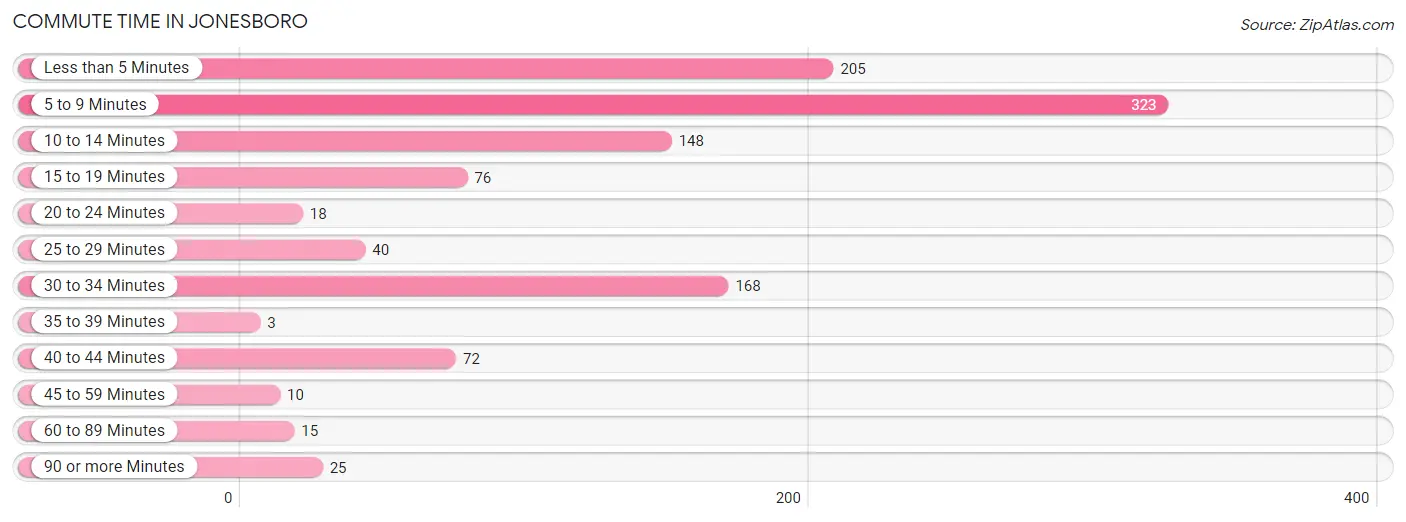
| Commute Time | # Commuters | % Commuters |
| Less than 5 Minutes | 205 | 18.6% |
| 5 to 9 Minutes | 323 | 29.3% |
| 10 to 14 Minutes | 148 | 13.4% |
| 15 to 19 Minutes | 76 | 6.9% |
| 20 to 24 Minutes | 18 | 1.6% |
| 25 to 29 Minutes | 40 | 3.6% |
| 30 to 34 Minutes | 168 | 15.2% |
| 35 to 39 Minutes | 3 | 0.3% |
| 40 to 44 Minutes | 72 | 6.5% |
| 45 to 59 Minutes | 10 | 0.9% |
| 60 to 89 Minutes | 15 | 1.4% |
| 90 or more Minutes | 25 | 2.3% |
Commute Time by Sex in Jonesboro
The most common commute times in Jonesboro are 5 to 9 minutes (215 commuters, 38.9%) for males and 5 to 9 minutes (108 commuters, 19.6%) for females.
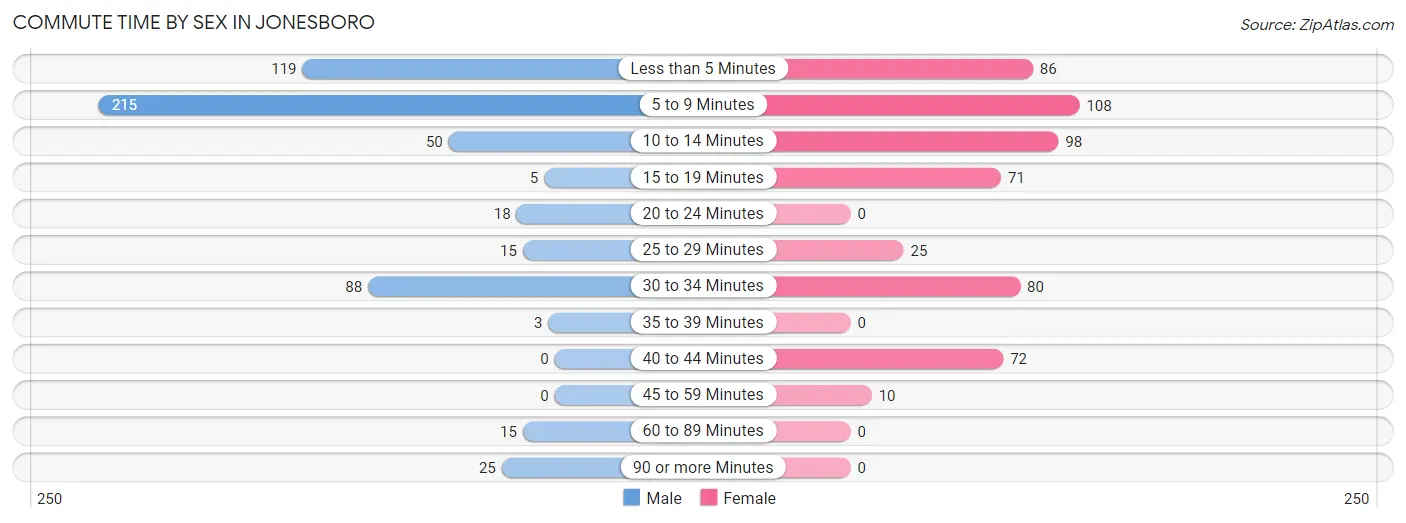
| Commute Time | Male | Female |
| Less than 5 Minutes | 119 (21.5%) | 86 (15.6%) |
| 5 to 9 Minutes | 215 (38.9%) | 108 (19.6%) |
| 10 to 14 Minutes | 50 (9.0%) | 98 (17.8%) |
| 15 to 19 Minutes | 5 (0.9%) | 71 (12.9%) |
| 20 to 24 Minutes | 18 (3.3%) | 0 (0.0%) |
| 25 to 29 Minutes | 15 (2.7%) | 25 (4.5%) |
| 30 to 34 Minutes | 88 (15.9%) | 80 (14.5%) |
| 35 to 39 Minutes | 3 (0.5%) | 0 (0.0%) |
| 40 to 44 Minutes | 0 (0.0%) | 72 (13.1%) |
| 45 to 59 Minutes | 0 (0.0%) | 10 (1.8%) |
| 60 to 89 Minutes | 15 (2.7%) | 0 (0.0%) |
| 90 or more Minutes | 25 (4.5%) | 0 (0.0%) |
Time of Departure to Work by Sex in Jonesboro
The most frequent times of departure to work in Jonesboro are 6:30 AM to 6:59 AM (190, 34.4%) for males and 7:30 AM to 7:59 AM (124, 22.6%) for females.
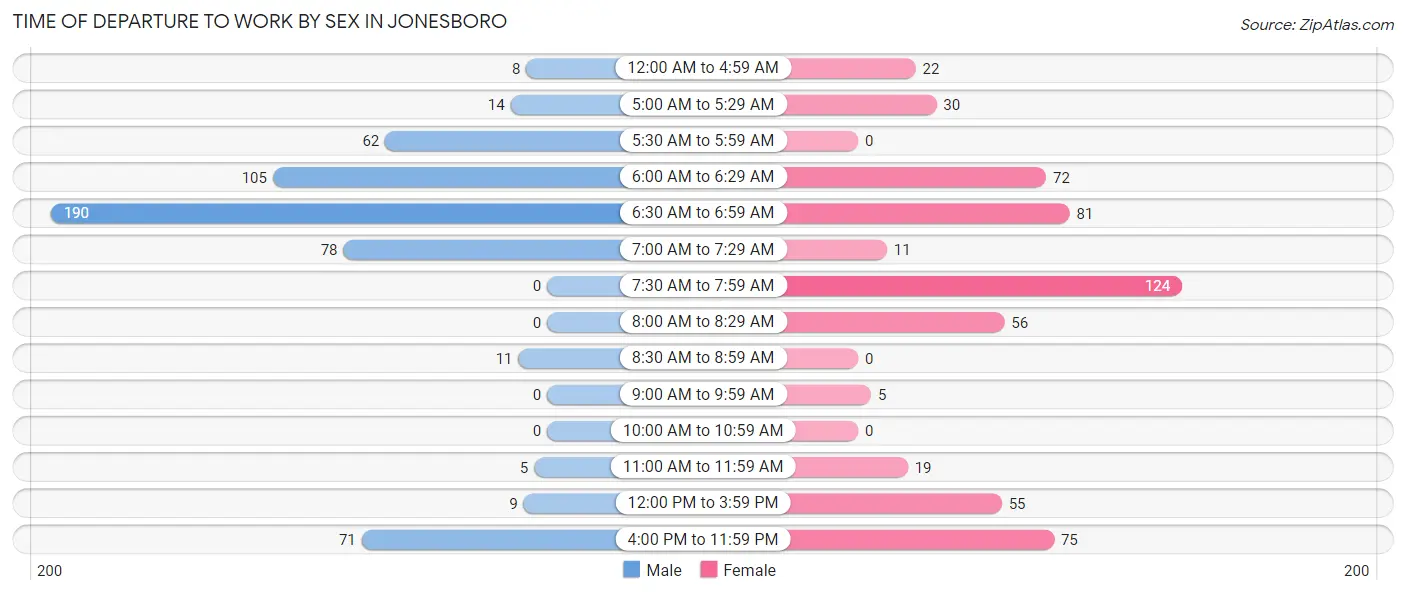
| Time of Departure | Male | Female |
| 12:00 AM to 4:59 AM | 8 (1.5%) | 22 (4.0%) |
| 5:00 AM to 5:29 AM | 14 (2.5%) | 30 (5.4%) |
| 5:30 AM to 5:59 AM | 62 (11.2%) | 0 (0.0%) |
| 6:00 AM to 6:29 AM | 105 (19.0%) | 72 (13.1%) |
| 6:30 AM to 6:59 AM | 190 (34.4%) | 81 (14.7%) |
| 7:00 AM to 7:29 AM | 78 (14.1%) | 11 (2.0%) |
| 7:30 AM to 7:59 AM | 0 (0.0%) | 124 (22.6%) |
| 8:00 AM to 8:29 AM | 0 (0.0%) | 56 (10.2%) |
| 8:30 AM to 8:59 AM | 11 (2.0%) | 0 (0.0%) |
| 9:00 AM to 9:59 AM | 0 (0.0%) | 5 (0.9%) |
| 10:00 AM to 10:59 AM | 0 (0.0%) | 0 (0.0%) |
| 11:00 AM to 11:59 AM | 5 (0.9%) | 19 (3.5%) |
| 12:00 PM to 3:59 PM | 9 (1.6%) | 55 (10.0%) |
| 4:00 PM to 11:59 PM | 71 (12.8%) | 75 (13.6%) |
| Total | 553 (100.0%) | 550 (100.0%) |
Housing Occupancy in Jonesboro
Occupancy by Ownership in Jonesboro
Of the total 1,311 dwellings in Jonesboro, owner-occupied units account for 501 (38.2%), while renter-occupied units make up 810 (61.8%).
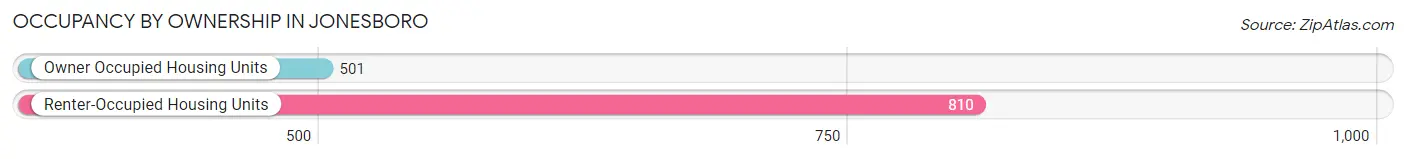
| Occupancy | # Housing Units | % Housing Units |
| Owner Occupied Housing Units | 501 | 38.2% |
| Renter-Occupied Housing Units | 810 | 61.8% |
| Total Occupied Housing Units | 1,311 | 100.0% |
Occupancy by Household Size in Jonesboro
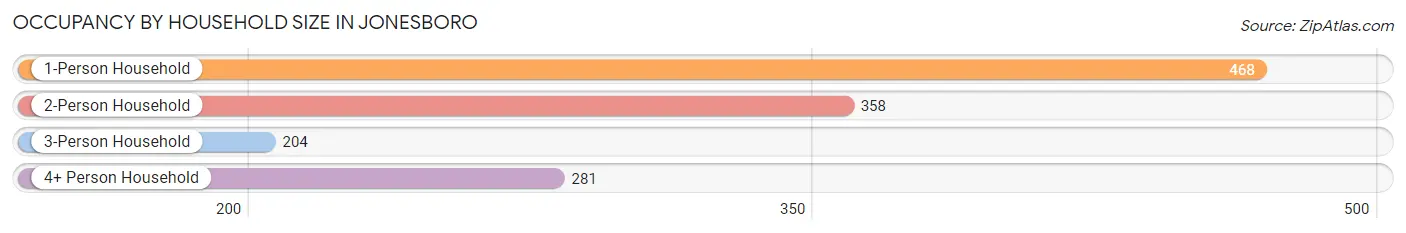
| Household Size | # Housing Units | % Housing Units |
| 1-Person Household | 468 | 35.7% |
| 2-Person Household | 358 | 27.3% |
| 3-Person Household | 204 | 15.6% |
| 4+ Person Household | 281 | 21.4% |
| Total Housing Units | 1,311 | 100.0% |
Occupancy by Ownership by Household Size in Jonesboro
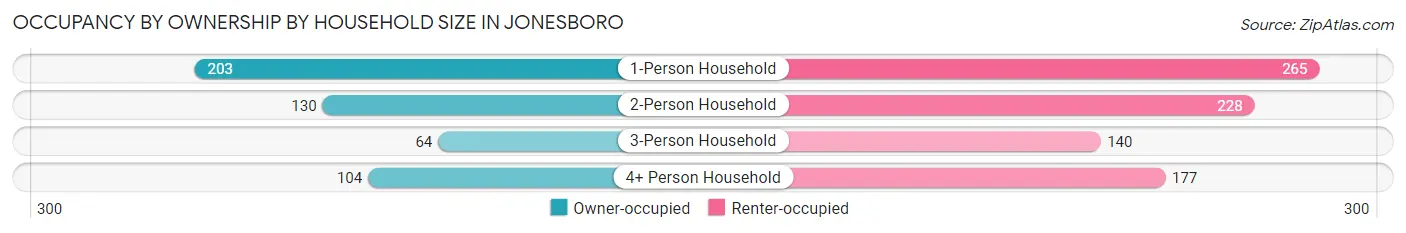
| Household Size | Owner-occupied | Renter-occupied |
| 1-Person Household | 203 (43.4%) | 265 (56.6%) |
| 2-Person Household | 130 (36.3%) | 228 (63.7%) |
| 3-Person Household | 64 (31.4%) | 140 (68.6%) |
| 4+ Person Household | 104 (37.0%) | 177 (63.0%) |
| Total Housing Units | 501 (38.2%) | 810 (61.8%) |
Occupancy by Educational Attainment in Jonesboro
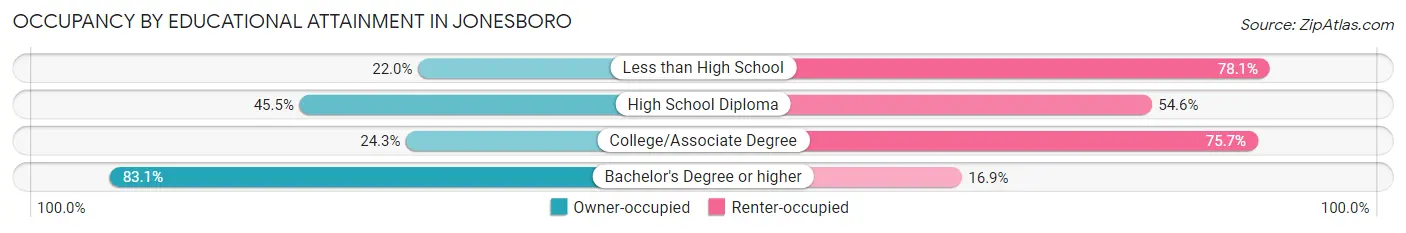
| Household Size | Owner-occupied | Renter-occupied |
| Less than High School | 45 (22.0%) | 160 (78.0%) |
| High School Diploma | 215 (45.5%) | 258 (54.5%) |
| College/Associate Degree | 118 (24.3%) | 367 (75.7%) |
| Bachelor's Degree or higher | 123 (83.1%) | 25 (16.9%) |
Occupancy by Age of Householder in Jonesboro
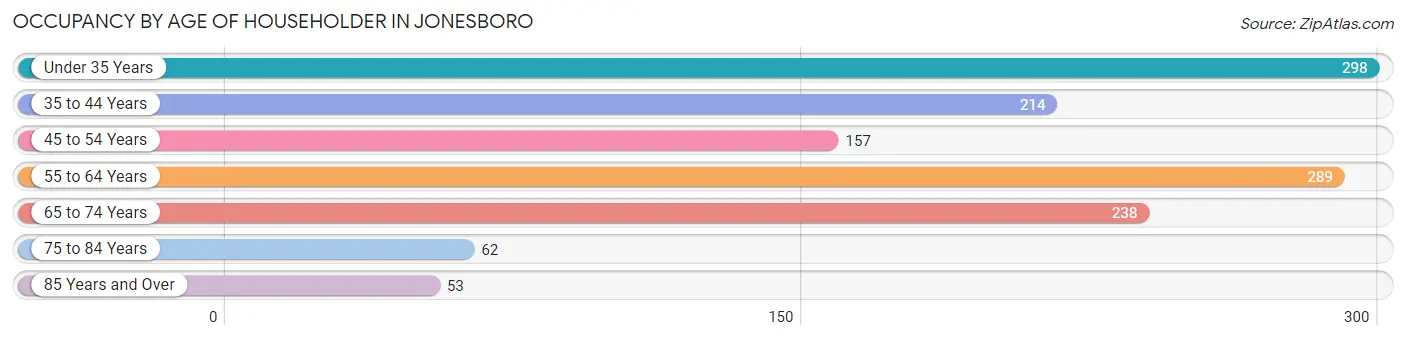
| Age Bracket | # Households | % Households |
| Under 35 Years | 298 | 22.7% |
| 35 to 44 Years | 214 | 16.3% |
| 45 to 54 Years | 157 | 12.0% |
| 55 to 64 Years | 289 | 22.0% |
| 65 to 74 Years | 238 | 18.1% |
| 75 to 84 Years | 62 | 4.7% |
| 85 Years and Over | 53 | 4.0% |
| Total | 1,311 | 100.0% |
Housing Finances in Jonesboro
Median Income by Occupancy in Jonesboro
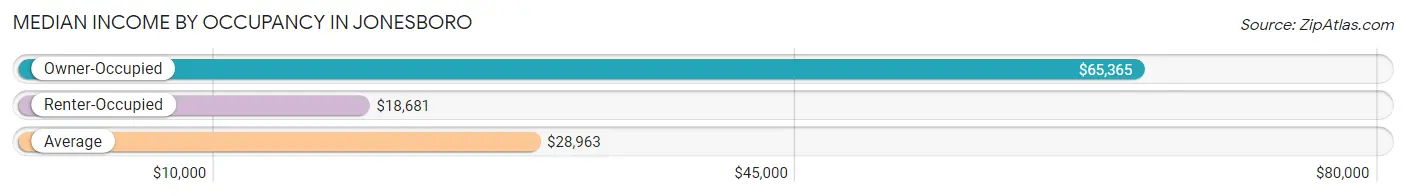
| Occupancy Type | # Households | Median Income |
| Owner-Occupied | 501 (38.2%) | $65,365 |
| Renter-Occupied | 810 (61.8%) | $18,681 |
| Average | 1,311 (100.0%) | $28,963 |
Occupancy by Householder Income Bracket in Jonesboro
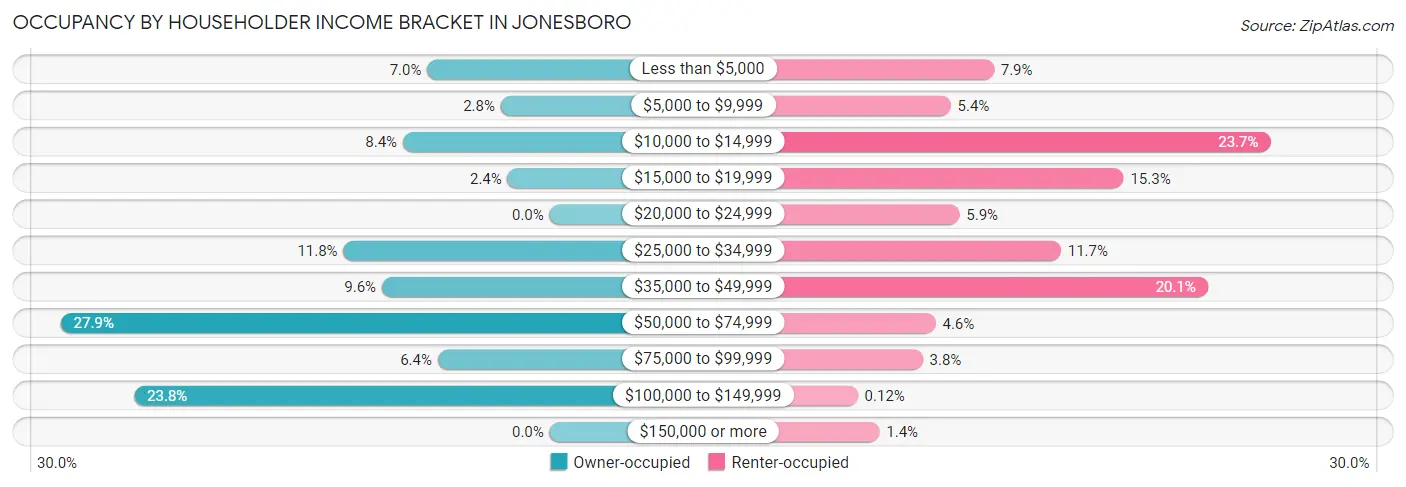
| Income Bracket | Owner-occupied | Renter-occupied |
| Less than $5,000 | 35 (7.0%) | 64 (7.9%) |
| $5,000 to $9,999 | 14 (2.8%) | 44 (5.4%) |
| $10,000 to $14,999 | 42 (8.4%) | 192 (23.7%) |
| $15,000 to $19,999 | 12 (2.4%) | 124 (15.3%) |
| $20,000 to $24,999 | 0 (0.0%) | 48 (5.9%) |
| $25,000 to $34,999 | 59 (11.8%) | 95 (11.7%) |
| $35,000 to $49,999 | 48 (9.6%) | 163 (20.1%) |
| $50,000 to $74,999 | 140 (27.9%) | 37 (4.6%) |
| $75,000 to $99,999 | 32 (6.4%) | 31 (3.8%) |
| $100,000 to $149,999 | 119 (23.7%) | 1 (0.1%) |
| $150,000 or more | 0 (0.0%) | 11 (1.4%) |
| Total | 501 (100.0%) | 810 (100.0%) |
Monthly Housing Cost Tiers in Jonesboro
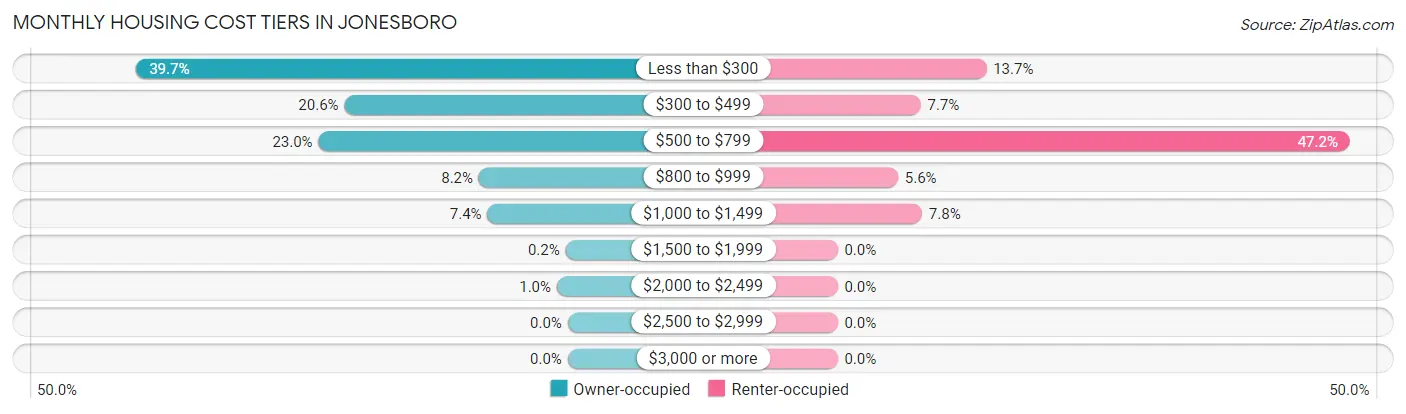
| Monthly Cost | Owner-occupied | Renter-occupied |
| Less than $300 | 199 (39.7%) | 111 (13.7%) |
| $300 to $499 | 103 (20.6%) | 62 (7.6%) |
| $500 to $799 | 115 (23.0%) | 382 (47.2%) |
| $800 to $999 | 41 (8.2%) | 45 (5.6%) |
| $1,000 to $1,499 | 37 (7.4%) | 63 (7.8%) |
| $1,500 to $1,999 | 1 (0.2%) | 0 (0.0%) |
| $2,000 to $2,499 | 5 (1.0%) | 0 (0.0%) |
| $2,500 to $2,999 | 0 (0.0%) | 0 (0.0%) |
| $3,000 or more | 0 (0.0%) | 0 (0.0%) |
| Total | 501 (100.0%) | 810 (100.0%) |
Physical Housing Characteristics in Jonesboro
Housing Structures in Jonesboro
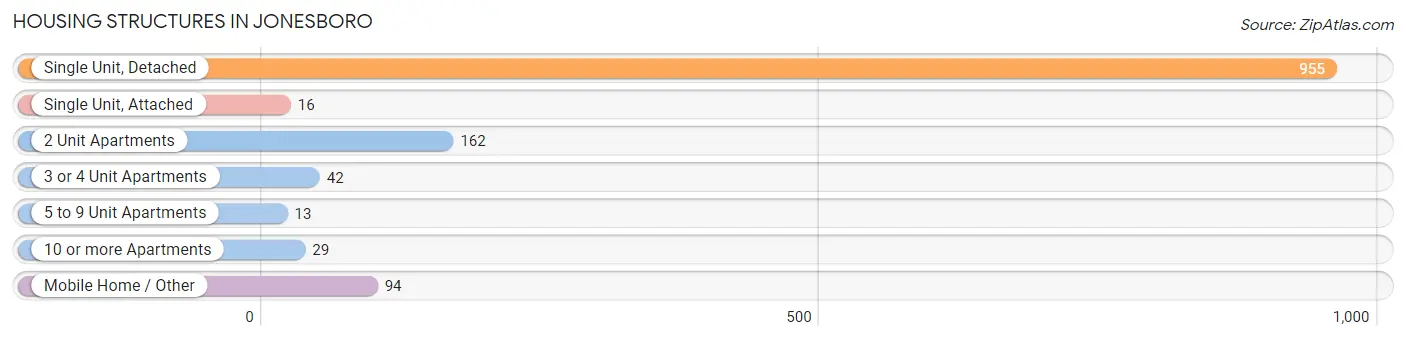
| Structure Type | # Housing Units | % Housing Units |
| Single Unit, Detached | 955 | 72.9% |
| Single Unit, Attached | 16 | 1.2% |
| 2 Unit Apartments | 162 | 12.4% |
| 3 or 4 Unit Apartments | 42 | 3.2% |
| 5 to 9 Unit Apartments | 13 | 1.0% |
| 10 or more Apartments | 29 | 2.2% |
| Mobile Home / Other | 94 | 7.2% |
| Total | 1,311 | 100.0% |
Housing Structures by Occupancy in Jonesboro
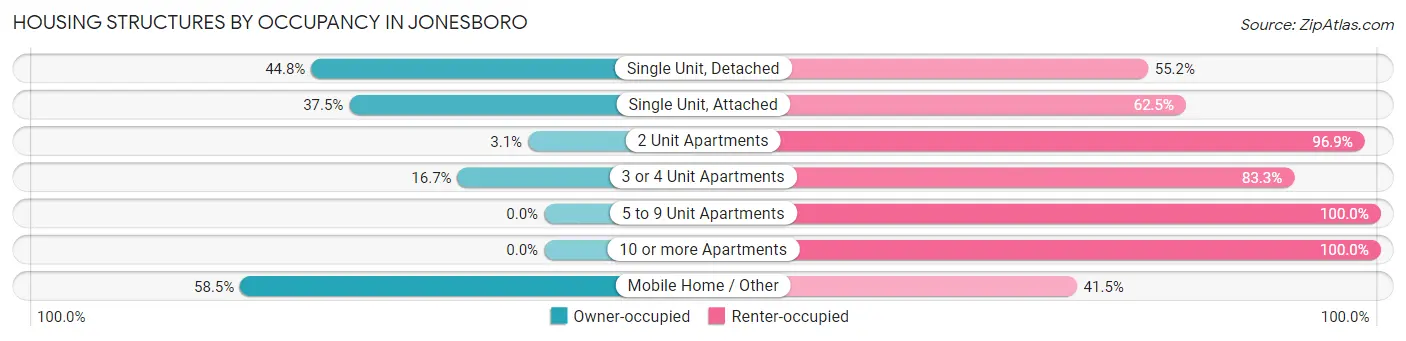
| Structure Type | Owner-occupied | Renter-occupied |
| Single Unit, Detached | 428 (44.8%) | 527 (55.2%) |
| Single Unit, Attached | 6 (37.5%) | 10 (62.5%) |
| 2 Unit Apartments | 5 (3.1%) | 157 (96.9%) |
| 3 or 4 Unit Apartments | 7 (16.7%) | 35 (83.3%) |
| 5 to 9 Unit Apartments | 0 (0.0%) | 13 (100.0%) |
| 10 or more Apartments | 0 (0.0%) | 29 (100.0%) |
| Mobile Home / Other | 55 (58.5%) | 39 (41.5%) |
| Total | 501 (38.2%) | 810 (61.8%) |
Housing Structures by Number of Rooms in Jonesboro
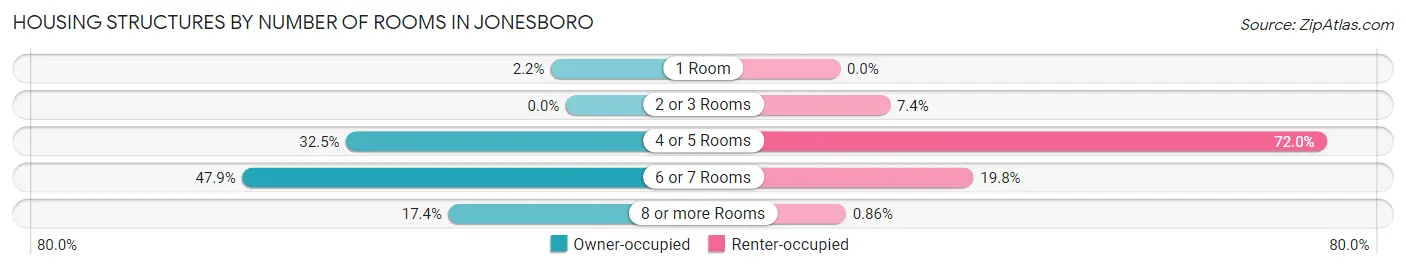
| Number of Rooms | Owner-occupied | Renter-occupied |
| 1 Room | 11 (2.2%) | 0 (0.0%) |
| 2 or 3 Rooms | 0 (0.0%) | 60 (7.4%) |
| 4 or 5 Rooms | 163 (32.5%) | 583 (72.0%) |
| 6 or 7 Rooms | 240 (47.9%) | 160 (19.8%) |
| 8 or more Rooms | 87 (17.4%) | 7 (0.9%) |
| Total | 501 (100.0%) | 810 (100.0%) |
Housing Structure by Heating Type in Jonesboro
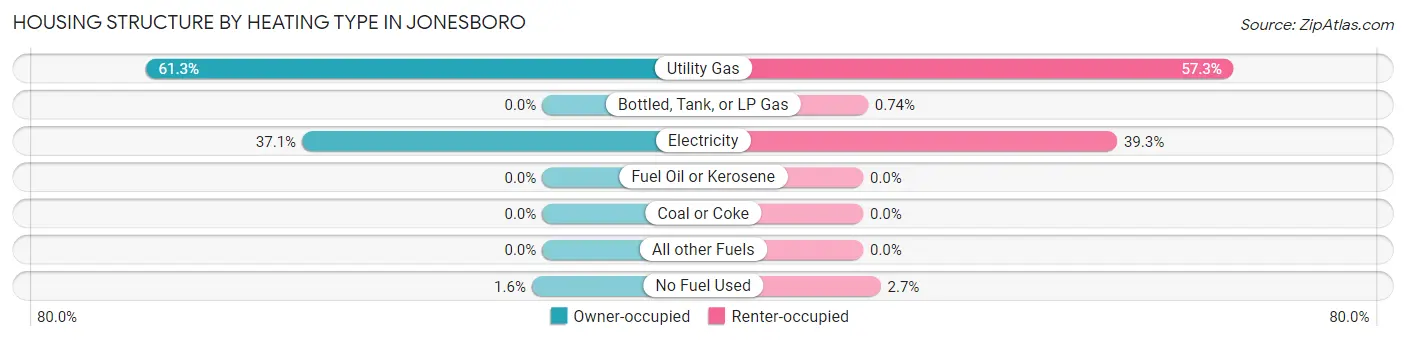
| Heating Type | Owner-occupied | Renter-occupied |
| Utility Gas | 307 (61.3%) | 464 (57.3%) |
| Bottled, Tank, or LP Gas | 0 (0.0%) | 6 (0.7%) |
| Electricity | 186 (37.1%) | 318 (39.3%) |
| Fuel Oil or Kerosene | 0 (0.0%) | 0 (0.0%) |
| Coal or Coke | 0 (0.0%) | 0 (0.0%) |
| All other Fuels | 0 (0.0%) | 0 (0.0%) |
| No Fuel Used | 8 (1.6%) | 22 (2.7%) |
| Total | 501 (100.0%) | 810 (100.0%) |
Household Vehicle Usage in Jonesboro

| Vehicles per Household | Owner-occupied | Renter-occupied |
| No Vehicle | 12 (2.4%) | 293 (36.2%) |
| 1 Vehicle | 167 (33.3%) | 424 (52.3%) |
| 2 Vehicles | 207 (41.3%) | 93 (11.5%) |
| 3 or more Vehicles | 115 (23.0%) | 0 (0.0%) |
| Total | 501 (100.0%) | 810 (100.0%) |
Real Estate & Mortgages in Jonesboro
Real Estate and Mortgage Overview in Jonesboro
| Characteristic | Without Mortgage | With Mortgage |
| Housing Units | 348 | 153 |
| Median Property Value | $91,800 | $84,500 |
| Median Household Income | $67,692 | $0 |
| Monthly Housing Costs | $274 | $0 |
| Real Estate Taxes | $199 | $52 |
Property Value by Mortgage Status in Jonesboro
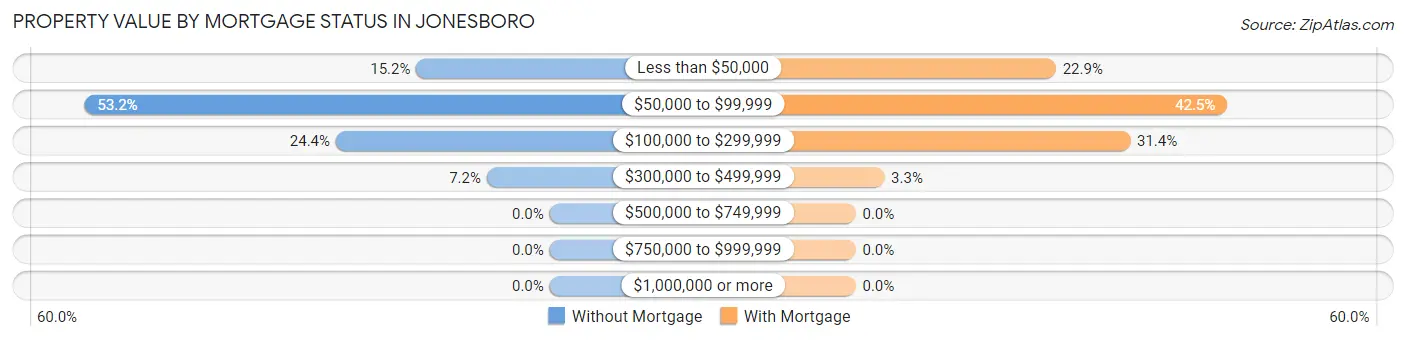
| Property Value | Without Mortgage | With Mortgage |
| Less than $50,000 | 53 (15.2%) | 35 (22.9%) |
| $50,000 to $99,999 | 185 (53.2%) | 65 (42.5%) |
| $100,000 to $299,999 | 85 (24.4%) | 48 (31.4%) |
| $300,000 to $499,999 | 25 (7.2%) | 5 (3.3%) |
| $500,000 to $749,999 | 0 (0.0%) | 0 (0.0%) |
| $750,000 to $999,999 | 0 (0.0%) | 0 (0.0%) |
| $1,000,000 or more | 0 (0.0%) | 0 (0.0%) |
| Total | 348 (100.0%) | 153 (100.0%) |
Household Income by Mortgage Status in Jonesboro
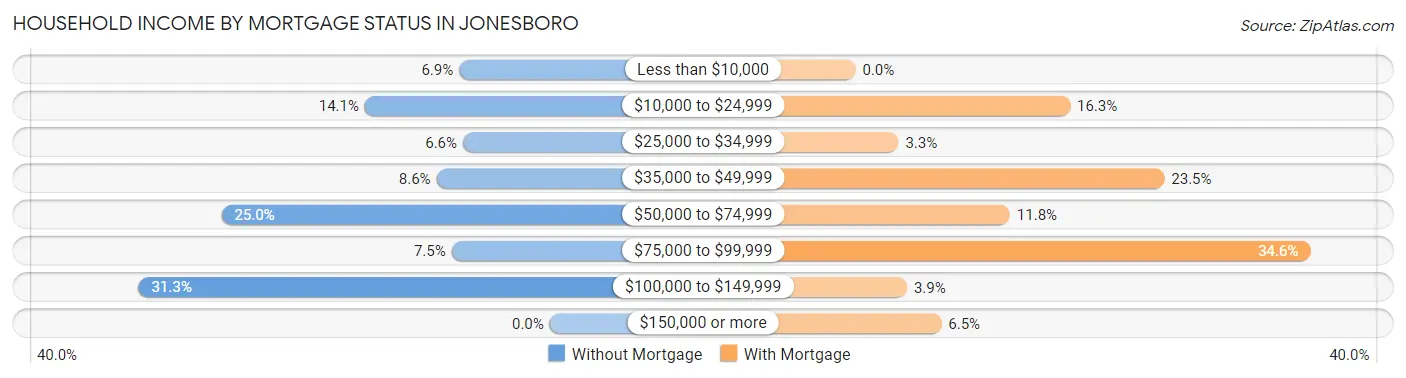
| Household Income | Without Mortgage | With Mortgage |
| Less than $10,000 | 24 (6.9%) | 0 (0.0%) |
| $10,000 to $24,999 | 49 (14.1%) | 25 (16.3%) |
| $25,000 to $34,999 | 23 (6.6%) | 5 (3.3%) |
| $35,000 to $49,999 | 30 (8.6%) | 36 (23.5%) |
| $50,000 to $74,999 | 87 (25.0%) | 18 (11.8%) |
| $75,000 to $99,999 | 26 (7.5%) | 53 (34.6%) |
| $100,000 to $149,999 | 109 (31.3%) | 6 (3.9%) |
| $150,000 or more | 0 (0.0%) | 10 (6.5%) |
| Total | 348 (100.0%) | 153 (100.0%) |
Property Value to Household Income Ratio in Jonesboro
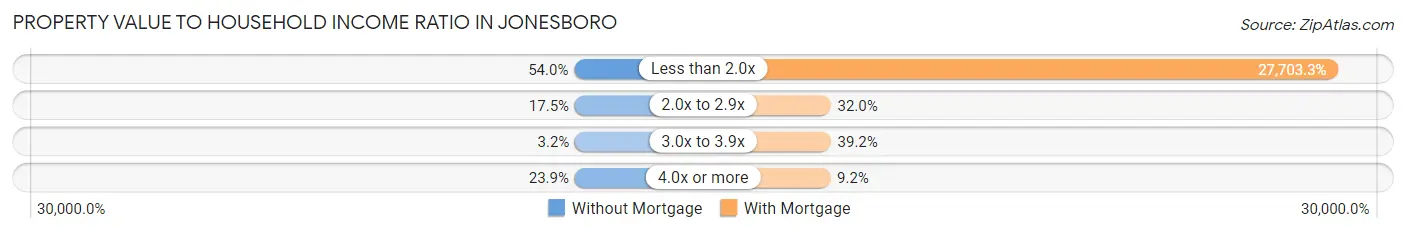
| Value-to-Income Ratio | Without Mortgage | With Mortgage |
| Less than 2.0x | 188 (54.0%) | 42,386 (27,703.3%) |
| 2.0x to 2.9x | 61 (17.5%) | 49 (32.0%) |
| 3.0x to 3.9x | 11 (3.2%) | 60 (39.2%) |
| 4.0x or more | 83 (23.8%) | 14 (9.1%) |
| Total | 348 (100.0%) | 153 (100.0%) |
Real Estate Taxes by Mortgage Status in Jonesboro
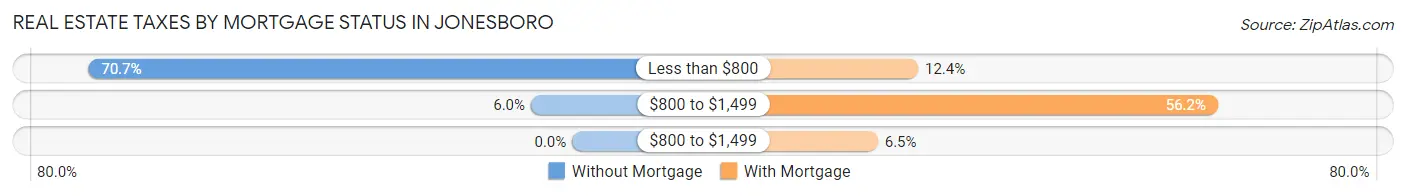
| Property Taxes | Without Mortgage | With Mortgage |
| Less than $800 | 246 (70.7%) | 19 (12.4%) |
| $800 to $1,499 | 21 (6.0%) | 86 (56.2%) |
| $800 to $1,499 | 0 (0.0%) | 10 (6.5%) |
| Total | 348 (100.0%) | 153 (100.0%) |
Health & Disability in Jonesboro
Health Insurance Coverage by Age in Jonesboro
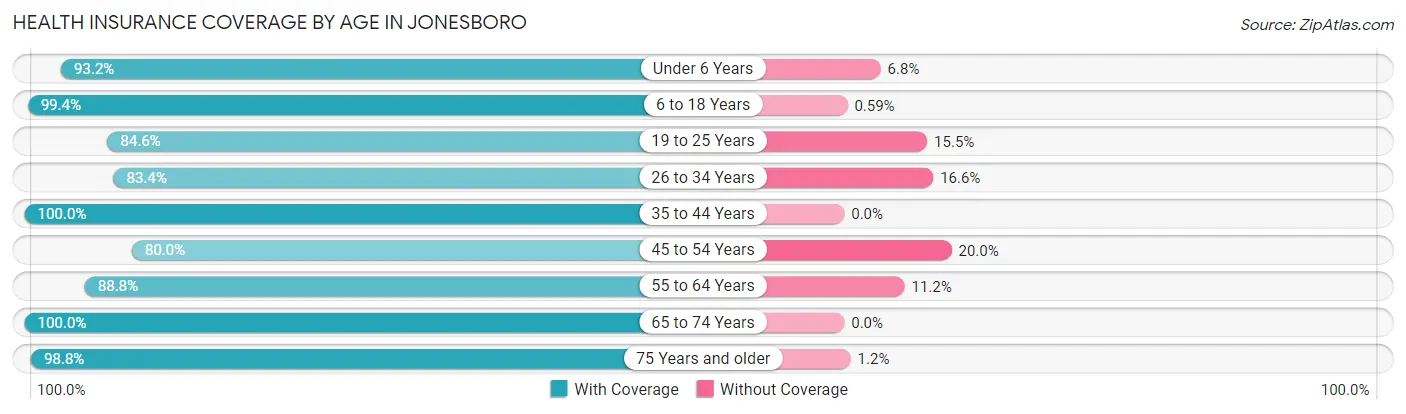
| Age Bracket | With Coverage | Without Coverage |
| Under 6 Years | 330 (93.2%) | 24 (6.8%) |
| 6 to 18 Years | 507 (99.4%) | 3 (0.6%) |
| 19 to 25 Years | 104 (84.6%) | 19 (15.4%) |
| 26 to 34 Years | 508 (83.4%) | 101 (16.6%) |
| 35 to 44 Years | 282 (100.0%) | 0 (0.0%) |
| 45 to 54 Years | 192 (80.0%) | 48 (20.0%) |
| 55 to 64 Years | 450 (88.8%) | 57 (11.2%) |
| 65 to 74 Years | 367 (100.0%) | 0 (0.0%) |
| 75 Years and older | 249 (98.8%) | 3 (1.2%) |
| Total | 2,989 (92.1%) | 255 (7.9%) |
Health Insurance Coverage by Citizenship Status in Jonesboro
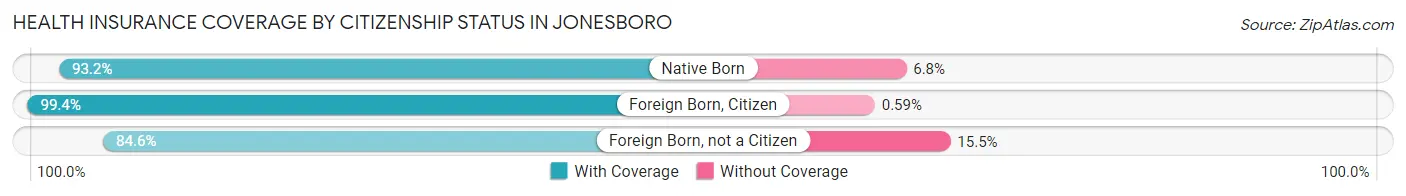
| Citizenship Status | With Coverage | Without Coverage |
| Native Born | 330 (93.2%) | 24 (6.8%) |
| Foreign Born, Citizen | 507 (99.4%) | 3 (0.6%) |
| Foreign Born, not a Citizen | 104 (84.6%) | 19 (15.4%) |
Health Insurance Coverage by Household Income in Jonesboro
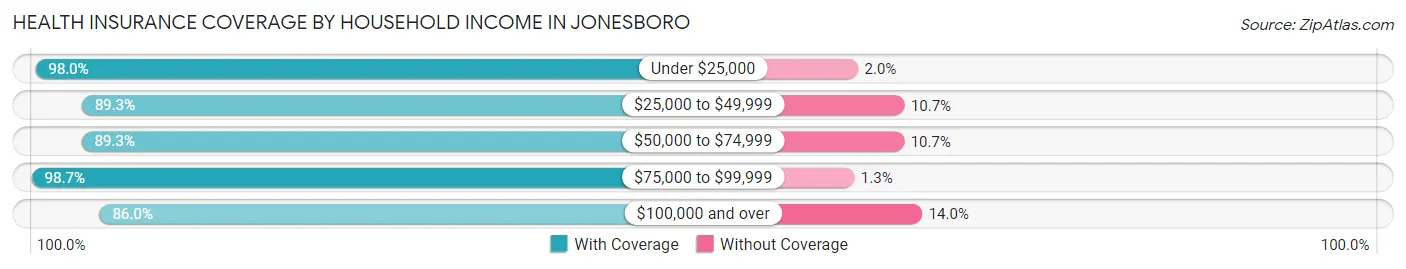
| Household Income | With Coverage | Without Coverage |
| Under $25,000 | 1,069 (98.0%) | 22 (2.0%) |
| $25,000 to $49,999 | 750 (89.3%) | 90 (10.7%) |
| $50,000 to $74,999 | 444 (89.3%) | 53 (10.7%) |
| $75,000 to $99,999 | 223 (98.7%) | 3 (1.3%) |
| $100,000 and over | 490 (86.0%) | 80 (14.0%) |
Public vs Private Health Insurance Coverage by Age in Jonesboro
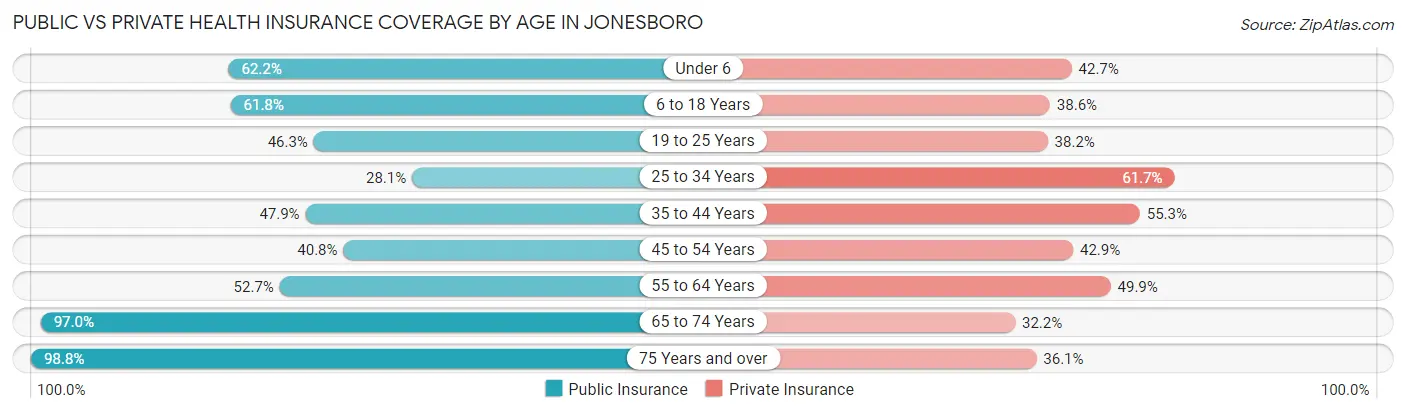
| Age Bracket | Public Insurance | Private Insurance |
| Under 6 | 220 (62.2%) | 151 (42.7%) |
| 6 to 18 Years | 315 (61.8%) | 197 (38.6%) |
| 19 to 25 Years | 57 (46.3%) | 47 (38.2%) |
| 25 to 34 Years | 171 (28.1%) | 376 (61.7%) |
| 35 to 44 Years | 135 (47.9%) | 156 (55.3%) |
| 45 to 54 Years | 98 (40.8%) | 103 (42.9%) |
| 55 to 64 Years | 267 (52.7%) | 253 (49.9%) |
| 65 to 74 Years | 356 (97.0%) | 118 (32.2%) |
| 75 Years and over | 249 (98.8%) | 91 (36.1%) |
| Total | 1,868 (57.6%) | 1,492 (46.0%) |
Disability Status by Sex by Age in Jonesboro
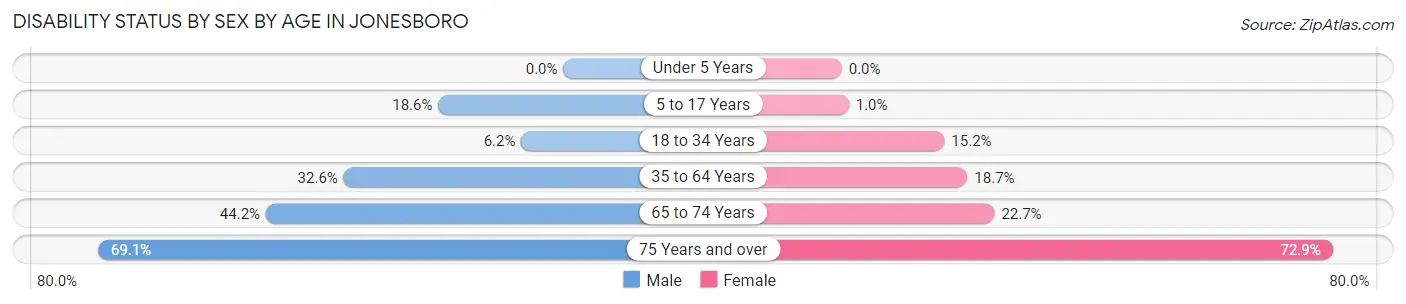
| Age Bracket | Male | Female |
| Under 5 Years | 0 (0.0%) | 0 (0.0%) |
| 5 to 17 Years | 44 (18.6%) | 3 (1.0%) |
| 18 to 34 Years | 26 (6.2%) | 48 (15.2%) |
| 35 to 64 Years | 138 (32.6%) | 113 (18.6%) |
| 65 to 74 Years | 53 (44.2%) | 56 (22.7%) |
| 75 Years and over | 85 (69.1%) | 94 (72.9%) |
Disability Class by Sex by Age in Jonesboro
Disability Class: Hearing Difficulty
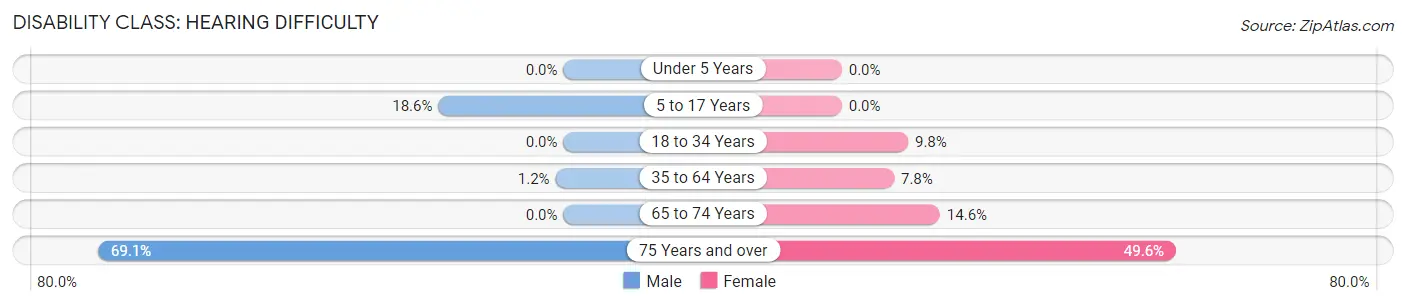
| Age Bracket | Male | Female |
| Under 5 Years | 0 (0.0%) | 0 (0.0%) |
| 5 to 17 Years | 44 (18.6%) | 0 (0.0%) |
| 18 to 34 Years | 0 (0.0%) | 31 (9.8%) |
| 35 to 64 Years | 5 (1.2%) | 47 (7.8%) |
| 65 to 74 Years | 0 (0.0%) | 36 (14.6%) |
| 75 Years and over | 85 (69.1%) | 64 (49.6%) |
Disability Class: Vision Difficulty
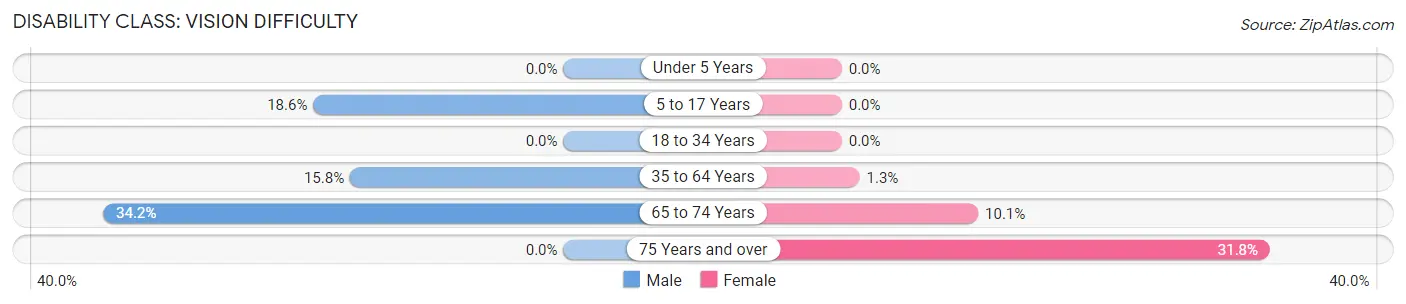
| Age Bracket | Male | Female |
| Under 5 Years | 0 (0.0%) | 0 (0.0%) |
| 5 to 17 Years | 44 (18.6%) | 0 (0.0%) |
| 18 to 34 Years | 0 (0.0%) | 0 (0.0%) |
| 35 to 64 Years | 67 (15.8%) | 8 (1.3%) |
| 65 to 74 Years | 41 (34.2%) | 25 (10.1%) |
| 75 Years and over | 0 (0.0%) | 41 (31.8%) |
Disability Class: Cognitive Difficulty
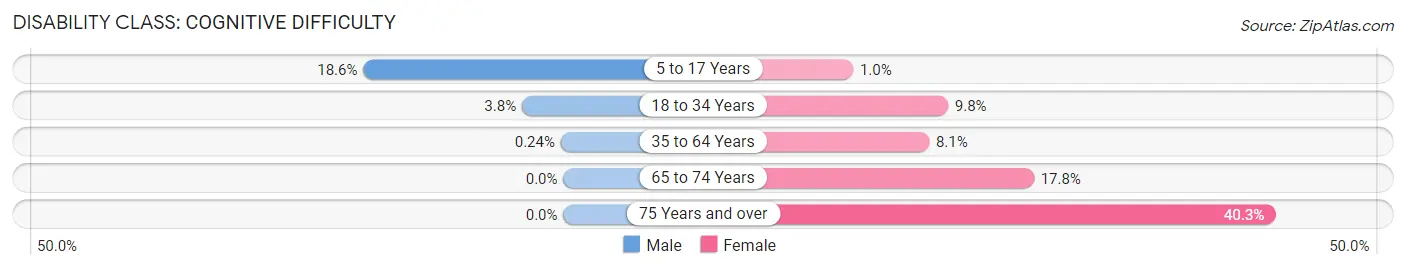
| Age Bracket | Male | Female |
| 5 to 17 Years | 44 (18.6%) | 3 (1.0%) |
| 18 to 34 Years | 16 (3.8%) | 31 (9.8%) |
| 35 to 64 Years | 1 (0.2%) | 49 (8.1%) |
| 65 to 74 Years | 0 (0.0%) | 44 (17.8%) |
| 75 Years and over | 0 (0.0%) | 52 (40.3%) |
Disability Class: Ambulatory Difficulty
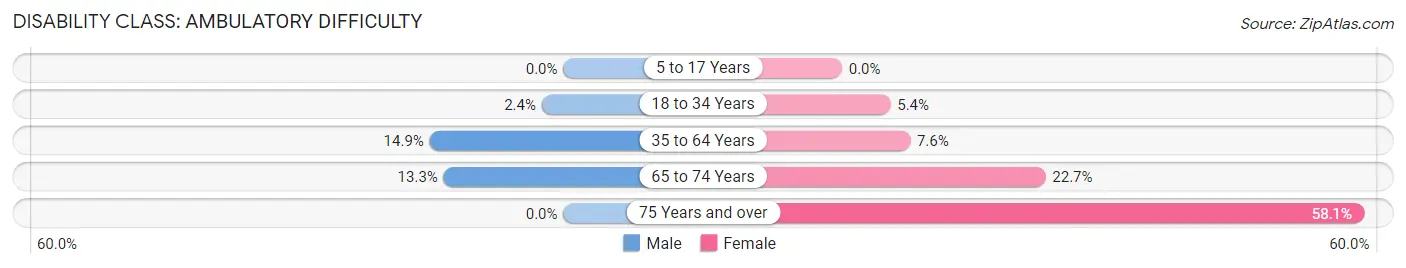
| Age Bracket | Male | Female |
| 5 to 17 Years | 0 (0.0%) | 0 (0.0%) |
| 18 to 34 Years | 10 (2.4%) | 17 (5.4%) |
| 35 to 64 Years | 63 (14.9%) | 46 (7.6%) |
| 65 to 74 Years | 16 (13.3%) | 56 (22.7%) |
| 75 Years and over | 0 (0.0%) | 75 (58.1%) |
Disability Class: Self-Care Difficulty
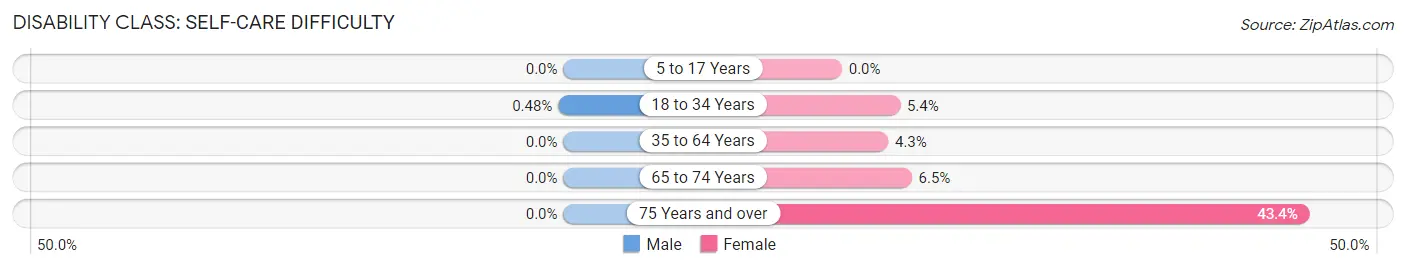
| Age Bracket | Male | Female |
| 5 to 17 Years | 0 (0.0%) | 0 (0.0%) |
| 18 to 34 Years | 2 (0.5%) | 17 (5.4%) |
| 35 to 64 Years | 0 (0.0%) | 26 (4.3%) |
| 65 to 74 Years | 0 (0.0%) | 16 (6.5%) |
| 75 Years and over | 0 (0.0%) | 56 (43.4%) |
Technology Access in Jonesboro
Computing Device Access in Jonesboro
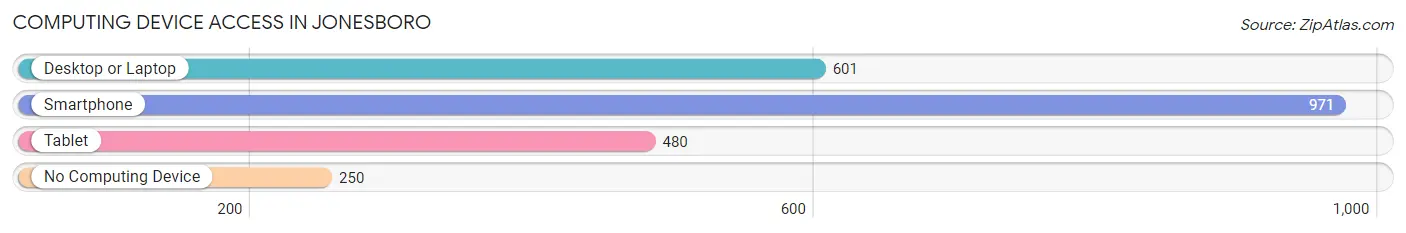
| Device Type | # Households | % Households |
| Desktop or Laptop | 601 | 45.8% |
| Smartphone | 971 | 74.1% |
| Tablet | 480 | 36.6% |
| No Computing Device | 250 | 19.1% |
| Total | 1,311 | 100.0% |
Internet Access in Jonesboro
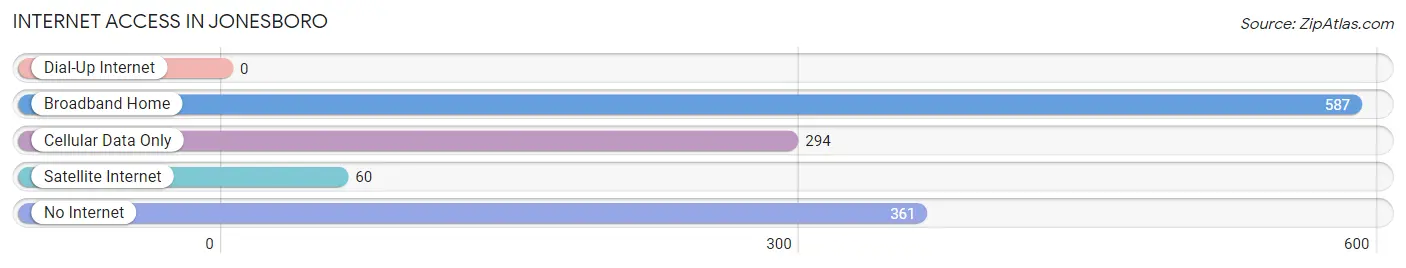
| Internet Type | # Households | % Households |
| Dial-Up Internet | 0 | 0.0% |
| Broadband Home | 587 | 44.8% |
| Cellular Data Only | 294 | 22.4% |
| Satellite Internet | 60 | 4.6% |
| No Internet | 361 | 27.5% |
| Total | 1,311 | 100.0% |
Jonesboro Summary
Jonesboro is a town located in Jackson Parish, Louisiana, United States. It is the parish seat of Jackson Parish and is located in the northern part of the state. The population of Jonesboro was 3,914 at the 2010 census.
History
Jonesboro was founded in 1858 by Dr. William Jones, a prominent physician and planter from nearby Monroe. The town was named after him and was incorporated in 1871. Jonesboro was the site of the Battle of Jonesboro during the Civil War, which was fought on April 28, 1864. The battle was a Confederate victory and resulted in the capture of Union General Nathaniel Banks.
Geography
Jonesboro is located at 32°25'25" North, 92°37'17" West (32.423, -92.621). According to the United States Census Bureau, the town has a total area of 3.2 square miles (8.3 km2), all land.
Economy
The economy of Jonesboro is largely based on agriculture and timber. The town is home to several large timber companies, including Weyerhaeuser and International Paper. The town is also home to several small businesses, including restaurants, retail stores, and service providers.
Demographics
As of the census of 2000, there were 3,914 people, 1,541 households, and 1,039 families residing in the town. The population density was 1,219.2 people per square mile (470.2/km2). There were 1,717 housing units at an average density of 535.2 per square mile (206.7/km2). The racial makeup of the town was 57.45% White, 40.90% African American, 0.18% Native American, 0.36% Asian, 0.03% Pacific Islander, 0.36% from other races, and 0.72% from two or more races. Hispanic or Latino of any race were 1.08% of the population.
There were 1,541 households, out of which 32.2% had children under the age of 18 living with them, 43.2% were married couples living together, 19.2% had a female householder with no husband present, and 33.2% were non-families. 29.7% of all households were made up of individuals, and 14.2% had someone living alone who was 65 years of age or older. The average household size was 2.50 and the average family size was 3.09.
In the town, the population was spread out, with 27.2% under the age of 18, 8.7% from 18 to 24, 25.2% from 25 to 44, 22.2% from 45 to 64, and 16.7% who were 65 years of age or older. The median age was 37 years. For every 100 females, there were 86.2 males. For every 100 females age 18 and over, there were 79.7 males.
The median income for a household in the town was $25,938, and the median income for a family was $32,917. Males had a median income of $30,000 versus $19,917 for females. The per capita income for the town was $14,845. About 18.2% of families and 22.2% of the population were below the poverty line, including 28.2% of those under age 18 and 20.2% of those age 65 or over.
Common Questions
What is Per Capita Income in Jonesboro?
Per Capita income in Jonesboro is $16,716.
What is the Median Family Income in Jonesboro?
Median Family Income in Jonesboro is $36,062.
What is the Median Household income in Jonesboro?
Median Household Income in Jonesboro is $28,963.
What is Income or Wage Gap in Jonesboro?
Income or Wage Gap in Jonesboro is 32.0%.
Women in Jonesboro earn 68.0 cents for every dollar earned by a man.
What is Family Income Deficit in Jonesboro?
Family Income Deficit in Jonesboro is $8,713.
Families that are below poverty line in Jonesboro earn $8,713 less on average than the poverty threshold level.
What is Inequality or Gini Index in Jonesboro?
Inequality or Gini Index in Jonesboro is 0.49.
What is the Total Population of Jonesboro?
Total Population of Jonesboro is 4,135.
What is the Total Male Population of Jonesboro?
Total Male Population of Jonesboro is 2,220.
What is the Total Female Population of Jonesboro?
Total Female Population of Jonesboro is 1,915.
What is the Ratio of Males per 100 Females in Jonesboro?
There are 115.93 Males per 100 Females in Jonesboro.
What is the Ratio of Females per 100 Males in Jonesboro?
There are 86.26 Females per 100 Males in Jonesboro.
What is the Median Population Age in Jonesboro?
Median Population Age in Jonesboro is 36.5 Years.
What is the Average Family Size in Jonesboro
Average Family Size in Jonesboro is 3.2 People.
What is the Average Household Size in Jonesboro
Average Household Size in Jonesboro is 2.5 People.
How Large is the Labor Force in Jonesboro?
There are 1,163 People in the Labor Forcein in Jonesboro.
What is the Percentage of People in the Labor Force in Jonesboro?
34.5% of People are in the Labor Force in Jonesboro.
What is the Unemployment Rate in Jonesboro?
Unemployment Rate in Jonesboro is 1.5%.