Homer, LA Map & Demographics
Homer Map
Homer Overview
$18,752
PER CAPITA INCOME
$32,813
AVG FAMILY INCOME
$20,723
AVG HOUSEHOLD INCOME
34.6%
WAGE / INCOME GAP [ % ]
65.4¢/ $1
WAGE / INCOME GAP [ $ ]
0.62
INEQUALITY / GINI INDEX
2,739
TOTAL POPULATION
1,401
MALE POPULATION
1,338
FEMALE POPULATION
104.71
MALES / 100 FEMALES
95.50
FEMALES / 100 MALES
26.9
MEDIAN AGE
3.7
AVG FAMILY SIZE
2.8
AVG HOUSEHOLD SIZE
878
LABOR FORCE [ PEOPLE ]
47.0%
PERCENT IN LABOR FORCE
5.2%
UNEMPLOYMENT RATE
Homer Zip Codes
Homer Area Codes
Income in Homer
Income Overview in Homer
Per Capita Income in Homer is $18,752, while median incomes of families and households are $32,813 and $20,723 respectively.
| Characteristic | Number | Measure |
| Per Capita Income | 2,739 | $18,752 |
| Median Family Income | 576 | $32,813 |
| Mean Family Income | 576 | $64,785 |
| Median Household Income | 973 | $20,723 |
| Mean Household Income | 973 | $48,404 |
| Income Deficit | 576 | $0 |
| Wage / Income Gap (%) | 2,739 | 34.60% |
| Wage / Income Gap ($) | 2,739 | 65.40¢ per $1 |
| Gini / Inequality Index | 2,739 | 0.62 |
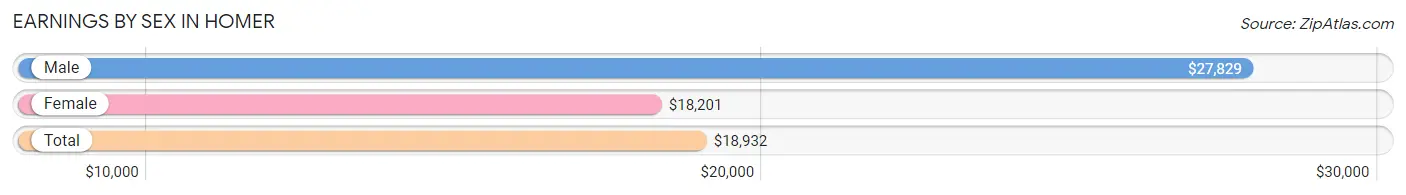
Earnings by Sex in Homer
Average Earnings in Homer are $18,932, $27,829 for men and $18,201 for women, a difference of 34.6%.
| Sex | Number | Average Earnings |
| Male | 361 (41.5%) | $27,829 |
| Female | 509 (58.5%) | $18,201 |
| Total | 870 (100.0%) | $18,932 |
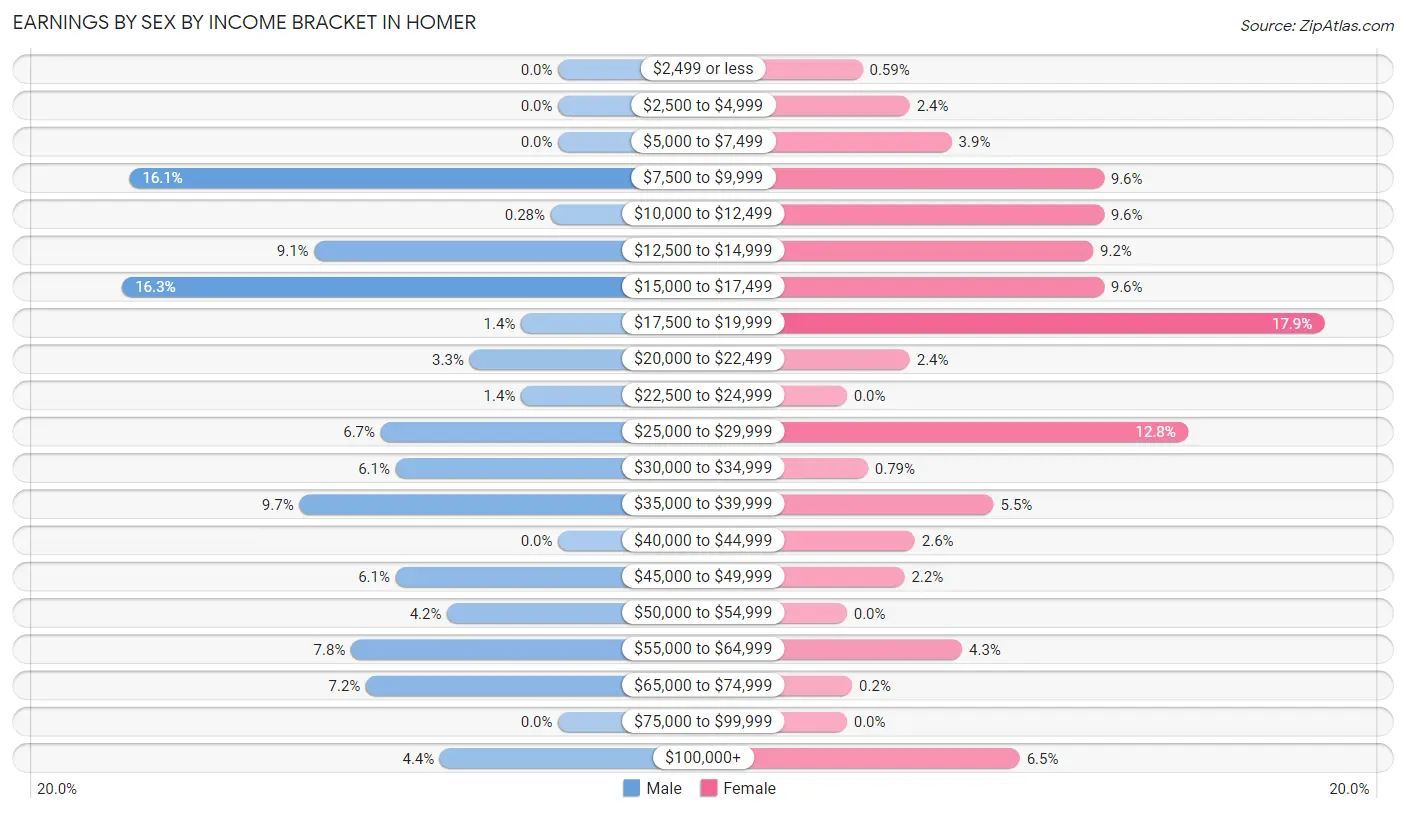
Earnings by Sex by Income Bracket in Homer
The most common earnings brackets in Homer are $15,000 to $17,499 for men (59 | 16.3%) and $17,500 to $19,999 for women (91 | 17.9%).
| Income | Male | Female |
| $2,499 or less | 0 (0.0%) | 3 (0.6%) |
| $2,500 to $4,999 | 0 (0.0%) | 12 (2.4%) |
| $5,000 to $7,499 | 0 (0.0%) | 20 (3.9%) |
| $7,500 to $9,999 | 58 (16.1%) | 49 (9.6%) |
| $10,000 to $12,499 | 1 (0.3%) | 49 (9.6%) |
| $12,500 to $14,999 | 33 (9.1%) | 47 (9.2%) |
| $15,000 to $17,499 | 59 (16.3%) | 49 (9.6%) |
| $17,500 to $19,999 | 5 (1.4%) | 91 (17.9%) |
| $20,000 to $22,499 | 12 (3.3%) | 12 (2.4%) |
| $22,500 to $24,999 | 5 (1.4%) | 0 (0.0%) |
| $25,000 to $29,999 | 24 (6.7%) | 65 (12.8%) |
| $30,000 to $34,999 | 22 (6.1%) | 4 (0.8%) |
| $35,000 to $39,999 | 35 (9.7%) | 28 (5.5%) |
| $40,000 to $44,999 | 0 (0.0%) | 13 (2.5%) |
| $45,000 to $49,999 | 22 (6.1%) | 11 (2.2%) |
| $50,000 to $54,999 | 15 (4.2%) | 0 (0.0%) |
| $55,000 to $64,999 | 28 (7.8%) | 22 (4.3%) |
| $65,000 to $74,999 | 26 (7.2%) | 1 (0.2%) |
| $75,000 to $99,999 | 0 (0.0%) | 0 (0.0%) |
| $100,000+ | 16 (4.4%) | 33 (6.5%) |
| Total | 361 (100.0%) | 509 (100.0%) |
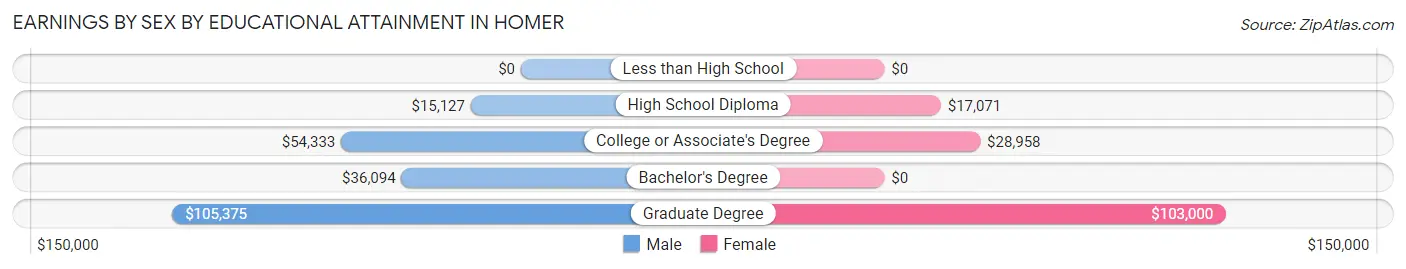
Earnings by Sex by Educational Attainment in Homer
Average earnings in Homer are $27,632 for men and $18,723 for women, a difference of 32.2%. Men with an educational attainment of graduate degree enjoy the highest average annual earnings of $105,375, while those with high school diploma education earn the least with $15,127. Women with an educational attainment of graduate degree earn the most with the average annual earnings of $103,000, while those with high school diploma education have the smallest earnings of $17,071.
| Educational Attainment | Male Income | Female Income |
| Less than High School | - | - |
| High School Diploma | $15,127 | $17,071 |
| College or Associate's Degree | $54,333 | $28,958 |
| Bachelor's Degree | $36,094 | $0 |
| Graduate Degree | $105,375 | $103,000 |
| Total | $27,632 | $18,723 |
Family Income in Homer
Family Income Brackets in Homer
According to the Homer family income data, there are 107 families falling into the less than $10,000 income range, which is the most common income bracket and makes up 18.6% of all families. Conversely, the $200,000+ income bracket is the least frequent group with only 6 families (1.0%) belonging to this category.
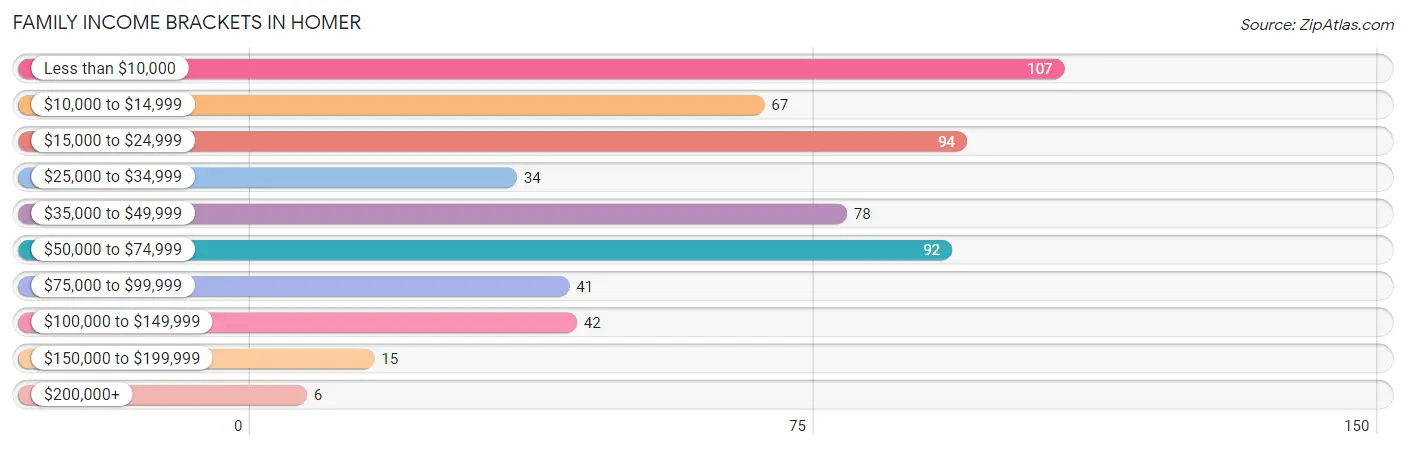
| Income Bracket | # Families | % Families |
| Less than $10,000 | 107 | 18.6% |
| $10,000 to $14,999 | 67 | 11.6% |
| $15,000 to $24,999 | 94 | 16.3% |
| $25,000 to $34,999 | 34 | 5.9% |
| $35,000 to $49,999 | 78 | 13.5% |
| $50,000 to $74,999 | 92 | 16.0% |
| $75,000 to $99,999 | 41 | 7.1% |
| $100,000 to $149,999 | 42 | 7.3% |
| $150,000 to $199,999 | 15 | 2.6% |
| $200,000+ | 6 | 1.0% |
Family Income by Famaliy Size in Homer
2-person families (240 | 41.7%) account for the highest median family income in Homer with $51,875 per family, while 2-person families (240 | 41.7%) have the highest median income of $25,938 per family member.
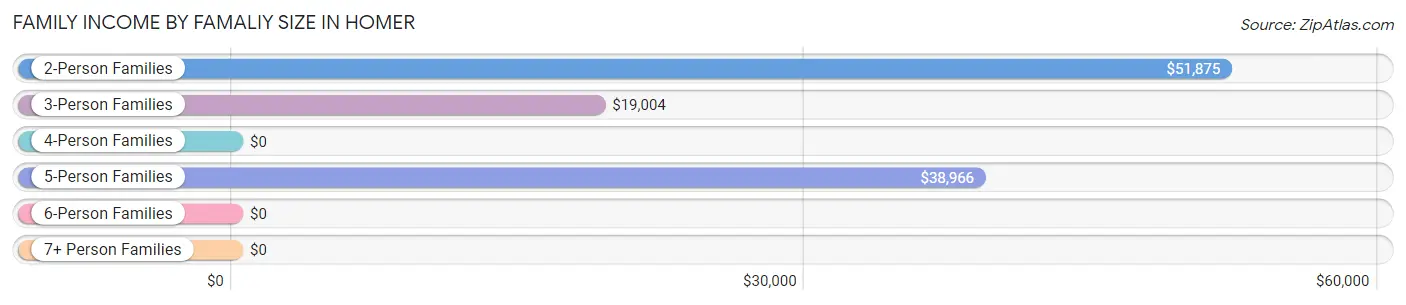
| Income Bracket | # Families | Median Income |
| 2-Person Families | 240 (41.7%) | $51,875 |
| 3-Person Families | 231 (40.1%) | $19,004 |
| 4-Person Families | 9 (1.6%) | $0 |
| 5-Person Families | 78 (13.5%) | $38,966 |
| 6-Person Families | 18 (3.1%) | $0 |
| 7+ Person Families | 0 (0.0%) | $0 |
| Total | 576 (100.0%) | $32,813 |
Family Income by Number of Earners in Homer
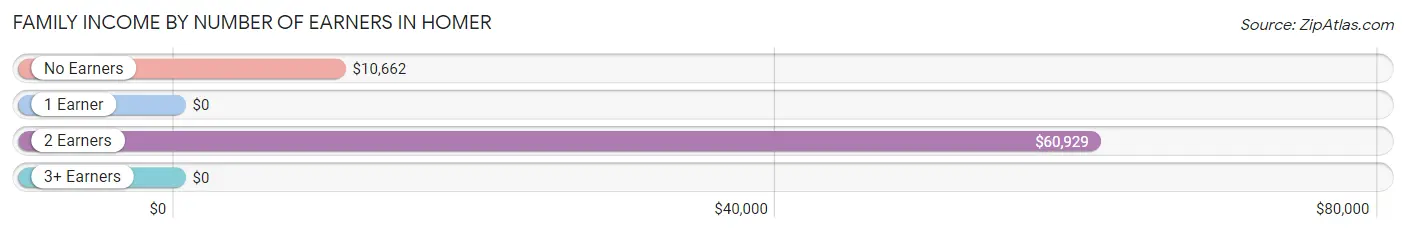
| Number of Earners | # Families | Median Income |
| No Earners | 207 (35.9%) | $10,662 |
| 1 Earner | 189 (32.8%) | $0 |
| 2 Earners | 168 (29.2%) | $60,929 |
| 3+ Earners | 12 (2.1%) | $0 |
| Total | 576 (100.0%) | $32,813 |
Household Income in Homer
Household Income Brackets in Homer
With 227 households falling in the category, the $15,000 to $24,999 income range is the most frequent in Homer, accounting for 23.3% of all households. In contrast, only 6 households (0.6%) fall into the $200,000+ income bracket, making it the least populous group.
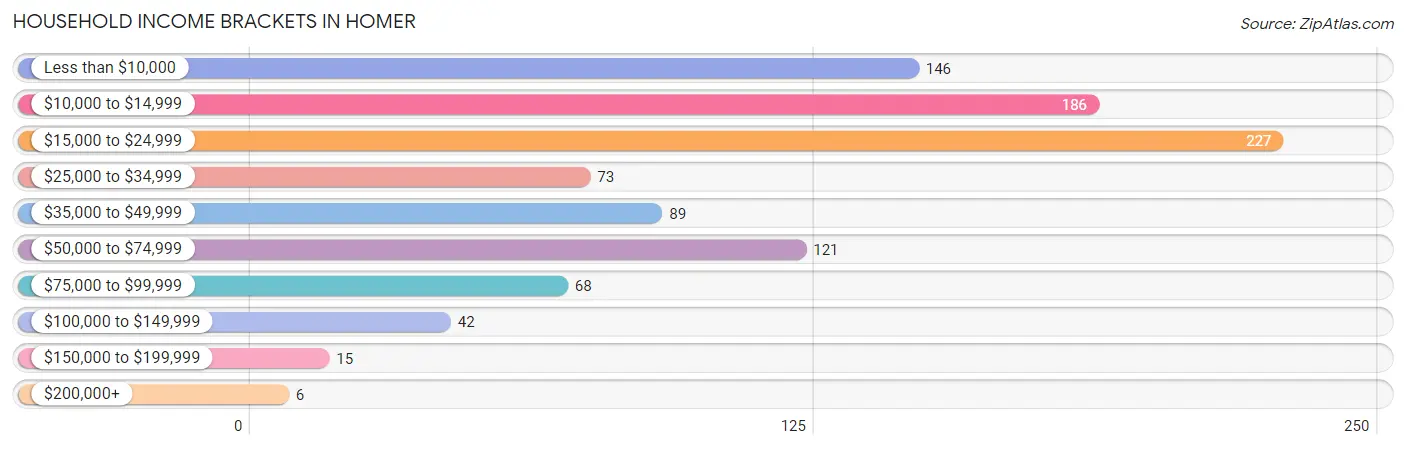
| Income Bracket | # Households | % Households |
| Less than $10,000 | 146 | 15.0% |
| $10,000 to $14,999 | 186 | 19.1% |
| $15,000 to $24,999 | 227 | 23.3% |
| $25,000 to $34,999 | 73 | 7.5% |
| $35,000 to $49,999 | 89 | 9.1% |
| $50,000 to $74,999 | 121 | 12.4% |
| $75,000 to $99,999 | 68 | 7.0% |
| $100,000 to $149,999 | 42 | 4.3% |
| $150,000 to $199,999 | 15 | 1.5% |
| $200,000+ | 6 | 0.6% |
Household Income by Householder Age in Homer
The median household income in Homer is $20,723, with the highest median household income of $42,000 found in the 45 to 64 years age bracket for the primary householder. A total of 222 households (22.8%) fall into this category. Meanwhile, the 15 to 24 years age bracket for the primary householder has the lowest median household income of $0, with 44 households (4.5%) in this group.
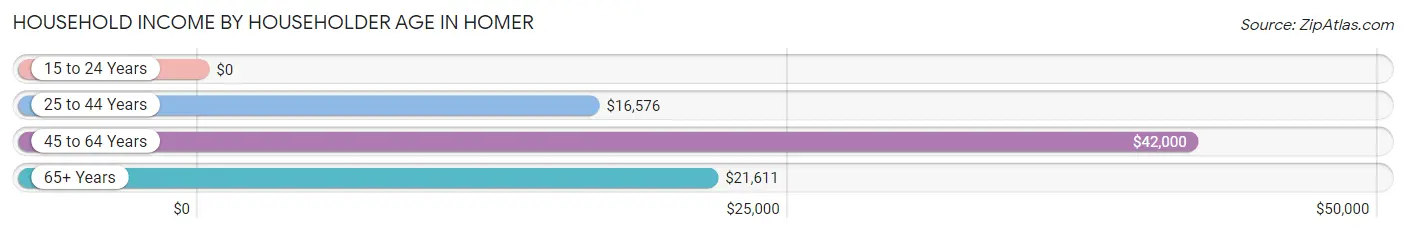
| Income Bracket | # Households | Median Income |
| 15 to 24 Years | 44 (4.5%) | $0 |
| 25 to 44 Years | 437 (44.9%) | $16,576 |
| 45 to 64 Years | 222 (22.8%) | $42,000 |
| 65+ Years | 270 (27.8%) | $21,611 |
| Total | 973 (100.0%) | $20,723 |
Poverty in Homer
Income Below Poverty by Sex and Age in Homer
With 46.5% poverty level for males and 46.3% for females among the residents of Homer, 5 year old males and 12 to 14 year old females are the most vulnerable to poverty, with 72 males (100.0%) and 86 females (93.5%) in their respective age groups living below the poverty level.
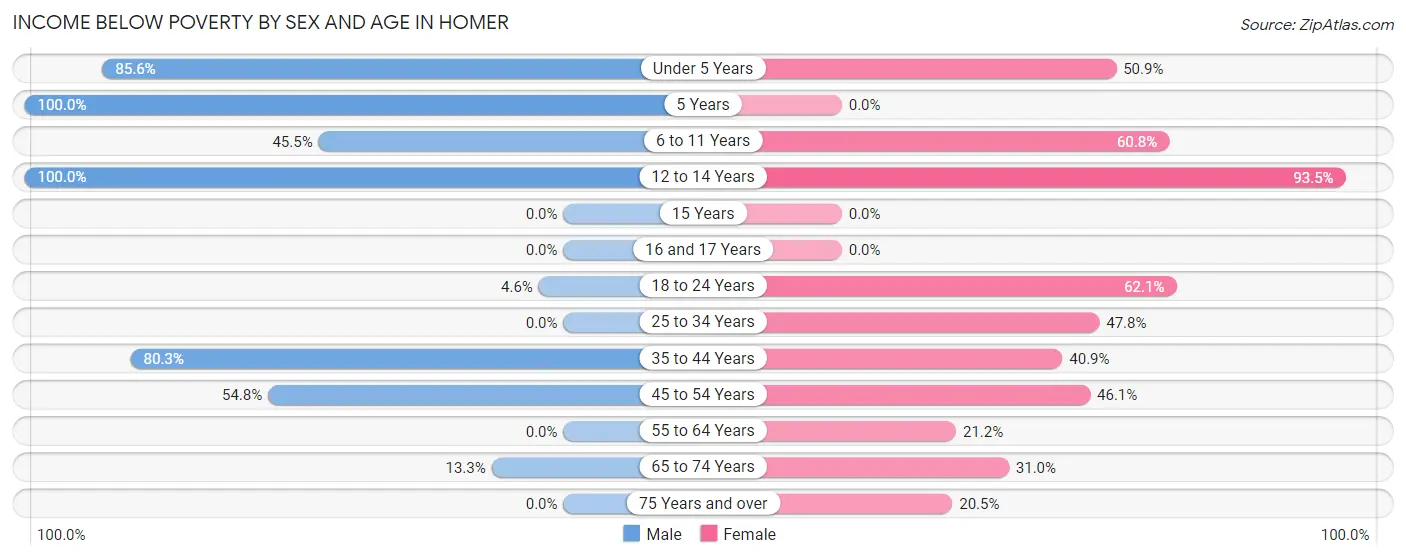
| Age Bracket | Male | Female |
| Under 5 Years | 148 (85.6%) | 27 (50.9%) |
| 5 Years | 72 (100.0%) | 0 (0.0%) |
| 6 to 11 Years | 65 (45.5%) | 113 (60.8%) |
| 12 to 14 Years | 86 (100.0%) | 86 (93.5%) |
| 15 Years | 0 (0.0%) | 0 (0.0%) |
| 16 and 17 Years | 0 (0.0%) | 0 (0.0%) |
| 18 to 24 Years | 12 (4.6%) | 54 (62.1%) |
| 25 to 34 Years | 0 (0.0%) | 98 (47.8%) |
| 35 to 44 Years | 200 (80.3%) | 104 (40.9%) |
| 45 to 54 Years | 57 (54.8%) | 59 (46.1%) |
| 55 to 64 Years | 0 (0.0%) | 21 (21.2%) |
| 65 to 74 Years | 12 (13.3%) | 49 (31.0%) |
| 75 Years and over | 0 (0.0%) | 8 (20.5%) |
| Total | 652 (46.5%) | 619 (46.3%) |
Income Above Poverty by Sex and Age in Homer
According to the poverty statistics in Homer, males aged 15 years and females aged 5 years are the age groups that are most secure financially, with 100.0% of males and 100.0% of females in these age groups living above the poverty line.
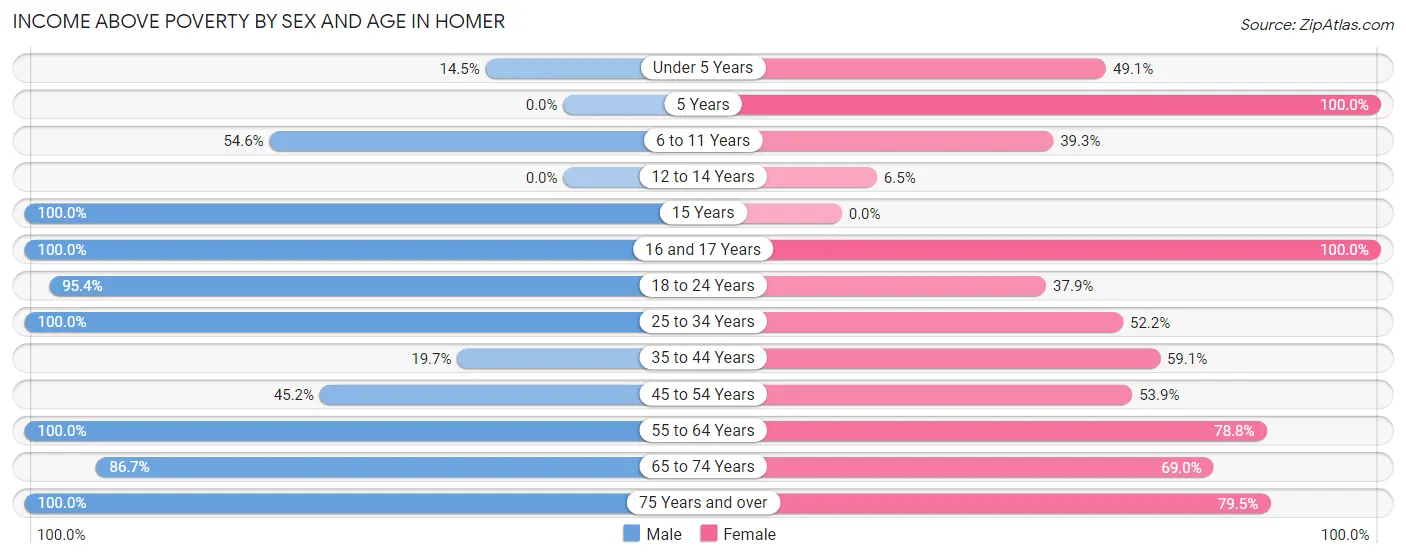
| Age Bracket | Male | Female |
| Under 5 Years | 25 (14.4%) | 26 (49.1%) |
| 5 Years | 0 (0.0%) | 22 (100.0%) |
| 6 to 11 Years | 78 (54.5%) | 73 (39.3%) |
| 12 to 14 Years | 0 (0.0%) | 6 (6.5%) |
| 15 Years | 43 (100.0%) | 0 (0.0%) |
| 16 and 17 Years | 5 (100.0%) | 15 (100.0%) |
| 18 to 24 Years | 250 (95.4%) | 33 (37.9%) |
| 25 to 34 Years | 39 (100.0%) | 107 (52.2%) |
| 35 to 44 Years | 49 (19.7%) | 150 (59.1%) |
| 45 to 54 Years | 47 (45.2%) | 69 (53.9%) |
| 55 to 64 Years | 63 (100.0%) | 78 (78.8%) |
| 65 to 74 Years | 78 (86.7%) | 109 (69.0%) |
| 75 Years and over | 72 (100.0%) | 31 (79.5%) |
| Total | 749 (53.5%) | 719 (53.7%) |
Income Below Poverty Among Married-Couple Families in Homer
The poverty statistics for married-couple families in Homer show that 3.0% or 5 of the total 166 families live below the poverty line. Families with 1 or 2 children have the highest poverty rate of 17.2%, comprising of 5 families. On the other hand, families with no children have the lowest poverty rate of 0.0%, which includes 0 families.
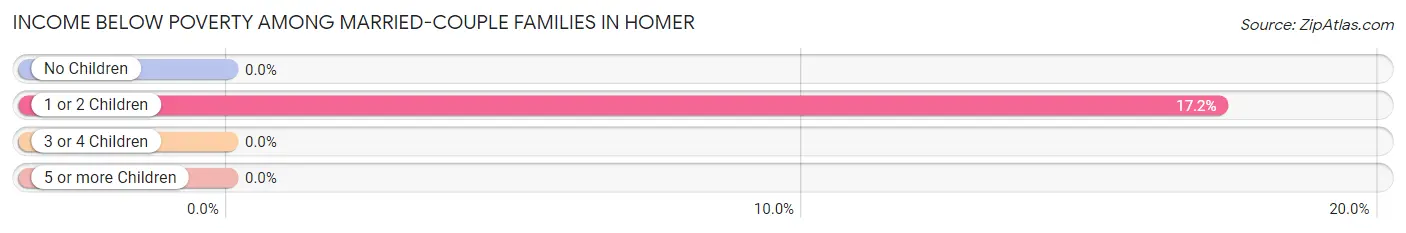
| Children | Above Poverty | Below Poverty |
| No Children | 122 (100.0%) | 0 (0.0%) |
| 1 or 2 Children | 24 (82.8%) | 5 (17.2%) |
| 3 or 4 Children | 15 (100.0%) | 0 (0.0%) |
| 5 or more Children | 0 (0.0%) | 0 (0.0%) |
| Total | 161 (97.0%) | 5 (3.0%) |
Income Below Poverty Among Single-Parent Households in Homer
According to the poverty data in Homer, 78.7% or 59 single-father households and 57.6% or 193 single-mother households are living below the poverty line. Among single-father households, those with 1 or 2 children have the highest poverty rate, with 59 households (100.0%) experiencing poverty. Likewise, among single-mother households, those with 5 or more children have the highest poverty rate, with 18 households (100.0%) falling below the poverty line.
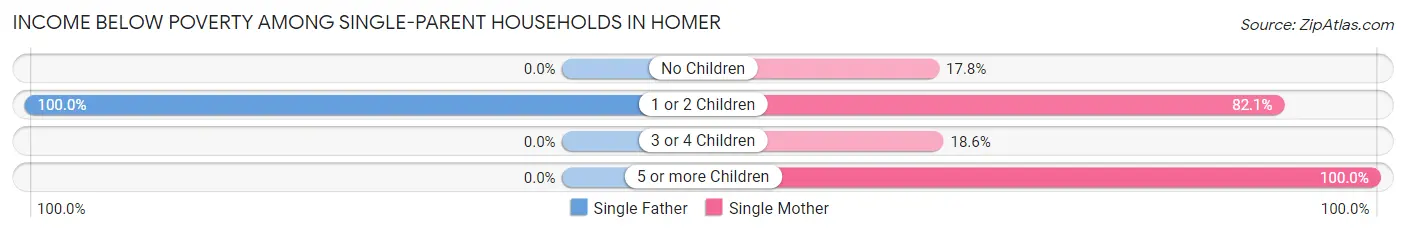
| Children | Single Father | Single Mother |
| No Children | 0 (0.0%) | 16 (17.8%) |
| 1 or 2 Children | 59 (100.0%) | 151 (82.1%) |
| 3 or 4 Children | 0 (0.0%) | 8 (18.6%) |
| 5 or more Children | 0 (0.0%) | 18 (100.0%) |
| Total | 59 (78.7%) | 193 (57.6%) |
Income Below Poverty Among Married-Couple vs Single-Parent Households in Homer
The poverty data for Homer shows that 5 of the married-couple family households (3.0%) and 252 of the single-parent households (61.5%) are living below the poverty level. Within the married-couple family households, those with 1 or 2 children have the highest poverty rate, with 5 households (17.2%) falling below the poverty line. Among the single-parent households, those with 5 or more children have the highest poverty rate, with 18 household (100.0%) living below poverty.
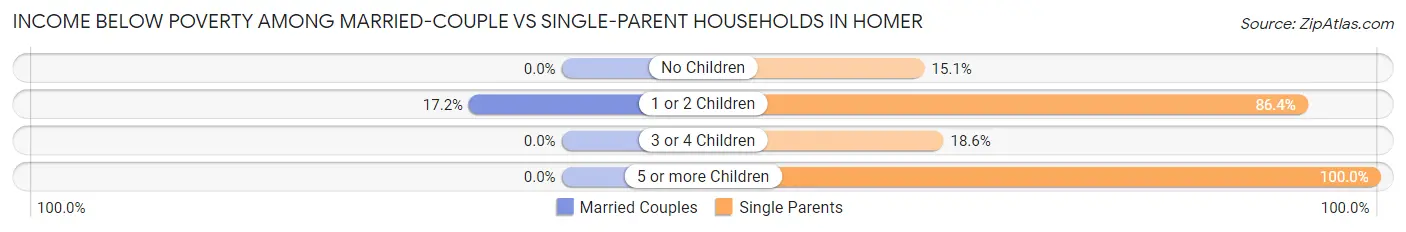
| Children | Married-Couple Families | Single-Parent Households |
| No Children | 0 (0.0%) | 16 (15.1%) |
| 1 or 2 Children | 5 (17.2%) | 210 (86.4%) |
| 3 or 4 Children | 0 (0.0%) | 8 (18.6%) |
| 5 or more Children | 0 (0.0%) | 18 (100.0%) |
| Total | 5 (3.0%) | 252 (61.5%) |
Race in Homer
The most populous races in Homer are Black / African American (1,961 | 71.6%), White / Caucasian (571 | 20.8%), and Two or more Races (188 | 6.9%).
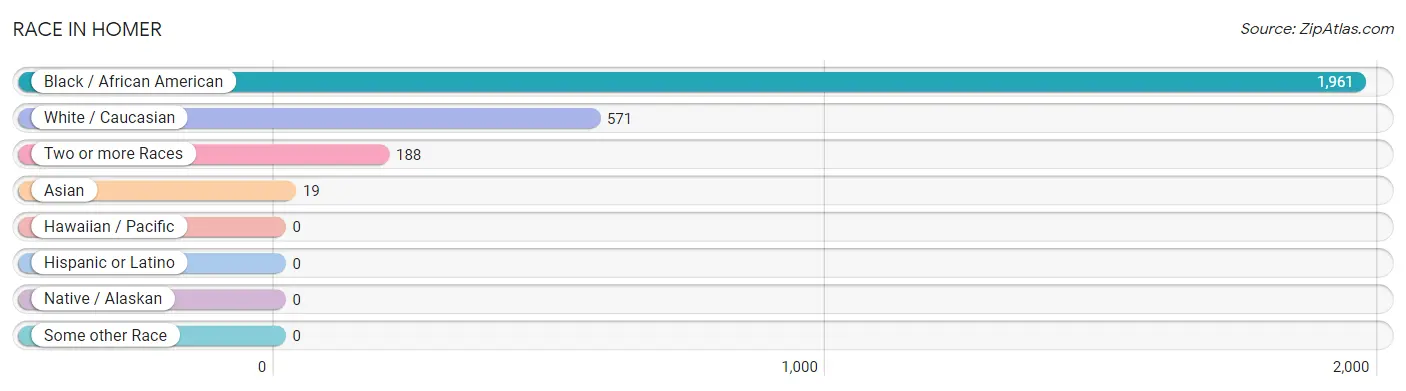
| Race | # Population | % Population |
| Asian | 19 | 0.7% |
| Black / African American | 1,961 | 71.6% |
| Hawaiian / Pacific | 0 | 0.0% |
| Hispanic or Latino | 0 | 0.0% |
| Native / Alaskan | 0 | 0.0% |
| White / Caucasian | 571 | 20.8% |
| Two or more Races | 188 | 6.9% |
| Some other Race | 0 | 0.0% |
| Total | 2,739 | 100.0% |
Ancestry in Homer
The most populous ancestries reported in Homer are American (1,092 | 39.9%), Belizean (126 | 4.6%), African (92 | 3.4%), Subsaharan African (92 | 3.4%), and Irish (57 | 2.1%), together accounting for 53.3% of all Homer residents.
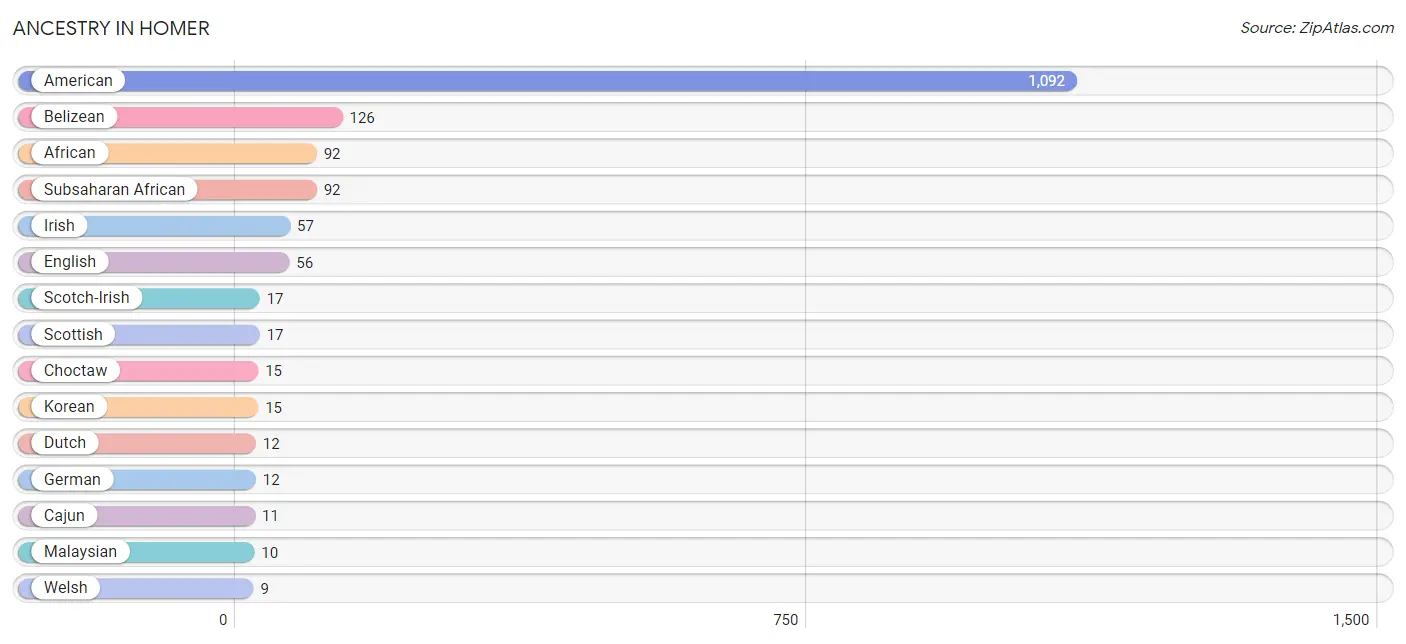
| Ancestry | # Population | % Population |
| African | 92 | 3.4% |
| American | 1,092 | 39.9% |
| Belizean | 126 | 4.6% |
| British West Indian | 7 | 0.3% |
| Cajun | 11 | 0.4% |
| Choctaw | 15 | 0.5% |
| Dutch | 12 | 0.4% |
| English | 56 | 2.0% |
| French | 4 | 0.2% |
| German | 12 | 0.4% |
| Irish | 57 | 2.1% |
| Italian | 7 | 0.3% |
| Korean | 15 | 0.5% |
| Malaysian | 10 | 0.4% |
| Scotch-Irish | 17 | 0.6% |
| Scottish | 17 | 0.6% |
| Subsaharan African | 92 | 3.4% |
| Swedish | 8 | 0.3% |
| Welsh | 9 | 0.3% | View All 19 Rows |
Immigrants in Homer
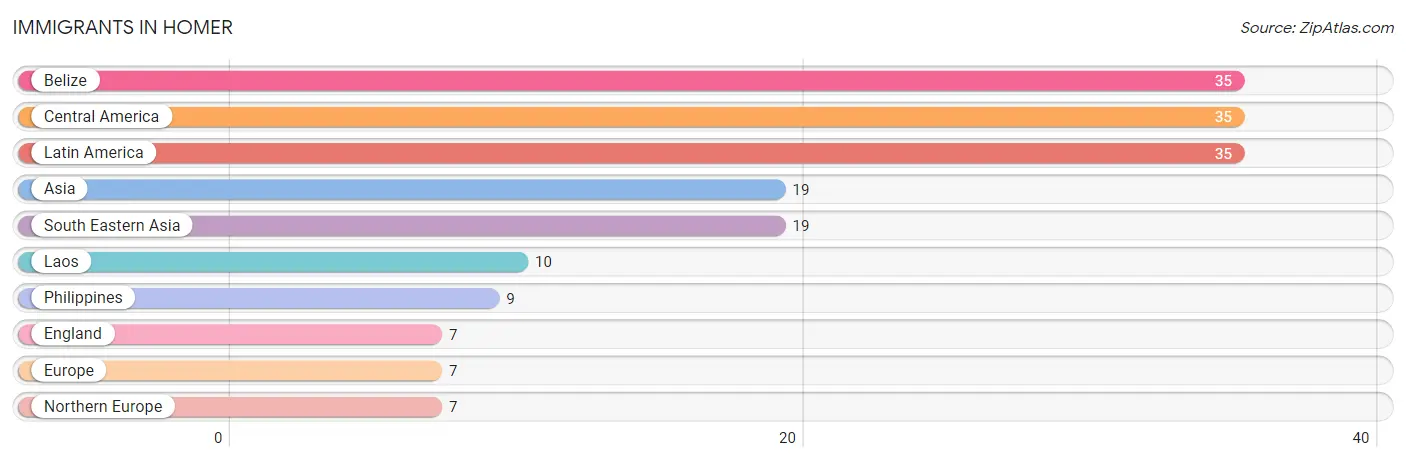
The most numerous immigrant groups reported in Homer came from Belize (35 | 1.3%), Central America (35 | 1.3%), Latin America (35 | 1.3%), Asia (19 | 0.7%), and South Eastern Asia (19 | 0.7%), together accounting for 5.2% of all Homer residents.
| Immigration Origin | # Population | % Population |
| Asia | 19 | 0.7% |
| Belize | 35 | 1.3% |
| Central America | 35 | 1.3% |
| England | 7 | 0.3% |
| Europe | 7 | 0.3% |
| Laos | 10 | 0.4% |
| Latin America | 35 | 1.3% |
| Northern Europe | 7 | 0.3% |
| Philippines | 9 | 0.3% |
| South Eastern Asia | 19 | 0.7% | View All 10 Rows |
Sex and Age in Homer
Sex and Age in Homer
The most populous age groups in Homer are 15 to 19 Years (207 | 14.8%) for men and 5 to 9 Years (196 | 14.6%) for women.
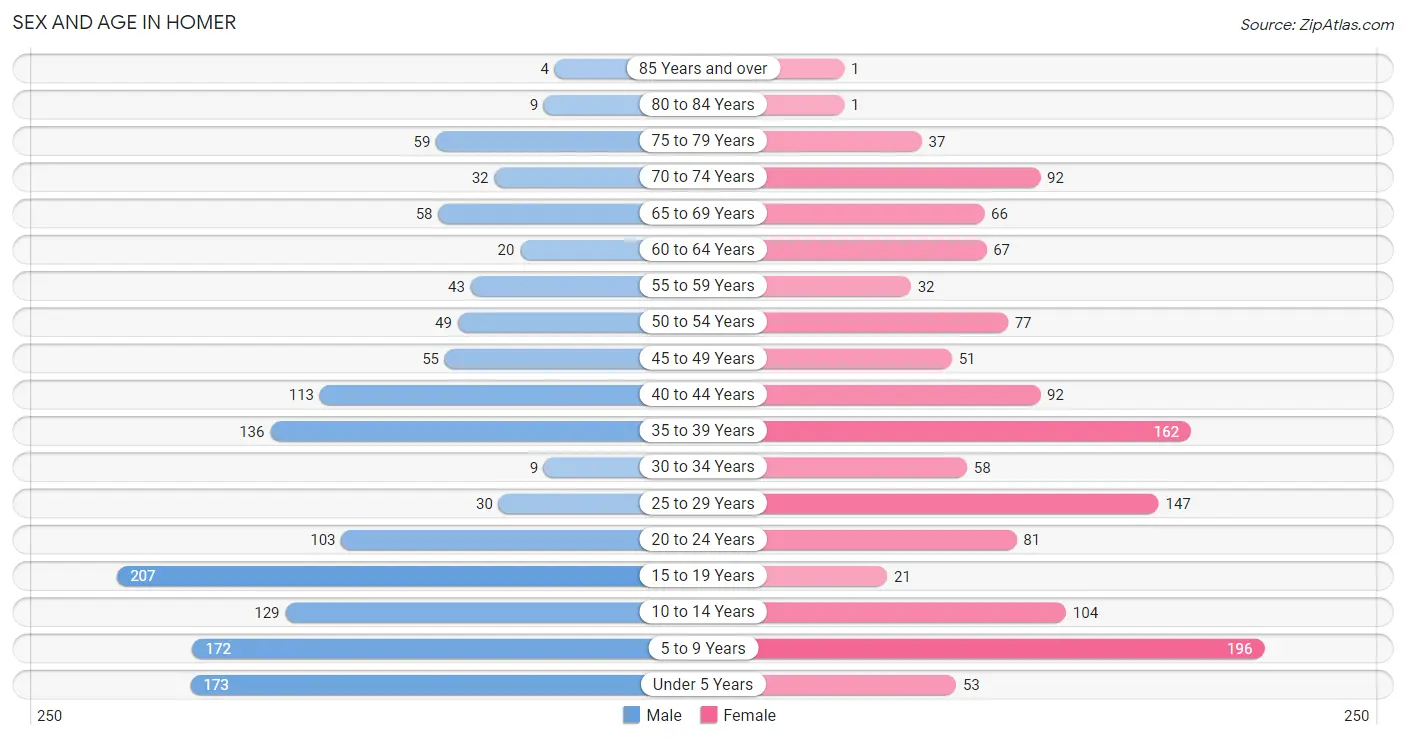
| Age Bracket | Male | Female |
| Under 5 Years | 173 (12.3%) | 53 (4.0%) |
| 5 to 9 Years | 172 (12.3%) | 196 (14.6%) |
| 10 to 14 Years | 129 (9.2%) | 104 (7.8%) |
| 15 to 19 Years | 207 (14.8%) | 21 (1.6%) |
| 20 to 24 Years | 103 (7.3%) | 81 (6.0%) |
| 25 to 29 Years | 30 (2.1%) | 147 (11.0%) |
| 30 to 34 Years | 9 (0.6%) | 58 (4.3%) |
| 35 to 39 Years | 136 (9.7%) | 162 (12.1%) |
| 40 to 44 Years | 113 (8.1%) | 92 (6.9%) |
| 45 to 49 Years | 55 (3.9%) | 51 (3.8%) |
| 50 to 54 Years | 49 (3.5%) | 77 (5.8%) |
| 55 to 59 Years | 43 (3.1%) | 32 (2.4%) |
| 60 to 64 Years | 20 (1.4%) | 67 (5.0%) |
| 65 to 69 Years | 58 (4.1%) | 66 (4.9%) |
| 70 to 74 Years | 32 (2.3%) | 92 (6.9%) |
| 75 to 79 Years | 59 (4.2%) | 37 (2.8%) |
| 80 to 84 Years | 9 (0.6%) | 1 (0.1%) |
| 85 Years and over | 4 (0.3%) | 1 (0.1%) |
| Total | 1,401 (100.0%) | 1,338 (100.0%) |
Families and Households in Homer
Median Family Size in Homer
The median family size in Homer is 3.70 persons per family, with single female/mother families (335 | 58.2%) accounting for the largest median family size of 4.49 persons per family. On the other hand, single male/father families (75 | 13.0%) represent the smallest median family size with 2.11 persons per family.
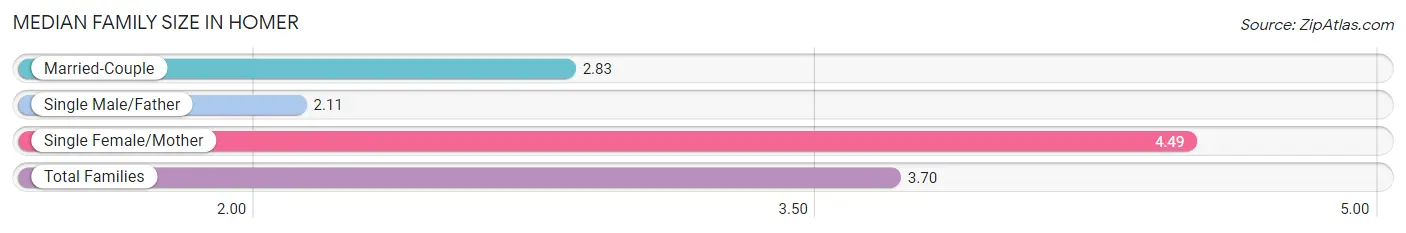
| Family Type | # Families | Family Size |
| Married-Couple | 166 (28.8%) | 2.83 |
| Single Male/Father | 75 (13.0%) | 2.11 |
| Single Female/Mother | 335 (58.2%) | 4.49 |
| Total Families | 576 (100.0%) | 3.70 |
Median Household Size in Homer
The median household size in Homer is 2.82 persons per household, with single female/mother households (335 | 34.4%) accounting for the largest median household size of 4.89 persons per household. non-family households (397 | 40.8%) represent the smallest median household size with 1.19 persons per household.
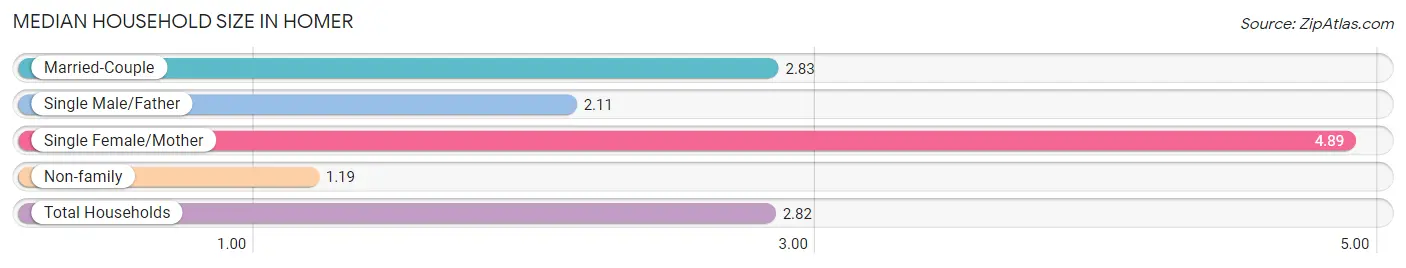
| Household Type | # Households | Household Size |
| Married-Couple | 166 (17.1%) | 2.83 |
| Single Male/Father | 75 (7.7%) | 2.11 |
| Single Female/Mother | 335 (34.4%) | 4.89 |
| Non-family | 397 (40.8%) | 1.19 |
| Total Households | 973 (100.0%) | 2.82 |
Household Size by Marriage Status in Homer
Out of a total of 973 households in Homer, 576 (59.2%) are family households, while 397 (40.8%) are nonfamily households. The most numerous type of family households are 3-person households, comprising 234, and the most common type of nonfamily households are 1-person households, comprising 269.
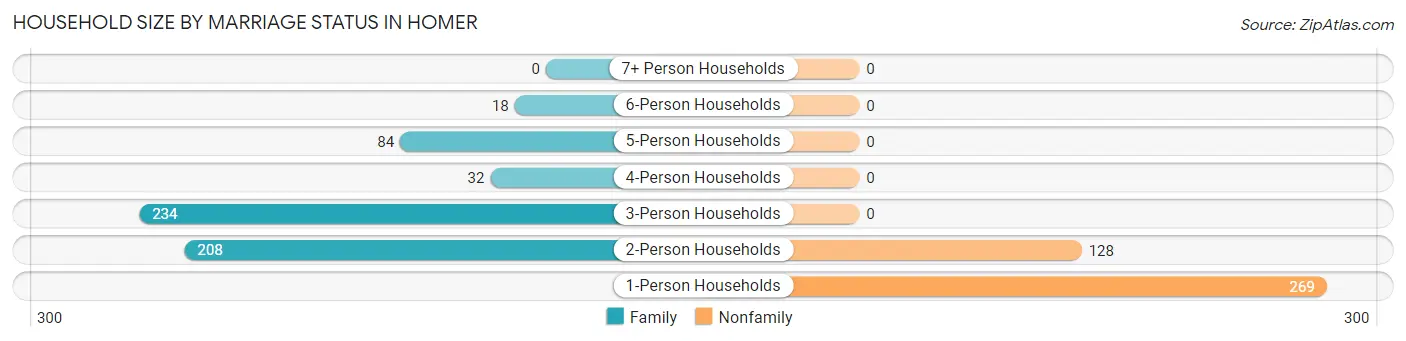
| Household Size | Family Households | Nonfamily Households |
| 1-Person Households | - | 269 (27.7%) |
| 2-Person Households | 208 (21.4%) | 128 (13.2%) |
| 3-Person Households | 234 (24.0%) | 0 (0.0%) |
| 4-Person Households | 32 (3.3%) | 0 (0.0%) |
| 5-Person Households | 84 (8.6%) | 0 (0.0%) |
| 6-Person Households | 18 (1.8%) | 0 (0.0%) |
| 7+ Person Households | 0 (0.0%) | 0 (0.0%) |
| Total | 576 (59.2%) | 397 (40.8%) |
Female Fertility in Homer
Fertility by Age in Homer
Average fertility rate in Homer is 29.0 births per 1,000 women. Women in the age bracket of 20 to 34 years have the highest fertility rate with 63.0 births per 1,000 women. Women in the age bracket of 20 to 34 years acount for 100.0% of all women with births.
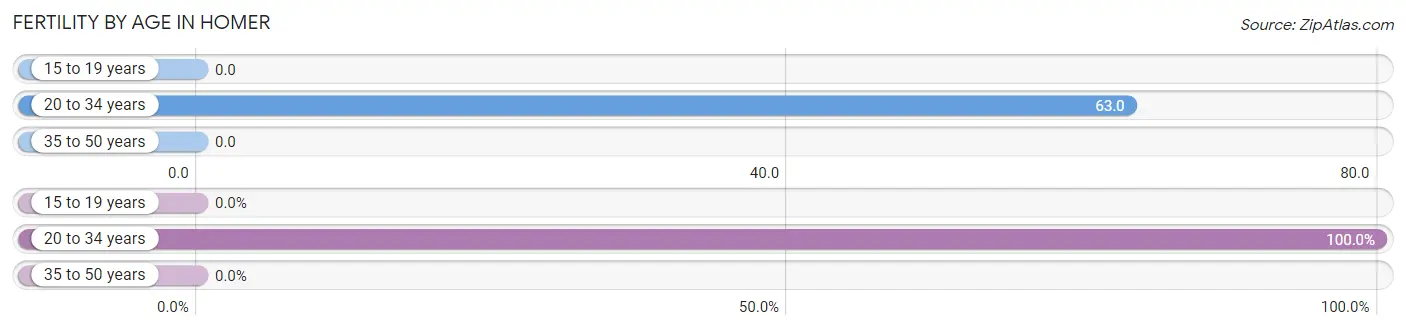
| Age Bracket | Women with Births | Births / 1,000 Women |
| 15 to 19 years | 0 (0.0%) | 0.0 |
| 20 to 34 years | 18 (100.0%) | 63.0 |
| 35 to 50 years | 0 (0.0%) | 0.0 |
| Total | 18 (100.0%) | 29.0 |
Fertility by Age by Marriage Status in Homer
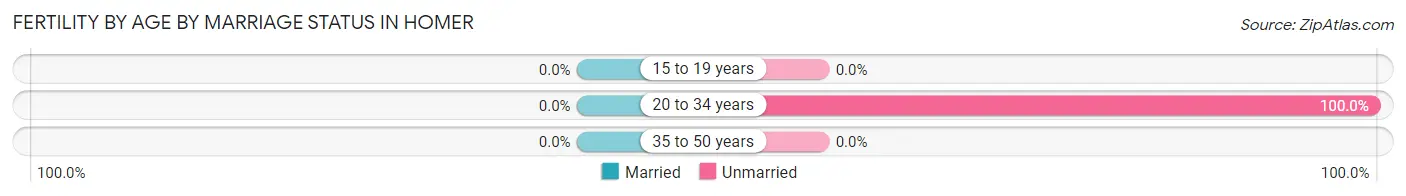
| Age Bracket | Married | Unmarried |
| 15 to 19 years | 0 (0.0%) | 0 (0.0%) |
| 20 to 34 years | 0 (0.0%) | 18 (100.0%) |
| 35 to 50 years | 0 (0.0%) | 0 (0.0%) |
| Total | 0 (0.0%) | 18 (100.0%) |
Fertility by Education in Homer
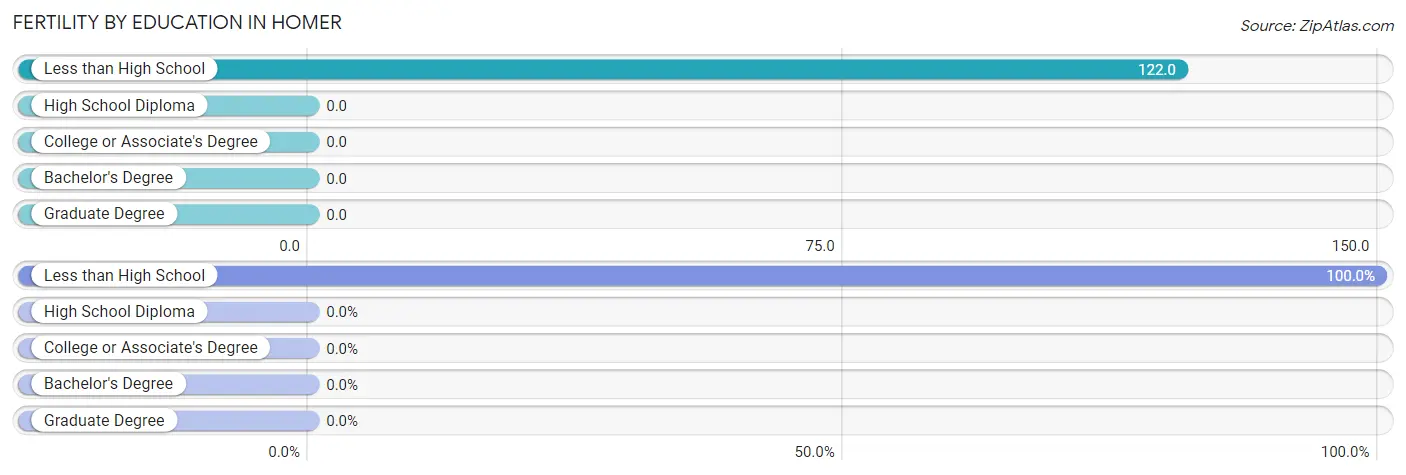
| Educational Attainment | Women with Births | Births / 1,000 Women |
| Less than High School | 18 (100.0%) | 122.0 |
| High School Diploma | 0 (0.0%) | 0.0 |
| College or Associate's Degree | 0 (0.0%) | 0.0 |
| Bachelor's Degree | 0 (0.0%) | 0.0 |
| Graduate Degree | 0 (0.0%) | 0.0 |
| Total | 18 (100.0%) | 29.0 |
Fertility by Education by Marriage Status in Homer
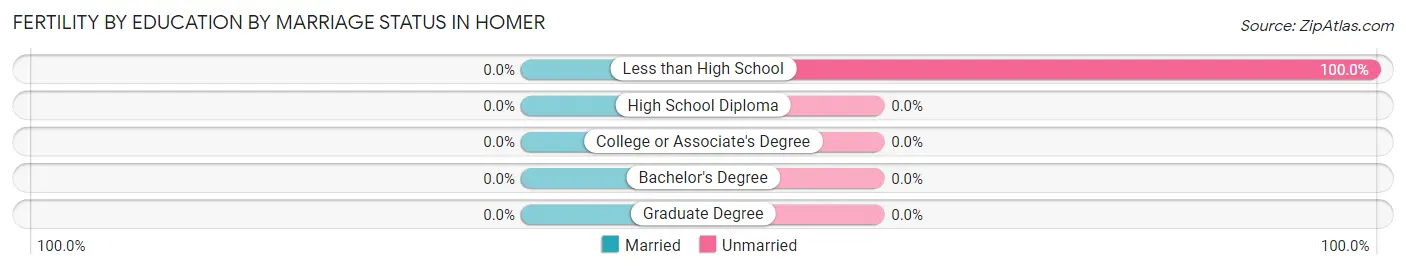
| Educational Attainment | Married | Unmarried |
| Less than High School | 0 (0.0%) | 18 (100.0%) |
| High School Diploma | 0 (0.0%) | 0 (0.0%) |
| College or Associate's Degree | 0 (0.0%) | 0 (0.0%) |
| Bachelor's Degree | 0 (0.0%) | 0 (0.0%) |
| Graduate Degree | 0 (0.0%) | 0 (0.0%) |
| Total | 0 (0.0%) | 18 (100.0%) |
Employment Characteristics in Homer
Employment by Class of Employer in Homer
Among the 832 employed individuals in Homer, private company employees (446 | 53.6%), state government employees (111 | 13.3%), and local government employees (85 | 10.2%) make up the most common classes of employment.
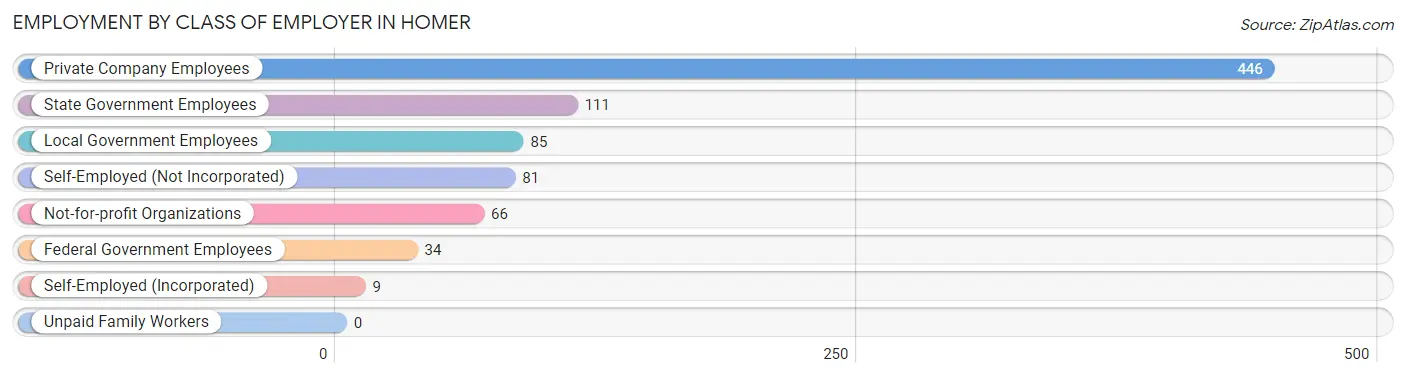
| Employer Class | # Employees | % Employees |
| Private Company Employees | 446 | 53.6% |
| Self-Employed (Incorporated) | 9 | 1.1% |
| Self-Employed (Not Incorporated) | 81 | 9.7% |
| Not-for-profit Organizations | 66 | 7.9% |
| Local Government Employees | 85 | 10.2% |
| State Government Employees | 111 | 13.3% |
| Federal Government Employees | 34 | 4.1% |
| Unpaid Family Workers | 0 | 0.0% |
| Total | 832 | 100.0% |
Employment Status by Age in Homer
According to the labor force statistics for Homer, out of the total population over 16 years of age (1,869), 47.0% or 878 individuals are in the labor force, with 5.2% or 46 of them unemployed. The age group with the highest labor force participation rate is 25 to 29 years, with 89.8% or 159 individuals in the labor force. Within the labor force, the 25 to 29 years age range has the highest percentage of unemployed individuals, with 11.9% or 19 of them being unemployed.
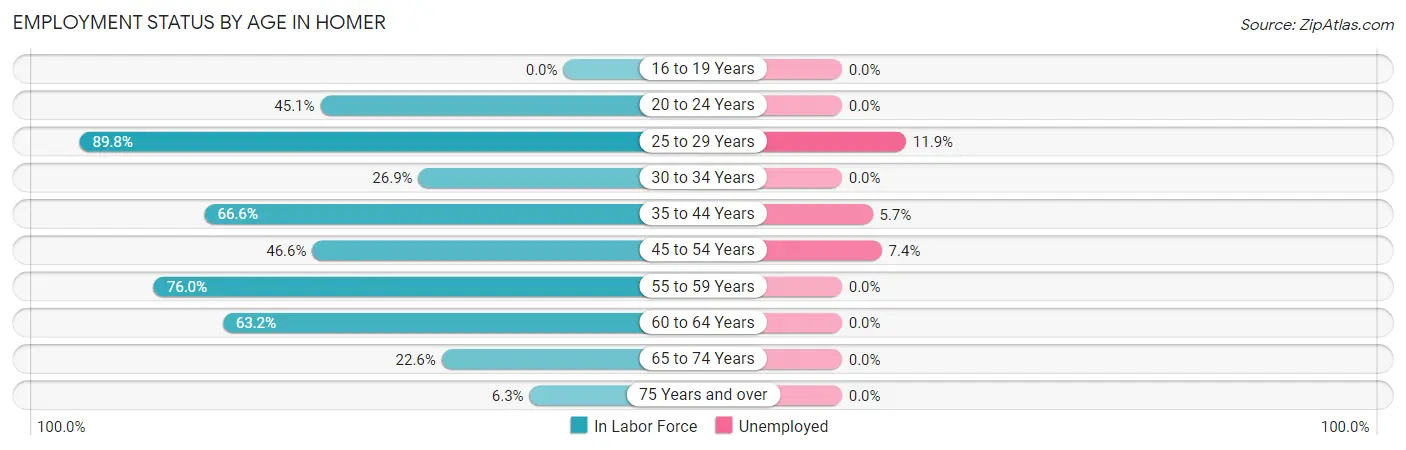
| Age Bracket | In Labor Force | Unemployed |
| 16 to 19 Years | 0 (0.0%) | 0 (0.0%) |
| 20 to 24 Years | 83 (45.1%) | 0 (0.0%) |
| 25 to 29 Years | 159 (89.8%) | 19 (11.9%) |
| 30 to 34 Years | 18 (26.9%) | 0 (0.0%) |
| 35 to 44 Years | 335 (66.6%) | 19 (5.7%) |
| 45 to 54 Years | 108 (46.6%) | 8 (7.4%) |
| 55 to 59 Years | 57 (76.0%) | 0 (0.0%) |
| 60 to 64 Years | 55 (63.2%) | 0 (0.0%) |
| 65 to 74 Years | 56 (22.6%) | 0 (0.0%) |
| 75 Years and over | 7 (6.3%) | 0 (0.0%) |
| Total | 878 (47.0%) | 46 (5.2%) |
Employment Status by Educational Attainment in Homer
According to labor force statistics for Homer, 64.2% of individuals (733) out of the total population between 25 and 64 years of age (1,141) are in the labor force, with 6.3% or 46 of them being unemployed. The group with the highest labor force participation rate are those with the educational attainment of college / associate degree, with 88.8% or 246 individuals in the labor force. Within the labor force, individuals with college / associate degree education have the highest percentage of unemployment, with 17.1% or 42 of them being unemployed.
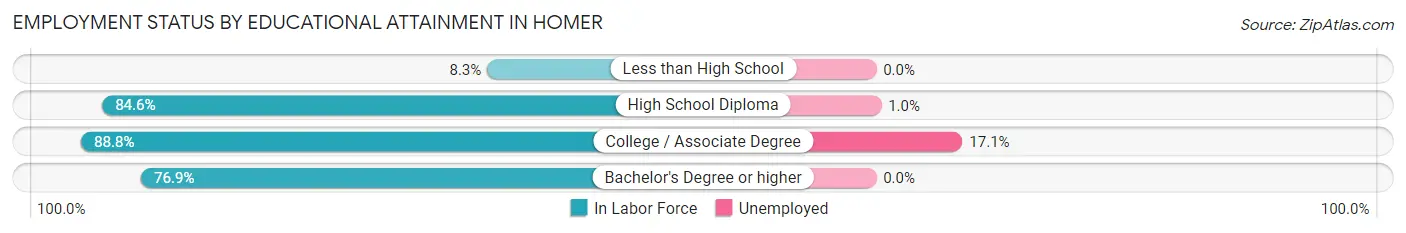
| Educational Attainment | In Labor Force | Unemployed |
| Less than High School | 26 (8.3%) | 0 (0.0%) |
| High School Diploma | 400 (84.6%) | 5 (1.0%) |
| College / Associate Degree | 246 (88.8%) | 47 (17.1%) |
| Bachelor's Degree or higher | 60 (76.9%) | 0 (0.0%) |
| Total | 733 (64.2%) | 72 (6.3%) |
Employment Occupations by Sex in Homer
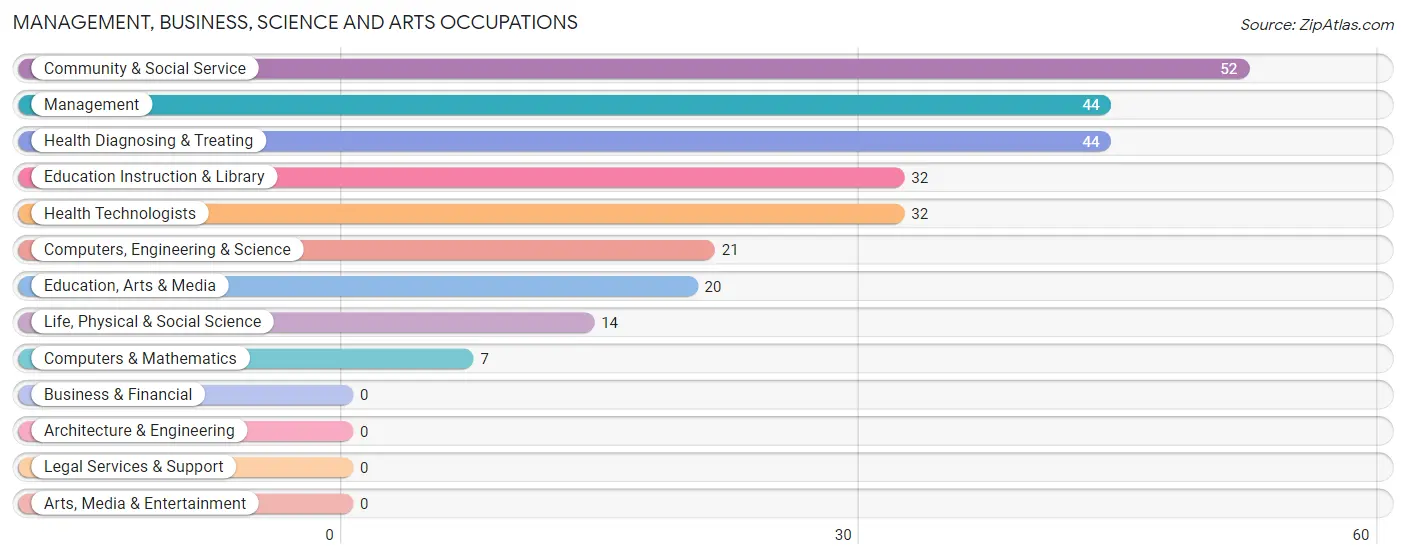
Management, Business, Science and Arts Occupations
The most common Management, Business, Science and Arts occupations in Homer are Community & Social Service (52 | 6.2%), Management (44 | 5.3%), Health Diagnosing & Treating (44 | 5.3%), Education Instruction & Library (32 | 3.8%), and Health Technologists (32 | 3.8%).
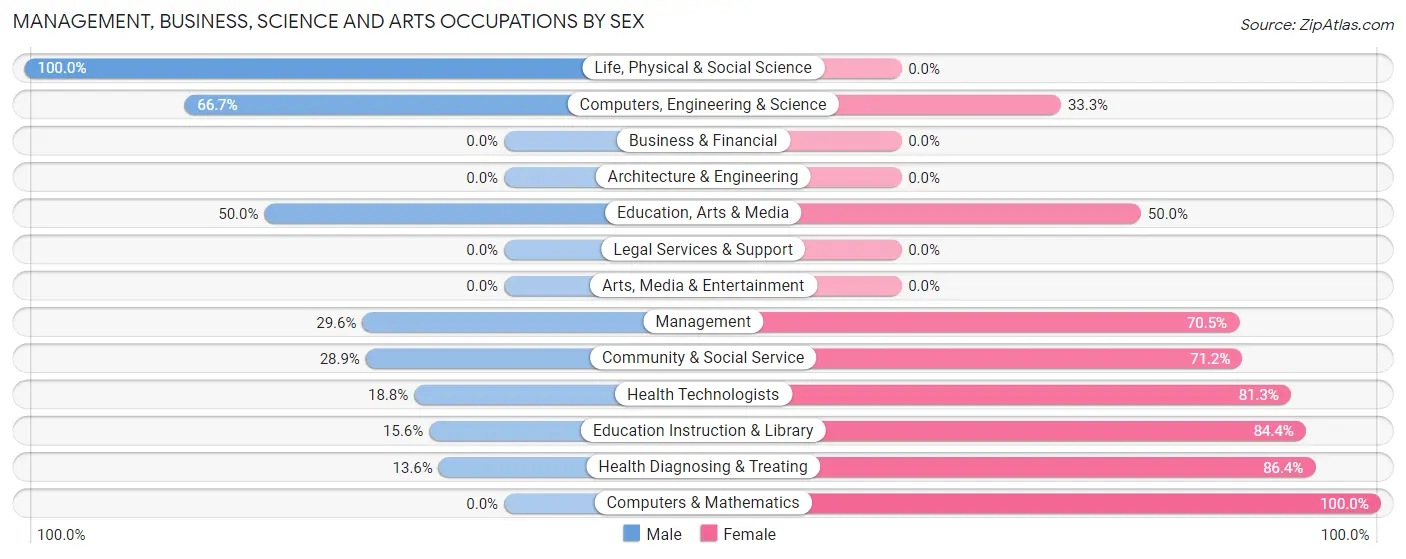
Management, Business, Science and Arts Occupations by Sex
Within the Management, Business, Science and Arts occupations in Homer, the most male-oriented occupations are Life, Physical & Social Science (100.0%), Computers, Engineering & Science (66.7%), and Education, Arts & Media (50.0%), while the most female-oriented occupations are Computers & Mathematics (100.0%), Health Diagnosing & Treating (86.4%), and Education Instruction & Library (84.4%).
| Occupation | Male | Female |
| Management | 13 (29.5%) | 31 (70.5%) |
| Business & Financial | 0 (0.0%) | 0 (0.0%) |
| Computers, Engineering & Science | 14 (66.7%) | 7 (33.3%) |
| Computers & Mathematics | 0 (0.0%) | 7 (100.0%) |
| Architecture & Engineering | 0 (0.0%) | 0 (0.0%) |
| Life, Physical & Social Science | 14 (100.0%) | 0 (0.0%) |
| Community & Social Service | 15 (28.8%) | 37 (71.2%) |
| Education, Arts & Media | 10 (50.0%) | 10 (50.0%) |
| Legal Services & Support | 0 (0.0%) | 0 (0.0%) |
| Education Instruction & Library | 5 (15.6%) | 27 (84.4%) |
| Arts, Media & Entertainment | 0 (0.0%) | 0 (0.0%) |
| Health Diagnosing & Treating | 6 (13.6%) | 38 (86.4%) |
| Health Technologists | 6 (18.8%) | 26 (81.2%) |
| Total (Category) | 48 (29.8%) | 113 (70.2%) |
| Total (Overall) | 342 (41.1%) | 490 (58.9%) |
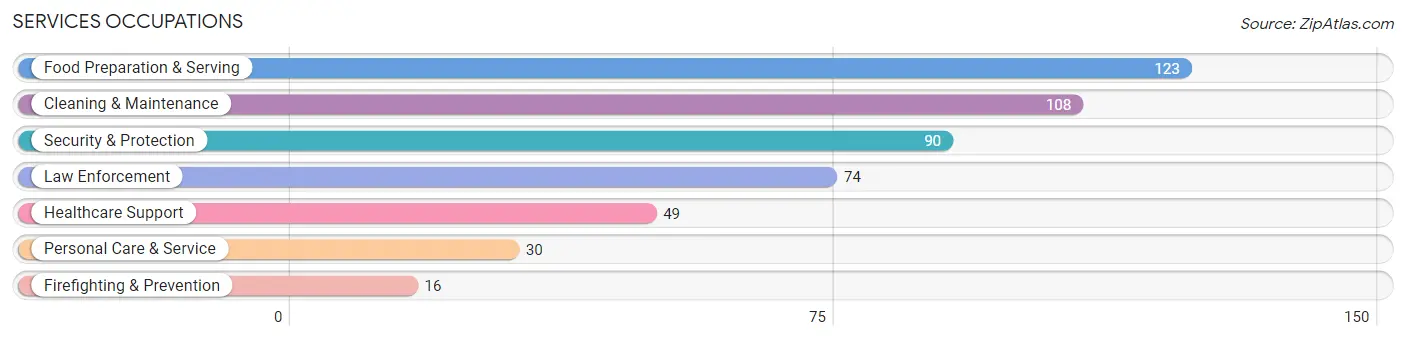
Services Occupations
The most common Services occupations in Homer are Food Preparation & Serving (123 | 14.8%), Cleaning & Maintenance (108 | 13.0%), Security & Protection (90 | 10.8%), Law Enforcement (74 | 8.9%), and Healthcare Support (49 | 5.9%).
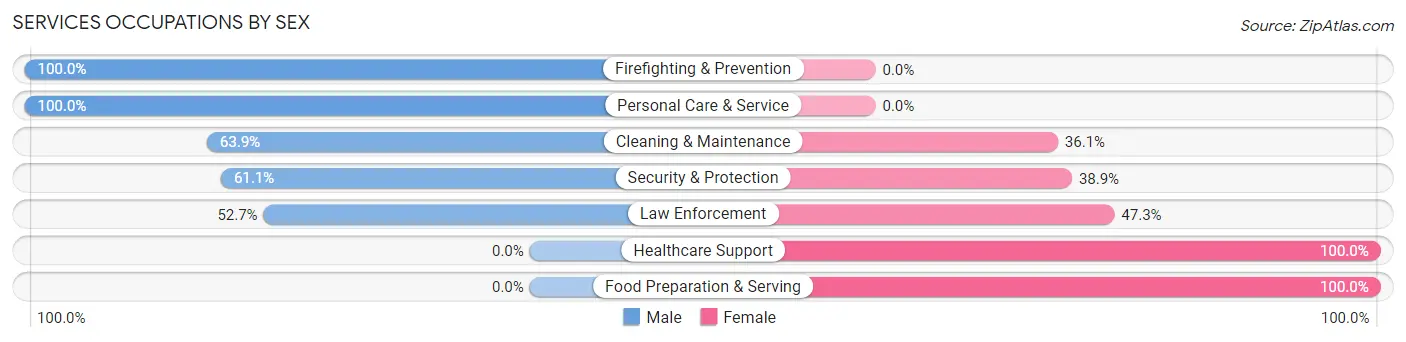
Services Occupations by Sex
Within the Services occupations in Homer, the most male-oriented occupations are Firefighting & Prevention (100.0%), Personal Care & Service (100.0%), and Cleaning & Maintenance (63.9%), while the most female-oriented occupations are Healthcare Support (100.0%), Food Preparation & Serving (100.0%), and Law Enforcement (47.3%).
| Occupation | Male | Female |
| Healthcare Support | 0 (0.0%) | 49 (100.0%) |
| Security & Protection | 55 (61.1%) | 35 (38.9%) |
| Firefighting & Prevention | 16 (100.0%) | 0 (0.0%) |
| Law Enforcement | 39 (52.7%) | 35 (47.3%) |
| Food Preparation & Serving | 0 (0.0%) | 123 (100.0%) |
| Cleaning & Maintenance | 69 (63.9%) | 39 (36.1%) |
| Personal Care & Service | 30 (100.0%) | 0 (0.0%) |
| Total (Category) | 154 (38.5%) | 246 (61.5%) |
| Total (Overall) | 342 (41.1%) | 490 (58.9%) |
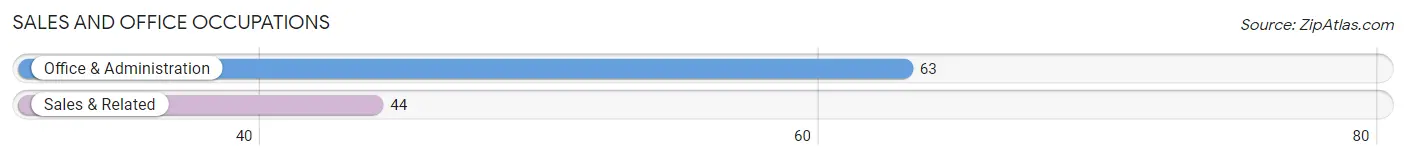
Sales and Office Occupations
The most common Sales and Office occupations in Homer are Office & Administration (63 | 7.6%), and Sales & Related (44 | 5.3%).
Sales and Office Occupations by Sex
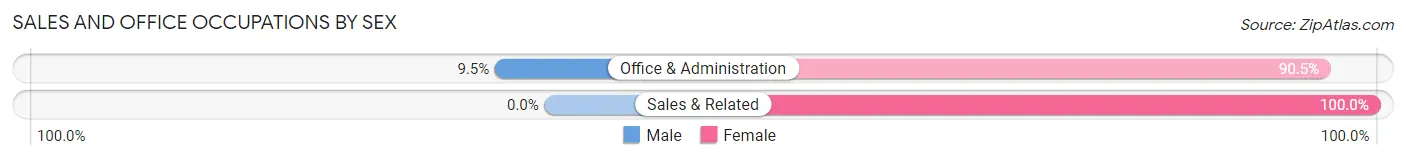
| Occupation | Male | Female |
| Sales & Related | 0 (0.0%) | 44 (100.0%) |
| Office & Administration | 6 (9.5%) | 57 (90.5%) |
| Total (Category) | 6 (5.6%) | 101 (94.4%) |
| Total (Overall) | 342 (41.1%) | 490 (58.9%) |
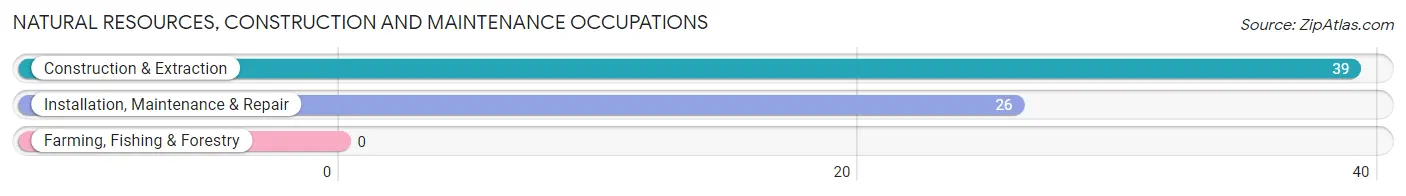
Natural Resources, Construction and Maintenance Occupations
The most common Natural Resources, Construction and Maintenance occupations in Homer are Construction & Extraction (39 | 4.7%), and Installation, Maintenance & Repair (26 | 3.1%).
Natural Resources, Construction and Maintenance Occupations by Sex
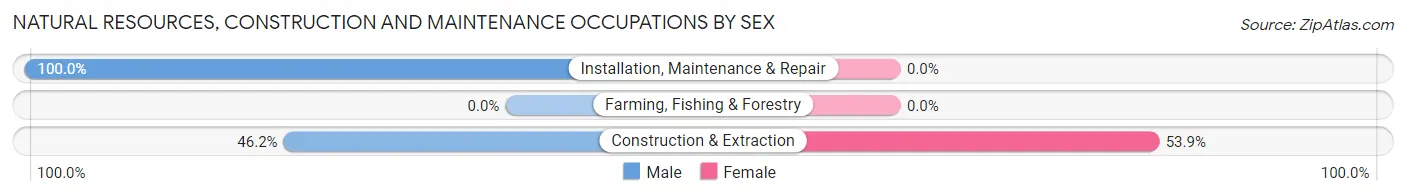
| Occupation | Male | Female |
| Farming, Fishing & Forestry | 0 (0.0%) | 0 (0.0%) |
| Construction & Extraction | 18 (46.2%) | 21 (53.8%) |
| Installation, Maintenance & Repair | 26 (100.0%) | 0 (0.0%) |
| Total (Category) | 44 (67.7%) | 21 (32.3%) |
| Total (Overall) | 342 (41.1%) | 490 (58.9%) |
Production, Transportation and Moving Occupations
The most common Production, Transportation and Moving occupations in Homer are Transportation (74 | 8.9%), and Production (25 | 3.0%).
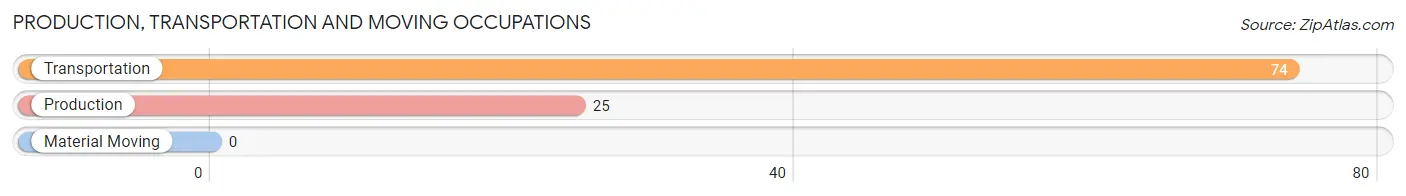
Production, Transportation and Moving Occupations by Sex
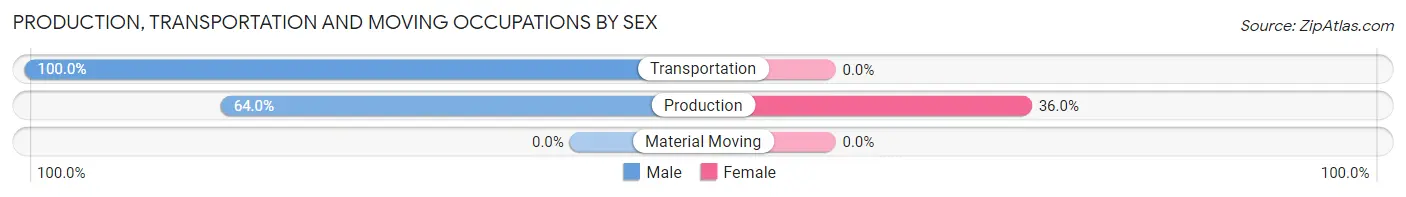
| Occupation | Male | Female |
| Production | 16 (64.0%) | 9 (36.0%) |
| Transportation | 74 (100.0%) | 0 (0.0%) |
| Material Moving | 0 (0.0%) | 0 (0.0%) |
| Total (Category) | 90 (90.9%) | 9 (9.1%) |
| Total (Overall) | 342 (41.1%) | 490 (58.9%) |
Employment Industries by Sex in Homer
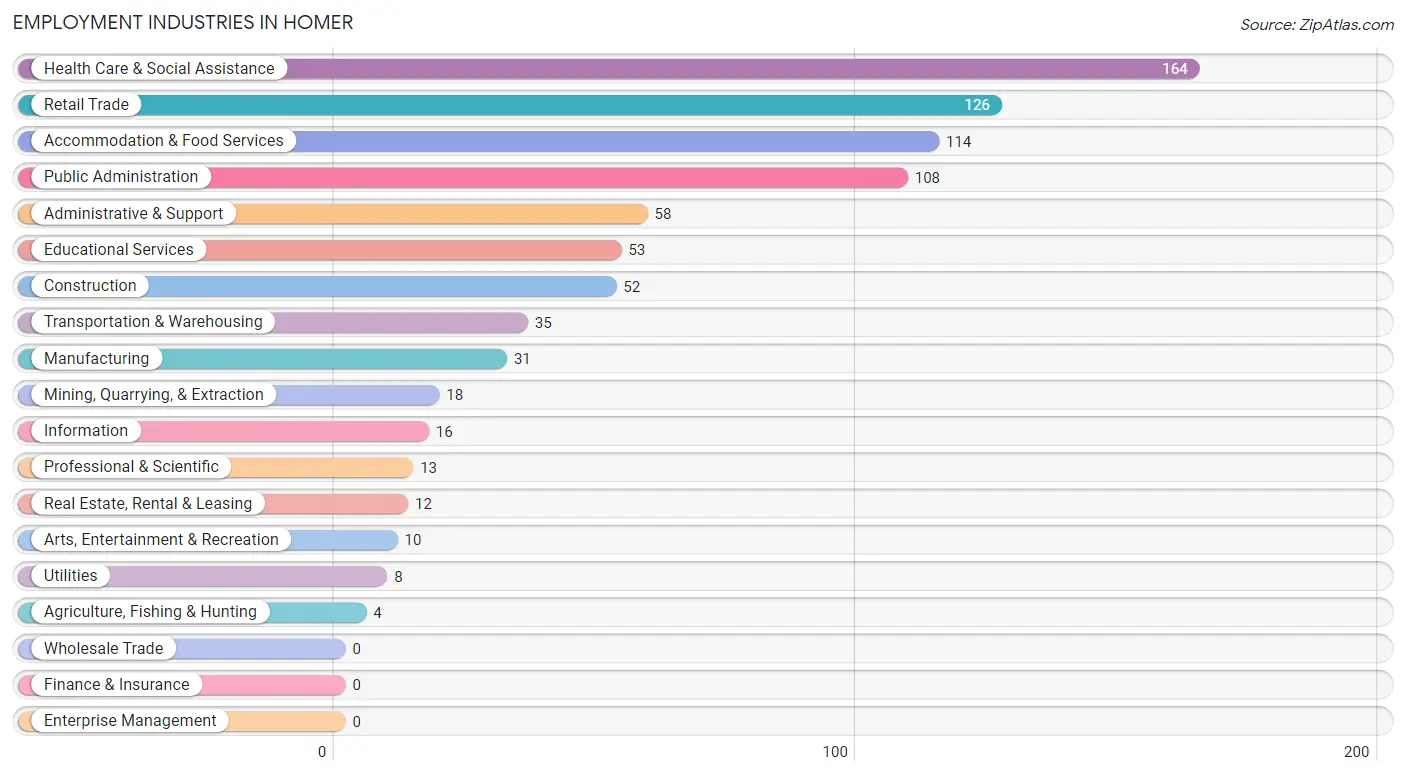
Employment Industries in Homer
The major employment industries in Homer include Health Care & Social Assistance (164 | 19.7%), Retail Trade (126 | 15.1%), Accommodation & Food Services (114 | 13.7%), Public Administration (108 | 13.0%), and Administrative & Support (58 | 7.0%).
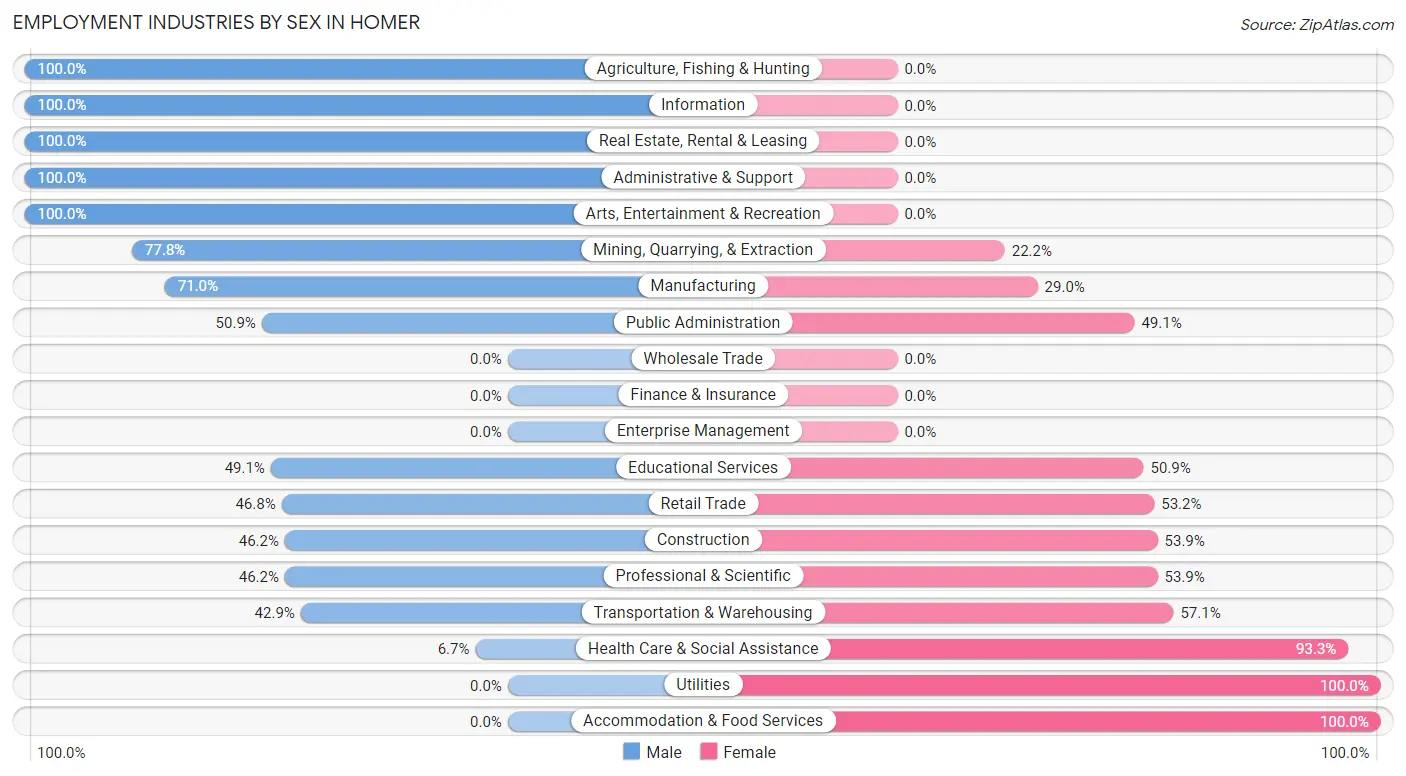
Employment Industries by Sex in Homer
The Homer industries that see more men than women are Agriculture, Fishing & Hunting (100.0%), Information (100.0%), and Real Estate, Rental & Leasing (100.0%), whereas the industries that tend to have a higher number of women are Utilities (100.0%), Accommodation & Food Services (100.0%), and Health Care & Social Assistance (93.3%).
| Industry | Male | Female |
| Agriculture, Fishing & Hunting | 4 (100.0%) | 0 (0.0%) |
| Mining, Quarrying, & Extraction | 14 (77.8%) | 4 (22.2%) |
| Construction | 24 (46.2%) | 28 (53.8%) |
| Manufacturing | 22 (71.0%) | 9 (29.0%) |
| Wholesale Trade | 0 (0.0%) | 0 (0.0%) |
| Retail Trade | 59 (46.8%) | 67 (53.2%) |
| Transportation & Warehousing | 15 (42.9%) | 20 (57.1%) |
| Utilities | 0 (0.0%) | 8 (100.0%) |
| Information | 16 (100.0%) | 0 (0.0%) |
| Finance & Insurance | 0 (0.0%) | 0 (0.0%) |
| Real Estate, Rental & Leasing | 12 (100.0%) | 0 (0.0%) |
| Professional & Scientific | 6 (46.2%) | 7 (53.8%) |
| Enterprise Management | 0 (0.0%) | 0 (0.0%) |
| Administrative & Support | 58 (100.0%) | 0 (0.0%) |
| Educational Services | 26 (49.1%) | 27 (50.9%) |
| Health Care & Social Assistance | 11 (6.7%) | 153 (93.3%) |
| Arts, Entertainment & Recreation | 10 (100.0%) | 0 (0.0%) |
| Accommodation & Food Services | 0 (0.0%) | 114 (100.0%) |
| Public Administration | 55 (50.9%) | 53 (49.1%) |
| Total | 342 (41.1%) | 490 (58.9%) |
Education in Homer
School Enrollment in Homer
The most common levels of schooling among the 849 students in Homer are elementary school (317 | 37.3%), middle school (154 | 18.1%), and college / undergraduate (144 | 17.0%).
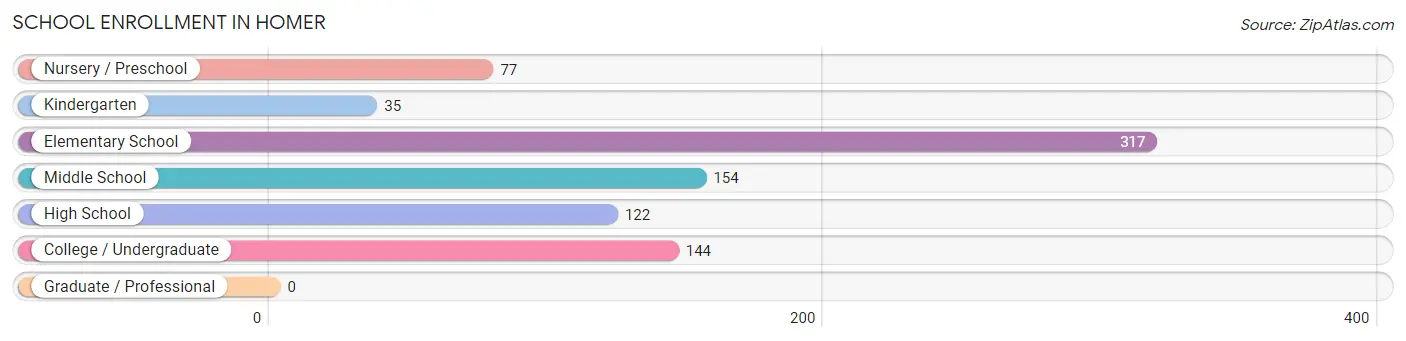
| School Level | # Students | % Students |
| Nursery / Preschool | 77 | 9.1% |
| Kindergarten | 35 | 4.1% |
| Elementary School | 317 | 37.3% |
| Middle School | 154 | 18.1% |
| High School | 122 | 14.4% |
| College / Undergraduate | 144 | 17.0% |
| Graduate / Professional | 0 | 0.0% |
| Total | 849 | 100.0% |
School Enrollment by Age by Funding Source in Homer
Out of a total of 849 students who are enrolled in schools in Homer, 21 (2.5%) attend a private institution, while the remaining 828 (97.5%) are enrolled in public schools. The age group of 15 to 17 year olds has the highest likelihood of being enrolled in private schools, with 15 (23.8% in the age bracket) enrolled. Conversely, the age group of 3 to 4 year olds has the lowest likelihood of being enrolled in a private school, with 55 (100.0% in the age bracket) attending a public institution.
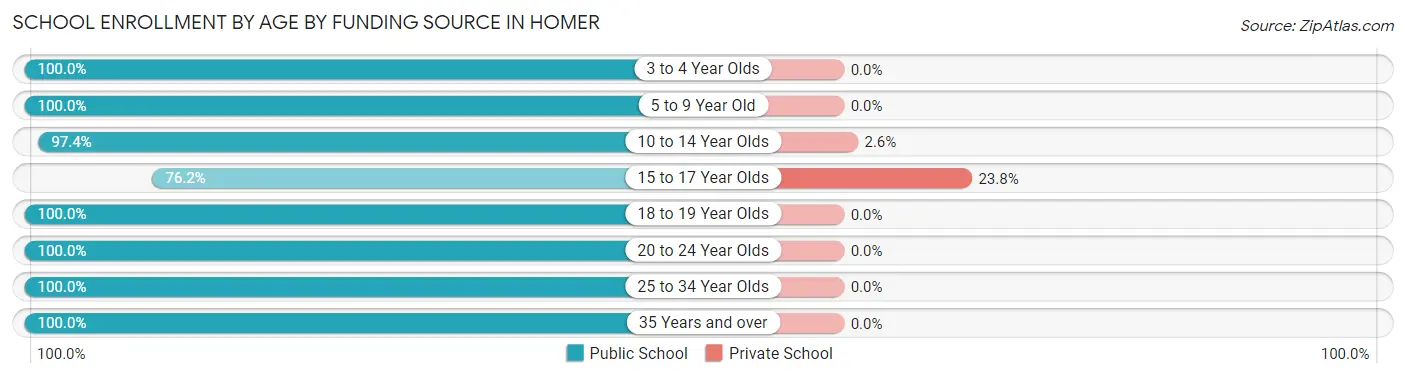
| Age Bracket | Public School | Private School |
| 3 to 4 Year Olds | 55 (100.0%) | 0 (0.0%) |
| 5 to 9 Year Old | 342 (100.0%) | 0 (0.0%) |
| 10 to 14 Year Olds | 227 (97.4%) | 6 (2.6%) |
| 15 to 17 Year Olds | 48 (76.2%) | 15 (23.8%) |
| 18 to 19 Year Olds | 12 (100.0%) | 0 (0.0%) |
| 20 to 24 Year Olds | 80 (100.0%) | 0 (0.0%) |
| 25 to 34 Year Olds | 35 (100.0%) | 0 (0.0%) |
| 35 Years and over | 29 (100.0%) | 0 (0.0%) |
| Total | 828 (97.5%) | 21 (2.5%) |
Educational Attainment by Field of Study in Homer
Business (42 | 26.6%), science & technology (33 | 20.9%), education (33 | 20.9%), arts & humanities (10 | 6.3%), and bio, nature & agricultural (9 | 5.7%) are the most common fields of study among 158 individuals in Homer who have obtained a bachelor's degree or higher.
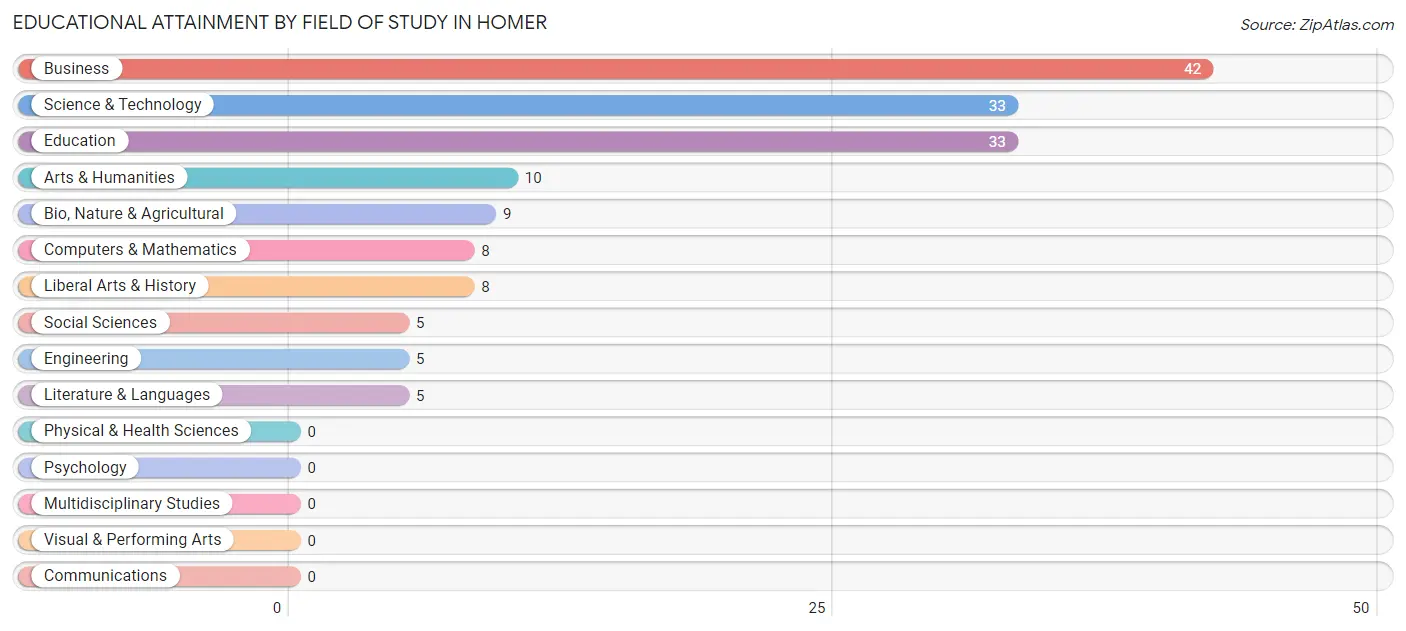
| Field of Study | # Graduates | % Graduates |
| Computers & Mathematics | 8 | 5.1% |
| Bio, Nature & Agricultural | 9 | 5.7% |
| Physical & Health Sciences | 0 | 0.0% |
| Psychology | 0 | 0.0% |
| Social Sciences | 5 | 3.2% |
| Engineering | 5 | 3.2% |
| Multidisciplinary Studies | 0 | 0.0% |
| Science & Technology | 33 | 20.9% |
| Business | 42 | 26.6% |
| Education | 33 | 20.9% |
| Literature & Languages | 5 | 3.2% |
| Liberal Arts & History | 8 | 5.1% |
| Visual & Performing Arts | 0 | 0.0% |
| Communications | 0 | 0.0% |
| Arts & Humanities | 10 | 6.3% |
| Total | 158 | 100.0% |
Transportation & Commute in Homer
Vehicle Availability by Sex in Homer
The most prevalent vehicle ownership categories in Homer are males with 1 vehicle (190, accounting for 55.6%) and females with 1 vehicle (158, making up 38.8%).
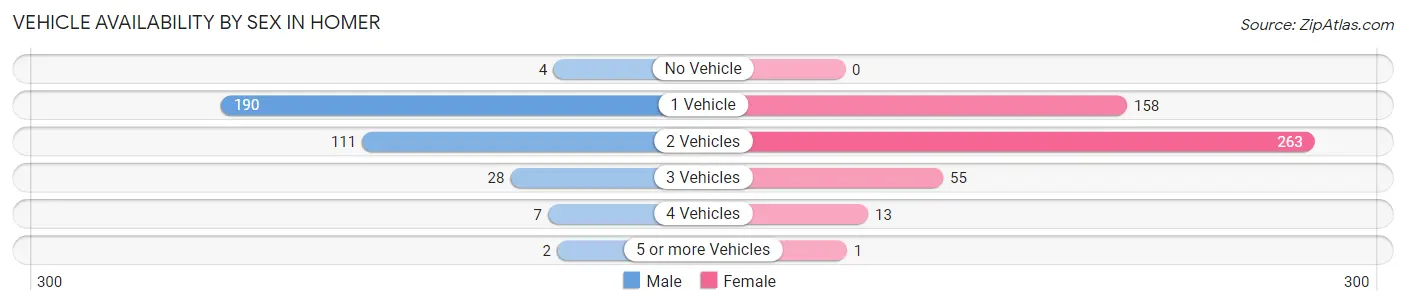
| Vehicles Available | Male | Female |
| No Vehicle | 4 (1.2%) | 0 (0.0%) |
| 1 Vehicle | 190 (55.6%) | 158 (32.2%) |
| 2 Vehicles | 111 (32.5%) | 263 (53.7%) |
| 3 Vehicles | 28 (8.2%) | 55 (11.2%) |
| 4 Vehicles | 7 (2.1%) | 13 (2.6%) |
| 5 or more Vehicles | 2 (0.6%) | 1 (0.2%) |
| Total | 342 (100.0%) | 490 (100.0%) |
Commute Time in Homer
The most frequently occuring commute durations in Homer are 5 to 9 minutes (223 commuters, 28.3%), 20 to 24 minutes (165 commuters, 20.9%), and 25 to 29 minutes (111 commuters, 14.1%).
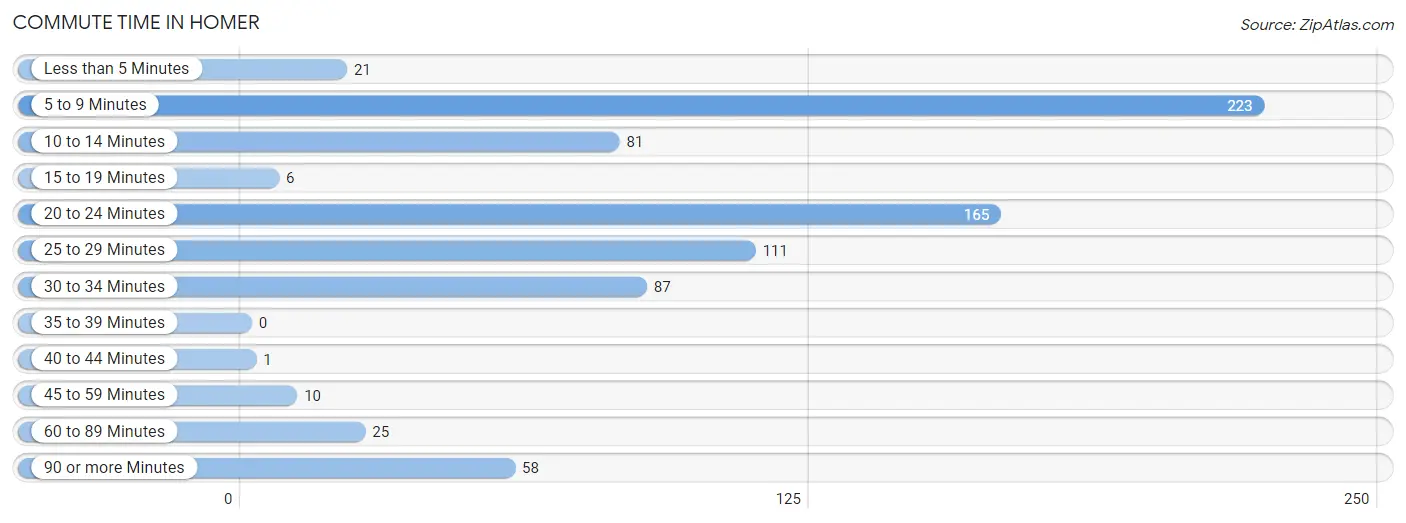
| Commute Time | # Commuters | % Commuters |
| Less than 5 Minutes | 21 | 2.7% |
| 5 to 9 Minutes | 223 | 28.3% |
| 10 to 14 Minutes | 81 | 10.3% |
| 15 to 19 Minutes | 6 | 0.8% |
| 20 to 24 Minutes | 165 | 20.9% |
| 25 to 29 Minutes | 111 | 14.1% |
| 30 to 34 Minutes | 87 | 11.0% |
| 35 to 39 Minutes | 0 | 0.0% |
| 40 to 44 Minutes | 1 | 0.1% |
| 45 to 59 Minutes | 10 | 1.3% |
| 60 to 89 Minutes | 25 | 3.2% |
| 90 or more Minutes | 58 | 7.4% |
Commute Time by Sex in Homer
The most common commute times in Homer are 20 to 24 minutes (97 commuters, 28.8%) for males and 5 to 9 minutes (195 commuters, 43.2%) for females.
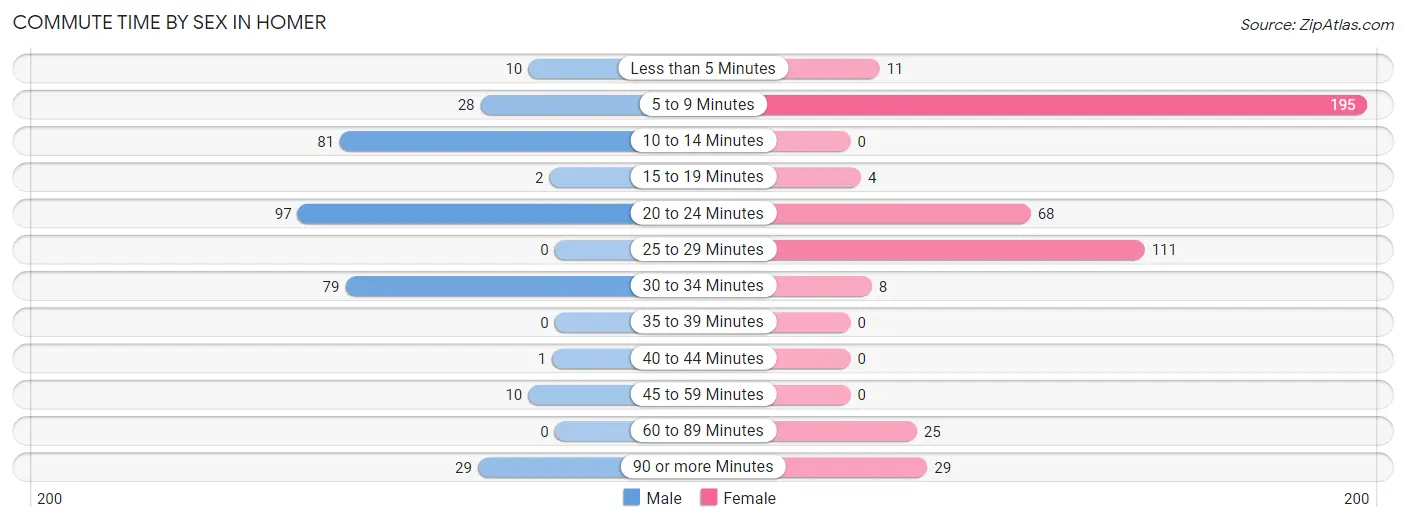
| Commute Time | Male | Female |
| Less than 5 Minutes | 10 (3.0%) | 11 (2.4%) |
| 5 to 9 Minutes | 28 (8.3%) | 195 (43.2%) |
| 10 to 14 Minutes | 81 (24.0%) | 0 (0.0%) |
| 15 to 19 Minutes | 2 (0.6%) | 4 (0.9%) |
| 20 to 24 Minutes | 97 (28.8%) | 68 (15.1%) |
| 25 to 29 Minutes | 0 (0.0%) | 111 (24.6%) |
| 30 to 34 Minutes | 79 (23.4%) | 8 (1.8%) |
| 35 to 39 Minutes | 0 (0.0%) | 0 (0.0%) |
| 40 to 44 Minutes | 1 (0.3%) | 0 (0.0%) |
| 45 to 59 Minutes | 10 (3.0%) | 0 (0.0%) |
| 60 to 89 Minutes | 0 (0.0%) | 25 (5.5%) |
| 90 or more Minutes | 29 (8.6%) | 29 (6.4%) |
Time of Departure to Work by Sex in Homer
The most frequent times of departure to work in Homer are 7:00 AM to 7:29 AM (110, 32.6%) for males and 6:30 AM to 6:59 AM (142, 31.5%) for females.
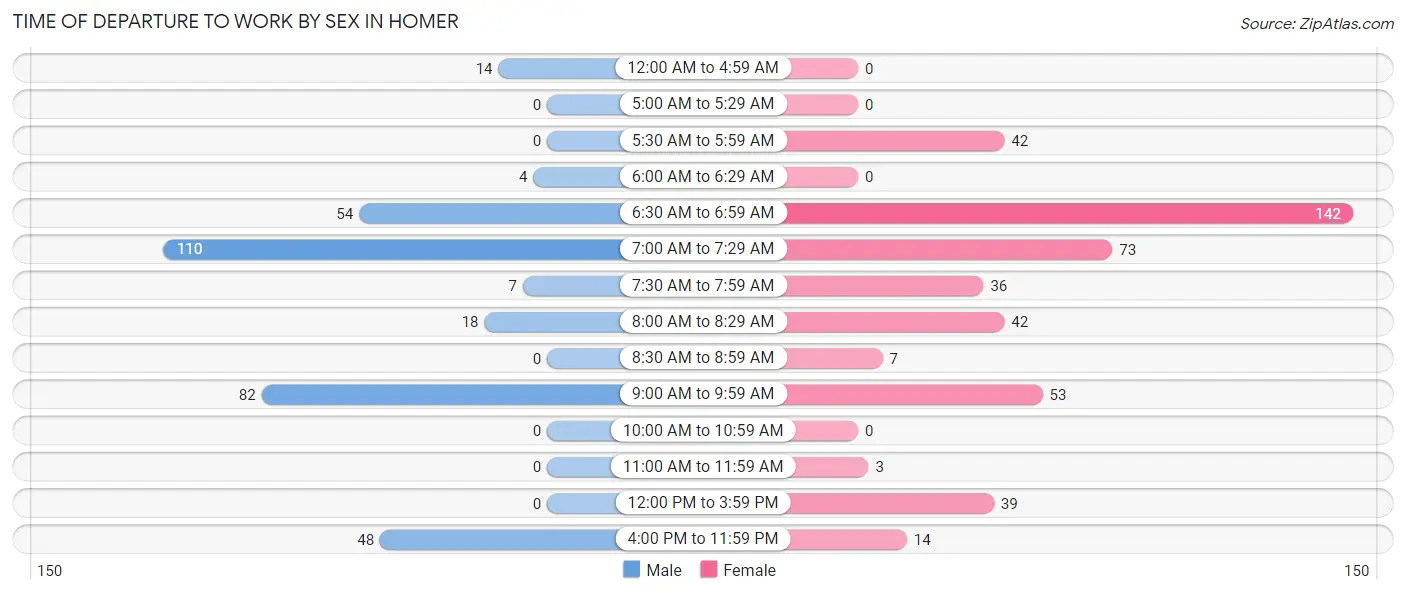
| Time of Departure | Male | Female |
| 12:00 AM to 4:59 AM | 14 (4.2%) | 0 (0.0%) |
| 5:00 AM to 5:29 AM | 0 (0.0%) | 0 (0.0%) |
| 5:30 AM to 5:59 AM | 0 (0.0%) | 42 (9.3%) |
| 6:00 AM to 6:29 AM | 4 (1.2%) | 0 (0.0%) |
| 6:30 AM to 6:59 AM | 54 (16.0%) | 142 (31.5%) |
| 7:00 AM to 7:29 AM | 110 (32.6%) | 73 (16.2%) |
| 7:30 AM to 7:59 AM | 7 (2.1%) | 36 (8.0%) |
| 8:00 AM to 8:29 AM | 18 (5.3%) | 42 (9.3%) |
| 8:30 AM to 8:59 AM | 0 (0.0%) | 7 (1.5%) |
| 9:00 AM to 9:59 AM | 82 (24.3%) | 53 (11.7%) |
| 10:00 AM to 10:59 AM | 0 (0.0%) | 0 (0.0%) |
| 11:00 AM to 11:59 AM | 0 (0.0%) | 3 (0.7%) |
| 12:00 PM to 3:59 PM | 0 (0.0%) | 39 (8.6%) |
| 4:00 PM to 11:59 PM | 48 (14.2%) | 14 (3.1%) |
| Total | 337 (100.0%) | 451 (100.0%) |
Housing Occupancy in Homer
Occupancy by Ownership in Homer
Of the total 973 dwellings in Homer, owner-occupied units account for 415 (42.6%), while renter-occupied units make up 558 (57.4%).
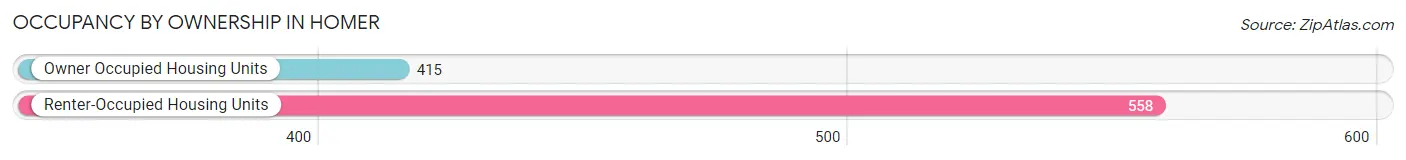
| Occupancy | # Housing Units | % Housing Units |
| Owner Occupied Housing Units | 415 | 42.6% |
| Renter-Occupied Housing Units | 558 | 57.4% |
| Total Occupied Housing Units | 973 | 100.0% |
Occupancy by Household Size in Homer
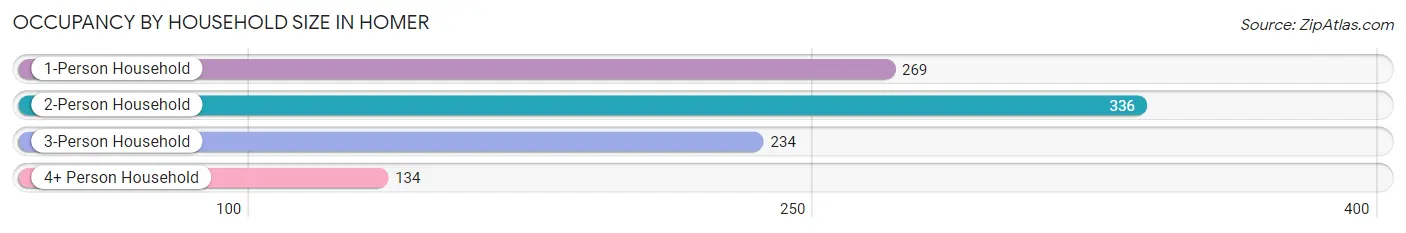
| Household Size | # Housing Units | % Housing Units |
| 1-Person Household | 269 | 27.7% |
| 2-Person Household | 336 | 34.5% |
| 3-Person Household | 234 | 24.0% |
| 4+ Person Household | 134 | 13.8% |
| Total Housing Units | 973 | 100.0% |
Occupancy by Ownership by Household Size in Homer
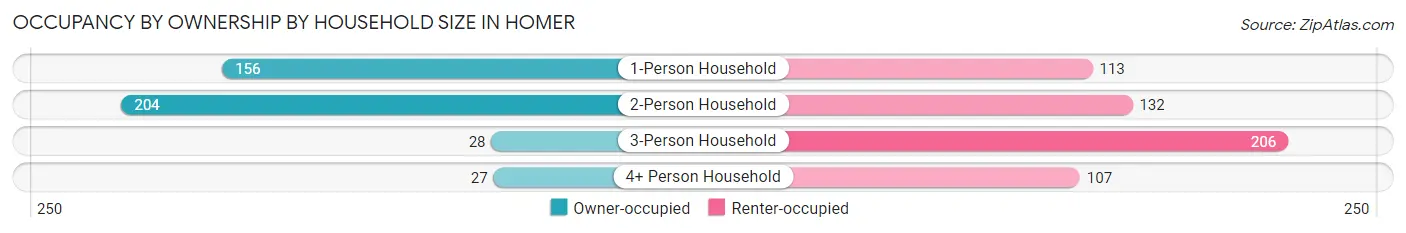
| Household Size | Owner-occupied | Renter-occupied |
| 1-Person Household | 156 (58.0%) | 113 (42.0%) |
| 2-Person Household | 204 (60.7%) | 132 (39.3%) |
| 3-Person Household | 28 (12.0%) | 206 (88.0%) |
| 4+ Person Household | 27 (20.2%) | 107 (79.8%) |
| Total Housing Units | 415 (42.6%) | 558 (57.4%) |
Occupancy by Educational Attainment in Homer
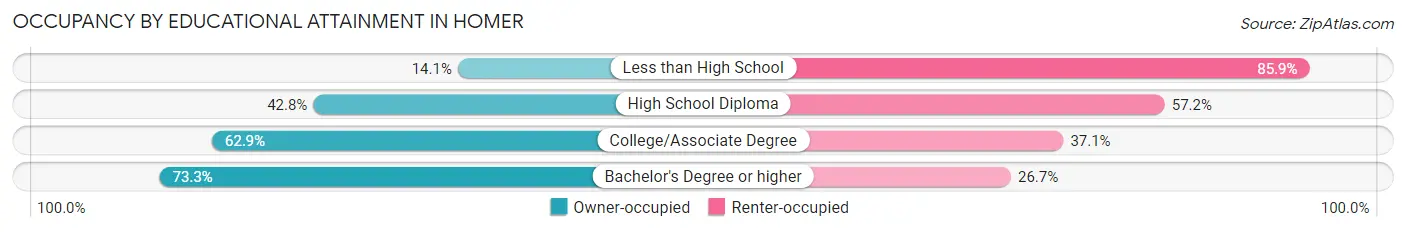
| Household Size | Owner-occupied | Renter-occupied |
| Less than High School | 37 (14.1%) | 225 (85.9%) |
| High School Diploma | 166 (42.8%) | 222 (57.2%) |
| College/Associate Degree | 149 (62.9%) | 88 (37.1%) |
| Bachelor's Degree or higher | 63 (73.3%) | 23 (26.7%) |
Occupancy by Age of Householder in Homer
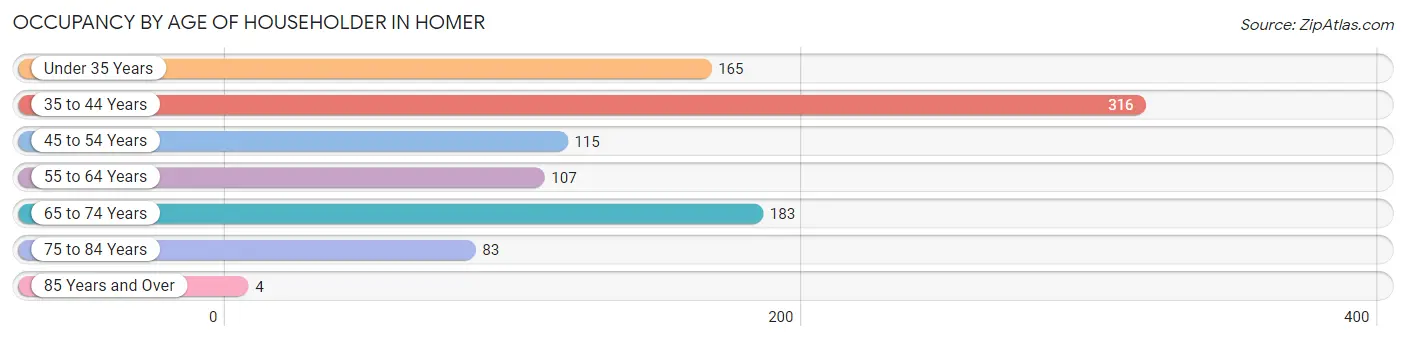
| Age Bracket | # Households | % Households |
| Under 35 Years | 165 | 17.0% |
| 35 to 44 Years | 316 | 32.5% |
| 45 to 54 Years | 115 | 11.8% |
| 55 to 64 Years | 107 | 11.0% |
| 65 to 74 Years | 183 | 18.8% |
| 75 to 84 Years | 83 | 8.5% |
| 85 Years and Over | 4 | 0.4% |
| Total | 973 | 100.0% |
Housing Finances in Homer
Median Income by Occupancy in Homer
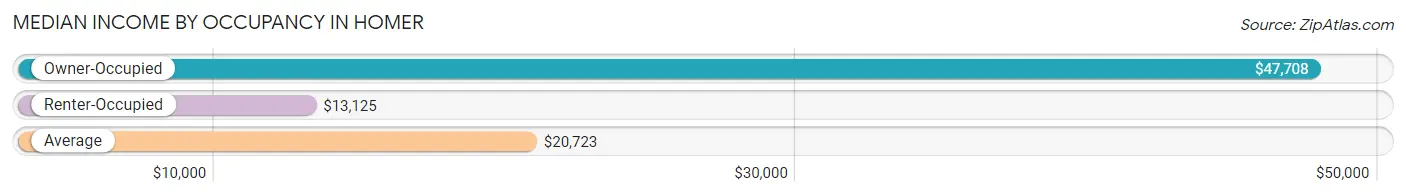
| Occupancy Type | # Households | Median Income |
| Owner-Occupied | 415 (42.6%) | $47,708 |
| Renter-Occupied | 558 (57.4%) | $13,125 |
| Average | 973 (100.0%) | $20,723 |
Occupancy by Householder Income Bracket in Homer
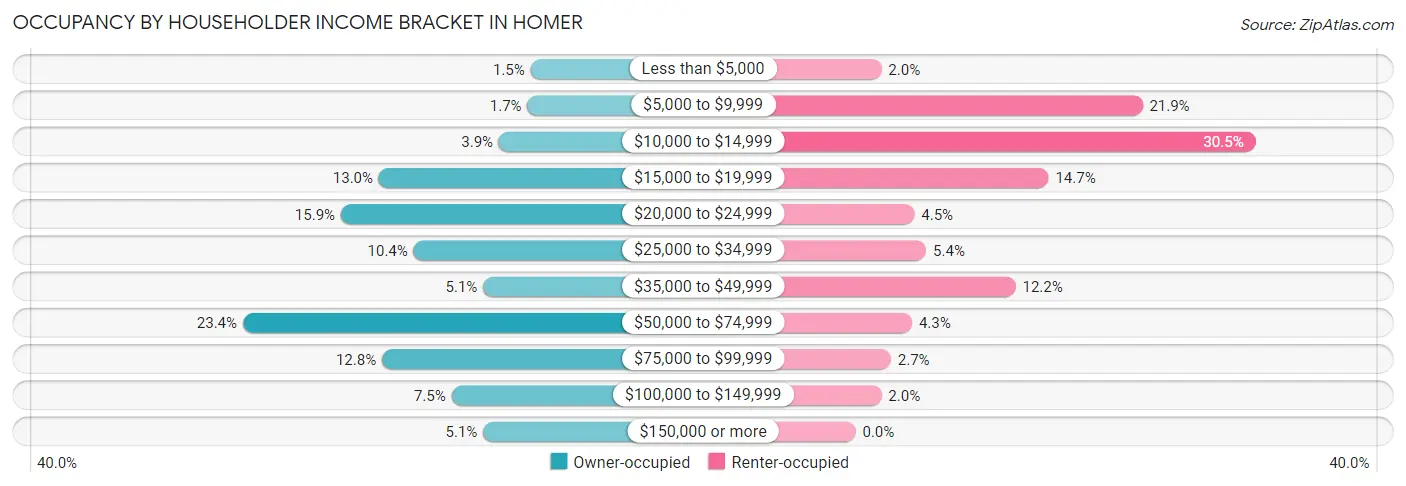
| Income Bracket | Owner-occupied | Renter-occupied |
| Less than $5,000 | 6 (1.5%) | 11 (2.0%) |
| $5,000 to $9,999 | 7 (1.7%) | 122 (21.9%) |
| $10,000 to $14,999 | 16 (3.9%) | 170 (30.5%) |
| $15,000 to $19,999 | 54 (13.0%) | 82 (14.7%) |
| $20,000 to $24,999 | 66 (15.9%) | 25 (4.5%) |
| $25,000 to $34,999 | 43 (10.4%) | 30 (5.4%) |
| $35,000 to $49,999 | 21 (5.1%) | 68 (12.2%) |
| $50,000 to $74,999 | 97 (23.4%) | 24 (4.3%) |
| $75,000 to $99,999 | 53 (12.8%) | 15 (2.7%) |
| $100,000 to $149,999 | 31 (7.5%) | 11 (2.0%) |
| $150,000 or more | 21 (5.1%) | 0 (0.0%) |
| Total | 415 (100.0%) | 558 (100.0%) |
Monthly Housing Cost Tiers in Homer
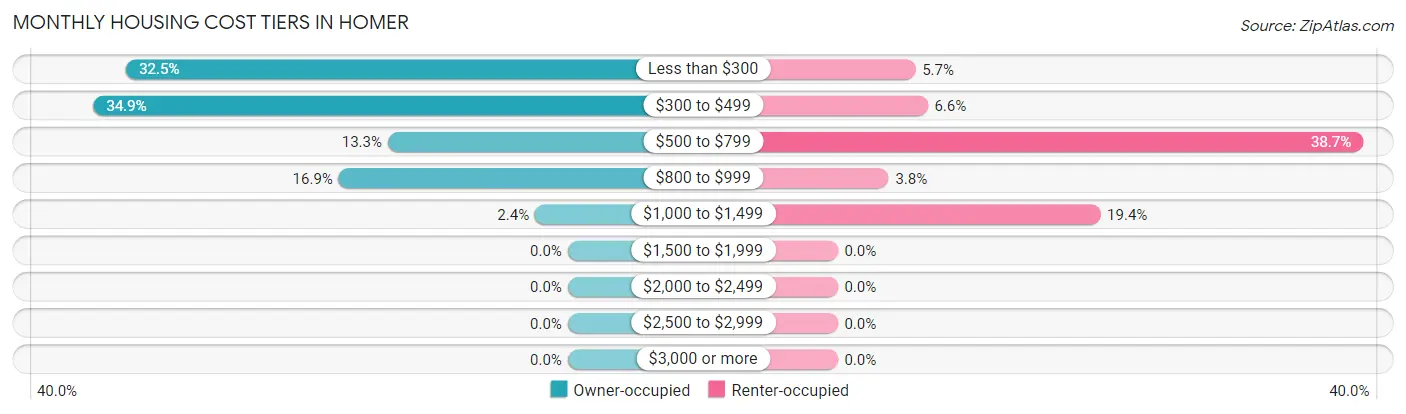
| Monthly Cost | Owner-occupied | Renter-occupied |
| Less than $300 | 135 (32.5%) | 32 (5.7%) |
| $300 to $499 | 145 (34.9%) | 37 (6.6%) |
| $500 to $799 | 55 (13.3%) | 216 (38.7%) |
| $800 to $999 | 70 (16.9%) | 21 (3.8%) |
| $1,000 to $1,499 | 10 (2.4%) | 108 (19.4%) |
| $1,500 to $1,999 | 0 (0.0%) | 0 (0.0%) |
| $2,000 to $2,499 | 0 (0.0%) | 0 (0.0%) |
| $2,500 to $2,999 | 0 (0.0%) | 0 (0.0%) |
| $3,000 or more | 0 (0.0%) | 0 (0.0%) |
| Total | 415 (100.0%) | 558 (100.0%) |
Physical Housing Characteristics in Homer
Housing Structures in Homer
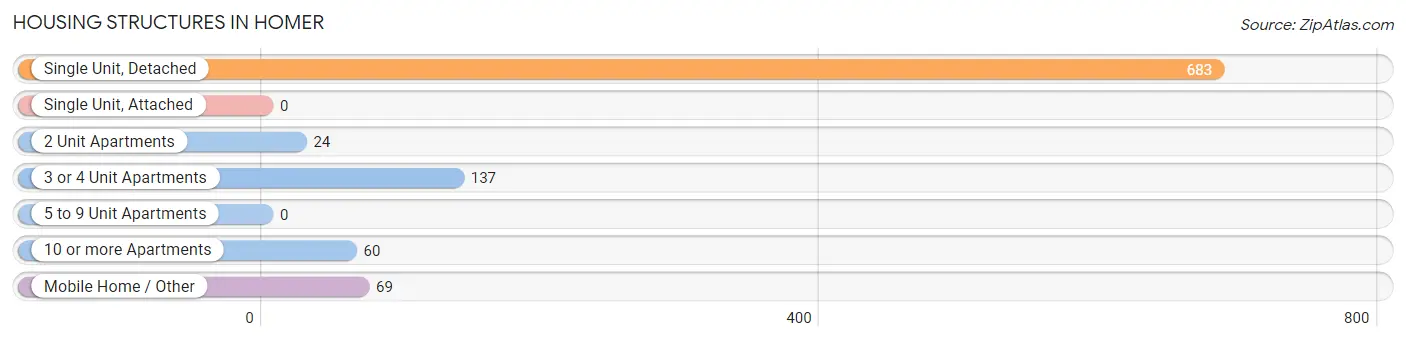
| Structure Type | # Housing Units | % Housing Units |
| Single Unit, Detached | 683 | 70.2% |
| Single Unit, Attached | 0 | 0.0% |
| 2 Unit Apartments | 24 | 2.5% |
| 3 or 4 Unit Apartments | 137 | 14.1% |
| 5 to 9 Unit Apartments | 0 | 0.0% |
| 10 or more Apartments | 60 | 6.2% |
| Mobile Home / Other | 69 | 7.1% |
| Total | 973 | 100.0% |
Housing Structures by Occupancy in Homer
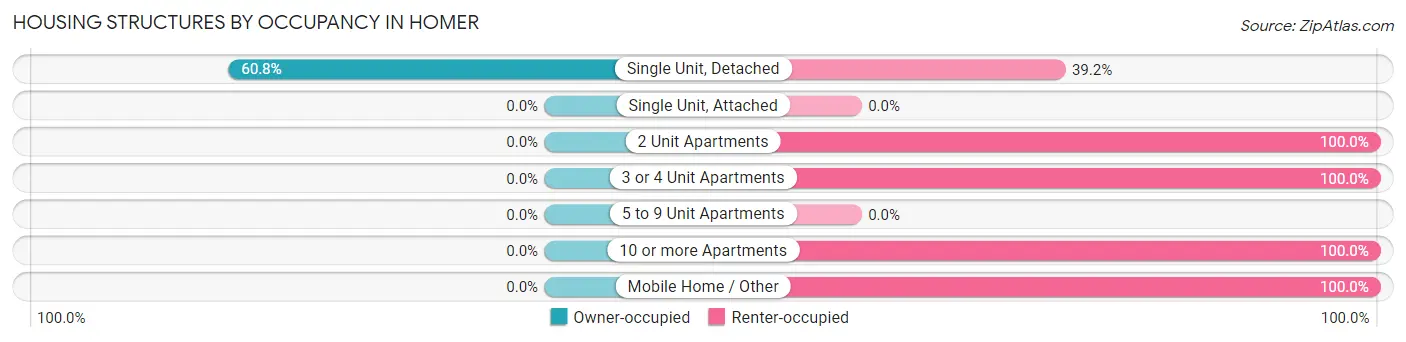
| Structure Type | Owner-occupied | Renter-occupied |
| Single Unit, Detached | 415 (60.8%) | 268 (39.2%) |
| Single Unit, Attached | 0 (0.0%) | 0 (0.0%) |
| 2 Unit Apartments | 0 (0.0%) | 24 (100.0%) |
| 3 or 4 Unit Apartments | 0 (0.0%) | 137 (100.0%) |
| 5 to 9 Unit Apartments | 0 (0.0%) | 0 (0.0%) |
| 10 or more Apartments | 0 (0.0%) | 60 (100.0%) |
| Mobile Home / Other | 0 (0.0%) | 69 (100.0%) |
| Total | 415 (42.6%) | 558 (57.4%) |
Housing Structures by Number of Rooms in Homer
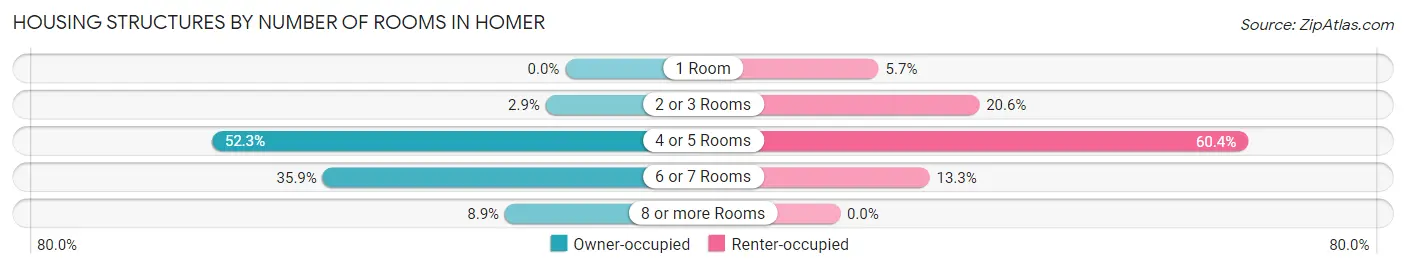
| Number of Rooms | Owner-occupied | Renter-occupied |
| 1 Room | 0 (0.0%) | 32 (5.7%) |
| 2 or 3 Rooms | 12 (2.9%) | 115 (20.6%) |
| 4 or 5 Rooms | 217 (52.3%) | 337 (60.4%) |
| 6 or 7 Rooms | 149 (35.9%) | 74 (13.3%) |
| 8 or more Rooms | 37 (8.9%) | 0 (0.0%) |
| Total | 415 (100.0%) | 558 (100.0%) |
Housing Structure by Heating Type in Homer
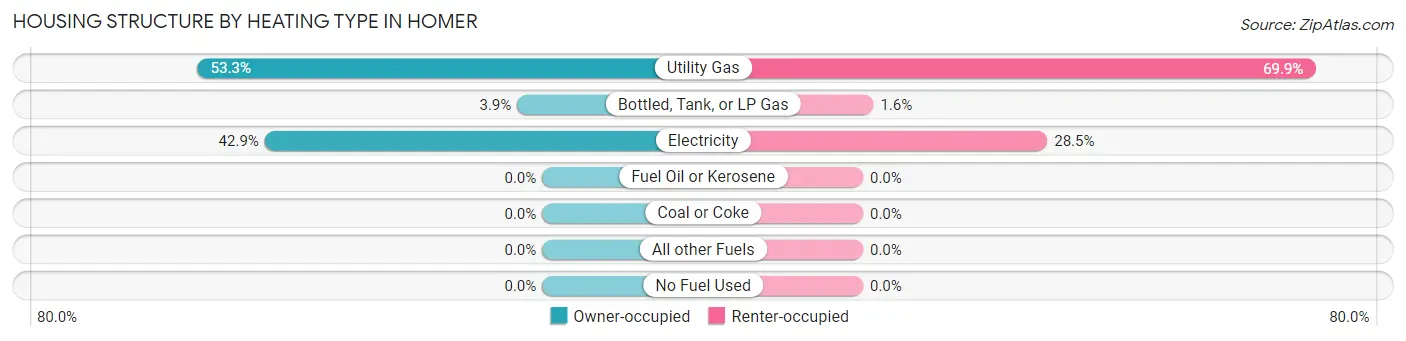
| Heating Type | Owner-occupied | Renter-occupied |
| Utility Gas | 221 (53.2%) | 390 (69.9%) |
| Bottled, Tank, or LP Gas | 16 (3.9%) | 9 (1.6%) |
| Electricity | 178 (42.9%) | 159 (28.5%) |
| Fuel Oil or Kerosene | 0 (0.0%) | 0 (0.0%) |
| Coal or Coke | 0 (0.0%) | 0 (0.0%) |
| All other Fuels | 0 (0.0%) | 0 (0.0%) |
| No Fuel Used | 0 (0.0%) | 0 (0.0%) |
| Total | 415 (100.0%) | 558 (100.0%) |
Household Vehicle Usage in Homer
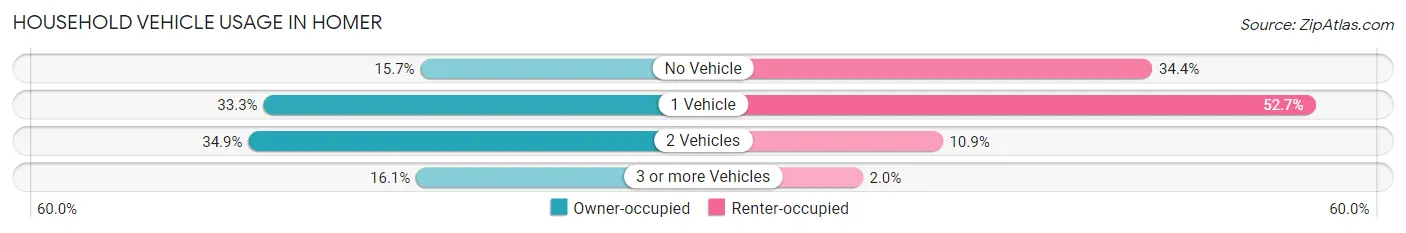
| Vehicles per Household | Owner-occupied | Renter-occupied |
| No Vehicle | 65 (15.7%) | 192 (34.4%) |
| 1 Vehicle | 138 (33.3%) | 294 (52.7%) |
| 2 Vehicles | 145 (34.9%) | 61 (10.9%) |
| 3 or more Vehicles | 67 (16.1%) | 11 (2.0%) |
| Total | 415 (100.0%) | 558 (100.0%) |
Real Estate & Mortgages in Homer
Real Estate and Mortgage Overview in Homer
| Characteristic | Without Mortgage | With Mortgage |
| Housing Units | 290 | 125 |
| Median Property Value | $48,400 | $65,000 |
| Median Household Income | $29,750 | $15 |
| Monthly Housing Costs | $314 | $0 |
| Real Estate Taxes | $220 | $41 |
Property Value by Mortgage Status in Homer
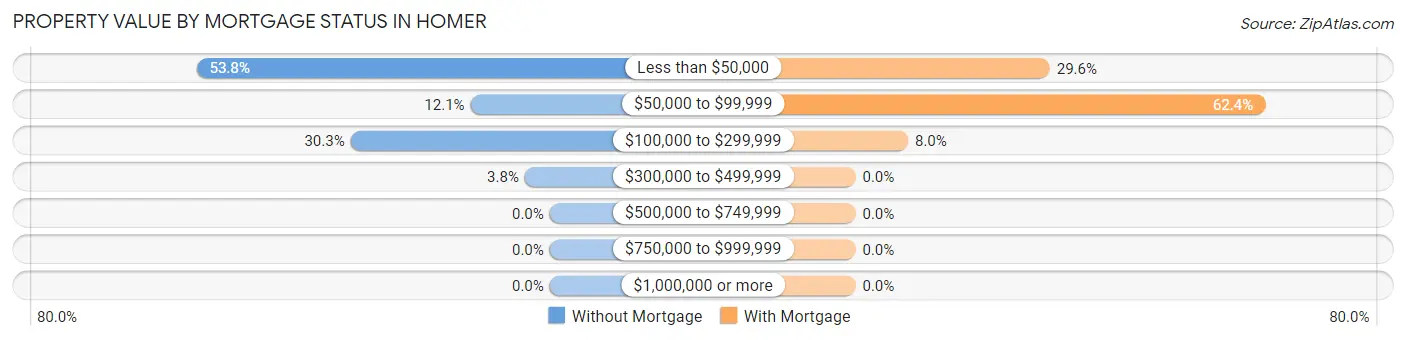
| Property Value | Without Mortgage | With Mortgage |
| Less than $50,000 | 156 (53.8%) | 37 (29.6%) |
| $50,000 to $99,999 | 35 (12.1%) | 78 (62.4%) |
| $100,000 to $299,999 | 88 (30.3%) | 10 (8.0%) |
| $300,000 to $499,999 | 11 (3.8%) | 0 (0.0%) |
| $500,000 to $749,999 | 0 (0.0%) | 0 (0.0%) |
| $750,000 to $999,999 | 0 (0.0%) | 0 (0.0%) |
| $1,000,000 or more | 0 (0.0%) | 0 (0.0%) |
| Total | 290 (100.0%) | 125 (100.0%) |
Household Income by Mortgage Status in Homer
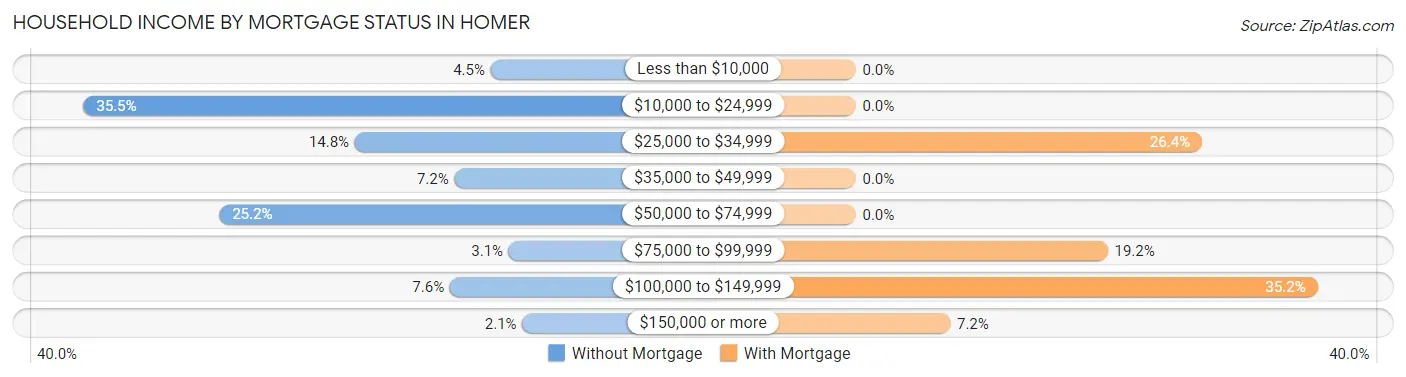
| Household Income | Without Mortgage | With Mortgage |
| Less than $10,000 | 13 (4.5%) | 0 (0.0%) |
| $10,000 to $24,999 | 103 (35.5%) | 0 (0.0%) |
| $25,000 to $34,999 | 43 (14.8%) | 33 (26.4%) |
| $35,000 to $49,999 | 21 (7.2%) | 0 (0.0%) |
| $50,000 to $74,999 | 73 (25.2%) | 0 (0.0%) |
| $75,000 to $99,999 | 9 (3.1%) | 24 (19.2%) |
| $100,000 to $149,999 | 22 (7.6%) | 44 (35.2%) |
| $150,000 or more | 6 (2.1%) | 9 (7.2%) |
| Total | 290 (100.0%) | 125 (100.0%) |
Property Value to Household Income Ratio in Homer
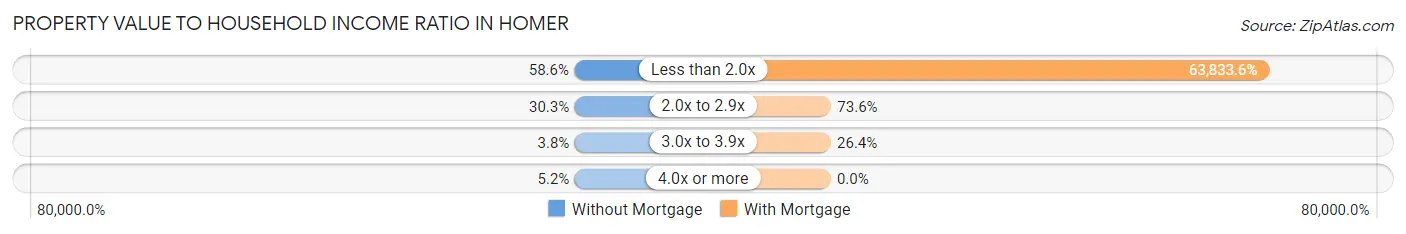
| Value-to-Income Ratio | Without Mortgage | With Mortgage |
| Less than 2.0x | 170 (58.6%) | 79,792 (63,833.6%) |
| 2.0x to 2.9x | 88 (30.3%) | 92 (73.6%) |
| 3.0x to 3.9x | 11 (3.8%) | 33 (26.4%) |
| 4.0x or more | 15 (5.2%) | 0 (0.0%) |
| Total | 290 (100.0%) | 125 (100.0%) |
Real Estate Taxes by Mortgage Status in Homer
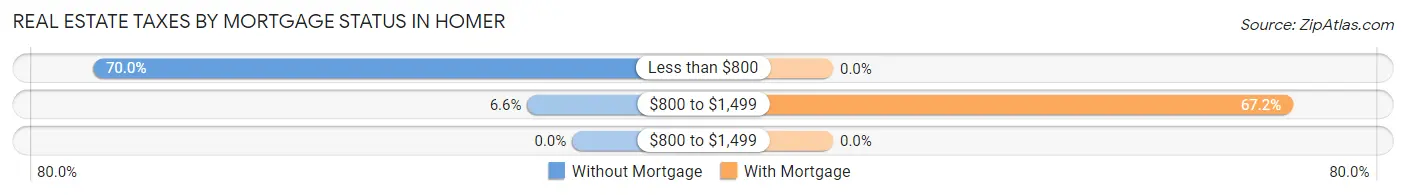
| Property Taxes | Without Mortgage | With Mortgage |
| Less than $800 | 203 (70.0%) | 0 (0.0%) |
| $800 to $1,499 | 19 (6.6%) | 84 (67.2%) |
| $800 to $1,499 | 0 (0.0%) | 0 (0.0%) |
| Total | 290 (100.0%) | 125 (100.0%) |
Health & Disability in Homer
Health Insurance Coverage by Age in Homer
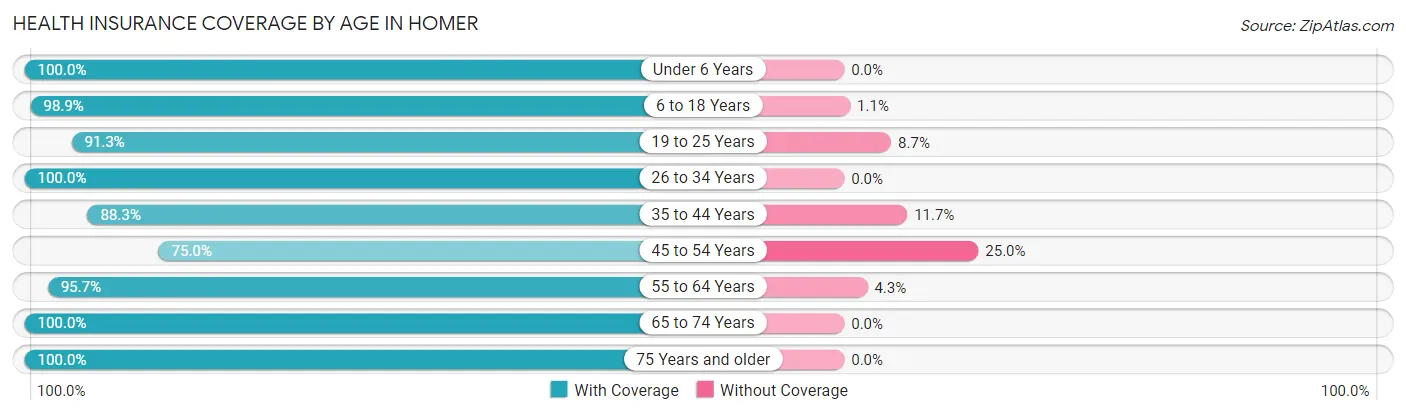
| Age Bracket | With Coverage | Without Coverage |
| Under 6 Years | 320 (100.0%) | 0 (0.0%) |
| 6 to 18 Years | 637 (98.9%) | 7 (1.1%) |
| 19 to 25 Years | 282 (91.3%) | 27 (8.7%) |
| 26 to 34 Years | 210 (100.0%) | 0 (0.0%) |
| 35 to 44 Years | 444 (88.3%) | 59 (11.7%) |
| 45 to 54 Years | 174 (75.0%) | 58 (25.0%) |
| 55 to 64 Years | 155 (95.7%) | 7 (4.3%) |
| 65 to 74 Years | 248 (100.0%) | 0 (0.0%) |
| 75 Years and older | 111 (100.0%) | 0 (0.0%) |
| Total | 2,581 (94.2%) | 158 (5.8%) |
Health Insurance Coverage by Citizenship Status in Homer
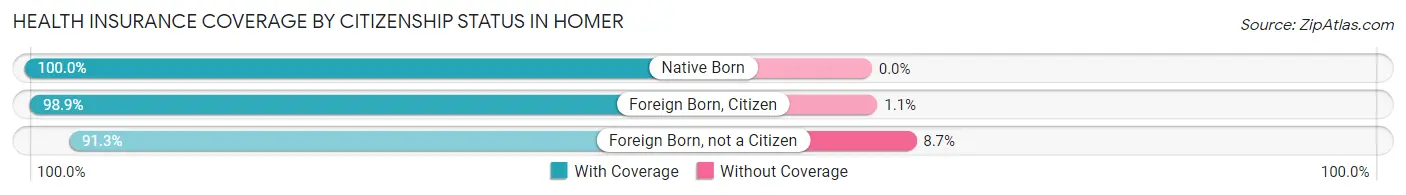
| Citizenship Status | With Coverage | Without Coverage |
| Native Born | 320 (100.0%) | 0 (0.0%) |
| Foreign Born, Citizen | 637 (98.9%) | 7 (1.1%) |
| Foreign Born, not a Citizen | 282 (91.3%) | 27 (8.7%) |
Health Insurance Coverage by Household Income in Homer
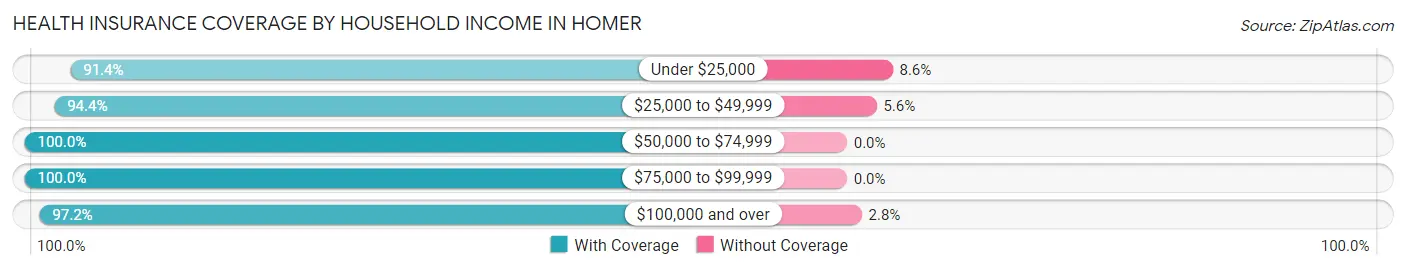
| Household Income | With Coverage | Without Coverage |
| Under $25,000 | 1,227 (91.4%) | 115 (8.6%) |
| $25,000 to $49,999 | 628 (94.4%) | 37 (5.6%) |
| $50,000 to $74,999 | 316 (100.0%) | 0 (0.0%) |
| $75,000 to $99,999 | 200 (100.0%) | 0 (0.0%) |
| $100,000 and over | 210 (97.2%) | 6 (2.8%) |
Public vs Private Health Insurance Coverage by Age in Homer
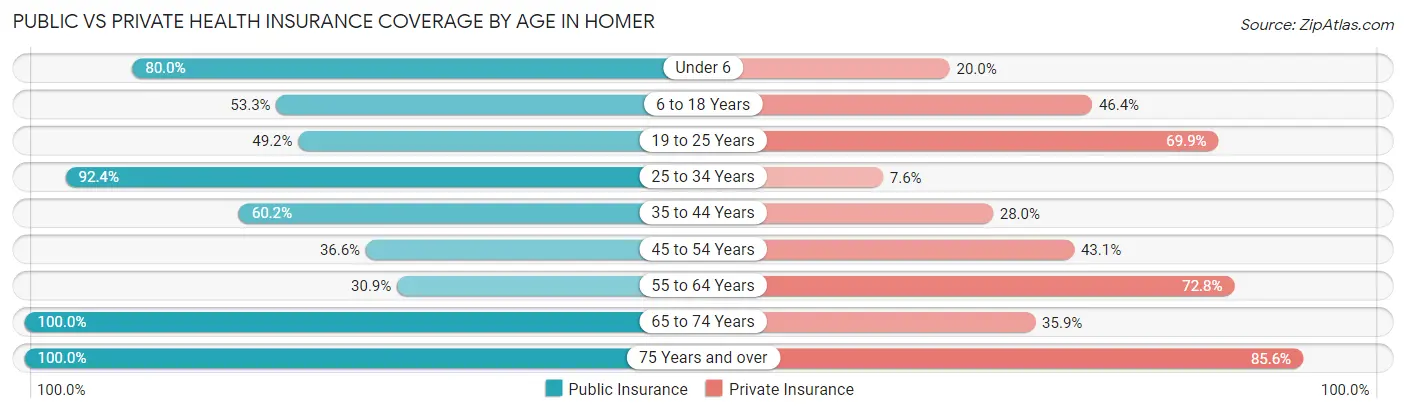
| Age Bracket | Public Insurance | Private Insurance |
| Under 6 | 256 (80.0%) | 64 (20.0%) |
| 6 to 18 Years | 343 (53.3%) | 299 (46.4%) |
| 19 to 25 Years | 152 (49.2%) | 216 (69.9%) |
| 25 to 34 Years | 194 (92.4%) | 16 (7.6%) |
| 35 to 44 Years | 303 (60.2%) | 141 (28.0%) |
| 45 to 54 Years | 85 (36.6%) | 100 (43.1%) |
| 55 to 64 Years | 50 (30.9%) | 118 (72.8%) |
| 65 to 74 Years | 248 (100.0%) | 89 (35.9%) |
| 75 Years and over | 111 (100.0%) | 95 (85.6%) |
| Total | 1,742 (63.6%) | 1,138 (41.5%) |
Disability Status by Sex by Age in Homer
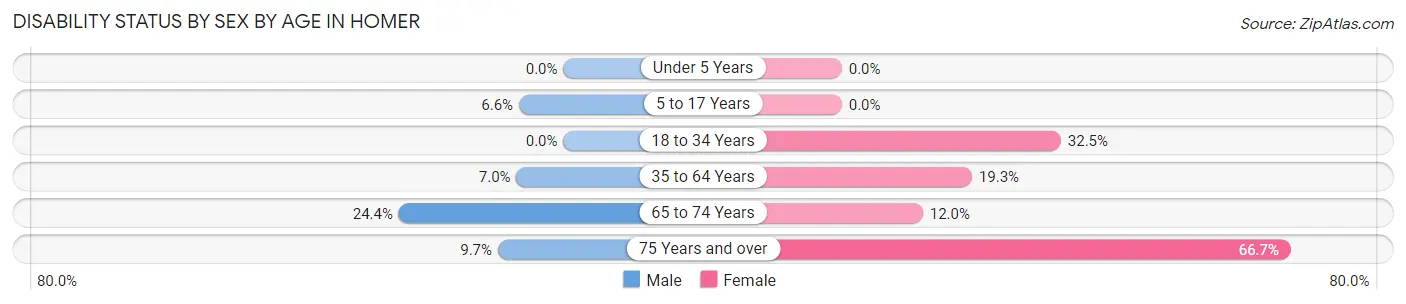
| Age Bracket | Male | Female |
| Under 5 Years | 0 (0.0%) | 0 (0.0%) |
| 5 to 17 Years | 23 (6.6%) | 0 (0.0%) |
| 18 to 34 Years | 0 (0.0%) | 95 (32.5%) |
| 35 to 64 Years | 29 (7.0%) | 93 (19.3%) |
| 65 to 74 Years | 22 (24.4%) | 19 (12.0%) |
| 75 Years and over | 7 (9.7%) | 26 (66.7%) |
Disability Class by Sex by Age in Homer
Disability Class: Hearing Difficulty
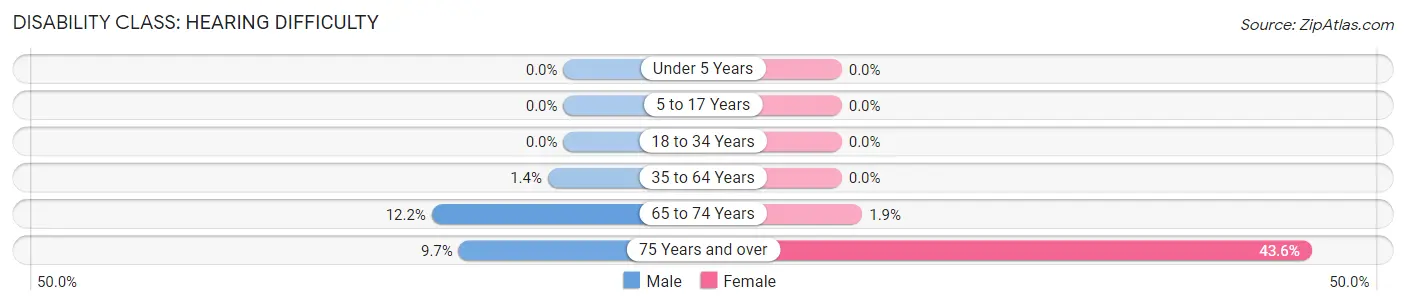
| Age Bracket | Male | Female |
| Under 5 Years | 0 (0.0%) | 0 (0.0%) |
| 5 to 17 Years | 0 (0.0%) | 0 (0.0%) |
| 18 to 34 Years | 0 (0.0%) | 0 (0.0%) |
| 35 to 64 Years | 6 (1.4%) | 0 (0.0%) |
| 65 to 74 Years | 11 (12.2%) | 3 (1.9%) |
| 75 Years and over | 7 (9.7%) | 17 (43.6%) |
Disability Class: Vision Difficulty
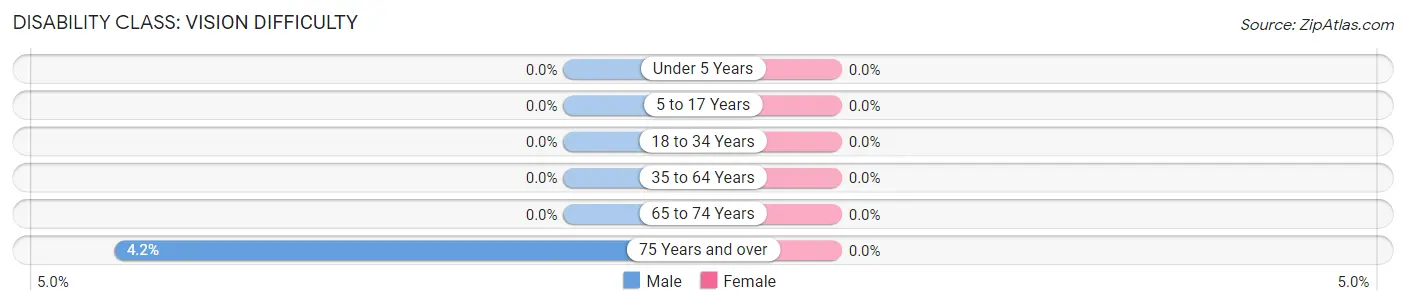
| Age Bracket | Male | Female |
| Under 5 Years | 0 (0.0%) | 0 (0.0%) |
| 5 to 17 Years | 0 (0.0%) | 0 (0.0%) |
| 18 to 34 Years | 0 (0.0%) | 0 (0.0%) |
| 35 to 64 Years | 0 (0.0%) | 0 (0.0%) |
| 65 to 74 Years | 0 (0.0%) | 0 (0.0%) |
| 75 Years and over | 3 (4.2%) | 0 (0.0%) |
Disability Class: Cognitive Difficulty
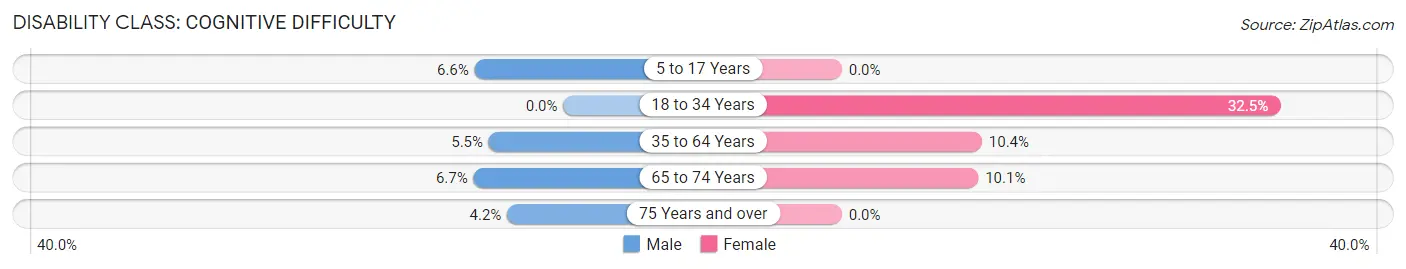
| Age Bracket | Male | Female |
| 5 to 17 Years | 23 (6.6%) | 0 (0.0%) |
| 18 to 34 Years | 0 (0.0%) | 95 (32.5%) |
| 35 to 64 Years | 23 (5.5%) | 50 (10.4%) |
| 65 to 74 Years | 6 (6.7%) | 16 (10.1%) |
| 75 Years and over | 3 (4.2%) | 0 (0.0%) |
Disability Class: Ambulatory Difficulty
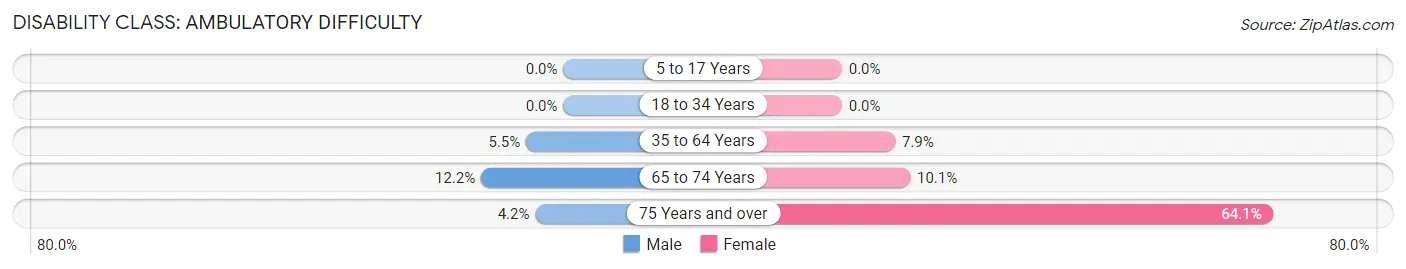
| Age Bracket | Male | Female |
| 5 to 17 Years | 0 (0.0%) | 0 (0.0%) |
| 18 to 34 Years | 0 (0.0%) | 0 (0.0%) |
| 35 to 64 Years | 23 (5.5%) | 38 (7.9%) |
| 65 to 74 Years | 11 (12.2%) | 16 (10.1%) |
| 75 Years and over | 3 (4.2%) | 25 (64.1%) |
Disability Class: Self-Care Difficulty
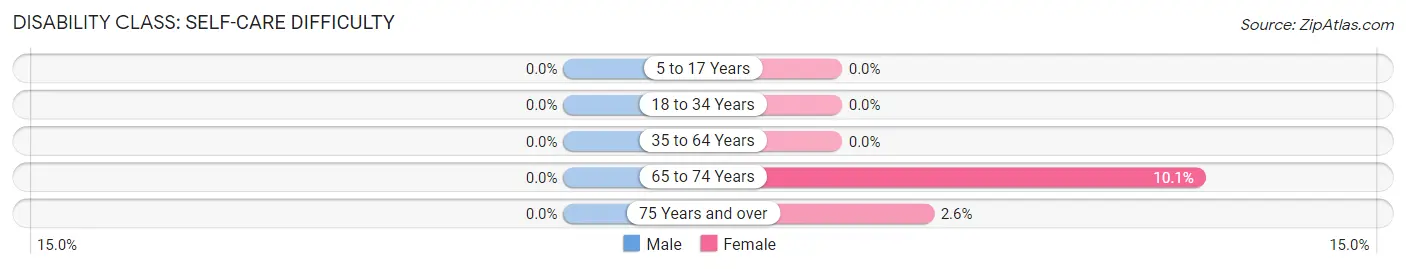
| Age Bracket | Male | Female |
| 5 to 17 Years | 0 (0.0%) | 0 (0.0%) |
| 18 to 34 Years | 0 (0.0%) | 0 (0.0%) |
| 35 to 64 Years | 0 (0.0%) | 0 (0.0%) |
| 65 to 74 Years | 0 (0.0%) | 16 (10.1%) |
| 75 Years and over | 0 (0.0%) | 1 (2.6%) |
Technology Access in Homer
Computing Device Access in Homer
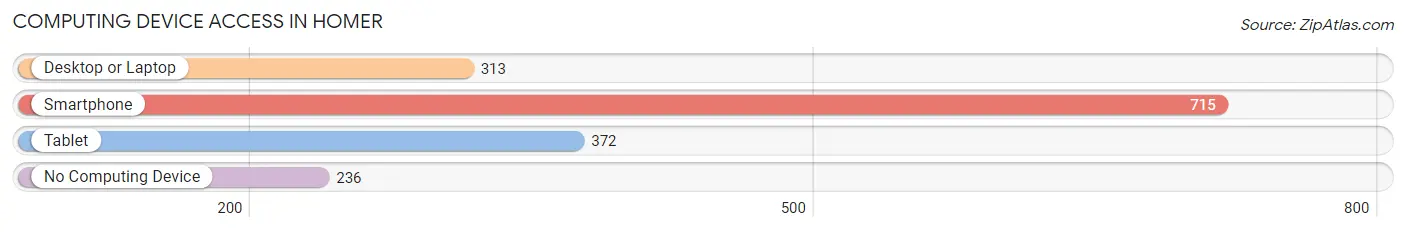
| Device Type | # Households | % Households |
| Desktop or Laptop | 313 | 32.2% |
| Smartphone | 715 | 73.5% |
| Tablet | 372 | 38.2% |
| No Computing Device | 236 | 24.2% |
| Total | 973 | 100.0% |
Internet Access in Homer
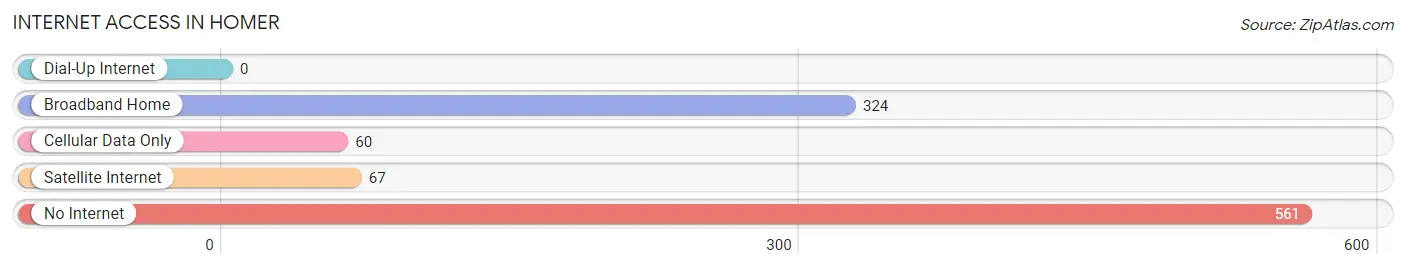
| Internet Type | # Households | % Households |
| Dial-Up Internet | 0 | 0.0% |
| Broadband Home | 324 | 33.3% |
| Cellular Data Only | 60 | 6.2% |
| Satellite Internet | 67 | 6.9% |
| No Internet | 561 | 57.7% |
| Total | 973 | 100.0% |
Homer Summary
Homer, Louisiana is a small town located in Claiborne Parish in the northwestern corner of the state. It is situated on the banks of the Ouachita River, and is the parish seat of Claiborne Parish. The town has a population of approximately 3,000 people, and is known for its rich history and culture.
History
Homer was founded in 1848 by a group of settlers from the nearby town of Athens. The town was named after the Greek poet Homer, and was originally intended to be a trading post for the local farmers and ranchers. The town quickly grew, and by the late 19th century, it had become a thriving commercial center. The town was also home to a number of businesses, including a cotton gin, a sawmill, and a gristmill.
In the early 20th century, Homer was a major stop on the Louisiana and Arkansas Railroad. The railroad brought in a number of new businesses, including a hotel, a bank, and a movie theater. The town also became a popular destination for tourists, who came to enjoy the town’s natural beauty and its many attractions.
Geography
Homer is located in the northwestern corner of Louisiana, in Claiborne Parish. The town is situated on the banks of the Ouachita River, and is surrounded by rolling hills and forests. The town is located approximately 30 miles from the state capital of Baton Rouge, and is approximately 90 miles from the city of Shreveport.
The climate in Homer is generally mild, with temperatures ranging from the mid-50s in the winter to the mid-80s in the summer. The town receives an average of 48 inches of rain per year, and is known for its mild winters and hot summers.
Economy
Homer’s economy is largely based on agriculture and tourism. The town is home to a number of farms, which produce a variety of crops, including cotton, corn, soybeans, and wheat. The town is also home to a number of tourist attractions, including the Homer Historic District, the Homer Museum, and the Homer Country Club.
The town is also home to a number of businesses, including restaurants, retail stores, and service providers. The town is also home to a number of manufacturing companies, which produce a variety of products, including furniture, clothing, and electronics.
Demographics
As of the 2010 census, Homer had a population of 3,000 people. The town is predominantly white, with approximately 75% of the population identifying as white. The town is also home to a small African American population, with approximately 15% of the population identifying as African American. The town is also home to a small Hispanic population, with approximately 5% of the population identifying as Hispanic.
Homer is a small town with a rich history and culture. The town is home to a number of businesses, farms, and tourist attractions, and is a popular destination for tourists and locals alike. The town is also home to a diverse population, with a variety of ethnic backgrounds and cultures.
Common Questions
What is Per Capita Income in Homer?
Per Capita income in Homer is $18,752.
What is the Median Family Income in Homer?
Median Family Income in Homer is $32,813.
What is the Median Household income in Homer?
Median Household Income in Homer is $20,723.
What is Income or Wage Gap in Homer?
Income or Wage Gap in Homer is 34.6%.
Women in Homer earn 65.4 cents for every dollar earned by a man.
What is Inequality or Gini Index in Homer?
Inequality or Gini Index in Homer is 0.62.
What is the Total Population of Homer?
Total Population of Homer is 2,739.
What is the Total Male Population of Homer?
Total Male Population of Homer is 1,401.
What is the Total Female Population of Homer?
Total Female Population of Homer is 1,338.
What is the Ratio of Males per 100 Females in Homer?
There are 104.71 Males per 100 Females in Homer.
What is the Ratio of Females per 100 Males in Homer?
There are 95.50 Females per 100 Males in Homer.
What is the Median Population Age in Homer?
Median Population Age in Homer is 26.9 Years.
What is the Average Family Size in Homer
Average Family Size in Homer is 3.7 People.
What is the Average Household Size in Homer
Average Household Size in Homer is 2.8 People.
How Large is the Labor Force in Homer?
There are 878 People in the Labor Forcein in Homer.
What is the Percentage of People in the Labor Force in Homer?
47.0% of People are in the Labor Force in Homer.
What is the Unemployment Rate in Homer?
Unemployment Rate in Homer is 5.2%.