Hester, LA Map & Demographics
Hester Map
Hester Overview
$39,224
PER CAPITA INCOME
$138,529
AVG FAMILY INCOME
$137,923
AVG HOUSEHOLD INCOME
50.4%
WAGE / INCOME GAP [ % ]
49.6¢/ $1
WAGE / INCOME GAP [ $ ]
0.23
INEQUALITY / GINI INDEX
706
TOTAL POPULATION
330
MALE POPULATION
376
FEMALE POPULATION
87.77
MALES / 100 FEMALES
113.94
FEMALES / 100 MALES
32.6
MEDIAN AGE
4.1
AVG FAMILY SIZE
3.6
AVG HOUSEHOLD SIZE
364
LABOR FORCE [ PEOPLE ]
85.8%
PERCENT IN LABOR FORCE
Hester Zip Codes
Hester Area Codes
Income in Hester
Income Overview in Hester
Per Capita Income in Hester is $39,224, while median incomes of families and households are $138,529 and $137,923 respectively.
| Characteristic | Number | Measure |
| Per Capita Income | 706 | $39,224 |
| Median Family Income | 164 | $138,529 |
| Mean Family Income | 164 | $153,511 |
| Median Household Income | 197 | $137,923 |
| Mean Household Income | 197 | $134,978 |
| Income Deficit | 164 | $0 |
| Wage / Income Gap (%) | 706 | 50.39% |
| Wage / Income Gap ($) | 706 | 49.61¢ per $1 |
| Gini / Inequality Index | 706 | 0.23 |
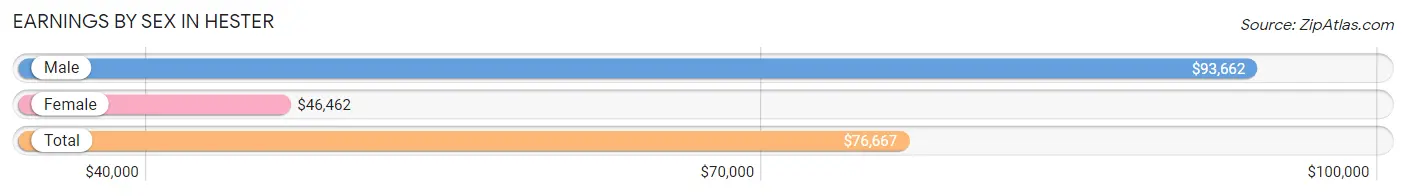
Earnings by Sex in Hester
Average Earnings in Hester are $76,667, $93,662 for men and $46,462 for women, a difference of 50.4%.
| Sex | Number | Average Earnings |
| Male | 169 (46.4%) | $93,662 |
| Female | 195 (53.6%) | $46,462 |
| Total | 364 (100.0%) | $76,667 |
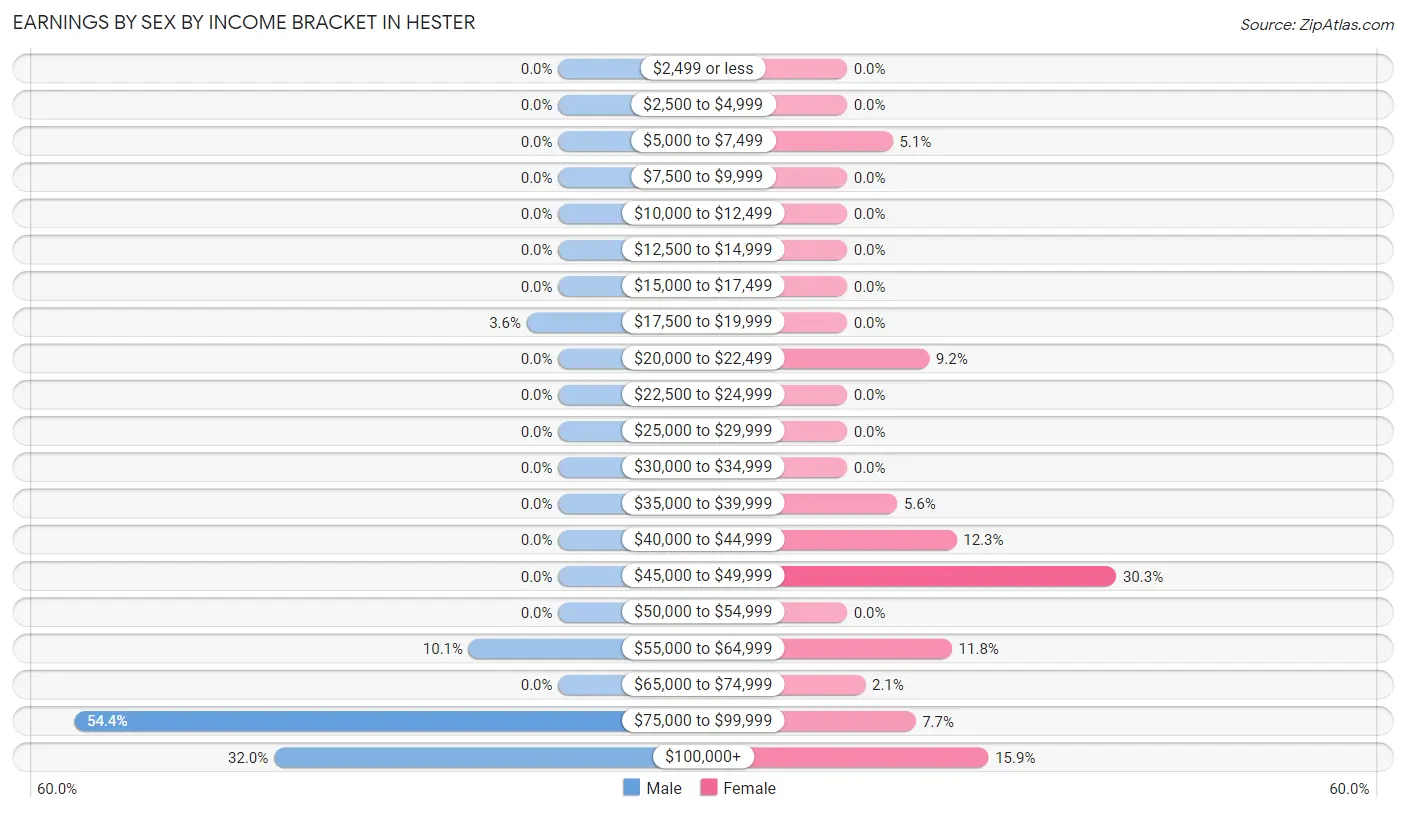
Earnings by Sex by Income Bracket in Hester
The most common earnings brackets in Hester are $75,000 to $99,999 for men (92 | 54.4%) and $45,000 to $49,999 for women (59 | 30.3%).
| Income | Male | Female |
| $2,499 or less | 0 (0.0%) | 0 (0.0%) |
| $2,500 to $4,999 | 0 (0.0%) | 0 (0.0%) |
| $5,000 to $7,499 | 0 (0.0%) | 10 (5.1%) |
| $7,500 to $9,999 | 0 (0.0%) | 0 (0.0%) |
| $10,000 to $12,499 | 0 (0.0%) | 0 (0.0%) |
| $12,500 to $14,999 | 0 (0.0%) | 0 (0.0%) |
| $15,000 to $17,499 | 0 (0.0%) | 0 (0.0%) |
| $17,500 to $19,999 | 6 (3.5%) | 0 (0.0%) |
| $20,000 to $22,499 | 0 (0.0%) | 18 (9.2%) |
| $22,500 to $24,999 | 0 (0.0%) | 0 (0.0%) |
| $25,000 to $29,999 | 0 (0.0%) | 0 (0.0%) |
| $30,000 to $34,999 | 0 (0.0%) | 0 (0.0%) |
| $35,000 to $39,999 | 0 (0.0%) | 11 (5.6%) |
| $40,000 to $44,999 | 0 (0.0%) | 24 (12.3%) |
| $45,000 to $49,999 | 0 (0.0%) | 59 (30.3%) |
| $50,000 to $54,999 | 0 (0.0%) | 0 (0.0%) |
| $55,000 to $64,999 | 17 (10.1%) | 23 (11.8%) |
| $65,000 to $74,999 | 0 (0.0%) | 4 (2.1%) |
| $75,000 to $99,999 | 92 (54.4%) | 15 (7.7%) |
| $100,000+ | 54 (32.0%) | 31 (15.9%) |
| Total | 169 (100.0%) | 195 (100.0%) |
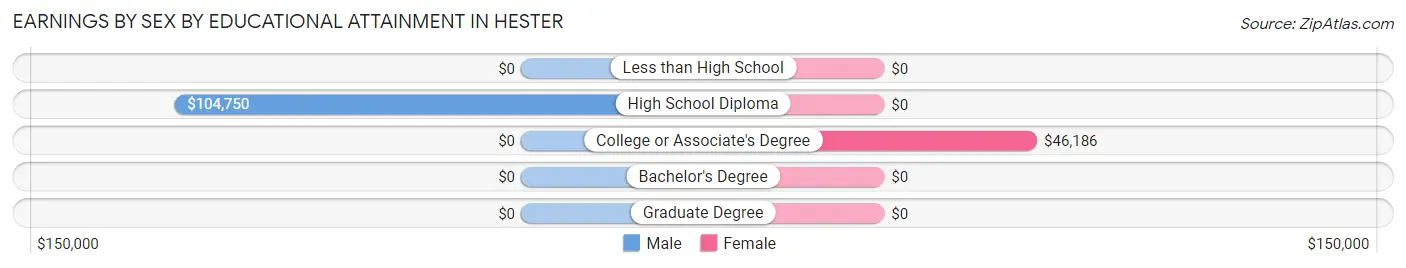
Earnings by Sex by Educational Attainment in Hester
Average earnings in Hester are $93,794 for men and $46,462 for women, a difference of 50.5%. Men with an educational attainment of high school diploma enjoy the highest average annual earnings of $104,750, while those with high school diploma education earn the least with $104,750. Women with an educational attainment of college or associate's degree earn the most with the average annual earnings of $46,186, while those with college or associate's degree education have the smallest earnings of $46,186.
| Educational Attainment | Male Income | Female Income |
| Less than High School | - | - |
| High School Diploma | $104,750 | $0 |
| College or Associate's Degree | - | - |
| Bachelor's Degree | - | - |
| Graduate Degree | - | - |
| Total | $93,794 | $46,462 |
Family Income in Hester
Family Income Brackets in Hester
According to the Hester family income data, there are 116 families falling into the $100,000 to $149,999 income range, which is the most common income bracket and makes up 70.7% of all families.
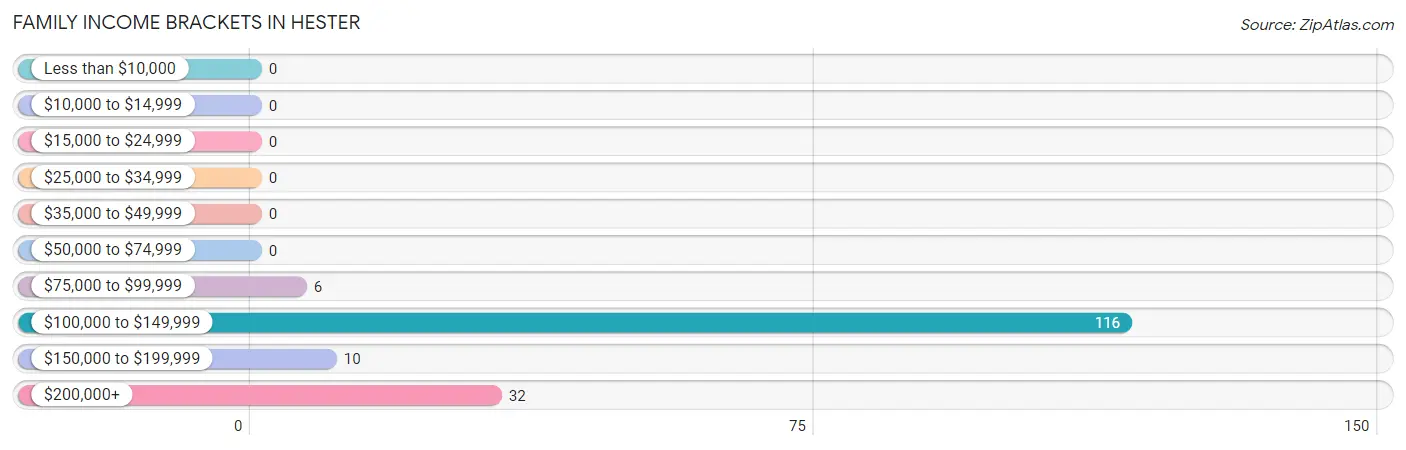
| Income Bracket | # Families | % Families |
| Less than $10,000 | 0 | 0.0% |
| $10,000 to $14,999 | 0 | 0.0% |
| $15,000 to $24,999 | 0 | 0.0% |
| $25,000 to $34,999 | 0 | 0.0% |
| $35,000 to $49,999 | 0 | 0.0% |
| $50,000 to $74,999 | 0 | 0.0% |
| $75,000 to $99,999 | 6 | 3.7% |
| $100,000 to $149,999 | 116 | 70.7% |
| $150,000 to $199,999 | 10 | 6.1% |
| $200,000+ | 32 | 19.5% |
Family Income by Famaliy Size in Hester
4-person families (97 | 59.2%) account for the highest median family income in Hester with $139,063 per family, while 2-person families (23 | 14.0%) have the highest median income of $67,356 per family member.
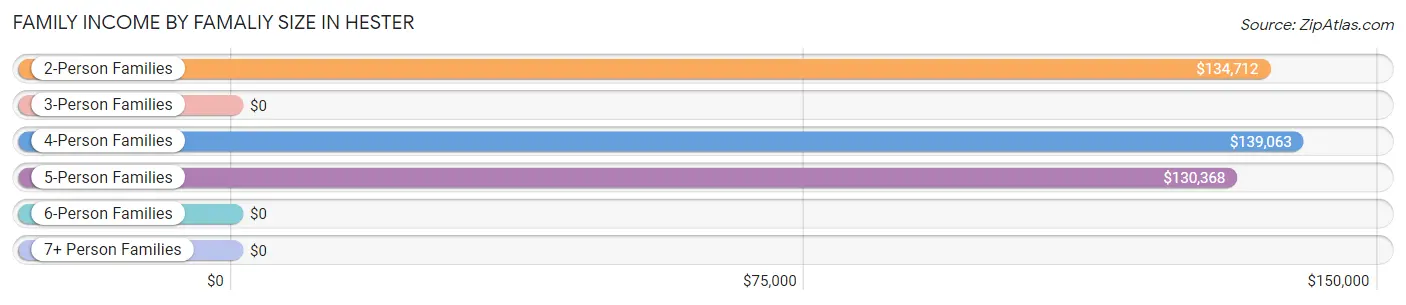
| Income Bracket | # Families | Median Income |
| 2-Person Families | 23 (14.0%) | $134,712 |
| 3-Person Families | 3 (1.8%) | $0 |
| 4-Person Families | 97 (59.2%) | $139,063 |
| 5-Person Families | 41 (25.0%) | $130,368 |
| 6-Person Families | 0 (0.0%) | $0 |
| 7+ Person Families | 0 (0.0%) | $0 |
| Total | 164 (100.0%) | $138,529 |
Family Income by Number of Earners in Hester
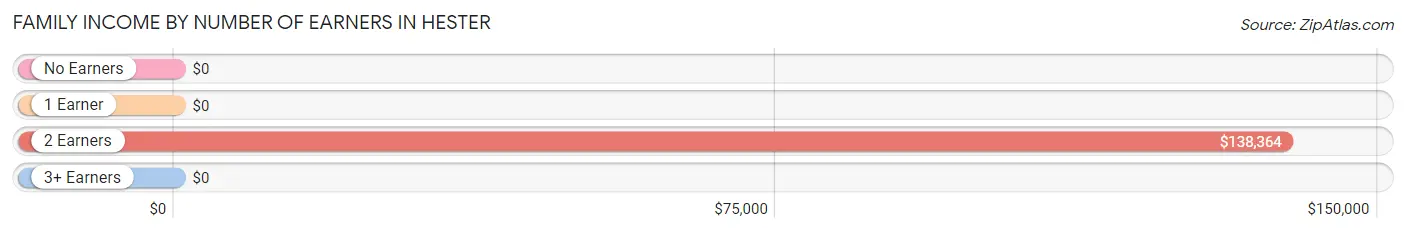
| Number of Earners | # Families | Median Income |
| No Earners | 0 (0.0%) | $0 |
| 1 Earner | 6 (3.7%) | $0 |
| 2 Earners | 155 (94.5%) | $138,364 |
| 3+ Earners | 3 (1.8%) | $0 |
| Total | 164 (100.0%) | $138,529 |
Household Income in Hester
Household Income Brackets in Hester
With 116 households falling in the category, the $100,000 to $149,999 income range is the most frequent in Hester, accounting for 58.9% of all households.
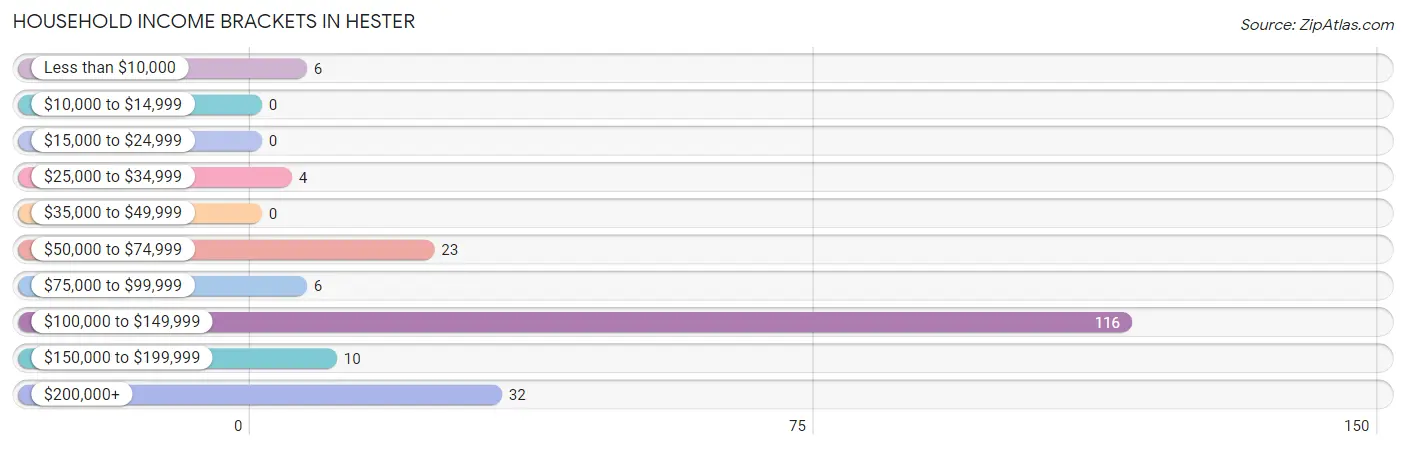
| Income Bracket | # Households | % Households |
| Less than $10,000 | 6 | 3.0% |
| $10,000 to $14,999 | 0 | 0.0% |
| $15,000 to $24,999 | 0 | 0.0% |
| $25,000 to $34,999 | 4 | 2.0% |
| $35,000 to $49,999 | 0 | 0.0% |
| $50,000 to $74,999 | 23 | 11.7% |
| $75,000 to $99,999 | 6 | 3.0% |
| $100,000 to $149,999 | 116 | 58.9% |
| $150,000 to $199,999 | 10 | 5.1% |
| $200,000+ | 32 | 16.2% |
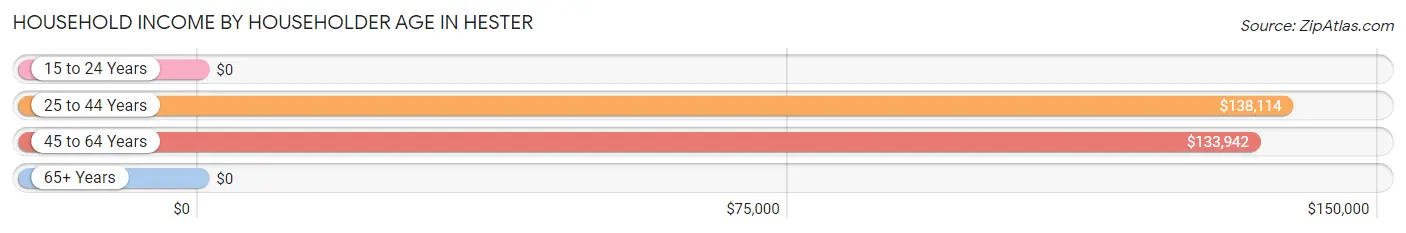
Household Income by Householder Age in Hester
The median household income in Hester is $137,923, with the highest median household income of $138,114 found in the 25 to 44 years age bracket for the primary householder. A total of 98 households (49.7%) fall into this category.
| Income Bracket | # Households | Median Income |
| 15 to 24 Years | 0 (0.0%) | $0 |
| 25 to 44 Years | 98 (49.7%) | $138,114 |
| 45 to 64 Years | 93 (47.2%) | $133,942 |
| 65+ Years | 6 (3.0%) | $0 |
| Total | 197 (100.0%) | $137,923 |
Poverty in Hester
Income Below Poverty by Sex and Age in Hester
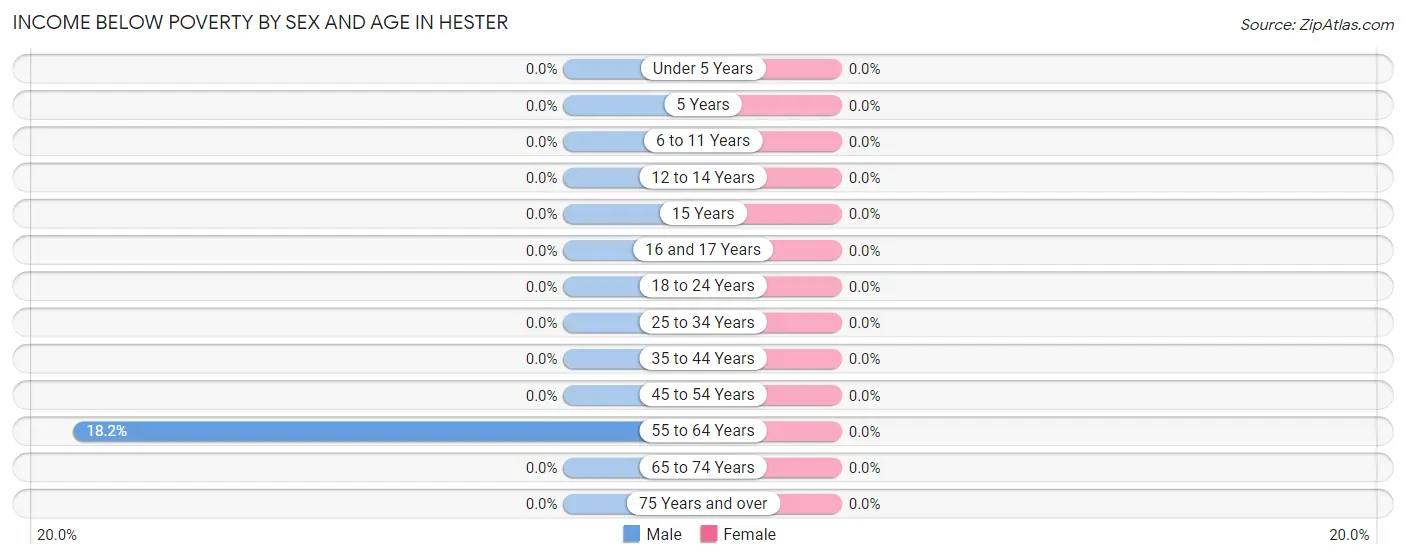
| Age Bracket | Male | Female |
| Under 5 Years | 0 (0.0%) | 0 (0.0%) |
| 5 Years | 0 (0.0%) | 0 (0.0%) |
| 6 to 11 Years | 0 (0.0%) | 0 (0.0%) |
| 12 to 14 Years | 0 (0.0%) | 0 (0.0%) |
| 15 Years | 0 (0.0%) | 0 (0.0%) |
| 16 and 17 Years | 0 (0.0%) | 0 (0.0%) |
| 18 to 24 Years | 0 (0.0%) | 0 (0.0%) |
| 25 to 34 Years | 0 (0.0%) | 0 (0.0%) |
| 35 to 44 Years | 0 (0.0%) | 0 (0.0%) |
| 45 to 54 Years | 0 (0.0%) | 0 (0.0%) |
| 55 to 64 Years | 6 (18.2%) | 0 (0.0%) |
| 65 to 74 Years | 0 (0.0%) | 0 (0.0%) |
| 75 Years and over | 0 (0.0%) | 0 (0.0%) |
| Total | 6 (1.8%) | 0 (0.0%) |
Income Above Poverty by Sex and Age in Hester
According to the poverty statistics in Hester, males aged under 5 years and females aged under 5 years are the age groups that are most secure financially, with 100.0% of males and 100.0% of females in these age groups living above the poverty line.
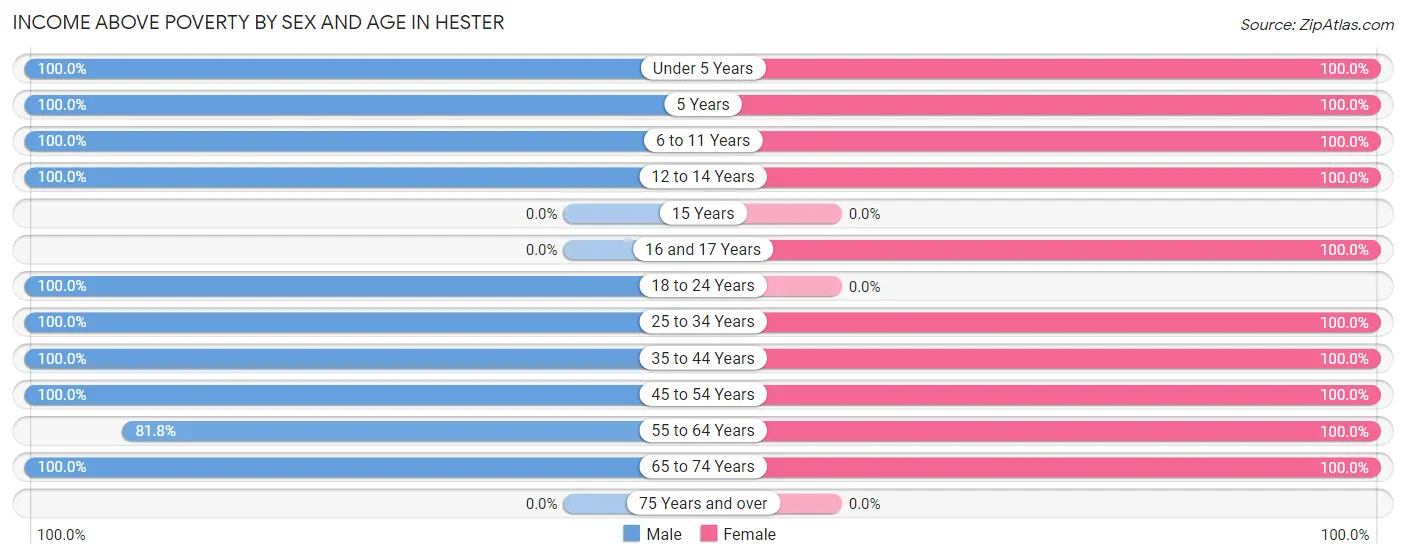
| Age Bracket | Male | Female |
| Under 5 Years | 35 (100.0%) | 48 (100.0%) |
| 5 Years | 18 (100.0%) | 16 (100.0%) |
| 6 to 11 Years | 63 (100.0%) | 57 (100.0%) |
| 12 to 14 Years | 39 (100.0%) | 6 (100.0%) |
| 15 Years | 0 (0.0%) | 0 (0.0%) |
| 16 and 17 Years | 0 (0.0%) | 40 (100.0%) |
| 18 to 24 Years | 6 (100.0%) | 0 (0.0%) |
| 25 to 34 Years | 15 (100.0%) | 24 (100.0%) |
| 35 to 44 Years | 83 (100.0%) | 83 (100.0%) |
| 45 to 54 Years | 34 (100.0%) | 74 (100.0%) |
| 55 to 64 Years | 27 (81.8%) | 22 (100.0%) |
| 65 to 74 Years | 4 (100.0%) | 6 (100.0%) |
| 75 Years and over | 0 (0.0%) | 0 (0.0%) |
| Total | 324 (98.2%) | 376 (100.0%) |
Income Below Poverty Among Married-Couple Families in Hester
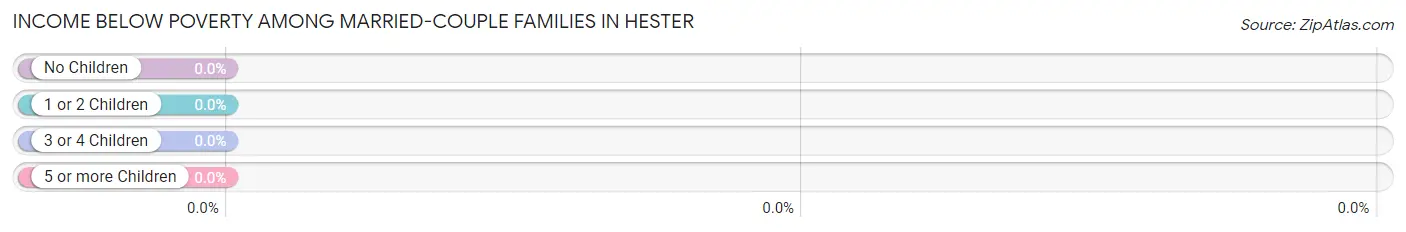
| Children | Above Poverty | Below Poverty |
| No Children | 26 (100.0%) | 0 (0.0%) |
| 1 or 2 Children | 97 (100.0%) | 0 (0.0%) |
| 3 or 4 Children | 41 (100.0%) | 0 (0.0%) |
| 5 or more Children | 0 (0.0%) | 0 (0.0%) |
| Total | 164 (100.0%) | 0 (0.0%) |
Income Below Poverty Among Single-Parent Households in Hester
| Children | Single Father | Single Mother |
| No Children | 0 (0.0%) | 0 (0.0%) |
| 1 or 2 Children | 0 (0.0%) | 0 (0.0%) |
| 3 or 4 Children | 0 (0.0%) | 0 (0.0%) |
| 5 or more Children | 0 (0.0%) | 0 (0.0%) |
| Total | 0 (0.0%) | 0 (0.0%) |
Income Below Poverty Among Married-Couple vs Single-Parent Households in Hester
| Children | Married-Couple Families | Single-Parent Households |
| No Children | 0 (0.0%) | 0 (0.0%) |
| 1 or 2 Children | 0 (0.0%) | 0 (0.0%) |
| 3 or 4 Children | 0 (0.0%) | 0 (0.0%) |
| 5 or more Children | 0 (0.0%) | 0 (0.0%) |
| Total | 0 (0.0%) | 0 (0.0%) |
Race in Hester
The most populous races in Hester are , and White / Caucasian (706 | 100.0%).
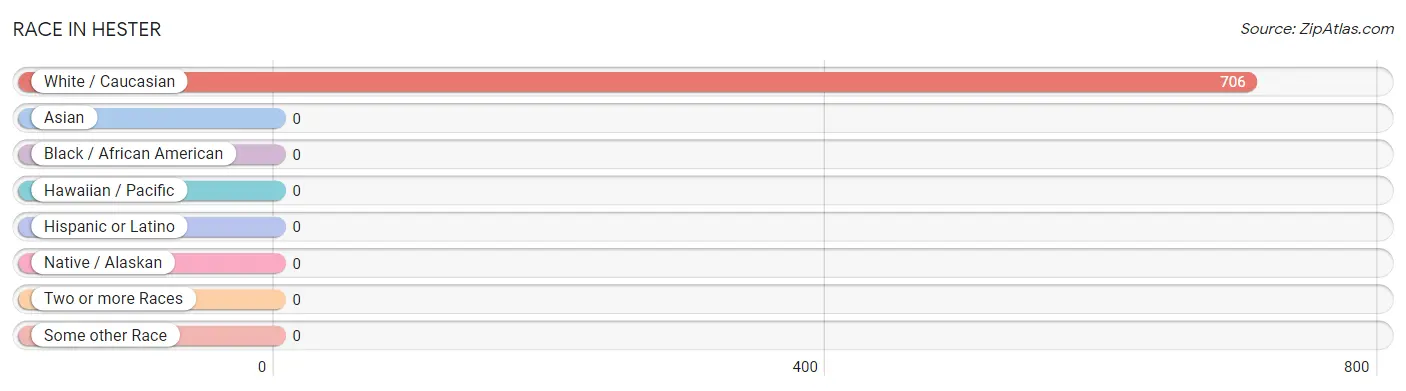
| Race | # Population | % Population |
| Asian | 0 | 0.0% |
| Black / African American | 0 | 0.0% |
| Hawaiian / Pacific | 0 | 0.0% |
| Hispanic or Latino | 0 | 0.0% |
| Native / Alaskan | 0 | 0.0% |
| White / Caucasian | 706 | 100.0% |
| Two or more Races | 0 | 0.0% |
| Some other Race | 0 | 0.0% |
| Total | 706 | 100.0% |
Ancestry in Hester
The most populous ancestries reported in Hester are American (483 | 68.4%), French (139 | 19.7%), Italian (34 | 4.8%), French Canadian (30 | 4.3%), and German (8 | 1.1%), together accounting for 98.3% of all Hester residents.
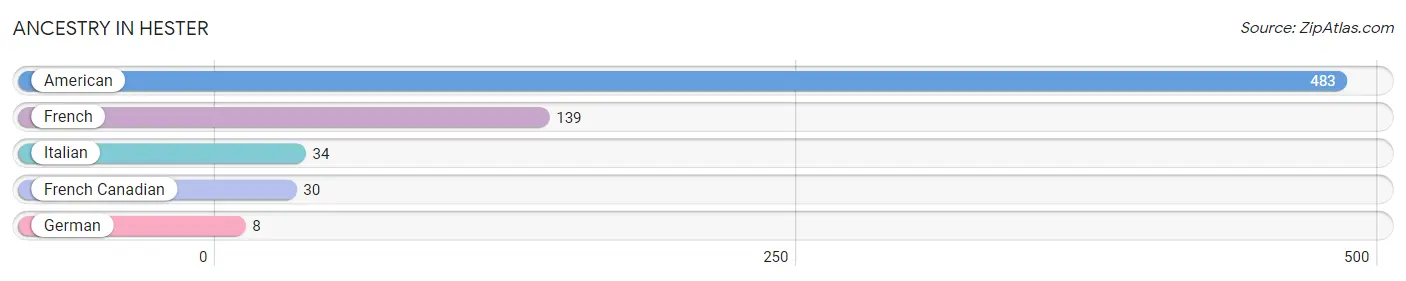
| Ancestry | # Population | % Population |
| American | 483 | 68.4% |
| French | 139 | 19.7% |
| French Canadian | 30 | 4.3% |
| German | 8 | 1.1% |
| Italian | 34 | 4.8% | View All 5 Rows |
Immigrants in Hester

| Immigration Origin | # Population | % Population | View All 0 Rows |
Sex and Age in Hester
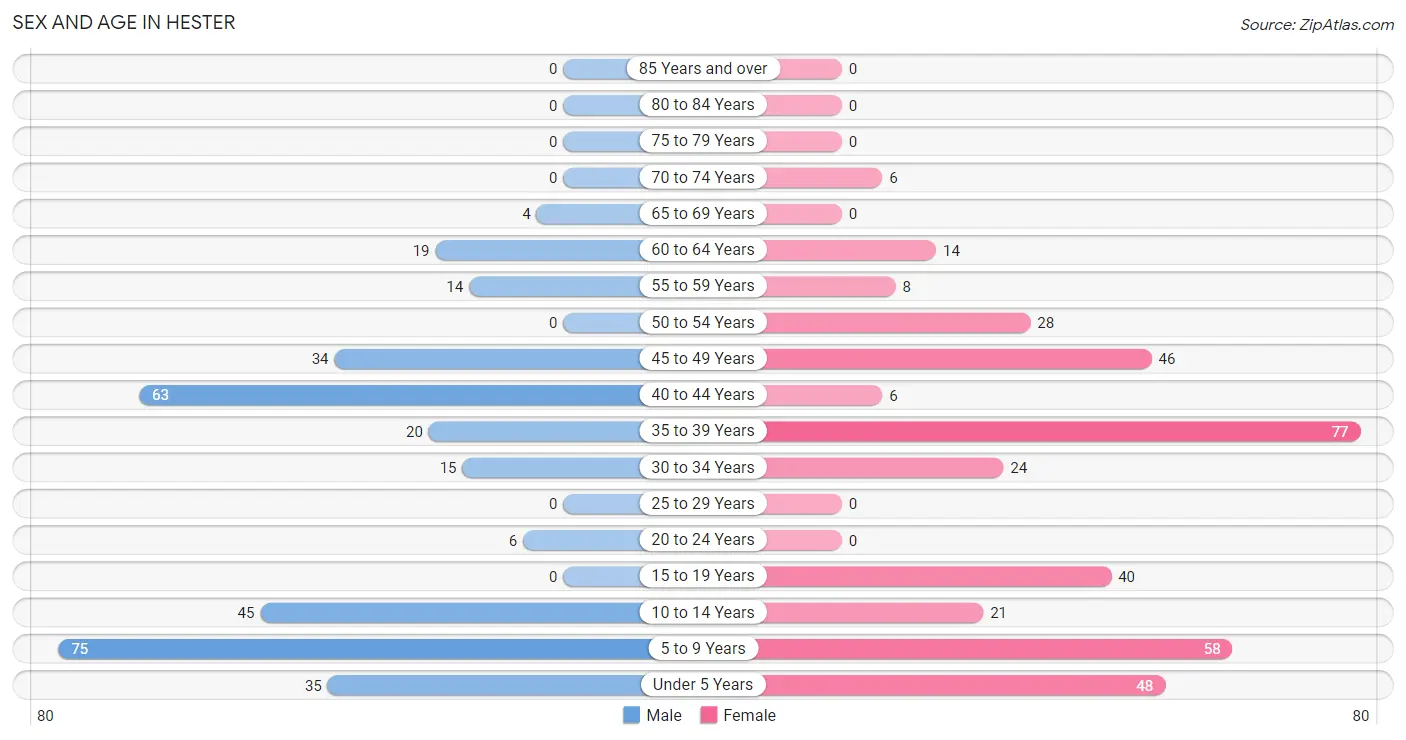
Sex and Age in Hester
The most populous age groups in Hester are 5 to 9 Years (75 | 22.7%) for men and 35 to 39 Years (77 | 20.5%) for women.
| Age Bracket | Male | Female |
| Under 5 Years | 35 (10.6%) | 48 (12.8%) |
| 5 to 9 Years | 75 (22.7%) | 58 (15.4%) |
| 10 to 14 Years | 45 (13.6%) | 21 (5.6%) |
| 15 to 19 Years | 0 (0.0%) | 40 (10.6%) |
| 20 to 24 Years | 6 (1.8%) | 0 (0.0%) |
| 25 to 29 Years | 0 (0.0%) | 0 (0.0%) |
| 30 to 34 Years | 15 (4.5%) | 24 (6.4%) |
| 35 to 39 Years | 20 (6.1%) | 77 (20.5%) |
| 40 to 44 Years | 63 (19.1%) | 6 (1.6%) |
| 45 to 49 Years | 34 (10.3%) | 46 (12.2%) |
| 50 to 54 Years | 0 (0.0%) | 28 (7.4%) |
| 55 to 59 Years | 14 (4.2%) | 8 (2.1%) |
| 60 to 64 Years | 19 (5.8%) | 14 (3.7%) |
| 65 to 69 Years | 4 (1.2%) | 0 (0.0%) |
| 70 to 74 Years | 0 (0.0%) | 6 (1.6%) |
| 75 to 79 Years | 0 (0.0%) | 0 (0.0%) |
| 80 to 84 Years | 0 (0.0%) | 0 (0.0%) |
| 85 Years and over | 0 (0.0%) | 0 (0.0%) |
| Total | 330 (100.0%) | 376 (100.0%) |
Families and Households in Hester
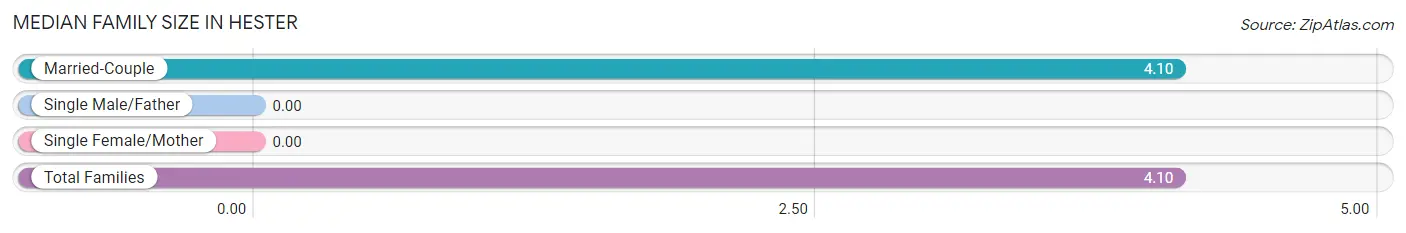
Median Family Size in Hester
| Family Type | # Families | Family Size |
| Married-Couple | 164 (100.0%) | 4.10 |
| Single Male/Father | 0 (0.0%) | - |
| Single Female/Mother | 0 (0.0%) | - |
| Total Families | 164 (100.0%) | 4.10 |
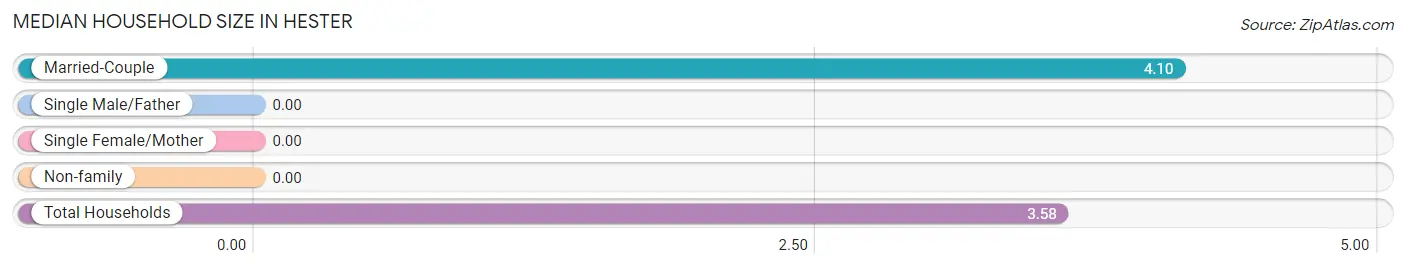
Median Household Size in Hester
| Household Type | # Households | Household Size |
| Married-Couple | 164 (83.3%) | 4.10 |
| Single Male/Father | 0 (0.0%) | - |
| Single Female/Mother | 0 (0.0%) | - |
| Non-family | 33 (16.8%) | - |
| Total Households | 197 (100.0%) | 3.58 |
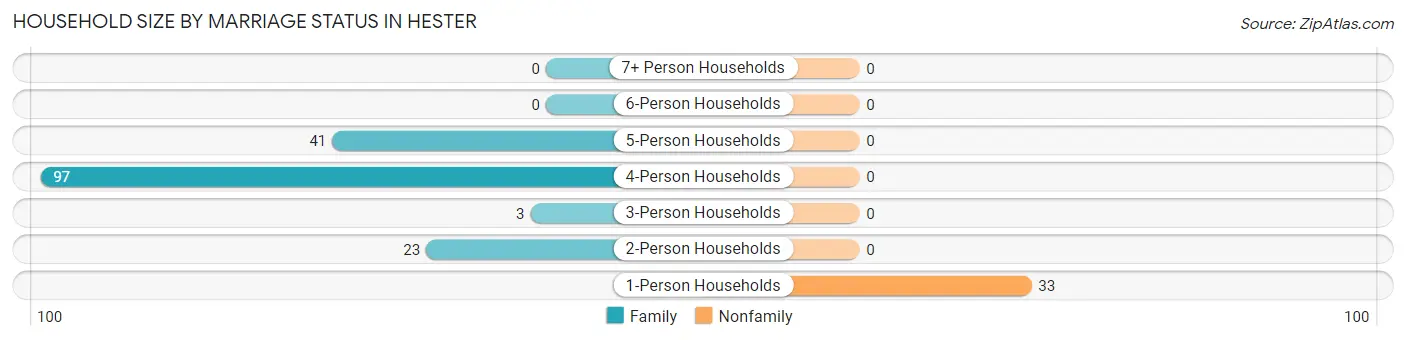
Household Size by Marriage Status in Hester
Out of a total of 197 households in Hester, 164 (83.3%) are family households, while 33 (16.8%) are nonfamily households. The most numerous type of family households are 4-person households, comprising 97, and the most common type of nonfamily households are 1-person households, comprising 33.
| Household Size | Family Households | Nonfamily Households |
| 1-Person Households | - | 33 (16.8%) |
| 2-Person Households | 23 (11.7%) | 0 (0.0%) |
| 3-Person Households | 3 (1.5%) | 0 (0.0%) |
| 4-Person Households | 97 (49.2%) | 0 (0.0%) |
| 5-Person Households | 41 (20.8%) | 0 (0.0%) |
| 6-Person Households | 0 (0.0%) | 0 (0.0%) |
| 7+ Person Households | 0 (0.0%) | 0 (0.0%) |
| Total | 164 (83.3%) | 33 (16.8%) |
Female Fertility in Hester
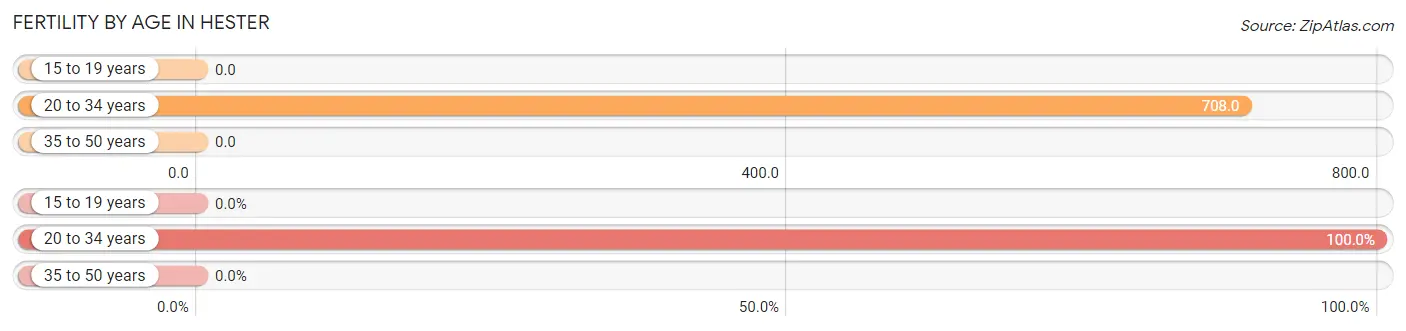
Fertility by Age in Hester
Average fertility rate in Hester is 88.0 births per 1,000 women. Women in the age bracket of 20 to 34 years have the highest fertility rate with 708.0 births per 1,000 women. Women in the age bracket of 20 to 34 years acount for 100.0% of all women with births.
| Age Bracket | Women with Births | Births / 1,000 Women |
| 15 to 19 years | 0 (0.0%) | 0.0 |
| 20 to 34 years | 17 (100.0%) | 708.0 |
| 35 to 50 years | 0 (0.0%) | 0.0 |
| Total | 17 (100.0%) | 88.0 |
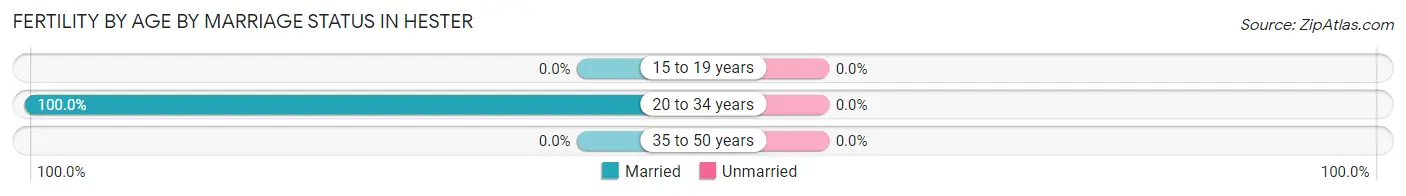
Fertility by Age by Marriage Status in Hester
| Age Bracket | Married | Unmarried |
| 15 to 19 years | 0 (0.0%) | 0 (0.0%) |
| 20 to 34 years | 17 (100.0%) | 0 (0.0%) |
| 35 to 50 years | 0 (0.0%) | 0 (0.0%) |
| Total | 17 (100.0%) | 0 (0.0%) |
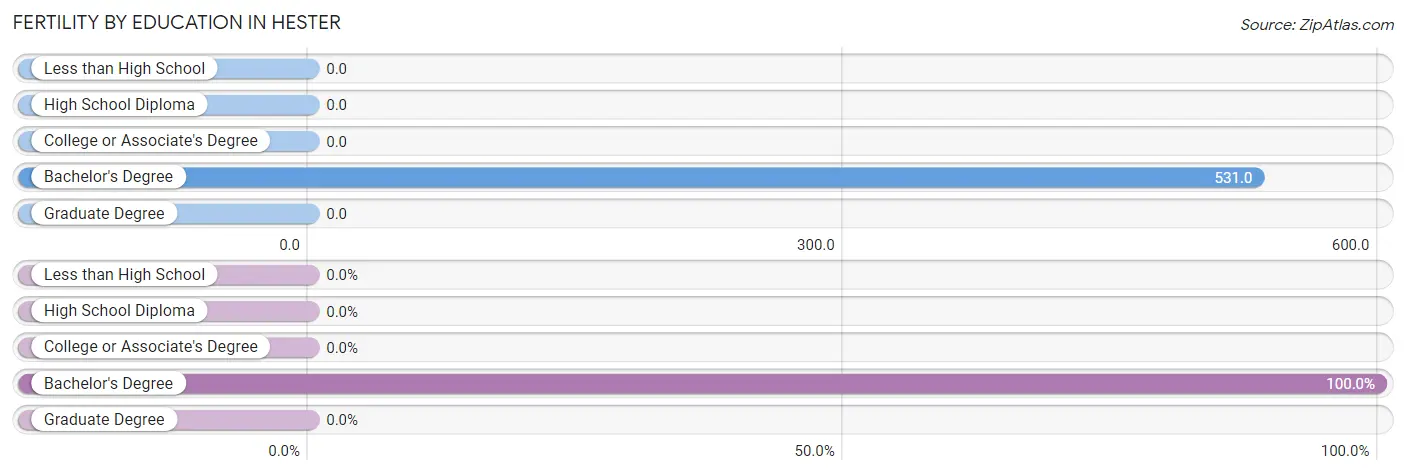
Fertility by Education in Hester
| Educational Attainment | Women with Births | Births / 1,000 Women |
| Less than High School | 0 (0.0%) | 0.0 |
| High School Diploma | 0 (0.0%) | 0.0 |
| College or Associate's Degree | 0 (0.0%) | 0.0 |
| Bachelor's Degree | 17 (100.0%) | 531.0 |
| Graduate Degree | 0 (0.0%) | 0.0 |
| Total | 17 (100.0%) | 88.0 |
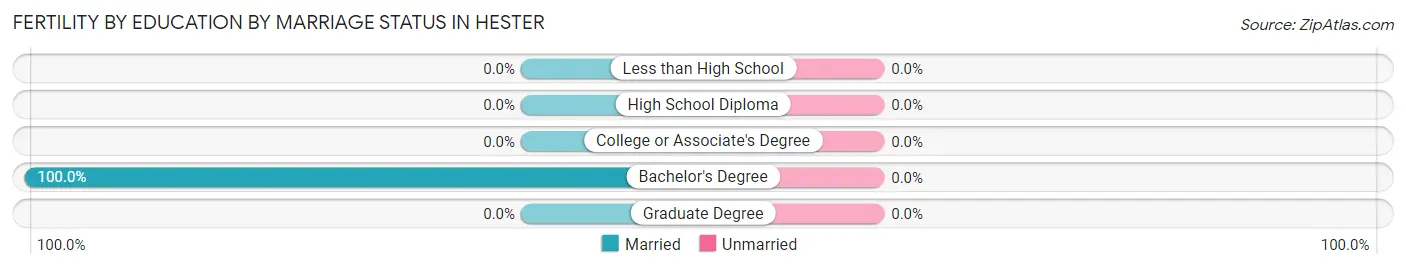
Fertility by Education by Marriage Status in Hester
| Educational Attainment | Married | Unmarried |
| Less than High School | 0 (0.0%) | 0 (0.0%) |
| High School Diploma | 0 (0.0%) | 0 (0.0%) |
| College or Associate's Degree | 0 (0.0%) | 0 (0.0%) |
| Bachelor's Degree | 17 (100.0%) | 0 (0.0%) |
| Graduate Degree | 0 (0.0%) | 0 (0.0%) |
| Total | 17 (100.0%) | 0 (0.0%) |
Employment Characteristics in Hester
Employment by Class of Employer in Hester
Among the 355 employed individuals in Hester, private company employees (312 | 87.9%), not-for-profit organizations (27 | 7.6%), and state government employees (11 | 3.1%) make up the most common classes of employment.
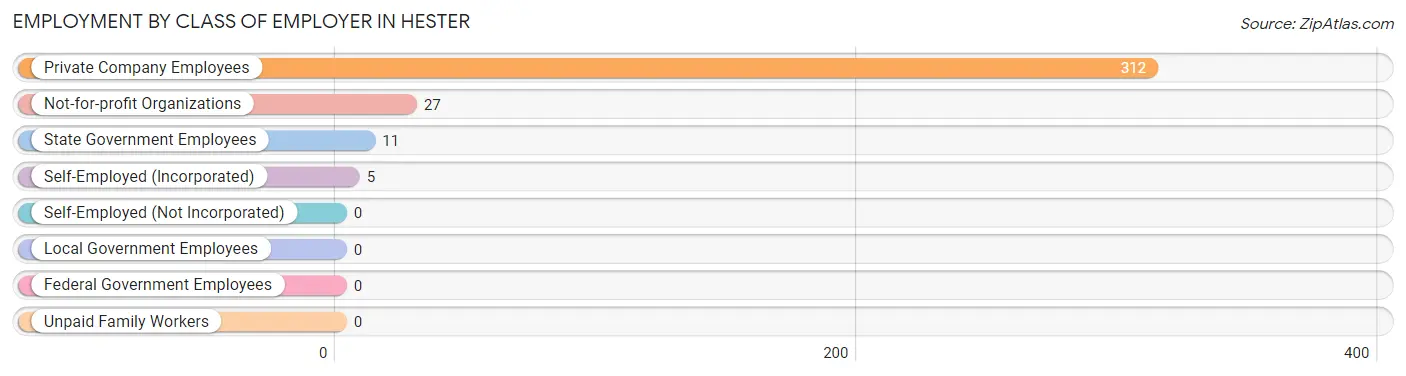
| Employer Class | # Employees | % Employees |
| Private Company Employees | 312 | 87.9% |
| Self-Employed (Incorporated) | 5 | 1.4% |
| Self-Employed (Not Incorporated) | 0 | 0.0% |
| Not-for-profit Organizations | 27 | 7.6% |
| Local Government Employees | 0 | 0.0% |
| State Government Employees | 11 | 3.1% |
| Federal Government Employees | 0 | 0.0% |
| Unpaid Family Workers | 0 | 0.0% |
| Total | 355 | 100.0% |
Employment Status by Age in Hester
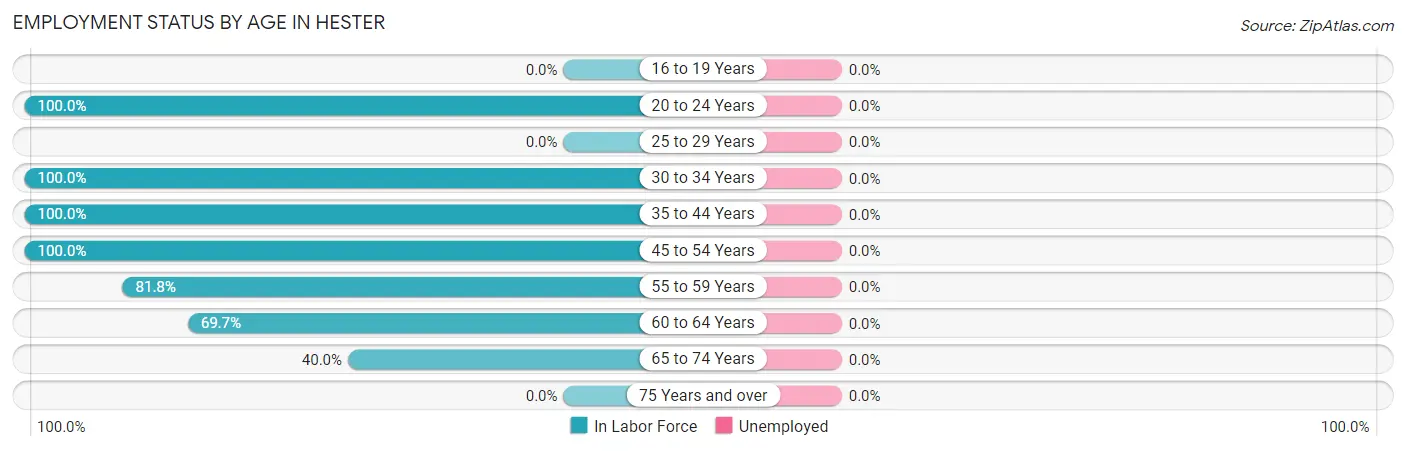
| Age Bracket | In Labor Force | Unemployed |
| 16 to 19 Years | 0 (0.0%) | 0 (0.0%) |
| 20 to 24 Years | 6 (100.0%) | 0 (0.0%) |
| 25 to 29 Years | 0 (0.0%) | 0 (0.0%) |
| 30 to 34 Years | 39 (100.0%) | 0 (0.0%) |
| 35 to 44 Years | 166 (100.0%) | 0 (0.0%) |
| 45 to 54 Years | 108 (100.0%) | 0 (0.0%) |
| 55 to 59 Years | 18 (81.8%) | 0 (0.0%) |
| 60 to 64 Years | 23 (69.7%) | 0 (0.0%) |
| 65 to 74 Years | 4 (40.0%) | 0 (0.0%) |
| 75 Years and over | 0 (0.0%) | 0 (0.0%) |
| Total | 364 (85.8%) | 0 (0.0%) |
Employment Status by Educational Attainment in Hester
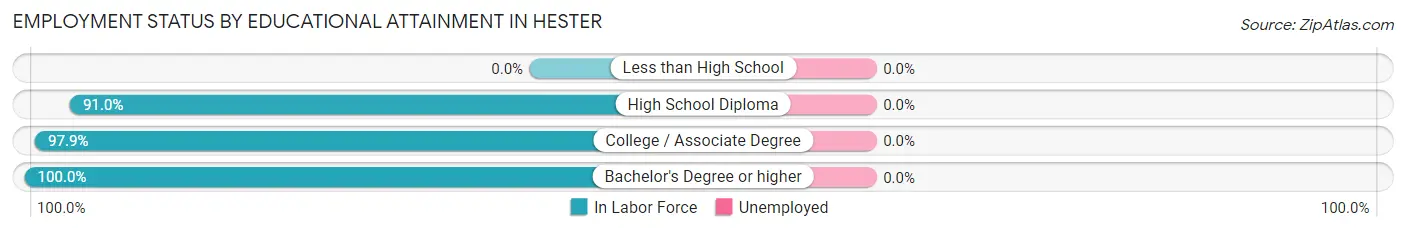
| Educational Attainment | In Labor Force | Unemployed |
| Less than High School | 0 (0.0%) | 0 (0.0%) |
| High School Diploma | 101 (91.0%) | 0 (0.0%) |
| College / Associate Degree | 184 (97.9%) | 0 (0.0%) |
| Bachelor's Degree or higher | 69 (100.0%) | 0 (0.0%) |
| Total | 354 (96.2%) | 0 (0.0%) |
Employment Occupations by Sex in Hester
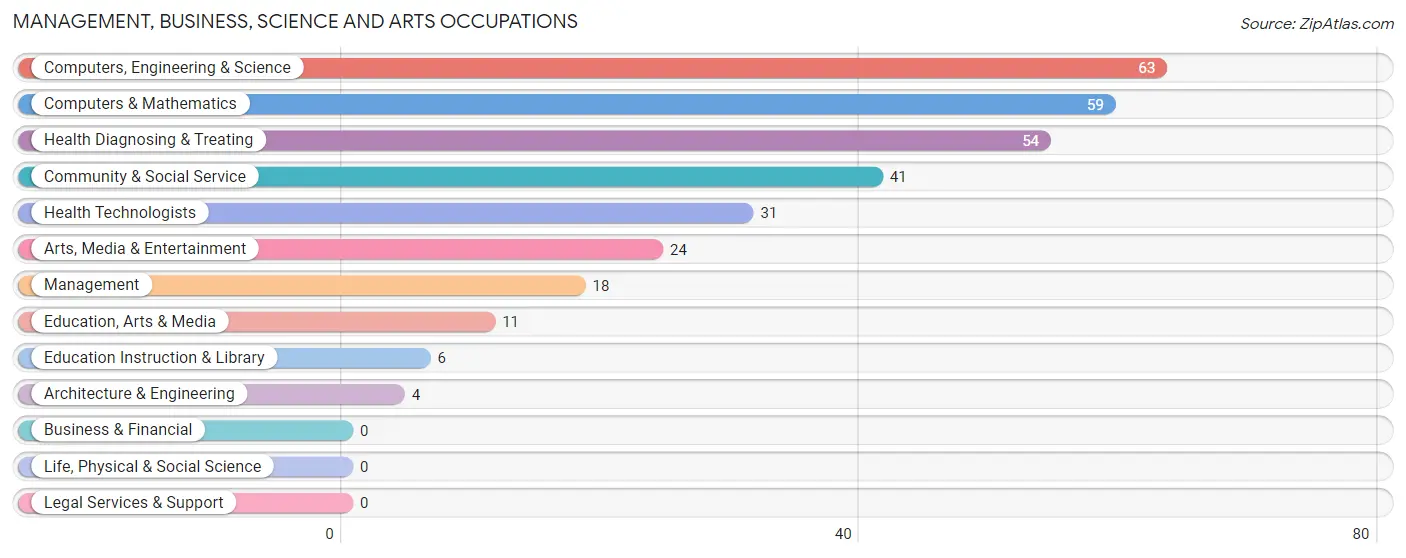
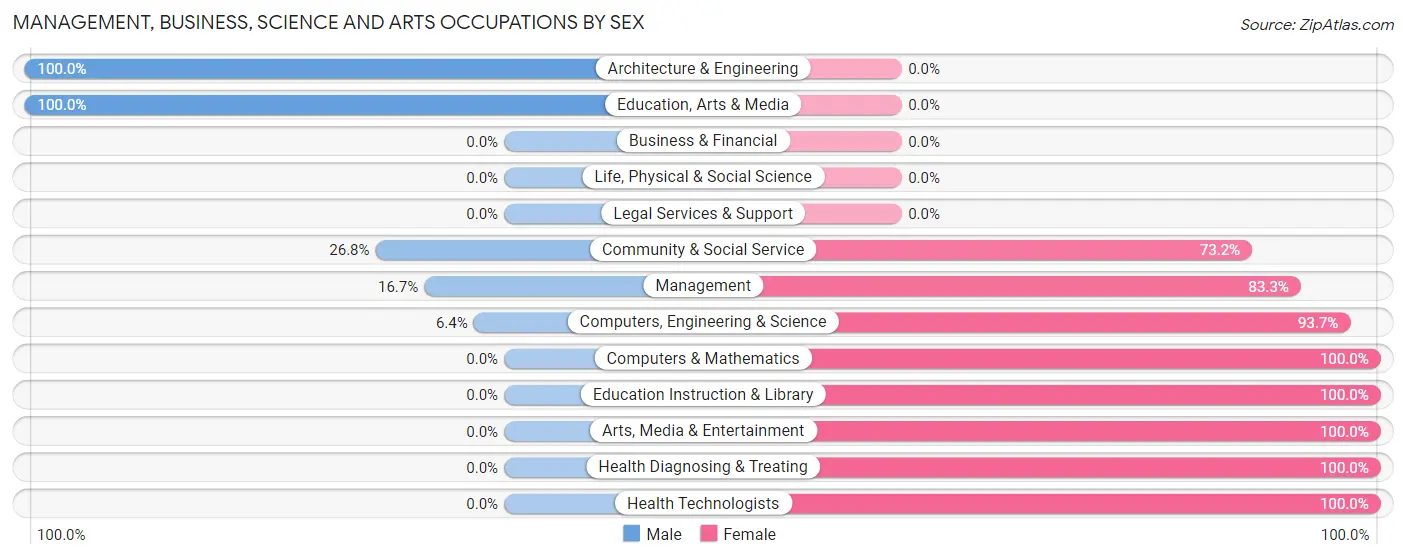
Management, Business, Science and Arts Occupations
The most common Management, Business, Science and Arts occupations in Hester are Computers, Engineering & Science (63 | 17.3%), Computers & Mathematics (59 | 16.2%), Health Diagnosing & Treating (54 | 14.8%), Community & Social Service (41 | 11.3%), and Health Technologists (31 | 8.5%).
Management, Business, Science and Arts Occupations by Sex
Within the Management, Business, Science and Arts occupations in Hester, the most male-oriented occupations are Architecture & Engineering (100.0%), Education, Arts & Media (100.0%), and Community & Social Service (26.8%), while the most female-oriented occupations are Computers & Mathematics (100.0%), Education Instruction & Library (100.0%), and Arts, Media & Entertainment (100.0%).
| Occupation | Male | Female |
| Management | 3 (16.7%) | 15 (83.3%) |
| Business & Financial | 0 (0.0%) | 0 (0.0%) |
| Computers, Engineering & Science | 4 (6.4%) | 59 (93.6%) |
| Computers & Mathematics | 0 (0.0%) | 59 (100.0%) |
| Architecture & Engineering | 4 (100.0%) | 0 (0.0%) |
| Life, Physical & Social Science | 0 (0.0%) | 0 (0.0%) |
| Community & Social Service | 11 (26.8%) | 30 (73.2%) |
| Education, Arts & Media | 11 (100.0%) | 0 (0.0%) |
| Legal Services & Support | 0 (0.0%) | 0 (0.0%) |
| Education Instruction & Library | 0 (0.0%) | 6 (100.0%) |
| Arts, Media & Entertainment | 0 (0.0%) | 24 (100.0%) |
| Health Diagnosing & Treating | 0 (0.0%) | 54 (100.0%) |
| Health Technologists | 0 (0.0%) | 31 (100.0%) |
| Total (Category) | 18 (10.2%) | 158 (89.8%) |
| Total (Overall) | 169 (46.4%) | 195 (53.6%) |
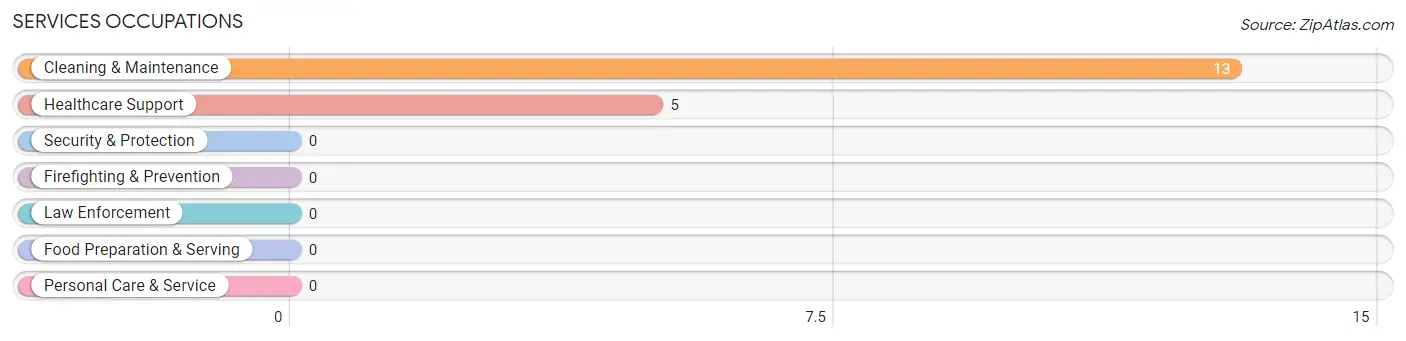
Services Occupations
The most common Services occupations in Hester are Cleaning & Maintenance (13 | 3.6%), and Healthcare Support (5 | 1.4%).
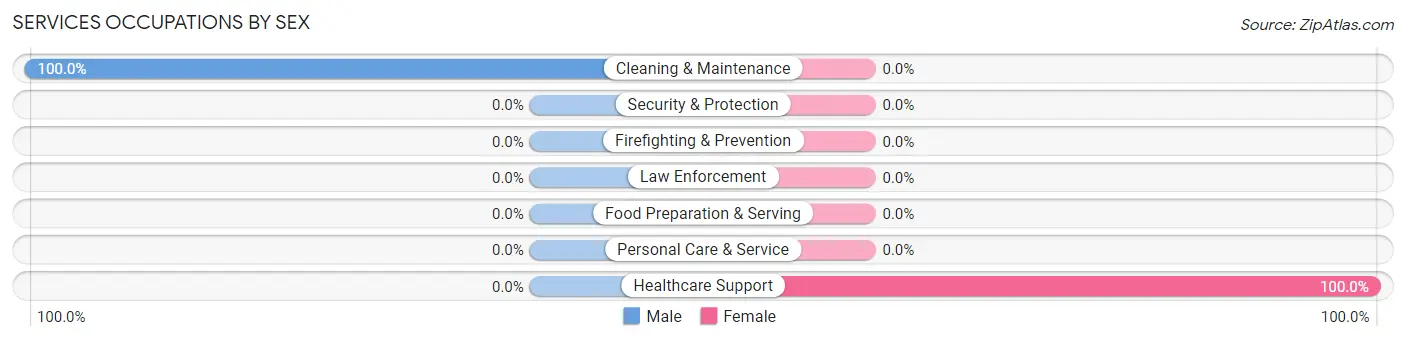
Services Occupations by Sex
| Occupation | Male | Female |
| Healthcare Support | 0 (0.0%) | 5 (100.0%) |
| Security & Protection | 0 (0.0%) | 0 (0.0%) |
| Firefighting & Prevention | 0 (0.0%) | 0 (0.0%) |
| Law Enforcement | 0 (0.0%) | 0 (0.0%) |
| Food Preparation & Serving | 0 (0.0%) | 0 (0.0%) |
| Cleaning & Maintenance | 13 (100.0%) | 0 (0.0%) |
| Personal Care & Service | 0 (0.0%) | 0 (0.0%) |
| Total (Category) | 13 (72.2%) | 5 (27.8%) |
| Total (Overall) | 169 (46.4%) | 195 (53.6%) |
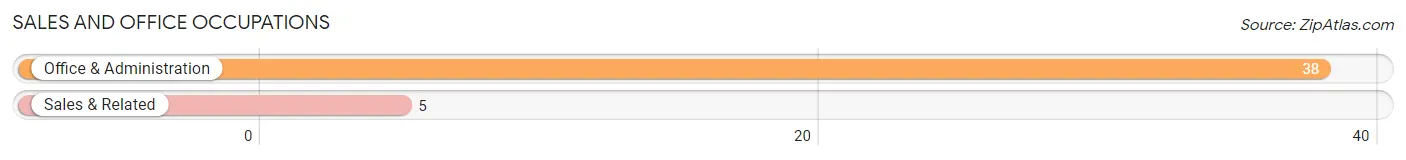
Sales and Office Occupations
The most common Sales and Office occupations in Hester are Office & Administration (38 | 10.4%), and Sales & Related (5 | 1.4%).
Sales and Office Occupations by Sex

| Occupation | Male | Female |
| Sales & Related | 5 (100.0%) | 0 (0.0%) |
| Office & Administration | 6 (15.8%) | 32 (84.2%) |
| Total (Category) | 11 (25.6%) | 32 (74.4%) |
| Total (Overall) | 169 (46.4%) | 195 (53.6%) |
Natural Resources, Construction and Maintenance Occupations
The most common Natural Resources, Construction and Maintenance occupations in Hester are Installation, Maintenance & Repair (63 | 17.3%), and Farming, Fishing & Forestry (15 | 4.1%).
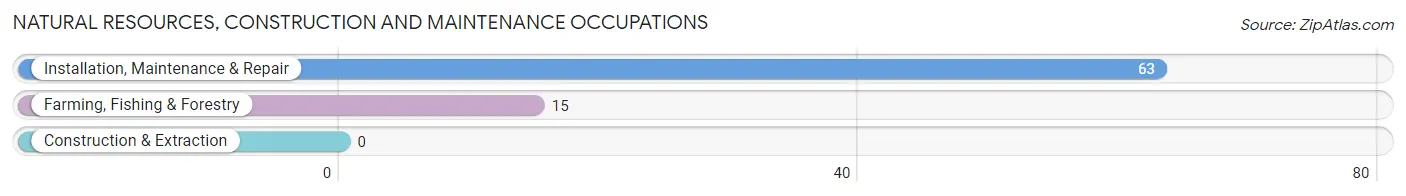
Natural Resources, Construction and Maintenance Occupations by Sex
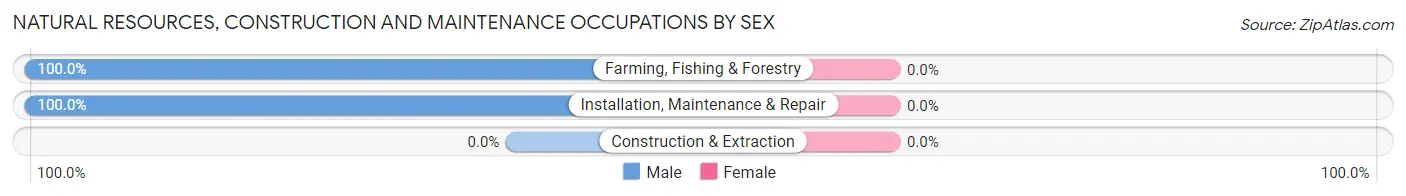
| Occupation | Male | Female |
| Farming, Fishing & Forestry | 15 (100.0%) | 0 (0.0%) |
| Construction & Extraction | 0 (0.0%) | 0 (0.0%) |
| Installation, Maintenance & Repair | 63 (100.0%) | 0 (0.0%) |
| Total (Category) | 78 (100.0%) | 0 (0.0%) |
| Total (Overall) | 169 (46.4%) | 195 (53.6%) |
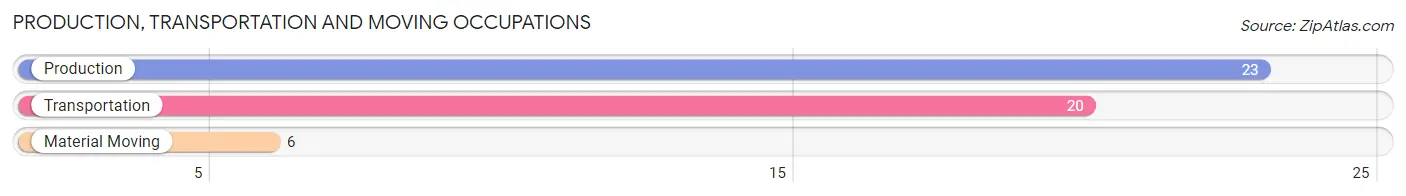
Production, Transportation and Moving Occupations
The most common Production, Transportation and Moving occupations in Hester are Production (23 | 6.3%), Transportation (20 | 5.5%), and Material Moving (6 | 1.7%).
Production, Transportation and Moving Occupations by Sex
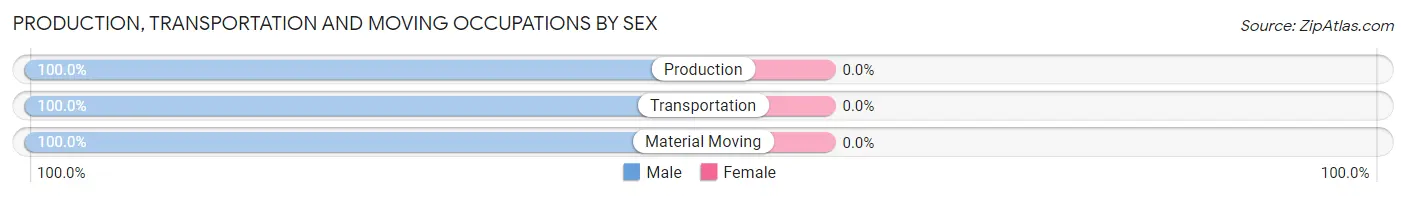
| Occupation | Male | Female |
| Production | 23 (100.0%) | 0 (0.0%) |
| Transportation | 20 (100.0%) | 0 (0.0%) |
| Material Moving | 6 (100.0%) | 0 (0.0%) |
| Total (Category) | 49 (100.0%) | 0 (0.0%) |
| Total (Overall) | 169 (46.4%) | 195 (53.6%) |
Employment Industries by Sex in Hester
Employment Industries in Hester
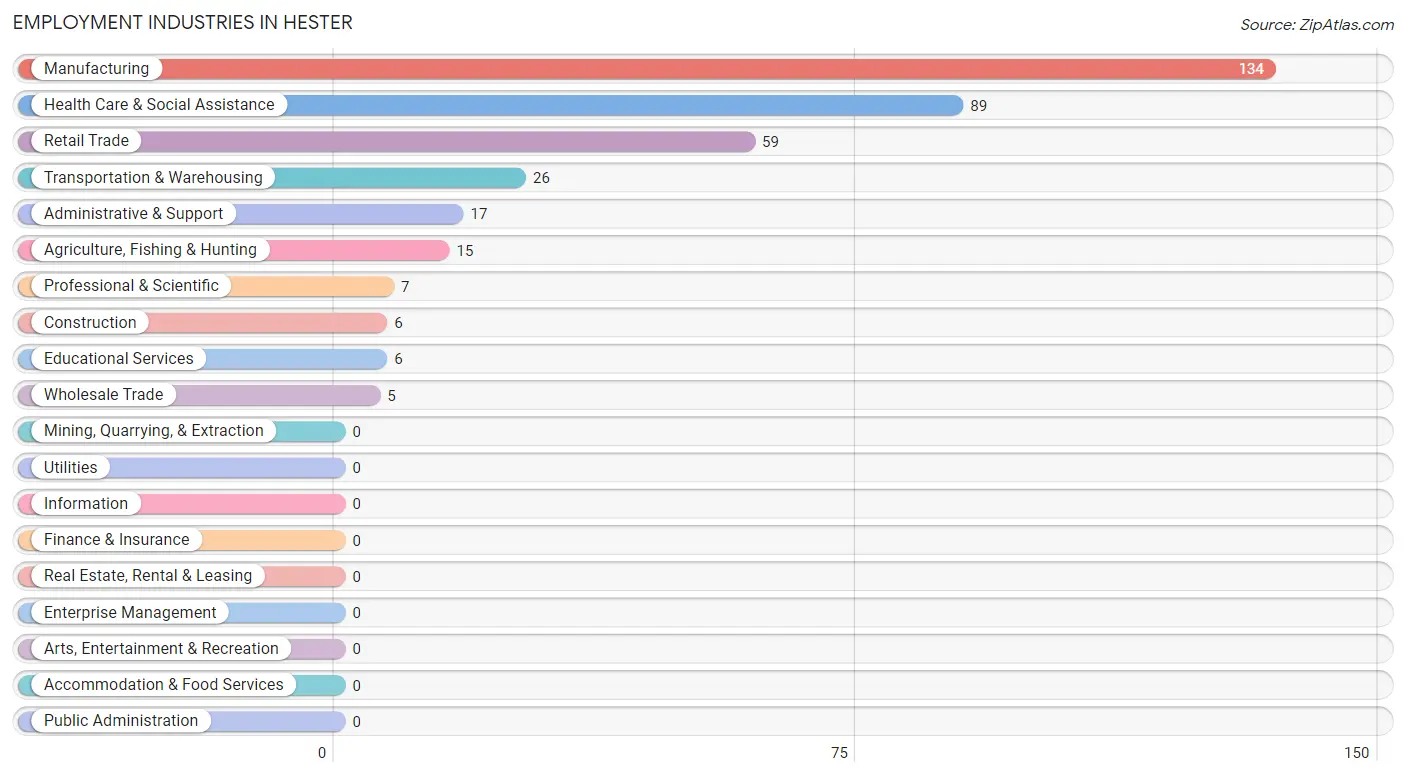
The major employment industries in Hester include Manufacturing (134 | 36.8%), Health Care & Social Assistance (89 | 24.4%), Retail Trade (59 | 16.2%), Transportation & Warehousing (26 | 7.1%), and Administrative & Support (17 | 4.7%).
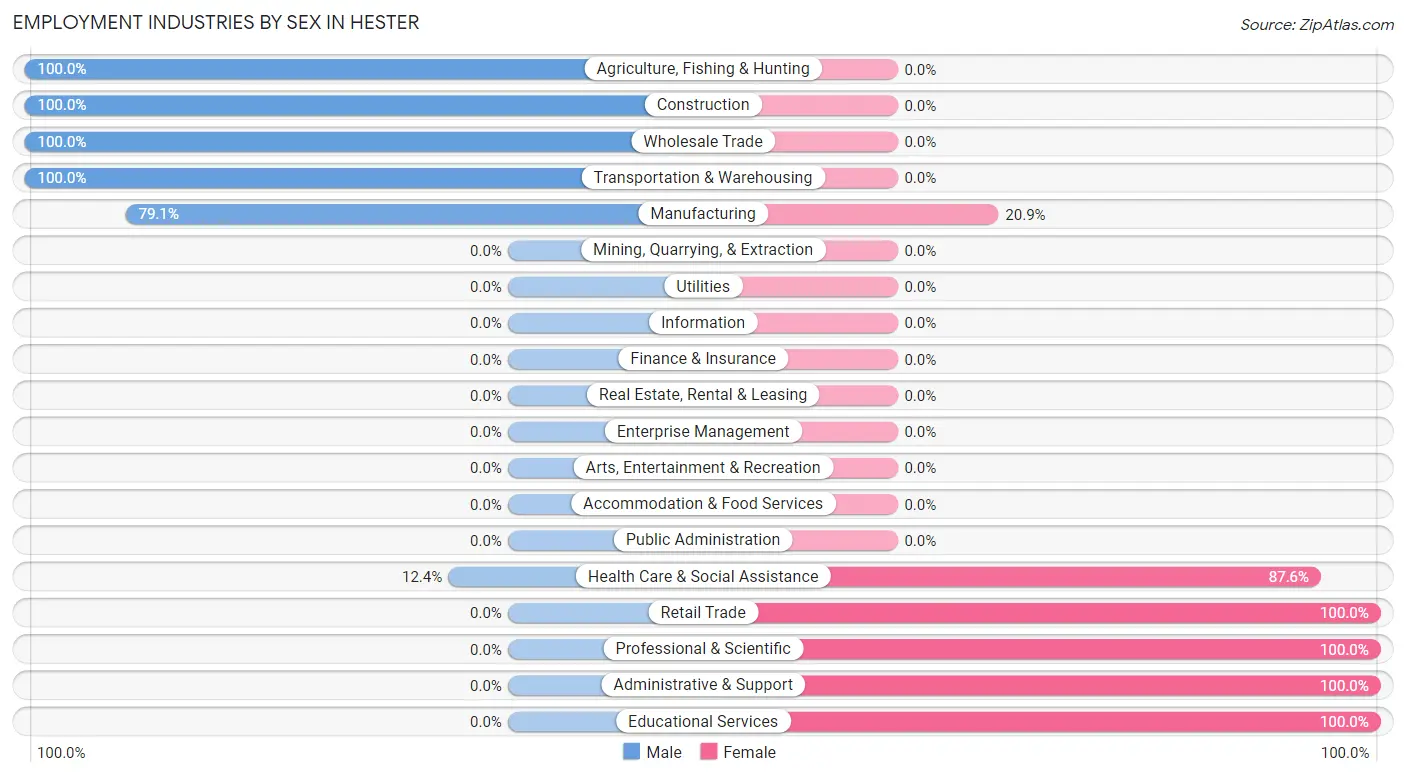
Employment Industries by Sex in Hester
The Hester industries that see more men than women are Agriculture, Fishing & Hunting (100.0%), Construction (100.0%), and Wholesale Trade (100.0%), whereas the industries that tend to have a higher number of women are Retail Trade (100.0%), Professional & Scientific (100.0%), and Administrative & Support (100.0%).
| Industry | Male | Female |
| Agriculture, Fishing & Hunting | 15 (100.0%) | 0 (0.0%) |
| Mining, Quarrying, & Extraction | 0 (0.0%) | 0 (0.0%) |
| Construction | 6 (100.0%) | 0 (0.0%) |
| Manufacturing | 106 (79.1%) | 28 (20.9%) |
| Wholesale Trade | 5 (100.0%) | 0 (0.0%) |
| Retail Trade | 0 (0.0%) | 59 (100.0%) |
| Transportation & Warehousing | 26 (100.0%) | 0 (0.0%) |
| Utilities | 0 (0.0%) | 0 (0.0%) |
| Information | 0 (0.0%) | 0 (0.0%) |
| Finance & Insurance | 0 (0.0%) | 0 (0.0%) |
| Real Estate, Rental & Leasing | 0 (0.0%) | 0 (0.0%) |
| Professional & Scientific | 0 (0.0%) | 7 (100.0%) |
| Enterprise Management | 0 (0.0%) | 0 (0.0%) |
| Administrative & Support | 0 (0.0%) | 17 (100.0%) |
| Educational Services | 0 (0.0%) | 6 (100.0%) |
| Health Care & Social Assistance | 11 (12.4%) | 78 (87.6%) |
| Arts, Entertainment & Recreation | 0 (0.0%) | 0 (0.0%) |
| Accommodation & Food Services | 0 (0.0%) | 0 (0.0%) |
| Public Administration | 0 (0.0%) | 0 (0.0%) |
| Total | 169 (46.4%) | 195 (53.6%) |
Education in Hester
School Enrollment in Hester
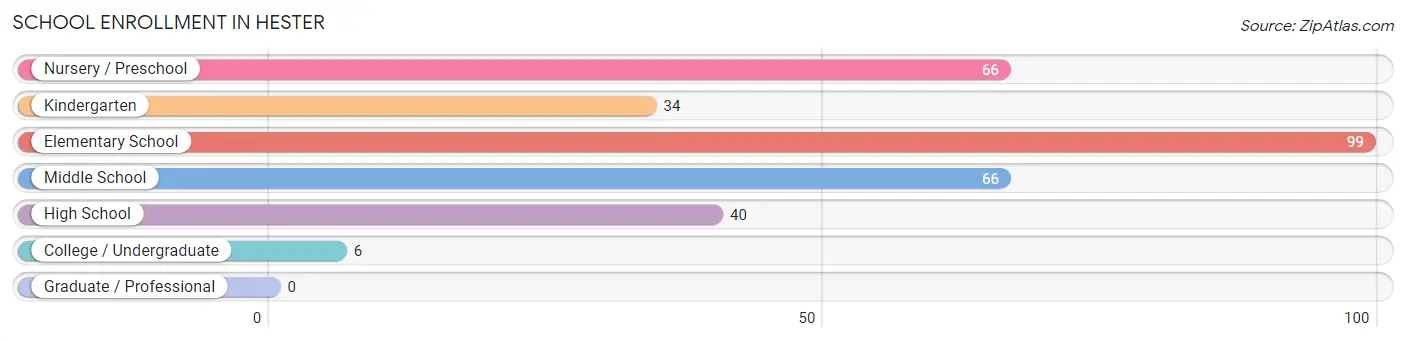
The most common levels of schooling among the 311 students in Hester are elementary school (99 | 31.8%), nursery / preschool (66 | 21.2%), and middle school (66 | 21.2%).
| School Level | # Students | % Students |
| Nursery / Preschool | 66 | 21.2% |
| Kindergarten | 34 | 10.9% |
| Elementary School | 99 | 31.8% |
| Middle School | 66 | 21.2% |
| High School | 40 | 12.9% |
| College / Undergraduate | 6 | 1.9% |
| Graduate / Professional | 0 | 0.0% |
| Total | 311 | 100.0% |
School Enrollment by Age by Funding Source in Hester
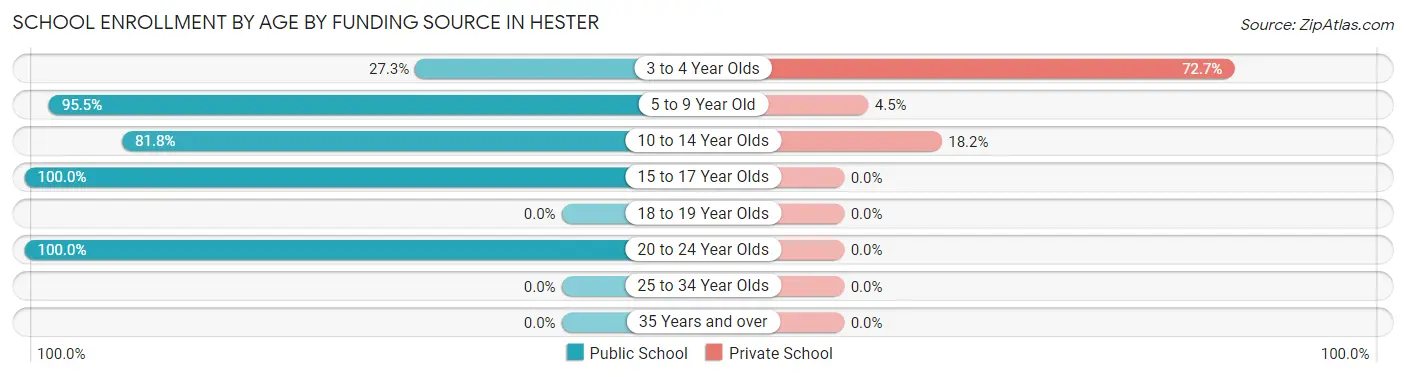
Out of a total of 311 students who are enrolled in schools in Hester, 66 (21.2%) attend a private institution, while the remaining 245 (78.8%) are enrolled in public schools. The age group of 3 to 4 year olds has the highest likelihood of being enrolled in private schools, with 48 (72.7% in the age bracket) enrolled. Conversely, the age group of 15 to 17 year olds has the lowest likelihood of being enrolled in a private school, with 40 (100.0% in the age bracket) attending a public institution.
| Age Bracket | Public School | Private School |
| 3 to 4 Year Olds | 18 (27.3%) | 48 (72.7%) |
| 5 to 9 Year Old | 127 (95.5%) | 6 (4.5%) |
| 10 to 14 Year Olds | 54 (81.8%) | 12 (18.2%) |
| 15 to 17 Year Olds | 40 (100.0%) | 0 (0.0%) |
| 18 to 19 Year Olds | 0 (0.0%) | 0 (0.0%) |
| 20 to 24 Year Olds | 6 (100.0%) | 0 (0.0%) |
| 25 to 34 Year Olds | 0 (0.0%) | 0 (0.0%) |
| 35 Years and over | 0 (0.0%) | 0 (0.0%) |
| Total | 245 (78.8%) | 66 (21.2%) |
Educational Attainment by Field of Study in Hester
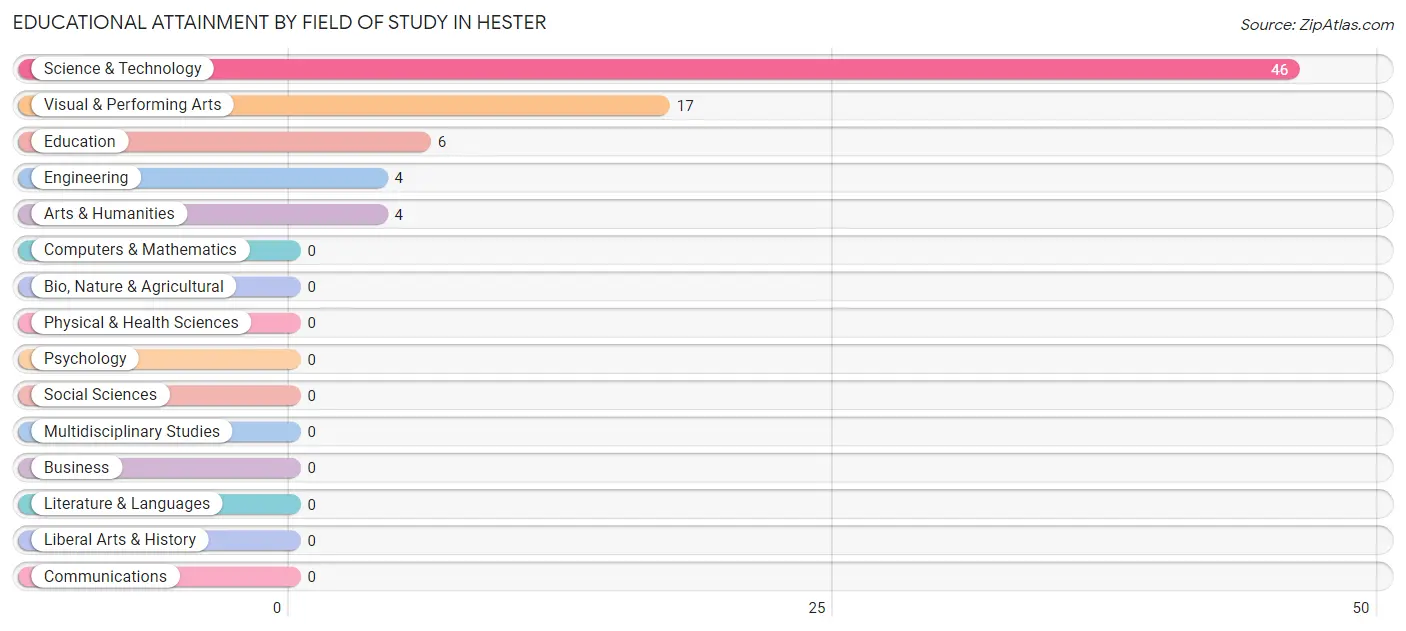
Science & technology (46 | 59.7%), visual & performing arts (17 | 22.1%), education (6 | 7.8%), engineering (4 | 5.2%), and arts & humanities (4 | 5.2%) are the most common fields of study among 77 individuals in Hester who have obtained a bachelor's degree or higher.
| Field of Study | # Graduates | % Graduates |
| Computers & Mathematics | 0 | 0.0% |
| Bio, Nature & Agricultural | 0 | 0.0% |
| Physical & Health Sciences | 0 | 0.0% |
| Psychology | 0 | 0.0% |
| Social Sciences | 0 | 0.0% |
| Engineering | 4 | 5.2% |
| Multidisciplinary Studies | 0 | 0.0% |
| Science & Technology | 46 | 59.7% |
| Business | 0 | 0.0% |
| Education | 6 | 7.8% |
| Literature & Languages | 0 | 0.0% |
| Liberal Arts & History | 0 | 0.0% |
| Visual & Performing Arts | 17 | 22.1% |
| Communications | 0 | 0.0% |
| Arts & Humanities | 4 | 5.2% |
| Total | 77 | 100.0% |
Transportation & Commute in Hester
Vehicle Availability by Sex in Hester
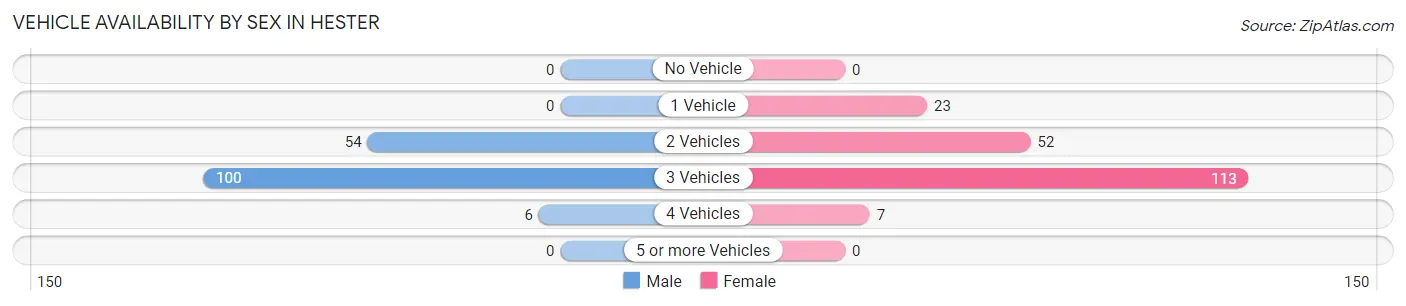
The most prevalent vehicle ownership categories in Hester are males with 3 vehicles (100, accounting for 62.5%) and females with 3 vehicles (113, making up 51.3%).
| Vehicles Available | Male | Female |
| No Vehicle | 0 (0.0%) | 0 (0.0%) |
| 1 Vehicle | 0 (0.0%) | 23 (11.8%) |
| 2 Vehicles | 54 (33.8%) | 52 (26.7%) |
| 3 Vehicles | 100 (62.5%) | 113 (58.0%) |
| 4 Vehicles | 6 (3.7%) | 7 (3.6%) |
| 5 or more Vehicles | 0 (0.0%) | 0 (0.0%) |
| Total | 160 (100.0%) | 195 (100.0%) |
Commute Time in Hester
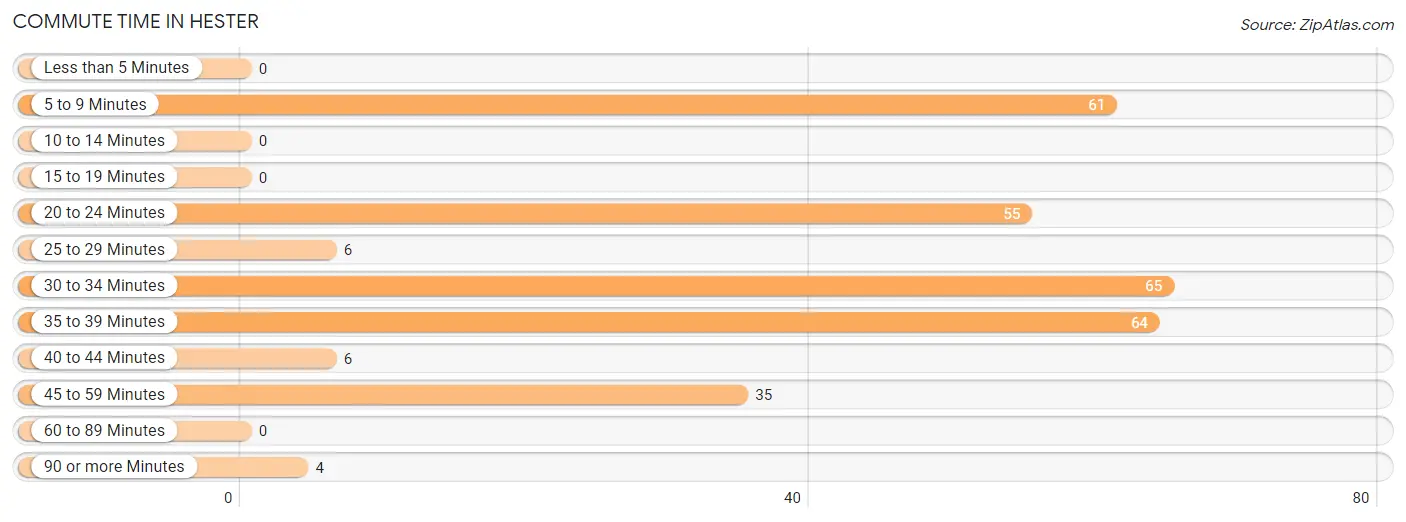
The most frequently occuring commute durations in Hester are 30 to 34 minutes (65 commuters, 22.0%), 35 to 39 minutes (64 commuters, 21.6%), and 5 to 9 minutes (61 commuters, 20.6%).
| Commute Time | # Commuters | % Commuters |
| Less than 5 Minutes | 0 | 0.0% |
| 5 to 9 Minutes | 61 | 20.6% |
| 10 to 14 Minutes | 0 | 0.0% |
| 15 to 19 Minutes | 0 | 0.0% |
| 20 to 24 Minutes | 55 | 18.6% |
| 25 to 29 Minutes | 6 | 2.0% |
| 30 to 34 Minutes | 65 | 22.0% |
| 35 to 39 Minutes | 64 | 21.6% |
| 40 to 44 Minutes | 6 | 2.0% |
| 45 to 59 Minutes | 35 | 11.8% |
| 60 to 89 Minutes | 0 | 0.0% |
| 90 or more Minutes | 4 | 1.3% |
Commute Time by Sex in Hester
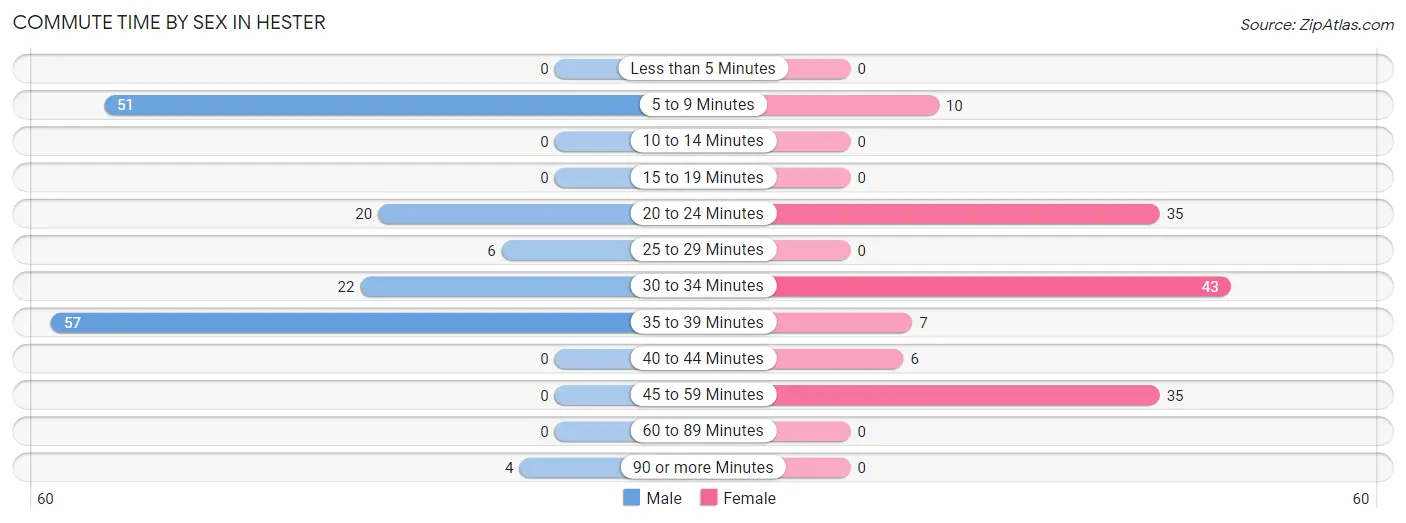
The most common commute times in Hester are 35 to 39 minutes (57 commuters, 35.6%) for males and 30 to 34 minutes (43 commuters, 31.6%) for females.
| Commute Time | Male | Female |
| Less than 5 Minutes | 0 (0.0%) | 0 (0.0%) |
| 5 to 9 Minutes | 51 (31.9%) | 10 (7.3%) |
| 10 to 14 Minutes | 0 (0.0%) | 0 (0.0%) |
| 15 to 19 Minutes | 0 (0.0%) | 0 (0.0%) |
| 20 to 24 Minutes | 20 (12.5%) | 35 (25.7%) |
| 25 to 29 Minutes | 6 (3.7%) | 0 (0.0%) |
| 30 to 34 Minutes | 22 (13.8%) | 43 (31.6%) |
| 35 to 39 Minutes | 57 (35.6%) | 7 (5.1%) |
| 40 to 44 Minutes | 0 (0.0%) | 6 (4.4%) |
| 45 to 59 Minutes | 0 (0.0%) | 35 (25.7%) |
| 60 to 89 Minutes | 0 (0.0%) | 0 (0.0%) |
| 90 or more Minutes | 4 (2.5%) | 0 (0.0%) |
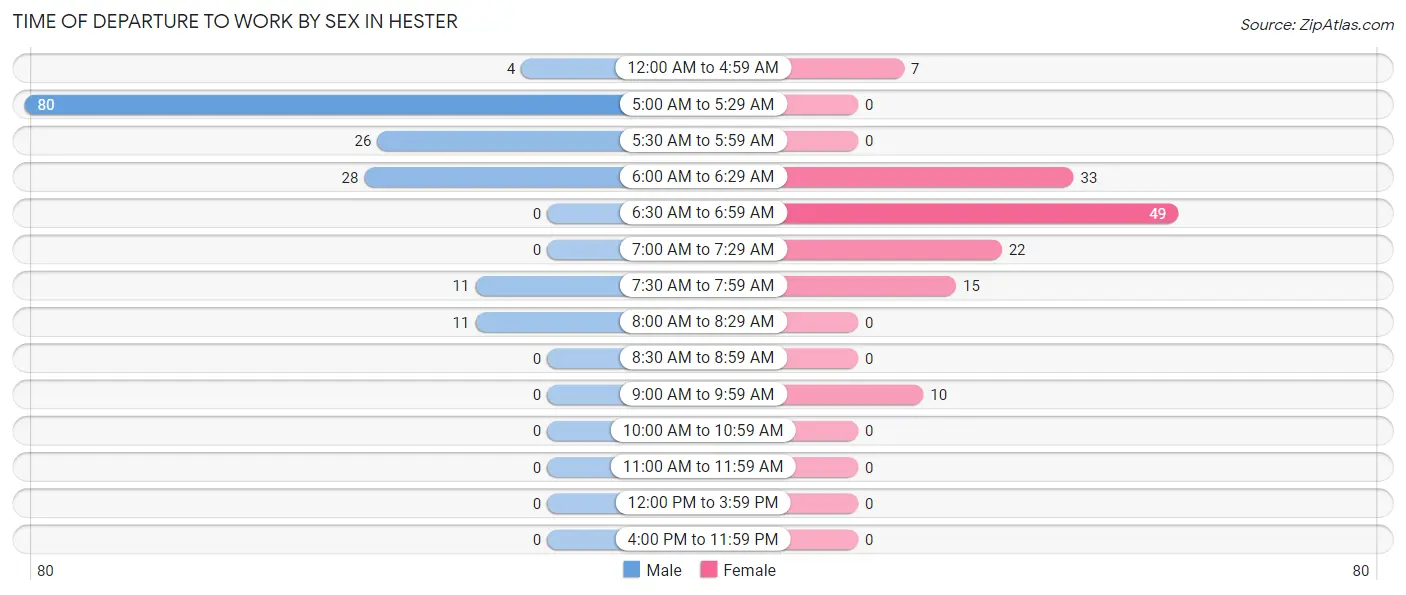
Time of Departure to Work by Sex in Hester
The most frequent times of departure to work in Hester are 5:00 AM to 5:29 AM (80, 50.0%) for males and 6:30 AM to 6:59 AM (49, 36.0%) for females.
| Time of Departure | Male | Female |
| 12:00 AM to 4:59 AM | 4 (2.5%) | 7 (5.1%) |
| 5:00 AM to 5:29 AM | 80 (50.0%) | 0 (0.0%) |
| 5:30 AM to 5:59 AM | 26 (16.3%) | 0 (0.0%) |
| 6:00 AM to 6:29 AM | 28 (17.5%) | 33 (24.3%) |
| 6:30 AM to 6:59 AM | 0 (0.0%) | 49 (36.0%) |
| 7:00 AM to 7:29 AM | 0 (0.0%) | 22 (16.2%) |
| 7:30 AM to 7:59 AM | 11 (6.9%) | 15 (11.0%) |
| 8:00 AM to 8:29 AM | 11 (6.9%) | 0 (0.0%) |
| 8:30 AM to 8:59 AM | 0 (0.0%) | 0 (0.0%) |
| 9:00 AM to 9:59 AM | 0 (0.0%) | 10 (7.3%) |
| 10:00 AM to 10:59 AM | 0 (0.0%) | 0 (0.0%) |
| 11:00 AM to 11:59 AM | 0 (0.0%) | 0 (0.0%) |
| 12:00 PM to 3:59 PM | 0 (0.0%) | 0 (0.0%) |
| 4:00 PM to 11:59 PM | 0 (0.0%) | 0 (0.0%) |
| Total | 160 (100.0%) | 136 (100.0%) |
Housing Occupancy in Hester
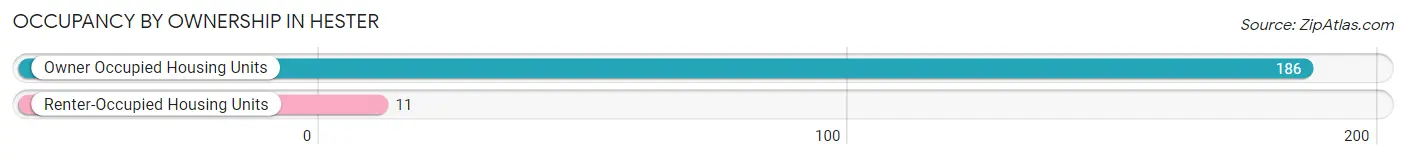
Occupancy by Ownership in Hester
Of the total 197 dwellings in Hester, owner-occupied units account for 186 (94.4%), while renter-occupied units make up 11 (5.6%).
| Occupancy | # Housing Units | % Housing Units |
| Owner Occupied Housing Units | 186 | 94.4% |
| Renter-Occupied Housing Units | 11 | 5.6% |
| Total Occupied Housing Units | 197 | 100.0% |
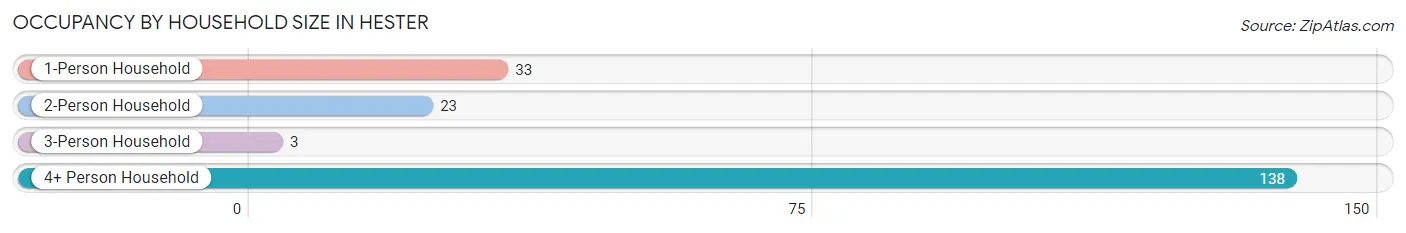
Occupancy by Household Size in Hester
| Household Size | # Housing Units | % Housing Units |
| 1-Person Household | 33 | 16.8% |
| 2-Person Household | 23 | 11.7% |
| 3-Person Household | 3 | 1.5% |
| 4+ Person Household | 138 | 70.1% |
| Total Housing Units | 197 | 100.0% |
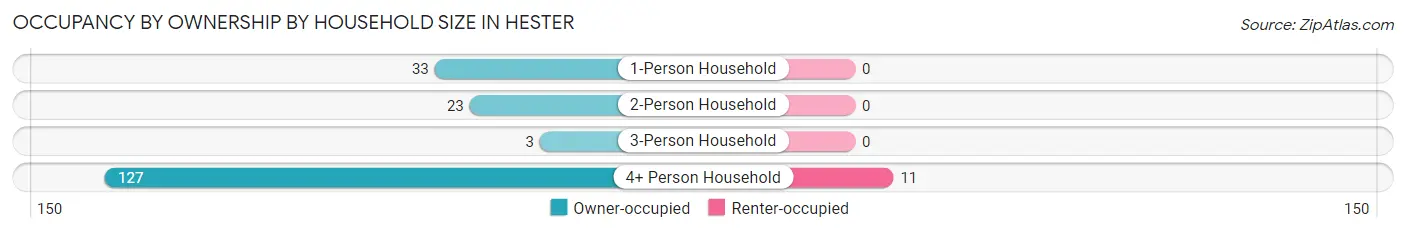
Occupancy by Ownership by Household Size in Hester
| Household Size | Owner-occupied | Renter-occupied |
| 1-Person Household | 33 (100.0%) | 0 (0.0%) |
| 2-Person Household | 23 (100.0%) | 0 (0.0%) |
| 3-Person Household | 3 (100.0%) | 0 (0.0%) |
| 4+ Person Household | 127 (92.0%) | 11 (8.0%) |
| Total Housing Units | 186 (94.4%) | 11 (5.6%) |
Occupancy by Educational Attainment in Hester
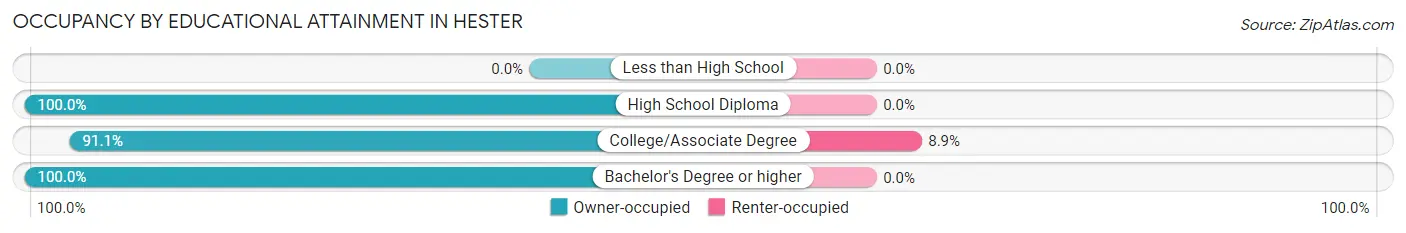
| Household Size | Owner-occupied | Renter-occupied |
| Less than High School | 0 (0.0%) | 0 (0.0%) |
| High School Diploma | 51 (100.0%) | 0 (0.0%) |
| College/Associate Degree | 112 (91.1%) | 11 (8.9%) |
| Bachelor's Degree or higher | 23 (100.0%) | 0 (0.0%) |
Occupancy by Age of Householder in Hester
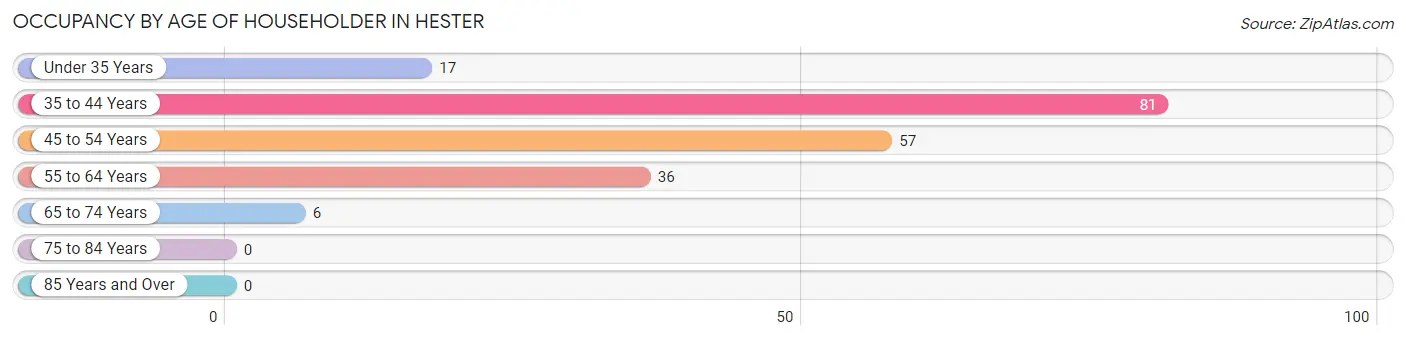
| Age Bracket | # Households | % Households |
| Under 35 Years | 17 | 8.6% |
| 35 to 44 Years | 81 | 41.1% |
| 45 to 54 Years | 57 | 28.9% |
| 55 to 64 Years | 36 | 18.3% |
| 65 to 74 Years | 6 | 3.0% |
| 75 to 84 Years | 0 | 0.0% |
| 85 Years and Over | 0 | 0.0% |
| Total | 197 | 100.0% |
Housing Finances in Hester
Median Income by Occupancy in Hester
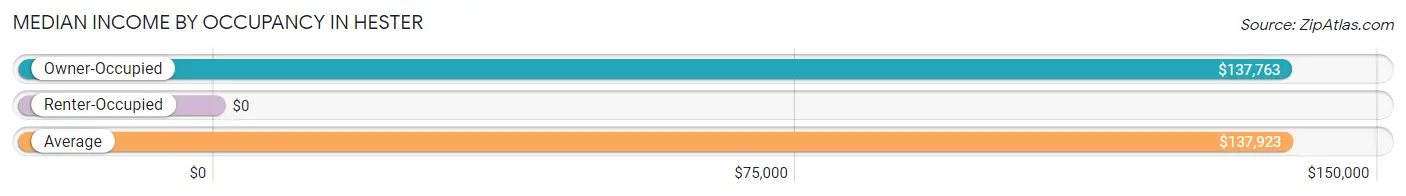
| Occupancy Type | # Households | Median Income |
| Owner-Occupied | 186 (94.4%) | $137,763 |
| Renter-Occupied | 11 (5.6%) | $0 |
| Average | 197 (100.0%) | $137,923 |
Occupancy by Householder Income Bracket in Hester
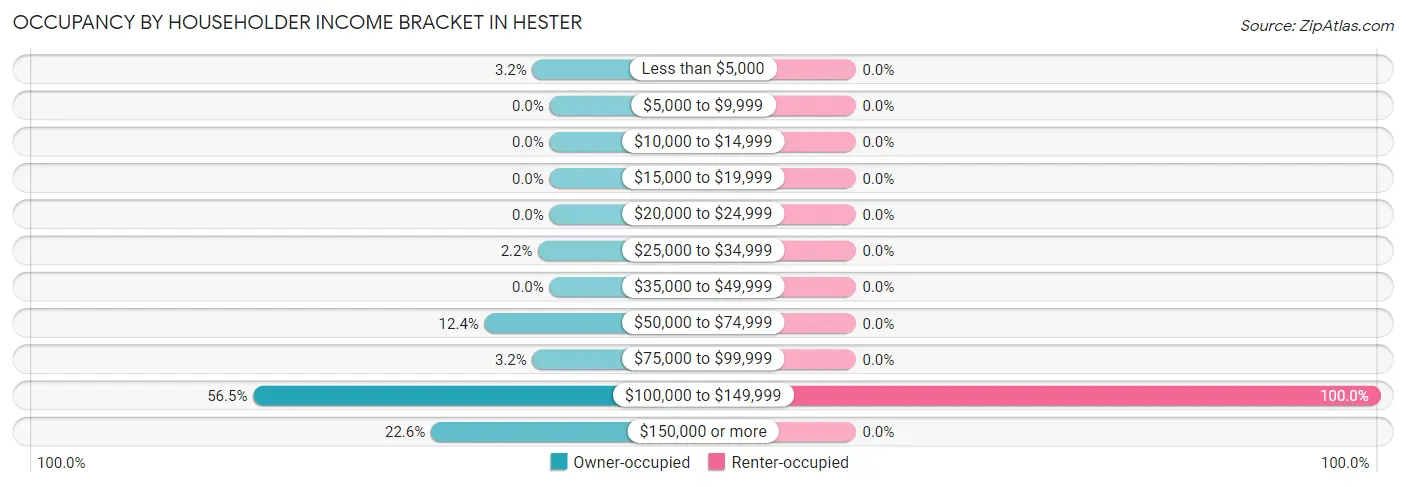
| Income Bracket | Owner-occupied | Renter-occupied |
| Less than $5,000 | 6 (3.2%) | 0 (0.0%) |
| $5,000 to $9,999 | 0 (0.0%) | 0 (0.0%) |
| $10,000 to $14,999 | 0 (0.0%) | 0 (0.0%) |
| $15,000 to $19,999 | 0 (0.0%) | 0 (0.0%) |
| $20,000 to $24,999 | 0 (0.0%) | 0 (0.0%) |
| $25,000 to $34,999 | 4 (2.1%) | 0 (0.0%) |
| $35,000 to $49,999 | 0 (0.0%) | 0 (0.0%) |
| $50,000 to $74,999 | 23 (12.4%) | 0 (0.0%) |
| $75,000 to $99,999 | 6 (3.2%) | 0 (0.0%) |
| $100,000 to $149,999 | 105 (56.5%) | 11 (100.0%) |
| $150,000 or more | 42 (22.6%) | 0 (0.0%) |
| Total | 186 (100.0%) | 11 (100.0%) |
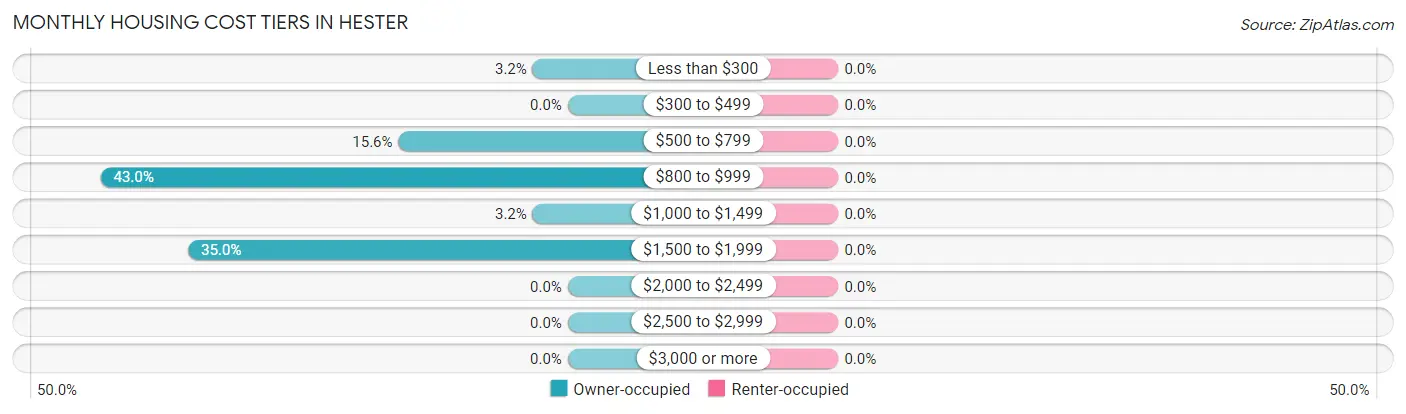
Monthly Housing Cost Tiers in Hester
| Monthly Cost | Owner-occupied | Renter-occupied |
| Less than $300 | 6 (3.2%) | 0 (0.0%) |
| $300 to $499 | 0 (0.0%) | 0 (0.0%) |
| $500 to $799 | 29 (15.6%) | 0 (0.0%) |
| $800 to $999 | 80 (43.0%) | 0 (0.0%) |
| $1,000 to $1,499 | 6 (3.2%) | 0 (0.0%) |
| $1,500 to $1,999 | 65 (34.9%) | 0 (0.0%) |
| $2,000 to $2,499 | 0 (0.0%) | 0 (0.0%) |
| $2,500 to $2,999 | 0 (0.0%) | 0 (0.0%) |
| $3,000 or more | 0 (0.0%) | 0 (0.0%) |
| Total | 186 (100.0%) | 11 (100.0%) |
Physical Housing Characteristics in Hester
Housing Structures in Hester
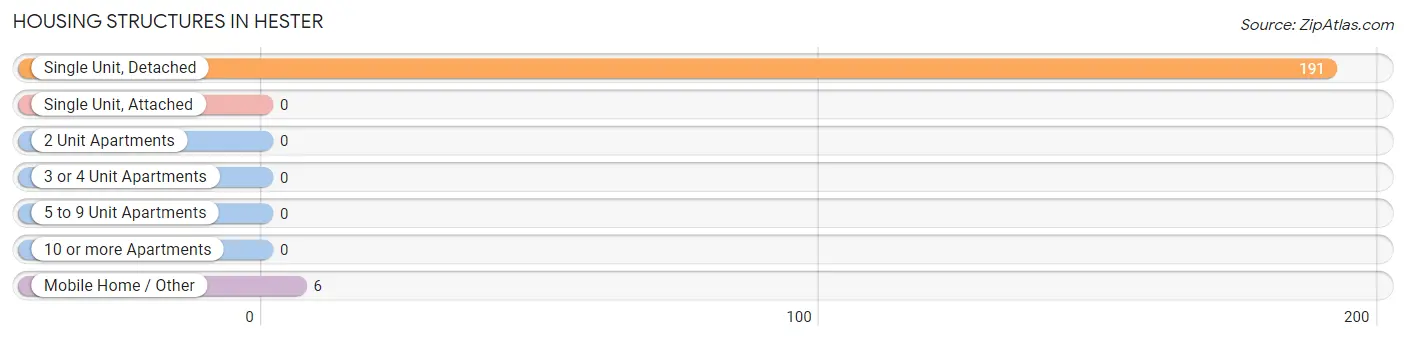
| Structure Type | # Housing Units | % Housing Units |
| Single Unit, Detached | 191 | 97.0% |
| Single Unit, Attached | 0 | 0.0% |
| 2 Unit Apartments | 0 | 0.0% |
| 3 or 4 Unit Apartments | 0 | 0.0% |
| 5 to 9 Unit Apartments | 0 | 0.0% |
| 10 or more Apartments | 0 | 0.0% |
| Mobile Home / Other | 6 | 3.0% |
| Total | 197 | 100.0% |
Housing Structures by Occupancy in Hester
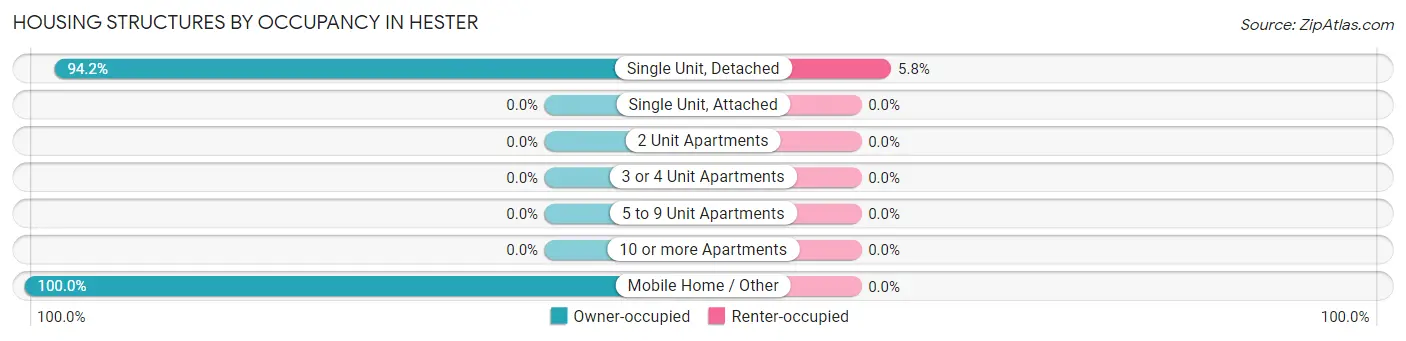
| Structure Type | Owner-occupied | Renter-occupied |
| Single Unit, Detached | 180 (94.2%) | 11 (5.8%) |
| Single Unit, Attached | 0 (0.0%) | 0 (0.0%) |
| 2 Unit Apartments | 0 (0.0%) | 0 (0.0%) |
| 3 or 4 Unit Apartments | 0 (0.0%) | 0 (0.0%) |
| 5 to 9 Unit Apartments | 0 (0.0%) | 0 (0.0%) |
| 10 or more Apartments | 0 (0.0%) | 0 (0.0%) |
| Mobile Home / Other | 6 (100.0%) | 0 (0.0%) |
| Total | 186 (94.4%) | 11 (5.6%) |
Housing Structures by Number of Rooms in Hester
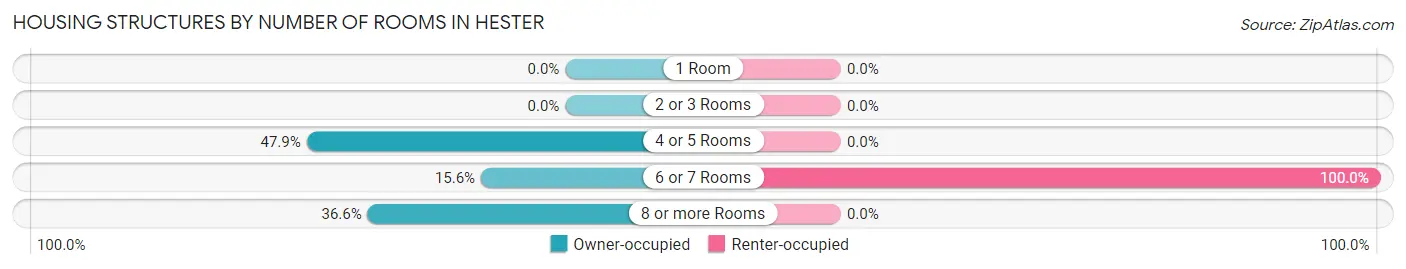
| Number of Rooms | Owner-occupied | Renter-occupied |
| 1 Room | 0 (0.0%) | 0 (0.0%) |
| 2 or 3 Rooms | 0 (0.0%) | 0 (0.0%) |
| 4 or 5 Rooms | 89 (47.8%) | 0 (0.0%) |
| 6 or 7 Rooms | 29 (15.6%) | 11 (100.0%) |
| 8 or more Rooms | 68 (36.6%) | 0 (0.0%) |
| Total | 186 (100.0%) | 11 (100.0%) |
Housing Structure by Heating Type in Hester
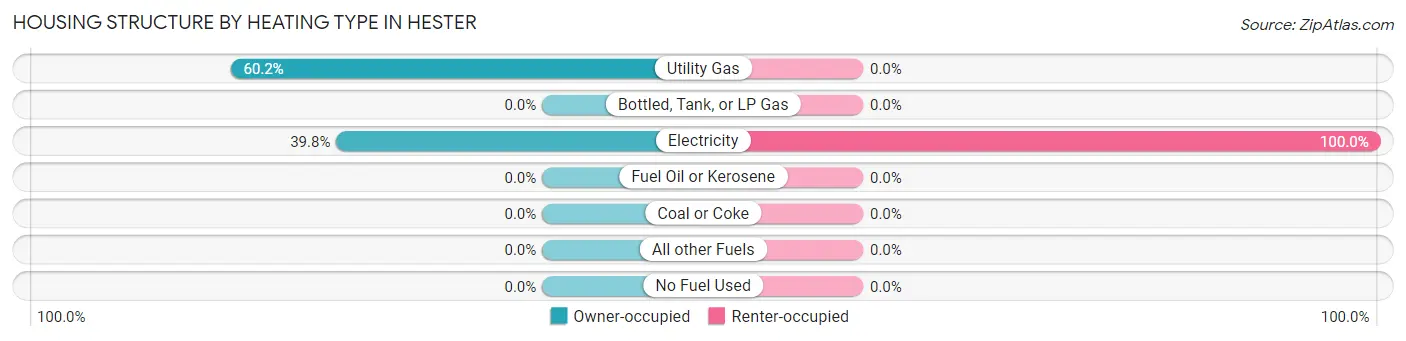
| Heating Type | Owner-occupied | Renter-occupied |
| Utility Gas | 112 (60.2%) | 0 (0.0%) |
| Bottled, Tank, or LP Gas | 0 (0.0%) | 0 (0.0%) |
| Electricity | 74 (39.8%) | 11 (100.0%) |
| Fuel Oil or Kerosene | 0 (0.0%) | 0 (0.0%) |
| Coal or Coke | 0 (0.0%) | 0 (0.0%) |
| All other Fuels | 0 (0.0%) | 0 (0.0%) |
| No Fuel Used | 0 (0.0%) | 0 (0.0%) |
| Total | 186 (100.0%) | 11 (100.0%) |
Household Vehicle Usage in Hester
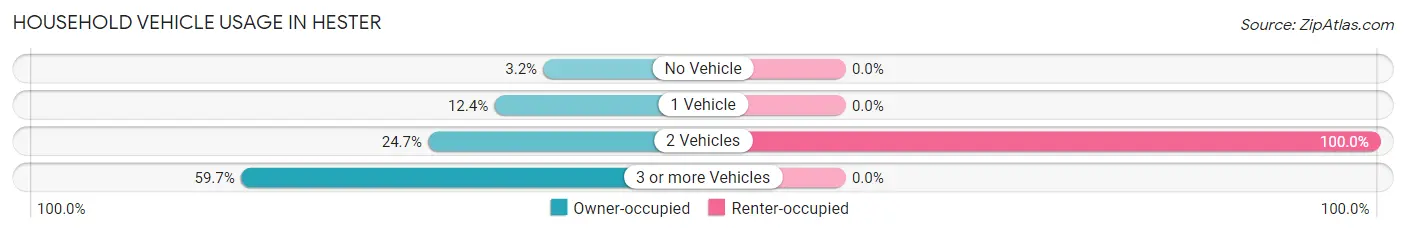
| Vehicles per Household | Owner-occupied | Renter-occupied |
| No Vehicle | 6 (3.2%) | 0 (0.0%) |
| 1 Vehicle | 23 (12.4%) | 0 (0.0%) |
| 2 Vehicles | 46 (24.7%) | 11 (100.0%) |
| 3 or more Vehicles | 111 (59.7%) | 0 (0.0%) |
| Total | 186 (100.0%) | 11 (100.0%) |
Real Estate & Mortgages in Hester
Real Estate and Mortgage Overview in Hester
| Characteristic | Without Mortgage | With Mortgage |
| Housing Units | 35 | 151 |
| Median Property Value | $197,100 | $171,700 |
| Median Household Income | $133,942 | $30 |
| Monthly Housing Costs | $663 | $0 |
| Real Estate Taxes | $1,058 | $6 |
Property Value by Mortgage Status in Hester
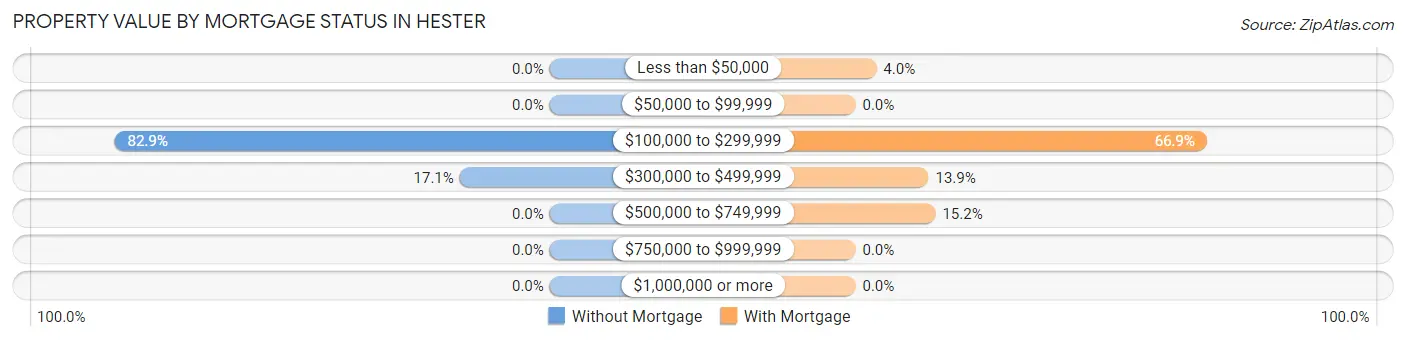
| Property Value | Without Mortgage | With Mortgage |
| Less than $50,000 | 0 (0.0%) | 6 (4.0%) |
| $50,000 to $99,999 | 0 (0.0%) | 0 (0.0%) |
| $100,000 to $299,999 | 29 (82.9%) | 101 (66.9%) |
| $300,000 to $499,999 | 6 (17.1%) | 21 (13.9%) |
| $500,000 to $749,999 | 0 (0.0%) | 23 (15.2%) |
| $750,000 to $999,999 | 0 (0.0%) | 0 (0.0%) |
| $1,000,000 or more | 0 (0.0%) | 0 (0.0%) |
| Total | 35 (100.0%) | 151 (100.0%) |
Household Income by Mortgage Status in Hester
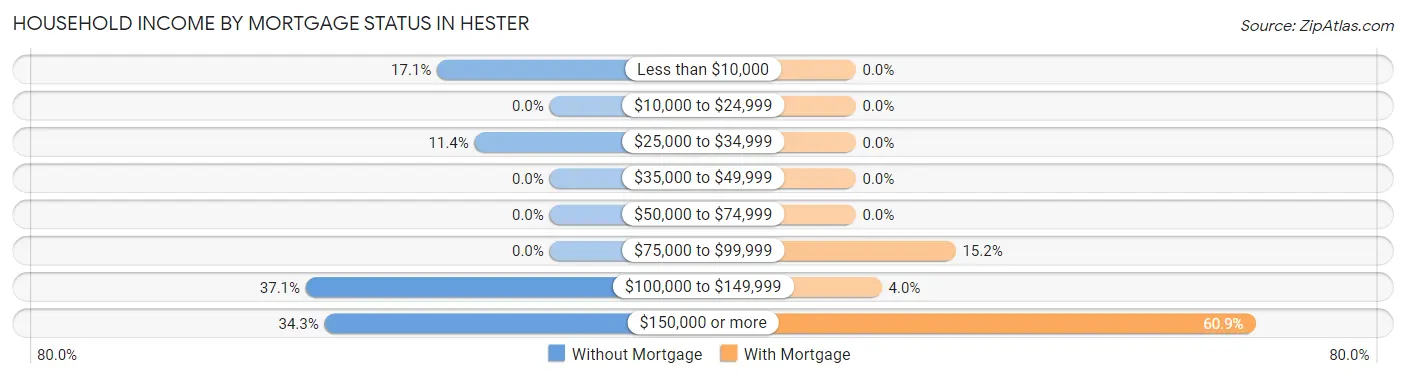
| Household Income | Without Mortgage | With Mortgage |
| Less than $10,000 | 6 (17.1%) | 0 (0.0%) |
| $10,000 to $24,999 | 0 (0.0%) | 0 (0.0%) |
| $25,000 to $34,999 | 4 (11.4%) | 0 (0.0%) |
| $35,000 to $49,999 | 0 (0.0%) | 0 (0.0%) |
| $50,000 to $74,999 | 0 (0.0%) | 0 (0.0%) |
| $75,000 to $99,999 | 0 (0.0%) | 23 (15.2%) |
| $100,000 to $149,999 | 13 (37.1%) | 6 (4.0%) |
| $150,000 or more | 12 (34.3%) | 92 (60.9%) |
| Total | 35 (100.0%) | 151 (100.0%) |
Property Value to Household Income Ratio in Hester
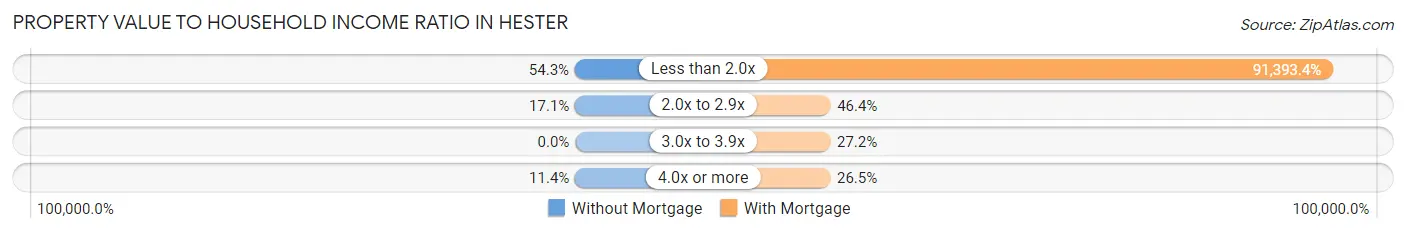
| Value-to-Income Ratio | Without Mortgage | With Mortgage |
| Less than 2.0x | 19 (54.3%) | 138,004 (91,393.4%) |
| 2.0x to 2.9x | 6 (17.1%) | 70 (46.4%) |
| 3.0x to 3.9x | 0 (0.0%) | 41 (27.2%) |
| 4.0x or more | 4 (11.4%) | 40 (26.5%) |
| Total | 35 (100.0%) | 151 (100.0%) |
Real Estate Taxes by Mortgage Status in Hester
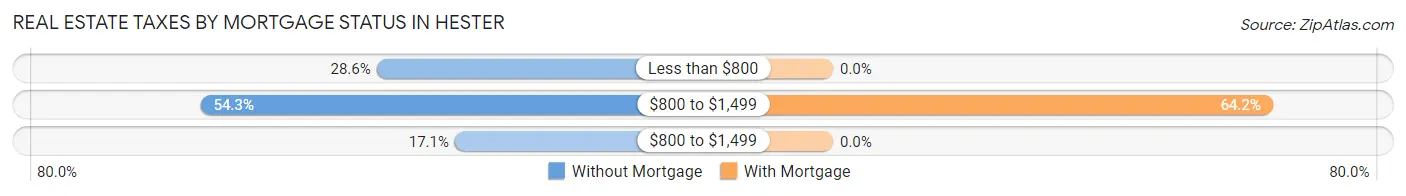
| Property Taxes | Without Mortgage | With Mortgage |
| Less than $800 | 10 (28.6%) | 0 (0.0%) |
| $800 to $1,499 | 19 (54.3%) | 97 (64.2%) |
| $800 to $1,499 | 6 (17.1%) | 0 (0.0%) |
| Total | 35 (100.0%) | 151 (100.0%) |
Health & Disability in Hester
Health Insurance Coverage by Age in Hester
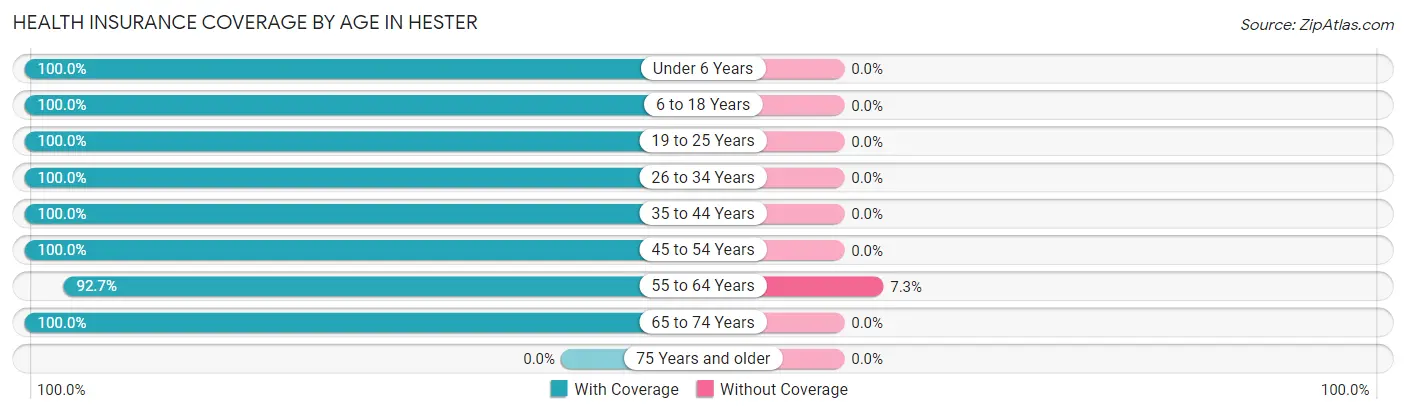
| Age Bracket | With Coverage | Without Coverage |
| Under 6 Years | 117 (100.0%) | 0 (0.0%) |
| 6 to 18 Years | 205 (100.0%) | 0 (0.0%) |
| 19 to 25 Years | 6 (100.0%) | 0 (0.0%) |
| 26 to 34 Years | 39 (100.0%) | 0 (0.0%) |
| 35 to 44 Years | 166 (100.0%) | 0 (0.0%) |
| 45 to 54 Years | 108 (100.0%) | 0 (0.0%) |
| 55 to 64 Years | 51 (92.7%) | 4 (7.3%) |
| 65 to 74 Years | 10 (100.0%) | 0 (0.0%) |
| 75 Years and older | 0 (0.0%) | 0 (0.0%) |
| Total | 702 (99.4%) | 4 (0.6%) |
Health Insurance Coverage by Citizenship Status in Hester

| Citizenship Status | With Coverage | Without Coverage |
| Native Born | 117 (100.0%) | 0 (0.0%) |
| Foreign Born, Citizen | 205 (100.0%) | 0 (0.0%) |
| Foreign Born, not a Citizen | 6 (100.0%) | 0 (0.0%) |
Health Insurance Coverage by Household Income in Hester
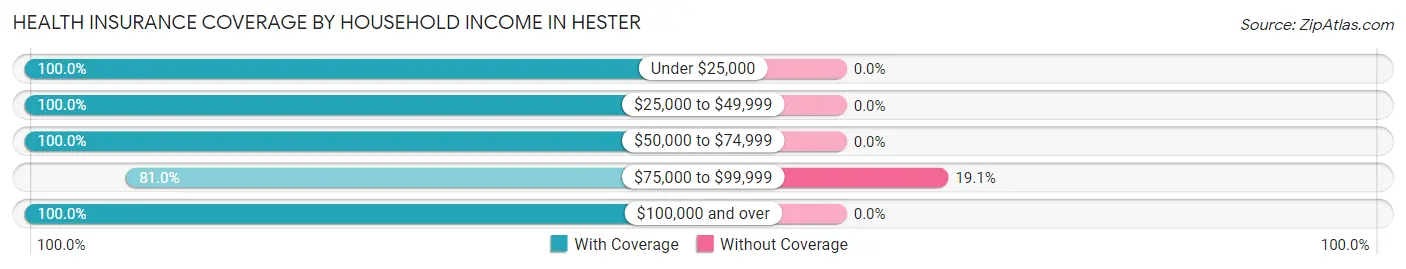
| Household Income | With Coverage | Without Coverage |
| Under $25,000 | 6 (100.0%) | 0 (0.0%) |
| $25,000 to $49,999 | 4 (100.0%) | 0 (0.0%) |
| $50,000 to $74,999 | 23 (100.0%) | 0 (0.0%) |
| $75,000 to $99,999 | 17 (80.9%) | 4 (19.1%) |
| $100,000 and over | 652 (100.0%) | 0 (0.0%) |
Public vs Private Health Insurance Coverage by Age in Hester
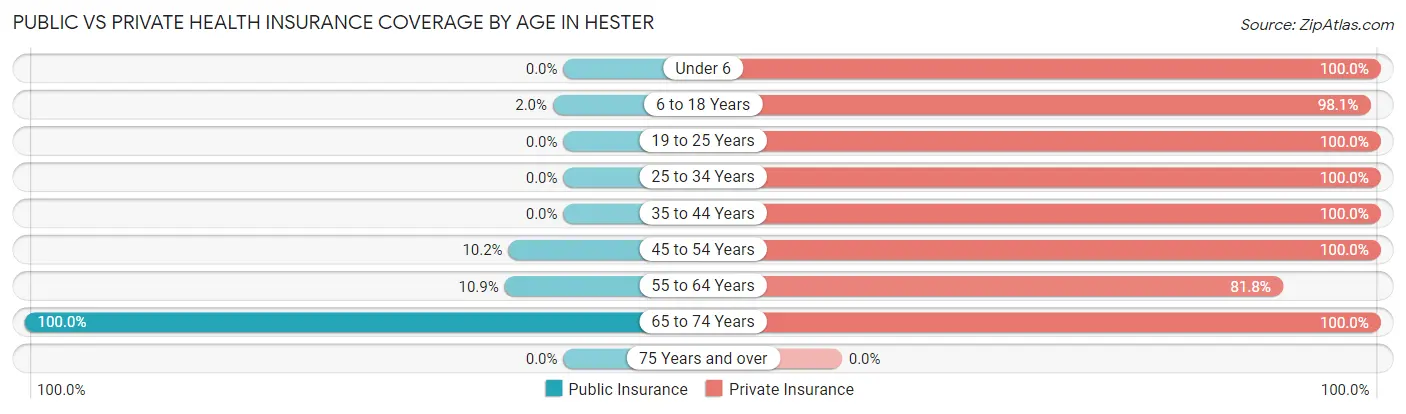
| Age Bracket | Public Insurance | Private Insurance |
| Under 6 | 0 (0.0%) | 117 (100.0%) |
| 6 to 18 Years | 4 (1.9%) | 201 (98.1%) |
| 19 to 25 Years | 0 (0.0%) | 6 (100.0%) |
| 25 to 34 Years | 0 (0.0%) | 39 (100.0%) |
| 35 to 44 Years | 0 (0.0%) | 166 (100.0%) |
| 45 to 54 Years | 11 (10.2%) | 108 (100.0%) |
| 55 to 64 Years | 6 (10.9%) | 45 (81.8%) |
| 65 to 74 Years | 10 (100.0%) | 10 (100.0%) |
| 75 Years and over | 0 (0.0%) | 0 (0.0%) |
| Total | 31 (4.4%) | 692 (98.0%) |
Disability Status by Sex by Age in Hester
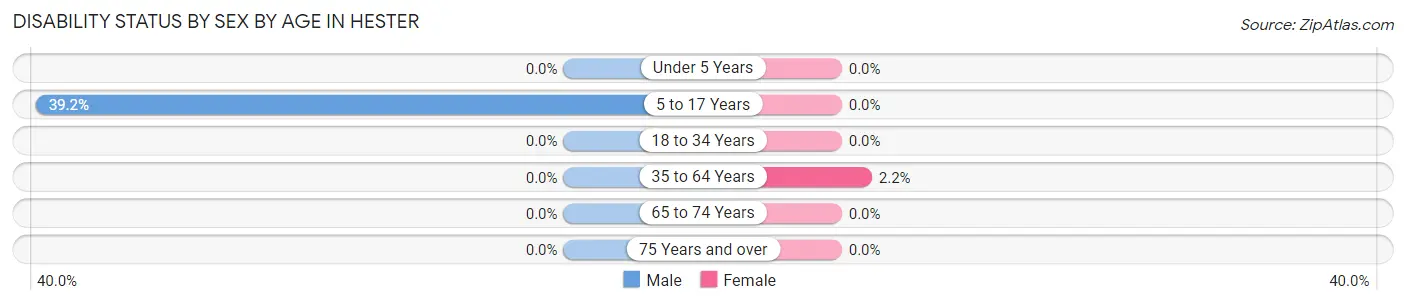
| Age Bracket | Male | Female |
| Under 5 Years | 0 (0.0%) | 0 (0.0%) |
| 5 to 17 Years | 47 (39.2%) | 0 (0.0%) |
| 18 to 34 Years | 0 (0.0%) | 0 (0.0%) |
| 35 to 64 Years | 0 (0.0%) | 4 (2.2%) |
| 65 to 74 Years | 0 (0.0%) | 0 (0.0%) |
| 75 Years and over | 0 (0.0%) | 0 (0.0%) |
Disability Class by Sex by Age in Hester
Disability Class: Hearing Difficulty
| Age Bracket | Male | Female |
| Under 5 Years | 0 (0.0%) | 0 (0.0%) |
| 5 to 17 Years | 0 (0.0%) | 0 (0.0%) |
| 18 to 34 Years | 0 (0.0%) | 0 (0.0%) |
| 35 to 64 Years | 0 (0.0%) | 0 (0.0%) |
| 65 to 74 Years | 0 (0.0%) | 0 (0.0%) |
| 75 Years and over | 0 (0.0%) | 0 (0.0%) |
Disability Class: Vision Difficulty
| Age Bracket | Male | Female |
| Under 5 Years | 0 (0.0%) | 0 (0.0%) |
| 5 to 17 Years | 0 (0.0%) | 0 (0.0%) |
| 18 to 34 Years | 0 (0.0%) | 0 (0.0%) |
| 35 to 64 Years | 0 (0.0%) | 0 (0.0%) |
| 65 to 74 Years | 0 (0.0%) | 0 (0.0%) |
| 75 Years and over | 0 (0.0%) | 0 (0.0%) |
Disability Class: Cognitive Difficulty
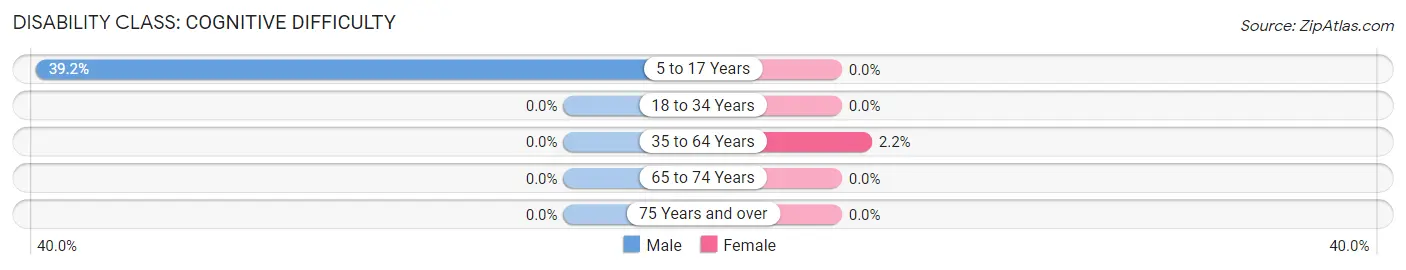
| Age Bracket | Male | Female |
| 5 to 17 Years | 47 (39.2%) | 0 (0.0%) |
| 18 to 34 Years | 0 (0.0%) | 0 (0.0%) |
| 35 to 64 Years | 0 (0.0%) | 4 (2.2%) |
| 65 to 74 Years | 0 (0.0%) | 0 (0.0%) |
| 75 Years and over | 0 (0.0%) | 0 (0.0%) |
Disability Class: Ambulatory Difficulty
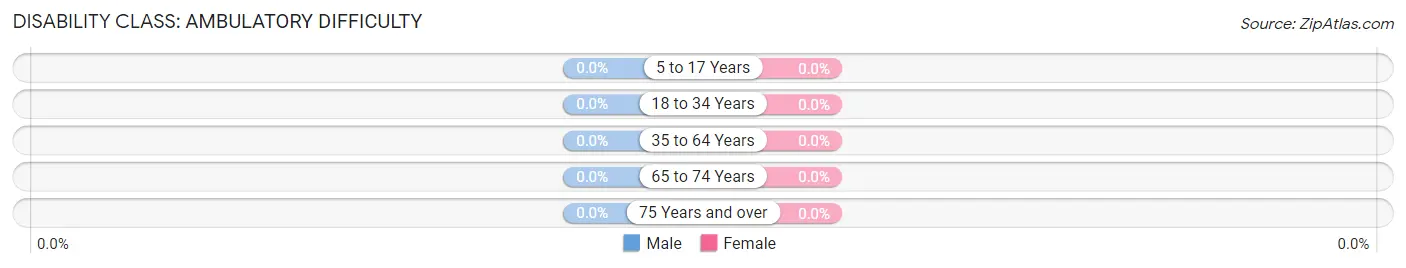
| Age Bracket | Male | Female |
| 5 to 17 Years | 0 (0.0%) | 0 (0.0%) |
| 18 to 34 Years | 0 (0.0%) | 0 (0.0%) |
| 35 to 64 Years | 0 (0.0%) | 0 (0.0%) |
| 65 to 74 Years | 0 (0.0%) | 0 (0.0%) |
| 75 Years and over | 0 (0.0%) | 0 (0.0%) |
Disability Class: Self-Care Difficulty
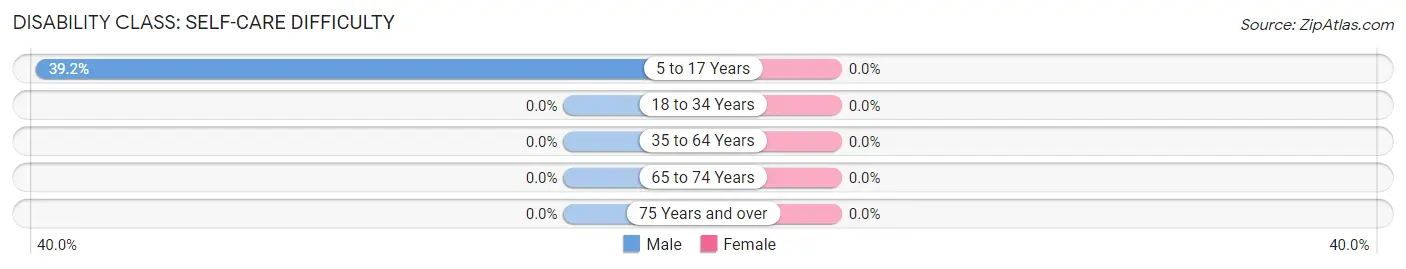
| Age Bracket | Male | Female |
| 5 to 17 Years | 47 (39.2%) | 0 (0.0%) |
| 18 to 34 Years | 0 (0.0%) | 0 (0.0%) |
| 35 to 64 Years | 0 (0.0%) | 0 (0.0%) |
| 65 to 74 Years | 0 (0.0%) | 0 (0.0%) |
| 75 Years and over | 0 (0.0%) | 0 (0.0%) |
Technology Access in Hester
Computing Device Access in Hester
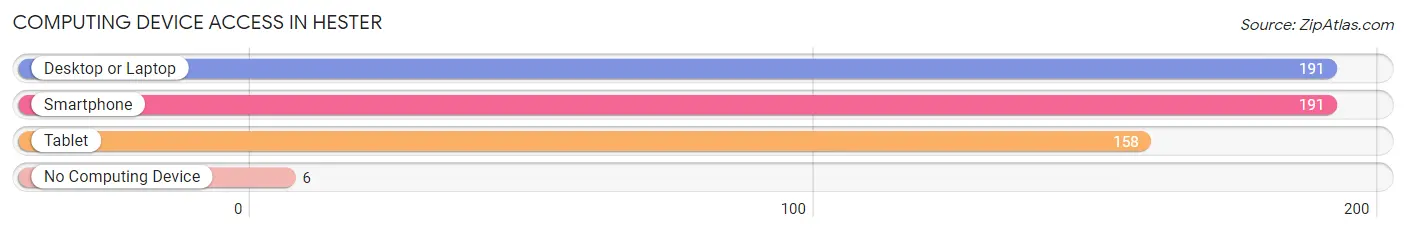
| Device Type | # Households | % Households |
| Desktop or Laptop | 191 | 97.0% |
| Smartphone | 191 | 97.0% |
| Tablet | 158 | 80.2% |
| No Computing Device | 6 | 3.0% |
| Total | 197 | 100.0% |
Internet Access in Hester
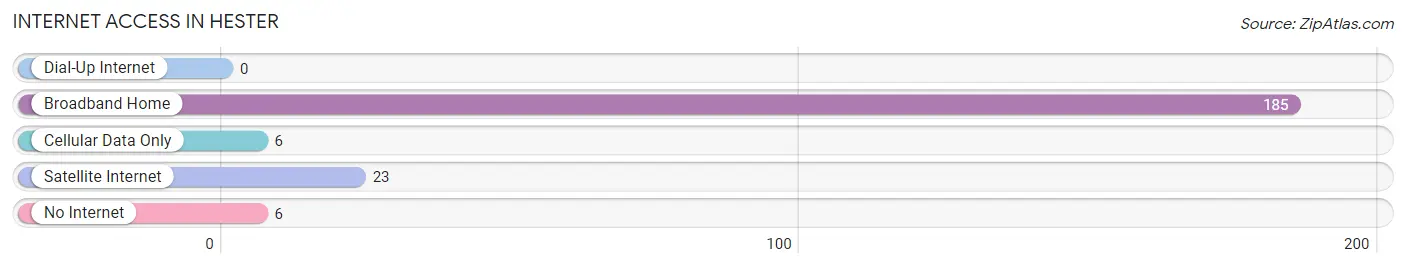
| Internet Type | # Households | % Households |
| Dial-Up Internet | 0 | 0.0% |
| Broadband Home | 185 | 93.9% |
| Cellular Data Only | 6 | 3.0% |
| Satellite Internet | 23 | 11.7% |
| No Internet | 6 | 3.0% |
| Total | 197 | 100.0% |
Hester Summary
Hester, Louisiana is a small town located in the northern part of the state, in the parish of Rapides. It is situated on the banks of the Red River, and is home to a population of just over 1,000 people. The town was founded in 1845, and has a rich history of agriculture, industry, and culture.
Geography
Hester is located in the northern part of Louisiana, in the parish of Rapides. It is situated on the banks of the Red River, and is surrounded by the towns of Pineville, Alexandria, and Woodworth. The town is located in a rural area, and is surrounded by farmland and forests. The climate in Hester is humid subtropical, with hot summers and mild winters.
Economy
Hester’s economy is largely based on agriculture and industry. The town is home to several farms, which produce a variety of crops, including cotton, corn, soybeans, and wheat. The town also has several manufacturing plants, which produce a variety of products, including furniture, clothing, and electronics. In addition, Hester is home to several small businesses, including restaurants, shops, and services.
Demographics
As of the 2010 census, Hester had a population of 1,072 people. The racial makeup of the town was 79.3% White, 17.2% African American, 0.7% Native American, 0.3% Asian, 0.1% Pacific Islander, and 2.4% from other races. The median household income in Hester was $30,938, and the median family income was $37,813. The town’s poverty rate was 22.2%.
History
Hester was founded in 1845 by a group of settlers from the nearby town of Pineville. The town was named after the Hester family, who were among the first settlers. The town quickly grew, and by the late 19th century, it had become a thriving agricultural and industrial center. The town was home to several cotton mills, furniture factories, and other businesses.
In the early 20th century, Hester experienced a period of decline, as many of the town’s businesses closed or moved away. However, in the late 20th century, the town experienced a resurgence, as new businesses opened and the town’s population began to grow. Today, Hester is a small but vibrant town, with a strong sense of community and a rich history.
Common Questions
What is Per Capita Income in Hester?
Per Capita income in Hester is $39,224.
What is the Median Family Income in Hester?
Median Family Income in Hester is $138,529.
What is the Median Household income in Hester?
Median Household Income in Hester is $137,923.
What is Income or Wage Gap in Hester?
Income or Wage Gap in Hester is 50.4%.
Women in Hester earn 49.6 cents for every dollar earned by a man.
What is Inequality or Gini Index in Hester?
Inequality or Gini Index in Hester is 0.23.
What is the Total Population of Hester?
Total Population of Hester is 706.
What is the Total Male Population of Hester?
Total Male Population of Hester is 330.
What is the Total Female Population of Hester?
Total Female Population of Hester is 376.
What is the Ratio of Males per 100 Females in Hester?
There are 87.77 Males per 100 Females in Hester.
What is the Ratio of Females per 100 Males in Hester?
There are 113.94 Females per 100 Males in Hester.
What is the Median Population Age in Hester?
Median Population Age in Hester is 32.6 Years.
What is the Average Family Size in Hester
Average Family Size in Hester is 4.1 People.
What is the Average Household Size in Hester
Average Household Size in Hester is 3.6 People.
How Large is the Labor Force in Hester?
There are 364 People in the Labor Forcein in Hester.
What is the Percentage of People in the Labor Force in Hester?
85.8% of People are in the Labor Force in Hester.