Harrisonburg, LA Map & Demographics
Harrisonburg Map
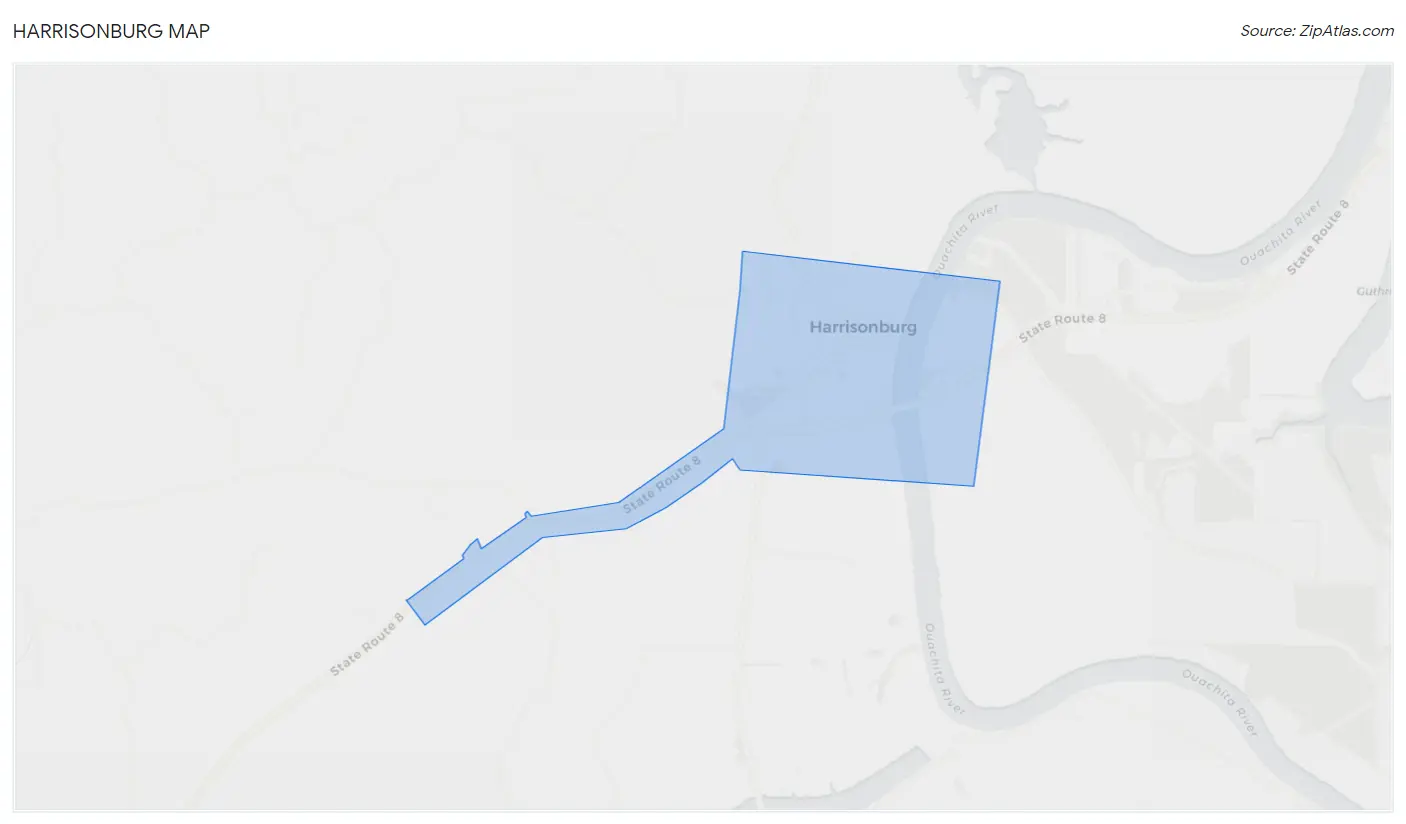
Harrisonburg Overview
$47,008
PER CAPITA INCOME
$70,875
AVG FAMILY INCOME
0.64
INEQUALITY / GINI INDEX
278
TOTAL POPULATION
128
MALE POPULATION
150
FEMALE POPULATION
85.33
MALES / 100 FEMALES
117.19
FEMALES / 100 MALES
47.1
MEDIAN AGE
3.6
AVG FAMILY SIZE
1.9
AVG HOUSEHOLD SIZE
115
LABOR FORCE [ PEOPLE ]
48.5%
PERCENT IN LABOR FORCE
Harrisonburg Zip Codes
Harrisonburg Area Codes
Income in Harrisonburg
Income Overview in Harrisonburg
| Characteristic | Number | Measure |
| Per Capita Income | 278 | $47,008 |
| Median Family Income | 43 | $70,875 |
| Mean Family Income | 43 | $97,430 |
| Median Household Income | 138 | $0 |
| Mean Household Income | 138 | $84,232 |
| Income Deficit | 43 | $0 |
| Wage / Income Gap (%) | 278 | 0.00% |
| Wage / Income Gap ($) | 278 | 100.00¢ per $1 |
| Gini / Inequality Index | 278 | 0.64 |
Earnings by Sex in Harrisonburg
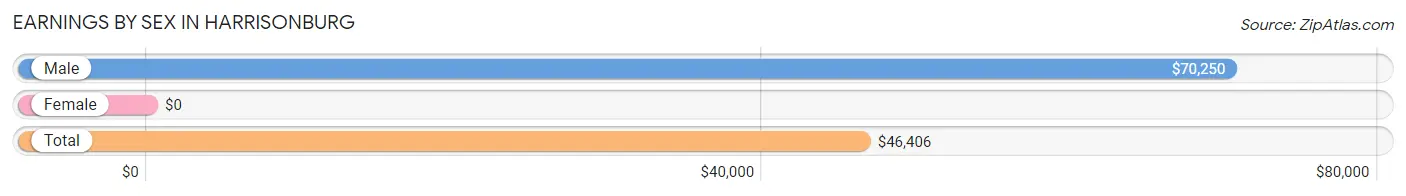
| Sex | Number | Average Earnings |
| Male | 76 (59.8%) | $70,250 |
| Female | 51 (40.2%) | $0 |
| Total | 127 (100.0%) | $46,406 |
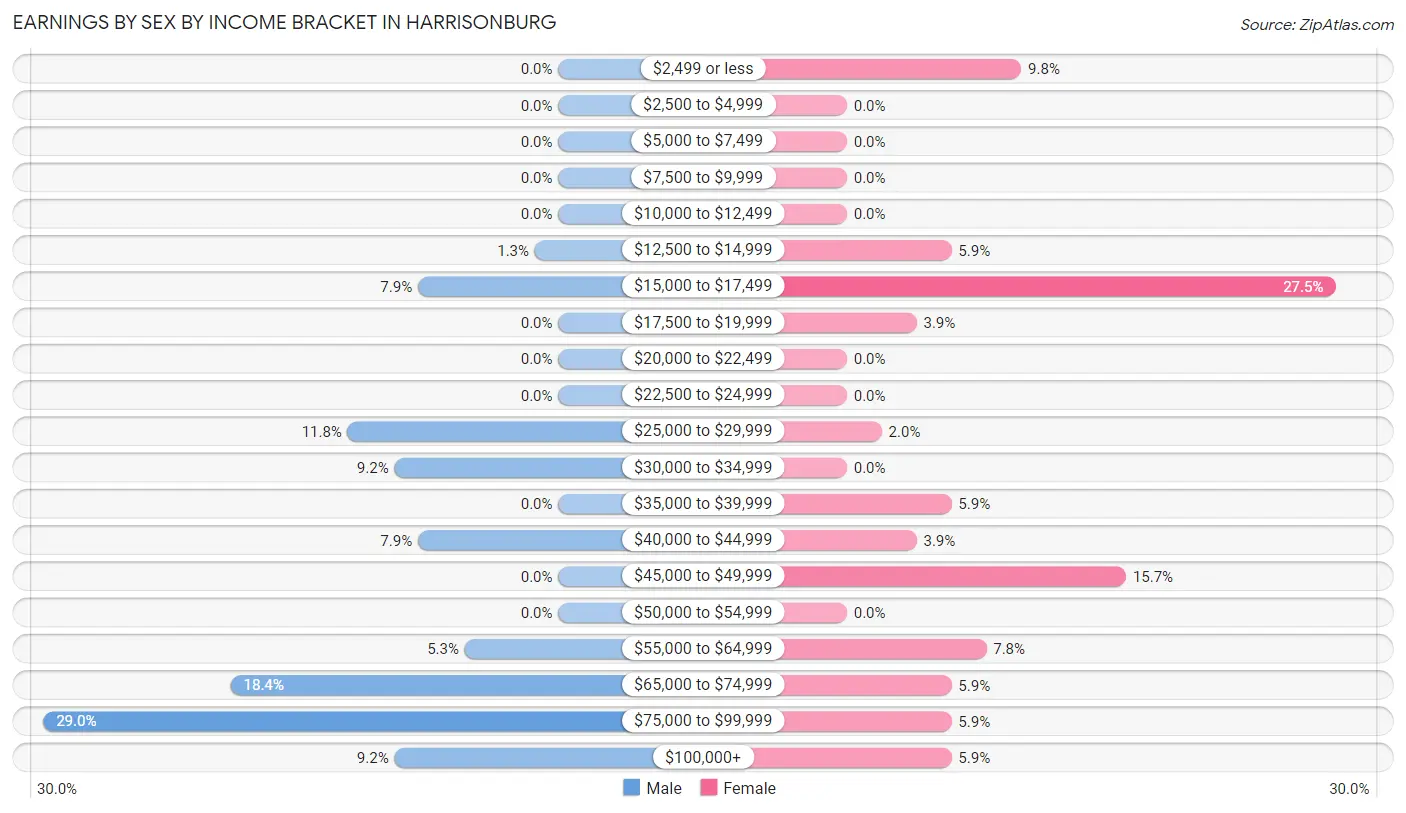
Earnings by Sex by Income Bracket in Harrisonburg
The most common earnings brackets in Harrisonburg are $75,000 to $99,999 for men (22 | 28.9%) and $15,000 to $17,499 for women (14 | 27.5%).
| Income | Male | Female |
| $2,499 or less | 0 (0.0%) | 5 (9.8%) |
| $2,500 to $4,999 | 0 (0.0%) | 0 (0.0%) |
| $5,000 to $7,499 | 0 (0.0%) | 0 (0.0%) |
| $7,500 to $9,999 | 0 (0.0%) | 0 (0.0%) |
| $10,000 to $12,499 | 0 (0.0%) | 0 (0.0%) |
| $12,500 to $14,999 | 1 (1.3%) | 3 (5.9%) |
| $15,000 to $17,499 | 6 (7.9%) | 14 (27.5%) |
| $17,500 to $19,999 | 0 (0.0%) | 2 (3.9%) |
| $20,000 to $22,499 | 0 (0.0%) | 0 (0.0%) |
| $22,500 to $24,999 | 0 (0.0%) | 0 (0.0%) |
| $25,000 to $29,999 | 9 (11.8%) | 1 (2.0%) |
| $30,000 to $34,999 | 7 (9.2%) | 0 (0.0%) |
| $35,000 to $39,999 | 0 (0.0%) | 3 (5.9%) |
| $40,000 to $44,999 | 6 (7.9%) | 2 (3.9%) |
| $45,000 to $49,999 | 0 (0.0%) | 8 (15.7%) |
| $50,000 to $54,999 | 0 (0.0%) | 0 (0.0%) |
| $55,000 to $64,999 | 4 (5.3%) | 4 (7.8%) |
| $65,000 to $74,999 | 14 (18.4%) | 3 (5.9%) |
| $75,000 to $99,999 | 22 (28.9%) | 3 (5.9%) |
| $100,000+ | 7 (9.2%) | 3 (5.9%) |
| Total | 76 (100.0%) | 51 (100.0%) |
Earnings by Sex by Educational Attainment in Harrisonburg
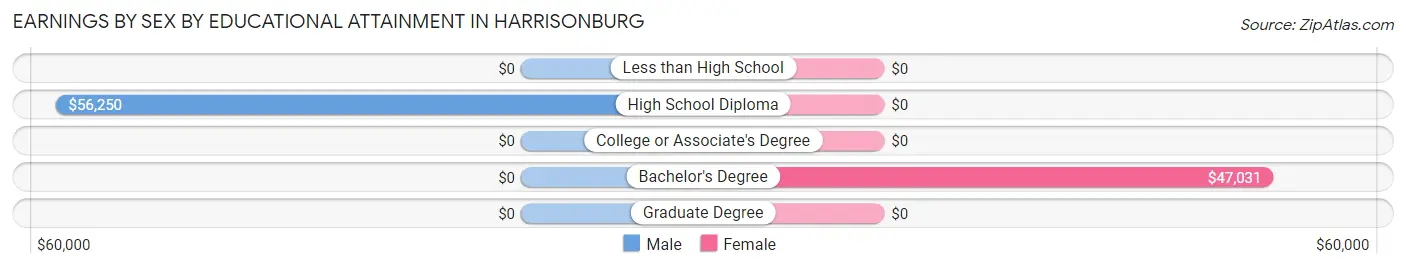
| Educational Attainment | Male Income | Female Income |
| Less than High School | - | - |
| High School Diploma | $56,250 | $0 |
| College or Associate's Degree | - | - |
| Bachelor's Degree | - | - |
| Graduate Degree | - | - |
| Total | $69,375 | $0 |
Family Income in Harrisonburg
Family Income Brackets in Harrisonburg
According to the Harrisonburg family income data, there are 12 families falling into the $15,000 to $24,999 income range, which is the most common income bracket and makes up 27.9% of all families.
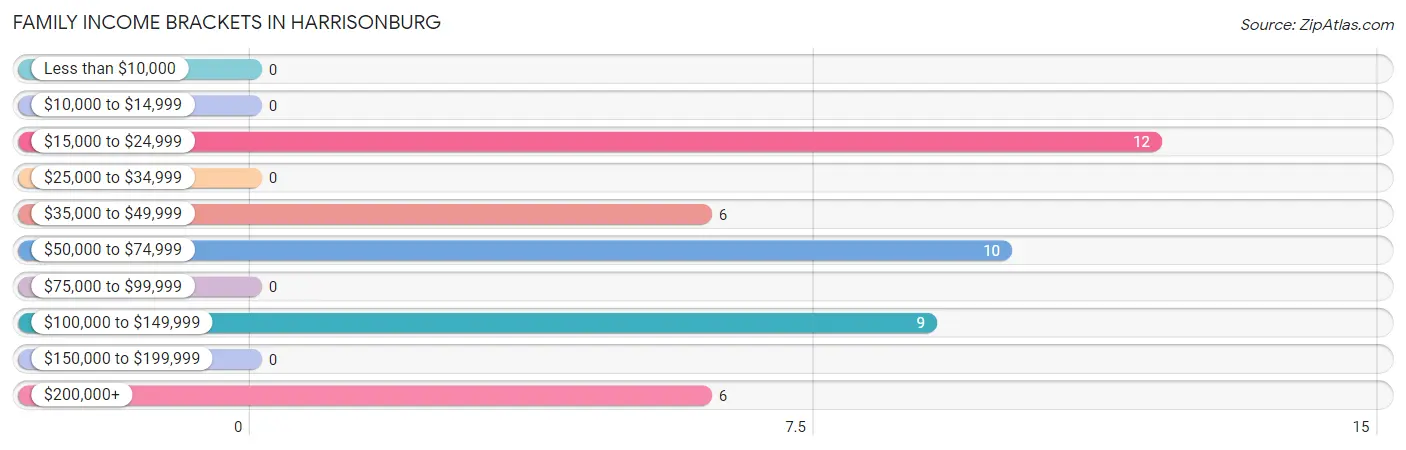
| Income Bracket | # Families | % Families |
| Less than $10,000 | 0 | 0.0% |
| $10,000 to $14,999 | 0 | 0.0% |
| $15,000 to $24,999 | 12 | 27.9% |
| $25,000 to $34,999 | 0 | 0.0% |
| $35,000 to $49,999 | 6 | 14.0% |
| $50,000 to $74,999 | 10 | 23.3% |
| $75,000 to $99,999 | 0 | 0.0% |
| $100,000 to $149,999 | 9 | 20.9% |
| $150,000 to $199,999 | 0 | 0.0% |
| $200,000+ | 6 | 14.0% |
Family Income by Famaliy Size in Harrisonburg
| Income Bracket | # Families | Median Income |
| 2-Person Families | 23 (53.5%) | $0 |
| 3-Person Families | 6 (14.0%) | $0 |
| 4-Person Families | 4 (9.3%) | $0 |
| 5-Person Families | 10 (23.3%) | $0 |
| 6-Person Families | 0 (0.0%) | $0 |
| 7+ Person Families | 0 (0.0%) | $0 |
| Total | 43 (100.0%) | $70,875 |
Family Income by Number of Earners in Harrisonburg
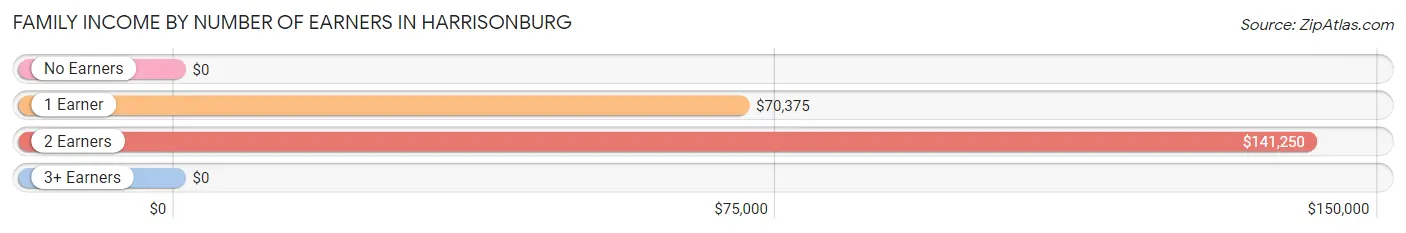
| Number of Earners | # Families | Median Income |
| No Earners | 4 (9.3%) | $0 |
| 1 Earner | 25 (58.1%) | $70,375 |
| 2 Earners | 14 (32.6%) | $141,250 |
| 3+ Earners | 0 (0.0%) | $0 |
| Total | 43 (100.0%) | $70,875 |
Household Income in Harrisonburg
Household Income Brackets in Harrisonburg
With 35 households falling in the category, the $10,000 to $14,999 income range is the most frequent in Harrisonburg, accounting for 25.4% of all households.
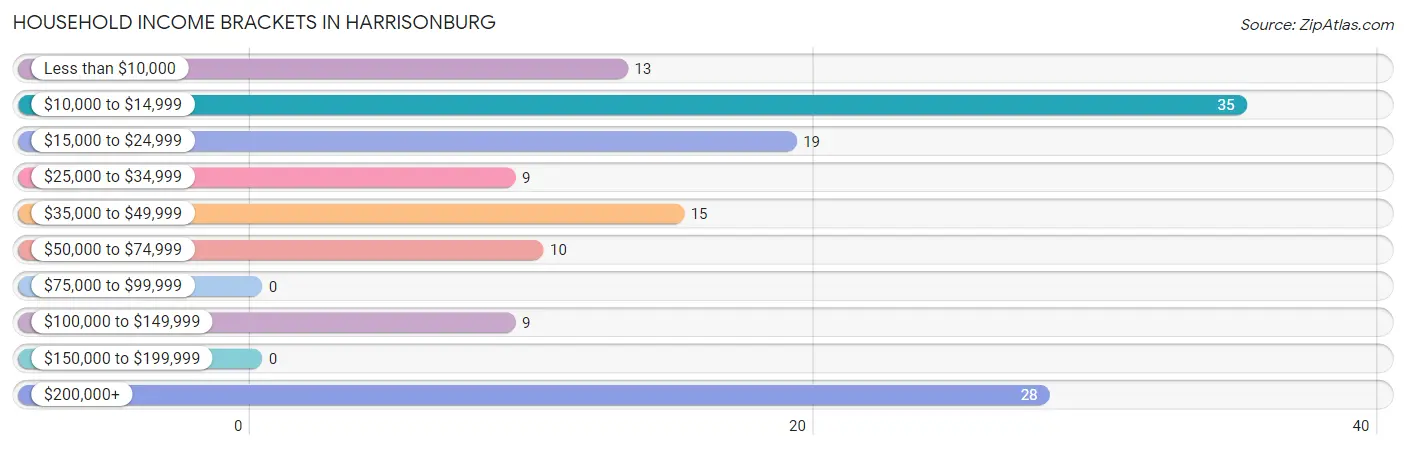
| Income Bracket | # Households | % Households |
| Less than $10,000 | 13 | 9.4% |
| $10,000 to $14,999 | 35 | 25.4% |
| $15,000 to $24,999 | 19 | 13.8% |
| $25,000 to $34,999 | 9 | 6.5% |
| $35,000 to $49,999 | 15 | 10.9% |
| $50,000 to $74,999 | 10 | 7.2% |
| $75,000 to $99,999 | 0 | 0.0% |
| $100,000 to $149,999 | 9 | 6.5% |
| $150,000 to $199,999 | 0 | 0.0% |
| $200,000+ | 28 | 20.3% |
Household Income by Householder Age in Harrisonburg
The median household income in Harrisonburg is $0, with the highest median household income of $70,625 found in the 25 to 44 years age bracket for the primary householder. A total of 29 households (21.0%) fall into this category. Meanwhile, the 15 to 24 years age bracket for the primary householder has the lowest median household income of $0, with 2 households (1.5%) in this group.
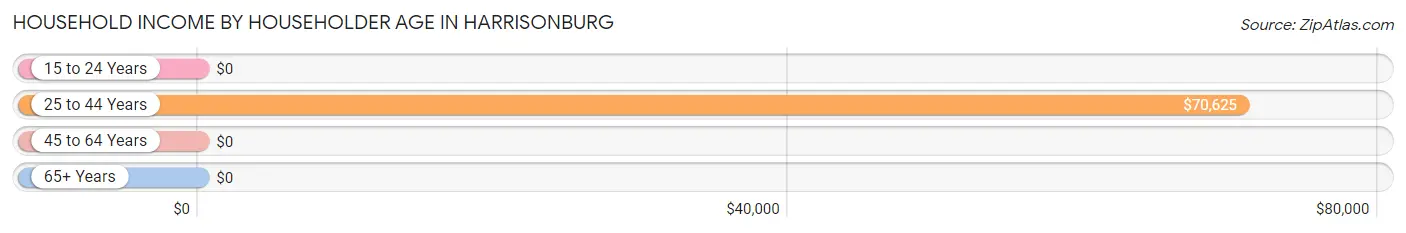
| Income Bracket | # Households | Median Income |
| 15 to 24 Years | 2 (1.5%) | $0 |
| 25 to 44 Years | 29 (21.0%) | $70,625 |
| 45 to 64 Years | 41 (29.7%) | $0 |
| 65+ Years | 66 (47.8%) | $0 |
| Total | 138 (100.0%) | $0 |
Poverty in Harrisonburg
Income Below Poverty by Sex and Age in Harrisonburg
With 17.1% poverty level for males and 27.3% for females among the residents of Harrisonburg, 16 and 17 year old males and 75 year old and over females are the most vulnerable to poverty, with 3 males (100.0%) and 30 females (93.8%) in their respective age groups living below the poverty level.
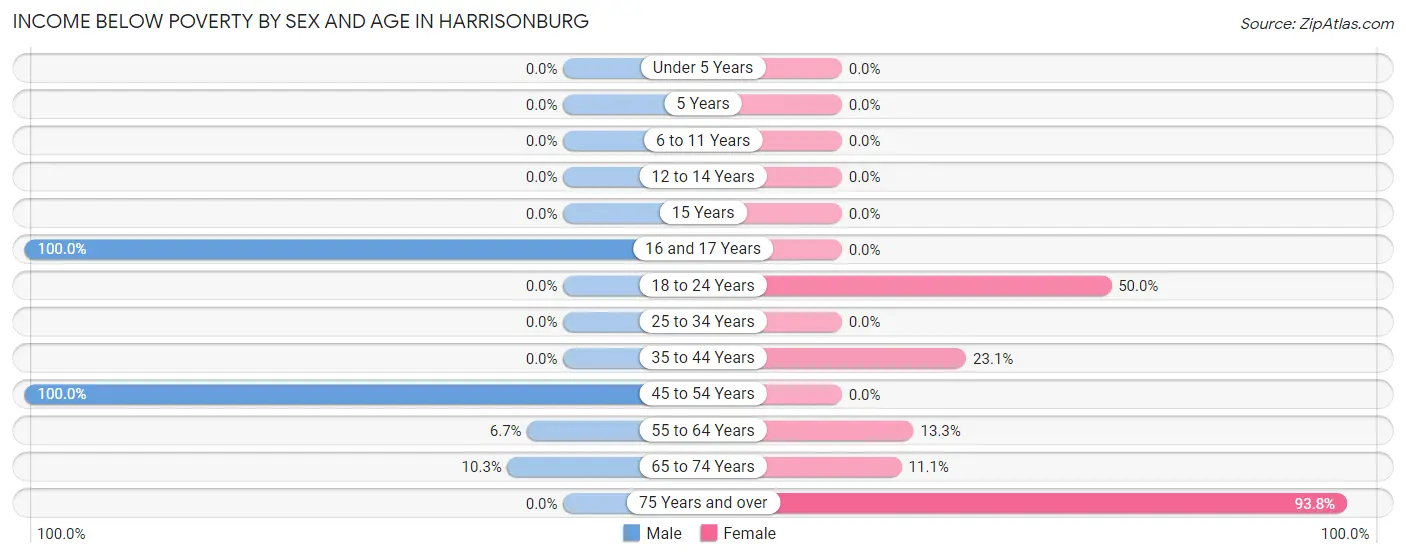
| Age Bracket | Male | Female |
| Under 5 Years | 0 (0.0%) | 0 (0.0%) |
| 5 Years | 0 (0.0%) | 0 (0.0%) |
| 6 to 11 Years | 0 (0.0%) | 0 (0.0%) |
| 12 to 14 Years | 0 (0.0%) | 0 (0.0%) |
| 15 Years | 0 (0.0%) | 0 (0.0%) |
| 16 and 17 Years | 3 (100.0%) | 0 (0.0%) |
| 18 to 24 Years | 0 (0.0%) | 5 (50.0%) |
| 25 to 34 Years | 0 (0.0%) | 0 (0.0%) |
| 35 to 44 Years | 0 (0.0%) | 3 (23.1%) |
| 45 to 54 Years | 11 (100.0%) | 0 (0.0%) |
| 55 to 64 Years | 1 (6.7%) | 2 (13.3%) |
| 65 to 74 Years | 3 (10.3%) | 1 (11.1%) |
| 75 Years and over | 0 (0.0%) | 30 (93.8%) |
| Total | 18 (17.1%) | 41 (27.3%) |
Income Above Poverty by Sex and Age in Harrisonburg
According to the poverty statistics in Harrisonburg, males aged 6 to 11 years and females aged under 5 years are the age groups that are most secure financially, with 100.0% of males and 100.0% of females in these age groups living above the poverty line.
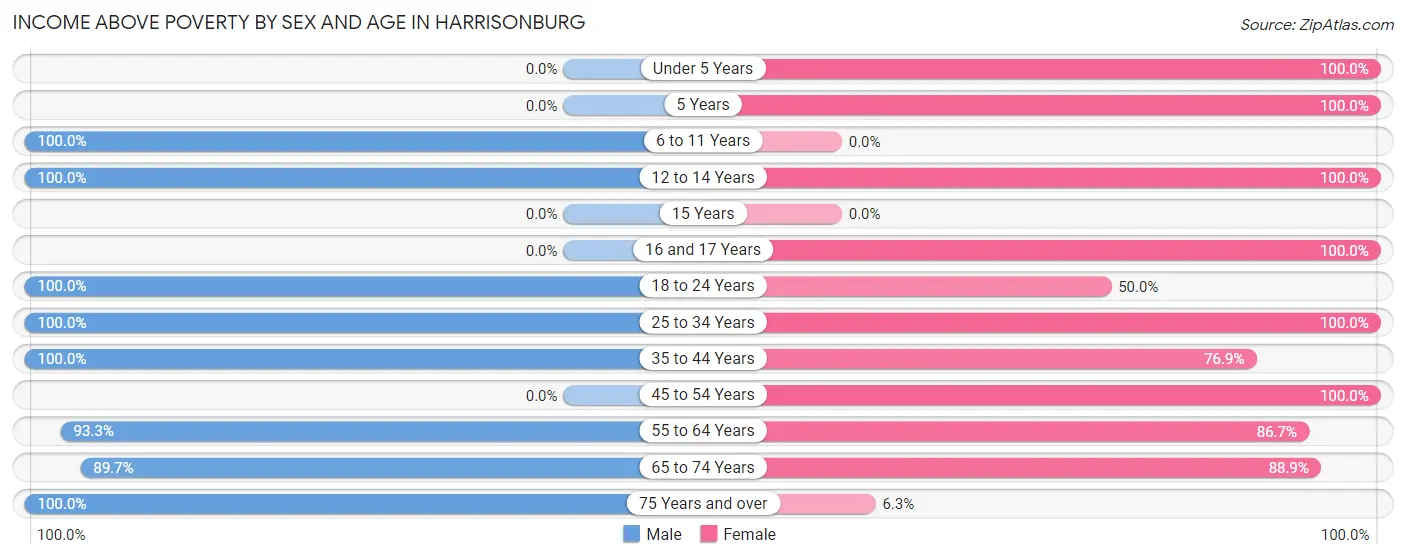
| Age Bracket | Male | Female |
| Under 5 Years | 0 (0.0%) | 15 (100.0%) |
| 5 Years | 0 (0.0%) | 10 (100.0%) |
| 6 to 11 Years | 12 (100.0%) | 0 (0.0%) |
| 12 to 14 Years | 2 (100.0%) | 2 (100.0%) |
| 15 Years | 0 (0.0%) | 0 (0.0%) |
| 16 and 17 Years | 0 (0.0%) | 4 (100.0%) |
| 18 to 24 Years | 4 (100.0%) | 5 (50.0%) |
| 25 to 34 Years | 10 (100.0%) | 15 (100.0%) |
| 35 to 44 Years | 18 (100.0%) | 10 (76.9%) |
| 45 to 54 Years | 0 (0.0%) | 25 (100.0%) |
| 55 to 64 Years | 14 (93.3%) | 13 (86.7%) |
| 65 to 74 Years | 26 (89.7%) | 8 (88.9%) |
| 75 Years and over | 1 (100.0%) | 2 (6.2%) |
| Total | 87 (82.9%) | 109 (72.7%) |
Income Below Poverty Among Married-Couple Families in Harrisonburg
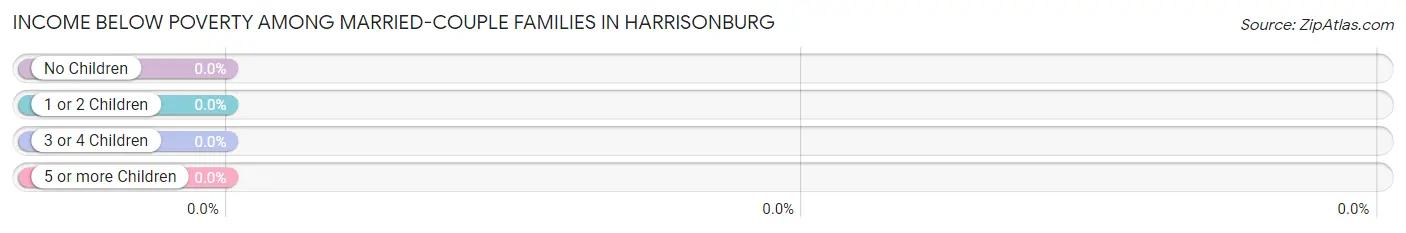
| Children | Above Poverty | Below Poverty |
| No Children | 14 (100.0%) | 0 (0.0%) |
| 1 or 2 Children | 7 (100.0%) | 0 (0.0%) |
| 3 or 4 Children | 10 (100.0%) | 0 (0.0%) |
| 5 or more Children | 0 (0.0%) | 0 (0.0%) |
| Total | 31 (100.0%) | 0 (0.0%) |
Income Below Poverty Among Single-Parent Households in Harrisonburg
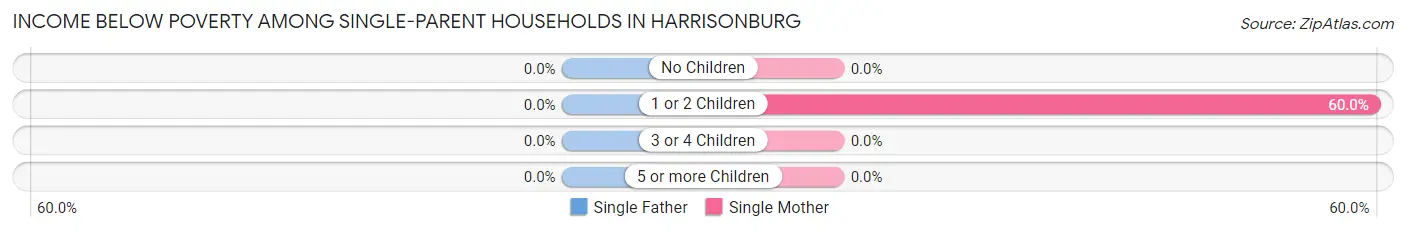
| Children | Single Father | Single Mother |
| No Children | 0 (0.0%) | 0 (0.0%) |
| 1 or 2 Children | 0 (0.0%) | 3 (60.0%) |
| 3 or 4 Children | 0 (0.0%) | 0 (0.0%) |
| 5 or more Children | 0 (0.0%) | 0 (0.0%) |
| Total | 0 (0.0%) | 3 (50.0%) |
Income Below Poverty Among Married-Couple vs Single-Parent Households in Harrisonburg
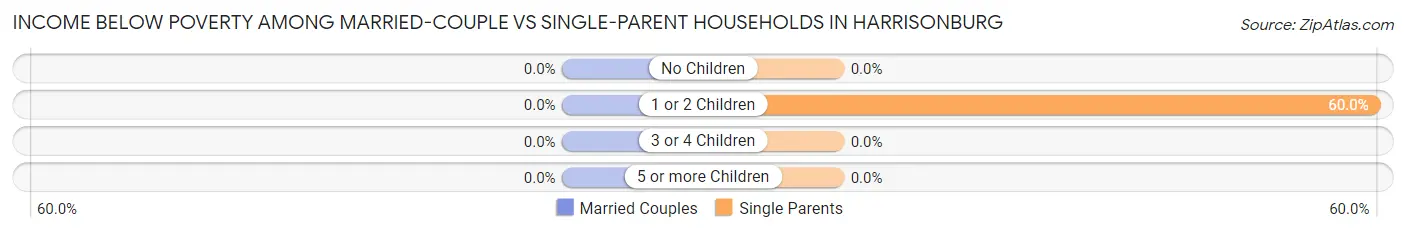
| Children | Married-Couple Families | Single-Parent Households |
| No Children | 0 (0.0%) | 0 (0.0%) |
| 1 or 2 Children | 0 (0.0%) | 3 (60.0%) |
| 3 or 4 Children | 0 (0.0%) | 0 (0.0%) |
| 5 or more Children | 0 (0.0%) | 0 (0.0%) |
| Total | 0 (0.0%) | 3 (25.0%) |
Race in Harrisonburg
The most populous races in Harrisonburg are White / Caucasian (240 | 86.3%), and Black / African American (38 | 13.7%).
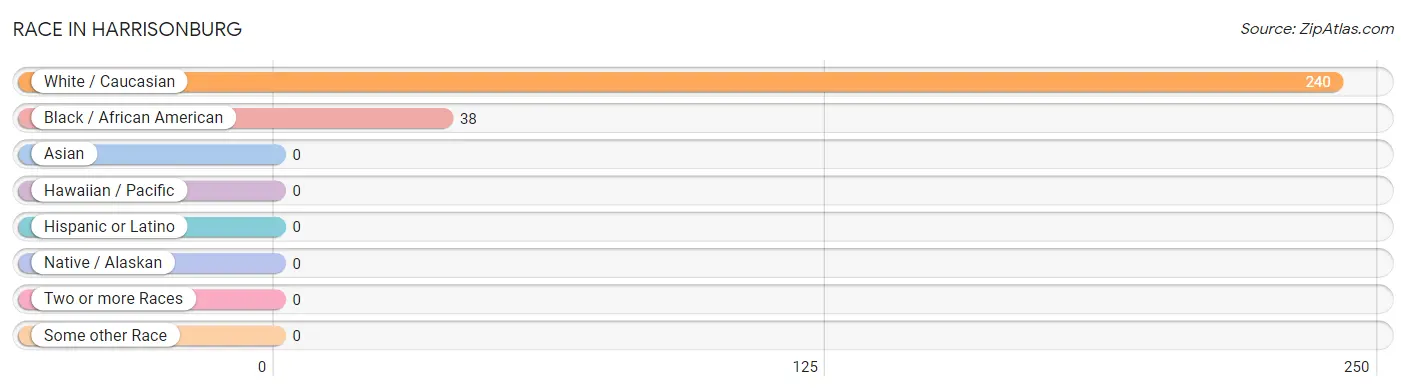
| Race | # Population | % Population |
| Asian | 0 | 0.0% |
| Black / African American | 38 | 13.7% |
| Hawaiian / Pacific | 0 | 0.0% |
| Hispanic or Latino | 0 | 0.0% |
| Native / Alaskan | 0 | 0.0% |
| White / Caucasian | 240 | 86.3% |
| Two or more Races | 0 | 0.0% |
| Some other Race | 0 | 0.0% |
| Total | 278 | 100.0% |
Ancestry in Harrisonburg
The most populous ancestries reported in Harrisonburg are American (56 | 20.1%), English (20 | 7.2%), French (14 | 5.0%), Irish (7 | 2.5%), and German (4 | 1.4%), together accounting for 36.3% of all Harrisonburg residents.
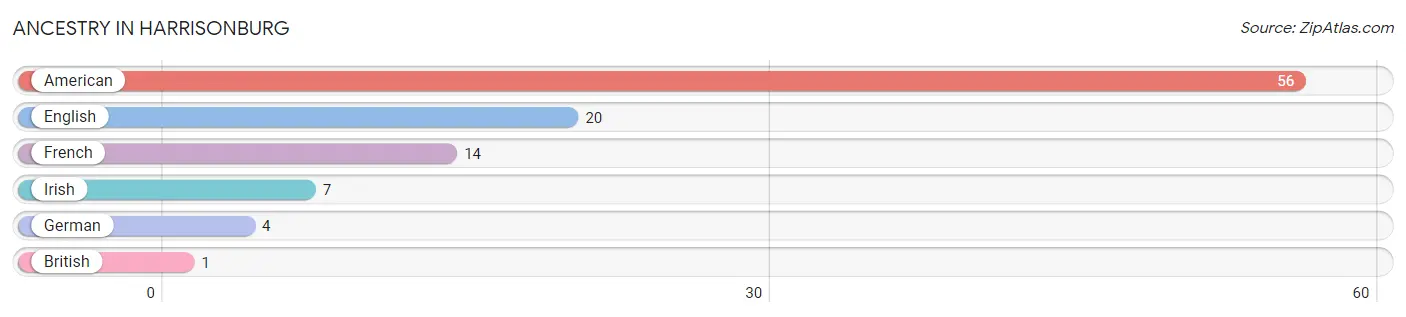
| Ancestry | # Population | % Population |
| American | 56 | 20.1% |
| British | 1 | 0.4% |
| English | 20 | 7.2% |
| French | 14 | 5.0% |
| German | 4 | 1.4% |
| Irish | 7 | 2.5% | View All 6 Rows |
Immigrants in Harrisonburg

| Immigration Origin | # Population | % Population | View All 0 Rows |
Sex and Age in Harrisonburg
Sex and Age in Harrisonburg
The most populous age groups in Harrisonburg are 65 to 69 Years (25 | 19.5%) for men and 75 to 79 Years (19 | 12.7%) for women.
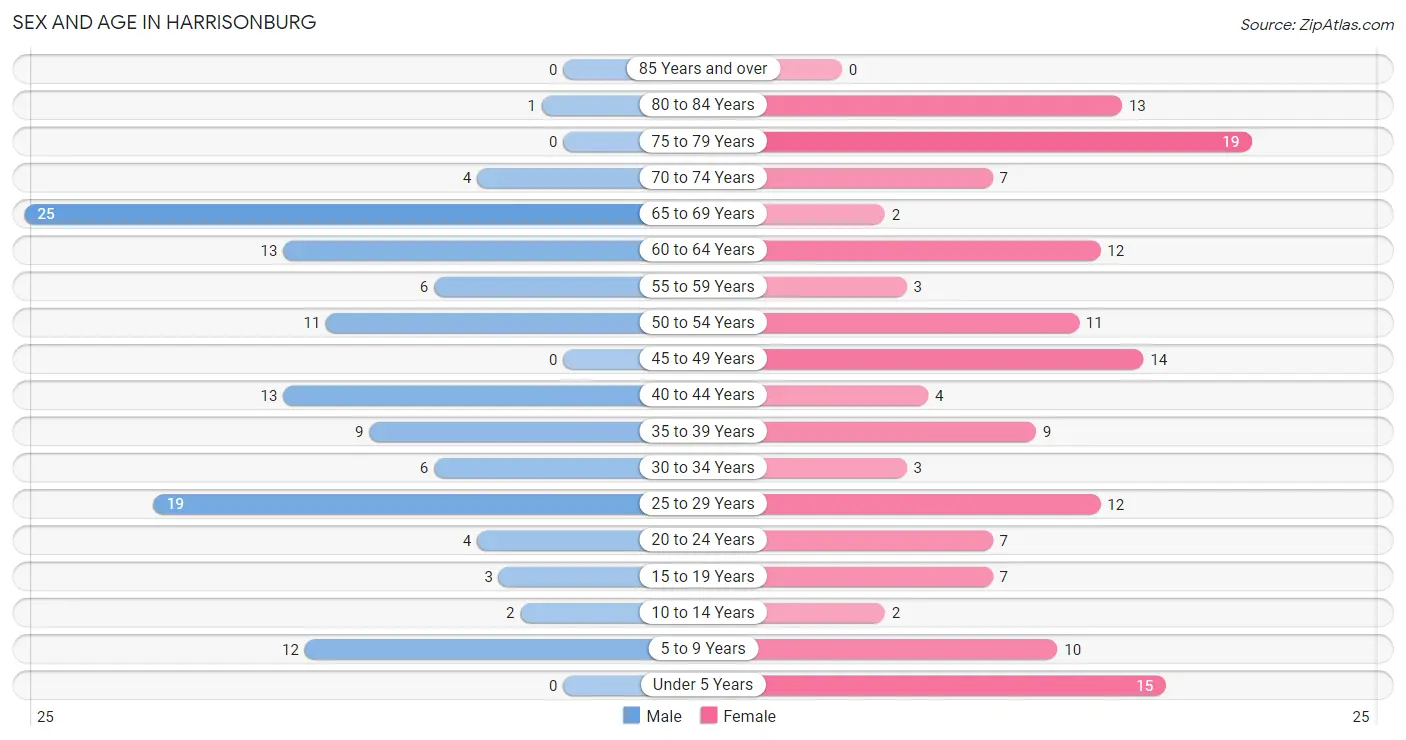
| Age Bracket | Male | Female |
| Under 5 Years | 0 (0.0%) | 15 (10.0%) |
| 5 to 9 Years | 12 (9.4%) | 10 (6.7%) |
| 10 to 14 Years | 2 (1.6%) | 2 (1.3%) |
| 15 to 19 Years | 3 (2.3%) | 7 (4.7%) |
| 20 to 24 Years | 4 (3.1%) | 7 (4.7%) |
| 25 to 29 Years | 19 (14.8%) | 12 (8.0%) |
| 30 to 34 Years | 6 (4.7%) | 3 (2.0%) |
| 35 to 39 Years | 9 (7.0%) | 9 (6.0%) |
| 40 to 44 Years | 13 (10.2%) | 4 (2.7%) |
| 45 to 49 Years | 0 (0.0%) | 14 (9.3%) |
| 50 to 54 Years | 11 (8.6%) | 11 (7.3%) |
| 55 to 59 Years | 6 (4.7%) | 3 (2.0%) |
| 60 to 64 Years | 13 (10.2%) | 12 (8.0%) |
| 65 to 69 Years | 25 (19.5%) | 2 (1.3%) |
| 70 to 74 Years | 4 (3.1%) | 7 (4.7%) |
| 75 to 79 Years | 0 (0.0%) | 19 (12.7%) |
| 80 to 84 Years | 1 (0.8%) | 13 (8.7%) |
| 85 Years and over | 0 (0.0%) | 0 (0.0%) |
| Total | 128 (100.0%) | 150 (100.0%) |
Families and Households in Harrisonburg
Median Family Size in Harrisonburg
The median family size in Harrisonburg is 3.63 persons per family, with married-couple families (31 | 72.1%) accounting for the largest median family size of 3.71 persons per family. On the other hand, single male/father families (6 | 14.0%) represent the smallest median family size with 3.33 persons per family.
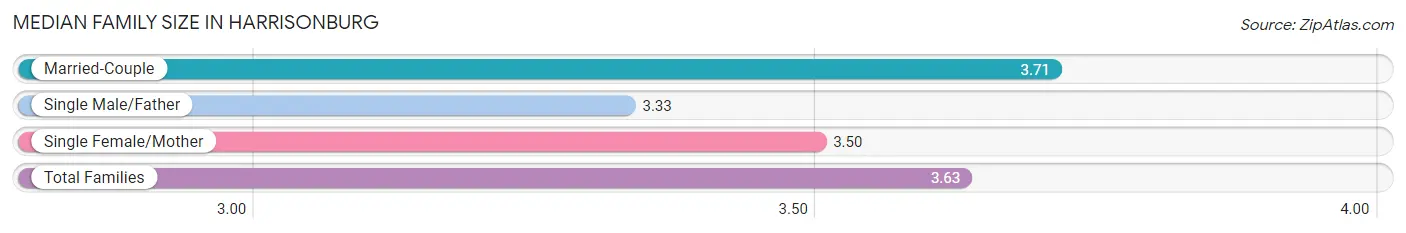
| Family Type | # Families | Family Size |
| Married-Couple | 31 (72.1%) | 3.71 |
| Single Male/Father | 6 (14.0%) | 3.33 |
| Single Female/Mother | 6 (14.0%) | 3.50 |
| Total Families | 43 (100.0%) | 3.63 |
Median Household Size in Harrisonburg
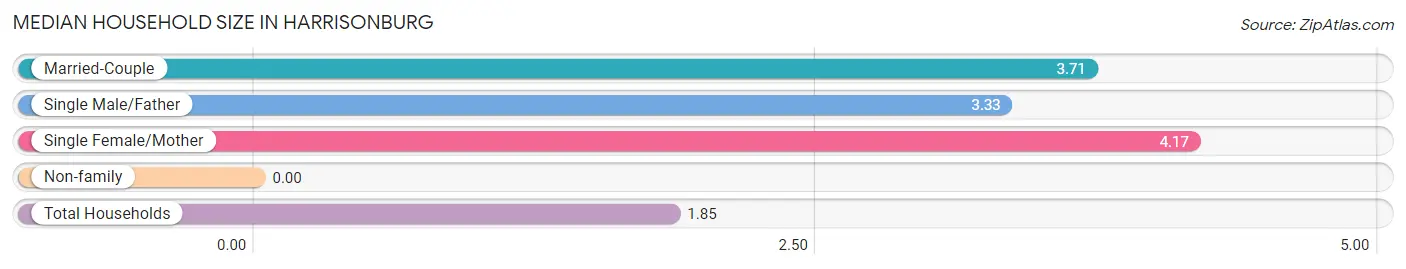
| Household Type | # Households | Household Size |
| Married-Couple | 31 (22.5%) | 3.71 |
| Single Male/Father | 6 (4.3%) | 3.33 |
| Single Female/Mother | 6 (4.3%) | 4.17 |
| Non-family | 95 (68.8%) | - |
| Total Households | 138 (100.0%) | 1.85 |
Household Size by Marriage Status in Harrisonburg
Out of a total of 138 households in Harrisonburg, 43 (31.2%) are family households, while 95 (68.8%) are nonfamily households. The most numerous type of family households are 2-person households, comprising 21, and the most common type of nonfamily households are 1-person households, comprising 95.
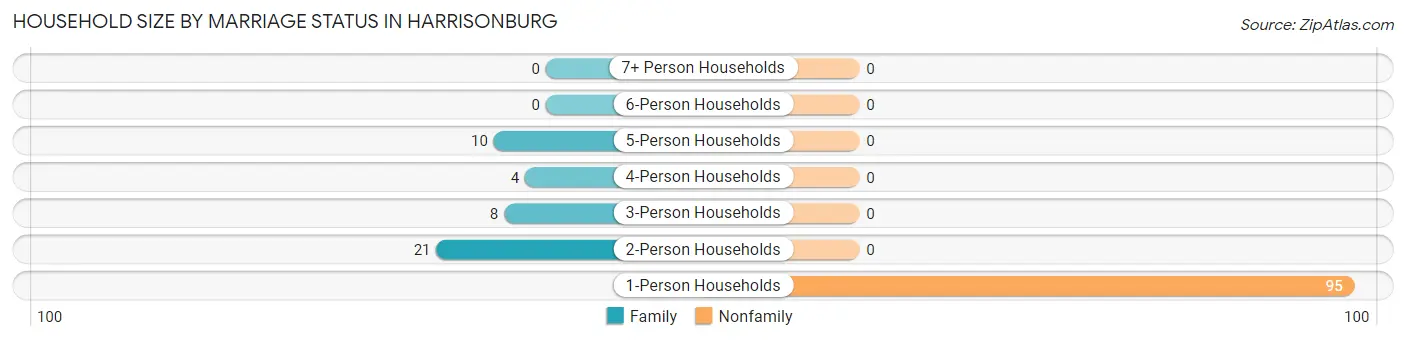
| Household Size | Family Households | Nonfamily Households |
| 1-Person Households | - | 95 (68.8%) |
| 2-Person Households | 21 (15.2%) | 0 (0.0%) |
| 3-Person Households | 8 (5.8%) | 0 (0.0%) |
| 4-Person Households | 4 (2.9%) | 0 (0.0%) |
| 5-Person Households | 10 (7.2%) | 0 (0.0%) |
| 6-Person Households | 0 (0.0%) | 0 (0.0%) |
| 7+ Person Households | 0 (0.0%) | 0 (0.0%) |
| Total | 43 (31.2%) | 95 (68.8%) |
Female Fertility in Harrisonburg
Fertility by Age in Harrisonburg
| Age Bracket | Women with Births | Births / 1,000 Women |
| 15 to 19 years | 0 (0.0%) | 0.0 |
| 20 to 34 years | 0 (0.0%) | 0.0 |
| 35 to 50 years | 0 (0.0%) | 0.0 |
| Total | 0 (0.0%) | 0.0 |
Fertility by Age by Marriage Status in Harrisonburg
| Age Bracket | Married | Unmarried |
| 15 to 19 years | 0 (0.0%) | 0 (0.0%) |
| 20 to 34 years | 0 (0.0%) | 0 (0.0%) |
| 35 to 50 years | 0 (0.0%) | 0 (0.0%) |
| Total | 0 (0.0%) | 0 (0.0%) |
Fertility by Education in Harrisonburg
| Educational Attainment | Women with Births | Births / 1,000 Women |
| Less than High School | 0 (0.0%) | 0.0 |
| High School Diploma | 0 (0.0%) | 0.0 |
| College or Associate's Degree | 0 (0.0%) | 0.0 |
| Bachelor's Degree | 0 (0.0%) | 0.0 |
| Graduate Degree | 0 (0.0%) | 0.0 |
| Total | 0 (0.0%) | 0.0 |
Fertility by Education by Marriage Status in Harrisonburg
| Educational Attainment | Married | Unmarried |
| Less than High School | 0 (0.0%) | 0 (0.0%) |
| High School Diploma | 0 (0.0%) | 0 (0.0%) |
| College or Associate's Degree | 0 (0.0%) | 0 (0.0%) |
| Bachelor's Degree | 0 (0.0%) | 0 (0.0%) |
| Graduate Degree | 0 (0.0%) | 0 (0.0%) |
| Total | 0 (0.0%) | 0 (0.0%) |
Employment Characteristics in Harrisonburg
Employment by Class of Employer in Harrisonburg
Among the 107 employed individuals in Harrisonburg, private company employees (59 | 55.1%), self-employed (not incorporated) (23 | 21.5%), and state government employees (12 | 11.2%) make up the most common classes of employment.
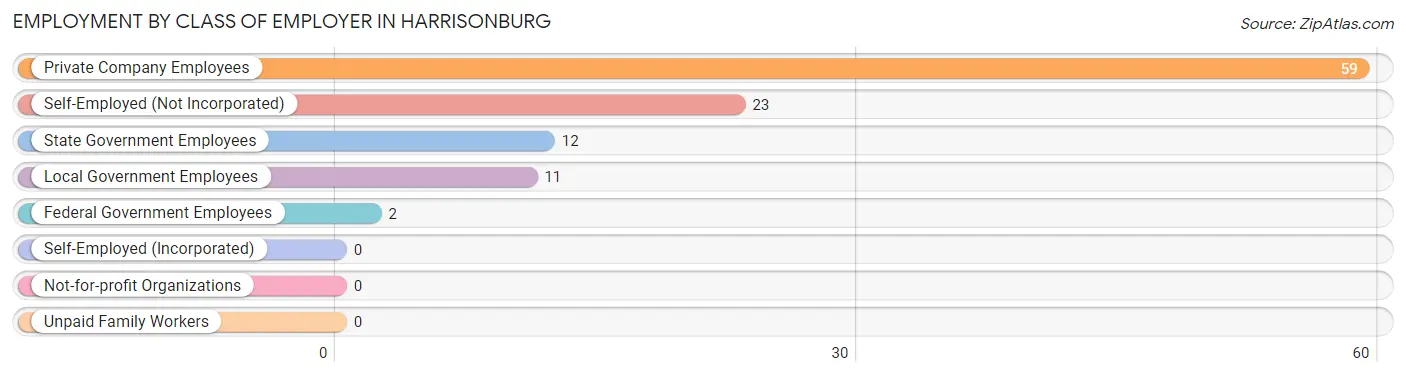
| Employer Class | # Employees | % Employees |
| Private Company Employees | 59 | 55.1% |
| Self-Employed (Incorporated) | 0 | 0.0% |
| Self-Employed (Not Incorporated) | 23 | 21.5% |
| Not-for-profit Organizations | 0 | 0.0% |
| Local Government Employees | 11 | 10.3% |
| State Government Employees | 12 | 11.2% |
| Federal Government Employees | 2 | 1.9% |
| Unpaid Family Workers | 0 | 0.0% |
| Total | 107 | 100.0% |
Employment Status by Age in Harrisonburg
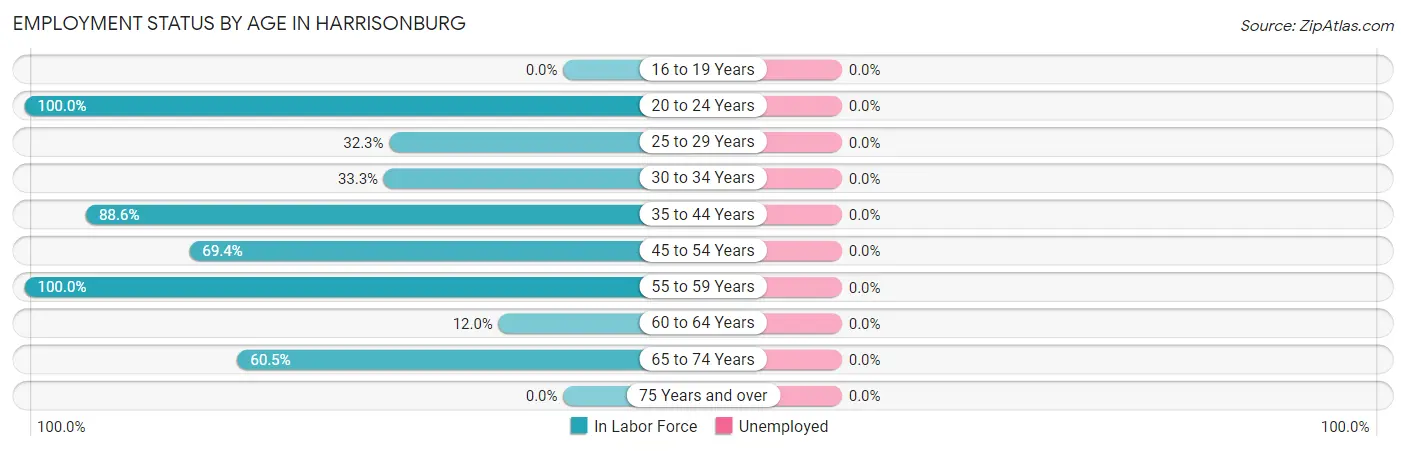
| Age Bracket | In Labor Force | Unemployed |
| 16 to 19 Years | 0 (0.0%) | 0 (0.0%) |
| 20 to 24 Years | 11 (100.0%) | 0 (0.0%) |
| 25 to 29 Years | 10 (32.3%) | 0 (0.0%) |
| 30 to 34 Years | 3 (33.3%) | 0 (0.0%) |
| 35 to 44 Years | 31 (88.6%) | 0 (0.0%) |
| 45 to 54 Years | 25 (69.4%) | 0 (0.0%) |
| 55 to 59 Years | 9 (100.0%) | 0 (0.0%) |
| 60 to 64 Years | 3 (12.0%) | 0 (0.0%) |
| 65 to 74 Years | 23 (60.5%) | 0 (0.0%) |
| 75 Years and over | 0 (0.0%) | 0 (0.0%) |
| Total | 115 (48.5%) | 0 (0.0%) |
Employment Status by Educational Attainment in Harrisonburg
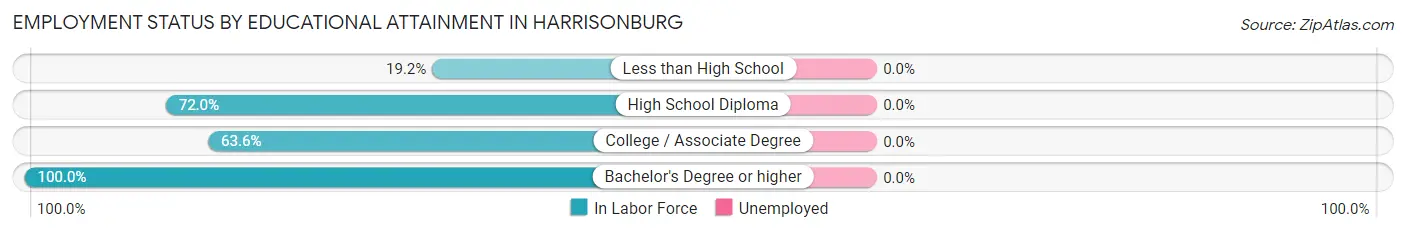
| Educational Attainment | In Labor Force | Unemployed |
| Less than High School | 10 (19.2%) | 0 (0.0%) |
| High School Diploma | 36 (72.0%) | 0 (0.0%) |
| College / Associate Degree | 14 (63.6%) | 0 (0.0%) |
| Bachelor's Degree or higher | 21 (100.0%) | 0 (0.0%) |
| Total | 81 (55.9%) | 0 (0.0%) |
Employment Occupations by Sex in Harrisonburg
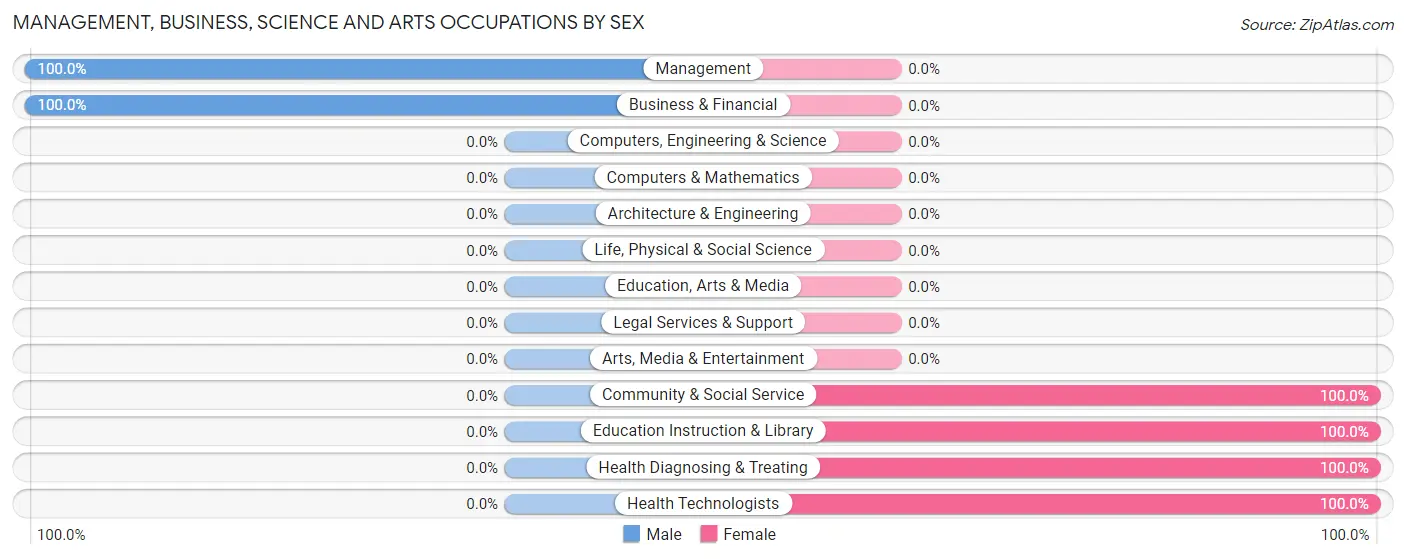
Management, Business, Science and Arts Occupations
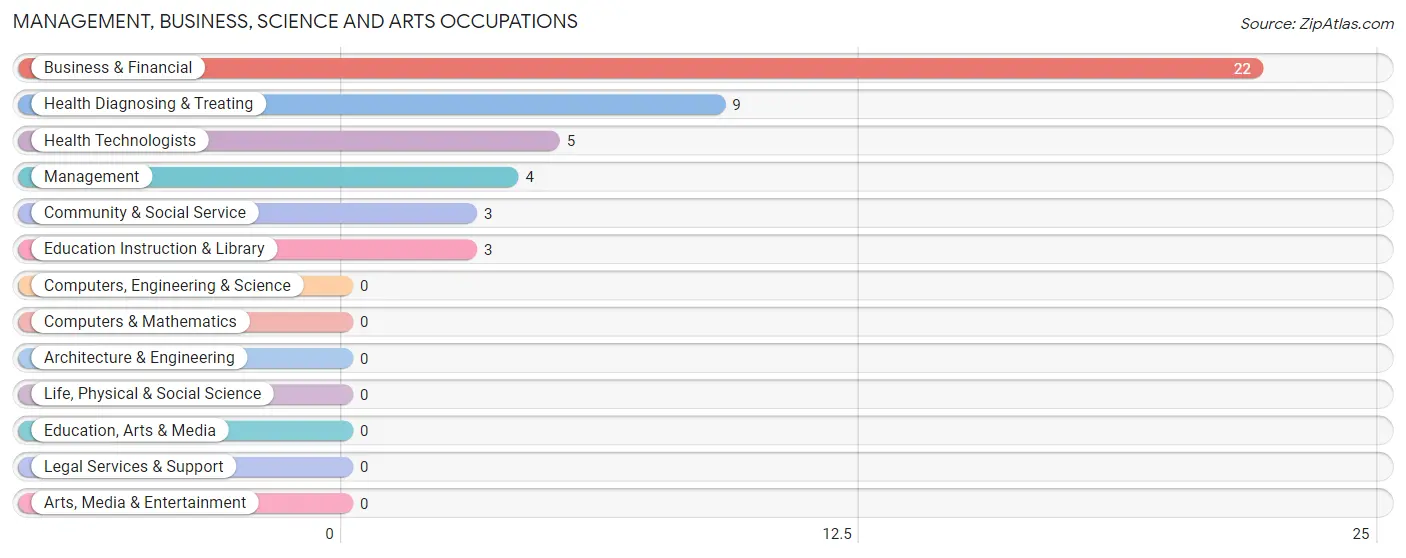
The most common Management, Business, Science and Arts occupations in Harrisonburg are Business & Financial (22 | 19.5%), Health Diagnosing & Treating (9 | 8.0%), Health Technologists (5 | 4.4%), Management (4 | 3.5%), and Community & Social Service (3 | 2.6%).
Management, Business, Science and Arts Occupations by Sex
Within the Management, Business, Science and Arts occupations in Harrisonburg, the most male-oriented occupations are Management (100.0%), and Business & Financial (100.0%), while the most female-oriented occupations are Community & Social Service (100.0%), Education Instruction & Library (100.0%), and Health Diagnosing & Treating (100.0%).
| Occupation | Male | Female |
| Management | 4 (100.0%) | 0 (0.0%) |
| Business & Financial | 22 (100.0%) | 0 (0.0%) |
| Computers, Engineering & Science | 0 (0.0%) | 0 (0.0%) |
| Computers & Mathematics | 0 (0.0%) | 0 (0.0%) |
| Architecture & Engineering | 0 (0.0%) | 0 (0.0%) |
| Life, Physical & Social Science | 0 (0.0%) | 0 (0.0%) |
| Community & Social Service | 0 (0.0%) | 3 (100.0%) |
| Education, Arts & Media | 0 (0.0%) | 0 (0.0%) |
| Legal Services & Support | 0 (0.0%) | 0 (0.0%) |
| Education Instruction & Library | 0 (0.0%) | 3 (100.0%) |
| Arts, Media & Entertainment | 0 (0.0%) | 0 (0.0%) |
| Health Diagnosing & Treating | 0 (0.0%) | 9 (100.0%) |
| Health Technologists | 0 (0.0%) | 5 (100.0%) |
| Total (Category) | 26 (68.4%) | 12 (31.6%) |
| Total (Overall) | 62 (54.9%) | 51 (45.1%) |
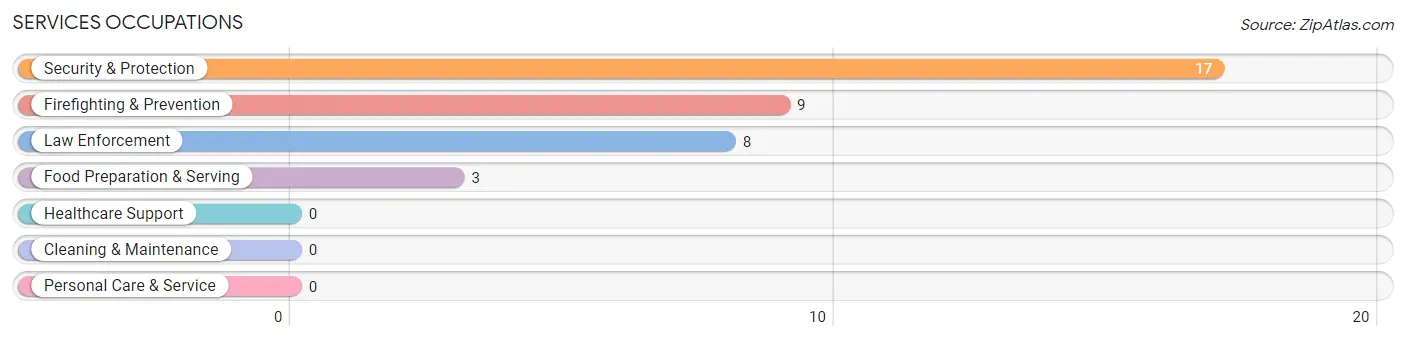
Services Occupations
The most common Services occupations in Harrisonburg are Security & Protection (17 | 15.0%), Firefighting & Prevention (9 | 8.0%), Law Enforcement (8 | 7.1%), and Food Preparation & Serving (3 | 2.6%).
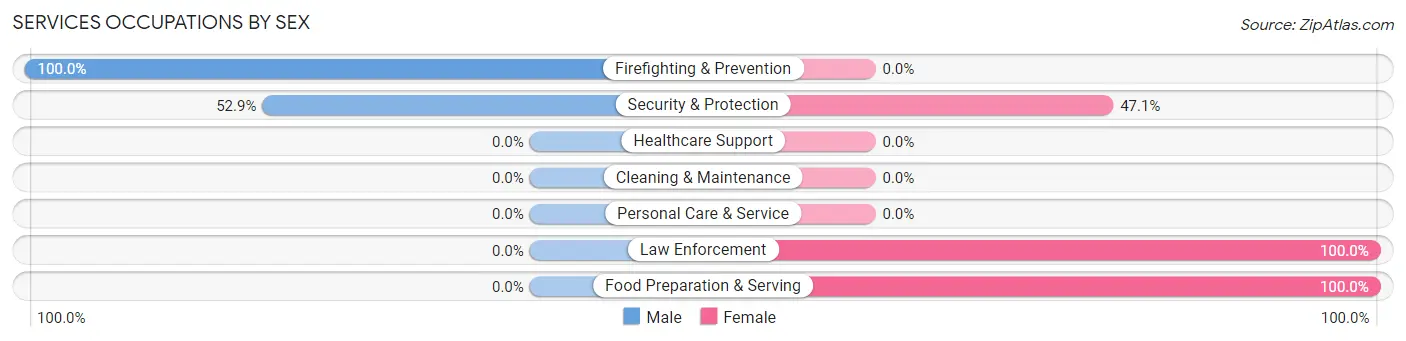
Services Occupations by Sex
Within the Services occupations in Harrisonburg, the most male-oriented occupations are Firefighting & Prevention (100.0%), and Security & Protection (52.9%), while the most female-oriented occupations are Law Enforcement (100.0%), Food Preparation & Serving (100.0%), and Security & Protection (47.1%).
| Occupation | Male | Female |
| Healthcare Support | 0 (0.0%) | 0 (0.0%) |
| Security & Protection | 9 (52.9%) | 8 (47.1%) |
| Firefighting & Prevention | 9 (100.0%) | 0 (0.0%) |
| Law Enforcement | 0 (0.0%) | 8 (100.0%) |
| Food Preparation & Serving | 0 (0.0%) | 3 (100.0%) |
| Cleaning & Maintenance | 0 (0.0%) | 0 (0.0%) |
| Personal Care & Service | 0 (0.0%) | 0 (0.0%) |
| Total (Category) | 9 (45.0%) | 11 (55.0%) |
| Total (Overall) | 62 (54.9%) | 51 (45.1%) |
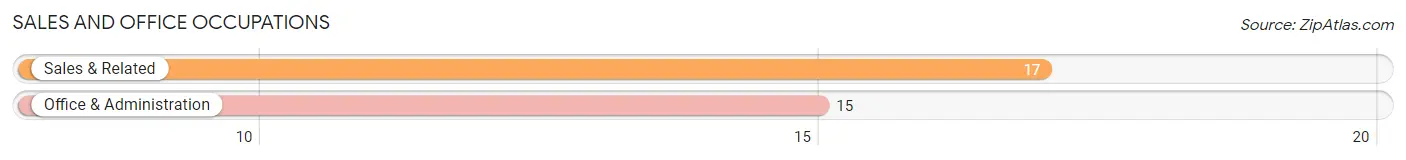
Sales and Office Occupations
The most common Sales and Office occupations in Harrisonburg are Sales & Related (17 | 15.0%), and Office & Administration (15 | 13.3%).
Sales and Office Occupations by Sex
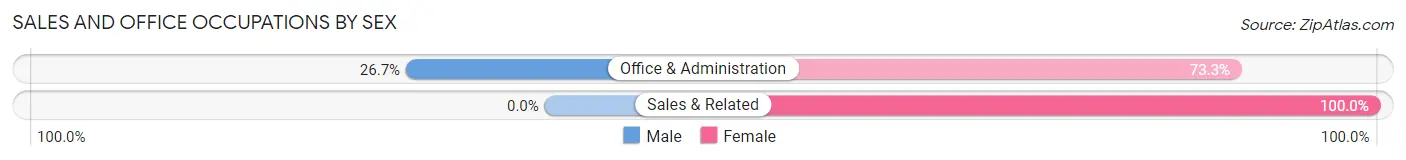
| Occupation | Male | Female |
| Sales & Related | 0 (0.0%) | 17 (100.0%) |
| Office & Administration | 4 (26.7%) | 11 (73.3%) |
| Total (Category) | 4 (12.5%) | 28 (87.5%) |
| Total (Overall) | 62 (54.9%) | 51 (45.1%) |
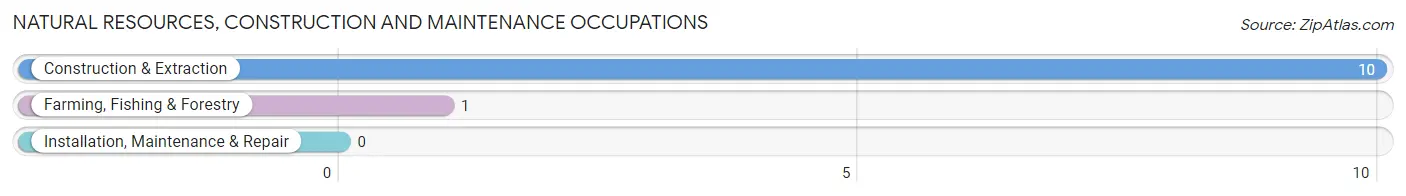
Natural Resources, Construction and Maintenance Occupations
The most common Natural Resources, Construction and Maintenance occupations in Harrisonburg are Construction & Extraction (10 | 8.8%), and Farming, Fishing & Forestry (1 | 0.9%).
Natural Resources, Construction and Maintenance Occupations by Sex
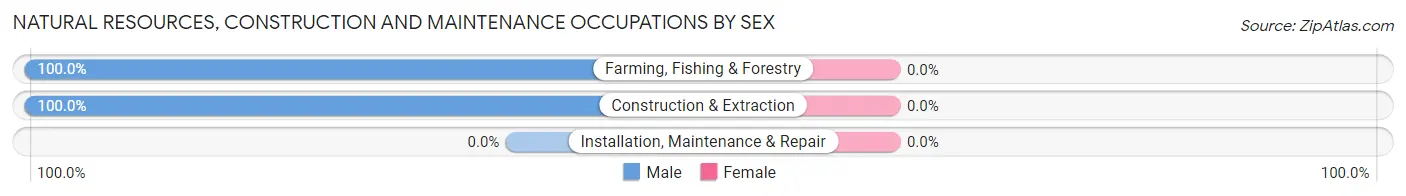
| Occupation | Male | Female |
| Farming, Fishing & Forestry | 1 (100.0%) | 0 (0.0%) |
| Construction & Extraction | 10 (100.0%) | 0 (0.0%) |
| Installation, Maintenance & Repair | 0 (0.0%) | 0 (0.0%) |
| Total (Category) | 11 (100.0%) | 0 (0.0%) |
| Total (Overall) | 62 (54.9%) | 51 (45.1%) |
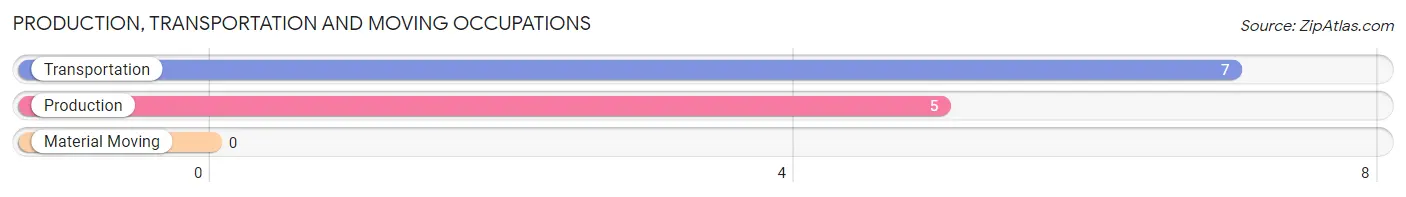
Production, Transportation and Moving Occupations
The most common Production, Transportation and Moving occupations in Harrisonburg are Transportation (7 | 6.2%), and Production (5 | 4.4%).
Production, Transportation and Moving Occupations by Sex
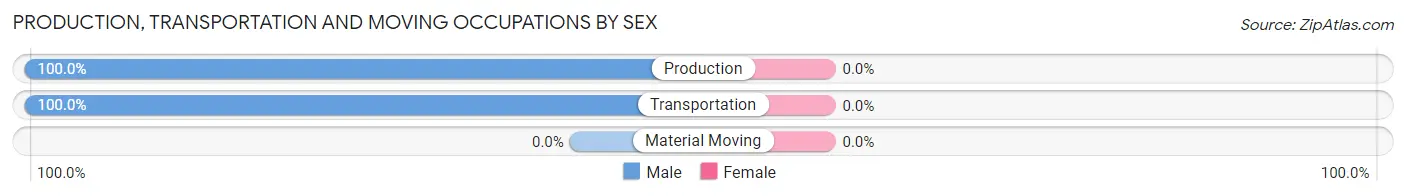
| Occupation | Male | Female |
| Production | 5 (100.0%) | 0 (0.0%) |
| Transportation | 7 (100.0%) | 0 (0.0%) |
| Material Moving | 0 (0.0%) | 0 (0.0%) |
| Total (Category) | 12 (100.0%) | 0 (0.0%) |
| Total (Overall) | 62 (54.9%) | 51 (45.1%) |
Employment Industries by Sex in Harrisonburg
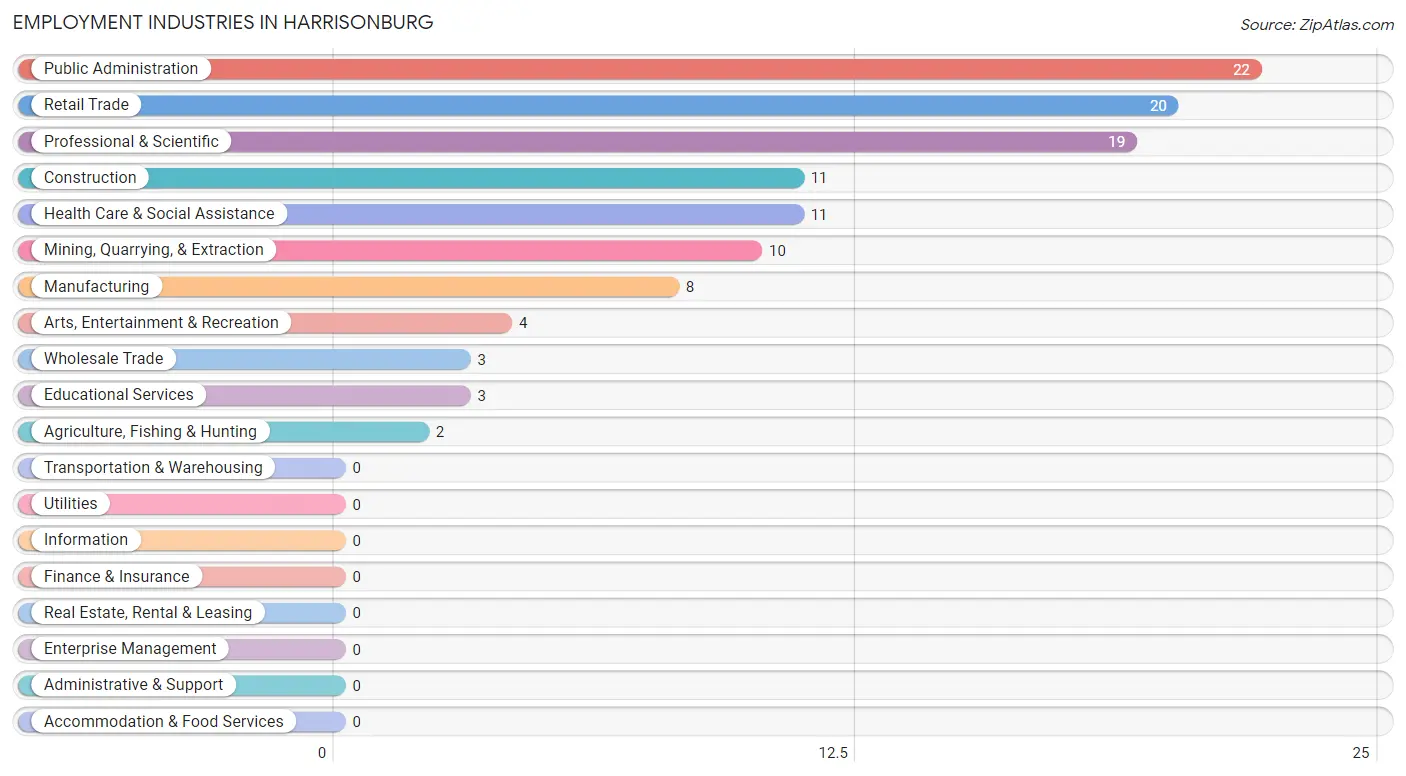
Employment Industries in Harrisonburg
The major employment industries in Harrisonburg include Public Administration (22 | 19.5%), Retail Trade (20 | 17.7%), Professional & Scientific (19 | 16.8%), Construction (11 | 9.7%), and Health Care & Social Assistance (11 | 9.7%).
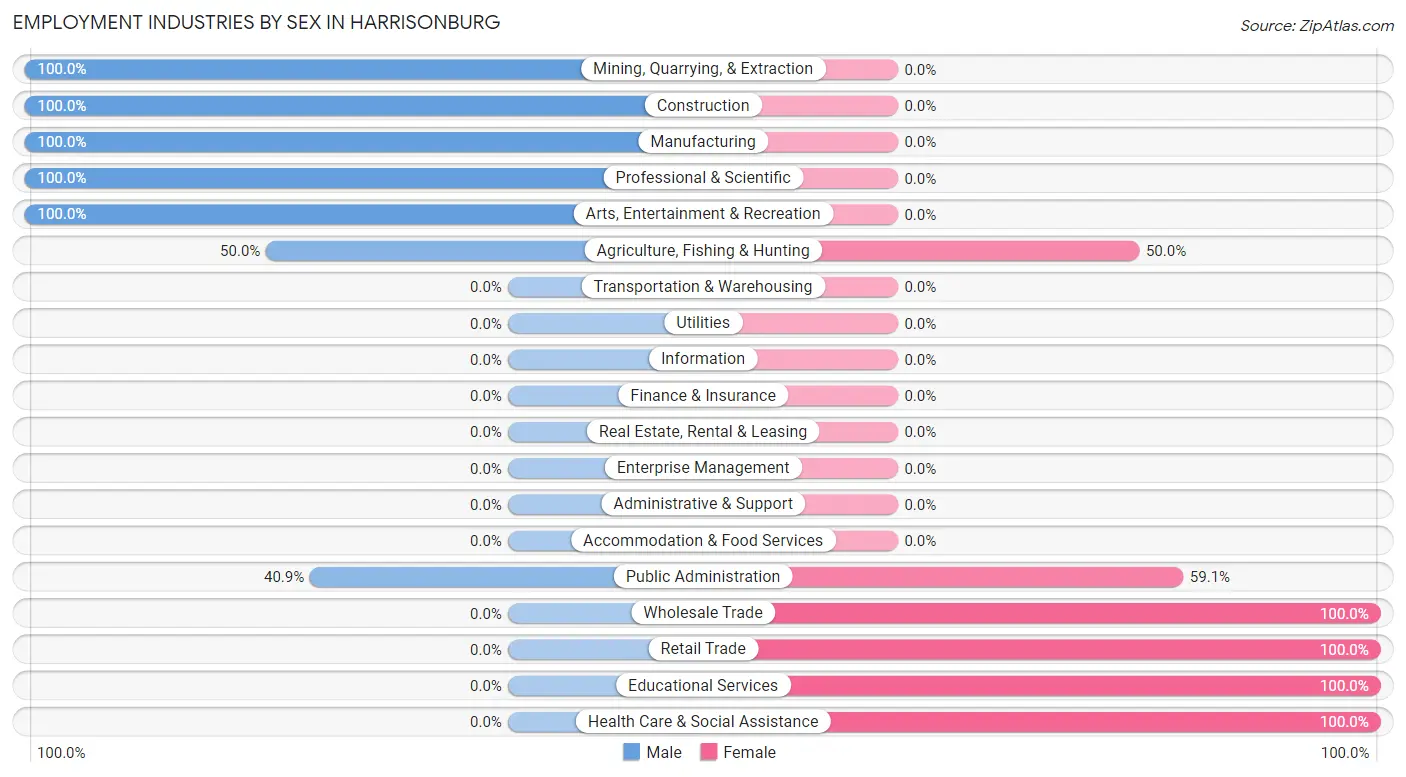
Employment Industries by Sex in Harrisonburg
The Harrisonburg industries that see more men than women are Mining, Quarrying, & Extraction (100.0%), Construction (100.0%), and Manufacturing (100.0%), whereas the industries that tend to have a higher number of women are Wholesale Trade (100.0%), Retail Trade (100.0%), and Educational Services (100.0%).
| Industry | Male | Female |
| Agriculture, Fishing & Hunting | 1 (50.0%) | 1 (50.0%) |
| Mining, Quarrying, & Extraction | 10 (100.0%) | 0 (0.0%) |
| Construction | 11 (100.0%) | 0 (0.0%) |
| Manufacturing | 8 (100.0%) | 0 (0.0%) |
| Wholesale Trade | 0 (0.0%) | 3 (100.0%) |
| Retail Trade | 0 (0.0%) | 20 (100.0%) |
| Transportation & Warehousing | 0 (0.0%) | 0 (0.0%) |
| Utilities | 0 (0.0%) | 0 (0.0%) |
| Information | 0 (0.0%) | 0 (0.0%) |
| Finance & Insurance | 0 (0.0%) | 0 (0.0%) |
| Real Estate, Rental & Leasing | 0 (0.0%) | 0 (0.0%) |
| Professional & Scientific | 19 (100.0%) | 0 (0.0%) |
| Enterprise Management | 0 (0.0%) | 0 (0.0%) |
| Administrative & Support | 0 (0.0%) | 0 (0.0%) |
| Educational Services | 0 (0.0%) | 3 (100.0%) |
| Health Care & Social Assistance | 0 (0.0%) | 11 (100.0%) |
| Arts, Entertainment & Recreation | 4 (100.0%) | 0 (0.0%) |
| Accommodation & Food Services | 0 (0.0%) | 0 (0.0%) |
| Public Administration | 9 (40.9%) | 13 (59.1%) |
| Total | 62 (54.9%) | 51 (45.1%) |
Education in Harrisonburg
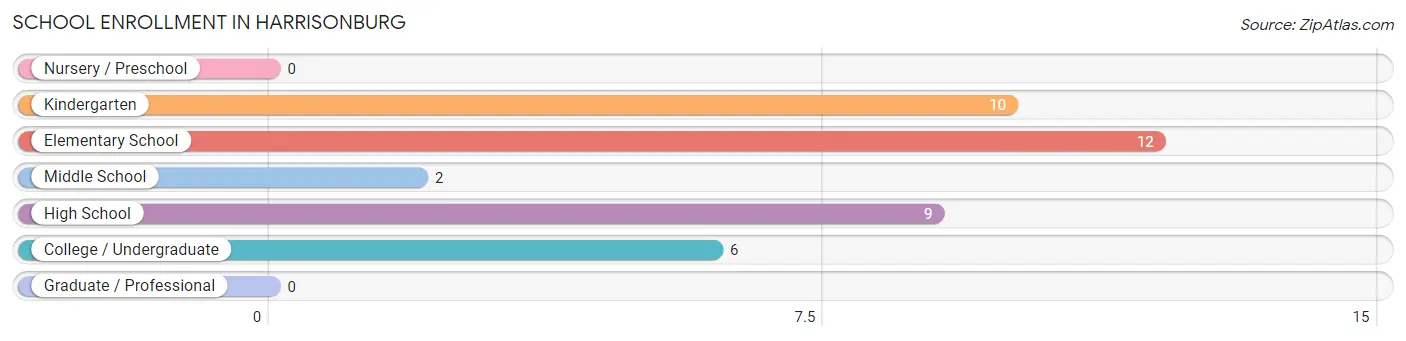
School Enrollment in Harrisonburg
The most common levels of schooling among the 39 students in Harrisonburg are elementary school (12 | 30.8%), kindergarten (10 | 25.6%), and high school (9 | 23.1%).
| School Level | # Students | % Students |
| Nursery / Preschool | 0 | 0.0% |
| Kindergarten | 10 | 25.6% |
| Elementary School | 12 | 30.8% |
| Middle School | 2 | 5.1% |
| High School | 9 | 23.1% |
| College / Undergraduate | 6 | 15.4% |
| Graduate / Professional | 0 | 0.0% |
| Total | 39 | 100.0% |
School Enrollment by Age by Funding Source in Harrisonburg
Out of a total of 39 students who are enrolled in schools in Harrisonburg, 4 (10.3%) attend a private institution, while the remaining 35 (89.7%) are enrolled in public schools. The age group of 10 to 14 year olds has the highest likelihood of being enrolled in private schools, with 2 (50.0% in the age bracket) enrolled. Conversely, the age group of 15 to 17 year olds has the lowest likelihood of being enrolled in a private school, with 7 (100.0% in the age bracket) attending a public institution.
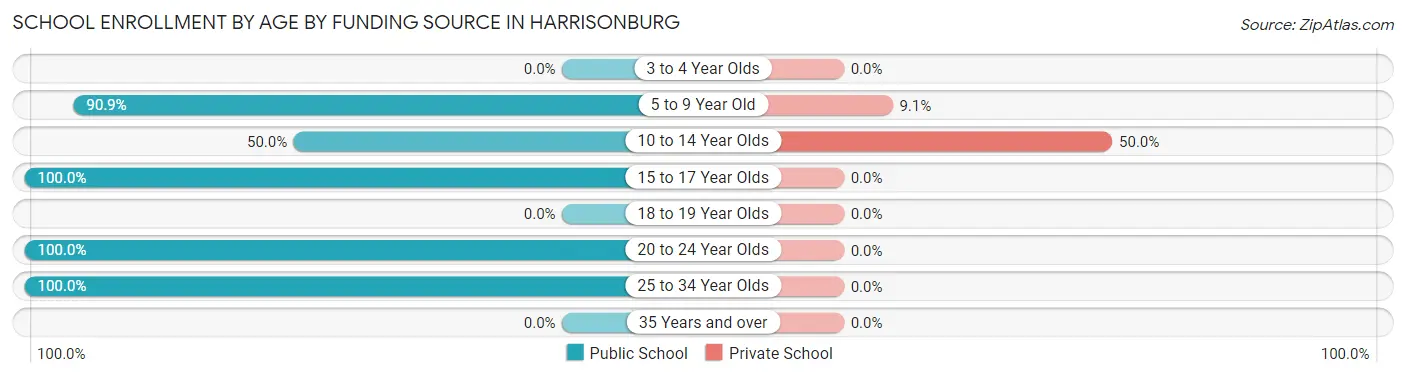
| Age Bracket | Public School | Private School |
| 3 to 4 Year Olds | 0 (0.0%) | 0 (0.0%) |
| 5 to 9 Year Old | 20 (90.9%) | 2 (9.1%) |
| 10 to 14 Year Olds | 2 (50.0%) | 2 (50.0%) |
| 15 to 17 Year Olds | 7 (100.0%) | 0 (0.0%) |
| 18 to 19 Year Olds | 0 (0.0%) | 0 (0.0%) |
| 20 to 24 Year Olds | 5 (100.0%) | 0 (0.0%) |
| 25 to 34 Year Olds | 1 (100.0%) | 0 (0.0%) |
| 35 Years and over | 0 (0.0%) | 0 (0.0%) |
| Total | 35 (89.7%) | 4 (10.3%) |
Educational Attainment by Field of Study in Harrisonburg
Business (20 | 48.8%), education (13 | 31.7%), science & technology (7 | 17.1%), and communications (1 | 2.4%) are the most common fields of study among 41 individuals in Harrisonburg who have obtained a bachelor's degree or higher.
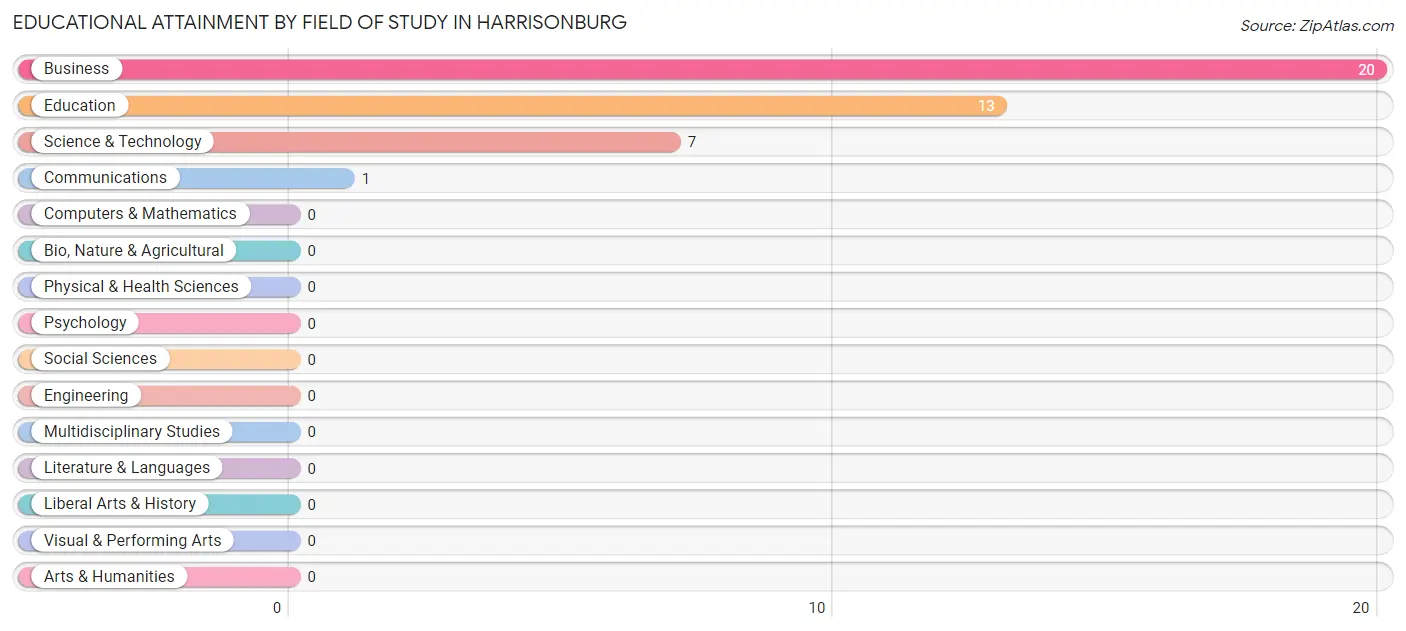
| Field of Study | # Graduates | % Graduates |
| Computers & Mathematics | 0 | 0.0% |
| Bio, Nature & Agricultural | 0 | 0.0% |
| Physical & Health Sciences | 0 | 0.0% |
| Psychology | 0 | 0.0% |
| Social Sciences | 0 | 0.0% |
| Engineering | 0 | 0.0% |
| Multidisciplinary Studies | 0 | 0.0% |
| Science & Technology | 7 | 17.1% |
| Business | 20 | 48.8% |
| Education | 13 | 31.7% |
| Literature & Languages | 0 | 0.0% |
| Liberal Arts & History | 0 | 0.0% |
| Visual & Performing Arts | 0 | 0.0% |
| Communications | 1 | 2.4% |
| Arts & Humanities | 0 | 0.0% |
| Total | 41 | 100.0% |
Transportation & Commute in Harrisonburg
Vehicle Availability by Sex in Harrisonburg
The most prevalent vehicle ownership categories in Harrisonburg are males with 2 vehicles (51, accounting for 79.7%) and females with 2 vehicles (28, making up 118.6%).
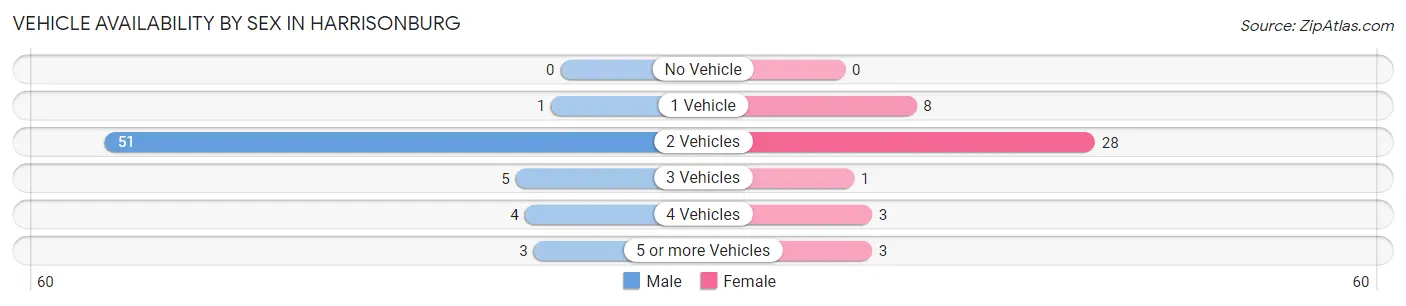
| Vehicles Available | Male | Female |
| No Vehicle | 0 (0.0%) | 0 (0.0%) |
| 1 Vehicle | 1 (1.6%) | 8 (18.6%) |
| 2 Vehicles | 51 (79.7%) | 28 (65.1%) |
| 3 Vehicles | 5 (7.8%) | 1 (2.3%) |
| 4 Vehicles | 4 (6.2%) | 3 (7.0%) |
| 5 or more Vehicles | 3 (4.7%) | 3 (7.0%) |
| Total | 64 (100.0%) | 43 (100.0%) |
Commute Time in Harrisonburg
The most frequently occuring commute durations in Harrisonburg are less than 5 minutes (22 commuters, 22.5%), 45 to 59 minutes (18 commuters, 18.4%), and 20 to 24 minutes (17 commuters, 17.3%).
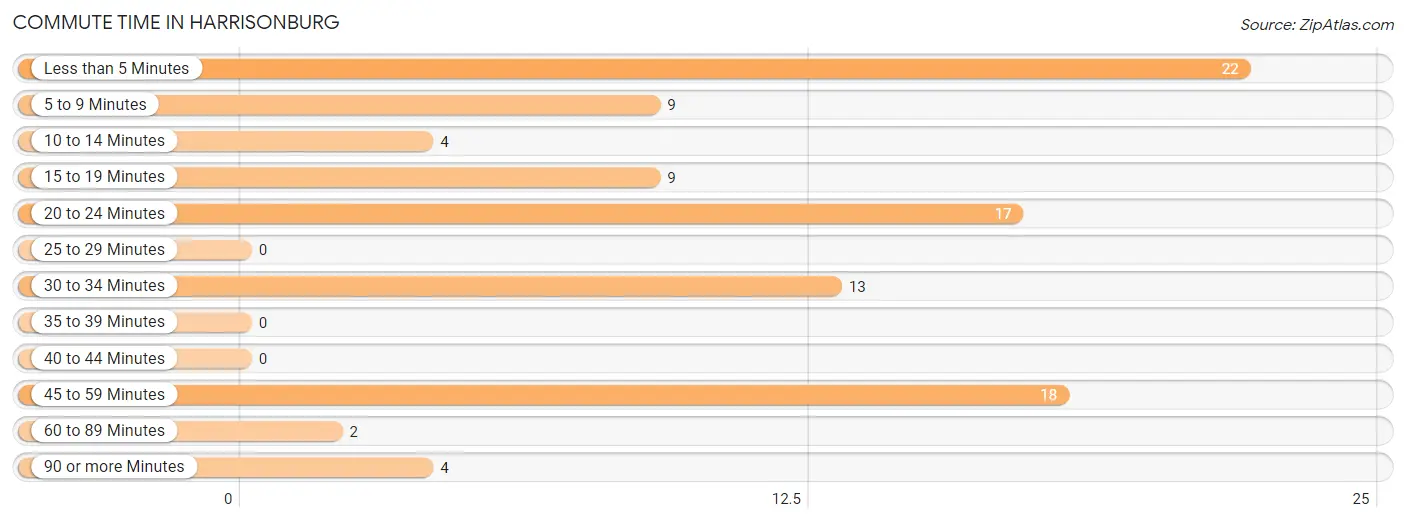
| Commute Time | # Commuters | % Commuters |
| Less than 5 Minutes | 22 | 22.5% |
| 5 to 9 Minutes | 9 | 9.2% |
| 10 to 14 Minutes | 4 | 4.1% |
| 15 to 19 Minutes | 9 | 9.2% |
| 20 to 24 Minutes | 17 | 17.3% |
| 25 to 29 Minutes | 0 | 0.0% |
| 30 to 34 Minutes | 13 | 13.3% |
| 35 to 39 Minutes | 0 | 0.0% |
| 40 to 44 Minutes | 0 | 0.0% |
| 45 to 59 Minutes | 18 | 18.4% |
| 60 to 89 Minutes | 2 | 2.0% |
| 90 or more Minutes | 4 | 4.1% |
Commute Time by Sex in Harrisonburg
The most common commute times in Harrisonburg are less than 5 minutes (22 commuters, 40.0%) for males and 20 to 24 minutes (14 commuters, 32.6%) for females.
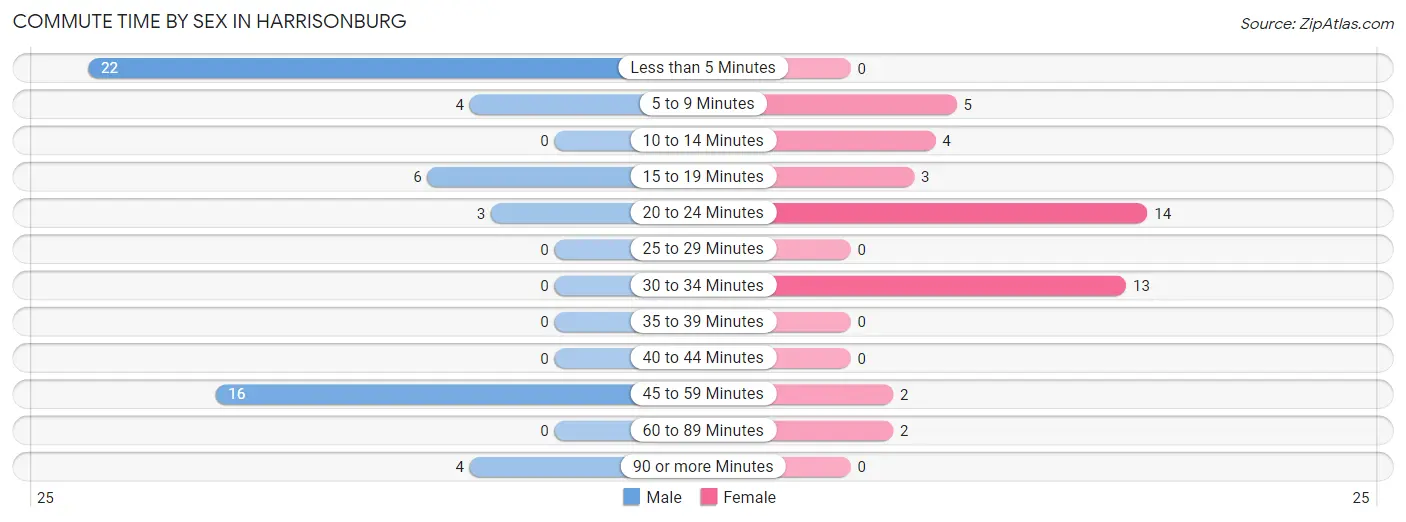
| Commute Time | Male | Female |
| Less than 5 Minutes | 22 (40.0%) | 0 (0.0%) |
| 5 to 9 Minutes | 4 (7.3%) | 5 (11.6%) |
| 10 to 14 Minutes | 0 (0.0%) | 4 (9.3%) |
| 15 to 19 Minutes | 6 (10.9%) | 3 (7.0%) |
| 20 to 24 Minutes | 3 (5.4%) | 14 (32.6%) |
| 25 to 29 Minutes | 0 (0.0%) | 0 (0.0%) |
| 30 to 34 Minutes | 0 (0.0%) | 13 (30.2%) |
| 35 to 39 Minutes | 0 (0.0%) | 0 (0.0%) |
| 40 to 44 Minutes | 0 (0.0%) | 0 (0.0%) |
| 45 to 59 Minutes | 16 (29.1%) | 2 (4.6%) |
| 60 to 89 Minutes | 0 (0.0%) | 2 (4.6%) |
| 90 or more Minutes | 4 (7.3%) | 0 (0.0%) |
Time of Departure to Work by Sex in Harrisonburg
The most frequent times of departure to work in Harrisonburg are 8:00 AM to 8:29 AM (19, 34.5%) for males and 8:00 AM to 8:29 AM (20, 46.5%) for females.
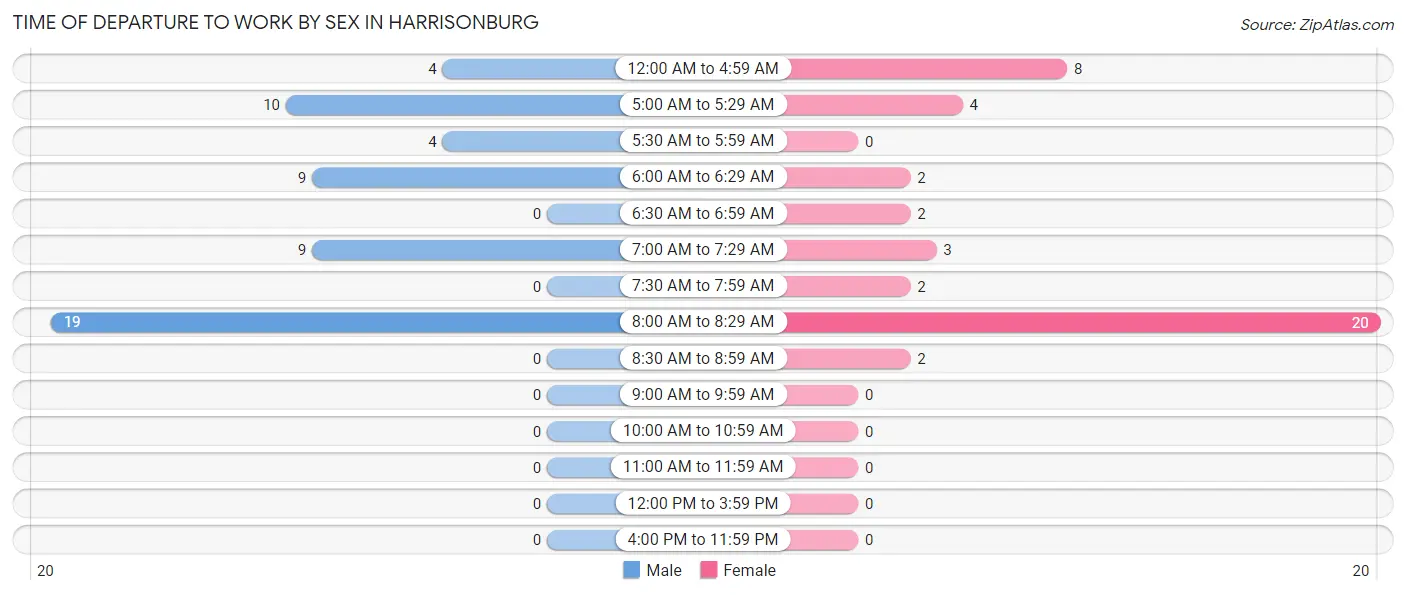
| Time of Departure | Male | Female |
| 12:00 AM to 4:59 AM | 4 (7.3%) | 8 (18.6%) |
| 5:00 AM to 5:29 AM | 10 (18.2%) | 4 (9.3%) |
| 5:30 AM to 5:59 AM | 4 (7.3%) | 0 (0.0%) |
| 6:00 AM to 6:29 AM | 9 (16.4%) | 2 (4.6%) |
| 6:30 AM to 6:59 AM | 0 (0.0%) | 2 (4.6%) |
| 7:00 AM to 7:29 AM | 9 (16.4%) | 3 (7.0%) |
| 7:30 AM to 7:59 AM | 0 (0.0%) | 2 (4.6%) |
| 8:00 AM to 8:29 AM | 19 (34.5%) | 20 (46.5%) |
| 8:30 AM to 8:59 AM | 0 (0.0%) | 2 (4.6%) |
| 9:00 AM to 9:59 AM | 0 (0.0%) | 0 (0.0%) |
| 10:00 AM to 10:59 AM | 0 (0.0%) | 0 (0.0%) |
| 11:00 AM to 11:59 AM | 0 (0.0%) | 0 (0.0%) |
| 12:00 PM to 3:59 PM | 0 (0.0%) | 0 (0.0%) |
| 4:00 PM to 11:59 PM | 0 (0.0%) | 0 (0.0%) |
| Total | 55 (100.0%) | 43 (100.0%) |
Housing Occupancy in Harrisonburg
Occupancy by Ownership in Harrisonburg
Of the total 138 dwellings in Harrisonburg, owner-occupied units account for 95 (68.8%), while renter-occupied units make up 43 (31.2%).
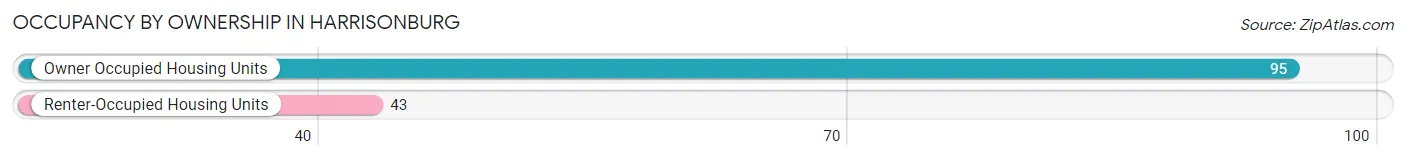
| Occupancy | # Housing Units | % Housing Units |
| Owner Occupied Housing Units | 95 | 68.8% |
| Renter-Occupied Housing Units | 43 | 31.2% |
| Total Occupied Housing Units | 138 | 100.0% |
Occupancy by Household Size in Harrisonburg
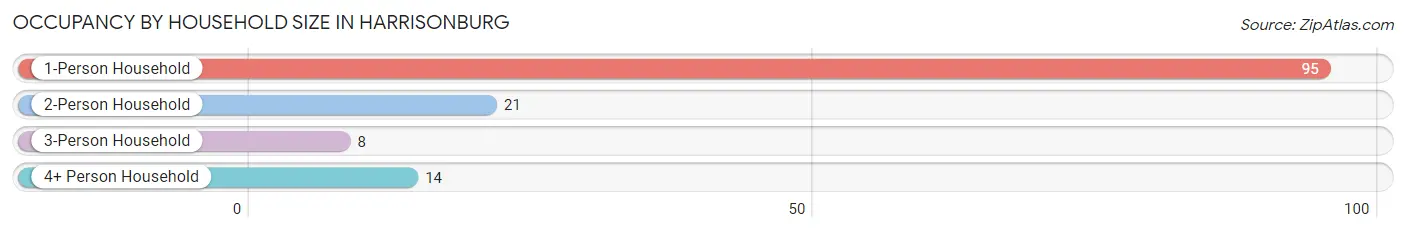
| Household Size | # Housing Units | % Housing Units |
| 1-Person Household | 95 | 68.8% |
| 2-Person Household | 21 | 15.2% |
| 3-Person Household | 8 | 5.8% |
| 4+ Person Household | 14 | 10.1% |
| Total Housing Units | 138 | 100.0% |
Occupancy by Ownership by Household Size in Harrisonburg
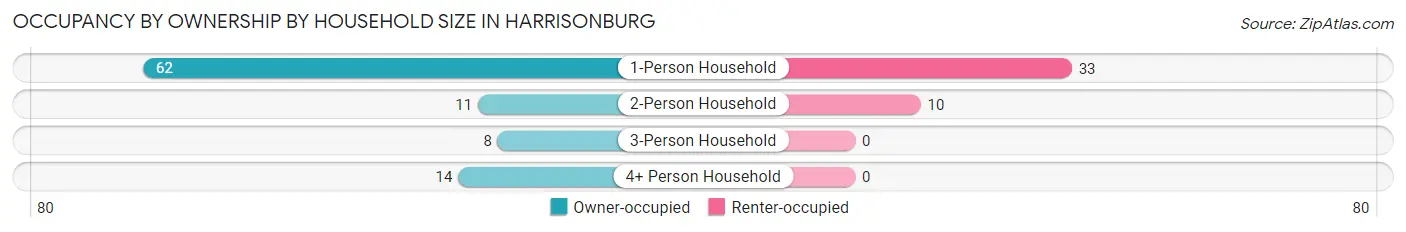
| Household Size | Owner-occupied | Renter-occupied |
| 1-Person Household | 62 (65.3%) | 33 (34.7%) |
| 2-Person Household | 11 (52.4%) | 10 (47.6%) |
| 3-Person Household | 8 (100.0%) | 0 (0.0%) |
| 4+ Person Household | 14 (100.0%) | 0 (0.0%) |
| Total Housing Units | 95 (68.8%) | 43 (31.2%) |
Occupancy by Educational Attainment in Harrisonburg
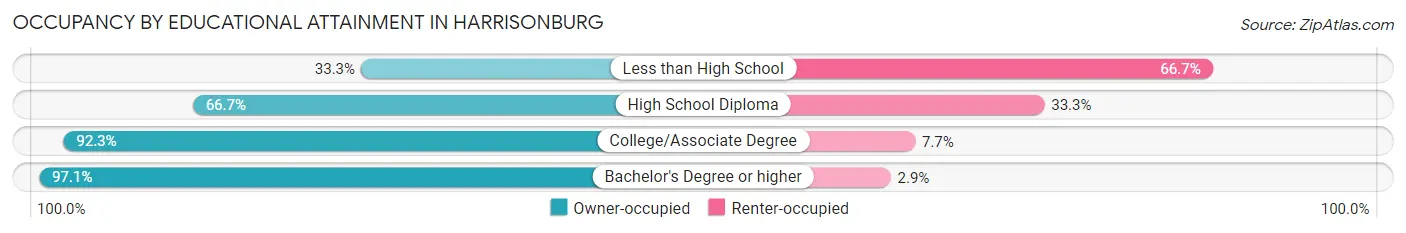
| Household Size | Owner-occupied | Renter-occupied |
| Less than High School | 11 (33.3%) | 22 (66.7%) |
| High School Diploma | 38 (66.7%) | 19 (33.3%) |
| College/Associate Degree | 12 (92.3%) | 1 (7.7%) |
| Bachelor's Degree or higher | 34 (97.1%) | 1 (2.9%) |
Occupancy by Age of Householder in Harrisonburg
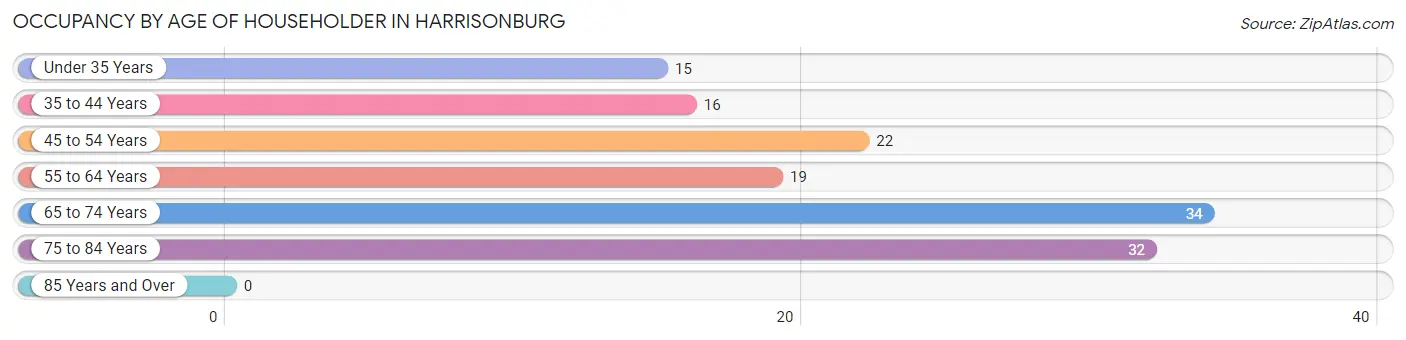
| Age Bracket | # Households | % Households |
| Under 35 Years | 15 | 10.9% |
| 35 to 44 Years | 16 | 11.6% |
| 45 to 54 Years | 22 | 15.9% |
| 55 to 64 Years | 19 | 13.8% |
| 65 to 74 Years | 34 | 24.6% |
| 75 to 84 Years | 32 | 23.2% |
| 85 Years and Over | 0 | 0.0% |
| Total | 138 | 100.0% |
Housing Finances in Harrisonburg
Median Income by Occupancy in Harrisonburg
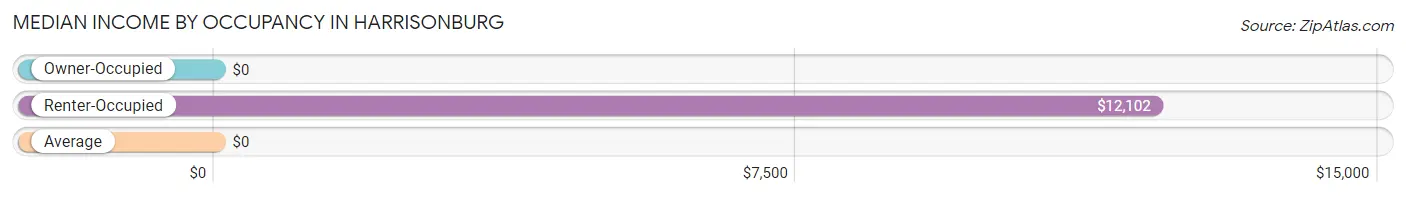
| Occupancy Type | # Households | Median Income |
| Owner-Occupied | 95 (68.8%) | $0 |
| Renter-Occupied | 43 (31.2%) | $12,102 |
| Average | 138 (100.0%) | $0 |
Occupancy by Householder Income Bracket in Harrisonburg
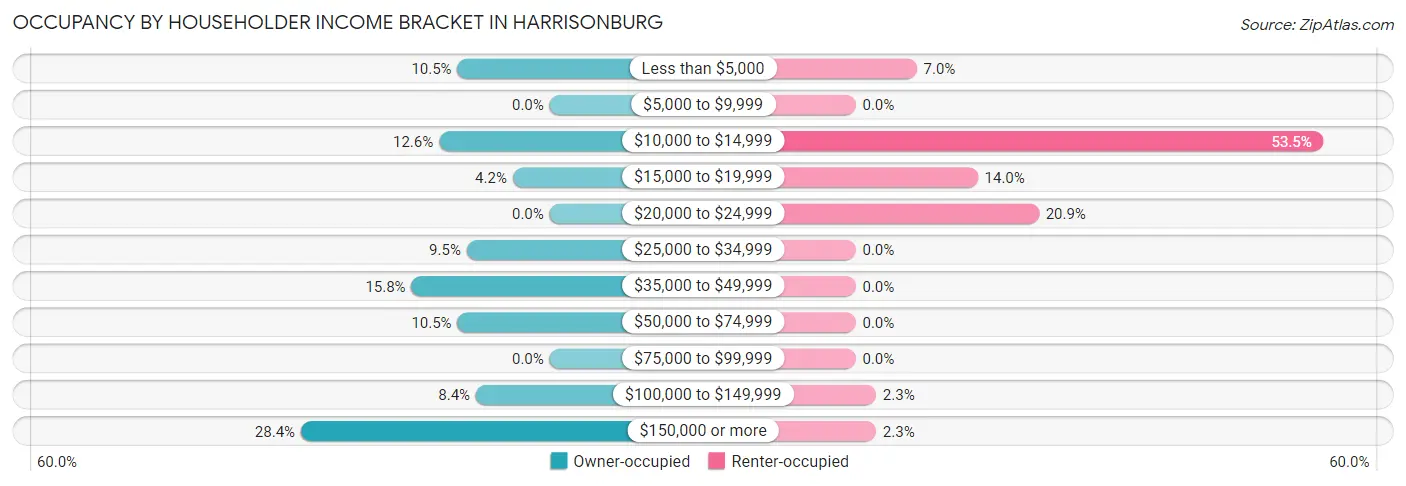
| Income Bracket | Owner-occupied | Renter-occupied |
| Less than $5,000 | 10 (10.5%) | 3 (7.0%) |
| $5,000 to $9,999 | 0 (0.0%) | 0 (0.0%) |
| $10,000 to $14,999 | 12 (12.6%) | 23 (53.5%) |
| $15,000 to $19,999 | 4 (4.2%) | 6 (14.0%) |
| $20,000 to $24,999 | 0 (0.0%) | 9 (20.9%) |
| $25,000 to $34,999 | 9 (9.5%) | 0 (0.0%) |
| $35,000 to $49,999 | 15 (15.8%) | 0 (0.0%) |
| $50,000 to $74,999 | 10 (10.5%) | 0 (0.0%) |
| $75,000 to $99,999 | 0 (0.0%) | 0 (0.0%) |
| $100,000 to $149,999 | 8 (8.4%) | 1 (2.3%) |
| $150,000 or more | 27 (28.4%) | 1 (2.3%) |
| Total | 95 (100.0%) | 43 (100.0%) |
Monthly Housing Cost Tiers in Harrisonburg
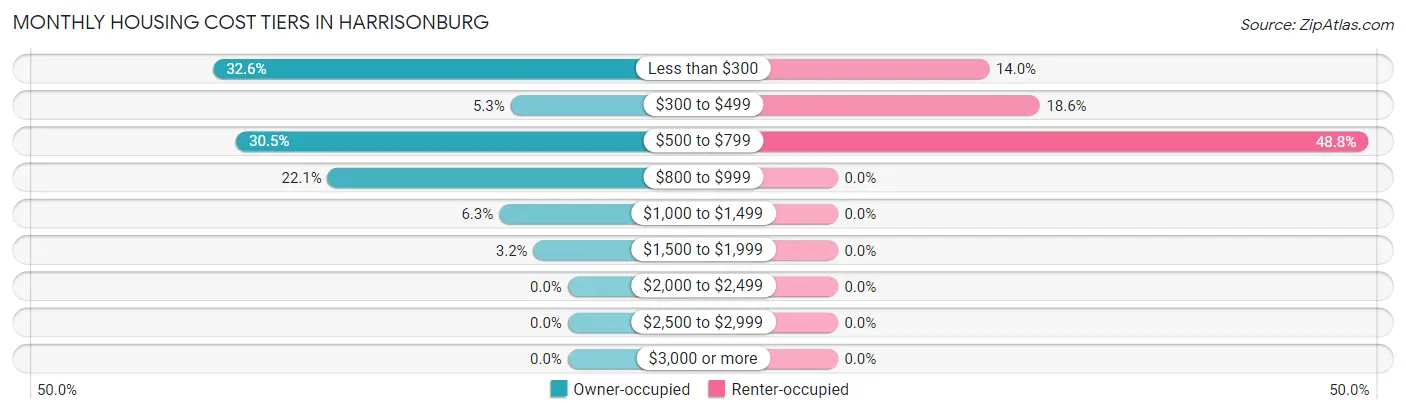
| Monthly Cost | Owner-occupied | Renter-occupied |
| Less than $300 | 31 (32.6%) | 6 (14.0%) |
| $300 to $499 | 5 (5.3%) | 8 (18.6%) |
| $500 to $799 | 29 (30.5%) | 21 (48.8%) |
| $800 to $999 | 21 (22.1%) | 0 (0.0%) |
| $1,000 to $1,499 | 6 (6.3%) | 0 (0.0%) |
| $1,500 to $1,999 | 3 (3.2%) | 0 (0.0%) |
| $2,000 to $2,499 | 0 (0.0%) | 0 (0.0%) |
| $2,500 to $2,999 | 0 (0.0%) | 0 (0.0%) |
| $3,000 or more | 0 (0.0%) | 0 (0.0%) |
| Total | 95 (100.0%) | 43 (100.0%) |
Physical Housing Characteristics in Harrisonburg
Housing Structures in Harrisonburg
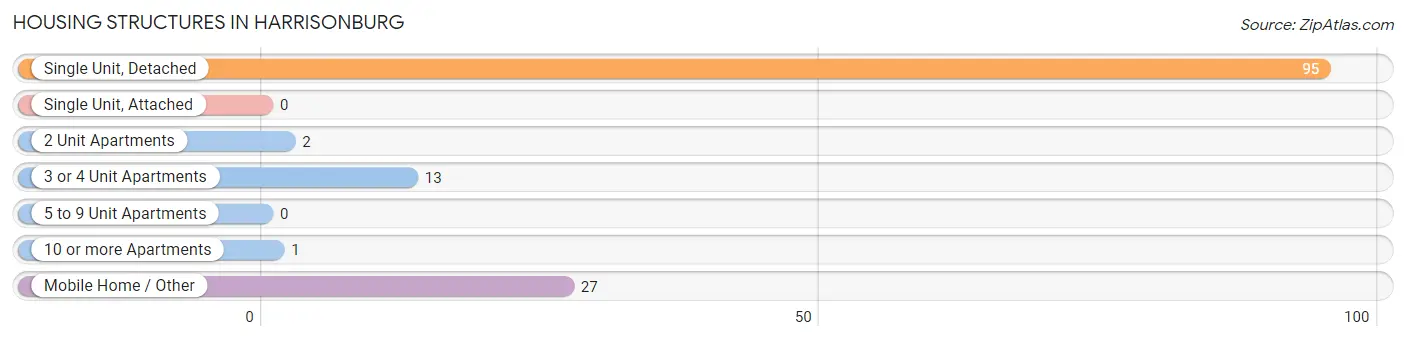
| Structure Type | # Housing Units | % Housing Units |
| Single Unit, Detached | 95 | 68.8% |
| Single Unit, Attached | 0 | 0.0% |
| 2 Unit Apartments | 2 | 1.5% |
| 3 or 4 Unit Apartments | 13 | 9.4% |
| 5 to 9 Unit Apartments | 0 | 0.0% |
| 10 or more Apartments | 1 | 0.7% |
| Mobile Home / Other | 27 | 19.6% |
| Total | 138 | 100.0% |
Housing Structures by Occupancy in Harrisonburg
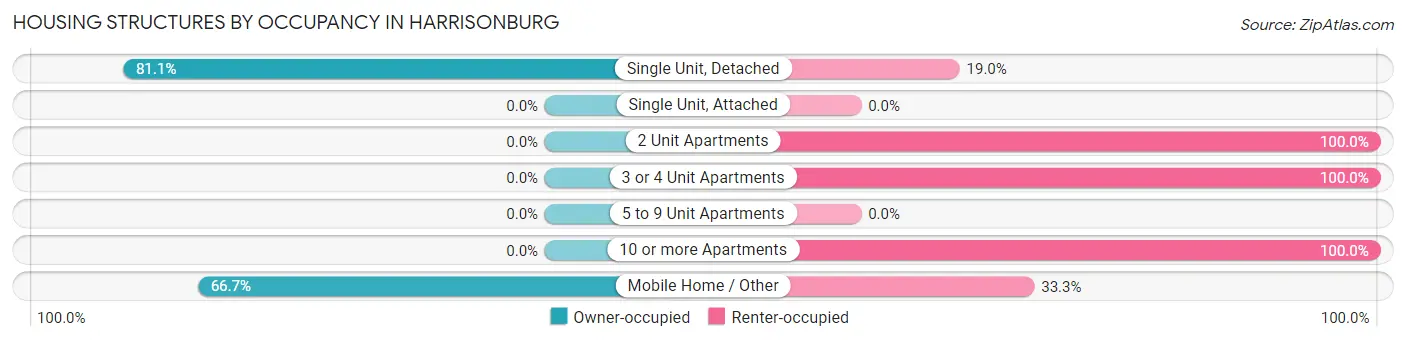
| Structure Type | Owner-occupied | Renter-occupied |
| Single Unit, Detached | 77 (81.0%) | 18 (19.0%) |
| Single Unit, Attached | 0 (0.0%) | 0 (0.0%) |
| 2 Unit Apartments | 0 (0.0%) | 2 (100.0%) |
| 3 or 4 Unit Apartments | 0 (0.0%) | 13 (100.0%) |
| 5 to 9 Unit Apartments | 0 (0.0%) | 0 (0.0%) |
| 10 or more Apartments | 0 (0.0%) | 1 (100.0%) |
| Mobile Home / Other | 18 (66.7%) | 9 (33.3%) |
| Total | 95 (68.8%) | 43 (31.2%) |
Housing Structures by Number of Rooms in Harrisonburg
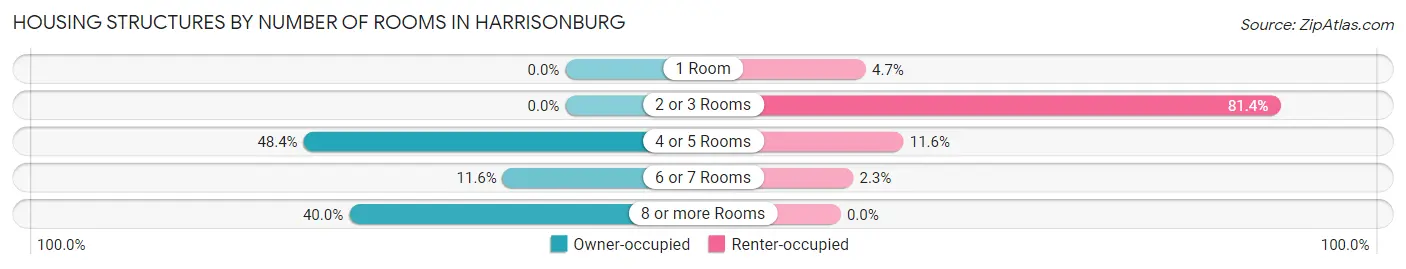
| Number of Rooms | Owner-occupied | Renter-occupied |
| 1 Room | 0 (0.0%) | 2 (4.6%) |
| 2 or 3 Rooms | 0 (0.0%) | 35 (81.4%) |
| 4 or 5 Rooms | 46 (48.4%) | 5 (11.6%) |
| 6 or 7 Rooms | 11 (11.6%) | 1 (2.3%) |
| 8 or more Rooms | 38 (40.0%) | 0 (0.0%) |
| Total | 95 (100.0%) | 43 (100.0%) |
Housing Structure by Heating Type in Harrisonburg

| Heating Type | Owner-occupied | Renter-occupied |
| Utility Gas | 66 (69.5%) | 1 (2.3%) |
| Bottled, Tank, or LP Gas | 11 (11.6%) | 6 (14.0%) |
| Electricity | 18 (19.0%) | 36 (83.7%) |
| Fuel Oil or Kerosene | 0 (0.0%) | 0 (0.0%) |
| Coal or Coke | 0 (0.0%) | 0 (0.0%) |
| All other Fuels | 0 (0.0%) | 0 (0.0%) |
| No Fuel Used | 0 (0.0%) | 0 (0.0%) |
| Total | 95 (100.0%) | 43 (100.0%) |
Household Vehicle Usage in Harrisonburg
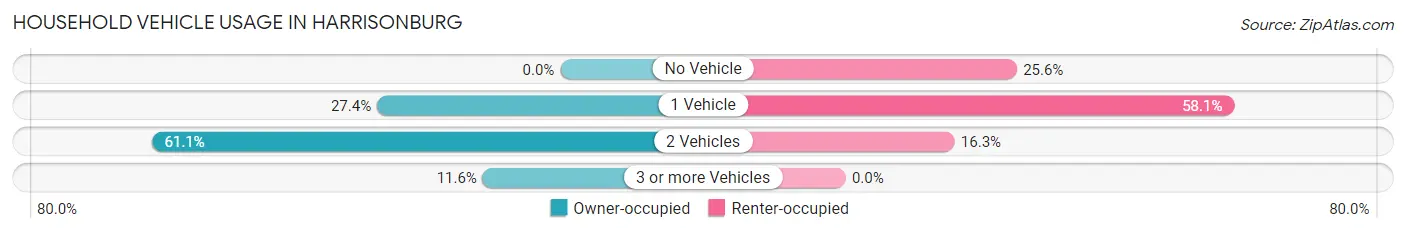
| Vehicles per Household | Owner-occupied | Renter-occupied |
| No Vehicle | 0 (0.0%) | 11 (25.6%) |
| 1 Vehicle | 26 (27.4%) | 25 (58.1%) |
| 2 Vehicles | 58 (61.1%) | 7 (16.3%) |
| 3 or more Vehicles | 11 (11.6%) | 0 (0.0%) |
| Total | 95 (100.0%) | 43 (100.0%) |
Real Estate & Mortgages in Harrisonburg
Real Estate and Mortgage Overview in Harrisonburg
| Characteristic | Without Mortgage | With Mortgage |
| Housing Units | 67 | 28 |
| Median Property Value | - | - |
| Median Household Income | - | - |
| Monthly Housing Costs | - | - |
| Real Estate Taxes | - | - |
Property Value by Mortgage Status in Harrisonburg
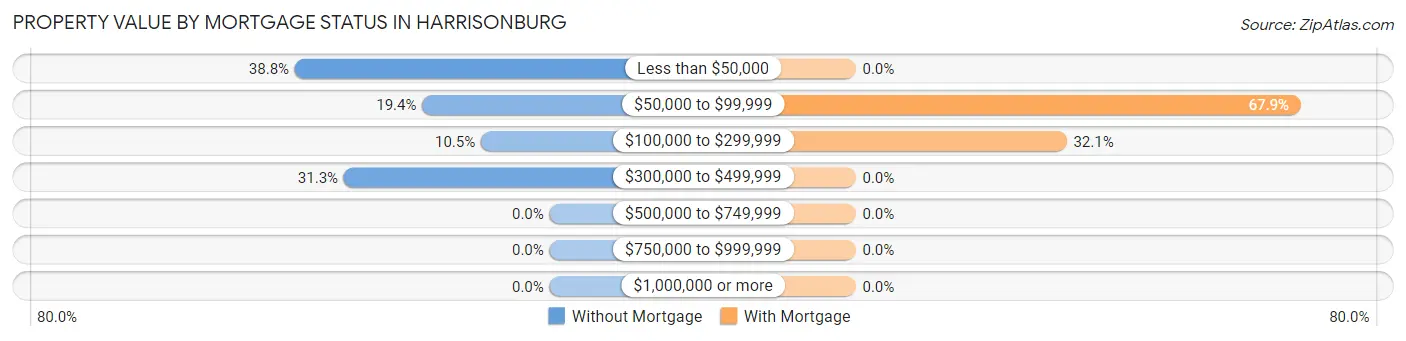
| Property Value | Without Mortgage | With Mortgage |
| Less than $50,000 | 26 (38.8%) | 0 (0.0%) |
| $50,000 to $99,999 | 13 (19.4%) | 19 (67.9%) |
| $100,000 to $299,999 | 7 (10.4%) | 9 (32.1%) |
| $300,000 to $499,999 | 21 (31.3%) | 0 (0.0%) |
| $500,000 to $749,999 | 0 (0.0%) | 0 (0.0%) |
| $750,000 to $999,999 | 0 (0.0%) | 0 (0.0%) |
| $1,000,000 or more | 0 (0.0%) | 0 (0.0%) |
| Total | 67 (100.0%) | 28 (100.0%) |
Household Income by Mortgage Status in Harrisonburg
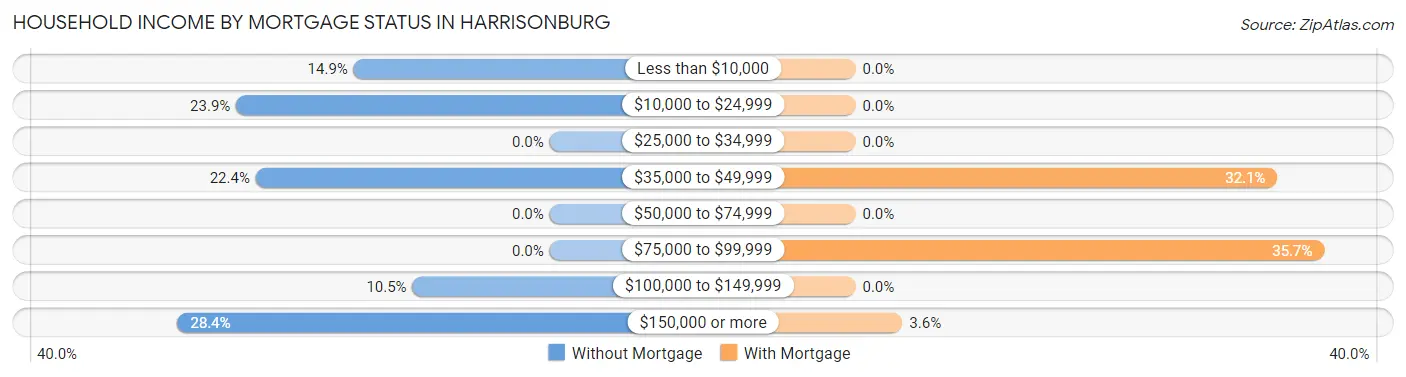
| Household Income | Without Mortgage | With Mortgage |
| Less than $10,000 | 10 (14.9%) | 0 (0.0%) |
| $10,000 to $24,999 | 16 (23.9%) | 0 (0.0%) |
| $25,000 to $34,999 | 0 (0.0%) | 0 (0.0%) |
| $35,000 to $49,999 | 15 (22.4%) | 9 (32.1%) |
| $50,000 to $74,999 | 0 (0.0%) | 0 (0.0%) |
| $75,000 to $99,999 | 0 (0.0%) | 10 (35.7%) |
| $100,000 to $149,999 | 7 (10.4%) | 0 (0.0%) |
| $150,000 or more | 19 (28.4%) | 1 (3.6%) |
| Total | 67 (100.0%) | 28 (100.0%) |
Property Value to Household Income Ratio in Harrisonburg
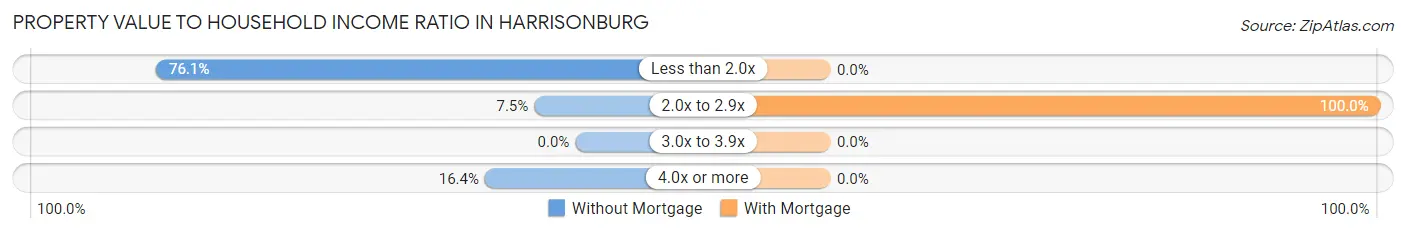
| Value-to-Income Ratio | Without Mortgage | With Mortgage |
| Less than 2.0x | 51 (76.1%) | 0 (0.0%) |
| 2.0x to 2.9x | 5 (7.5%) | 28 (100.0%) |
| 3.0x to 3.9x | 0 (0.0%) | 0 (0.0%) |
| 4.0x or more | 11 (16.4%) | 0 (0.0%) |
| Total | 67 (100.0%) | 28 (100.0%) |
Real Estate Taxes by Mortgage Status in Harrisonburg
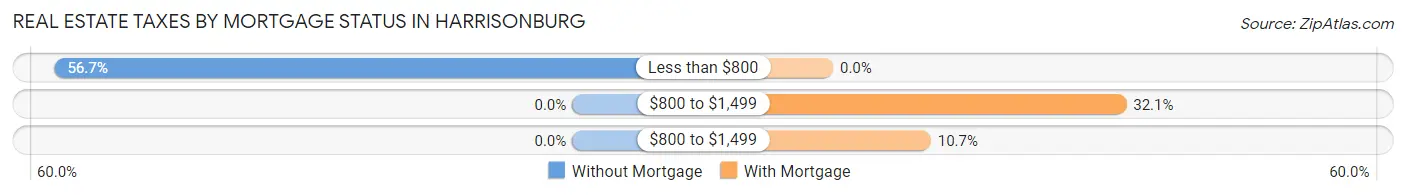
| Property Taxes | Without Mortgage | With Mortgage |
| Less than $800 | 38 (56.7%) | 0 (0.0%) |
| $800 to $1,499 | 0 (0.0%) | 9 (32.1%) |
| $800 to $1,499 | 0 (0.0%) | 3 (10.7%) |
| Total | 67 (100.0%) | 28 (100.0%) |
Health & Disability in Harrisonburg
Health Insurance Coverage by Age in Harrisonburg
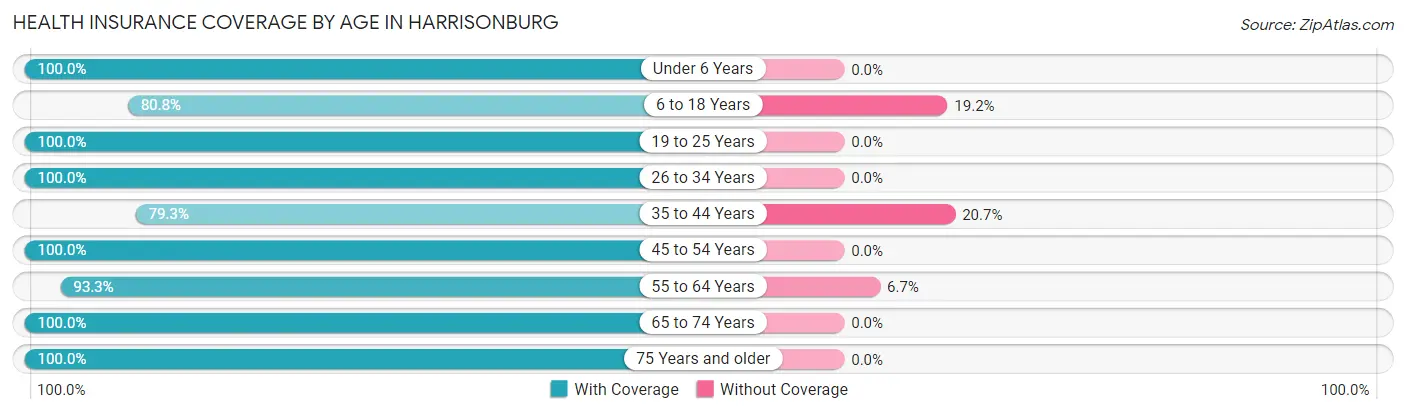
| Age Bracket | With Coverage | Without Coverage |
| Under 6 Years | 25 (100.0%) | 0 (0.0%) |
| 6 to 18 Years | 21 (80.8%) | 5 (19.2%) |
| 19 to 25 Years | 11 (100.0%) | 0 (0.0%) |
| 26 to 34 Years | 25 (100.0%) | 0 (0.0%) |
| 35 to 44 Years | 23 (79.3%) | 6 (20.7%) |
| 45 to 54 Years | 36 (100.0%) | 0 (0.0%) |
| 55 to 64 Years | 28 (93.3%) | 2 (6.7%) |
| 65 to 74 Years | 38 (100.0%) | 0 (0.0%) |
| 75 Years and older | 33 (100.0%) | 0 (0.0%) |
| Total | 240 (94.9%) | 13 (5.1%) |
Health Insurance Coverage by Citizenship Status in Harrisonburg
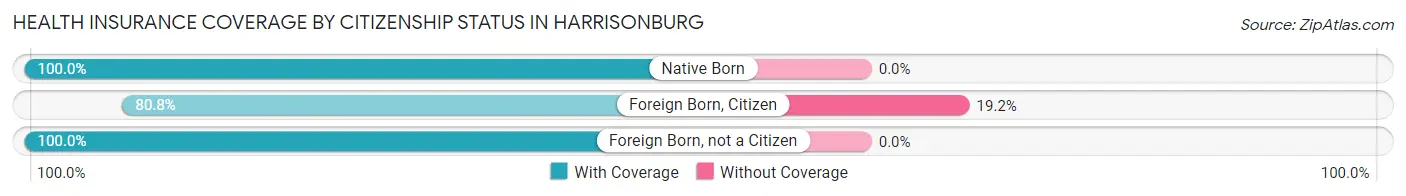
| Citizenship Status | With Coverage | Without Coverage |
| Native Born | 25 (100.0%) | 0 (0.0%) |
| Foreign Born, Citizen | 21 (80.8%) | 5 (19.2%) |
| Foreign Born, not a Citizen | 11 (100.0%) | 0 (0.0%) |
Health Insurance Coverage by Household Income in Harrisonburg
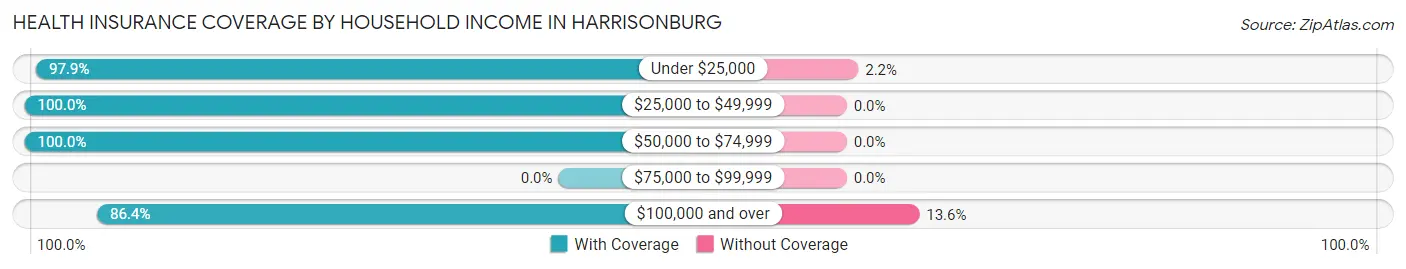
| Household Income | With Coverage | Without Coverage |
| Under $25,000 | 91 (97.9%) | 2 (2.1%) |
| $25,000 to $49,999 | 28 (100.0%) | 0 (0.0%) |
| $50,000 to $74,999 | 51 (100.0%) | 0 (0.0%) |
| $75,000 to $99,999 | 0 (0.0%) | 0 (0.0%) |
| $100,000 and over | 70 (86.4%) | 11 (13.6%) |
Public vs Private Health Insurance Coverage by Age in Harrisonburg
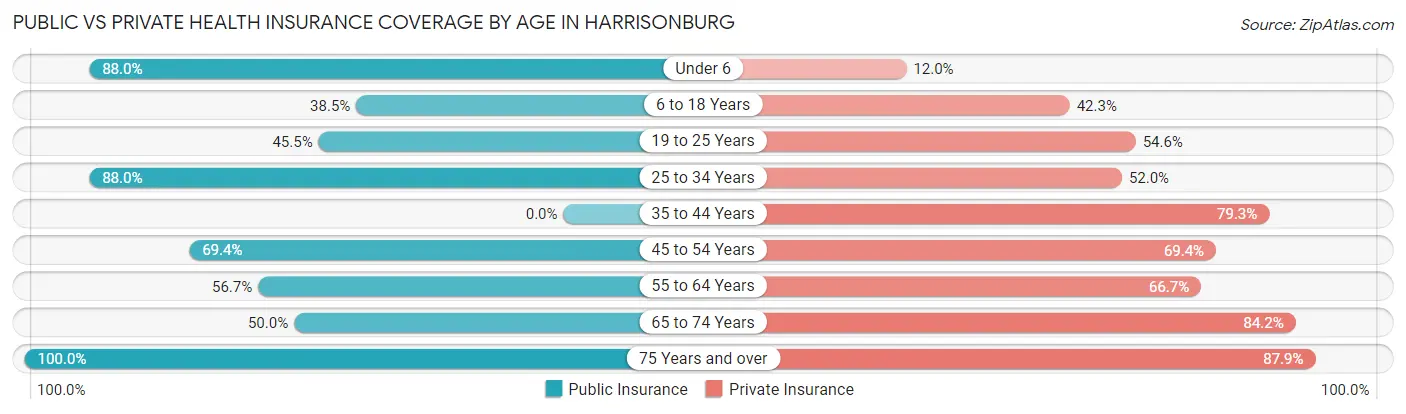
| Age Bracket | Public Insurance | Private Insurance |
| Under 6 | 22 (88.0%) | 3 (12.0%) |
| 6 to 18 Years | 10 (38.5%) | 11 (42.3%) |
| 19 to 25 Years | 5 (45.5%) | 6 (54.5%) |
| 25 to 34 Years | 22 (88.0%) | 13 (52.0%) |
| 35 to 44 Years | 0 (0.0%) | 23 (79.3%) |
| 45 to 54 Years | 25 (69.4%) | 25 (69.4%) |
| 55 to 64 Years | 17 (56.7%) | 20 (66.7%) |
| 65 to 74 Years | 19 (50.0%) | 32 (84.2%) |
| 75 Years and over | 33 (100.0%) | 29 (87.9%) |
| Total | 153 (60.5%) | 162 (64.0%) |
Disability Status by Sex by Age in Harrisonburg
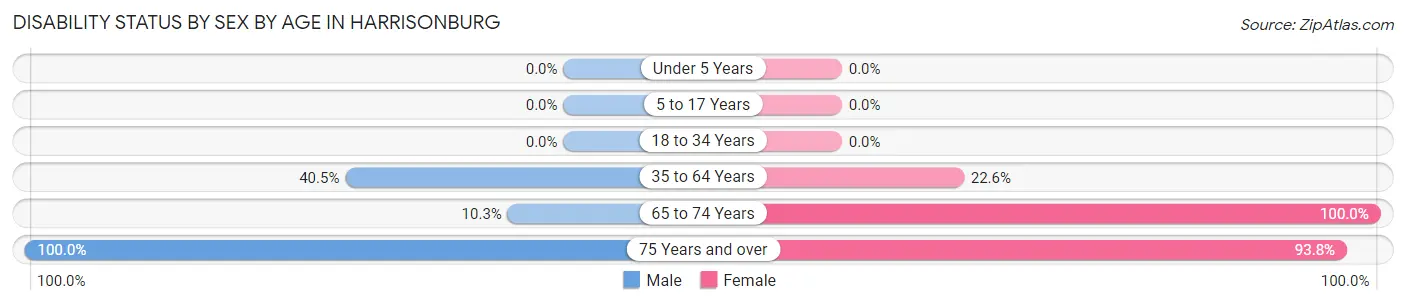
| Age Bracket | Male | Female |
| Under 5 Years | 0 (0.0%) | 0 (0.0%) |
| 5 to 17 Years | 0 (0.0%) | 0 (0.0%) |
| 18 to 34 Years | 0 (0.0%) | 0 (0.0%) |
| 35 to 64 Years | 17 (40.5%) | 12 (22.6%) |
| 65 to 74 Years | 3 (10.3%) | 9 (100.0%) |
| 75 Years and over | 1 (100.0%) | 30 (93.8%) |
Disability Class by Sex by Age in Harrisonburg
Disability Class: Hearing Difficulty
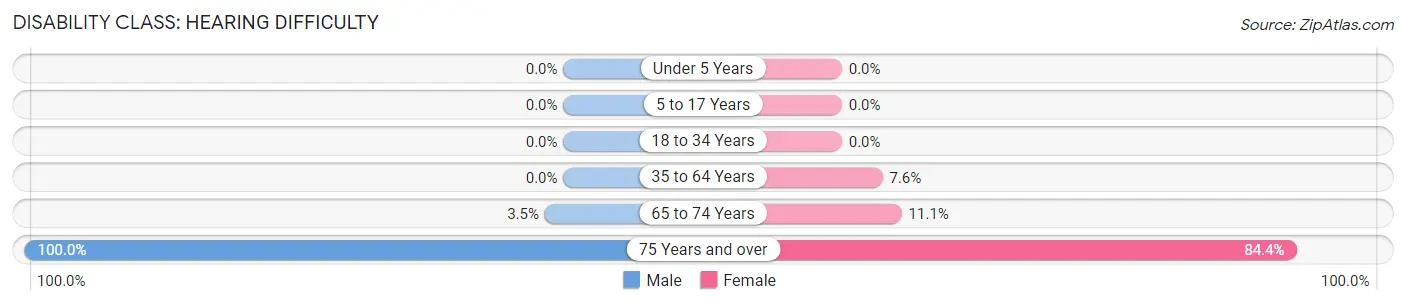
| Age Bracket | Male | Female |
| Under 5 Years | 0 (0.0%) | 0 (0.0%) |
| 5 to 17 Years | 0 (0.0%) | 0 (0.0%) |
| 18 to 34 Years | 0 (0.0%) | 0 (0.0%) |
| 35 to 64 Years | 0 (0.0%) | 4 (7.5%) |
| 65 to 74 Years | 1 (3.5%) | 1 (11.1%) |
| 75 Years and over | 1 (100.0%) | 27 (84.4%) |
Disability Class: Vision Difficulty
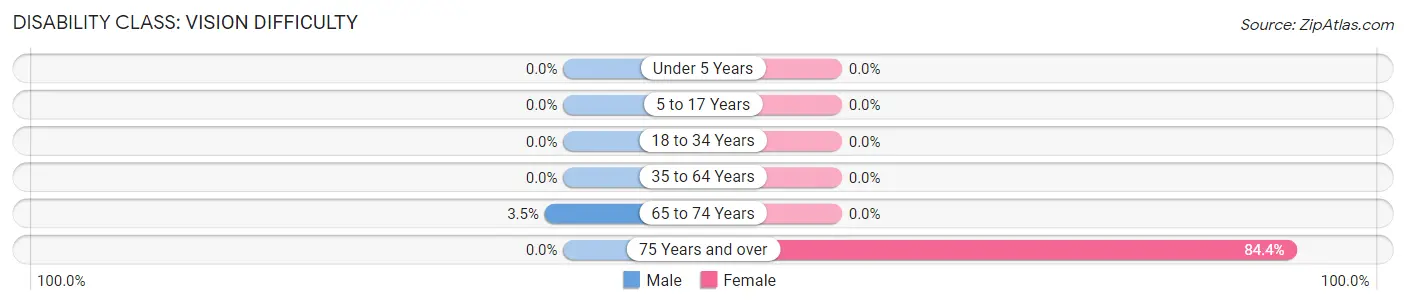
| Age Bracket | Male | Female |
| Under 5 Years | 0 (0.0%) | 0 (0.0%) |
| 5 to 17 Years | 0 (0.0%) | 0 (0.0%) |
| 18 to 34 Years | 0 (0.0%) | 0 (0.0%) |
| 35 to 64 Years | 0 (0.0%) | 0 (0.0%) |
| 65 to 74 Years | 1 (3.5%) | 0 (0.0%) |
| 75 Years and over | 0 (0.0%) | 27 (84.4%) |
Disability Class: Cognitive Difficulty
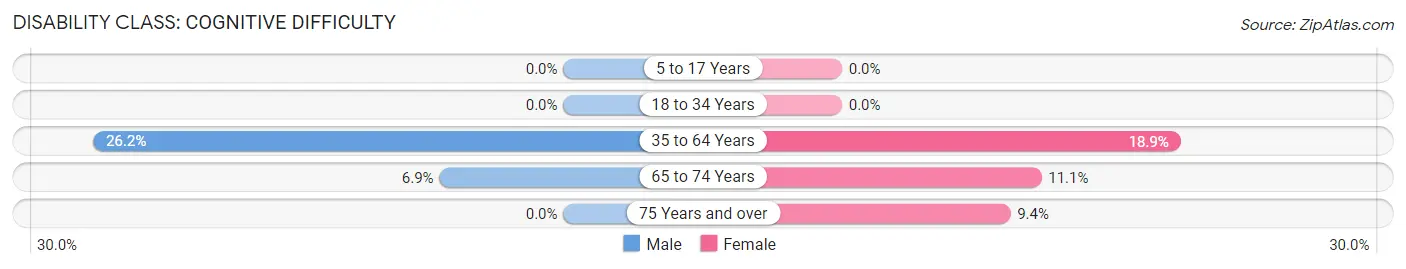
| Age Bracket | Male | Female |
| 5 to 17 Years | 0 (0.0%) | 0 (0.0%) |
| 18 to 34 Years | 0 (0.0%) | 0 (0.0%) |
| 35 to 64 Years | 11 (26.2%) | 10 (18.9%) |
| 65 to 74 Years | 2 (6.9%) | 1 (11.1%) |
| 75 Years and over | 0 (0.0%) | 3 (9.4%) |
Disability Class: Ambulatory Difficulty
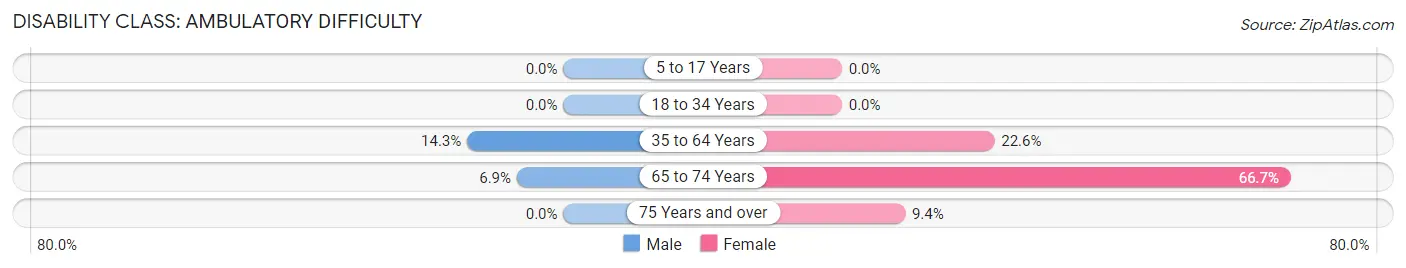
| Age Bracket | Male | Female |
| 5 to 17 Years | 0 (0.0%) | 0 (0.0%) |
| 18 to 34 Years | 0 (0.0%) | 0 (0.0%) |
| 35 to 64 Years | 6 (14.3%) | 12 (22.6%) |
| 65 to 74 Years | 2 (6.9%) | 6 (66.7%) |
| 75 Years and over | 0 (0.0%) | 3 (9.4%) |
Disability Class: Self-Care Difficulty
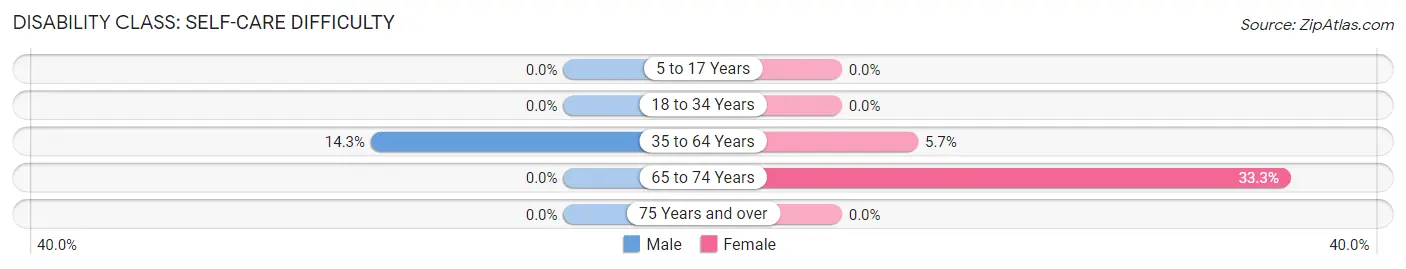
| Age Bracket | Male | Female |
| 5 to 17 Years | 0 (0.0%) | 0 (0.0%) |
| 18 to 34 Years | 0 (0.0%) | 0 (0.0%) |
| 35 to 64 Years | 6 (14.3%) | 3 (5.7%) |
| 65 to 74 Years | 0 (0.0%) | 3 (33.3%) |
| 75 Years and over | 0 (0.0%) | 0 (0.0%) |
Technology Access in Harrisonburg
Computing Device Access in Harrisonburg
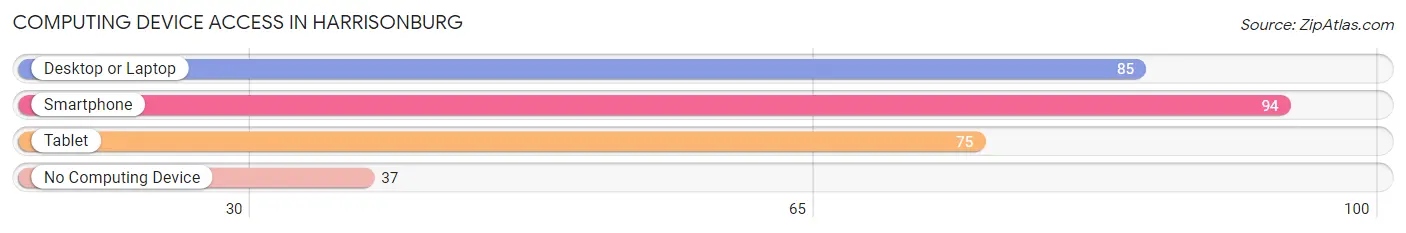
| Device Type | # Households | % Households |
| Desktop or Laptop | 85 | 61.6% |
| Smartphone | 94 | 68.1% |
| Tablet | 75 | 54.3% |
| No Computing Device | 37 | 26.8% |
| Total | 138 | 100.0% |
Internet Access in Harrisonburg
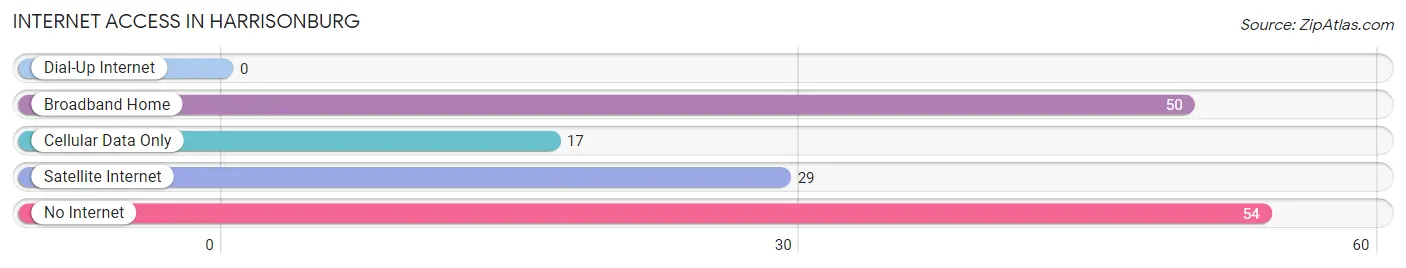
| Internet Type | # Households | % Households |
| Dial-Up Internet | 0 | 0.0% |
| Broadband Home | 50 | 36.2% |
| Cellular Data Only | 17 | 12.3% |
| Satellite Internet | 29 | 21.0% |
| No Internet | 54 | 39.1% |
| Total | 138 | 100.0% |
Harrisonburg Summary
Harrisonburg is a small town located in Catahoula Parish, Louisiana. It is situated on the banks of the Ouachita River, approximately 30 miles south of Monroe. The town was founded in 1845 and named after the Harrison family, who were among the first settlers in the area. The population of Harrisonburg was 1,845 in the 2010 census.
Geography
Harrisonburg is located in the northern part of Catahoula Parish, Louisiana. It is situated on the banks of the Ouachita River, approximately 30 miles south of Monroe. The town is surrounded by rolling hills and forests, and is located in the heart of the Louisiana Delta. The climate in Harrisonburg is humid subtropical, with hot summers and mild winters.
Economy
Harrisonburg’s economy is largely based on agriculture and timber. The town is home to several large farms, as well as a number of small businesses. The town is also home to a number of manufacturing plants, including a paper mill and a furniture factory. In addition, Harrisonburg is home to a number of retail stores, restaurants, and other businesses.
Demographics
According to the 2010 census, the population of Harrisonburg was 1,845. The racial makeup of the town was 79.3% White, 17.7% African American, 0.3% Native American, 0.2% Asian, 0.1% Pacific Islander, and 2.4% from other races. The median household income in Harrisonburg was $30,938, and the median family income was $37,813.
History
Harrisonburg was founded in 1845 by the Harrison family, who were among the first settlers in the area. The town was named after the family, and was originally a small farming community. In the late 19th century, the town began to grow as the timber industry began to expand in the area. The town was incorporated in 1891, and the population began to grow steadily. In the early 20th century, the town was home to a number of manufacturing plants, including a paper mill and a furniture factory.
In the late 20th century, Harrisonburg began to experience a decline in population as many of the manufacturing plants closed. However, the town has seen a resurgence in recent years, as new businesses have opened and the population has begun to grow again. Today, Harrisonburg is a small but vibrant town, with a strong sense of community and a rich history.
Common Questions
What is Per Capita Income in Harrisonburg?
Per Capita income in Harrisonburg is $47,008.
What is the Median Family Income in Harrisonburg?
Median Family Income in Harrisonburg is $70,875.
What is Inequality or Gini Index in Harrisonburg?
Inequality or Gini Index in Harrisonburg is 0.64.
What is the Total Population of Harrisonburg?
Total Population of Harrisonburg is 278.
What is the Total Male Population of Harrisonburg?
Total Male Population of Harrisonburg is 128.
What is the Total Female Population of Harrisonburg?
Total Female Population of Harrisonburg is 150.
What is the Ratio of Males per 100 Females in Harrisonburg?
There are 85.33 Males per 100 Females in Harrisonburg.
What is the Ratio of Females per 100 Males in Harrisonburg?
There are 117.19 Females per 100 Males in Harrisonburg.
What is the Median Population Age in Harrisonburg?
Median Population Age in Harrisonburg is 47.1 Years.
What is the Average Family Size in Harrisonburg
Average Family Size in Harrisonburg is 3.6 People.
What is the Average Household Size in Harrisonburg
Average Household Size in Harrisonburg is 1.9 People.
How Large is the Labor Force in Harrisonburg?
There are 115 People in the Labor Forcein in Harrisonburg.
What is the Percentage of People in the Labor Force in Harrisonburg?
48.5% of People are in the Labor Force in Harrisonburg.