Greenwood, LA Map & Demographics
Greenwood Map
Greenwood Overview
$42,213
PER CAPITA INCOME
$97,847
AVG FAMILY INCOME
$63,696
AVG HOUSEHOLD INCOME
2.2%
WAGE / INCOME GAP [ % ]
97.8¢/ $1
WAGE / INCOME GAP [ $ ]
0.45
INEQUALITY / GINI INDEX
3,149
TOTAL POPULATION
1,592
MALE POPULATION
1,557
FEMALE POPULATION
102.25
MALES / 100 FEMALES
97.80
FEMALES / 100 MALES
53.2
MEDIAN AGE
2.6
AVG FAMILY SIZE
2.2
AVG HOUSEHOLD SIZE
1,644
LABOR FORCE [ PEOPLE ]
60.1%
PERCENT IN LABOR FORCE
0.4%
UNEMPLOYMENT RATE
Greenwood Zip Codes
Greenwood Area Codes
Income in Greenwood
Income Overview in Greenwood
Per Capita Income in Greenwood is $42,213, while median incomes of families and households are $97,847 and $63,696 respectively.
| Characteristic | Number | Measure |
| Per Capita Income | 3,149 | $42,213 |
| Median Family Income | 1,034 | $97,847 |
| Mean Family Income | 1,034 | $117,101 |
| Median Household Income | 1,430 | $63,696 |
| Mean Household Income | 1,430 | $94,680 |
| Income Deficit | 1,034 | $0 |
| Wage / Income Gap (%) | 3,149 | 2.22% |
| Wage / Income Gap ($) | 3,149 | 97.78¢ per $1 |
| Gini / Inequality Index | 3,149 | 0.45 |
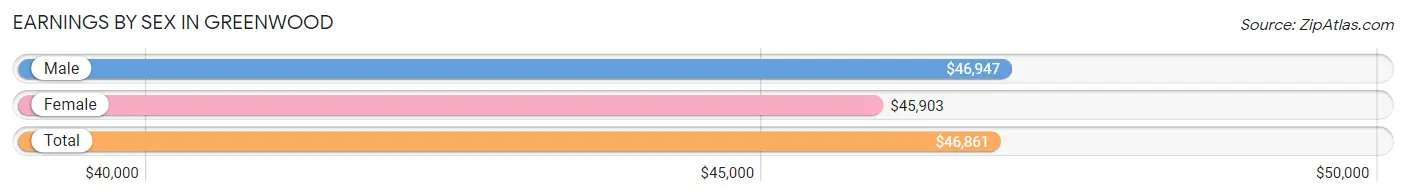
Earnings by Sex in Greenwood
Average Earnings in Greenwood are $46,861, $46,947 for men and $45,903 for women, a difference of 2.2%.
| Sex | Number | Average Earnings |
| Male | 1,036 (61.4%) | $46,947 |
| Female | 651 (38.6%) | $45,903 |
| Total | 1,687 (100.0%) | $46,861 |
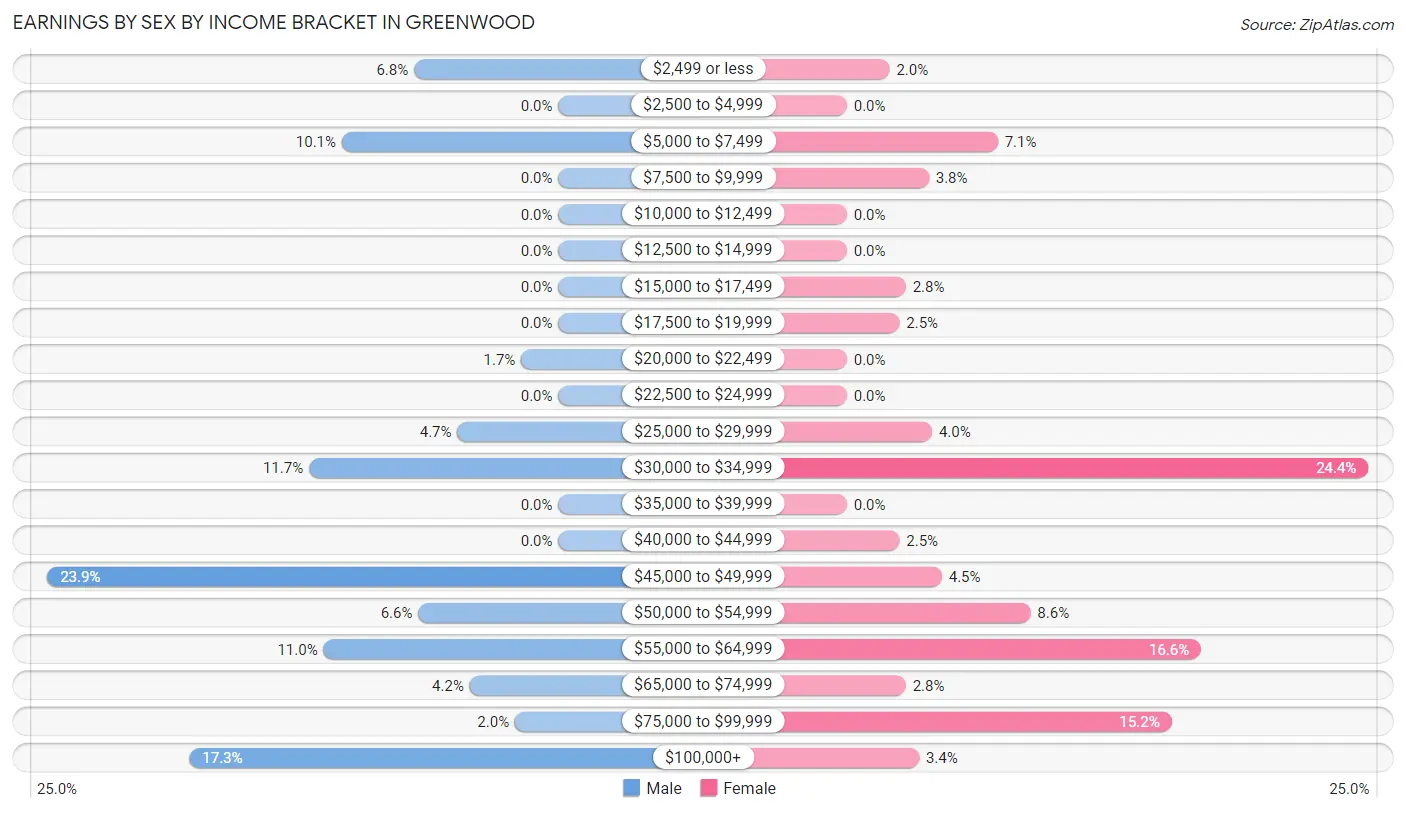
Earnings by Sex by Income Bracket in Greenwood
The most common earnings brackets in Greenwood are $45,000 to $49,999 for men (248 | 23.9%) and $30,000 to $34,999 for women (159 | 24.4%).
| Income | Male | Female |
| $2,499 or less | 70 (6.8%) | 13 (2.0%) |
| $2,500 to $4,999 | 0 (0.0%) | 0 (0.0%) |
| $5,000 to $7,499 | 105 (10.1%) | 46 (7.1%) |
| $7,500 to $9,999 | 0 (0.0%) | 25 (3.8%) |
| $10,000 to $12,499 | 0 (0.0%) | 0 (0.0%) |
| $12,500 to $14,999 | 0 (0.0%) | 0 (0.0%) |
| $15,000 to $17,499 | 0 (0.0%) | 18 (2.8%) |
| $17,500 to $19,999 | 0 (0.0%) | 16 (2.5%) |
| $20,000 to $22,499 | 18 (1.7%) | 0 (0.0%) |
| $22,500 to $24,999 | 0 (0.0%) | 0 (0.0%) |
| $25,000 to $29,999 | 49 (4.7%) | 26 (4.0%) |
| $30,000 to $34,999 | 121 (11.7%) | 159 (24.4%) |
| $35,000 to $39,999 | 0 (0.0%) | 0 (0.0%) |
| $40,000 to $44,999 | 0 (0.0%) | 16 (2.5%) |
| $45,000 to $49,999 | 248 (23.9%) | 29 (4.4%) |
| $50,000 to $54,999 | 68 (6.6%) | 56 (8.6%) |
| $55,000 to $64,999 | 114 (11.0%) | 108 (16.6%) |
| $65,000 to $74,999 | 43 (4.2%) | 18 (2.8%) |
| $75,000 to $99,999 | 21 (2.0%) | 99 (15.2%) |
| $100,000+ | 179 (17.3%) | 22 (3.4%) |
| Total | 1,036 (100.0%) | 651 (100.0%) |
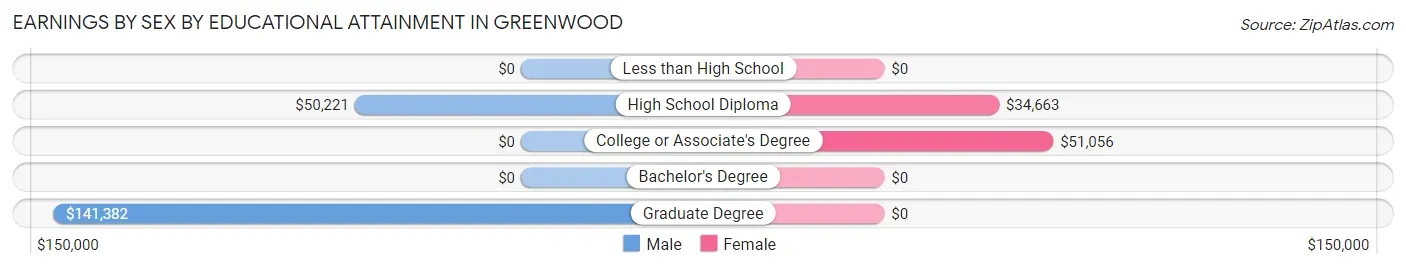
Earnings by Sex by Educational Attainment in Greenwood
Average earnings in Greenwood are $47,343 for men and $46,111 for women, a difference of 2.6%. Men with an educational attainment of graduate degree enjoy the highest average annual earnings of $141,382, while those with high school diploma education earn the least with $50,221. Women with an educational attainment of college or associate's degree earn the most with the average annual earnings of $51,056, while those with high school diploma education have the smallest earnings of $34,663.
| Educational Attainment | Male Income | Female Income |
| Less than High School | - | - |
| High School Diploma | $50,221 | $34,663 |
| College or Associate's Degree | - | - |
| Bachelor's Degree | - | - |
| Graduate Degree | $141,382 | $0 |
| Total | $47,343 | $46,111 |
Family Income in Greenwood
Family Income Brackets in Greenwood
According to the Greenwood family income data, there are 237 families falling into the $35,000 to $49,999 income range, which is the most common income bracket and makes up 22.9% of all families.
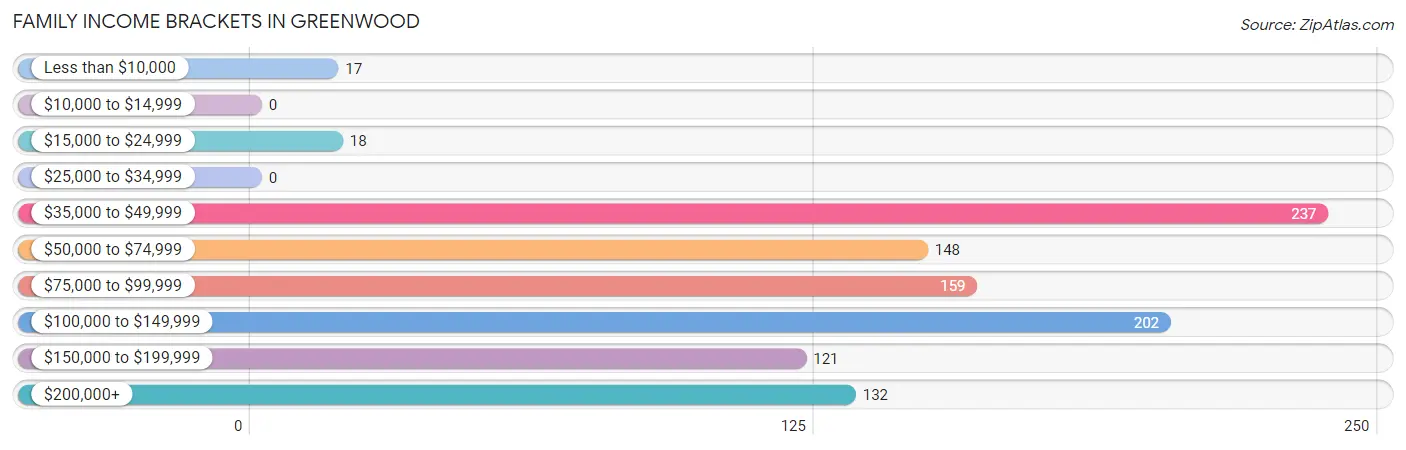
| Income Bracket | # Families | % Families |
| Less than $10,000 | 17 | 1.6% |
| $10,000 to $14,999 | 0 | 0.0% |
| $15,000 to $24,999 | 18 | 1.7% |
| $25,000 to $34,999 | 0 | 0.0% |
| $35,000 to $49,999 | 237 | 22.9% |
| $50,000 to $74,999 | 148 | 14.3% |
| $75,000 to $99,999 | 159 | 15.4% |
| $100,000 to $149,999 | 202 | 19.5% |
| $150,000 to $199,999 | 121 | 11.7% |
| $200,000+ | 132 | 12.8% |
Family Income by Famaliy Size in Greenwood
4-person families (77 | 7.4%) account for the highest median family income in Greenwood with $131,597 per family, while 2-person families (574 | 55.5%) have the highest median income of $49,306 per family member.
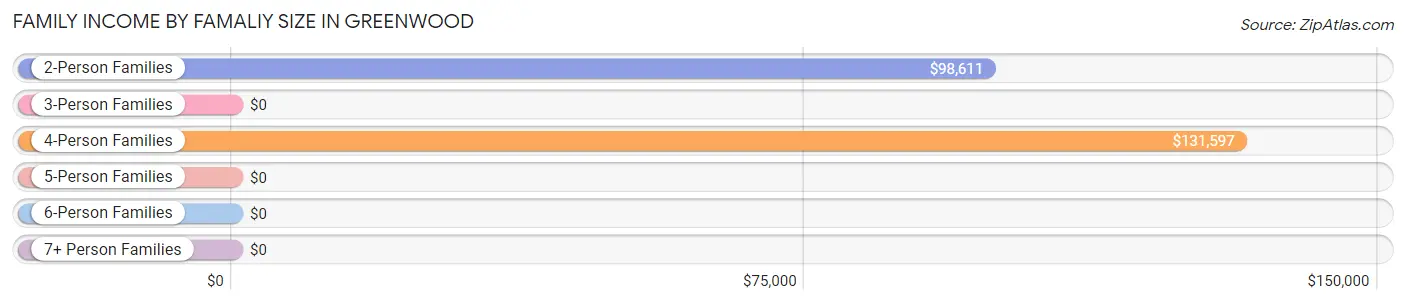
| Income Bracket | # Families | Median Income |
| 2-Person Families | 574 (55.5%) | $98,611 |
| 3-Person Families | 328 (31.7%) | $0 |
| 4-Person Families | 77 (7.4%) | $131,597 |
| 5-Person Families | 55 (5.3%) | $0 |
| 6-Person Families | 0 (0.0%) | $0 |
| 7+ Person Families | 0 (0.0%) | $0 |
| Total | 1,034 (100.0%) | $97,847 |
Family Income by Number of Earners in Greenwood
The median family income in Greenwood is $97,847, with families comprising 3+ earners (107) having the highest median family income of $224,160, while families with no earners (192) have the lowest median family income of $49,250, accounting for 10.3% and 18.6% of families, respectively.
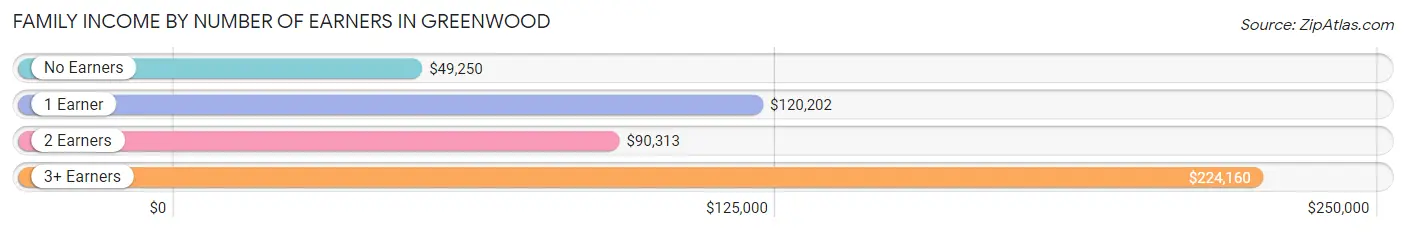
| Number of Earners | # Families | Median Income |
| No Earners | 192 (18.6%) | $49,250 |
| 1 Earner | 263 (25.4%) | $120,202 |
| 2 Earners | 472 (45.7%) | $90,313 |
| 3+ Earners | 107 (10.3%) | $224,160 |
| Total | 1,034 (100.0%) | $97,847 |
Household Income in Greenwood
Household Income Brackets in Greenwood
With 297 households falling in the category, the $35,000 to $49,999 income range is the most frequent in Greenwood, accounting for 20.8% of all households. In contrast, only 11 households (0.8%) fall into the $10,000 to $14,999 income bracket, making it the least populous group.
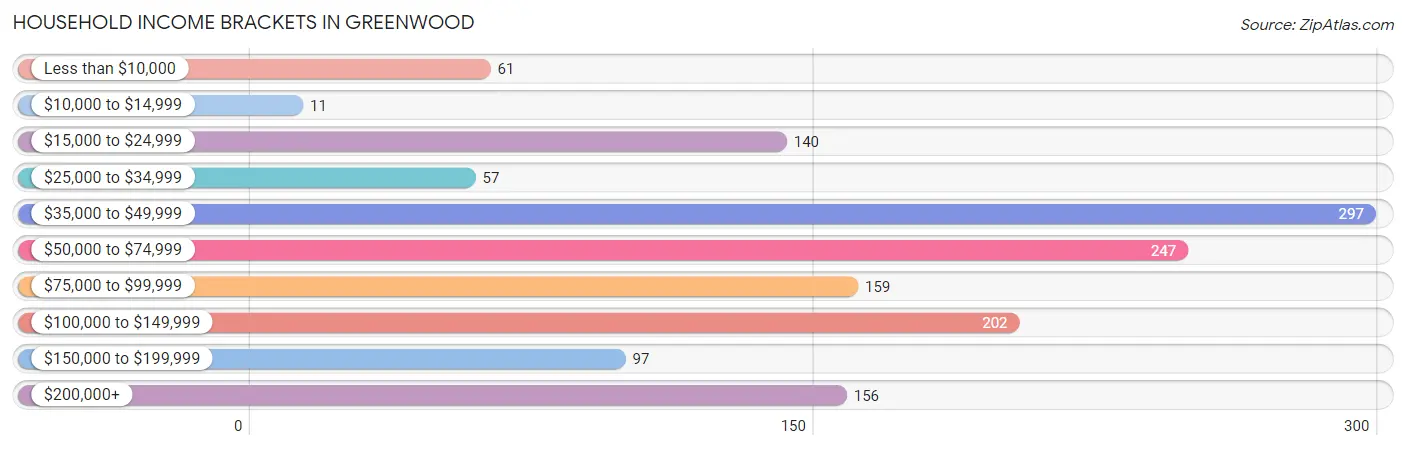
| Income Bracket | # Households | % Households |
| Less than $10,000 | 61 | 4.3% |
| $10,000 to $14,999 | 11 | 0.8% |
| $15,000 to $24,999 | 140 | 9.8% |
| $25,000 to $34,999 | 57 | 4.0% |
| $35,000 to $49,999 | 297 | 20.8% |
| $50,000 to $74,999 | 247 | 17.3% |
| $75,000 to $99,999 | 159 | 11.1% |
| $100,000 to $149,999 | 202 | 14.1% |
| $150,000 to $199,999 | 97 | 6.8% |
| $200,000+ | 156 | 10.9% |
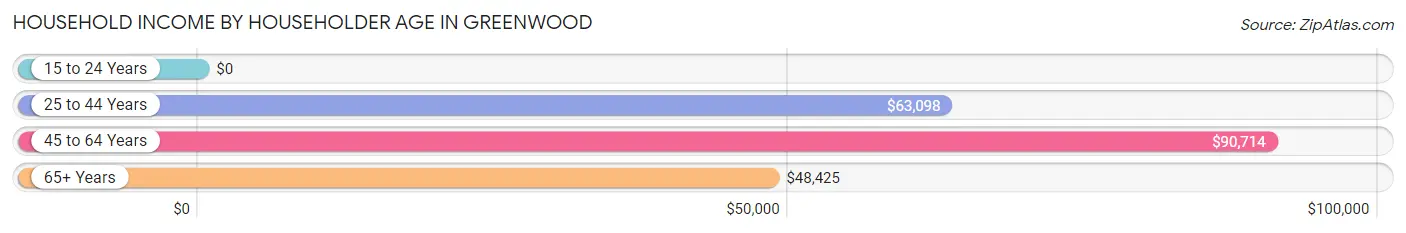
Household Income by Householder Age in Greenwood
The median household income in Greenwood is $63,696, with the highest median household income of $90,714 found in the 45 to 64 years age bracket for the primary householder. A total of 580 households (40.6%) fall into this category.
| Income Bracket | # Households | Median Income |
| 15 to 24 Years | 0 (0.0%) | $0 |
| 25 to 44 Years | 289 (20.2%) | $63,098 |
| 45 to 64 Years | 580 (40.6%) | $90,714 |
| 65+ Years | 561 (39.2%) | $48,425 |
| Total | 1,430 (100.0%) | $63,696 |
Poverty in Greenwood
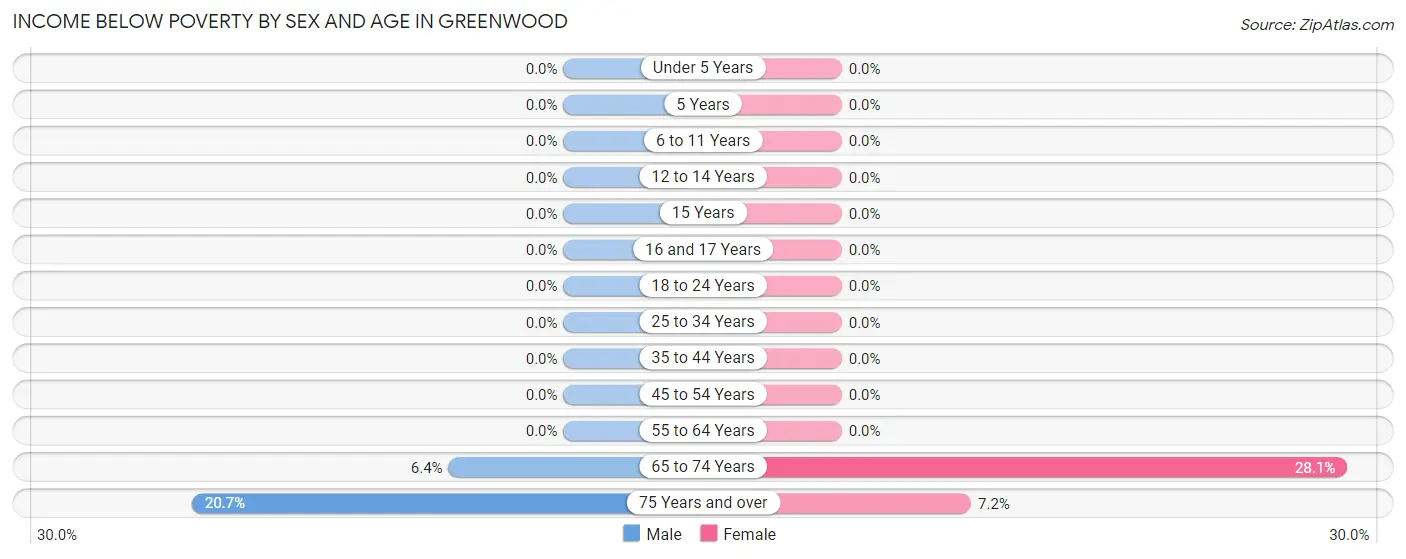
Income Below Poverty by Sex and Age in Greenwood
With 2.1% poverty level for males and 5.8% for females among the residents of Greenwood, 75 year old and over males and 65 to 74 year old females are the most vulnerable to poverty, with 18 males (20.7%) and 74 females (28.1%) in their respective age groups living below the poverty level.
| Age Bracket | Male | Female |
| Under 5 Years | 0 (0.0%) | 0 (0.0%) |
| 5 Years | 0 (0.0%) | 0 (0.0%) |
| 6 to 11 Years | 0 (0.0%) | 0 (0.0%) |
| 12 to 14 Years | 0 (0.0%) | 0 (0.0%) |
| 15 Years | 0 (0.0%) | 0 (0.0%) |
| 16 and 17 Years | 0 (0.0%) | 0 (0.0%) |
| 18 to 24 Years | 0 (0.0%) | 0 (0.0%) |
| 25 to 34 Years | 0 (0.0%) | 0 (0.0%) |
| 35 to 44 Years | 0 (0.0%) | 0 (0.0%) |
| 45 to 54 Years | 0 (0.0%) | 0 (0.0%) |
| 55 to 64 Years | 0 (0.0%) | 0 (0.0%) |
| 65 to 74 Years | 16 (6.4%) | 74 (28.1%) |
| 75 Years and over | 18 (20.7%) | 17 (7.2%) |
| Total | 34 (2.1%) | 91 (5.8%) |
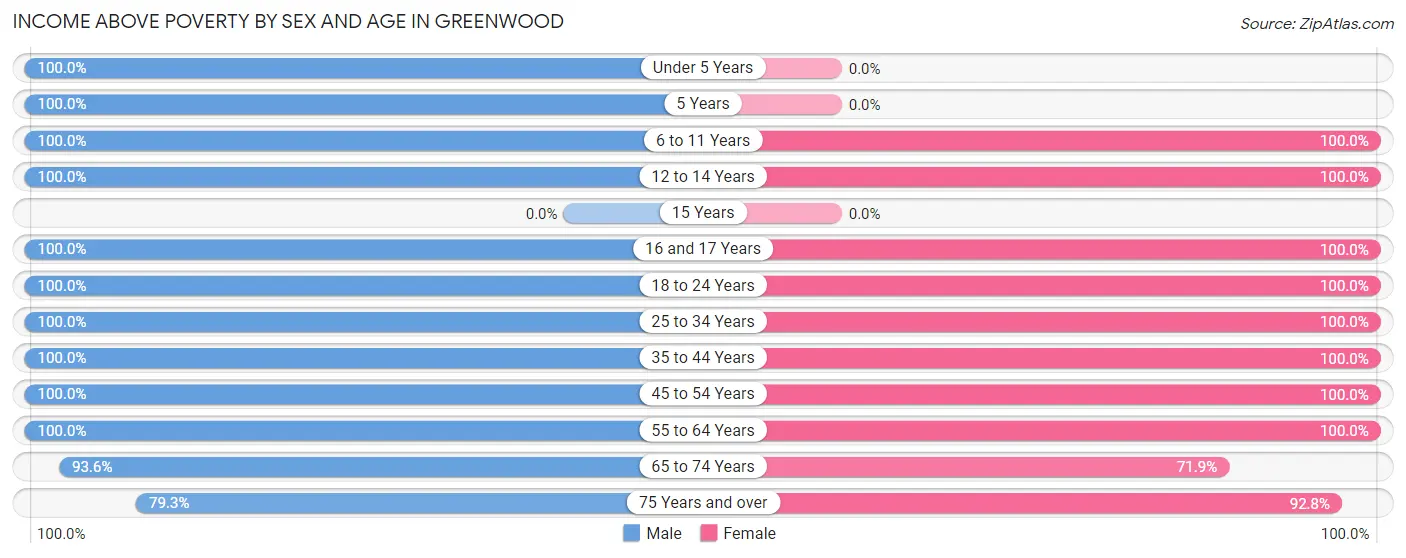
Income Above Poverty by Sex and Age in Greenwood
According to the poverty statistics in Greenwood, males aged under 5 years and females aged 6 to 11 years are the age groups that are most secure financially, with 100.0% of males and 100.0% of females in these age groups living above the poverty line.
| Age Bracket | Male | Female |
| Under 5 Years | 109 (100.0%) | 0 (0.0%) |
| 5 Years | 24 (100.0%) | 0 (0.0%) |
| 6 to 11 Years | 41 (100.0%) | 130 (100.0%) |
| 12 to 14 Years | 34 (100.0%) | 76 (100.0%) |
| 15 Years | 0 (0.0%) | 0 (0.0%) |
| 16 and 17 Years | 51 (100.0%) | 66 (100.0%) |
| 18 to 24 Years | 29 (100.0%) | 49 (100.0%) |
| 25 to 34 Years | 223 (100.0%) | 62 (100.0%) |
| 35 to 44 Years | 174 (100.0%) | 200 (100.0%) |
| 45 to 54 Years | 235 (100.0%) | 205 (100.0%) |
| 55 to 64 Years | 335 (100.0%) | 270 (100.0%) |
| 65 to 74 Years | 234 (93.6%) | 189 (71.9%) |
| 75 Years and over | 69 (79.3%) | 219 (92.8%) |
| Total | 1,558 (97.9%) | 1,466 (94.2%) |
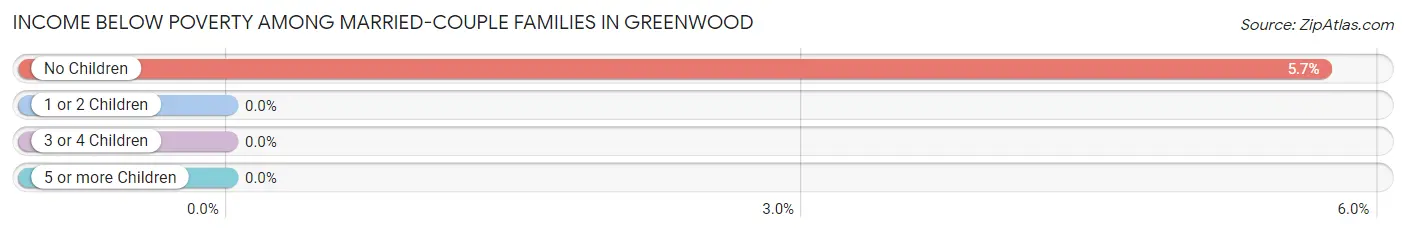
Income Below Poverty Among Married-Couple Families in Greenwood
The poverty statistics for married-couple families in Greenwood show that 3.8% or 35 of the total 931 families live below the poverty line. Families with no children have the highest poverty rate of 5.7%, comprising of 35 families. On the other hand, families with 1 or 2 children have the lowest poverty rate of 0.0%, which includes 0 families.
| Children | Above Poverty | Below Poverty |
| No Children | 578 (94.3%) | 35 (5.7%) |
| 1 or 2 Children | 295 (100.0%) | 0 (0.0%) |
| 3 or 4 Children | 23 (100.0%) | 0 (0.0%) |
| 5 or more Children | 0 (0.0%) | 0 (0.0%) |
| Total | 896 (96.2%) | 35 (3.8%) |
Income Below Poverty Among Single-Parent Households in Greenwood
| Children | Single Father | Single Mother |
| No Children | 0 (0.0%) | 0 (0.0%) |
| 1 or 2 Children | 0 (0.0%) | 0 (0.0%) |
| 3 or 4 Children | 0 (0.0%) | 0 (0.0%) |
| 5 or more Children | 0 (0.0%) | 0 (0.0%) |
| Total | 0 (0.0%) | 0 (0.0%) |
Income Below Poverty Among Married-Couple vs Single-Parent Households in Greenwood
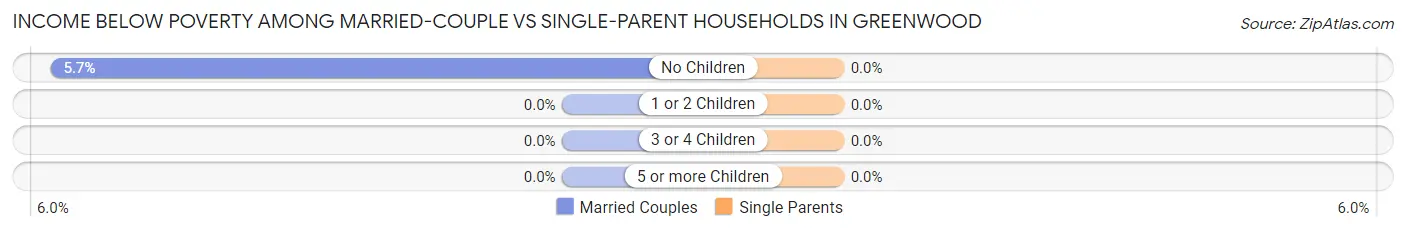
| Children | Married-Couple Families | Single-Parent Households |
| No Children | 35 (5.7%) | 0 (0.0%) |
| 1 or 2 Children | 0 (0.0%) | 0 (0.0%) |
| 3 or 4 Children | 0 (0.0%) | 0 (0.0%) |
| 5 or more Children | 0 (0.0%) | 0 (0.0%) |
| Total | 35 (3.8%) | 0 (0.0%) |
Race in Greenwood
The most populous races in Greenwood are White / Caucasian (1,993 | 63.3%), Black / African American (1,035 | 32.9%), and Hispanic or Latino (247 | 7.8%).
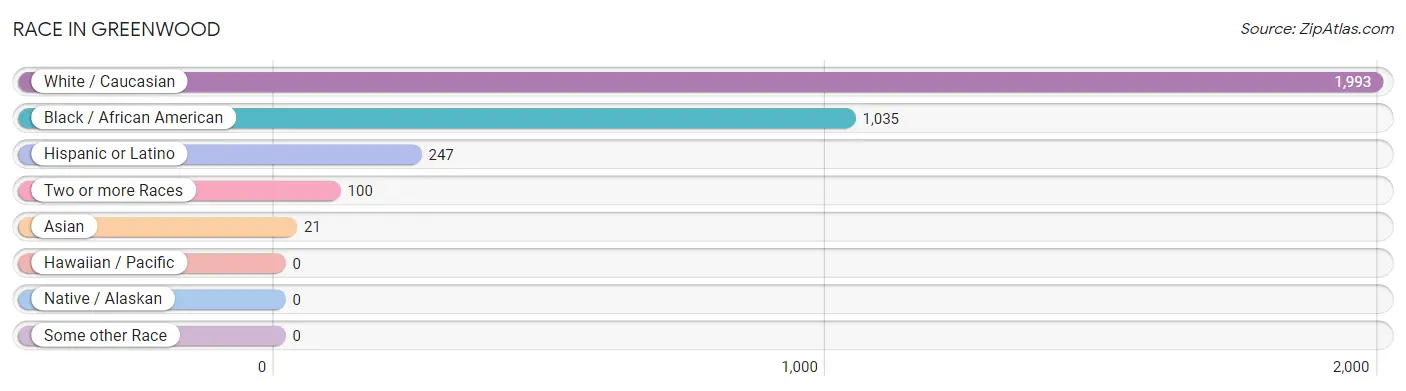
| Race | # Population | % Population |
| Asian | 21 | 0.7% |
| Black / African American | 1,035 | 32.9% |
| Hawaiian / Pacific | 0 | 0.0% |
| Hispanic or Latino | 247 | 7.8% |
| Native / Alaskan | 0 | 0.0% |
| White / Caucasian | 1,993 | 63.3% |
| Two or more Races | 100 | 3.2% |
| Some other Race | 0 | 0.0% |
| Total | 3,149 | 100.0% |
Ancestry in Greenwood
The most populous ancestries reported in Greenwood are American (456 | 14.5%), English (239 | 7.6%), Irish (217 | 6.9%), Mexican (196 | 6.2%), and German (114 | 3.6%), together accounting for 38.8% of all Greenwood residents.
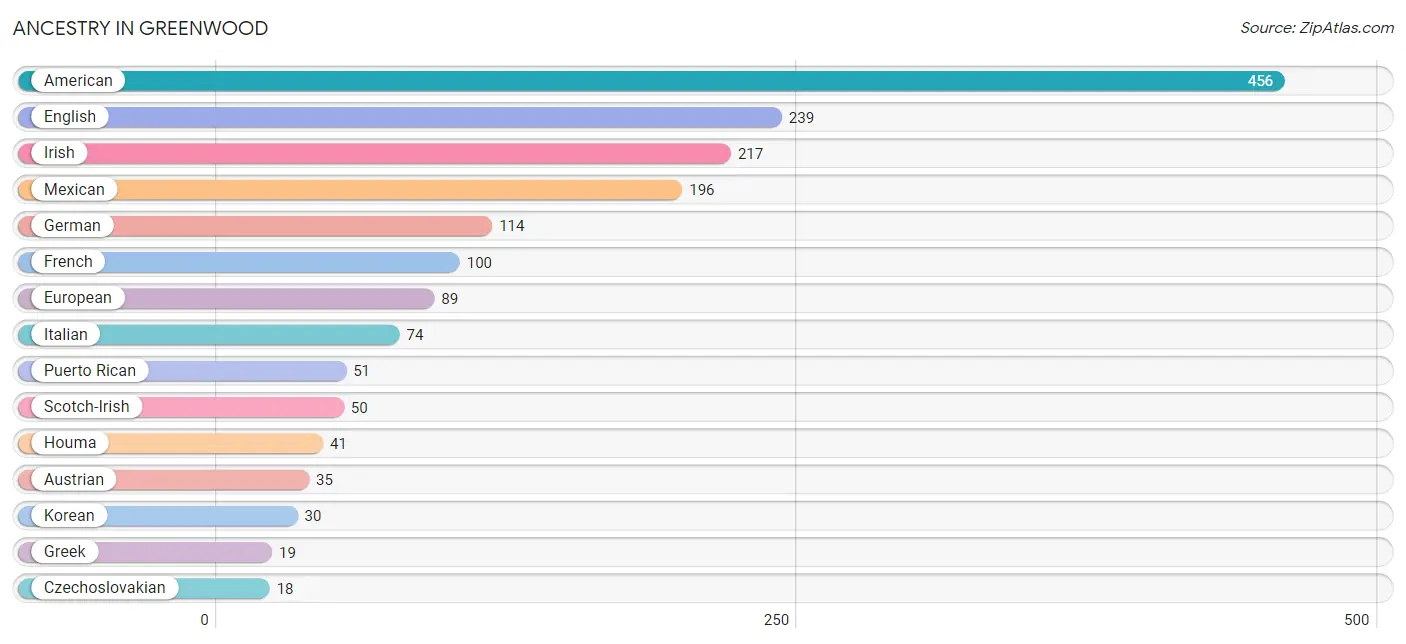
| Ancestry | # Population | % Population |
| American | 456 | 14.5% |
| Austrian | 35 | 1.1% |
| Czechoslovakian | 18 | 0.6% |
| English | 239 | 7.6% |
| European | 89 | 2.8% |
| French | 100 | 3.2% |
| German | 114 | 3.6% |
| Greek | 19 | 0.6% |
| Houma | 41 | 1.3% |
| Irish | 217 | 6.9% |
| Italian | 74 | 2.4% |
| Korean | 30 | 0.9% |
| Mexican | 196 | 6.2% |
| Puerto Rican | 51 | 1.6% |
| Scotch-Irish | 50 | 1.6% |
| Swedish | 18 | 0.6% |
| Welsh | 17 | 0.5% | View All 17 Rows |
Immigrants in Greenwood

| Immigration Origin | # Population | % Population | View All 0 Rows |
Sex and Age in Greenwood
Sex and Age in Greenwood
The most populous age groups in Greenwood are 60 to 64 Years (223 | 14.0%) for men and 65 to 69 Years (222 | 14.3%) for women.
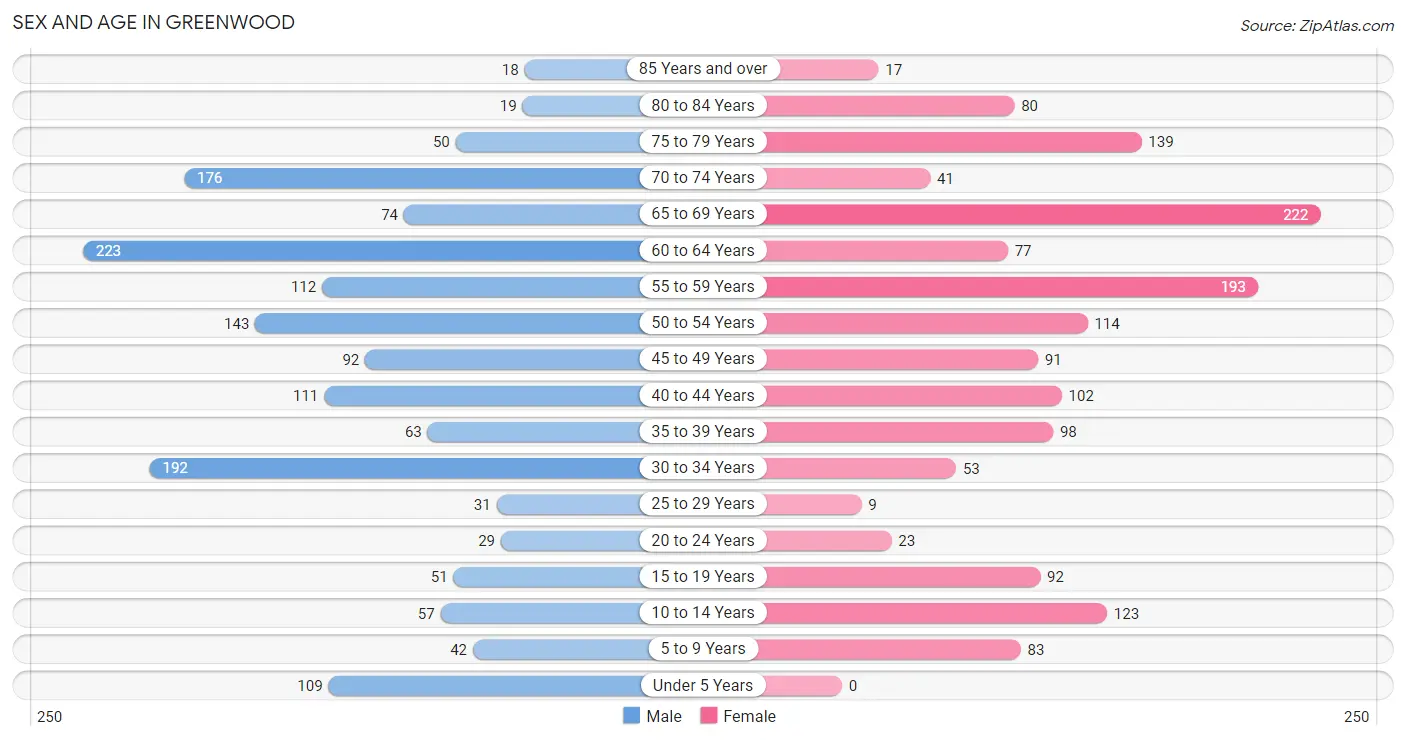
| Age Bracket | Male | Female |
| Under 5 Years | 109 (6.9%) | 0 (0.0%) |
| 5 to 9 Years | 42 (2.6%) | 83 (5.3%) |
| 10 to 14 Years | 57 (3.6%) | 123 (7.9%) |
| 15 to 19 Years | 51 (3.2%) | 92 (5.9%) |
| 20 to 24 Years | 29 (1.8%) | 23 (1.5%) |
| 25 to 29 Years | 31 (1.9%) | 9 (0.6%) |
| 30 to 34 Years | 192 (12.1%) | 53 (3.4%) |
| 35 to 39 Years | 63 (4.0%) | 98 (6.3%) |
| 40 to 44 Years | 111 (7.0%) | 102 (6.6%) |
| 45 to 49 Years | 92 (5.8%) | 91 (5.8%) |
| 50 to 54 Years | 143 (9.0%) | 114 (7.3%) |
| 55 to 59 Years | 112 (7.0%) | 193 (12.4%) |
| 60 to 64 Years | 223 (14.0%) | 77 (5.0%) |
| 65 to 69 Years | 74 (4.6%) | 222 (14.3%) |
| 70 to 74 Years | 176 (11.1%) | 41 (2.6%) |
| 75 to 79 Years | 50 (3.1%) | 139 (8.9%) |
| 80 to 84 Years | 19 (1.2%) | 80 (5.1%) |
| 85 Years and over | 18 (1.1%) | 17 (1.1%) |
| Total | 1,592 (100.0%) | 1,557 (100.0%) |
Families and Households in Greenwood
Median Family Size in Greenwood
The median family size in Greenwood is 2.64 persons per family, with married-couple families (931 | 90.0%) accounting for the largest median family size of 2.68 persons per family. On the other hand, single female/mother families (79 | 7.6%) represent the smallest median family size with 2.20 persons per family.
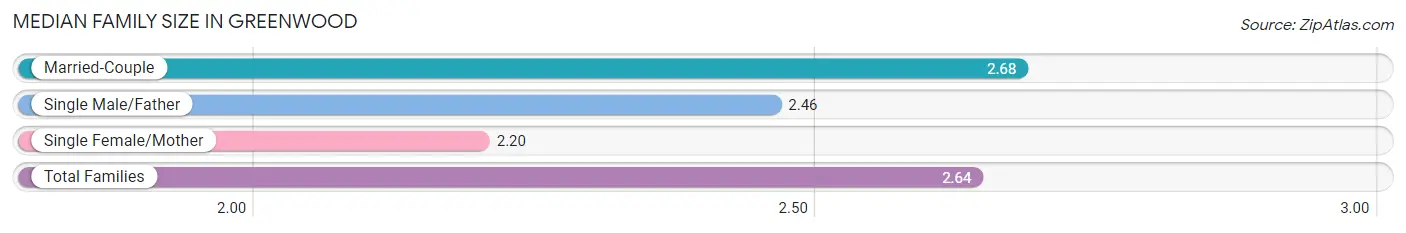
| Family Type | # Families | Family Size |
| Married-Couple | 931 (90.0%) | 2.68 |
| Single Male/Father | 24 (2.3%) | 2.46 |
| Single Female/Mother | 79 (7.6%) | 2.20 |
| Total Families | 1,034 (100.0%) | 2.64 |
Median Household Size in Greenwood
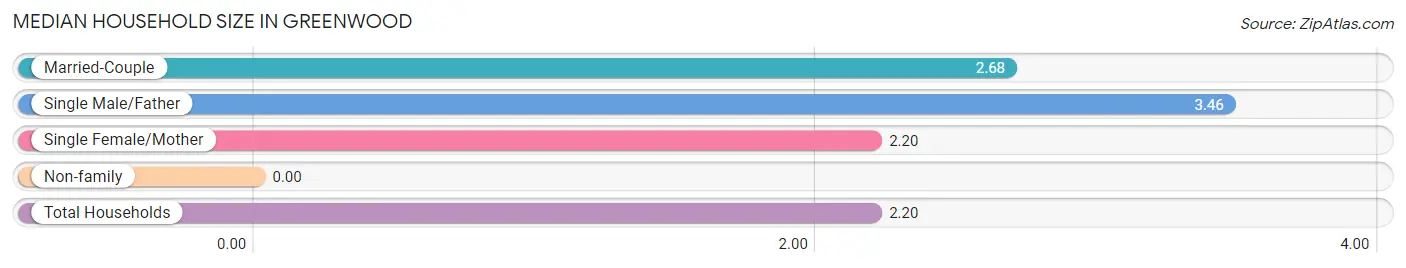
| Household Type | # Households | Household Size |
| Married-Couple | 931 (65.1%) | 2.68 |
| Single Male/Father | 24 (1.7%) | 3.46 |
| Single Female/Mother | 79 (5.5%) | 2.20 |
| Non-family | 396 (27.7%) | - |
| Total Households | 1,430 (100.0%) | 2.20 |
Household Size by Marriage Status in Greenwood
Out of a total of 1,430 households in Greenwood, 1,034 (72.3%) are family households, while 396 (27.7%) are nonfamily households. The most numerous type of family households are 2-person households, comprising 550, and the most common type of nonfamily households are 1-person households, comprising 396.
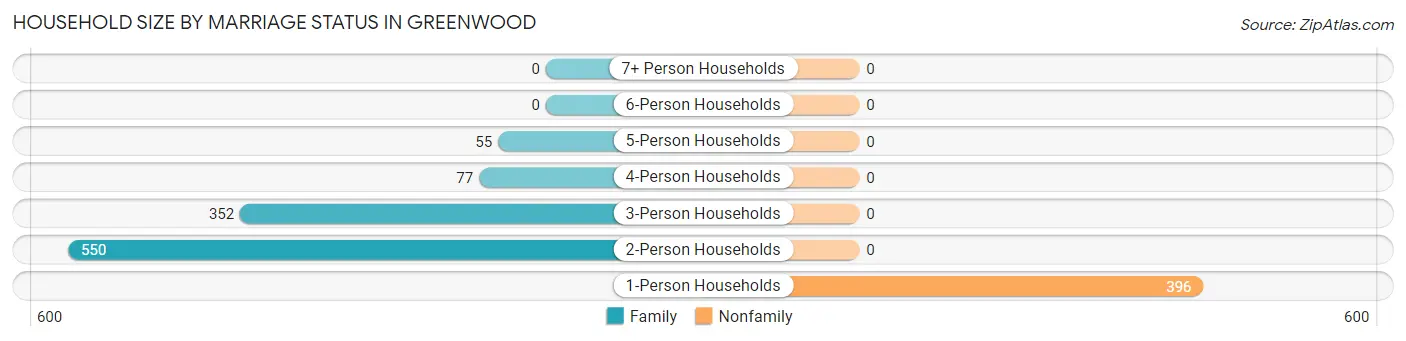
| Household Size | Family Households | Nonfamily Households |
| 1-Person Households | - | 396 (27.7%) |
| 2-Person Households | 550 (38.5%) | 0 (0.0%) |
| 3-Person Households | 352 (24.6%) | 0 (0.0%) |
| 4-Person Households | 77 (5.4%) | 0 (0.0%) |
| 5-Person Households | 55 (3.8%) | 0 (0.0%) |
| 6-Person Households | 0 (0.0%) | 0 (0.0%) |
| 7+ Person Households | 0 (0.0%) | 0 (0.0%) |
| Total | 1,034 (72.3%) | 396 (27.7%) |
Female Fertility in Greenwood
Fertility by Age in Greenwood
Average fertility rate in Greenwood is 109.0 births per 1,000 women. Women in the age bracket of 20 to 34 years have the highest fertility rate with 318.0 births per 1,000 women. Women in the age bracket of 20 to 34 years acount for 52.9% of all women with births.
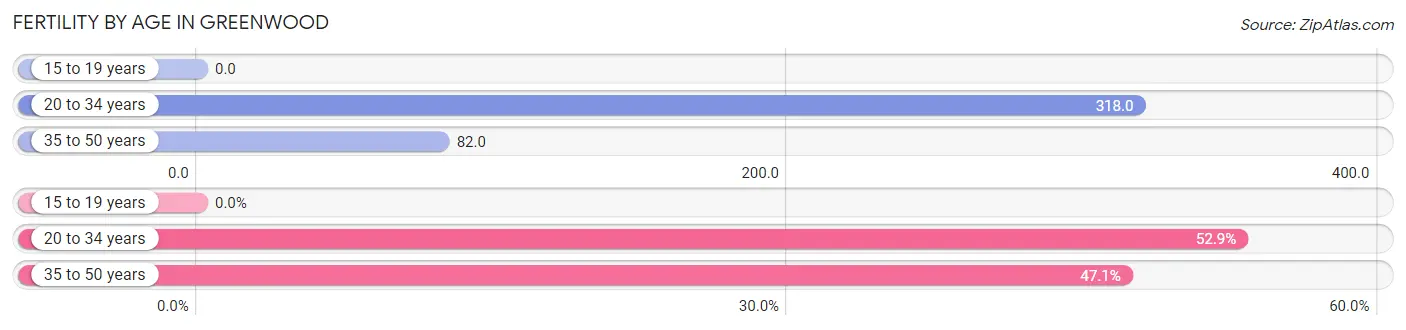
| Age Bracket | Women with Births | Births / 1,000 Women |
| 15 to 19 years | 0 (0.0%) | 0.0 |
| 20 to 34 years | 27 (52.9%) | 318.0 |
| 35 to 50 years | 24 (47.1%) | 82.0 |
| Total | 51 (100.0%) | 109.0 |
Fertility by Age by Marriage Status in Greenwood
52.9% of women with births (51) in Greenwood are married. The highest percentage of unmarried women with births falls into 35 to 50 years age bracket with 100.0% of them unmarried at the time of birth, while the lowest percentage of unmarried women with births belong to 20 to 34 years age bracket with 0.0% of them unmarried.
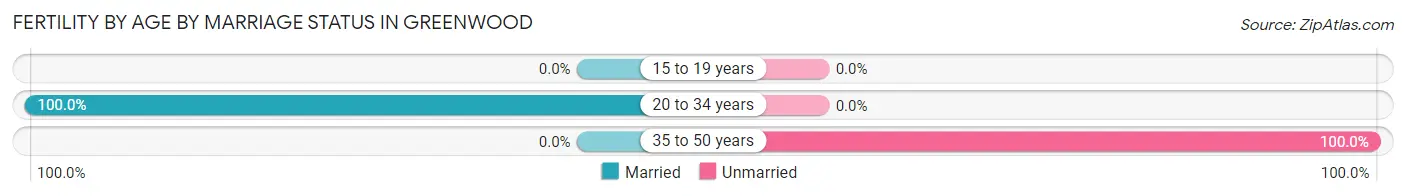
| Age Bracket | Married | Unmarried |
| 15 to 19 years | 0 (0.0%) | 0 (0.0%) |
| 20 to 34 years | 27 (100.0%) | 0 (0.0%) |
| 35 to 50 years | 0 (0.0%) | 24 (100.0%) |
| Total | 27 (52.9%) | 24 (47.1%) |
Fertility by Education in Greenwood
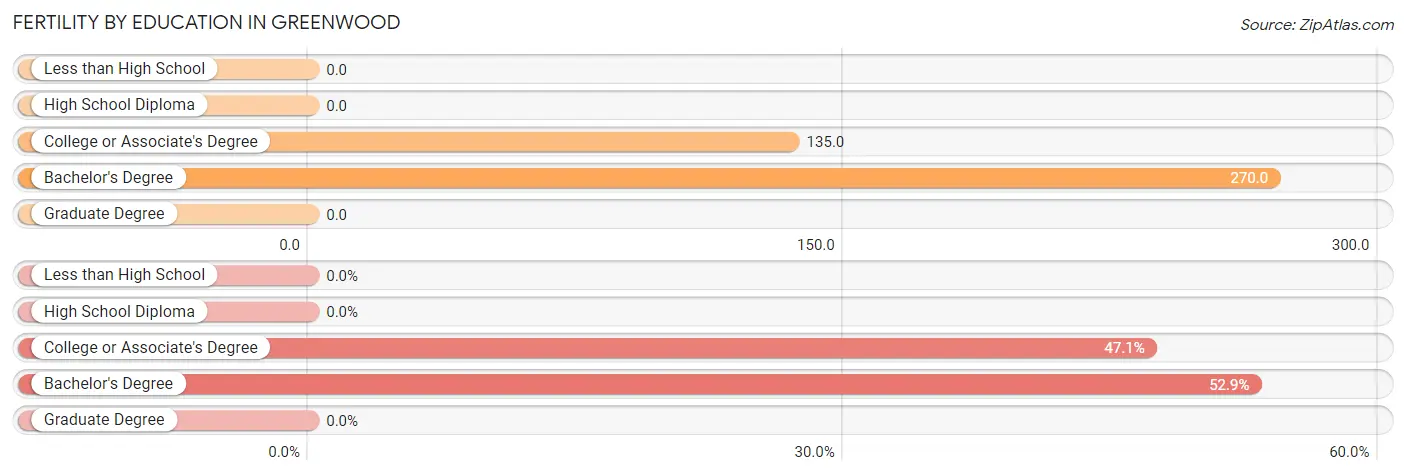
| Educational Attainment | Women with Births | Births / 1,000 Women |
| Less than High School | 0 (0.0%) | 0.0 |
| High School Diploma | 0 (0.0%) | 0.0 |
| College or Associate's Degree | 24 (47.1%) | 135.0 |
| Bachelor's Degree | 27 (52.9%) | 270.0 |
| Graduate Degree | 0 (0.0%) | 0.0 |
| Total | 51 (100.0%) | 109.0 |
Fertility by Education by Marriage Status in Greenwood
47.1% of women with births in Greenwood are unmarried. Women with the educational attainment of bachelor's degree are most likely to be married with 100.0% of them married at childbirth, while women with the educational attainment of college or associate's degree are least likely to be married with 100.0% of them unmarried at childbirth.
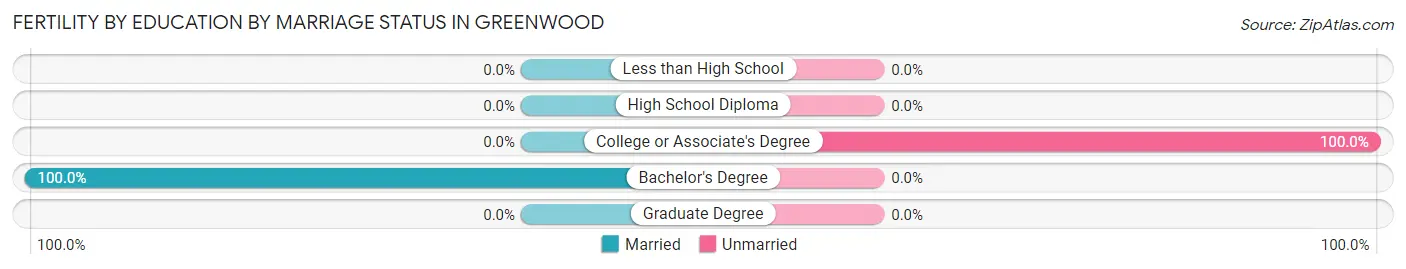
| Educational Attainment | Married | Unmarried |
| Less than High School | 0 (0.0%) | 0 (0.0%) |
| High School Diploma | 0 (0.0%) | 0 (0.0%) |
| College or Associate's Degree | 0 (0.0%) | 24 (100.0%) |
| Bachelor's Degree | 27 (100.0%) | 0 (0.0%) |
| Graduate Degree | 0 (0.0%) | 0 (0.0%) |
| Total | 27 (52.9%) | 24 (47.1%) |
Employment Characteristics in Greenwood
Employment by Class of Employer in Greenwood
Among the 1,586 employed individuals in Greenwood, private company employees (967 | 61.0%), state government employees (208 | 13.1%), and not-for-profit organizations (120 | 7.6%) make up the most common classes of employment.
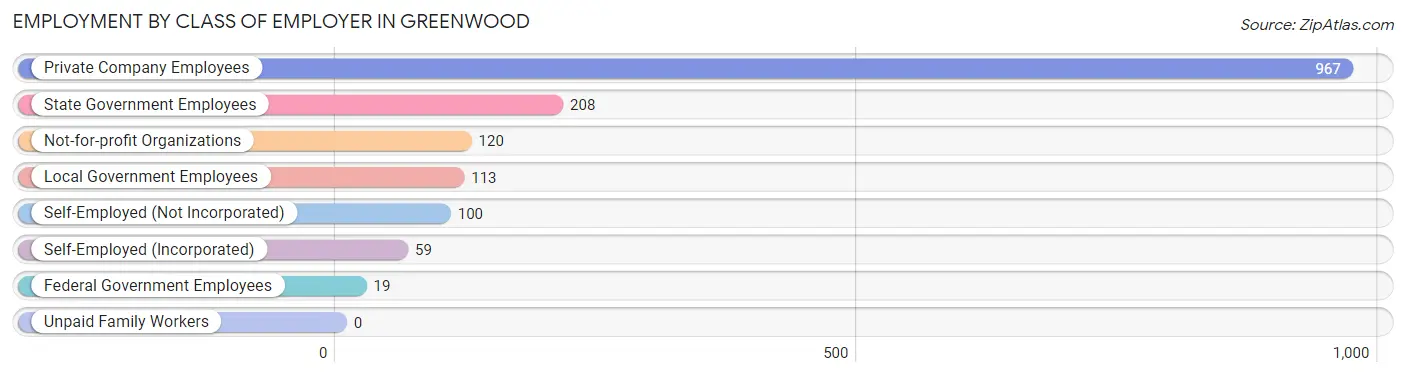
| Employer Class | # Employees | % Employees |
| Private Company Employees | 967 | 61.0% |
| Self-Employed (Incorporated) | 59 | 3.7% |
| Self-Employed (Not Incorporated) | 100 | 6.3% |
| Not-for-profit Organizations | 120 | 7.6% |
| Local Government Employees | 113 | 7.1% |
| State Government Employees | 208 | 13.1% |
| Federal Government Employees | 19 | 1.2% |
| Unpaid Family Workers | 0 | 0.0% |
| Total | 1,586 | 100.0% |
Employment Status by Age in Greenwood
According to the labor force statistics for Greenwood, out of the total population over 16 years of age (2,735), 60.1% or 1,644 individuals are in the labor force, with 0.4% or 7 of them unemployed. The age group with the highest labor force participation rate is 30 to 34 years, with 100.0% or 245 individuals in the labor force. Within the labor force, the 55 to 59 years age range has the highest percentage of unemployed individuals, with 3.3% or 7 of them being unemployed.
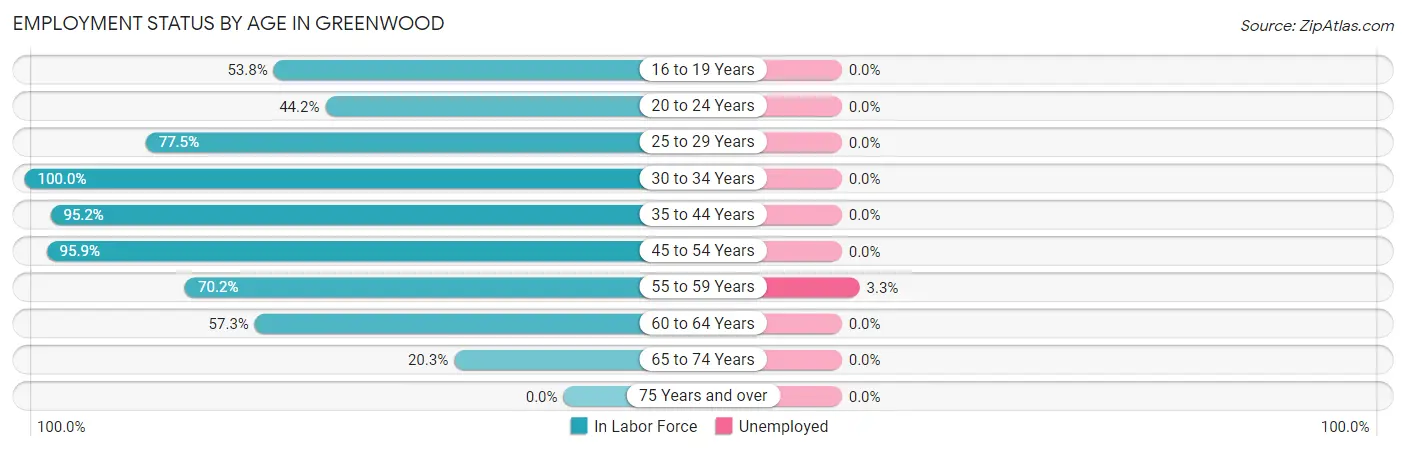
| Age Bracket | In Labor Force | Unemployed |
| 16 to 19 Years | 77 (53.8%) | 0 (0.0%) |
| 20 to 24 Years | 23 (44.2%) | 0 (0.0%) |
| 25 to 29 Years | 31 (77.5%) | 0 (0.0%) |
| 30 to 34 Years | 245 (100.0%) | 0 (0.0%) |
| 35 to 44 Years | 356 (95.2%) | 0 (0.0%) |
| 45 to 54 Years | 422 (95.9%) | 0 (0.0%) |
| 55 to 59 Years | 214 (70.2%) | 7 (3.3%) |
| 60 to 64 Years | 172 (57.3%) | 0 (0.0%) |
| 65 to 74 Years | 104 (20.3%) | 0 (0.0%) |
| 75 Years and over | 0 (0.0%) | 0 (0.0%) |
| Total | 1,644 (60.1%) | 7 (0.4%) |
Employment Status by Educational Attainment in Greenwood
According to labor force statistics for Greenwood, 84.5% of individuals (1,440) out of the total population between 25 and 64 years of age (1,704) are in the labor force, with 0.5% or 7 of them being unemployed. The group with the highest labor force participation rate are those with the educational attainment of bachelor's degree or higher, with 94.5% or 614 individuals in the labor force. Within the labor force, individuals with high school diploma education have the highest percentage of unemployment, with 2.0% or 7 of them being unemployed.
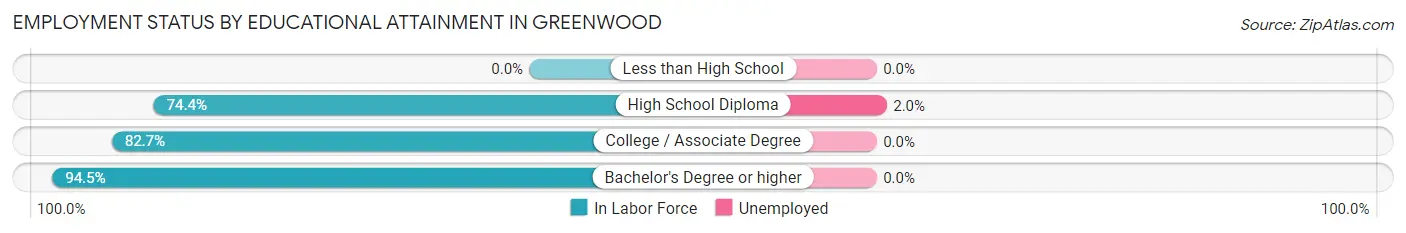
| Educational Attainment | In Labor Force | Unemployed |
| Less than High School | 0 (0.0%) | 0 (0.0%) |
| High School Diploma | 343 (74.4%) | 9 (2.0%) |
| College / Associate Degree | 483 (82.7%) | 0 (0.0%) |
| Bachelor's Degree or higher | 614 (94.5%) | 0 (0.0%) |
| Total | 1,440 (84.5%) | 9 (0.5%) |
Employment Occupations by Sex in Greenwood
Management, Business, Science and Arts Occupations
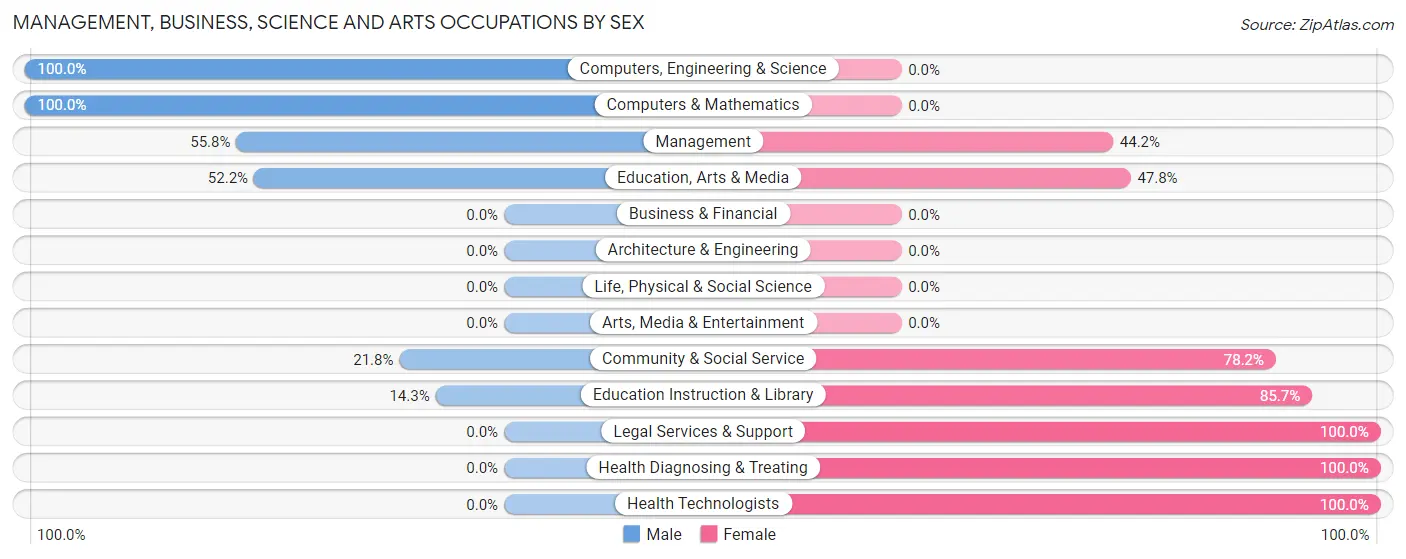
The most common Management, Business, Science and Arts occupations in Greenwood are Management (231 | 14.1%), Community & Social Service (174 | 10.6%), Education Instruction & Library (98 | 6.0%), Health Diagnosing & Treating (95 | 5.8%), and Computers, Engineering & Science (93 | 5.7%).
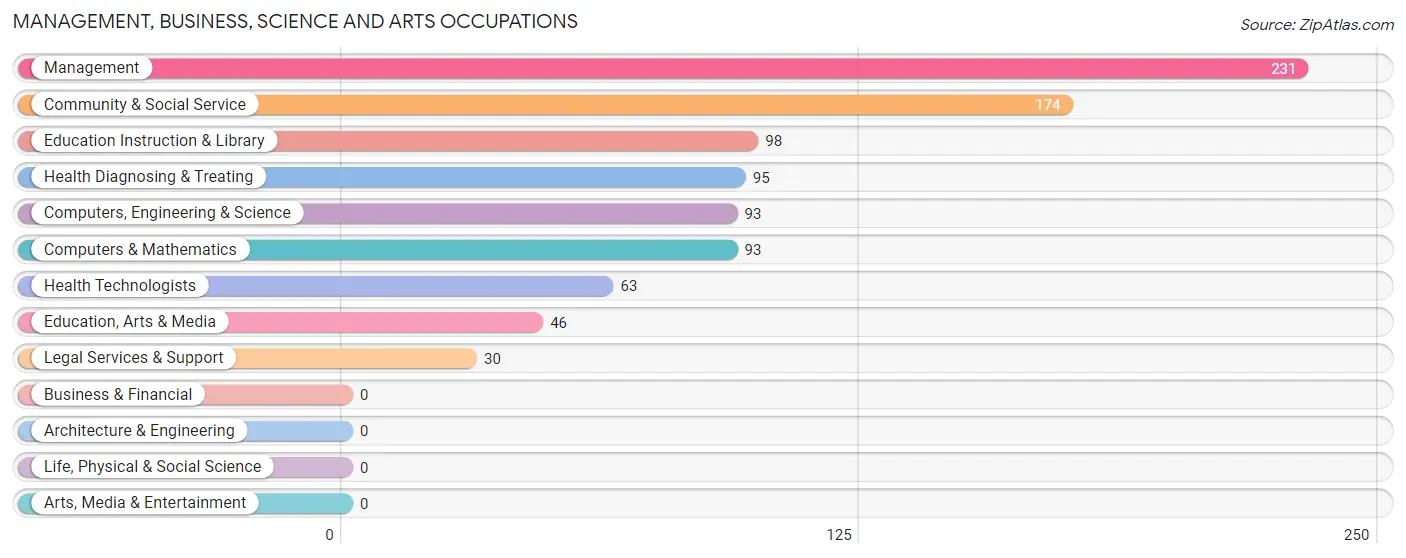
Management, Business, Science and Arts Occupations by Sex
Within the Management, Business, Science and Arts occupations in Greenwood, the most male-oriented occupations are Computers, Engineering & Science (100.0%), Computers & Mathematics (100.0%), and Management (55.8%), while the most female-oriented occupations are Legal Services & Support (100.0%), Health Diagnosing & Treating (100.0%), and Health Technologists (100.0%).
| Occupation | Male | Female |
| Management | 129 (55.8%) | 102 (44.2%) |
| Business & Financial | 0 (0.0%) | 0 (0.0%) |
| Computers, Engineering & Science | 93 (100.0%) | 0 (0.0%) |
| Computers & Mathematics | 93 (100.0%) | 0 (0.0%) |
| Architecture & Engineering | 0 (0.0%) | 0 (0.0%) |
| Life, Physical & Social Science | 0 (0.0%) | 0 (0.0%) |
| Community & Social Service | 38 (21.8%) | 136 (78.2%) |
| Education, Arts & Media | 24 (52.2%) | 22 (47.8%) |
| Legal Services & Support | 0 (0.0%) | 30 (100.0%) |
| Education Instruction & Library | 14 (14.3%) | 84 (85.7%) |
| Arts, Media & Entertainment | 0 (0.0%) | 0 (0.0%) |
| Health Diagnosing & Treating | 0 (0.0%) | 95 (100.0%) |
| Health Technologists | 0 (0.0%) | 63 (100.0%) |
| Total (Category) | 260 (43.8%) | 333 (56.2%) |
| Total (Overall) | 1,004 (61.3%) | 633 (38.7%) |
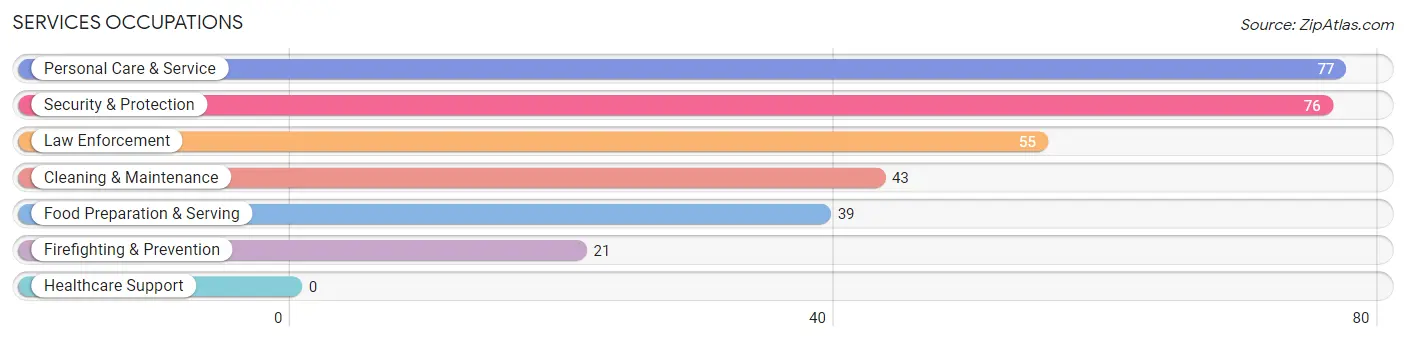
Services Occupations
The most common Services occupations in Greenwood are Personal Care & Service (77 | 4.7%), Security & Protection (76 | 4.6%), Law Enforcement (55 | 3.4%), Cleaning & Maintenance (43 | 2.6%), and Food Preparation & Serving (39 | 2.4%).
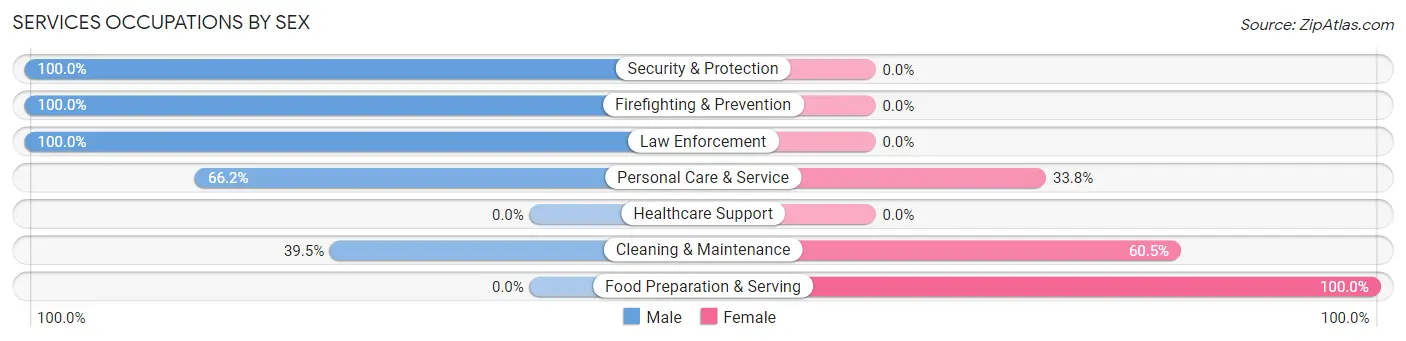
Services Occupations by Sex
Within the Services occupations in Greenwood, the most male-oriented occupations are Security & Protection (100.0%), Firefighting & Prevention (100.0%), and Law Enforcement (100.0%), while the most female-oriented occupations are Food Preparation & Serving (100.0%), Cleaning & Maintenance (60.5%), and Personal Care & Service (33.8%).
| Occupation | Male | Female |
| Healthcare Support | 0 (0.0%) | 0 (0.0%) |
| Security & Protection | 76 (100.0%) | 0 (0.0%) |
| Firefighting & Prevention | 21 (100.0%) | 0 (0.0%) |
| Law Enforcement | 55 (100.0%) | 0 (0.0%) |
| Food Preparation & Serving | 0 (0.0%) | 39 (100.0%) |
| Cleaning & Maintenance | 17 (39.5%) | 26 (60.5%) |
| Personal Care & Service | 51 (66.2%) | 26 (33.8%) |
| Total (Category) | 144 (61.3%) | 91 (38.7%) |
| Total (Overall) | 1,004 (61.3%) | 633 (38.7%) |
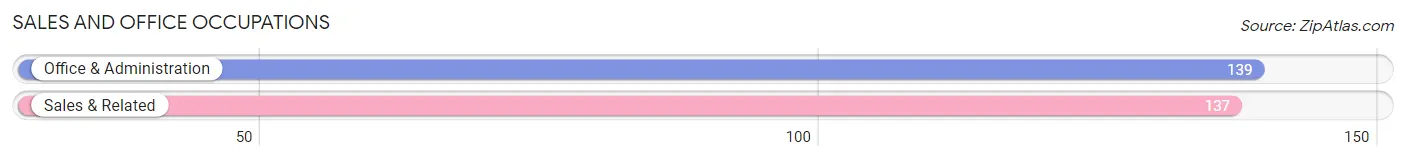
Sales and Office Occupations
The most common Sales and Office occupations in Greenwood are Office & Administration (139 | 8.5%), and Sales & Related (137 | 8.4%).
Sales and Office Occupations by Sex
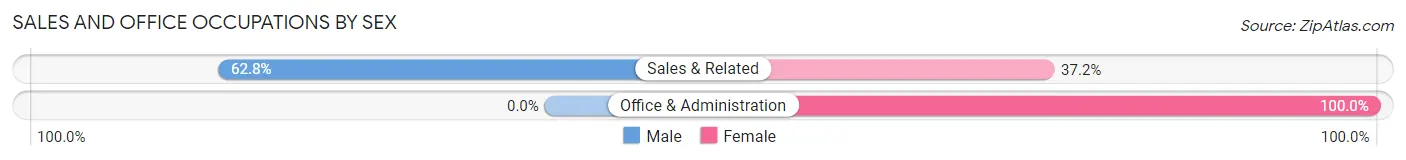
| Occupation | Male | Female |
| Sales & Related | 86 (62.8%) | 51 (37.2%) |
| Office & Administration | 0 (0.0%) | 139 (100.0%) |
| Total (Category) | 86 (31.2%) | 190 (68.8%) |
| Total (Overall) | 1,004 (61.3%) | 633 (38.7%) |
Natural Resources, Construction and Maintenance Occupations
The most common Natural Resources, Construction and Maintenance occupations in Greenwood are , and Construction & Extraction (131 | 8.0%).
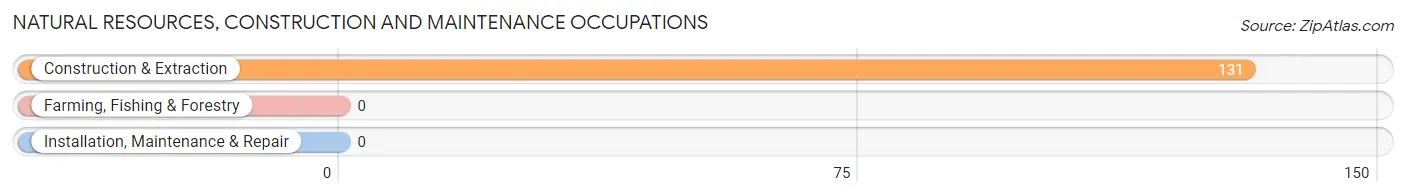
Natural Resources, Construction and Maintenance Occupations by Sex
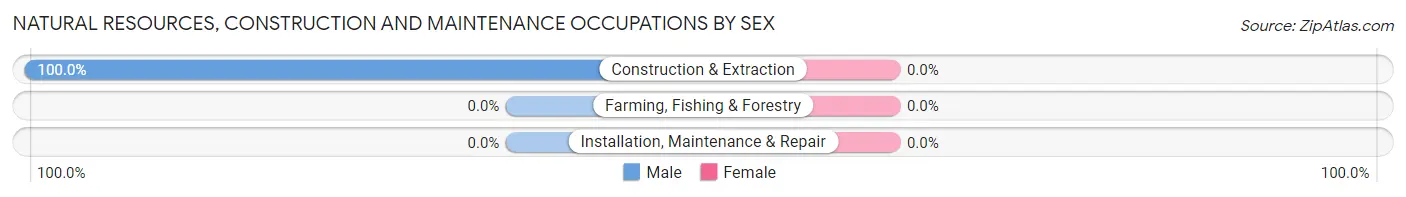
| Occupation | Male | Female |
| Farming, Fishing & Forestry | 0 (0.0%) | 0 (0.0%) |
| Construction & Extraction | 131 (100.0%) | 0 (0.0%) |
| Installation, Maintenance & Repair | 0 (0.0%) | 0 (0.0%) |
| Total (Category) | 131 (100.0%) | 0 (0.0%) |
| Total (Overall) | 1,004 (61.3%) | 633 (38.7%) |
Production, Transportation and Moving Occupations
The most common Production, Transportation and Moving occupations in Greenwood are Production (276 | 16.9%), Transportation (86 | 5.2%), and Material Moving (40 | 2.4%).
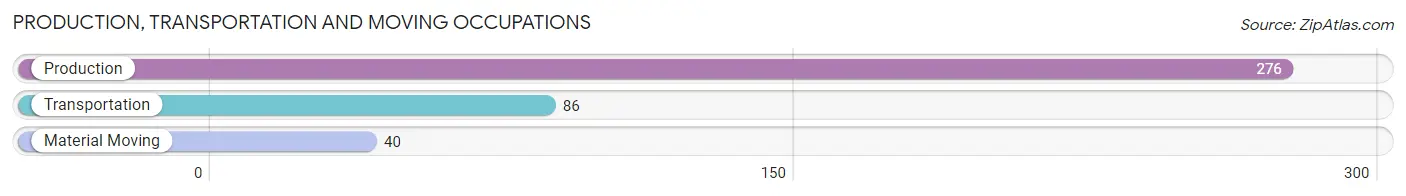
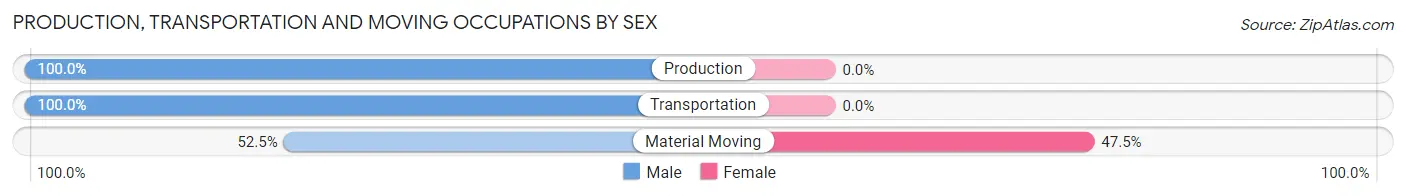
Production, Transportation and Moving Occupations by Sex
| Occupation | Male | Female |
| Production | 276 (100.0%) | 0 (0.0%) |
| Transportation | 86 (100.0%) | 0 (0.0%) |
| Material Moving | 21 (52.5%) | 19 (47.5%) |
| Total (Category) | 383 (95.3%) | 19 (4.7%) |
| Total (Overall) | 1,004 (61.3%) | 633 (38.7%) |
Employment Industries by Sex in Greenwood
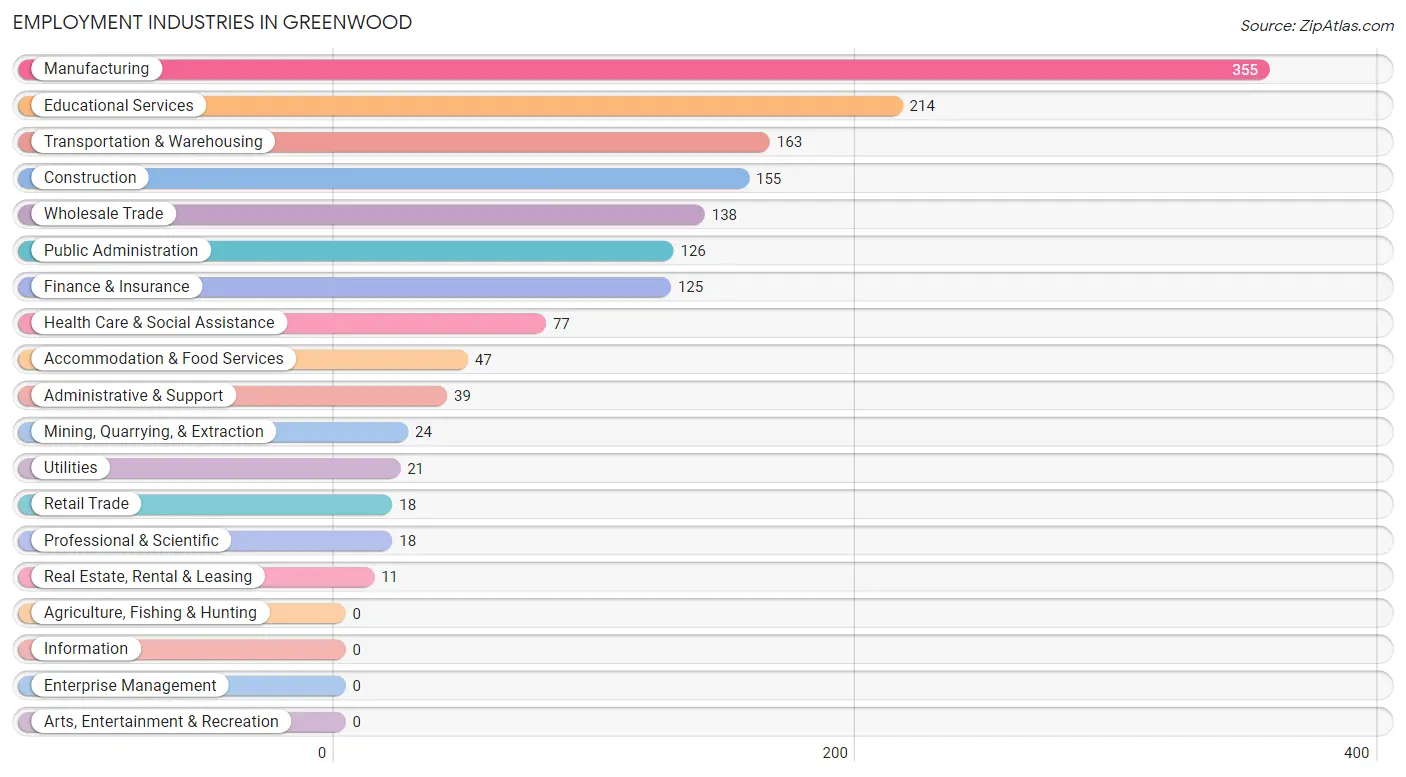
Employment Industries in Greenwood
The major employment industries in Greenwood include Manufacturing (355 | 21.7%), Educational Services (214 | 13.1%), Transportation & Warehousing (163 | 10.0%), Construction (155 | 9.5%), and Wholesale Trade (138 | 8.4%).
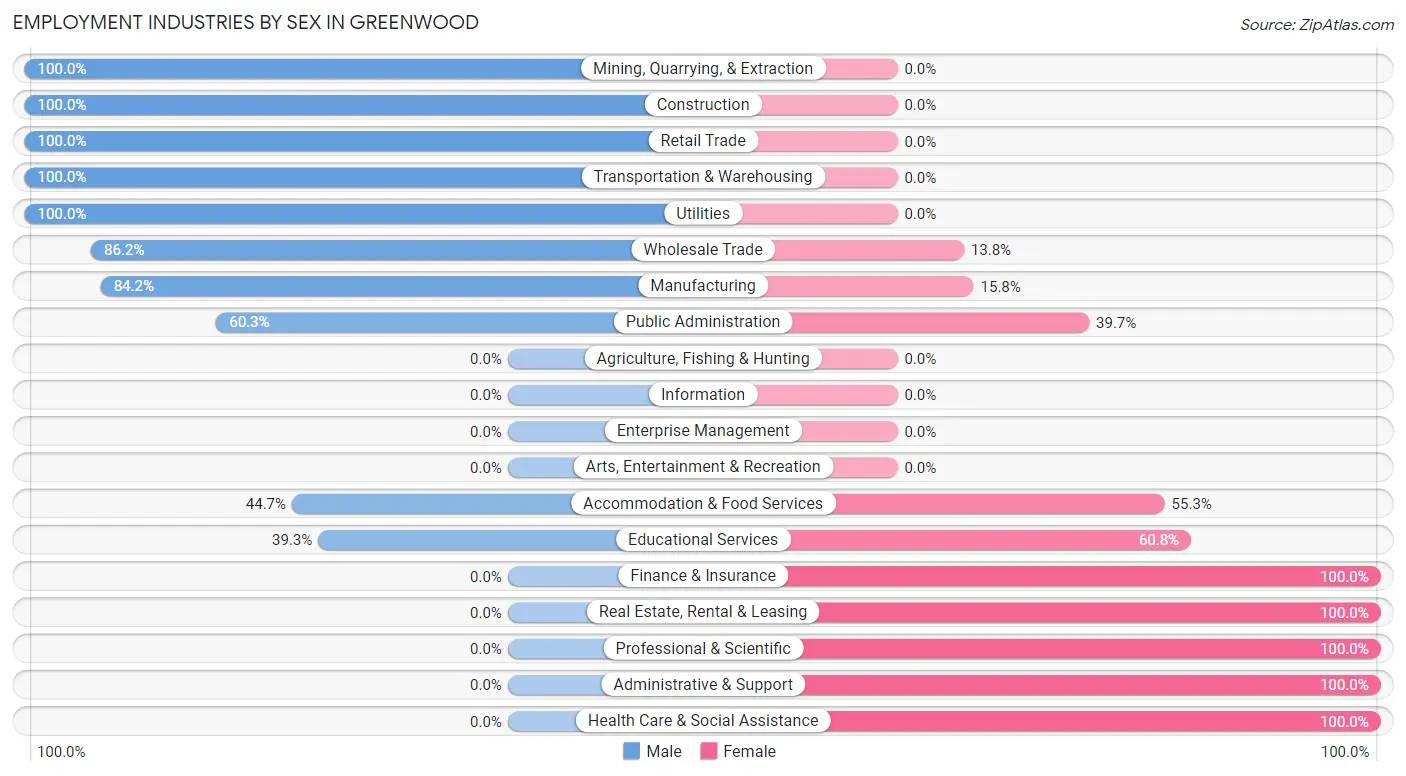
Employment Industries by Sex in Greenwood
The Greenwood industries that see more men than women are Mining, Quarrying, & Extraction (100.0%), Construction (100.0%), and Retail Trade (100.0%), whereas the industries that tend to have a higher number of women are Finance & Insurance (100.0%), Real Estate, Rental & Leasing (100.0%), and Professional & Scientific (100.0%).
| Industry | Male | Female |
| Agriculture, Fishing & Hunting | 0 (0.0%) | 0 (0.0%) |
| Mining, Quarrying, & Extraction | 24 (100.0%) | 0 (0.0%) |
| Construction | 155 (100.0%) | 0 (0.0%) |
| Manufacturing | 299 (84.2%) | 56 (15.8%) |
| Wholesale Trade | 119 (86.2%) | 19 (13.8%) |
| Retail Trade | 18 (100.0%) | 0 (0.0%) |
| Transportation & Warehousing | 163 (100.0%) | 0 (0.0%) |
| Utilities | 21 (100.0%) | 0 (0.0%) |
| Information | 0 (0.0%) | 0 (0.0%) |
| Finance & Insurance | 0 (0.0%) | 125 (100.0%) |
| Real Estate, Rental & Leasing | 0 (0.0%) | 11 (100.0%) |
| Professional & Scientific | 0 (0.0%) | 18 (100.0%) |
| Enterprise Management | 0 (0.0%) | 0 (0.0%) |
| Administrative & Support | 0 (0.0%) | 39 (100.0%) |
| Educational Services | 84 (39.3%) | 130 (60.8%) |
| Health Care & Social Assistance | 0 (0.0%) | 77 (100.0%) |
| Arts, Entertainment & Recreation | 0 (0.0%) | 0 (0.0%) |
| Accommodation & Food Services | 21 (44.7%) | 26 (55.3%) |
| Public Administration | 76 (60.3%) | 50 (39.7%) |
| Total | 1,004 (61.3%) | 633 (38.7%) |
Education in Greenwood
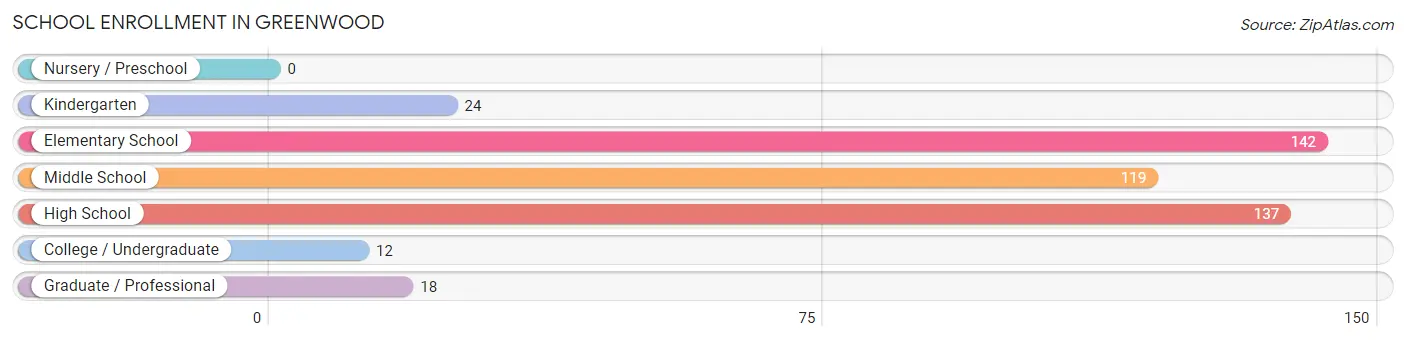
School Enrollment in Greenwood
The most common levels of schooling among the 452 students in Greenwood are elementary school (142 | 31.4%), high school (137 | 30.3%), and middle school (119 | 26.3%).
| School Level | # Students | % Students |
| Nursery / Preschool | 0 | 0.0% |
| Kindergarten | 24 | 5.3% |
| Elementary School | 142 | 31.4% |
| Middle School | 119 | 26.3% |
| High School | 137 | 30.3% |
| College / Undergraduate | 12 | 2.6% |
| Graduate / Professional | 18 | 4.0% |
| Total | 452 | 100.0% |
School Enrollment by Age by Funding Source in Greenwood
Out of a total of 452 students who are enrolled in schools in Greenwood, 47 (10.4%) attend a private institution, while the remaining 405 (89.6%) are enrolled in public schools. The age group of 10 to 14 year olds has the highest likelihood of being enrolled in private schools, with 32 (17.8% in the age bracket) enrolled. Conversely, the age group of 5 to 9 year old has the lowest likelihood of being enrolled in a private school, with 125 (100.0% in the age bracket) attending a public institution.
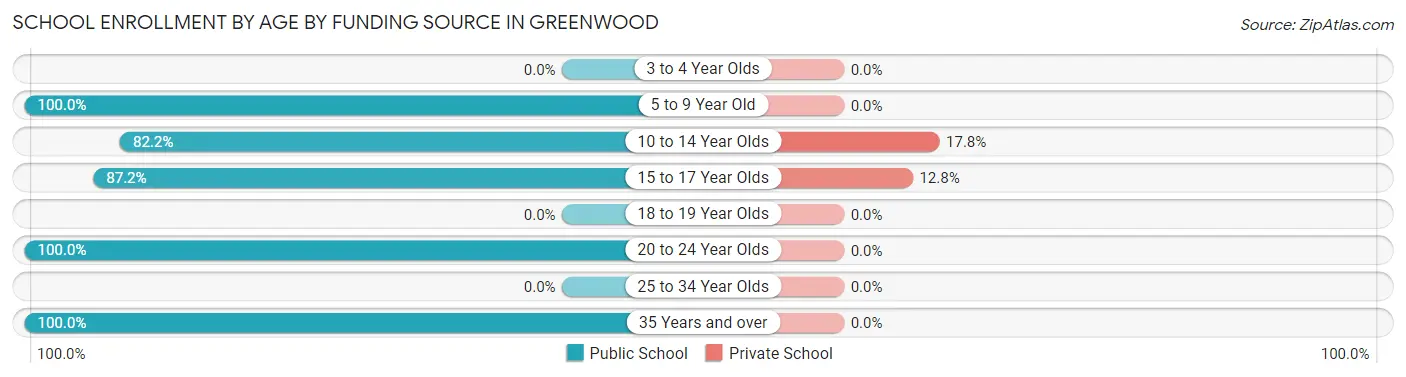
| Age Bracket | Public School | Private School |
| 3 to 4 Year Olds | 0 (0.0%) | 0 (0.0%) |
| 5 to 9 Year Old | 125 (100.0%) | 0 (0.0%) |
| 10 to 14 Year Olds | 148 (82.2%) | 32 (17.8%) |
| 15 to 17 Year Olds | 102 (87.2%) | 15 (12.8%) |
| 18 to 19 Year Olds | 0 (0.0%) | 0 (0.0%) |
| 20 to 24 Year Olds | 12 (100.0%) | 0 (0.0%) |
| 25 to 34 Year Olds | 0 (0.0%) | 0 (0.0%) |
| 35 Years and over | 18 (100.0%) | 0 (0.0%) |
| Total | 405 (89.6%) | 47 (10.4%) |
Educational Attainment by Field of Study in Greenwood
Business (261 | 38.0%), psychology (199 | 29.0%), education (108 | 15.7%), visual & performing arts (20 | 2.9%), and science & technology (19 | 2.8%) are the most common fields of study among 687 individuals in Greenwood who have obtained a bachelor's degree or higher.
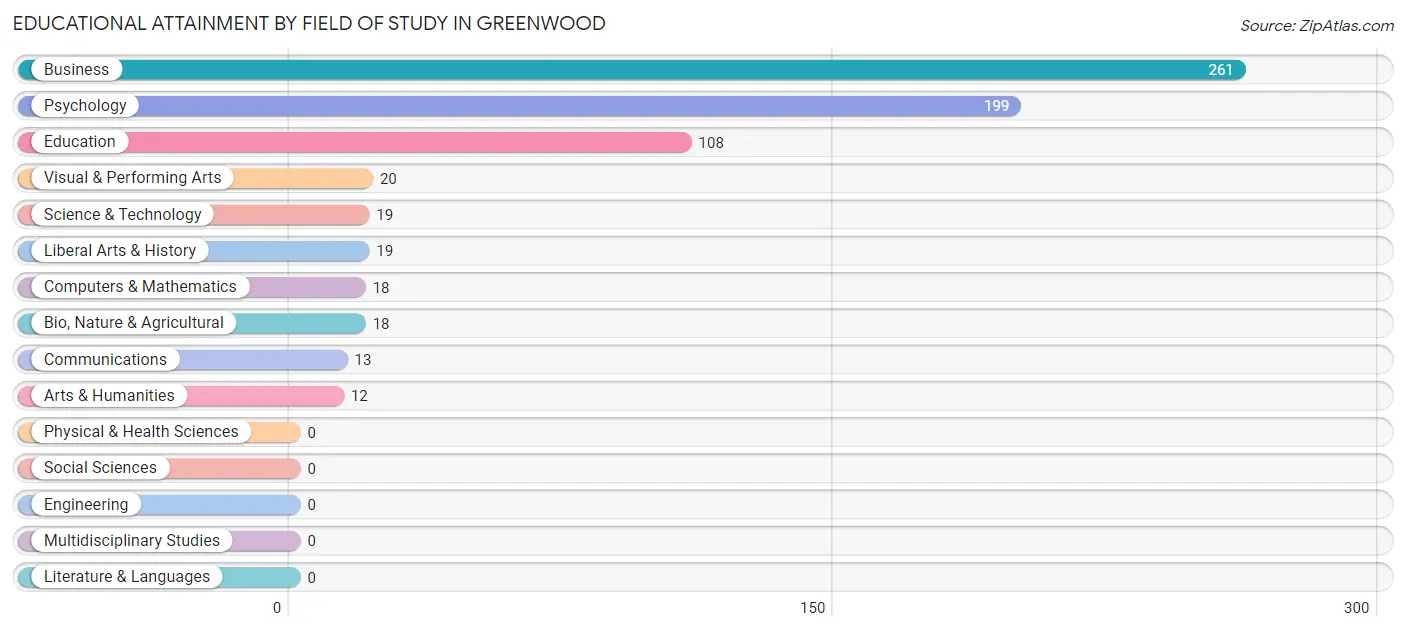
| Field of Study | # Graduates | % Graduates |
| Computers & Mathematics | 18 | 2.6% |
| Bio, Nature & Agricultural | 18 | 2.6% |
| Physical & Health Sciences | 0 | 0.0% |
| Psychology | 199 | 29.0% |
| Social Sciences | 0 | 0.0% |
| Engineering | 0 | 0.0% |
| Multidisciplinary Studies | 0 | 0.0% |
| Science & Technology | 19 | 2.8% |
| Business | 261 | 38.0% |
| Education | 108 | 15.7% |
| Literature & Languages | 0 | 0.0% |
| Liberal Arts & History | 19 | 2.8% |
| Visual & Performing Arts | 20 | 2.9% |
| Communications | 13 | 1.9% |
| Arts & Humanities | 12 | 1.8% |
| Total | 687 | 100.0% |
Transportation & Commute in Greenwood
Vehicle Availability by Sex in Greenwood
The most prevalent vehicle ownership categories in Greenwood are males with 2 vehicles (448, accounting for 47.0%) and females with 2 vehicles (315, making up 70.8%).
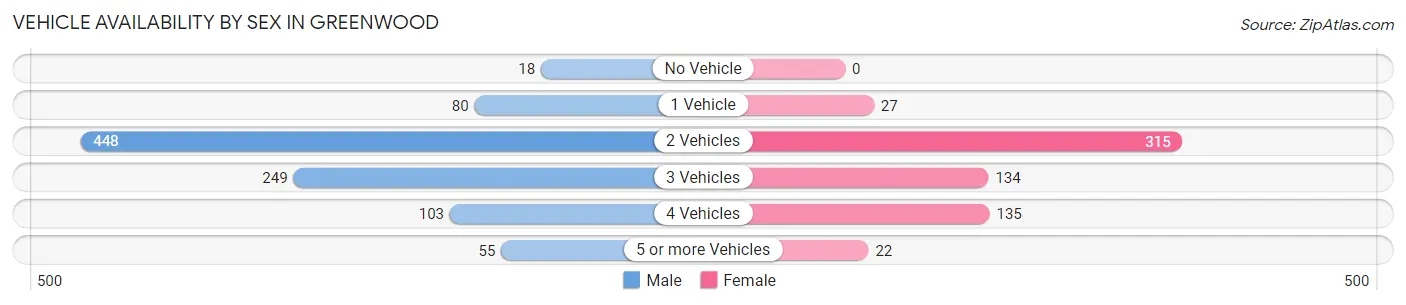
| Vehicles Available | Male | Female |
| No Vehicle | 18 (1.9%) | 0 (0.0%) |
| 1 Vehicle | 80 (8.4%) | 27 (4.3%) |
| 2 Vehicles | 448 (47.0%) | 315 (49.8%) |
| 3 Vehicles | 249 (26.1%) | 134 (21.2%) |
| 4 Vehicles | 103 (10.8%) | 135 (21.3%) |
| 5 or more Vehicles | 55 (5.8%) | 22 (3.5%) |
| Total | 953 (100.0%) | 633 (100.0%) |
Commute Time in Greenwood
The most frequently occuring commute durations in Greenwood are 20 to 24 minutes (415 commuters, 27.5%), 30 to 34 minutes (289 commuters, 19.1%), and 25 to 29 minutes (225 commuters, 14.9%).
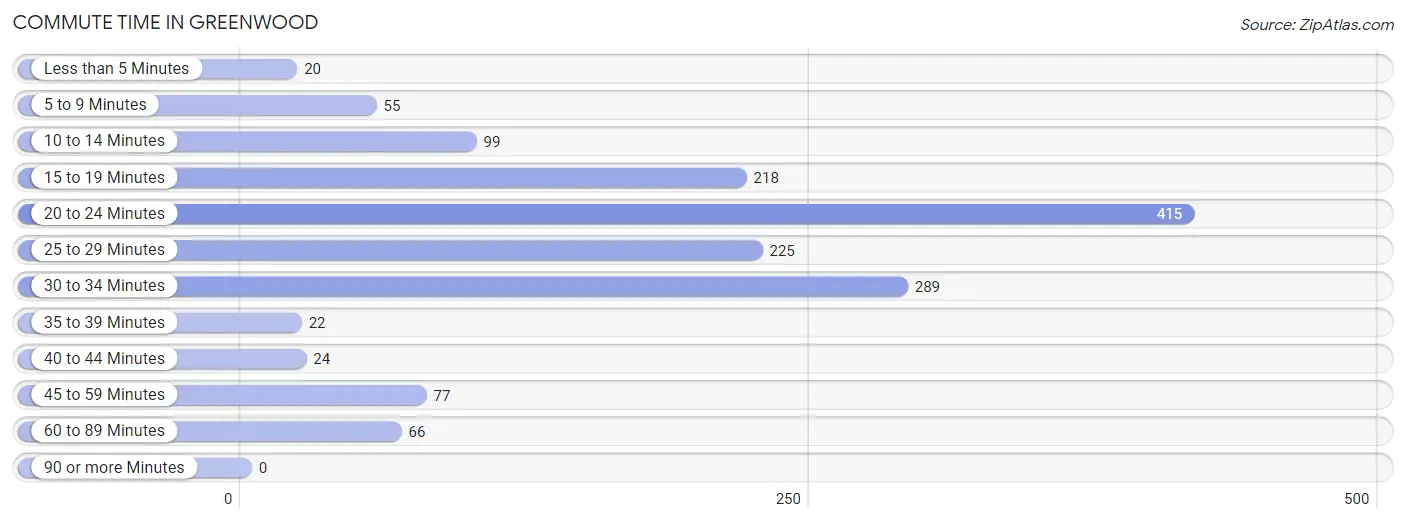
| Commute Time | # Commuters | % Commuters |
| Less than 5 Minutes | 20 | 1.3% |
| 5 to 9 Minutes | 55 | 3.6% |
| 10 to 14 Minutes | 99 | 6.6% |
| 15 to 19 Minutes | 218 | 14.4% |
| 20 to 24 Minutes | 415 | 27.5% |
| 25 to 29 Minutes | 225 | 14.9% |
| 30 to 34 Minutes | 289 | 19.1% |
| 35 to 39 Minutes | 22 | 1.5% |
| 40 to 44 Minutes | 24 | 1.6% |
| 45 to 59 Minutes | 77 | 5.1% |
| 60 to 89 Minutes | 66 | 4.4% |
| 90 or more Minutes | 0 | 0.0% |
Commute Time by Sex in Greenwood
The most common commute times in Greenwood are 20 to 24 minutes (225 commuters, 24.1%) for males and 20 to 24 minutes (190 commuters, 32.9%) for females.
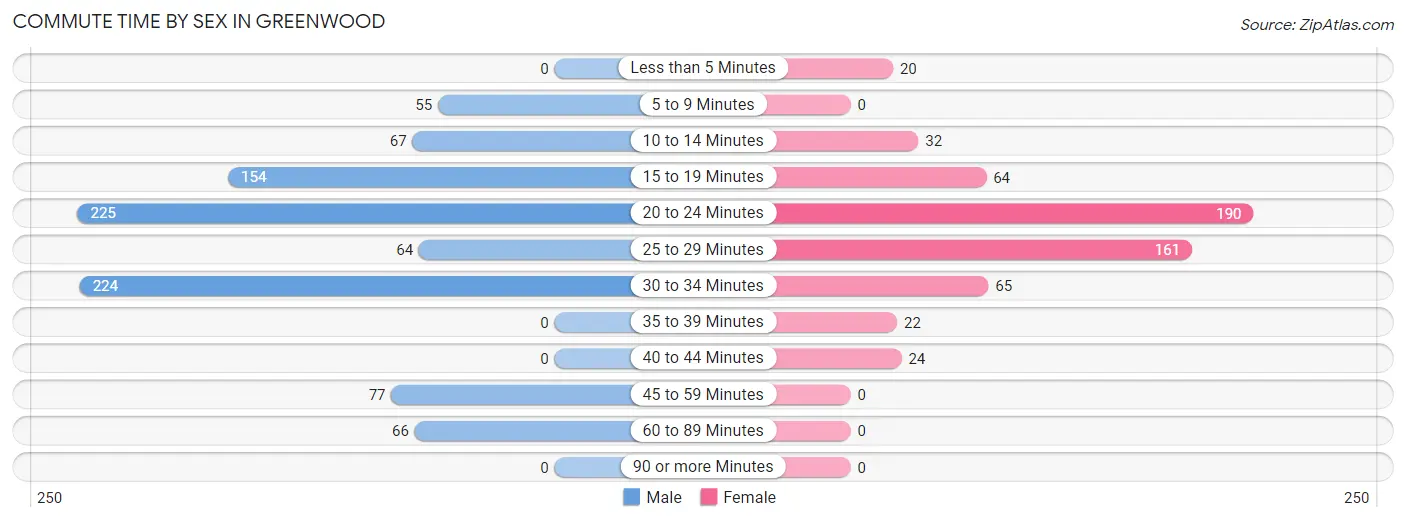
| Commute Time | Male | Female |
| Less than 5 Minutes | 0 (0.0%) | 20 (3.5%) |
| 5 to 9 Minutes | 55 (5.9%) | 0 (0.0%) |
| 10 to 14 Minutes | 67 (7.2%) | 32 (5.5%) |
| 15 to 19 Minutes | 154 (16.5%) | 64 (11.1%) |
| 20 to 24 Minutes | 225 (24.1%) | 190 (32.9%) |
| 25 to 29 Minutes | 64 (6.9%) | 161 (27.9%) |
| 30 to 34 Minutes | 224 (24.0%) | 65 (11.3%) |
| 35 to 39 Minutes | 0 (0.0%) | 22 (3.8%) |
| 40 to 44 Minutes | 0 (0.0%) | 24 (4.2%) |
| 45 to 59 Minutes | 77 (8.3%) | 0 (0.0%) |
| 60 to 89 Minutes | 66 (7.1%) | 0 (0.0%) |
| 90 or more Minutes | 0 (0.0%) | 0 (0.0%) |
Time of Departure to Work by Sex in Greenwood
The most frequent times of departure to work in Greenwood are 7:00 AM to 7:29 AM (272, 29.2%) for males and 7:30 AM to 7:59 AM (139, 24.0%) for females.
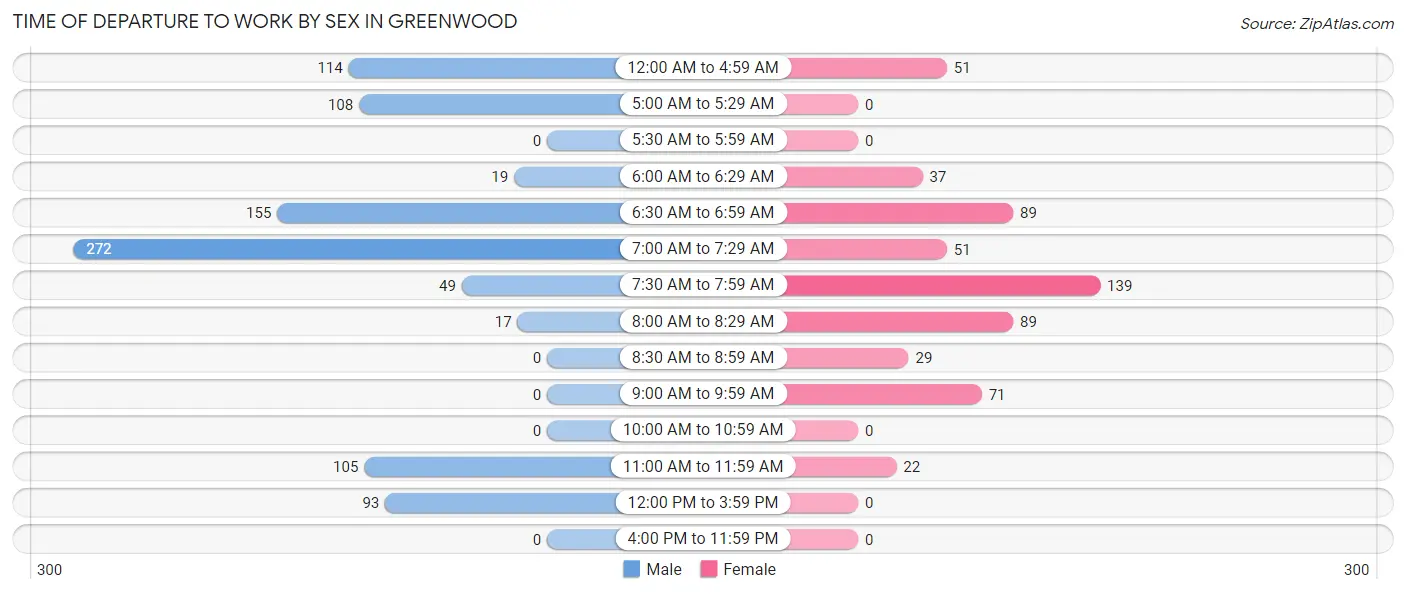
| Time of Departure | Male | Female |
| 12:00 AM to 4:59 AM | 114 (12.2%) | 51 (8.8%) |
| 5:00 AM to 5:29 AM | 108 (11.6%) | 0 (0.0%) |
| 5:30 AM to 5:59 AM | 0 (0.0%) | 0 (0.0%) |
| 6:00 AM to 6:29 AM | 19 (2.0%) | 37 (6.4%) |
| 6:30 AM to 6:59 AM | 155 (16.6%) | 89 (15.4%) |
| 7:00 AM to 7:29 AM | 272 (29.2%) | 51 (8.8%) |
| 7:30 AM to 7:59 AM | 49 (5.3%) | 139 (24.0%) |
| 8:00 AM to 8:29 AM | 17 (1.8%) | 89 (15.4%) |
| 8:30 AM to 8:59 AM | 0 (0.0%) | 29 (5.0%) |
| 9:00 AM to 9:59 AM | 0 (0.0%) | 71 (12.3%) |
| 10:00 AM to 10:59 AM | 0 (0.0%) | 0 (0.0%) |
| 11:00 AM to 11:59 AM | 105 (11.3%) | 22 (3.8%) |
| 12:00 PM to 3:59 PM | 93 (10.0%) | 0 (0.0%) |
| 4:00 PM to 11:59 PM | 0 (0.0%) | 0 (0.0%) |
| Total | 932 (100.0%) | 578 (100.0%) |
Housing Occupancy in Greenwood
Occupancy by Ownership in Greenwood
Of the total 1,430 dwellings in Greenwood, owner-occupied units account for 1,231 (86.1%), while renter-occupied units make up 199 (13.9%).
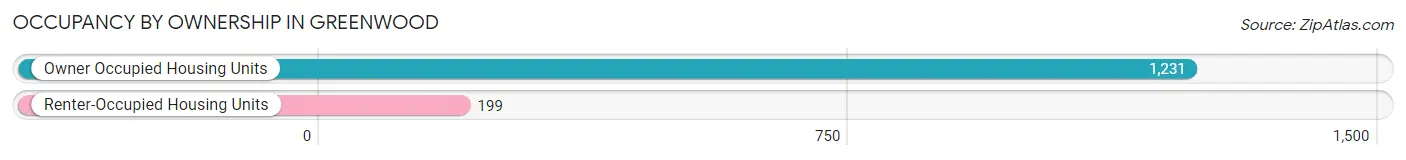
| Occupancy | # Housing Units | % Housing Units |
| Owner Occupied Housing Units | 1,231 | 86.1% |
| Renter-Occupied Housing Units | 199 | 13.9% |
| Total Occupied Housing Units | 1,430 | 100.0% |
Occupancy by Household Size in Greenwood
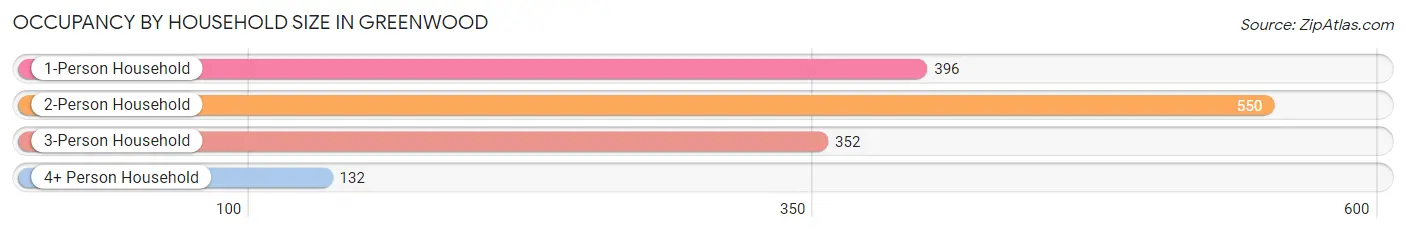
| Household Size | # Housing Units | % Housing Units |
| 1-Person Household | 396 | 27.7% |
| 2-Person Household | 550 | 38.5% |
| 3-Person Household | 352 | 24.6% |
| 4+ Person Household | 132 | 9.2% |
| Total Housing Units | 1,430 | 100.0% |
Occupancy by Ownership by Household Size in Greenwood
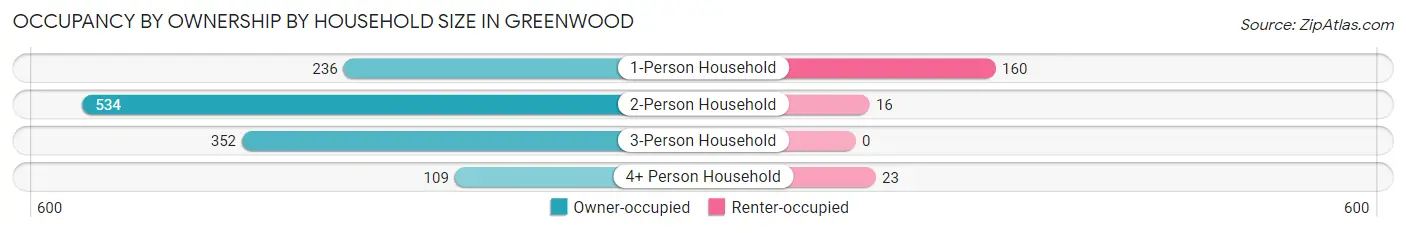
| Household Size | Owner-occupied | Renter-occupied |
| 1-Person Household | 236 (59.6%) | 160 (40.4%) |
| 2-Person Household | 534 (97.1%) | 16 (2.9%) |
| 3-Person Household | 352 (100.0%) | 0 (0.0%) |
| 4+ Person Household | 109 (82.6%) | 23 (17.4%) |
| Total Housing Units | 1,231 (86.1%) | 199 (13.9%) |
Occupancy by Educational Attainment in Greenwood
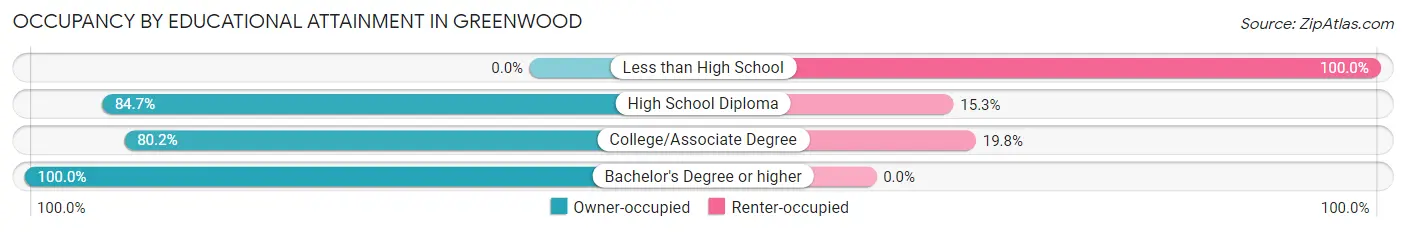
| Household Size | Owner-occupied | Renter-occupied |
| Less than High School | 0 (0.0%) | 14 (100.0%) |
| High School Diploma | 476 (84.7%) | 86 (15.3%) |
| College/Associate Degree | 402 (80.2%) | 99 (19.8%) |
| Bachelor's Degree or higher | 353 (100.0%) | 0 (0.0%) |
Occupancy by Age of Householder in Greenwood
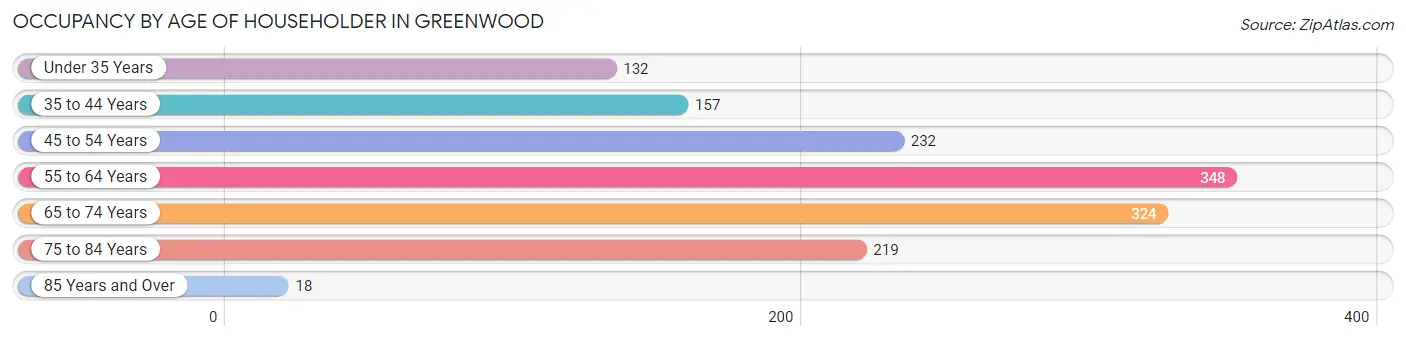
| Age Bracket | # Households | % Households |
| Under 35 Years | 132 | 9.2% |
| 35 to 44 Years | 157 | 11.0% |
| 45 to 54 Years | 232 | 16.2% |
| 55 to 64 Years | 348 | 24.3% |
| 65 to 74 Years | 324 | 22.7% |
| 75 to 84 Years | 219 | 15.3% |
| 85 Years and Over | 18 | 1.3% |
| Total | 1,430 | 100.0% |
Housing Finances in Greenwood
Median Income by Occupancy in Greenwood
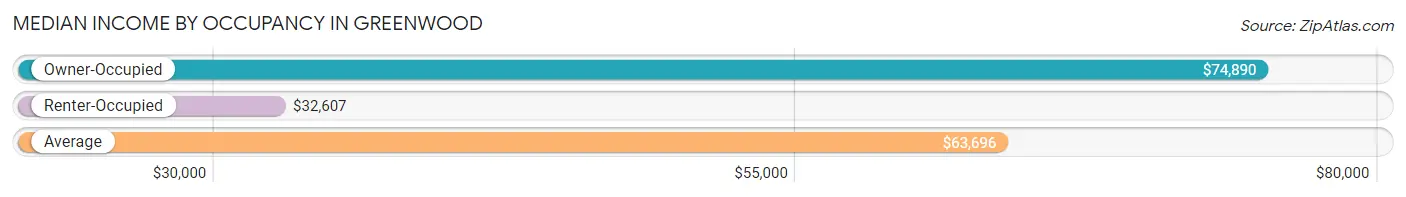
| Occupancy Type | # Households | Median Income |
| Owner-Occupied | 1,231 (86.1%) | $74,890 |
| Renter-Occupied | 199 (13.9%) | $32,607 |
| Average | 1,430 (100.0%) | $63,696 |
Occupancy by Householder Income Bracket in Greenwood
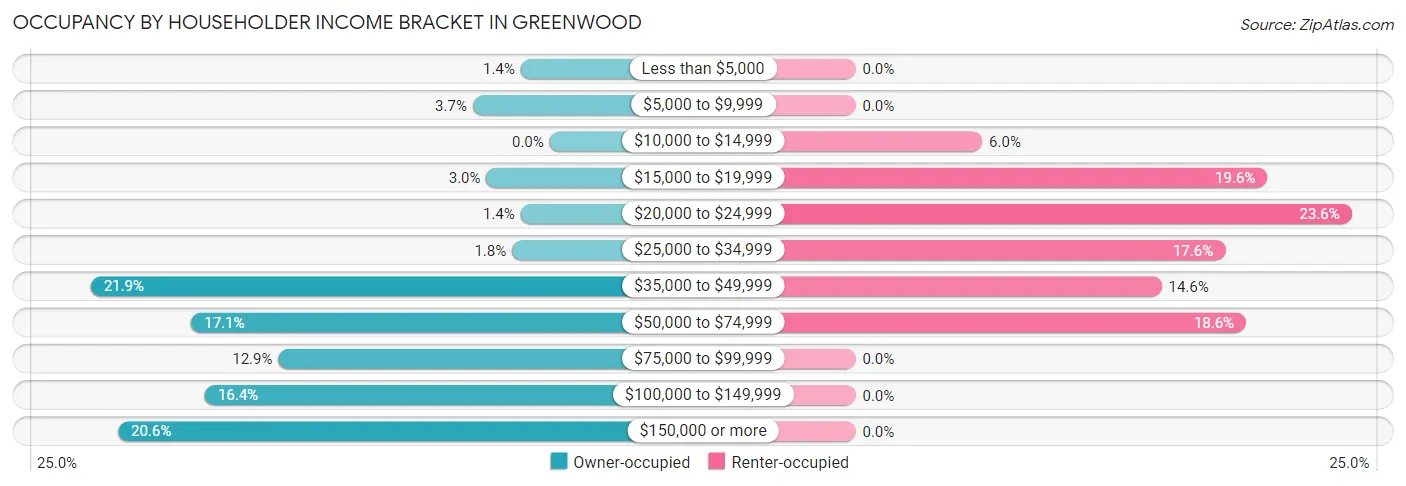
| Income Bracket | Owner-occupied | Renter-occupied |
| Less than $5,000 | 17 (1.4%) | 0 (0.0%) |
| $5,000 to $9,999 | 45 (3.7%) | 0 (0.0%) |
| $10,000 to $14,999 | 0 (0.0%) | 12 (6.0%) |
| $15,000 to $19,999 | 37 (3.0%) | 39 (19.6%) |
| $20,000 to $24,999 | 17 (1.4%) | 47 (23.6%) |
| $25,000 to $34,999 | 22 (1.8%) | 35 (17.6%) |
| $35,000 to $49,999 | 269 (21.8%) | 29 (14.6%) |
| $50,000 to $74,999 | 210 (17.1%) | 37 (18.6%) |
| $75,000 to $99,999 | 159 (12.9%) | 0 (0.0%) |
| $100,000 to $149,999 | 202 (16.4%) | 0 (0.0%) |
| $150,000 or more | 253 (20.5%) | 0 (0.0%) |
| Total | 1,231 (100.0%) | 199 (100.0%) |
Monthly Housing Cost Tiers in Greenwood
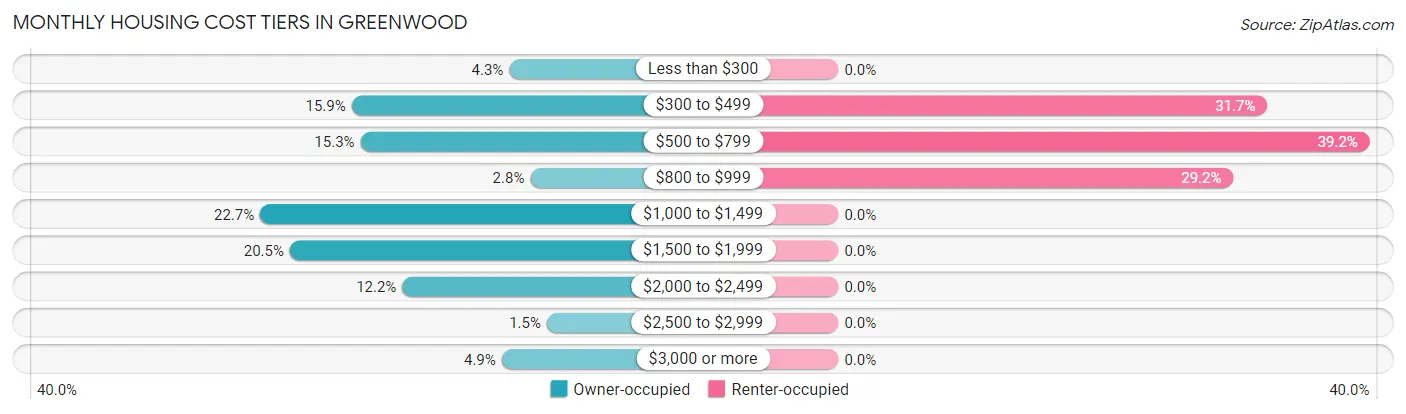
| Monthly Cost | Owner-occupied | Renter-occupied |
| Less than $300 | 53 (4.3%) | 0 (0.0%) |
| $300 to $499 | 196 (15.9%) | 63 (31.7%) |
| $500 to $799 | 188 (15.3%) | 78 (39.2%) |
| $800 to $999 | 34 (2.8%) | 58 (29.1%) |
| $1,000 to $1,499 | 279 (22.7%) | 0 (0.0%) |
| $1,500 to $1,999 | 252 (20.5%) | 0 (0.0%) |
| $2,000 to $2,499 | 150 (12.2%) | 0 (0.0%) |
| $2,500 to $2,999 | 19 (1.5%) | 0 (0.0%) |
| $3,000 or more | 60 (4.9%) | 0 (0.0%) |
| Total | 1,231 (100.0%) | 199 (100.0%) |
Physical Housing Characteristics in Greenwood
Housing Structures in Greenwood
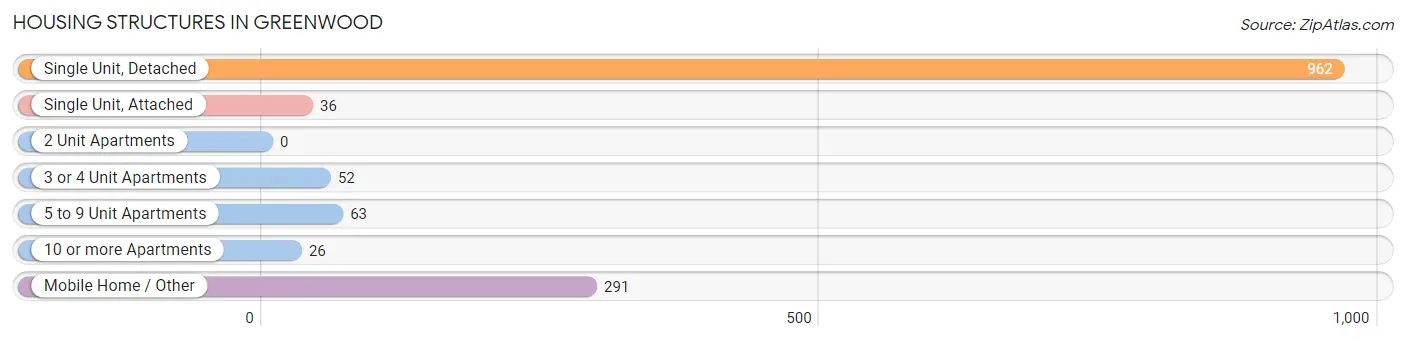
| Structure Type | # Housing Units | % Housing Units |
| Single Unit, Detached | 962 | 67.3% |
| Single Unit, Attached | 36 | 2.5% |
| 2 Unit Apartments | 0 | 0.0% |
| 3 or 4 Unit Apartments | 52 | 3.6% |
| 5 to 9 Unit Apartments | 63 | 4.4% |
| 10 or more Apartments | 26 | 1.8% |
| Mobile Home / Other | 291 | 20.3% |
| Total | 1,430 | 100.0% |
Housing Structures by Occupancy in Greenwood
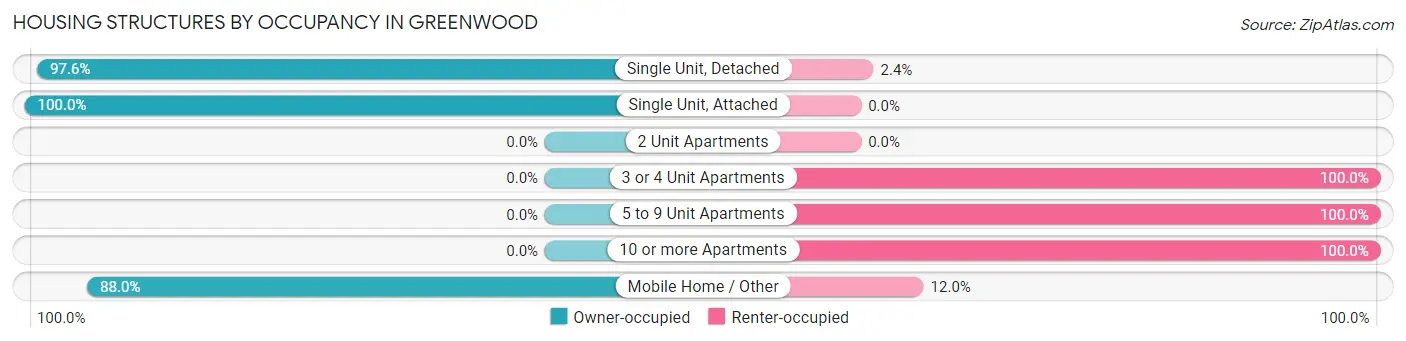
| Structure Type | Owner-occupied | Renter-occupied |
| Single Unit, Detached | 939 (97.6%) | 23 (2.4%) |
| Single Unit, Attached | 36 (100.0%) | 0 (0.0%) |
| 2 Unit Apartments | 0 (0.0%) | 0 (0.0%) |
| 3 or 4 Unit Apartments | 0 (0.0%) | 52 (100.0%) |
| 5 to 9 Unit Apartments | 0 (0.0%) | 63 (100.0%) |
| 10 or more Apartments | 0 (0.0%) | 26 (100.0%) |
| Mobile Home / Other | 256 (88.0%) | 35 (12.0%) |
| Total | 1,231 (86.1%) | 199 (13.9%) |
Housing Structures by Number of Rooms in Greenwood
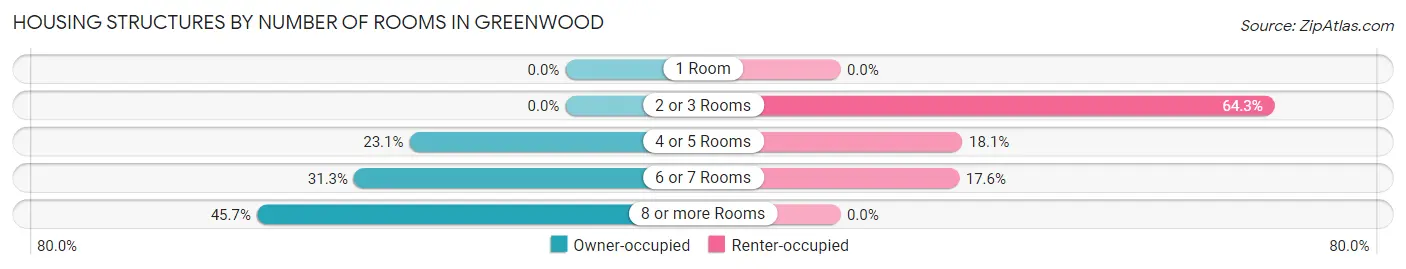
| Number of Rooms | Owner-occupied | Renter-occupied |
| 1 Room | 0 (0.0%) | 0 (0.0%) |
| 2 or 3 Rooms | 0 (0.0%) | 128 (64.3%) |
| 4 or 5 Rooms | 284 (23.1%) | 36 (18.1%) |
| 6 or 7 Rooms | 385 (31.3%) | 35 (17.6%) |
| 8 or more Rooms | 562 (45.7%) | 0 (0.0%) |
| Total | 1,231 (100.0%) | 199 (100.0%) |
Housing Structure by Heating Type in Greenwood
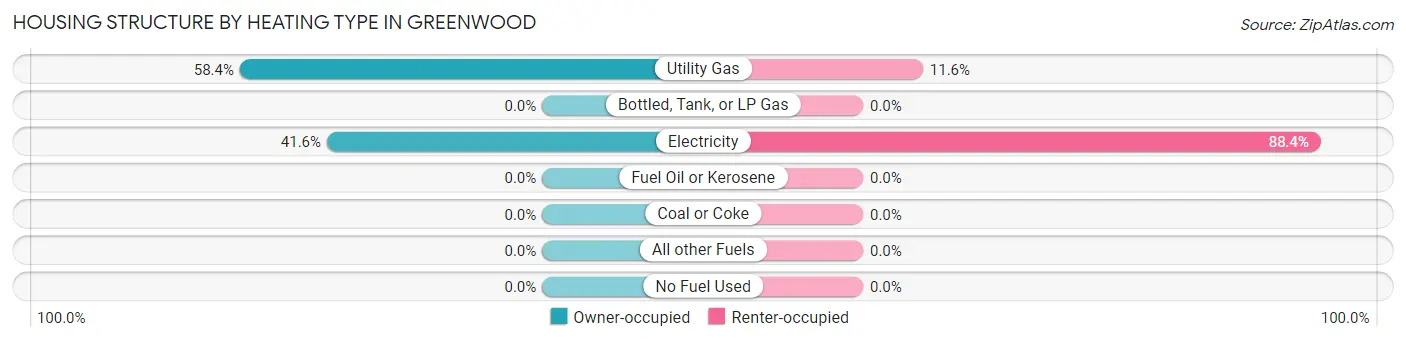
| Heating Type | Owner-occupied | Renter-occupied |
| Utility Gas | 719 (58.4%) | 23 (11.6%) |
| Bottled, Tank, or LP Gas | 0 (0.0%) | 0 (0.0%) |
| Electricity | 512 (41.6%) | 176 (88.4%) |
| Fuel Oil or Kerosene | 0 (0.0%) | 0 (0.0%) |
| Coal or Coke | 0 (0.0%) | 0 (0.0%) |
| All other Fuels | 0 (0.0%) | 0 (0.0%) |
| No Fuel Used | 0 (0.0%) | 0 (0.0%) |
| Total | 1,231 (100.0%) | 199 (100.0%) |
Household Vehicle Usage in Greenwood
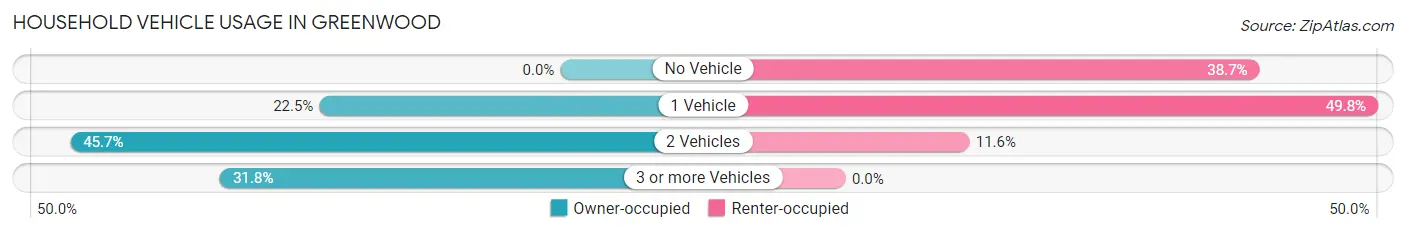
| Vehicles per Household | Owner-occupied | Renter-occupied |
| No Vehicle | 0 (0.0%) | 77 (38.7%) |
| 1 Vehicle | 277 (22.5%) | 99 (49.7%) |
| 2 Vehicles | 563 (45.7%) | 23 (11.6%) |
| 3 or more Vehicles | 391 (31.8%) | 0 (0.0%) |
| Total | 1,231 (100.0%) | 199 (100.0%) |
Real Estate & Mortgages in Greenwood
Real Estate and Mortgage Overview in Greenwood
| Characteristic | Without Mortgage | With Mortgage |
| Housing Units | 426 | 805 |
| Median Property Value | $205,400 | $243,900 |
| Median Household Income | $59,808 | $196 |
| Monthly Housing Costs | $457 | $41 |
| Real Estate Taxes | $1,176 | $129 |
Property Value by Mortgage Status in Greenwood
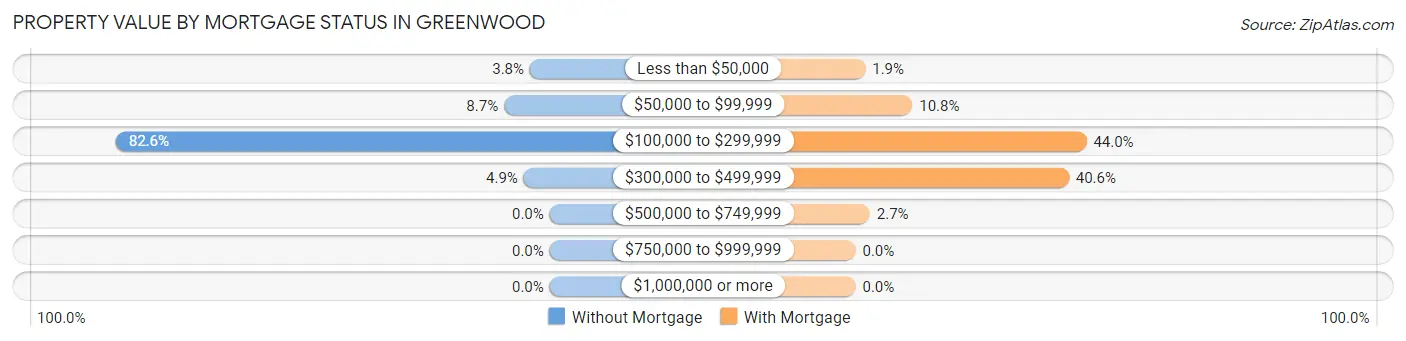
| Property Value | Without Mortgage | With Mortgage |
| Less than $50,000 | 16 (3.8%) | 15 (1.9%) |
| $50,000 to $99,999 | 37 (8.7%) | 87 (10.8%) |
| $100,000 to $299,999 | 352 (82.6%) | 354 (44.0%) |
| $300,000 to $499,999 | 21 (4.9%) | 327 (40.6%) |
| $500,000 to $749,999 | 0 (0.0%) | 22 (2.7%) |
| $750,000 to $999,999 | 0 (0.0%) | 0 (0.0%) |
| $1,000,000 or more | 0 (0.0%) | 0 (0.0%) |
| Total | 426 (100.0%) | 805 (100.0%) |
Household Income by Mortgage Status in Greenwood
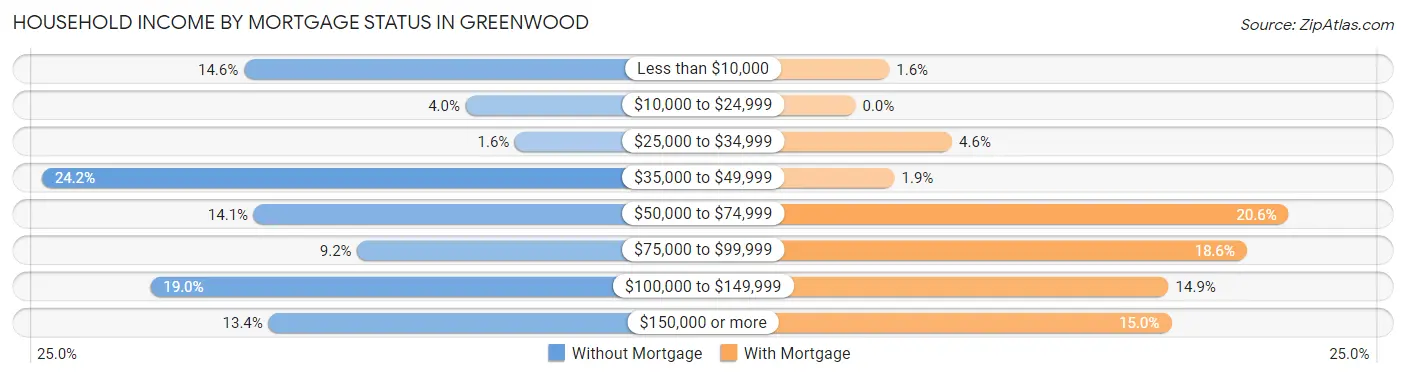
| Household Income | Without Mortgage | With Mortgage |
| Less than $10,000 | 62 (14.5%) | 13 (1.6%) |
| $10,000 to $24,999 | 17 (4.0%) | 0 (0.0%) |
| $25,000 to $34,999 | 7 (1.6%) | 37 (4.6%) |
| $35,000 to $49,999 | 103 (24.2%) | 15 (1.9%) |
| $50,000 to $74,999 | 60 (14.1%) | 166 (20.6%) |
| $75,000 to $99,999 | 39 (9.1%) | 150 (18.6%) |
| $100,000 to $149,999 | 81 (19.0%) | 120 (14.9%) |
| $150,000 or more | 57 (13.4%) | 121 (15.0%) |
| Total | 426 (100.0%) | 805 (100.0%) |
Property Value to Household Income Ratio in Greenwood
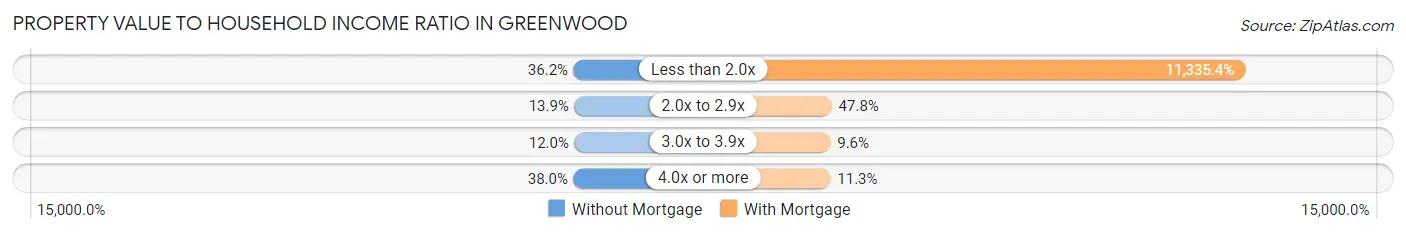
| Value-to-Income Ratio | Without Mortgage | With Mortgage |
| Less than 2.0x | 154 (36.1%) | 91,250 (11,335.4%) |
| 2.0x to 2.9x | 59 (13.9%) | 385 (47.8%) |
| 3.0x to 3.9x | 51 (12.0%) | 77 (9.6%) |
| 4.0x or more | 162 (38.0%) | 91 (11.3%) |
| Total | 426 (100.0%) | 805 (100.0%) |
Real Estate Taxes by Mortgage Status in Greenwood
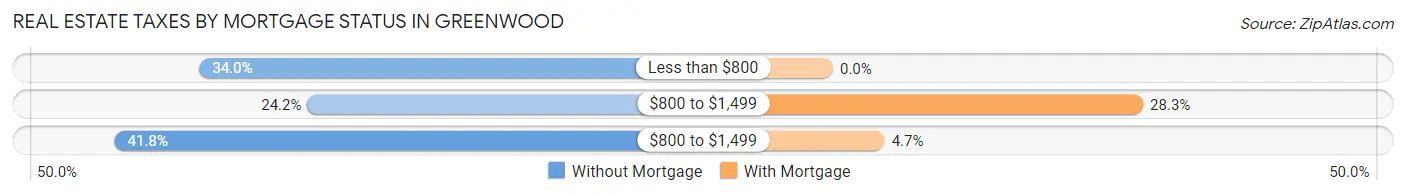
| Property Taxes | Without Mortgage | With Mortgage |
| Less than $800 | 145 (34.0%) | 0 (0.0%) |
| $800 to $1,499 | 103 (24.2%) | 228 (28.3%) |
| $800 to $1,499 | 178 (41.8%) | 38 (4.7%) |
| Total | 426 (100.0%) | 805 (100.0%) |
Health & Disability in Greenwood
Health Insurance Coverage by Age in Greenwood
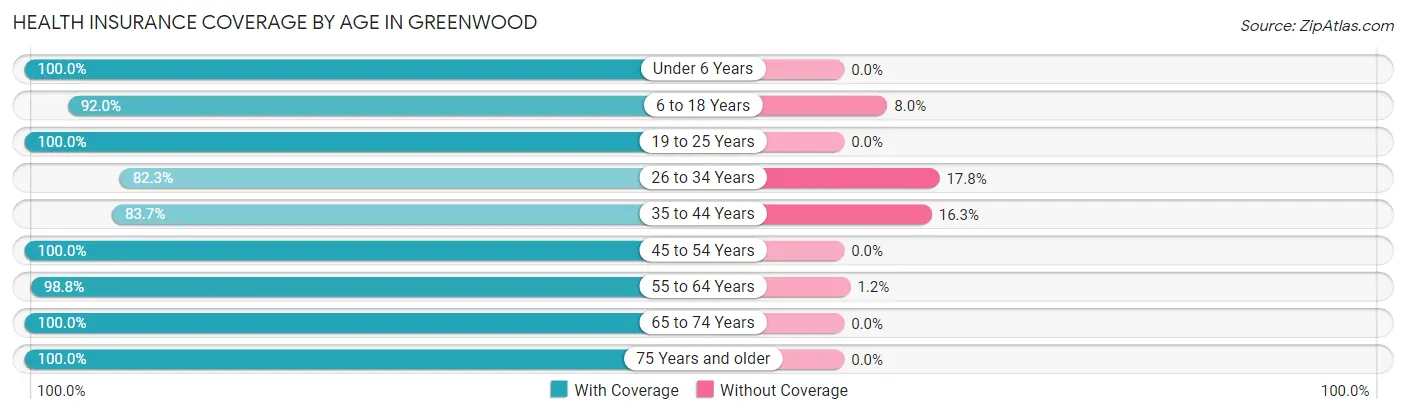
| Age Bracket | With Coverage | Without Coverage |
| Under 6 Years | 133 (100.0%) | 0 (0.0%) |
| 6 to 18 Years | 366 (92.0%) | 32 (8.0%) |
| 19 to 25 Years | 87 (100.0%) | 0 (0.0%) |
| 26 to 34 Years | 227 (82.3%) | 49 (17.7%) |
| 35 to 44 Years | 313 (83.7%) | 61 (16.3%) |
| 45 to 54 Years | 440 (100.0%) | 0 (0.0%) |
| 55 to 64 Years | 598 (98.8%) | 7 (1.2%) |
| 65 to 74 Years | 513 (100.0%) | 0 (0.0%) |
| 75 Years and older | 323 (100.0%) | 0 (0.0%) |
| Total | 3,000 (95.3%) | 149 (4.7%) |
Health Insurance Coverage by Citizenship Status in Greenwood
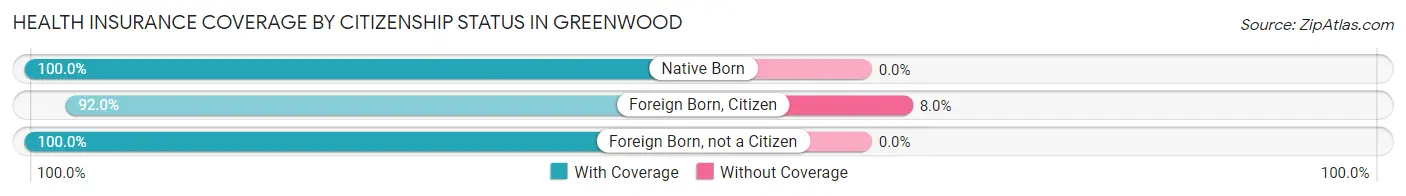
| Citizenship Status | With Coverage | Without Coverage |
| Native Born | 133 (100.0%) | 0 (0.0%) |
| Foreign Born, Citizen | 366 (92.0%) | 32 (8.0%) |
| Foreign Born, not a Citizen | 87 (100.0%) | 0 (0.0%) |
Health Insurance Coverage by Household Income in Greenwood
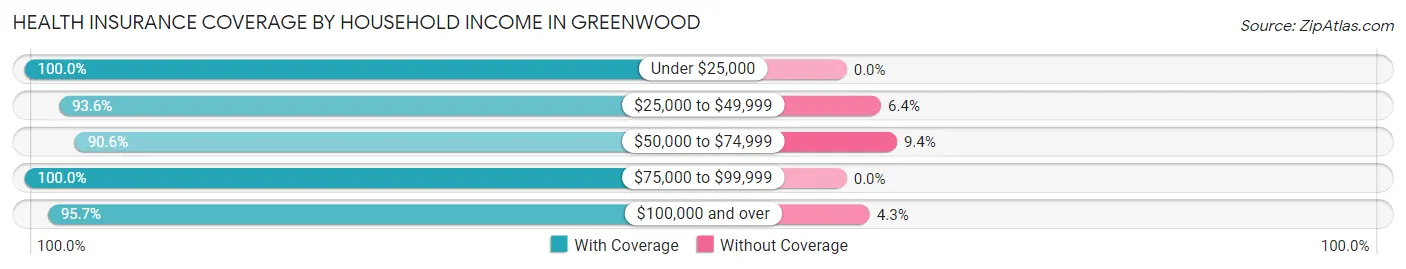
| Household Income | With Coverage | Without Coverage |
| Under $25,000 | 247 (100.0%) | 0 (0.0%) |
| $25,000 to $49,999 | 610 (93.6%) | 42 (6.4%) |
| $50,000 to $74,999 | 472 (90.6%) | 49 (9.4%) |
| $75,000 to $99,999 | 390 (100.0%) | 0 (0.0%) |
| $100,000 and over | 1,281 (95.7%) | 58 (4.3%) |
Public vs Private Health Insurance Coverage by Age in Greenwood
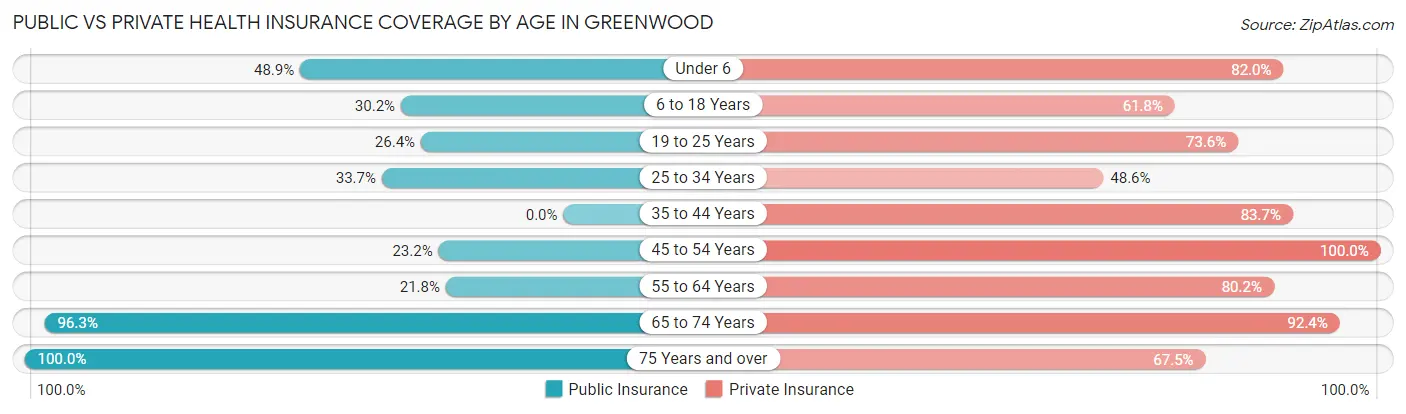
| Age Bracket | Public Insurance | Private Insurance |
| Under 6 | 65 (48.9%) | 109 (82.0%) |
| 6 to 18 Years | 120 (30.1%) | 246 (61.8%) |
| 19 to 25 Years | 23 (26.4%) | 64 (73.6%) |
| 25 to 34 Years | 93 (33.7%) | 134 (48.5%) |
| 35 to 44 Years | 0 (0.0%) | 313 (83.7%) |
| 45 to 54 Years | 102 (23.2%) | 440 (100.0%) |
| 55 to 64 Years | 132 (21.8%) | 485 (80.2%) |
| 65 to 74 Years | 494 (96.3%) | 474 (92.4%) |
| 75 Years and over | 323 (100.0%) | 218 (67.5%) |
| Total | 1,352 (42.9%) | 2,483 (78.8%) |
Disability Status by Sex by Age in Greenwood
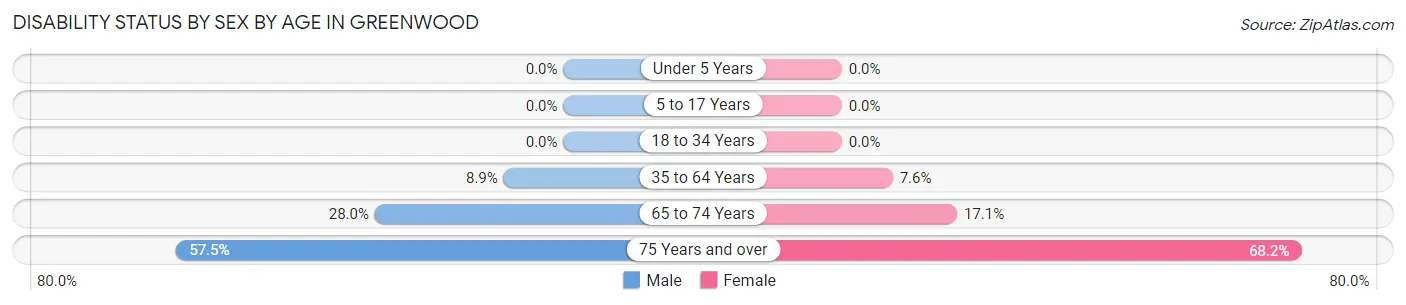
| Age Bracket | Male | Female |
| Under 5 Years | 0 (0.0%) | 0 (0.0%) |
| 5 to 17 Years | 0 (0.0%) | 0 (0.0%) |
| 18 to 34 Years | 0 (0.0%) | 0 (0.0%) |
| 35 to 64 Years | 66 (8.9%) | 51 (7.6%) |
| 65 to 74 Years | 70 (28.0%) | 45 (17.1%) |
| 75 Years and over | 50 (57.5%) | 161 (68.2%) |
Disability Class by Sex by Age in Greenwood
Disability Class: Hearing Difficulty
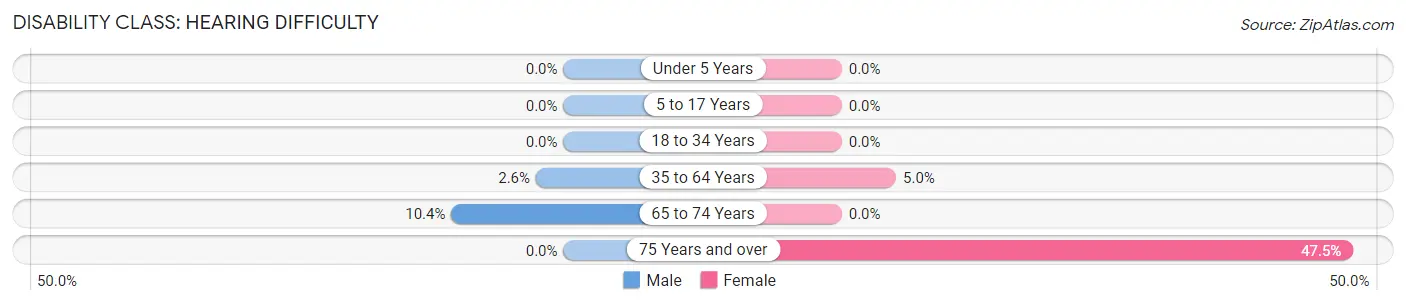
| Age Bracket | Male | Female |
| Under 5 Years | 0 (0.0%) | 0 (0.0%) |
| 5 to 17 Years | 0 (0.0%) | 0 (0.0%) |
| 18 to 34 Years | 0 (0.0%) | 0 (0.0%) |
| 35 to 64 Years | 19 (2.5%) | 34 (5.0%) |
| 65 to 74 Years | 26 (10.4%) | 0 (0.0%) |
| 75 Years and over | 0 (0.0%) | 112 (47.5%) |
Disability Class: Vision Difficulty
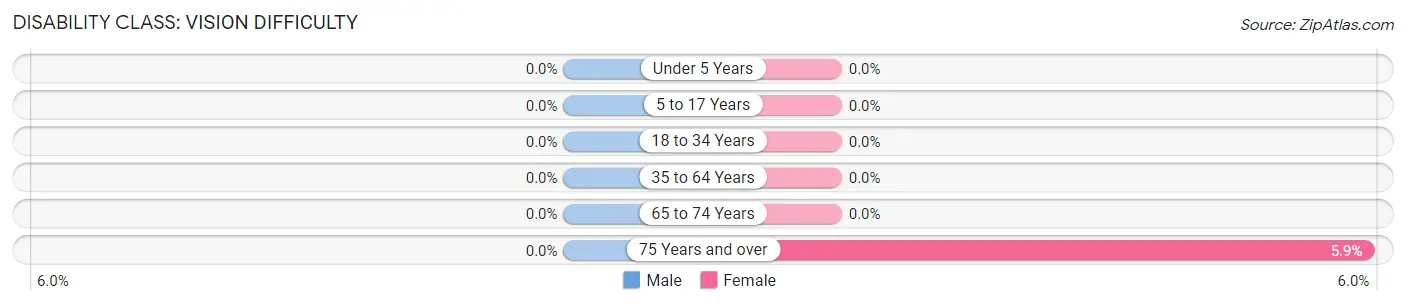
| Age Bracket | Male | Female |
| Under 5 Years | 0 (0.0%) | 0 (0.0%) |
| 5 to 17 Years | 0 (0.0%) | 0 (0.0%) |
| 18 to 34 Years | 0 (0.0%) | 0 (0.0%) |
| 35 to 64 Years | 0 (0.0%) | 0 (0.0%) |
| 65 to 74 Years | 0 (0.0%) | 0 (0.0%) |
| 75 Years and over | 0 (0.0%) | 14 (5.9%) |
Disability Class: Cognitive Difficulty
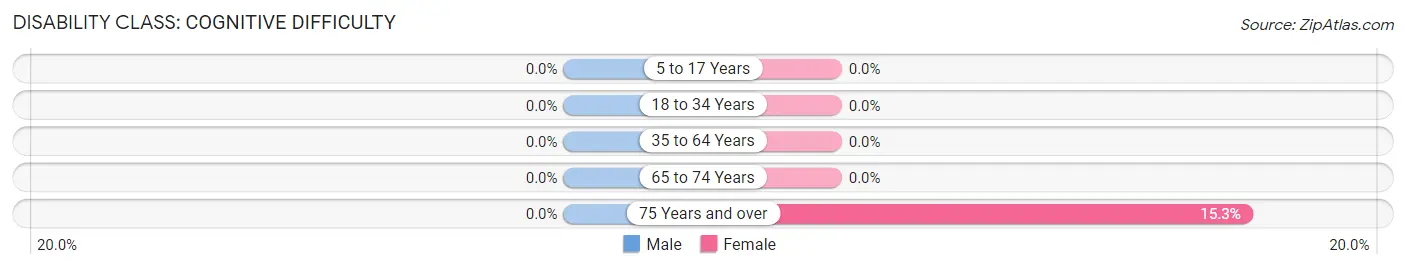
| Age Bracket | Male | Female |
| 5 to 17 Years | 0 (0.0%) | 0 (0.0%) |
| 18 to 34 Years | 0 (0.0%) | 0 (0.0%) |
| 35 to 64 Years | 0 (0.0%) | 0 (0.0%) |
| 65 to 74 Years | 0 (0.0%) | 0 (0.0%) |
| 75 Years and over | 0 (0.0%) | 36 (15.2%) |
Disability Class: Ambulatory Difficulty
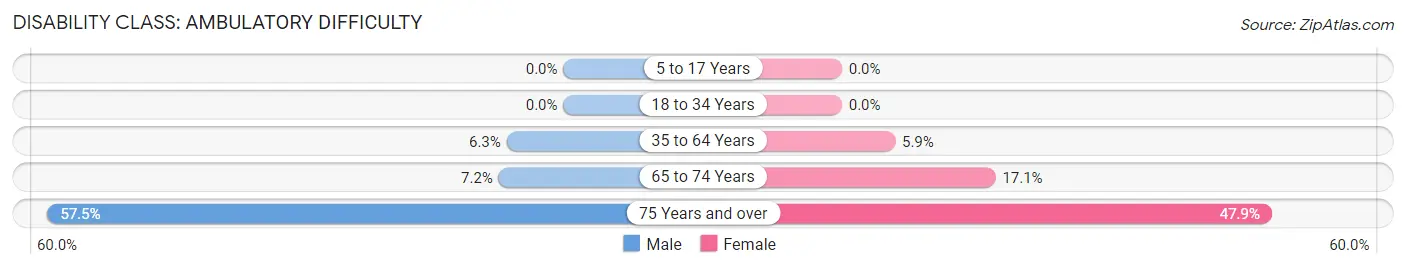
| Age Bracket | Male | Female |
| 5 to 17 Years | 0 (0.0%) | 0 (0.0%) |
| 18 to 34 Years | 0 (0.0%) | 0 (0.0%) |
| 35 to 64 Years | 47 (6.3%) | 40 (5.9%) |
| 65 to 74 Years | 18 (7.2%) | 45 (17.1%) |
| 75 Years and over | 50 (57.5%) | 113 (47.9%) |
Disability Class: Self-Care Difficulty
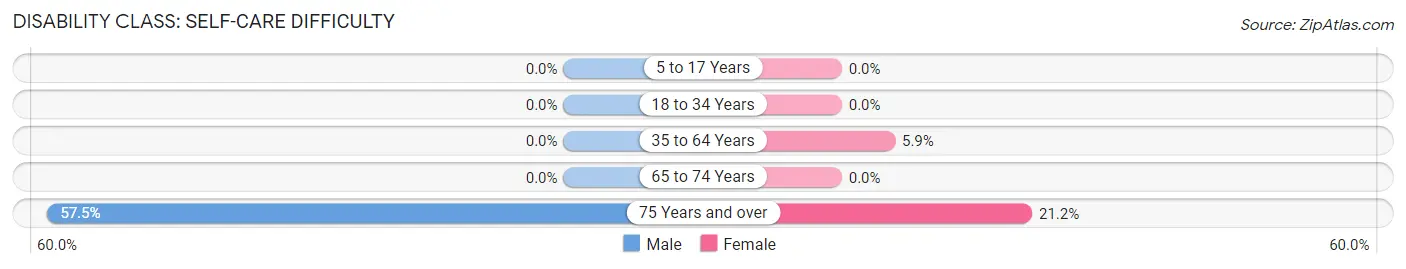
| Age Bracket | Male | Female |
| 5 to 17 Years | 0 (0.0%) | 0 (0.0%) |
| 18 to 34 Years | 0 (0.0%) | 0 (0.0%) |
| 35 to 64 Years | 0 (0.0%) | 40 (5.9%) |
| 65 to 74 Years | 0 (0.0%) | 0 (0.0%) |
| 75 Years and over | 50 (57.5%) | 50 (21.2%) |
Technology Access in Greenwood
Computing Device Access in Greenwood
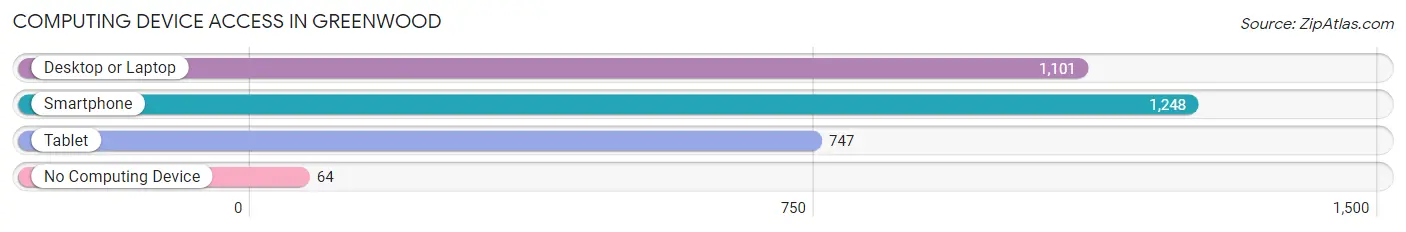
| Device Type | # Households | % Households |
| Desktop or Laptop | 1,101 | 77.0% |
| Smartphone | 1,248 | 87.3% |
| Tablet | 747 | 52.2% |
| No Computing Device | 64 | 4.5% |
| Total | 1,430 | 100.0% |
Internet Access in Greenwood
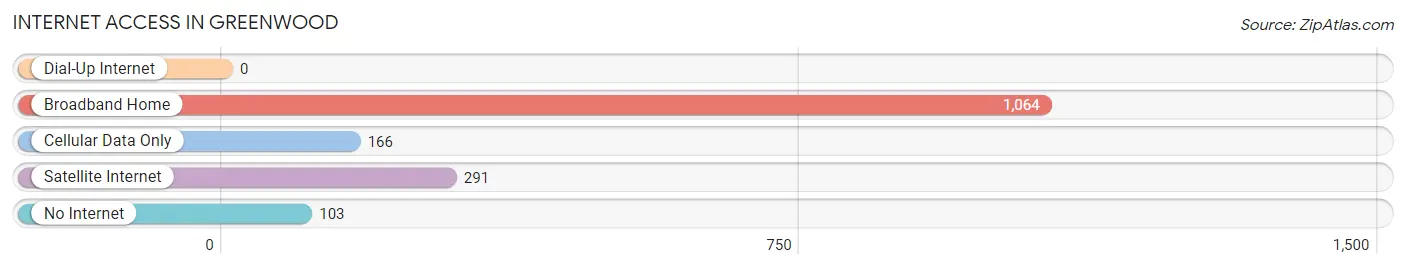
| Internet Type | # Households | % Households |
| Dial-Up Internet | 0 | 0.0% |
| Broadband Home | 1,064 | 74.4% |
| Cellular Data Only | 166 | 11.6% |
| Satellite Internet | 291 | 20.3% |
| No Internet | 103 | 7.2% |
| Total | 1,430 | 100.0% |
Greenwood Summary
Greenwood is a small town located in Caddo Parish, Louisiana. It is situated on the banks of the Red River, approximately 20 miles south of Shreveport. The town has a population of approximately 2,000 people and is part of the Shreveport-Bossier City metropolitan area.
History
Greenwood was founded in 1836 by a group of settlers from the nearby town of Grand Cane. The town was named after the Greenwood Plantation, which was owned by one of the settlers. The plantation was located on the banks of the Red River and was used to grow cotton and other crops.
In the late 19th century, Greenwood became a major center for the lumber industry. The town was home to several sawmills and lumber yards, which provided employment for many of the town’s residents.
In the early 20th century, Greenwood experienced a period of growth and prosperity. The town was home to several businesses, including a bank, a hotel, a movie theater, and a variety of stores.
Geography
Greenwood is located in Caddo Parish, Louisiana. The town is situated on the banks of the Red River, approximately 20 miles south of Shreveport. The town is surrounded by a variety of natural features, including forests, swamps, and wetlands.
The climate in Greenwood is humid subtropical, with hot, humid summers and mild winters. The average annual temperature is 68°F (20°C). The average annual precipitation is 48 inches (122 cm).
Economy
Greenwood’s economy is largely based on agriculture and forestry. The town is home to several farms, which produce a variety of crops, including cotton, soybeans, corn, and wheat. The town is also home to several sawmills and lumber yards, which provide employment for many of the town’s residents.
In addition to agriculture and forestry, Greenwood is home to a variety of businesses, including restaurants, retail stores, and service providers. The town is also home to a variety of manufacturing companies, which produce a variety of products, including furniture, clothing, and electronics.
Demographics
As of the 2010 census, Greenwood had a population of 2,000 people. The racial makeup of the town was 79.2% White, 17.2% African American, 0.7% Native American, 0.3% Asian, 0.1% Pacific Islander, and 2.5% from other races. The median household income was $31,250, and the median family income was $37,500.
The town is served by the Caddo Parish Public Schools system. The town is home to one elementary school, one middle school, and one high school. The town is also home to a variety of churches, including Baptist, Methodist, and Catholic.
Common Questions
What is Per Capita Income in Greenwood?
Per Capita income in Greenwood is $42,213.
What is the Median Family Income in Greenwood?
Median Family Income in Greenwood is $97,847.
What is the Median Household income in Greenwood?
Median Household Income in Greenwood is $63,696.
What is Income or Wage Gap in Greenwood?
Income or Wage Gap in Greenwood is 2.2%.
Women in Greenwood earn 97.8 cents for every dollar earned by a man.
What is Inequality or Gini Index in Greenwood?
Inequality or Gini Index in Greenwood is 0.45.
What is the Total Population of Greenwood?
Total Population of Greenwood is 3,149.
What is the Total Male Population of Greenwood?
Total Male Population of Greenwood is 1,592.
What is the Total Female Population of Greenwood?
Total Female Population of Greenwood is 1,557.
What is the Ratio of Males per 100 Females in Greenwood?
There are 102.25 Males per 100 Females in Greenwood.
What is the Ratio of Females per 100 Males in Greenwood?
There are 97.80 Females per 100 Males in Greenwood.
What is the Median Population Age in Greenwood?
Median Population Age in Greenwood is 53.2 Years.
What is the Average Family Size in Greenwood
Average Family Size in Greenwood is 2.6 People.
What is the Average Household Size in Greenwood
Average Household Size in Greenwood is 2.2 People.
How Large is the Labor Force in Greenwood?
There are 1,644 People in the Labor Forcein in Greenwood.
What is the Percentage of People in the Labor Force in Greenwood?
60.1% of People are in the Labor Force in Greenwood.
What is the Unemployment Rate in Greenwood?
Unemployment Rate in Greenwood is 0.4%.