Grayson, LA Map & Demographics
Grayson Map
Grayson Overview
$23,455
PER CAPITA INCOME
$58,375
AVG FAMILY INCOME
$47,917
AVG HOUSEHOLD INCOME
73.3%
WAGE / INCOME GAP [ % ]
26.7¢/ $1
WAGE / INCOME GAP [ $ ]
$13,815
FAMILY INCOME DEFICIT
0.51
INEQUALITY / GINI INDEX
633
TOTAL POPULATION
270
MALE POPULATION
363
FEMALE POPULATION
74.38
MALES / 100 FEMALES
134.44
FEMALES / 100 MALES
20.6
MEDIAN AGE
3.9
AVG FAMILY SIZE
3.0
AVG HOUSEHOLD SIZE
218
LABOR FORCE [ PEOPLE ]
65.1%
PERCENT IN LABOR FORCE
10.6%
UNEMPLOYMENT RATE
Grayson Zip Codes
Grayson Area Codes
Income in Grayson
Income Overview in Grayson
Per Capita Income in Grayson is $23,455, while median incomes of families and households are $58,375 and $47,917 respectively.
| Characteristic | Number | Measure |
| Per Capita Income | 633 | $23,455 |
| Median Family Income | 135 | $58,375 |
| Mean Family Income | 135 | $75,744 |
| Median Household Income | 209 | $47,917 |
| Mean Household Income | 209 | $67,987 |
| Income Deficit | 135 | $13,815 |
| Wage / Income Gap (%) | 633 | 73.29% |
| Wage / Income Gap ($) | 633 | 26.71¢ per $1 |
| Gini / Inequality Index | 633 | 0.51 |
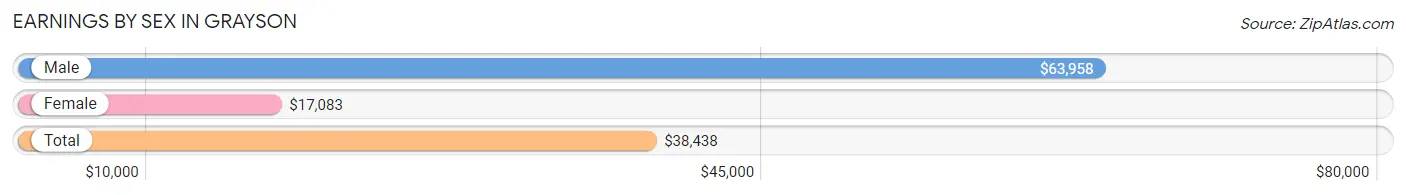
Earnings by Sex in Grayson
Average Earnings in Grayson are $38,438, $63,958 for men and $17,083 for women, a difference of 73.3%.
| Sex | Number | Average Earnings |
| Male | 111 (52.4%) | $63,958 |
| Female | 101 (47.6%) | $17,083 |
| Total | 212 (100.0%) | $38,438 |
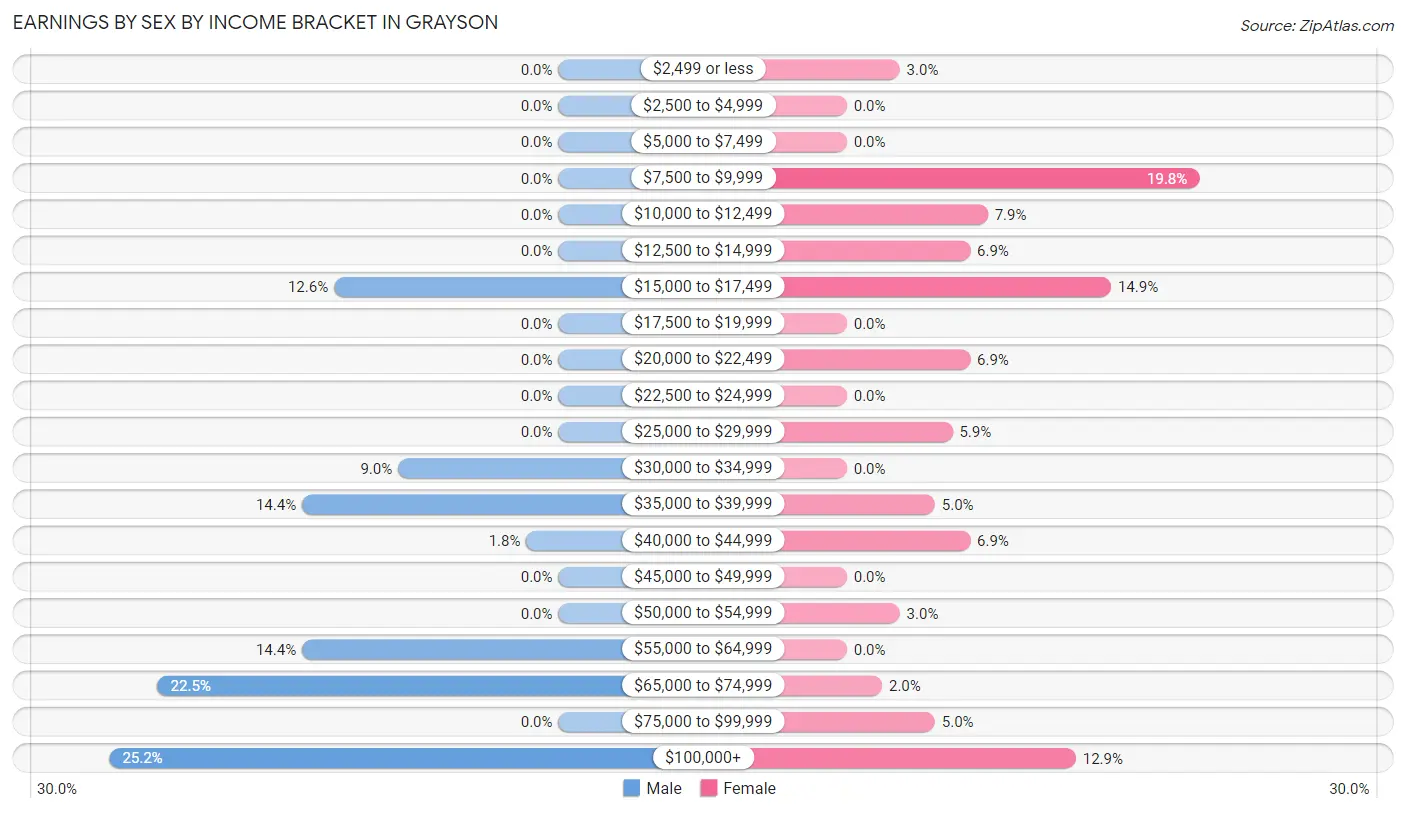
Earnings by Sex by Income Bracket in Grayson
The most common earnings brackets in Grayson are $100,000+ for men (28 | 25.2%) and $7,500 to $9,999 for women (20 | 19.8%).
| Income | Male | Female |
| $2,499 or less | 0 (0.0%) | 3 (3.0%) |
| $2,500 to $4,999 | 0 (0.0%) | 0 (0.0%) |
| $5,000 to $7,499 | 0 (0.0%) | 0 (0.0%) |
| $7,500 to $9,999 | 0 (0.0%) | 20 (19.8%) |
| $10,000 to $12,499 | 0 (0.0%) | 8 (7.9%) |
| $12,500 to $14,999 | 0 (0.0%) | 7 (6.9%) |
| $15,000 to $17,499 | 14 (12.6%) | 15 (14.8%) |
| $17,500 to $19,999 | 0 (0.0%) | 0 (0.0%) |
| $20,000 to $22,499 | 0 (0.0%) | 7 (6.9%) |
| $22,500 to $24,999 | 0 (0.0%) | 0 (0.0%) |
| $25,000 to $29,999 | 0 (0.0%) | 6 (5.9%) |
| $30,000 to $34,999 | 10 (9.0%) | 0 (0.0%) |
| $35,000 to $39,999 | 16 (14.4%) | 5 (5.0%) |
| $40,000 to $44,999 | 2 (1.8%) | 7 (6.9%) |
| $45,000 to $49,999 | 0 (0.0%) | 0 (0.0%) |
| $50,000 to $54,999 | 0 (0.0%) | 3 (3.0%) |
| $55,000 to $64,999 | 16 (14.4%) | 0 (0.0%) |
| $65,000 to $74,999 | 25 (22.5%) | 2 (2.0%) |
| $75,000 to $99,999 | 0 (0.0%) | 5 (5.0%) |
| $100,000+ | 28 (25.2%) | 13 (12.9%) |
| Total | 111 (100.0%) | 101 (100.0%) |
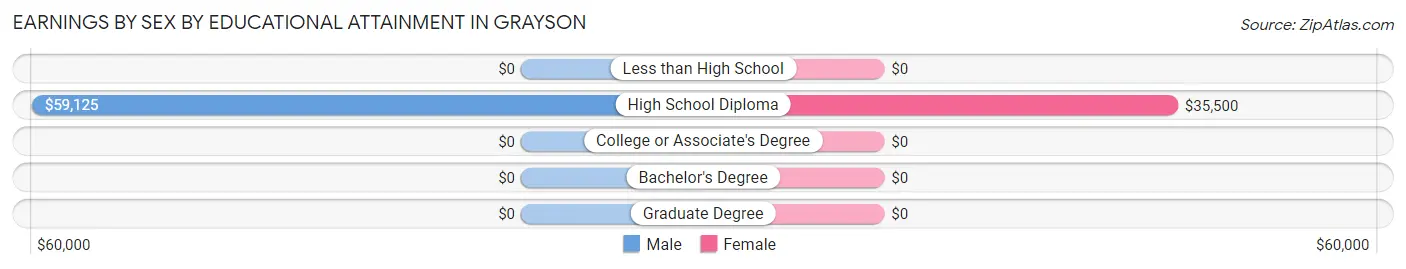
Earnings by Sex by Educational Attainment in Grayson
Average earnings in Grayson are $59,500 for men and $21,607 for women, a difference of 63.7%. Men with an educational attainment of high school diploma enjoy the highest average annual earnings of $59,125, while those with high school diploma education earn the least with $59,125. Women with an educational attainment of high school diploma earn the most with the average annual earnings of $35,500, while those with high school diploma education have the smallest earnings of $35,500.
| Educational Attainment | Male Income | Female Income |
| Less than High School | - | - |
| High School Diploma | $59,125 | $35,500 |
| College or Associate's Degree | - | - |
| Bachelor's Degree | - | - |
| Graduate Degree | - | - |
| Total | $59,500 | $21,607 |
Family Income in Grayson
Family Income Brackets in Grayson
According to the Grayson family income data, there are 37 families falling into the $50,000 to $74,999 income range, which is the most common income bracket and makes up 27.4% of all families.
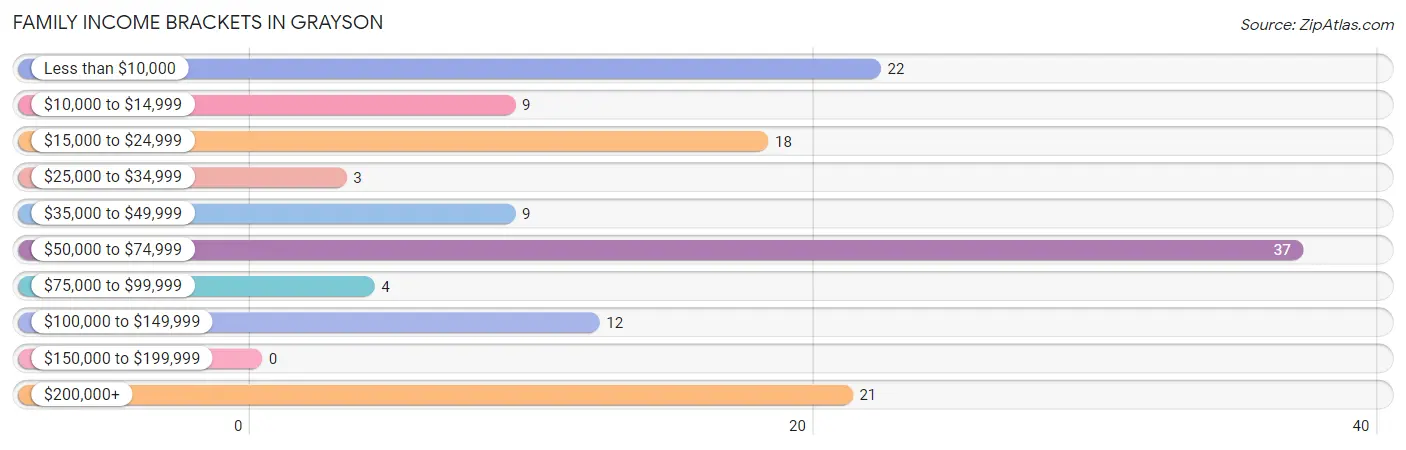
| Income Bracket | # Families | % Families |
| Less than $10,000 | 22 | 16.3% |
| $10,000 to $14,999 | 9 | 6.7% |
| $15,000 to $24,999 | 18 | 13.3% |
| $25,000 to $34,999 | 3 | 2.2% |
| $35,000 to $49,999 | 9 | 6.7% |
| $50,000 to $74,999 | 37 | 27.4% |
| $75,000 to $99,999 | 4 | 3.0% |
| $100,000 to $149,999 | 12 | 8.9% |
| $150,000 to $199,999 | 0 | 0.0% |
| $200,000+ | 21 | 15.6% |
Family Income by Famaliy Size in Grayson
| Income Bracket | # Families | Median Income |
| 2-Person Families | 46 (34.1%) | $0 |
| 3-Person Families | 27 (20.0%) | $0 |
| 4-Person Families | 43 (31.9%) | $0 |
| 5-Person Families | 15 (11.1%) | $0 |
| 6-Person Families | 0 (0.0%) | $0 |
| 7+ Person Families | 4 (3.0%) | $0 |
| Total | 135 (100.0%) | $58,375 |
Family Income by Number of Earners in Grayson
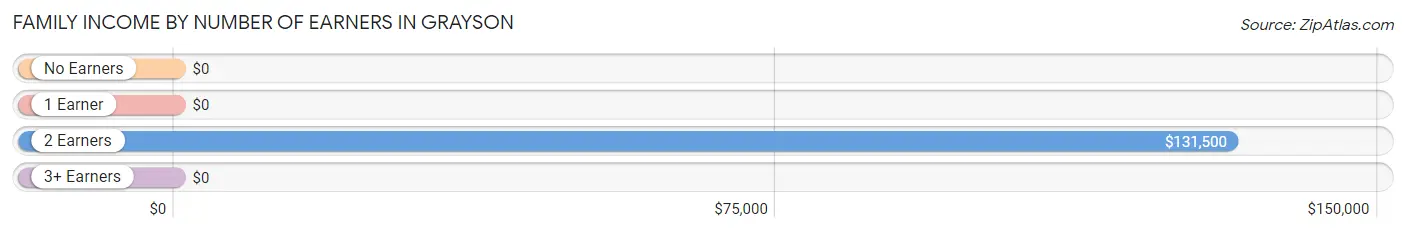
| Number of Earners | # Families | Median Income |
| No Earners | 17 (12.6%) | $0 |
| 1 Earner | 86 (63.7%) | $0 |
| 2 Earners | 32 (23.7%) | $131,500 |
| 3+ Earners | 0 (0.0%) | $0 |
| Total | 135 (100.0%) | $58,375 |
Household Income in Grayson
Household Income Brackets in Grayson
With 55 households falling in the category, the $50,000 to $74,999 income range is the most frequent in Grayson, accounting for 26.3% of all households. In contrast, only 6 households (2.9%) fall into the $75,000 to $99,999 income bracket, making it the least populous group.
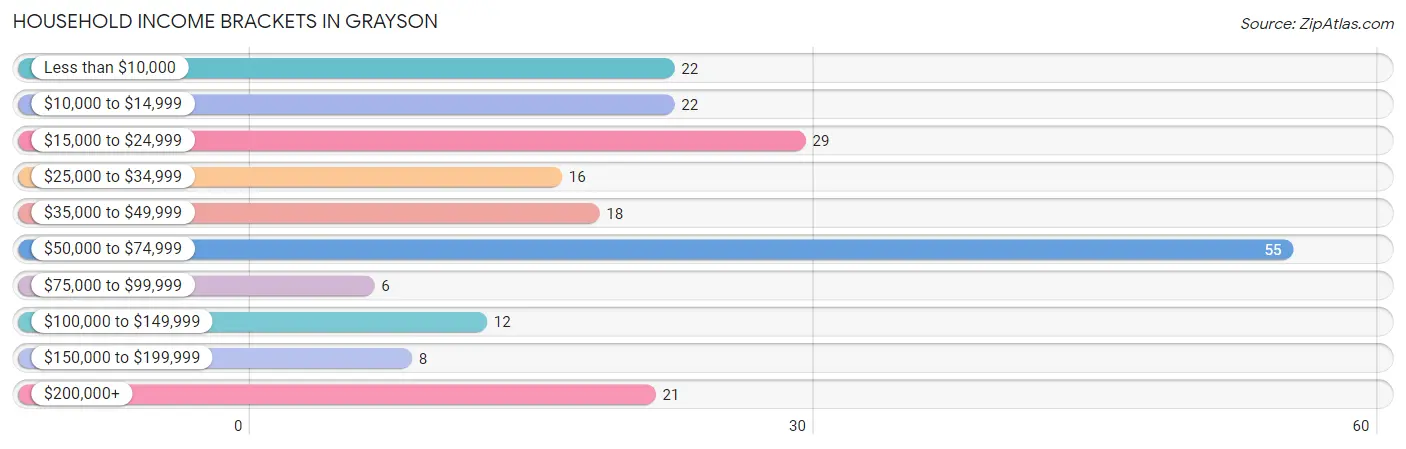
| Income Bracket | # Households | % Households |
| Less than $10,000 | 22 | 10.5% |
| $10,000 to $14,999 | 22 | 10.5% |
| $15,000 to $24,999 | 29 | 13.9% |
| $25,000 to $34,999 | 16 | 7.7% |
| $35,000 to $49,999 | 18 | 8.6% |
| $50,000 to $74,999 | 55 | 26.3% |
| $75,000 to $99,999 | 6 | 2.9% |
| $100,000 to $149,999 | 12 | 5.7% |
| $150,000 to $199,999 | 8 | 3.8% |
| $200,000+ | 21 | 10.0% |
Household Income by Householder Age in Grayson
The median household income in Grayson is $47,917, with the highest median household income of $59,750 found in the 25 to 44 years age bracket for the primary householder. A total of 94 households (45.0%) fall into this category. Meanwhile, the 15 to 24 years age bracket for the primary householder has the lowest median household income of $0, with 25 households (12.0%) in this group.
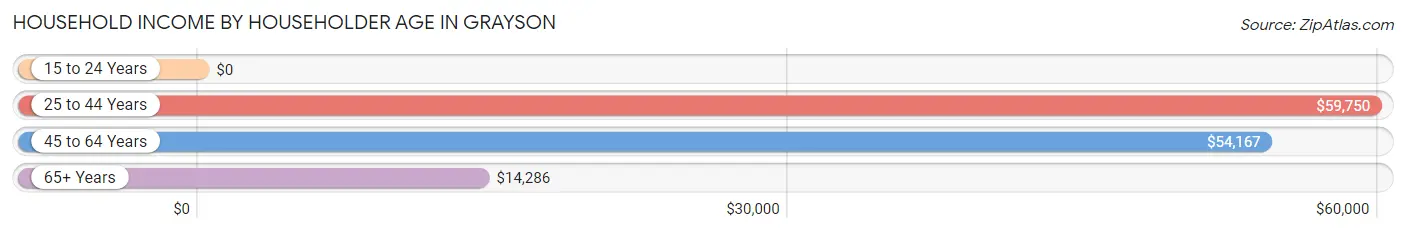
| Income Bracket | # Households | Median Income |
| 15 to 24 Years | 25 (12.0%) | $0 |
| 25 to 44 Years | 94 (45.0%) | $59,750 |
| 45 to 64 Years | 56 (26.8%) | $54,167 |
| 65+ Years | 34 (16.3%) | $14,286 |
| Total | 209 (100.0%) | $47,917 |
Poverty in Grayson
Income Below Poverty by Sex and Age in Grayson
With 20.4% poverty level for males and 38.0% for females among the residents of Grayson, 6 to 11 year old males and 16 and 17 year old females are the most vulnerable to poverty, with 23 males (57.5%) and 6 females (100.0%) in their respective age groups living below the poverty level.
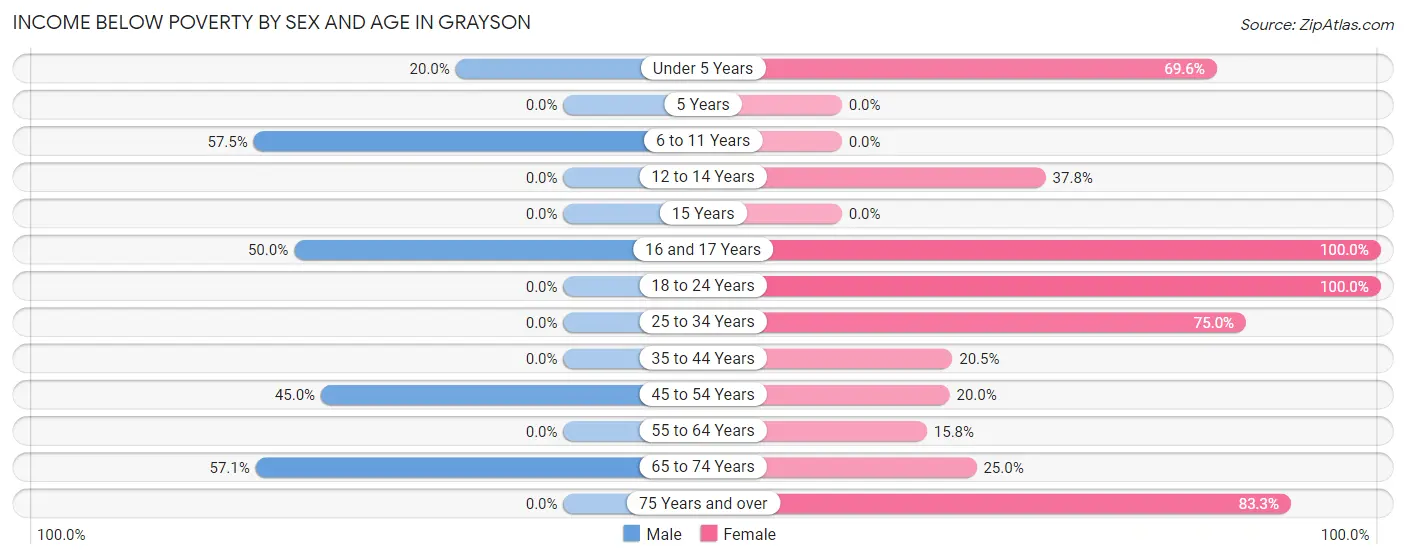
| Age Bracket | Male | Female |
| Under 5 Years | 8 (20.0%) | 16 (69.6%) |
| 5 Years | 0 (0.0%) | 0 (0.0%) |
| 6 to 11 Years | 23 (57.5%) | 0 (0.0%) |
| 12 to 14 Years | 0 (0.0%) | 42 (37.8%) |
| 15 Years | 0 (0.0%) | 0 (0.0%) |
| 16 and 17 Years | 3 (50.0%) | 6 (100.0%) |
| 18 to 24 Years | 0 (0.0%) | 14 (100.0%) |
| 25 to 34 Years | 0 (0.0%) | 36 (75.0%) |
| 35 to 44 Years | 0 (0.0%) | 8 (20.5%) |
| 45 to 54 Years | 9 (45.0%) | 6 (20.0%) |
| 55 to 64 Years | 0 (0.0%) | 3 (15.8%) |
| 65 to 74 Years | 12 (57.1%) | 2 (25.0%) |
| 75 Years and over | 0 (0.0%) | 5 (83.3%) |
| Total | 55 (20.4%) | 138 (38.0%) |
Income Above Poverty by Sex and Age in Grayson
According to the poverty statistics in Grayson, males aged 5 years and females aged 6 to 11 years are the age groups that are most secure financially, with 100.0% of males and 100.0% of females in these age groups living above the poverty line.
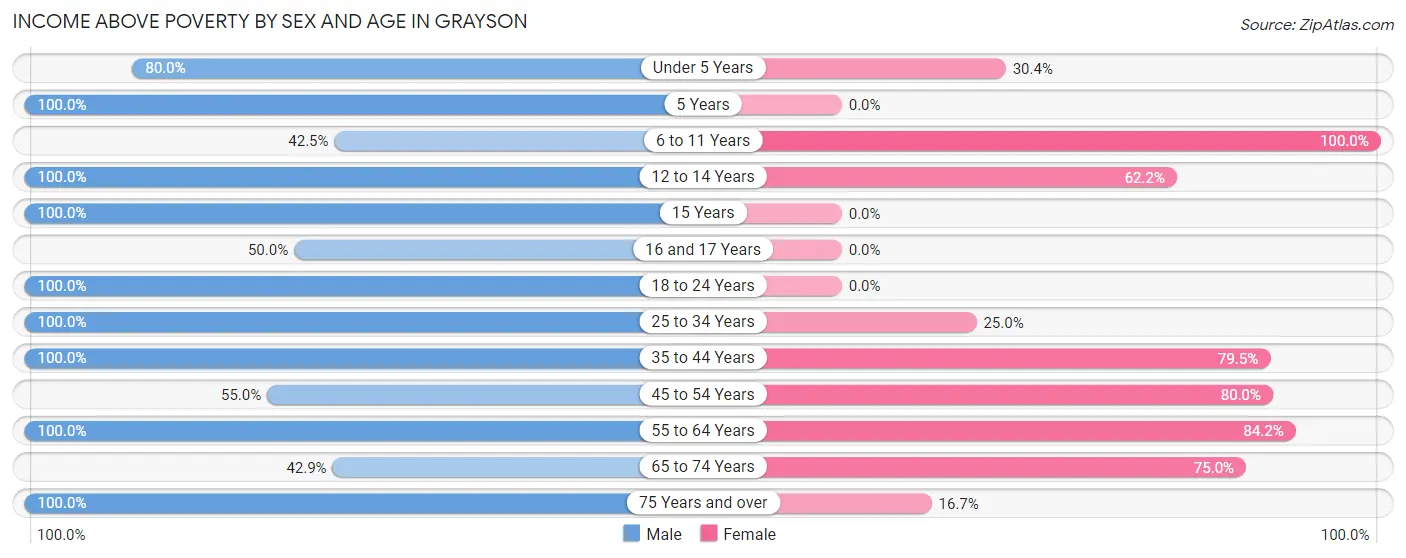
| Age Bracket | Male | Female |
| Under 5 Years | 32 (80.0%) | 7 (30.4%) |
| 5 Years | 7 (100.0%) | 0 (0.0%) |
| 6 to 11 Years | 17 (42.5%) | 59 (100.0%) |
| 12 to 14 Years | 11 (100.0%) | 69 (62.2%) |
| 15 Years | 7 (100.0%) | 0 (0.0%) |
| 16 and 17 Years | 3 (50.0%) | 0 (0.0%) |
| 18 to 24 Years | 11 (100.0%) | 0 (0.0%) |
| 25 to 34 Years | 30 (100.0%) | 12 (25.0%) |
| 35 to 44 Years | 60 (100.0%) | 31 (79.5%) |
| 45 to 54 Years | 11 (55.0%) | 24 (80.0%) |
| 55 to 64 Years | 14 (100.0%) | 16 (84.2%) |
| 65 to 74 Years | 9 (42.9%) | 6 (75.0%) |
| 75 Years and over | 3 (100.0%) | 1 (16.7%) |
| Total | 215 (79.6%) | 225 (62.0%) |
Income Below Poverty Among Married-Couple Families in Grayson
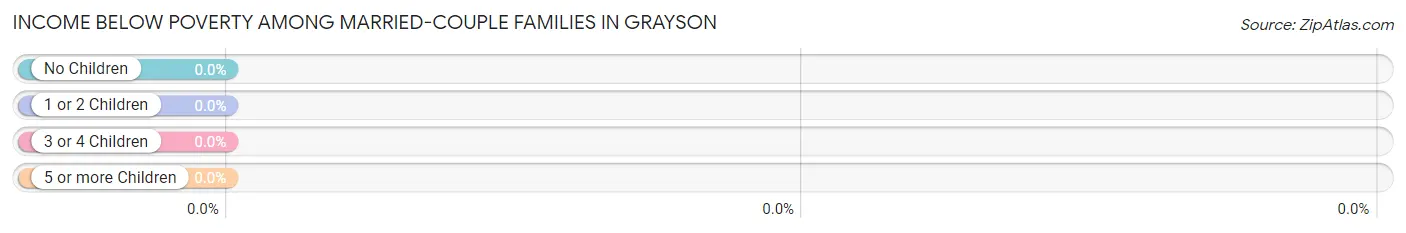
| Children | Above Poverty | Below Poverty |
| No Children | 16 (100.0%) | 0 (0.0%) |
| 1 or 2 Children | 30 (100.0%) | 0 (0.0%) |
| 3 or 4 Children | 0 (0.0%) | 0 (0.0%) |
| 5 or more Children | 4 (100.0%) | 0 (0.0%) |
| Total | 50 (100.0%) | 0 (0.0%) |
Income Below Poverty Among Single-Parent Households in Grayson
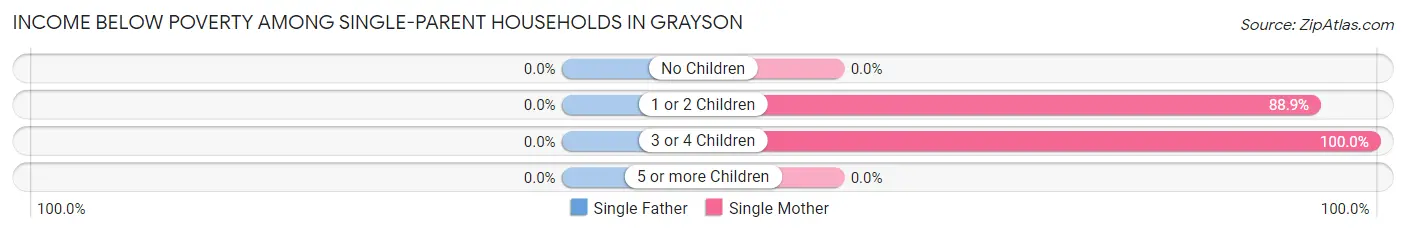
| Children | Single Father | Single Mother |
| No Children | 0 (0.0%) | 0 (0.0%) |
| 1 or 2 Children | 0 (0.0%) | 24 (88.9%) |
| 3 or 4 Children | 0 (0.0%) | 22 (100.0%) |
| 5 or more Children | 0 (0.0%) | 0 (0.0%) |
| Total | 0 (0.0%) | 46 (93.9%) |
Income Below Poverty Among Married-Couple vs Single-Parent Households in Grayson
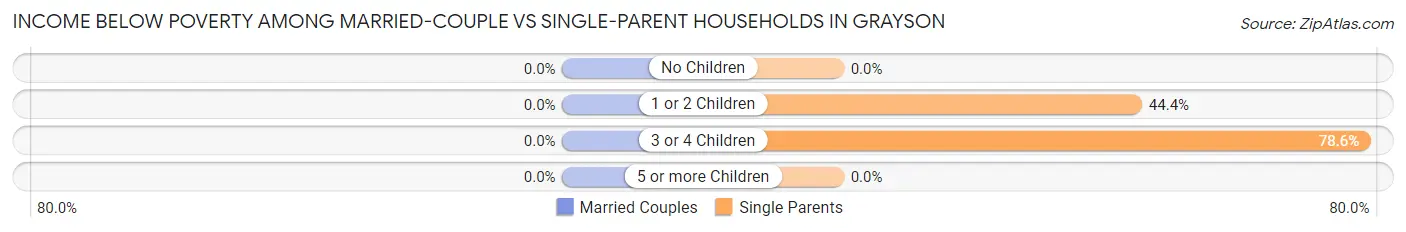
| Children | Married-Couple Families | Single-Parent Households |
| No Children | 0 (0.0%) | 0 (0.0%) |
| 1 or 2 Children | 0 (0.0%) | 24 (44.4%) |
| 3 or 4 Children | 0 (0.0%) | 22 (78.6%) |
| 5 or more Children | 0 (0.0%) | 0 (0.0%) |
| Total | 0 (0.0%) | 46 (54.1%) |
Race in Grayson
The most populous races in Grayson are White / Caucasian (399 | 63.0%), Black / African American (216 | 34.1%), and Two or more Races (18 | 2.8%).
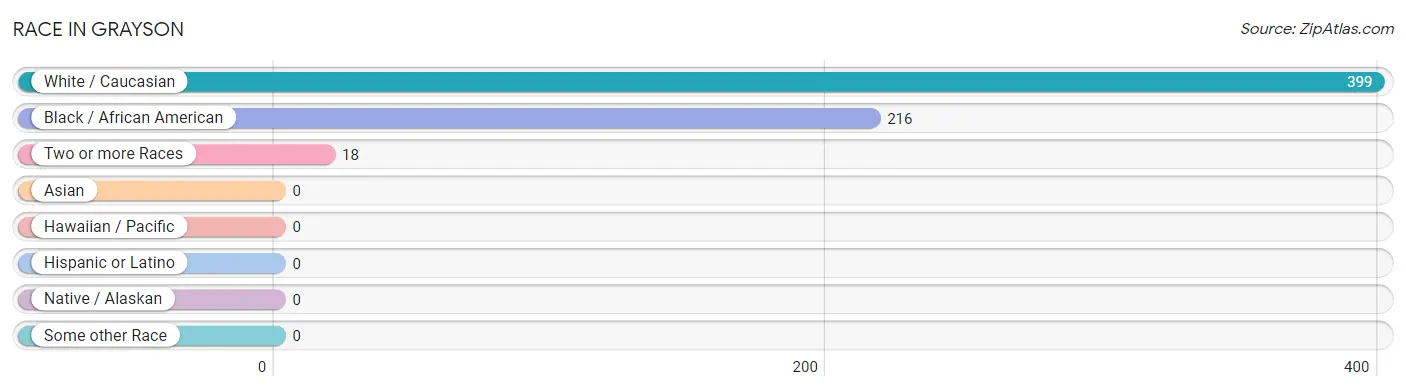
| Race | # Population | % Population |
| Asian | 0 | 0.0% |
| Black / African American | 216 | 34.1% |
| Hawaiian / Pacific | 0 | 0.0% |
| Hispanic or Latino | 0 | 0.0% |
| Native / Alaskan | 0 | 0.0% |
| White / Caucasian | 399 | 63.0% |
| Two or more Races | 18 | 2.8% |
| Some other Race | 0 | 0.0% |
| Total | 633 | 100.0% |
Ancestry in Grayson
The most populous ancestries reported in Grayson are American (149 | 23.5%), English (23 | 3.6%), Arab (18 | 2.8%), Moroccan (18 | 2.8%), and Nigerian (18 | 2.8%), together accounting for 35.7% of all Grayson residents.
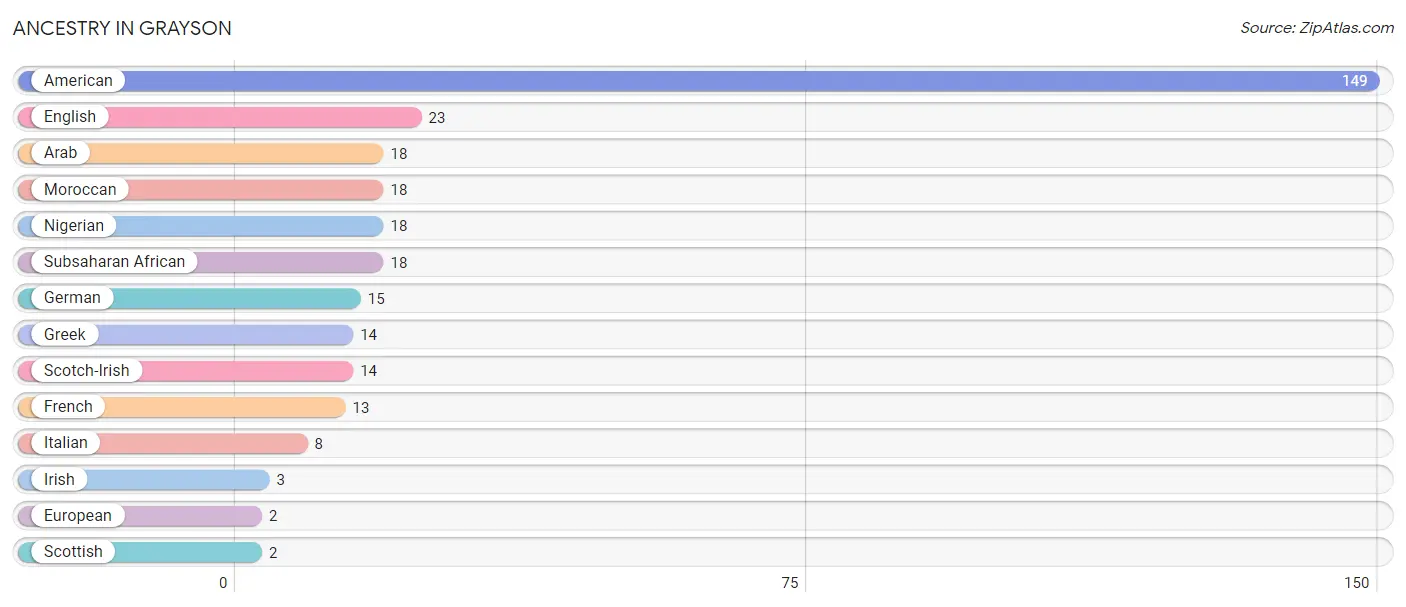
| Ancestry | # Population | % Population |
| American | 149 | 23.5% |
| Arab | 18 | 2.8% |
| English | 23 | 3.6% |
| European | 2 | 0.3% |
| French | 13 | 2.1% |
| German | 15 | 2.4% |
| Greek | 14 | 2.2% |
| Irish | 3 | 0.5% |
| Italian | 8 | 1.3% |
| Moroccan | 18 | 2.8% |
| Nigerian | 18 | 2.8% |
| Scotch-Irish | 14 | 2.2% |
| Scottish | 2 | 0.3% |
| Subsaharan African | 18 | 2.8% | View All 14 Rows |
Immigrants in Grayson
The most numerous immigrant groups reported in Grayson came from Europe (2 | 0.3%), Germany (2 | 0.3%), and Western Europe (2 | 0.3%), together accounting for 1.0% of all Grayson residents.
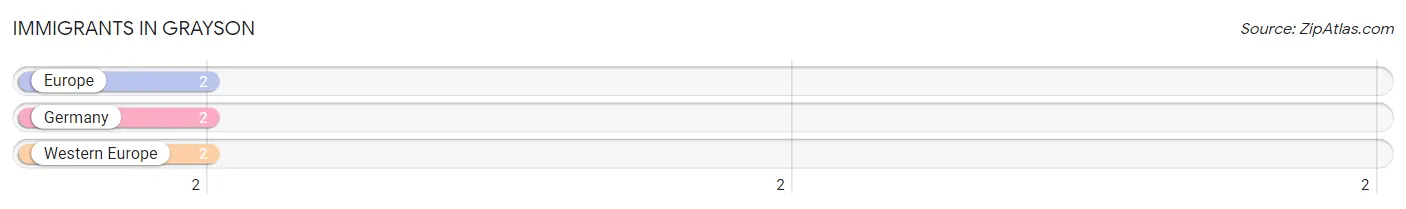
| Immigration Origin | # Population | % Population |
| Europe | 2 | 0.3% |
| Germany | 2 | 0.3% |
| Western Europe | 2 | 0.3% | View All 3 Rows |
Sex and Age in Grayson
Sex and Age in Grayson
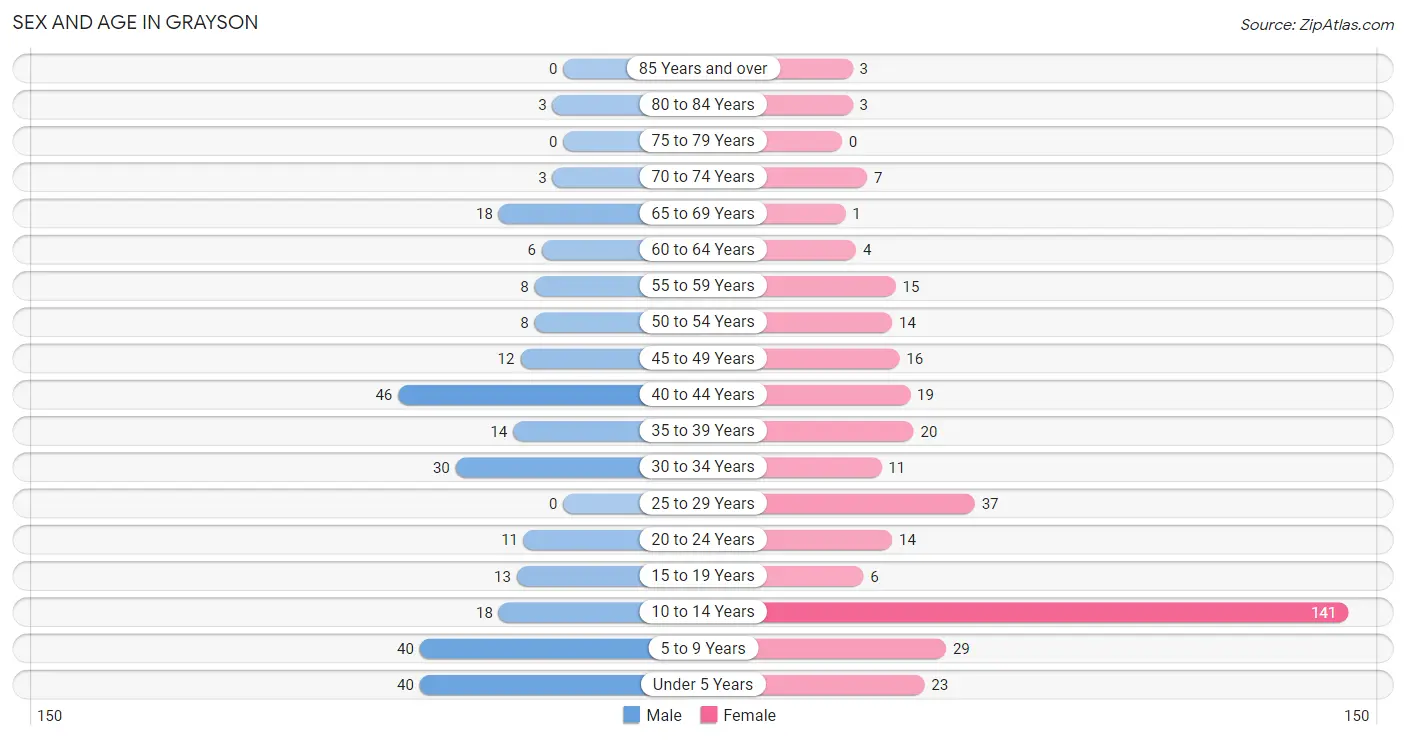
The most populous age groups in Grayson are 40 to 44 Years (46 | 17.0%) for men and 10 to 14 Years (141 | 38.8%) for women.
| Age Bracket | Male | Female |
| Under 5 Years | 40 (14.8%) | 23 (6.3%) |
| 5 to 9 Years | 40 (14.8%) | 29 (8.0%) |
| 10 to 14 Years | 18 (6.7%) | 141 (38.8%) |
| 15 to 19 Years | 13 (4.8%) | 6 (1.7%) |
| 20 to 24 Years | 11 (4.1%) | 14 (3.9%) |
| 25 to 29 Years | 0 (0.0%) | 37 (10.2%) |
| 30 to 34 Years | 30 (11.1%) | 11 (3.0%) |
| 35 to 39 Years | 14 (5.2%) | 20 (5.5%) |
| 40 to 44 Years | 46 (17.0%) | 19 (5.2%) |
| 45 to 49 Years | 12 (4.4%) | 16 (4.4%) |
| 50 to 54 Years | 8 (3.0%) | 14 (3.9%) |
| 55 to 59 Years | 8 (3.0%) | 15 (4.1%) |
| 60 to 64 Years | 6 (2.2%) | 4 (1.1%) |
| 65 to 69 Years | 18 (6.7%) | 1 (0.3%) |
| 70 to 74 Years | 3 (1.1%) | 7 (1.9%) |
| 75 to 79 Years | 0 (0.0%) | 0 (0.0%) |
| 80 to 84 Years | 3 (1.1%) | 3 (0.8%) |
| 85 Years and over | 0 (0.0%) | 3 (0.8%) |
| Total | 270 (100.0%) | 363 (100.0%) |
Families and Households in Grayson
Median Family Size in Grayson
The median family size in Grayson is 3.90 persons per family, with married-couple families (50 | 37.0%) accounting for the largest median family size of 4.58 persons per family. On the other hand, single female/mother families (49 | 36.3%) represent the smallest median family size with 3.35 persons per family.
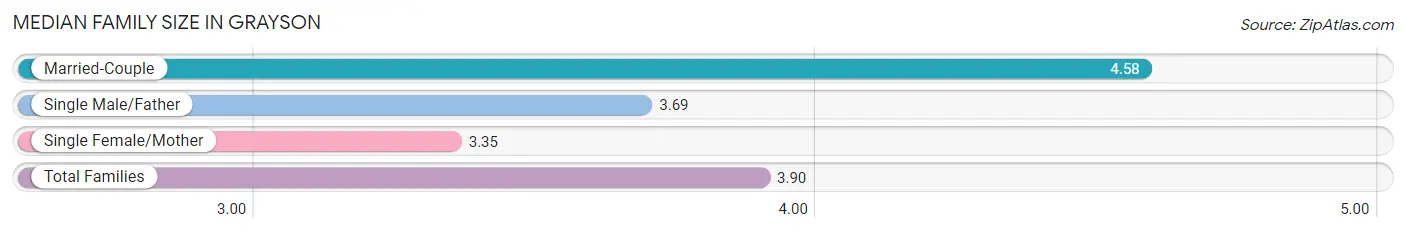
| Family Type | # Families | Family Size |
| Married-Couple | 50 (37.0%) | 4.58 |
| Single Male/Father | 36 (26.7%) | 3.69 |
| Single Female/Mother | 49 (36.3%) | 3.35 |
| Total Families | 135 (100.0%) | 3.90 |
Median Household Size in Grayson
The median household size in Grayson is 3.03 persons per household, with married-couple households (50 | 23.9%) accounting for the largest median household size of 4.58 persons per household. non-family households (74 | 35.4%) represent the smallest median household size with 1.07 persons per household.
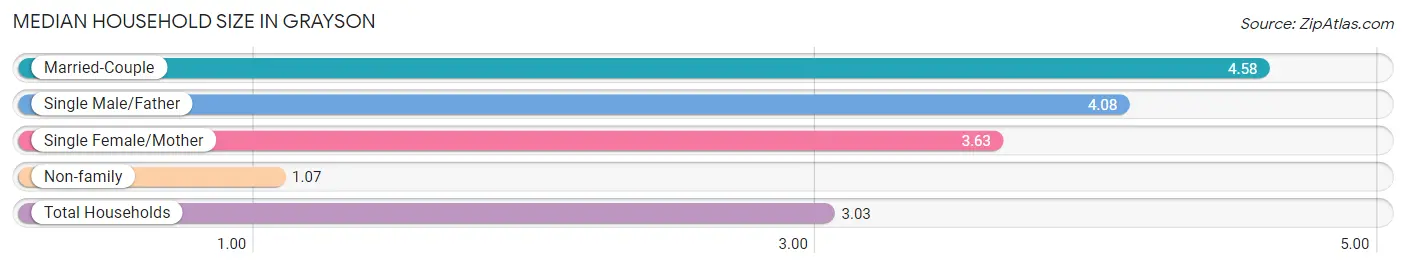
| Household Type | # Households | Household Size |
| Married-Couple | 50 (23.9%) | 4.58 |
| Single Male/Father | 36 (17.2%) | 4.08 |
| Single Female/Mother | 49 (23.4%) | 3.63 |
| Non-family | 74 (35.4%) | 1.07 |
| Total Households | 209 (100.0%) | 3.03 |
Household Size by Marriage Status in Grayson
Out of a total of 209 households in Grayson, 135 (64.6%) are family households, while 74 (35.4%) are nonfamily households. The most numerous type of family households are 4-person households, comprising 42, and the most common type of nonfamily households are 1-person households, comprising 68.
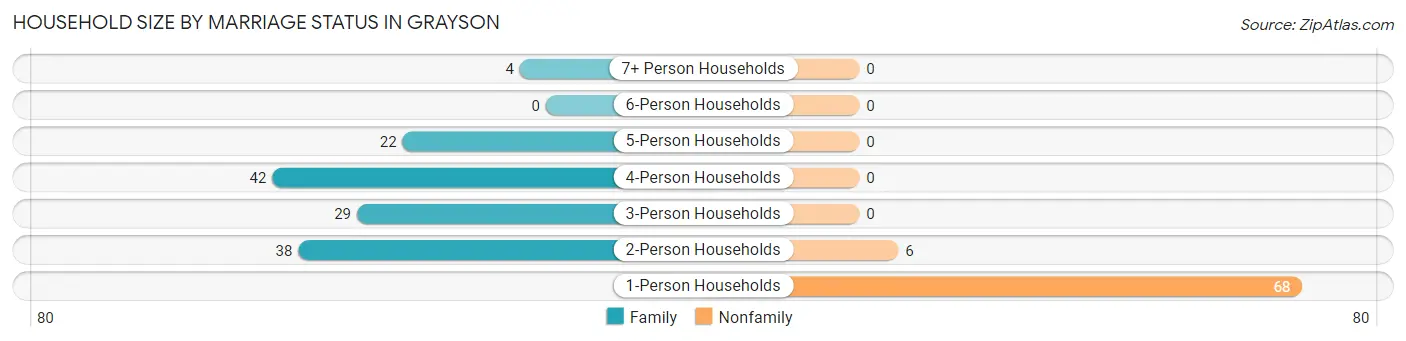
| Household Size | Family Households | Nonfamily Households |
| 1-Person Households | - | 68 (32.5%) |
| 2-Person Households | 38 (18.2%) | 6 (2.9%) |
| 3-Person Households | 29 (13.9%) | 0 (0.0%) |
| 4-Person Households | 42 (20.1%) | 0 (0.0%) |
| 5-Person Households | 22 (10.5%) | 0 (0.0%) |
| 6-Person Households | 0 (0.0%) | 0 (0.0%) |
| 7+ Person Households | 4 (1.9%) | 0 (0.0%) |
| Total | 135 (64.6%) | 74 (35.4%) |
Female Fertility in Grayson
Fertility by Age in Grayson
| Age Bracket | Women with Births | Births / 1,000 Women |
| 15 to 19 years | 0 (0.0%) | 0.0 |
| 20 to 34 years | 0 (0.0%) | 0.0 |
| 35 to 50 years | 0 (0.0%) | 0.0 |
| Total | 0 (0.0%) | 0.0 |
Fertility by Age by Marriage Status in Grayson
| Age Bracket | Married | Unmarried |
| 15 to 19 years | 0 (0.0%) | 0 (0.0%) |
| 20 to 34 years | 0 (0.0%) | 0 (0.0%) |
| 35 to 50 years | 0 (0.0%) | 0 (0.0%) |
| Total | 0 (0.0%) | 0 (0.0%) |
Fertility by Education in Grayson
| Educational Attainment | Women with Births | Births / 1,000 Women |
| Less than High School | 0 (0.0%) | 0.0 |
| High School Diploma | 0 (0.0%) | 0.0 |
| College or Associate's Degree | 0 (0.0%) | 0.0 |
| Bachelor's Degree | 0 (0.0%) | 0.0 |
| Graduate Degree | 0 (0.0%) | 0.0 |
| Total | 0 (0.0%) | 0.0 |
Fertility by Education by Marriage Status in Grayson
| Educational Attainment | Married | Unmarried |
| Less than High School | 0 (0.0%) | 0 (0.0%) |
| High School Diploma | 0 (0.0%) | 0 (0.0%) |
| College or Associate's Degree | 0 (0.0%) | 0 (0.0%) |
| Bachelor's Degree | 0 (0.0%) | 0 (0.0%) |
| Graduate Degree | 0 (0.0%) | 0 (0.0%) |
| Total | 0 (0.0%) | 0 (0.0%) |
Employment Characteristics in Grayson
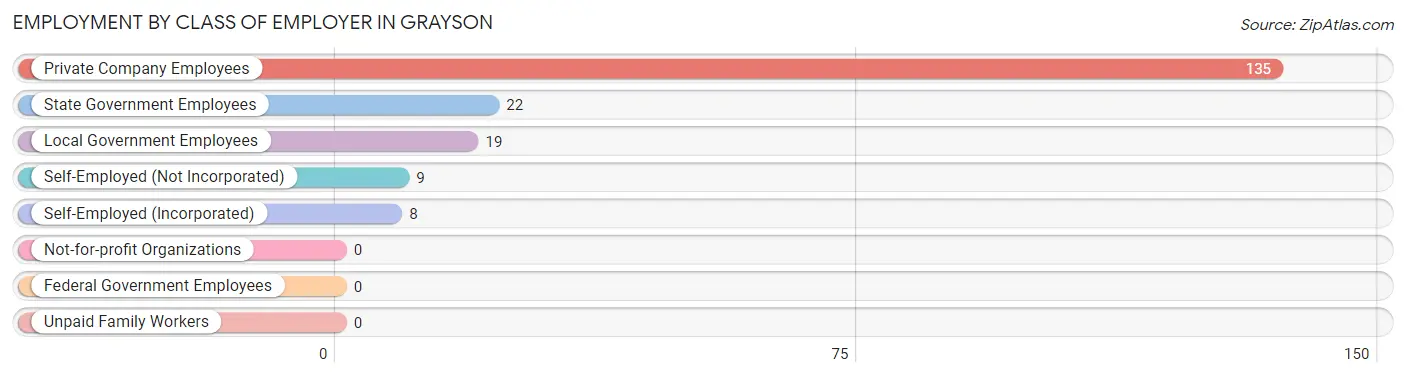
Employment by Class of Employer in Grayson
Among the 193 employed individuals in Grayson, private company employees (135 | 70.0%), state government employees (22 | 11.4%), and local government employees (19 | 9.8%) make up the most common classes of employment.
| Employer Class | # Employees | % Employees |
| Private Company Employees | 135 | 70.0% |
| Self-Employed (Incorporated) | 8 | 4.2% |
| Self-Employed (Not Incorporated) | 9 | 4.7% |
| Not-for-profit Organizations | 0 | 0.0% |
| Local Government Employees | 19 | 9.8% |
| State Government Employees | 22 | 11.4% |
| Federal Government Employees | 0 | 0.0% |
| Unpaid Family Workers | 0 | 0.0% |
| Total | 193 | 100.0% |
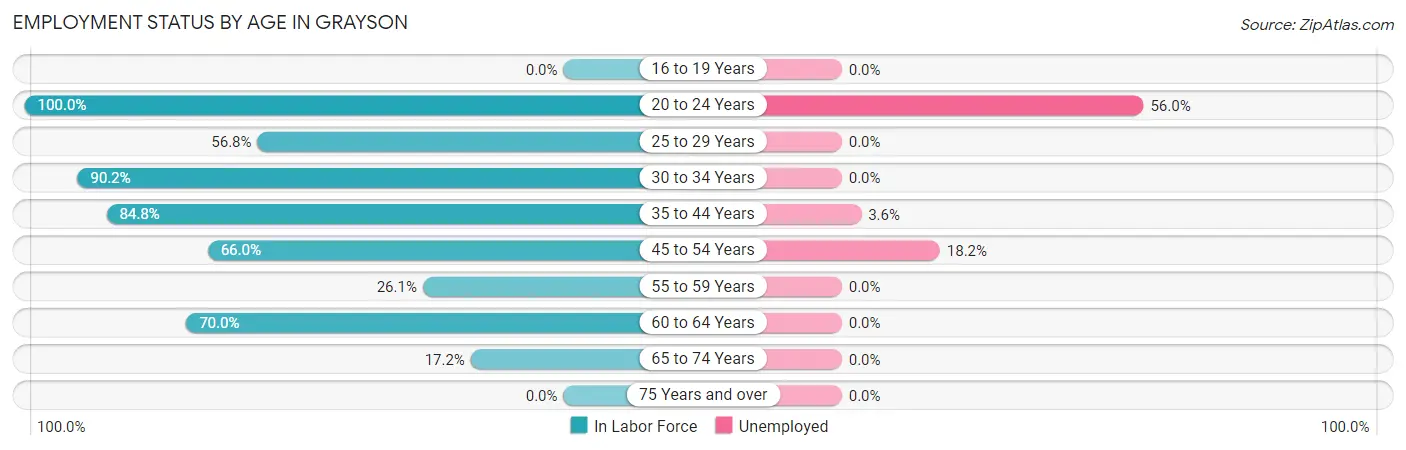
Employment Status by Age in Grayson
According to the labor force statistics for Grayson, out of the total population over 16 years of age (335), 65.1% or 218 individuals are in the labor force, with 10.6% or 23 of them unemployed. The age group with the highest labor force participation rate is 20 to 24 years, with 100.0% or 25 individuals in the labor force. Within the labor force, the 20 to 24 years age range has the highest percentage of unemployed individuals, with 56.0% or 14 of them being unemployed.
| Age Bracket | In Labor Force | Unemployed |
| 16 to 19 Years | 0 (0.0%) | 0 (0.0%) |
| 20 to 24 Years | 25 (100.0%) | 14 (56.0%) |
| 25 to 29 Years | 21 (56.8%) | 0 (0.0%) |
| 30 to 34 Years | 37 (90.2%) | 0 (0.0%) |
| 35 to 44 Years | 84 (84.8%) | 3 (3.6%) |
| 45 to 54 Years | 33 (66.0%) | 6 (18.2%) |
| 55 to 59 Years | 6 (26.1%) | 0 (0.0%) |
| 60 to 64 Years | 7 (70.0%) | 0 (0.0%) |
| 65 to 74 Years | 5 (17.2%) | 0 (0.0%) |
| 75 Years and over | 0 (0.0%) | 0 (0.0%) |
| Total | 218 (65.1%) | 23 (10.6%) |
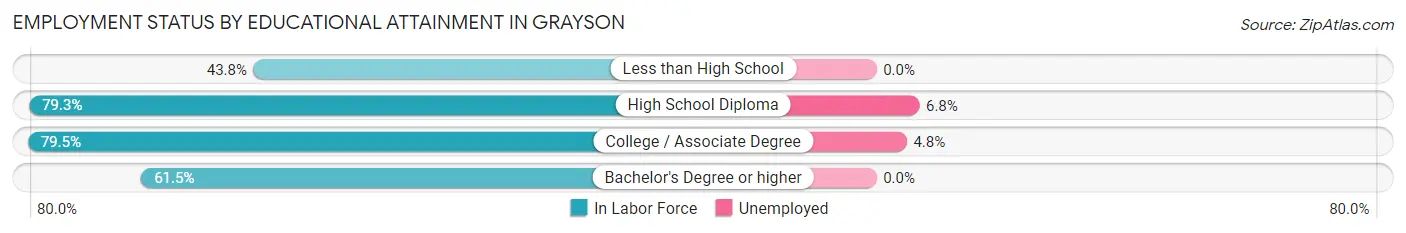
Employment Status by Educational Attainment in Grayson
According to labor force statistics for Grayson, 72.3% of individuals (188) out of the total population between 25 and 64 years of age (260) are in the labor force, with 4.8% or 9 of them being unemployed. The group with the highest labor force participation rate are those with the educational attainment of college / associate degree, with 79.5% or 62 individuals in the labor force. Within the labor force, individuals with high school diploma education have the highest percentage of unemployment, with 6.8% or 6 of them being unemployed.
| Educational Attainment | In Labor Force | Unemployed |
| Less than High School | 14 (43.8%) | 0 (0.0%) |
| High School Diploma | 88 (79.3%) | 8 (6.8%) |
| College / Associate Degree | 62 (79.5%) | 4 (4.8%) |
| Bachelor's Degree or higher | 24 (61.5%) | 0 (0.0%) |
| Total | 188 (72.3%) | 12 (4.8%) |
Employment Occupations by Sex in Grayson
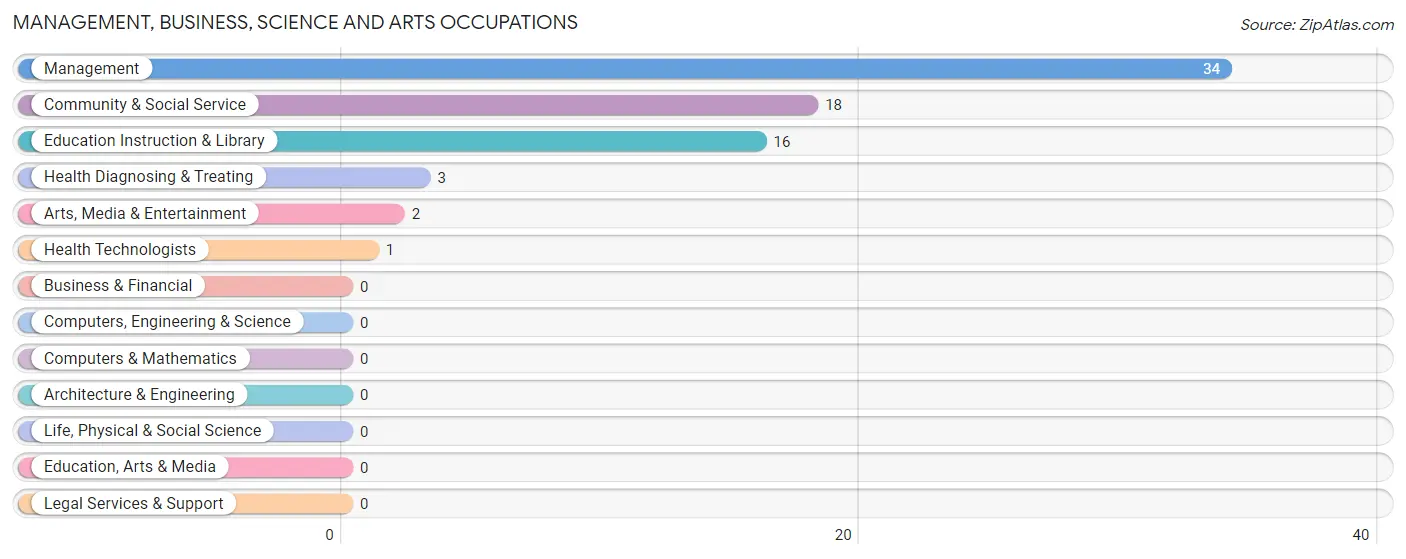
Management, Business, Science and Arts Occupations
The most common Management, Business, Science and Arts occupations in Grayson are Management (34 | 17.4%), Community & Social Service (18 | 9.2%), Education Instruction & Library (16 | 8.2%), Health Diagnosing & Treating (3 | 1.5%), and Arts, Media & Entertainment (2 | 1.0%).
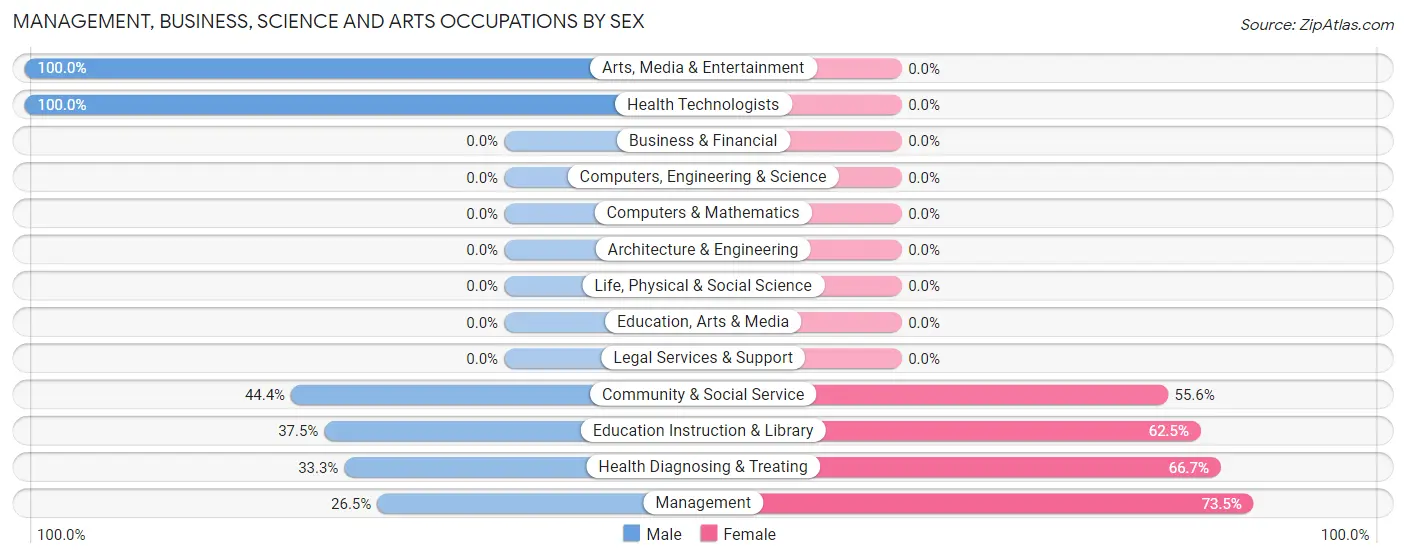
Management, Business, Science and Arts Occupations by Sex
Within the Management, Business, Science and Arts occupations in Grayson, the most male-oriented occupations are Arts, Media & Entertainment (100.0%), Health Technologists (100.0%), and Community & Social Service (44.4%), while the most female-oriented occupations are Management (73.5%), Health Diagnosing & Treating (66.7%), and Education Instruction & Library (62.5%).
| Occupation | Male | Female |
| Management | 9 (26.5%) | 25 (73.5%) |
| Business & Financial | 0 (0.0%) | 0 (0.0%) |
| Computers, Engineering & Science | 0 (0.0%) | 0 (0.0%) |
| Computers & Mathematics | 0 (0.0%) | 0 (0.0%) |
| Architecture & Engineering | 0 (0.0%) | 0 (0.0%) |
| Life, Physical & Social Science | 0 (0.0%) | 0 (0.0%) |
| Community & Social Service | 8 (44.4%) | 10 (55.6%) |
| Education, Arts & Media | 0 (0.0%) | 0 (0.0%) |
| Legal Services & Support | 0 (0.0%) | 0 (0.0%) |
| Education Instruction & Library | 6 (37.5%) | 10 (62.5%) |
| Arts, Media & Entertainment | 2 (100.0%) | 0 (0.0%) |
| Health Diagnosing & Treating | 1 (33.3%) | 2 (66.7%) |
| Health Technologists | 1 (100.0%) | 0 (0.0%) |
| Total (Category) | 18 (32.7%) | 37 (67.3%) |
| Total (Overall) | 111 (56.9%) | 84 (43.1%) |
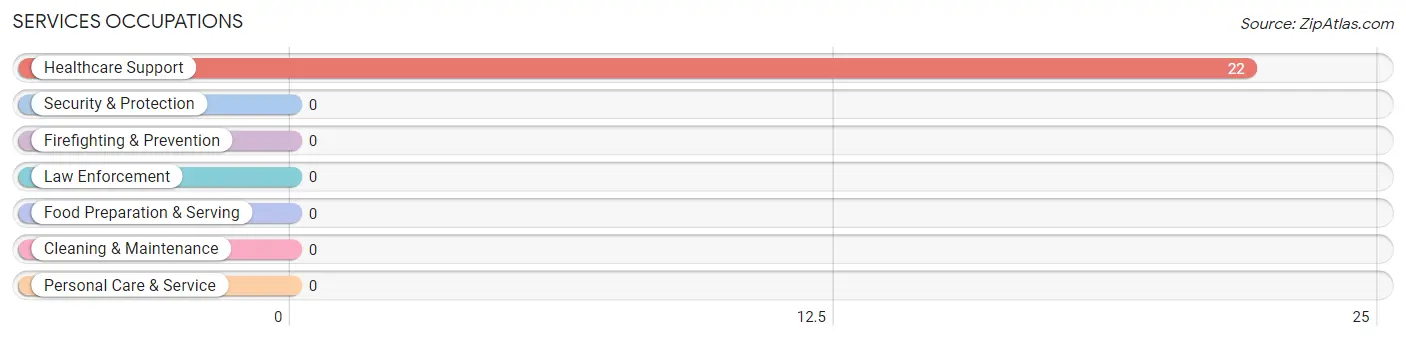
Services Occupations
The most common Services occupations in Grayson are , and Healthcare Support (22 | 11.3%).
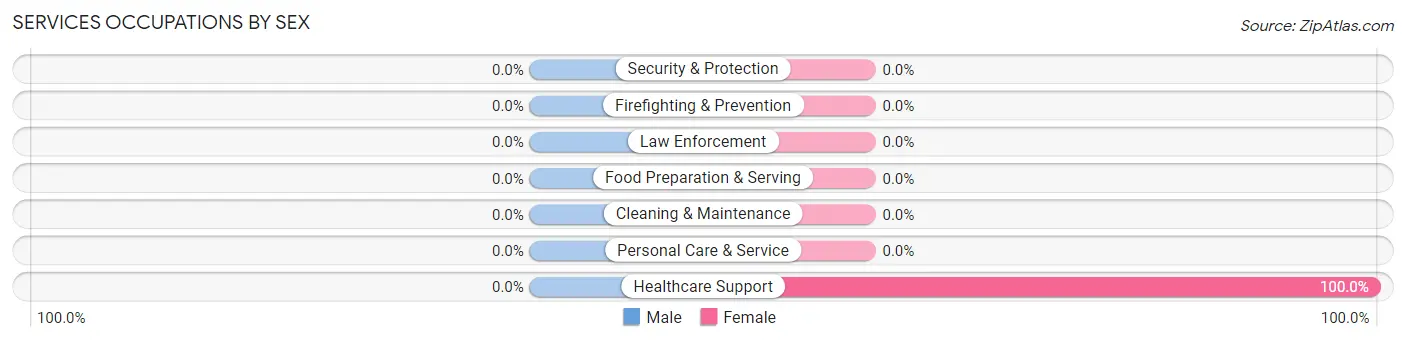
Services Occupations by Sex
| Occupation | Male | Female |
| Healthcare Support | 0 (0.0%) | 22 (100.0%) |
| Security & Protection | 0 (0.0%) | 0 (0.0%) |
| Firefighting & Prevention | 0 (0.0%) | 0 (0.0%) |
| Law Enforcement | 0 (0.0%) | 0 (0.0%) |
| Food Preparation & Serving | 0 (0.0%) | 0 (0.0%) |
| Cleaning & Maintenance | 0 (0.0%) | 0 (0.0%) |
| Personal Care & Service | 0 (0.0%) | 0 (0.0%) |
| Total (Category) | 0 (0.0%) | 22 (100.0%) |
| Total (Overall) | 111 (56.9%) | 84 (43.1%) |
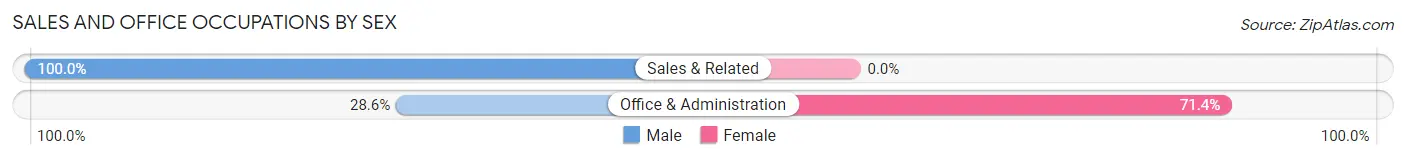
Sales and Office Occupations
The most common Sales and Office occupations in Grayson are Sales & Related (28 | 14.4%), and Office & Administration (28 | 14.4%).
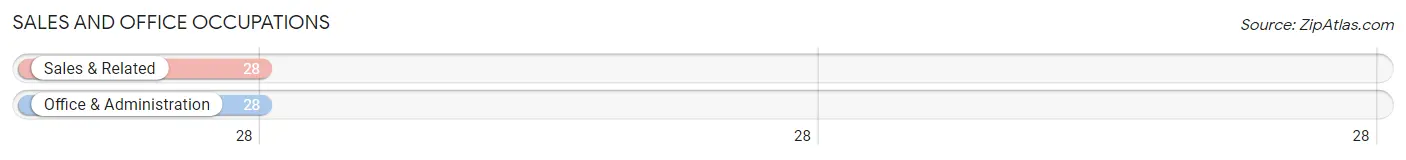
Sales and Office Occupations by Sex
| Occupation | Male | Female |
| Sales & Related | 28 (100.0%) | 0 (0.0%) |
| Office & Administration | 8 (28.6%) | 20 (71.4%) |
| Total (Category) | 36 (64.3%) | 20 (35.7%) |
| Total (Overall) | 111 (56.9%) | 84 (43.1%) |
Natural Resources, Construction and Maintenance Occupations
The most common Natural Resources, Construction and Maintenance occupations in Grayson are Construction & Extraction (25 | 12.8%), and Installation, Maintenance & Repair (14 | 7.2%).
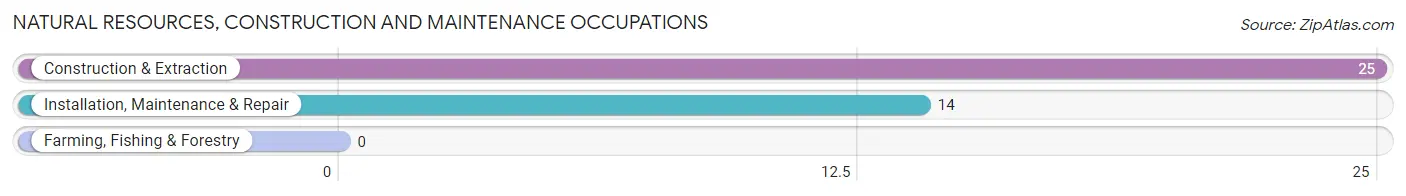
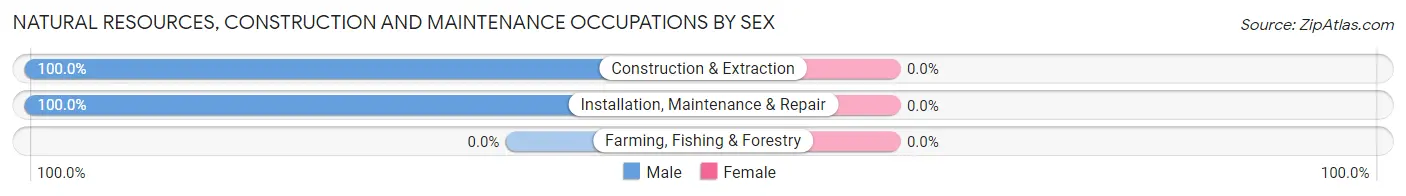
Natural Resources, Construction and Maintenance Occupations by Sex
| Occupation | Male | Female |
| Farming, Fishing & Forestry | 0 (0.0%) | 0 (0.0%) |
| Construction & Extraction | 25 (100.0%) | 0 (0.0%) |
| Installation, Maintenance & Repair | 14 (100.0%) | 0 (0.0%) |
| Total (Category) | 39 (100.0%) | 0 (0.0%) |
| Total (Overall) | 111 (56.9%) | 84 (43.1%) |
Production, Transportation and Moving Occupations
The most common Production, Transportation and Moving occupations in Grayson are Material Moving (18 | 9.2%), and Production (5 | 2.6%).
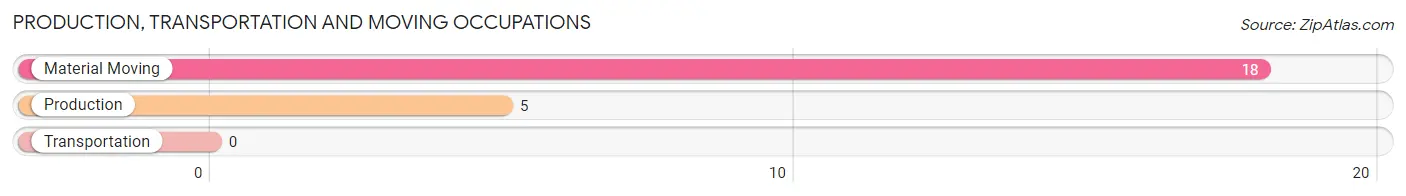
Production, Transportation and Moving Occupations by Sex
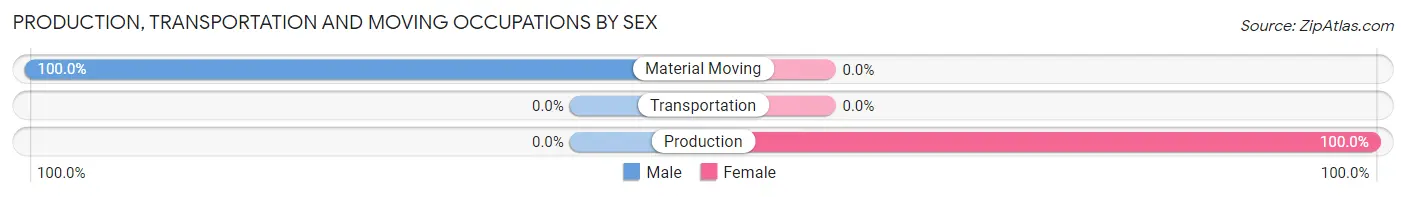
| Occupation | Male | Female |
| Production | 0 (0.0%) | 5 (100.0%) |
| Transportation | 0 (0.0%) | 0 (0.0%) |
| Material Moving | 18 (100.0%) | 0 (0.0%) |
| Total (Category) | 18 (78.3%) | 5 (21.7%) |
| Total (Overall) | 111 (56.9%) | 84 (43.1%) |
Employment Industries by Sex in Grayson
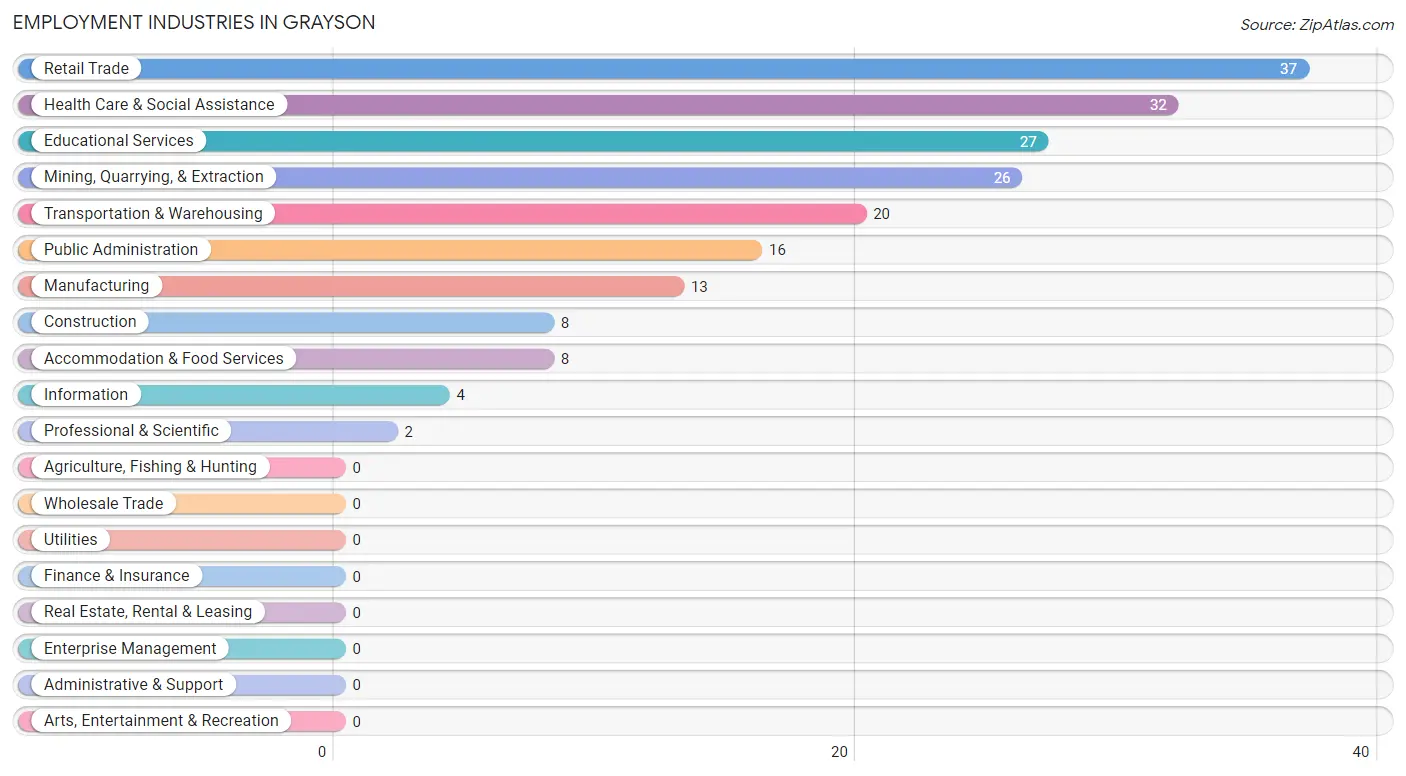
Employment Industries in Grayson
The major employment industries in Grayson include Retail Trade (37 | 19.0%), Health Care & Social Assistance (32 | 16.4%), Educational Services (27 | 13.9%), Mining, Quarrying, & Extraction (26 | 13.3%), and Transportation & Warehousing (20 | 10.3%).
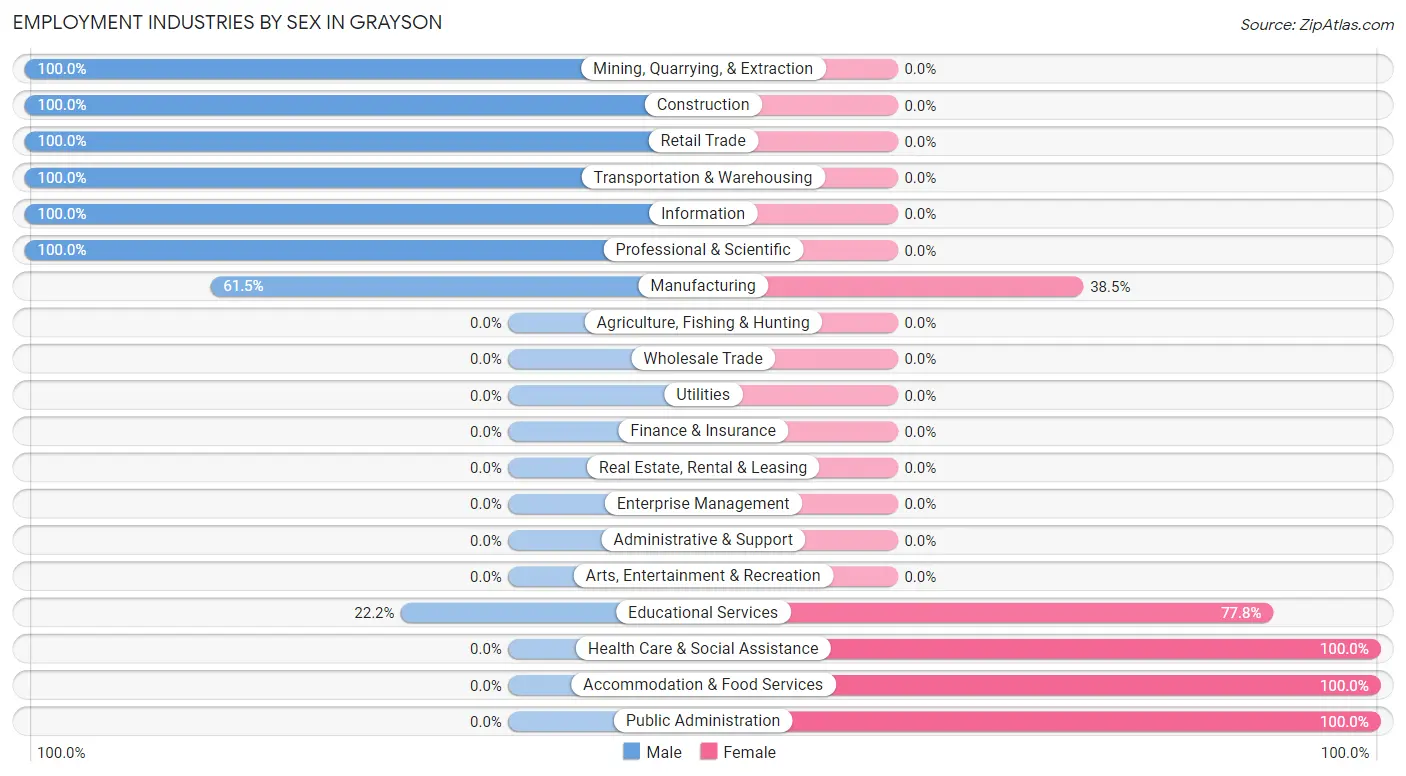
Employment Industries by Sex in Grayson
The Grayson industries that see more men than women are Mining, Quarrying, & Extraction (100.0%), Construction (100.0%), and Retail Trade (100.0%), whereas the industries that tend to have a higher number of women are Health Care & Social Assistance (100.0%), Accommodation & Food Services (100.0%), and Public Administration (100.0%).
| Industry | Male | Female |
| Agriculture, Fishing & Hunting | 0 (0.0%) | 0 (0.0%) |
| Mining, Quarrying, & Extraction | 26 (100.0%) | 0 (0.0%) |
| Construction | 8 (100.0%) | 0 (0.0%) |
| Manufacturing | 8 (61.5%) | 5 (38.5%) |
| Wholesale Trade | 0 (0.0%) | 0 (0.0%) |
| Retail Trade | 37 (100.0%) | 0 (0.0%) |
| Transportation & Warehousing | 20 (100.0%) | 0 (0.0%) |
| Utilities | 0 (0.0%) | 0 (0.0%) |
| Information | 4 (100.0%) | 0 (0.0%) |
| Finance & Insurance | 0 (0.0%) | 0 (0.0%) |
| Real Estate, Rental & Leasing | 0 (0.0%) | 0 (0.0%) |
| Professional & Scientific | 2 (100.0%) | 0 (0.0%) |
| Enterprise Management | 0 (0.0%) | 0 (0.0%) |
| Administrative & Support | 0 (0.0%) | 0 (0.0%) |
| Educational Services | 6 (22.2%) | 21 (77.8%) |
| Health Care & Social Assistance | 0 (0.0%) | 32 (100.0%) |
| Arts, Entertainment & Recreation | 0 (0.0%) | 0 (0.0%) |
| Accommodation & Food Services | 0 (0.0%) | 8 (100.0%) |
| Public Administration | 0 (0.0%) | 16 (100.0%) |
| Total | 111 (56.9%) | 84 (43.1%) |
Education in Grayson
School Enrollment in Grayson
The most common levels of schooling among the 262 students in Grayson are middle school (151 | 57.6%), elementary school (47 | 17.9%), and high school (26 | 9.9%).
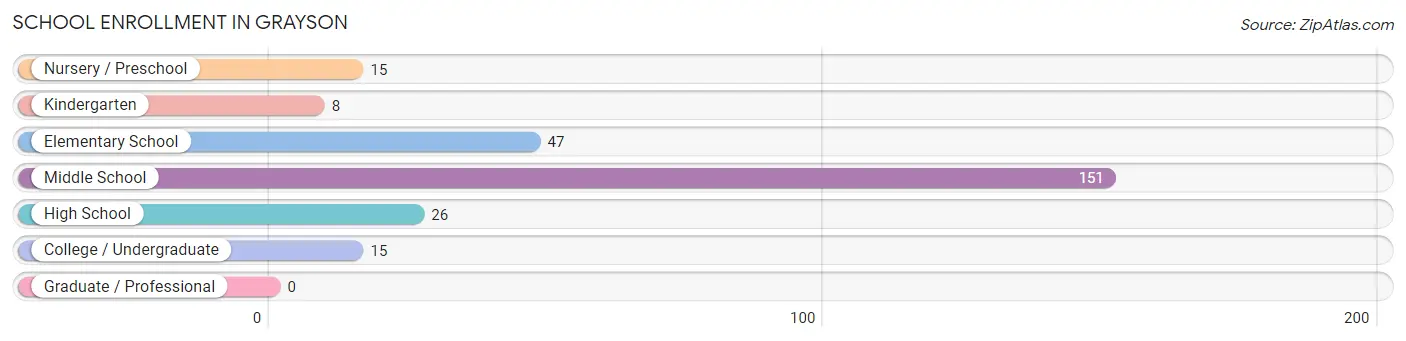
| School Level | # Students | % Students |
| Nursery / Preschool | 15 | 5.7% |
| Kindergarten | 8 | 3.0% |
| Elementary School | 47 | 17.9% |
| Middle School | 151 | 57.6% |
| High School | 26 | 9.9% |
| College / Undergraduate | 15 | 5.7% |
| Graduate / Professional | 0 | 0.0% |
| Total | 262 | 100.0% |
School Enrollment by Age by Funding Source in Grayson
Out of a total of 262 students who are enrolled in schools in Grayson, 23 (8.8%) attend a private institution, while the remaining 239 (91.2%) are enrolled in public schools. The age group of 15 to 17 year olds has the highest likelihood of being enrolled in private schools, with 3 (15.8% in the age bracket) enrolled. Conversely, the age group of 3 to 4 year olds has the lowest likelihood of being enrolled in a private school, with 8 (100.0% in the age bracket) attending a public institution.
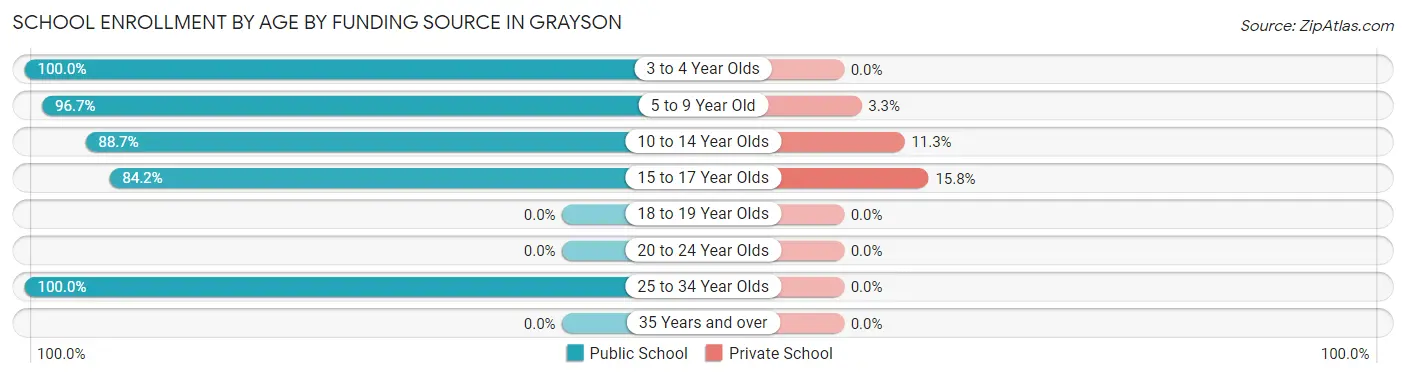
| Age Bracket | Public School | Private School |
| 3 to 4 Year Olds | 8 (100.0%) | 0 (0.0%) |
| 5 to 9 Year Old | 59 (96.7%) | 2 (3.3%) |
| 10 to 14 Year Olds | 141 (88.7%) | 18 (11.3%) |
| 15 to 17 Year Olds | 16 (84.2%) | 3 (15.8%) |
| 18 to 19 Year Olds | 0 (0.0%) | 0 (0.0%) |
| 20 to 24 Year Olds | 0 (0.0%) | 0 (0.0%) |
| 25 to 34 Year Olds | 15 (100.0%) | 0 (0.0%) |
| 35 Years and over | 0 (0.0%) | 0 (0.0%) |
| Total | 239 (91.2%) | 23 (8.8%) |
Educational Attainment by Field of Study in Grayson
Education (16 | 38.1%), arts & humanities (13 | 30.9%), science & technology (9 | 21.4%), and business (4 | 9.5%) are the most common fields of study among 42 individuals in Grayson who have obtained a bachelor's degree or higher.
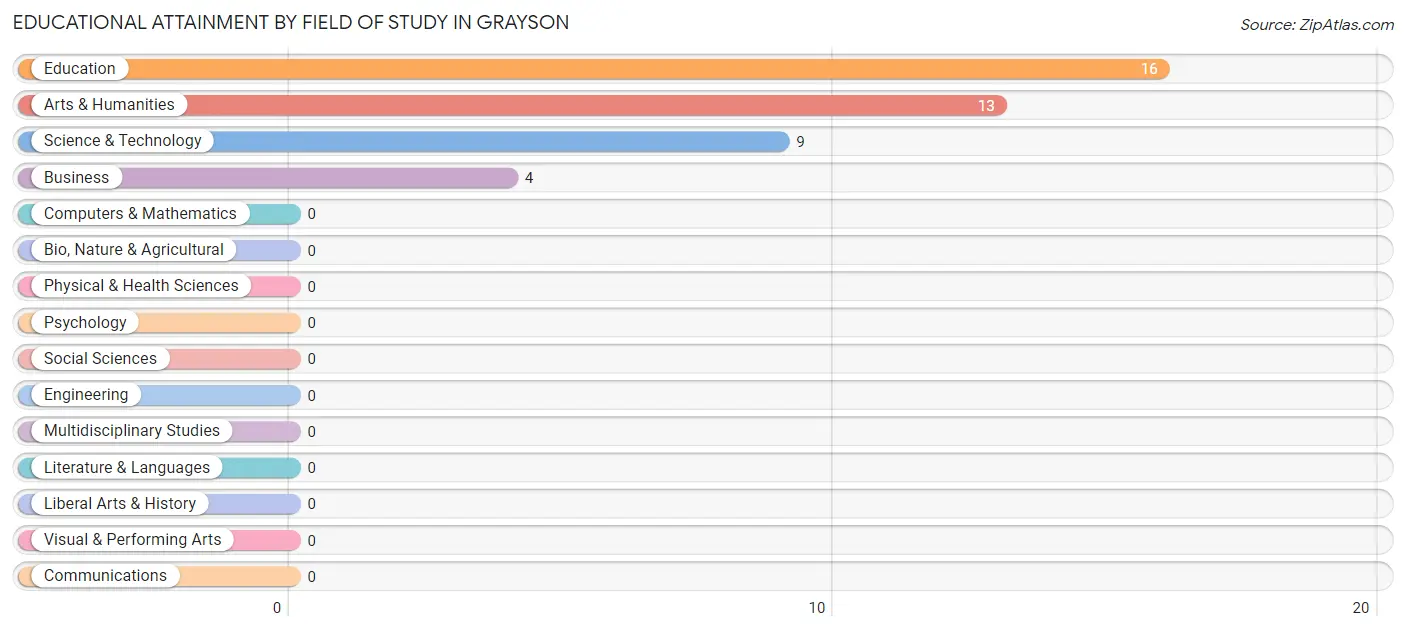
| Field of Study | # Graduates | % Graduates |
| Computers & Mathematics | 0 | 0.0% |
| Bio, Nature & Agricultural | 0 | 0.0% |
| Physical & Health Sciences | 0 | 0.0% |
| Psychology | 0 | 0.0% |
| Social Sciences | 0 | 0.0% |
| Engineering | 0 | 0.0% |
| Multidisciplinary Studies | 0 | 0.0% |
| Science & Technology | 9 | 21.4% |
| Business | 4 | 9.5% |
| Education | 16 | 38.1% |
| Literature & Languages | 0 | 0.0% |
| Liberal Arts & History | 0 | 0.0% |
| Visual & Performing Arts | 0 | 0.0% |
| Communications | 0 | 0.0% |
| Arts & Humanities | 13 | 30.9% |
| Total | 42 | 100.0% |
Transportation & Commute in Grayson
Vehicle Availability by Sex in Grayson
The most prevalent vehicle ownership categories in Grayson are males with 2 vehicles (74, accounting for 66.7%) and females with 2 vehicles (42, making up 90.2%).
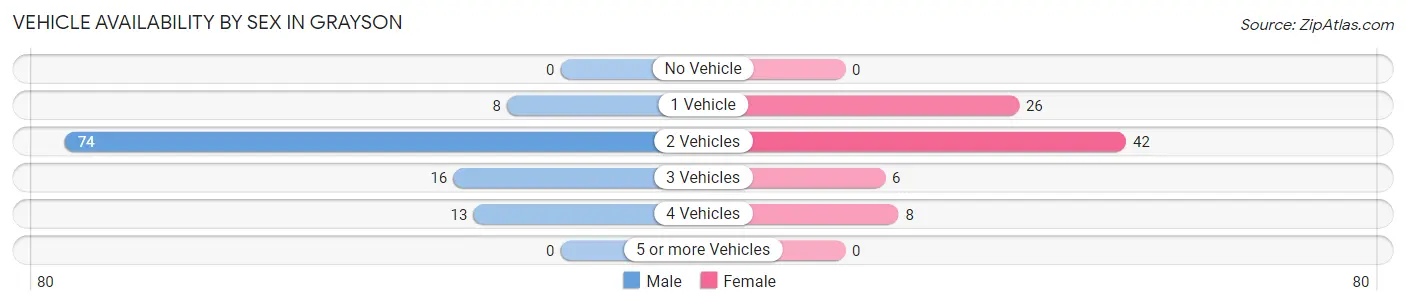
| Vehicles Available | Male | Female |
| No Vehicle | 0 (0.0%) | 0 (0.0%) |
| 1 Vehicle | 8 (7.2%) | 26 (31.7%) |
| 2 Vehicles | 74 (66.7%) | 42 (51.2%) |
| 3 Vehicles | 16 (14.4%) | 6 (7.3%) |
| 4 Vehicles | 13 (11.7%) | 8 (9.8%) |
| 5 or more Vehicles | 0 (0.0%) | 0 (0.0%) |
| Total | 111 (100.0%) | 82 (100.0%) |
Commute Time in Grayson
The most frequently occuring commute durations in Grayson are 5 to 9 minutes (45 commuters, 23.9%), 15 to 19 minutes (40 commuters, 21.3%), and 90 or more minutes (26 commuters, 13.8%).
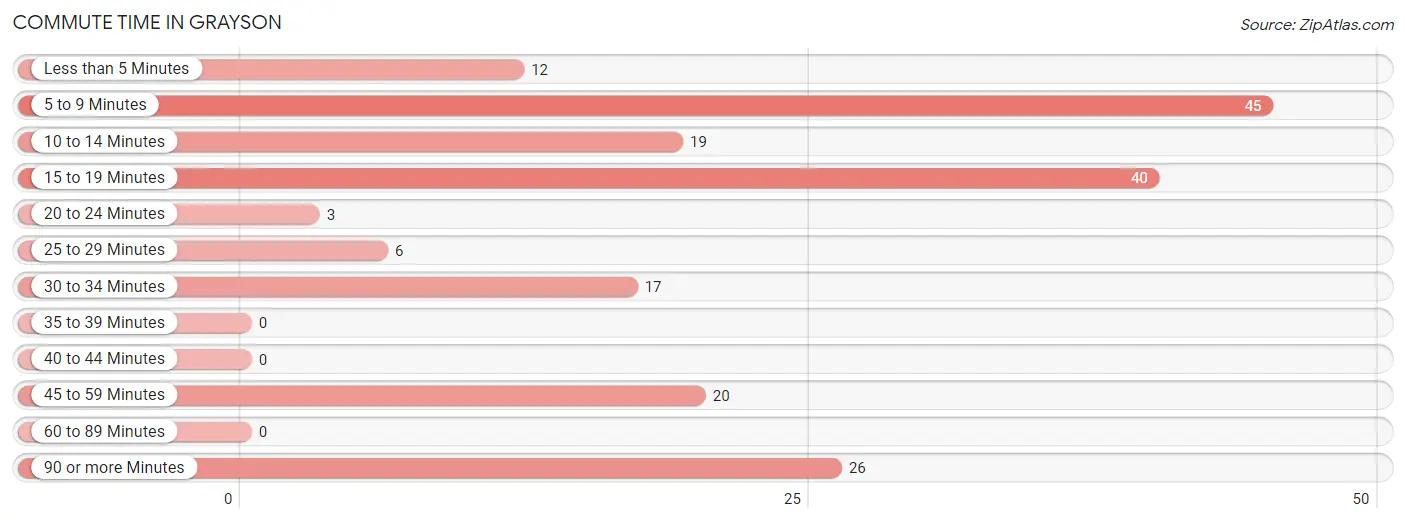
| Commute Time | # Commuters | % Commuters |
| Less than 5 Minutes | 12 | 6.4% |
| 5 to 9 Minutes | 45 | 23.9% |
| 10 to 14 Minutes | 19 | 10.1% |
| 15 to 19 Minutes | 40 | 21.3% |
| 20 to 24 Minutes | 3 | 1.6% |
| 25 to 29 Minutes | 6 | 3.2% |
| 30 to 34 Minutes | 17 | 9.0% |
| 35 to 39 Minutes | 0 | 0.0% |
| 40 to 44 Minutes | 0 | 0.0% |
| 45 to 59 Minutes | 20 | 10.6% |
| 60 to 89 Minutes | 0 | 0.0% |
| 90 or more Minutes | 26 | 13.8% |
Commute Time by Sex in Grayson
The most common commute times in Grayson are 15 to 19 minutes (31 commuters, 27.9%) for males and 5 to 9 minutes (37 commuters, 48.0%) for females.
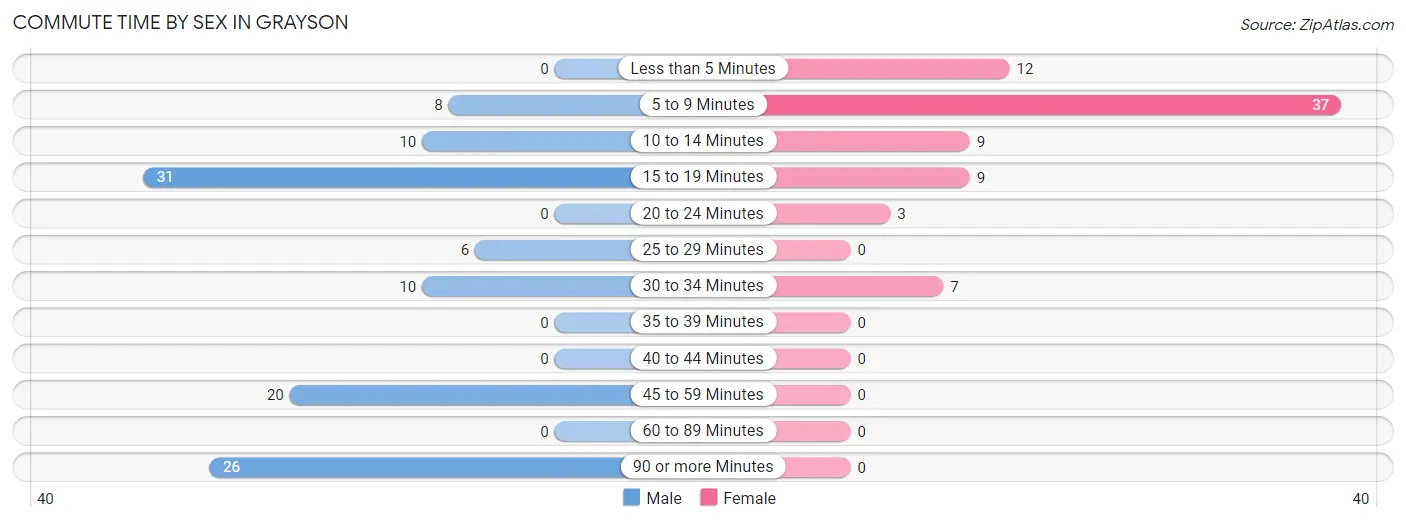
| Commute Time | Male | Female |
| Less than 5 Minutes | 0 (0.0%) | 12 (15.6%) |
| 5 to 9 Minutes | 8 (7.2%) | 37 (48.0%) |
| 10 to 14 Minutes | 10 (9.0%) | 9 (11.7%) |
| 15 to 19 Minutes | 31 (27.9%) | 9 (11.7%) |
| 20 to 24 Minutes | 0 (0.0%) | 3 (3.9%) |
| 25 to 29 Minutes | 6 (5.4%) | 0 (0.0%) |
| 30 to 34 Minutes | 10 (9.0%) | 7 (9.1%) |
| 35 to 39 Minutes | 0 (0.0%) | 0 (0.0%) |
| 40 to 44 Minutes | 0 (0.0%) | 0 (0.0%) |
| 45 to 59 Minutes | 20 (18.0%) | 0 (0.0%) |
| 60 to 89 Minutes | 0 (0.0%) | 0 (0.0%) |
| 90 or more Minutes | 26 (23.4%) | 0 (0.0%) |
Time of Departure to Work by Sex in Grayson
The most frequent times of departure to work in Grayson are 6:00 AM to 6:29 AM (31, 27.9%) for males and 4:00 PM to 11:59 PM (23, 29.9%) for females.
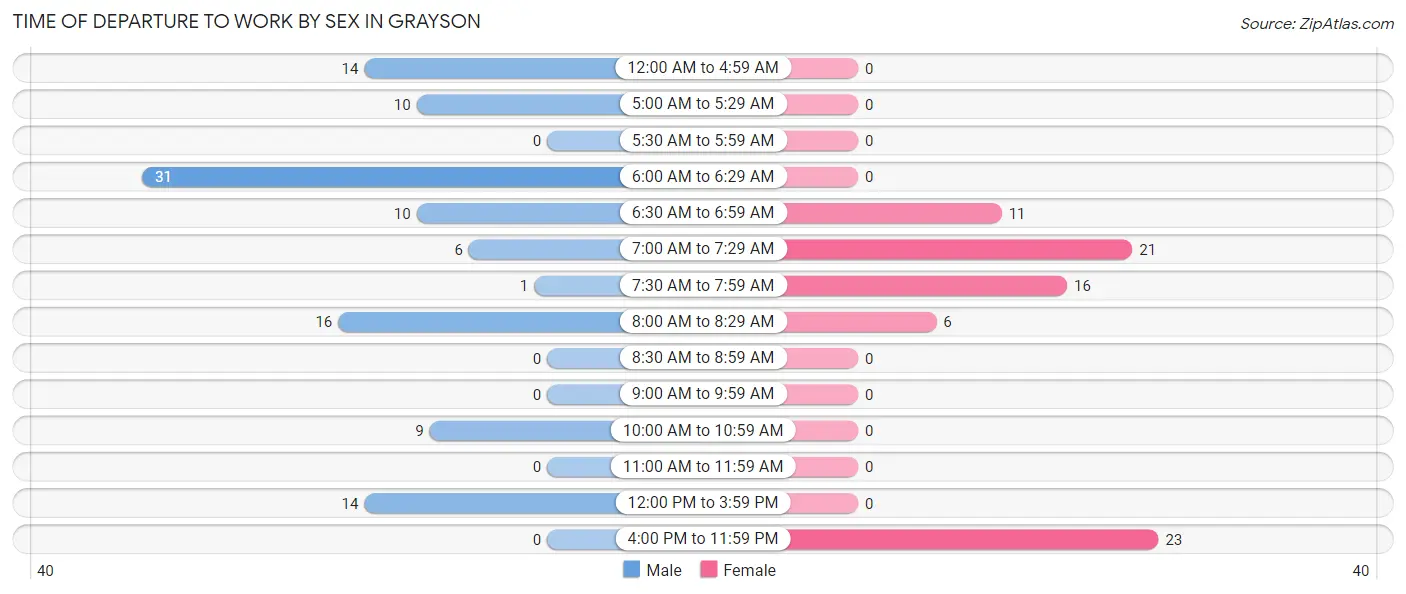
| Time of Departure | Male | Female |
| 12:00 AM to 4:59 AM | 14 (12.6%) | 0 (0.0%) |
| 5:00 AM to 5:29 AM | 10 (9.0%) | 0 (0.0%) |
| 5:30 AM to 5:59 AM | 0 (0.0%) | 0 (0.0%) |
| 6:00 AM to 6:29 AM | 31 (27.9%) | 0 (0.0%) |
| 6:30 AM to 6:59 AM | 10 (9.0%) | 11 (14.3%) |
| 7:00 AM to 7:29 AM | 6 (5.4%) | 21 (27.3%) |
| 7:30 AM to 7:59 AM | 1 (0.9%) | 16 (20.8%) |
| 8:00 AM to 8:29 AM | 16 (14.4%) | 6 (7.8%) |
| 8:30 AM to 8:59 AM | 0 (0.0%) | 0 (0.0%) |
| 9:00 AM to 9:59 AM | 0 (0.0%) | 0 (0.0%) |
| 10:00 AM to 10:59 AM | 9 (8.1%) | 0 (0.0%) |
| 11:00 AM to 11:59 AM | 0 (0.0%) | 0 (0.0%) |
| 12:00 PM to 3:59 PM | 14 (12.6%) | 0 (0.0%) |
| 4:00 PM to 11:59 PM | 0 (0.0%) | 23 (29.9%) |
| Total | 111 (100.0%) | 77 (100.0%) |
Housing Occupancy in Grayson
Occupancy by Ownership in Grayson
Of the total 209 dwellings in Grayson, owner-occupied units account for 97 (46.4%), while renter-occupied units make up 112 (53.6%).
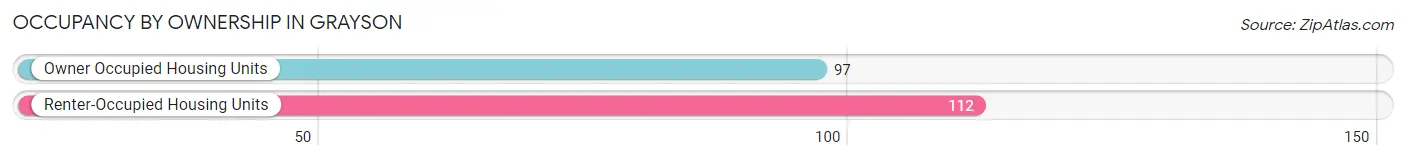
| Occupancy | # Housing Units | % Housing Units |
| Owner Occupied Housing Units | 97 | 46.4% |
| Renter-Occupied Housing Units | 112 | 53.6% |
| Total Occupied Housing Units | 209 | 100.0% |
Occupancy by Household Size in Grayson
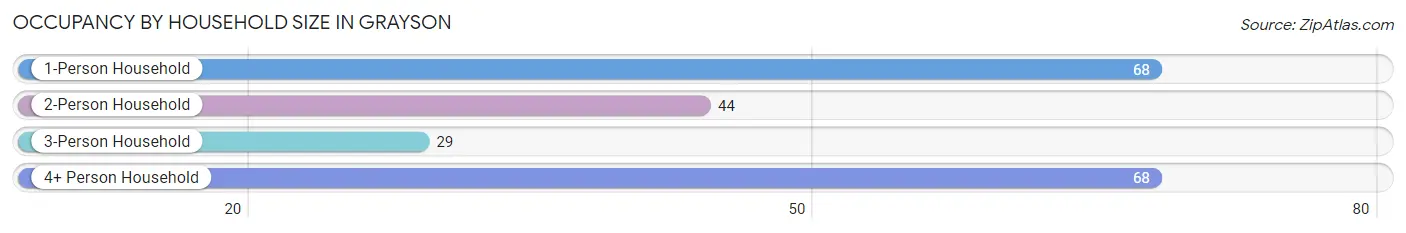
| Household Size | # Housing Units | % Housing Units |
| 1-Person Household | 68 | 32.5% |
| 2-Person Household | 44 | 21.0% |
| 3-Person Household | 29 | 13.9% |
| 4+ Person Household | 68 | 32.5% |
| Total Housing Units | 209 | 100.0% |
Occupancy by Ownership by Household Size in Grayson
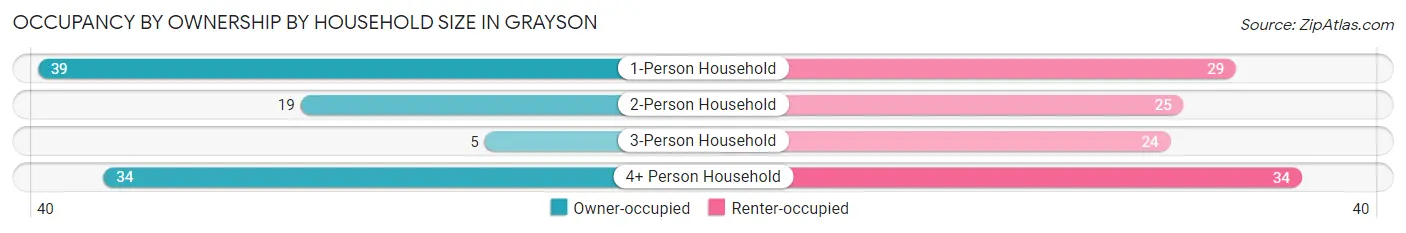
| Household Size | Owner-occupied | Renter-occupied |
| 1-Person Household | 39 (57.4%) | 29 (42.6%) |
| 2-Person Household | 19 (43.2%) | 25 (56.8%) |
| 3-Person Household | 5 (17.2%) | 24 (82.8%) |
| 4+ Person Household | 34 (50.0%) | 34 (50.0%) |
| Total Housing Units | 97 (46.4%) | 112 (53.6%) |
Occupancy by Educational Attainment in Grayson
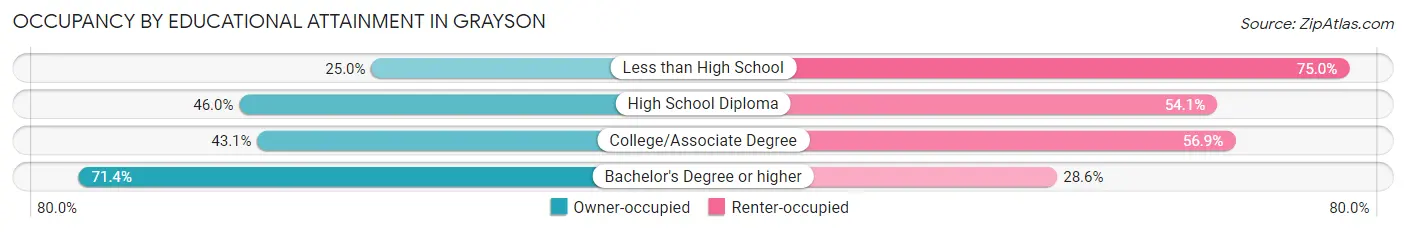
| Household Size | Owner-occupied | Renter-occupied |
| Less than High School | 3 (25.0%) | 9 (75.0%) |
| High School Diploma | 51 (46.0%) | 60 (54.0%) |
| College/Associate Degree | 28 (43.1%) | 37 (56.9%) |
| Bachelor's Degree or higher | 15 (71.4%) | 6 (28.6%) |
Occupancy by Age of Householder in Grayson
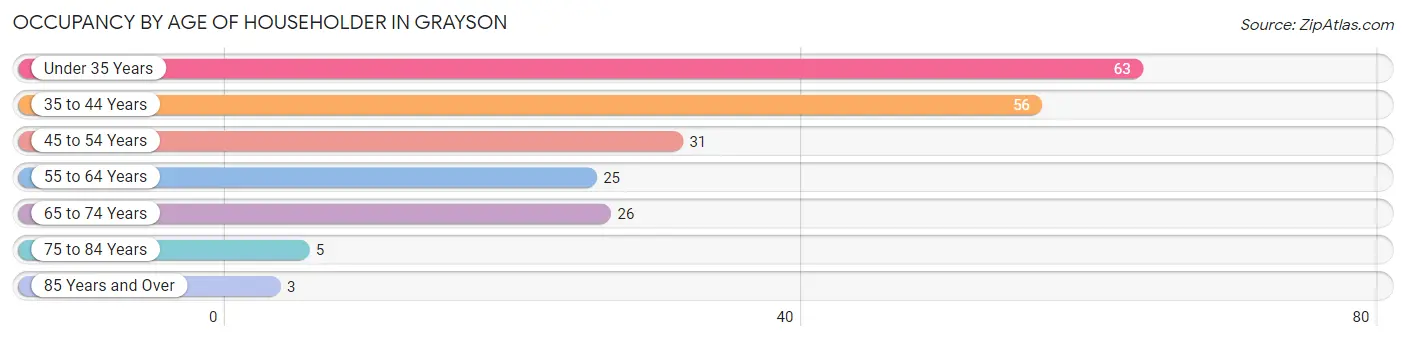
| Age Bracket | # Households | % Households |
| Under 35 Years | 63 | 30.1% |
| 35 to 44 Years | 56 | 26.8% |
| 45 to 54 Years | 31 | 14.8% |
| 55 to 64 Years | 25 | 12.0% |
| 65 to 74 Years | 26 | 12.4% |
| 75 to 84 Years | 5 | 2.4% |
| 85 Years and Over | 3 | 1.4% |
| Total | 209 | 100.0% |
Housing Finances in Grayson
Median Income by Occupancy in Grayson
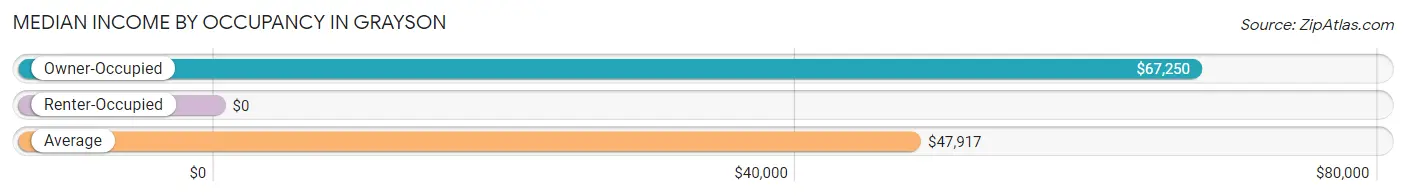
| Occupancy Type | # Households | Median Income |
| Owner-Occupied | 97 (46.4%) | $67,250 |
| Renter-Occupied | 112 (53.6%) | $0 |
| Average | 209 (100.0%) | $47,917 |
Occupancy by Householder Income Bracket in Grayson
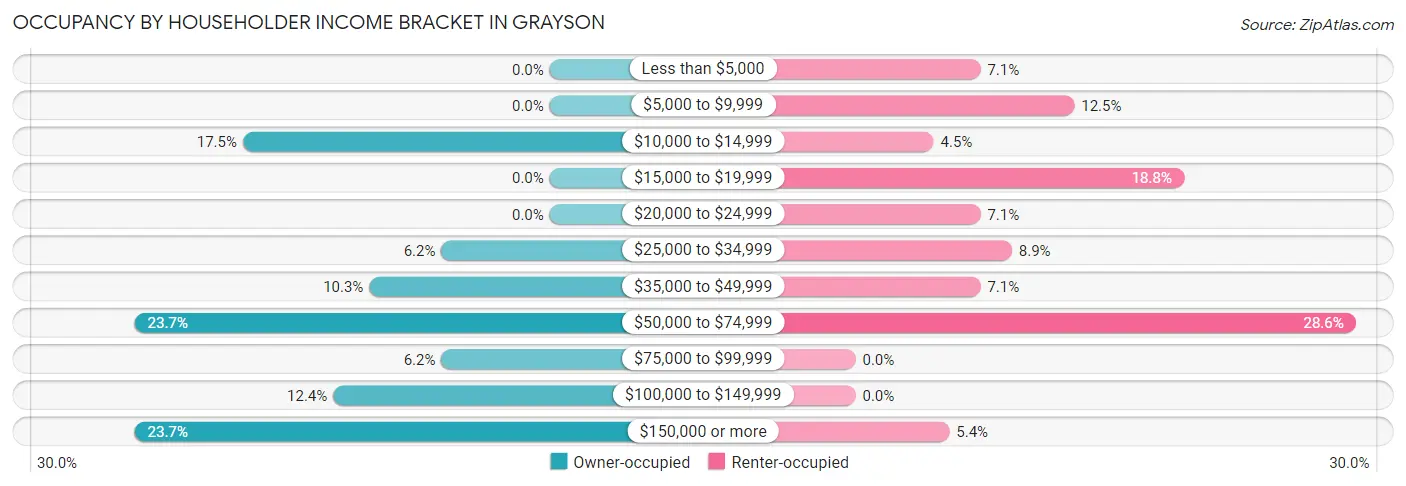
| Income Bracket | Owner-occupied | Renter-occupied |
| Less than $5,000 | 0 (0.0%) | 8 (7.1%) |
| $5,000 to $9,999 | 0 (0.0%) | 14 (12.5%) |
| $10,000 to $14,999 | 17 (17.5%) | 5 (4.5%) |
| $15,000 to $19,999 | 0 (0.0%) | 21 (18.8%) |
| $20,000 to $24,999 | 0 (0.0%) | 8 (7.1%) |
| $25,000 to $34,999 | 6 (6.2%) | 10 (8.9%) |
| $35,000 to $49,999 | 10 (10.3%) | 8 (7.1%) |
| $50,000 to $74,999 | 23 (23.7%) | 32 (28.6%) |
| $75,000 to $99,999 | 6 (6.2%) | 0 (0.0%) |
| $100,000 to $149,999 | 12 (12.4%) | 0 (0.0%) |
| $150,000 or more | 23 (23.7%) | 6 (5.4%) |
| Total | 97 (100.0%) | 112 (100.0%) |
Monthly Housing Cost Tiers in Grayson
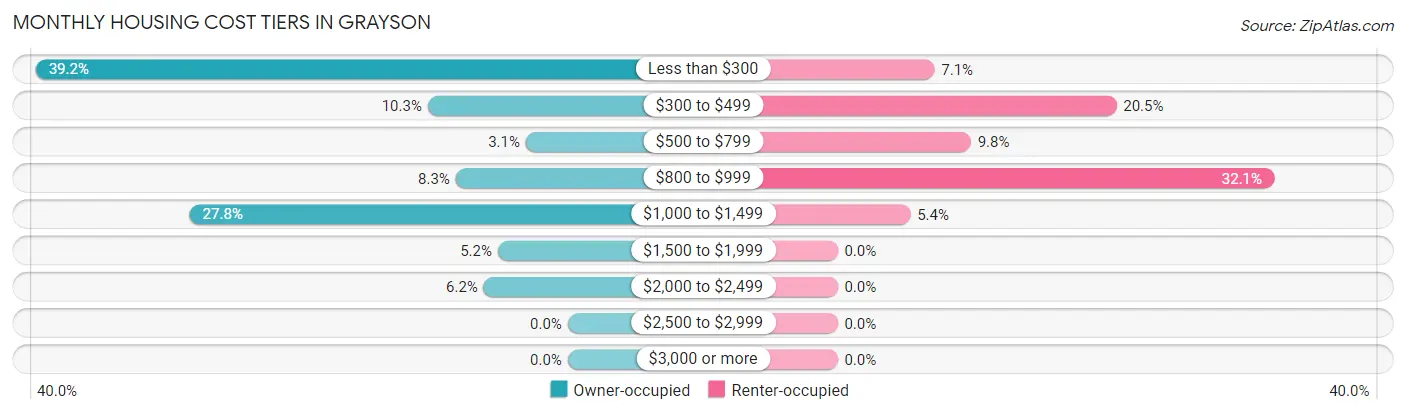
| Monthly Cost | Owner-occupied | Renter-occupied |
| Less than $300 | 38 (39.2%) | 8 (7.1%) |
| $300 to $499 | 10 (10.3%) | 23 (20.5%) |
| $500 to $799 | 3 (3.1%) | 11 (9.8%) |
| $800 to $999 | 8 (8.3%) | 36 (32.1%) |
| $1,000 to $1,499 | 27 (27.8%) | 6 (5.4%) |
| $1,500 to $1,999 | 5 (5.1%) | 0 (0.0%) |
| $2,000 to $2,499 | 6 (6.2%) | 0 (0.0%) |
| $2,500 to $2,999 | 0 (0.0%) | 0 (0.0%) |
| $3,000 or more | 0 (0.0%) | 0 (0.0%) |
| Total | 97 (100.0%) | 112 (100.0%) |
Physical Housing Characteristics in Grayson
Housing Structures in Grayson
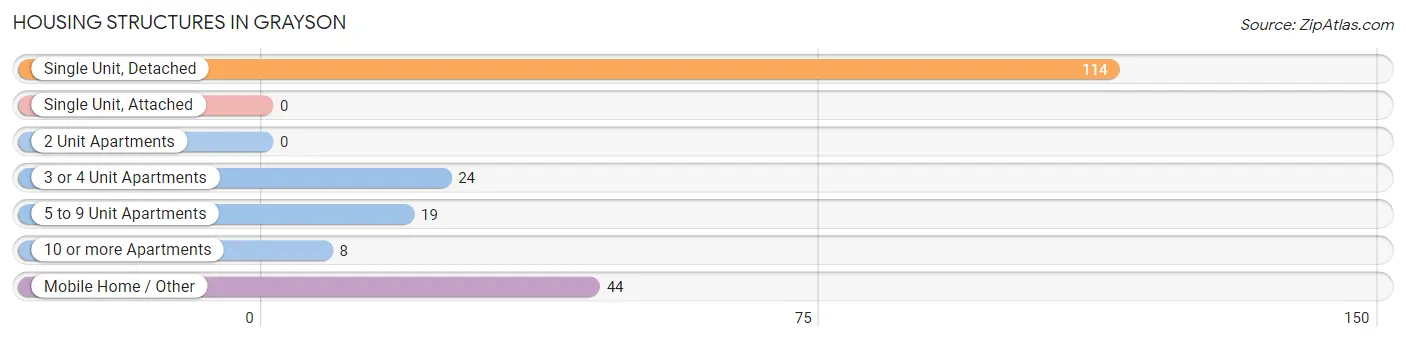
| Structure Type | # Housing Units | % Housing Units |
| Single Unit, Detached | 114 | 54.5% |
| Single Unit, Attached | 0 | 0.0% |
| 2 Unit Apartments | 0 | 0.0% |
| 3 or 4 Unit Apartments | 24 | 11.5% |
| 5 to 9 Unit Apartments | 19 | 9.1% |
| 10 or more Apartments | 8 | 3.8% |
| Mobile Home / Other | 44 | 21.0% |
| Total | 209 | 100.0% |
Housing Structures by Occupancy in Grayson
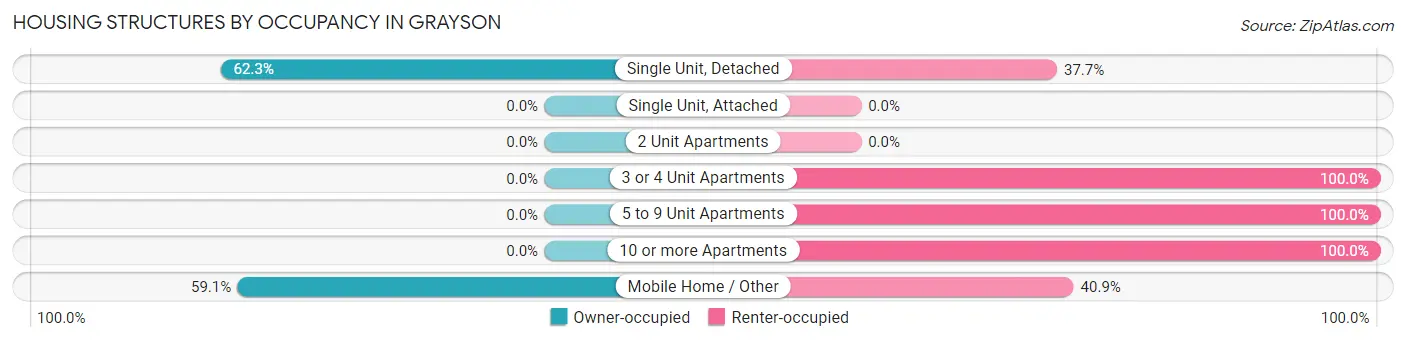
| Structure Type | Owner-occupied | Renter-occupied |
| Single Unit, Detached | 71 (62.3%) | 43 (37.7%) |
| Single Unit, Attached | 0 (0.0%) | 0 (0.0%) |
| 2 Unit Apartments | 0 (0.0%) | 0 (0.0%) |
| 3 or 4 Unit Apartments | 0 (0.0%) | 24 (100.0%) |
| 5 to 9 Unit Apartments | 0 (0.0%) | 19 (100.0%) |
| 10 or more Apartments | 0 (0.0%) | 8 (100.0%) |
| Mobile Home / Other | 26 (59.1%) | 18 (40.9%) |
| Total | 97 (46.4%) | 112 (53.6%) |
Housing Structures by Number of Rooms in Grayson
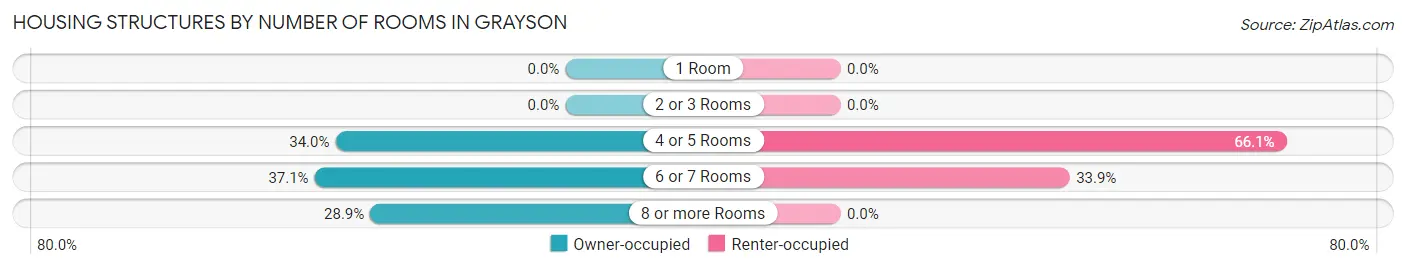
| Number of Rooms | Owner-occupied | Renter-occupied |
| 1 Room | 0 (0.0%) | 0 (0.0%) |
| 2 or 3 Rooms | 0 (0.0%) | 0 (0.0%) |
| 4 or 5 Rooms | 33 (34.0%) | 74 (66.1%) |
| 6 or 7 Rooms | 36 (37.1%) | 38 (33.9%) |
| 8 or more Rooms | 28 (28.9%) | 0 (0.0%) |
| Total | 97 (100.0%) | 112 (100.0%) |
Housing Structure by Heating Type in Grayson
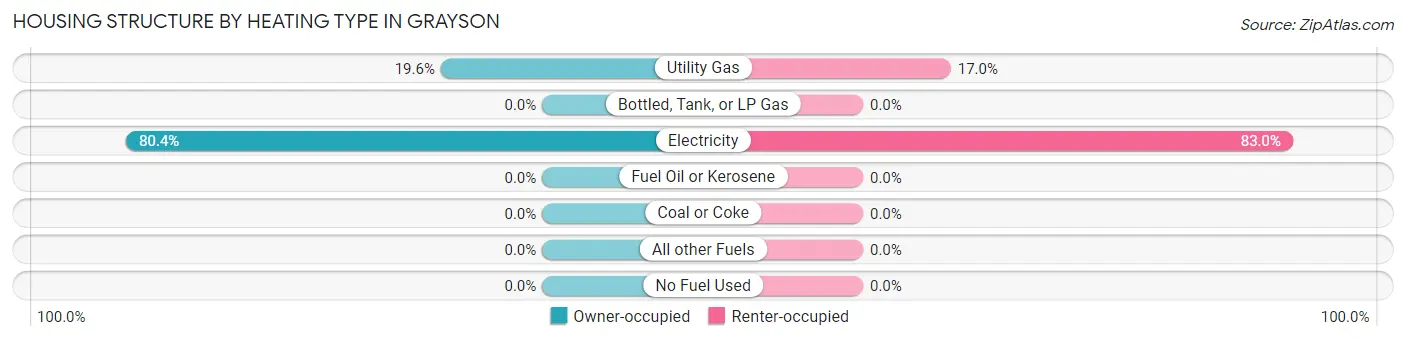
| Heating Type | Owner-occupied | Renter-occupied |
| Utility Gas | 19 (19.6%) | 19 (17.0%) |
| Bottled, Tank, or LP Gas | 0 (0.0%) | 0 (0.0%) |
| Electricity | 78 (80.4%) | 93 (83.0%) |
| Fuel Oil or Kerosene | 0 (0.0%) | 0 (0.0%) |
| Coal or Coke | 0 (0.0%) | 0 (0.0%) |
| All other Fuels | 0 (0.0%) | 0 (0.0%) |
| No Fuel Used | 0 (0.0%) | 0 (0.0%) |
| Total | 97 (100.0%) | 112 (100.0%) |
Household Vehicle Usage in Grayson
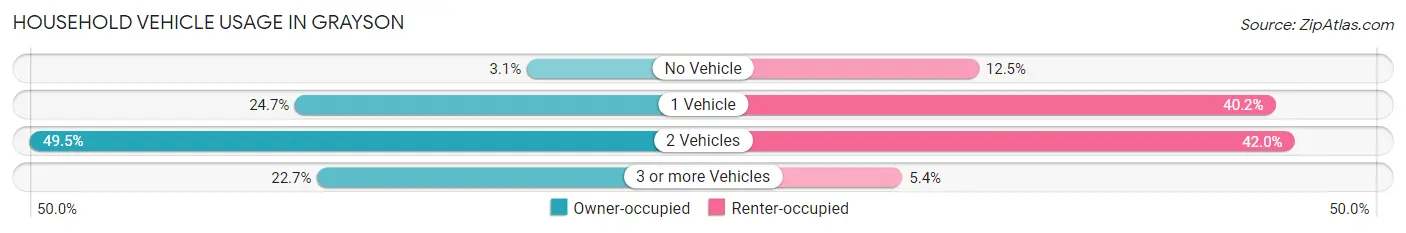
| Vehicles per Household | Owner-occupied | Renter-occupied |
| No Vehicle | 3 (3.1%) | 14 (12.5%) |
| 1 Vehicle | 24 (24.7%) | 45 (40.2%) |
| 2 Vehicles | 48 (49.5%) | 47 (42.0%) |
| 3 or more Vehicles | 22 (22.7%) | 6 (5.4%) |
| Total | 97 (100.0%) | 112 (100.0%) |
Real Estate & Mortgages in Grayson
Real Estate and Mortgage Overview in Grayson
| Characteristic | Without Mortgage | With Mortgage |
| Housing Units | 59 | 38 |
| Median Property Value | - | - |
| Median Household Income | $65,179 | $14 |
| Monthly Housing Costs | $267 | $0 |
| Real Estate Taxes | $199 | $0 |
Property Value by Mortgage Status in Grayson
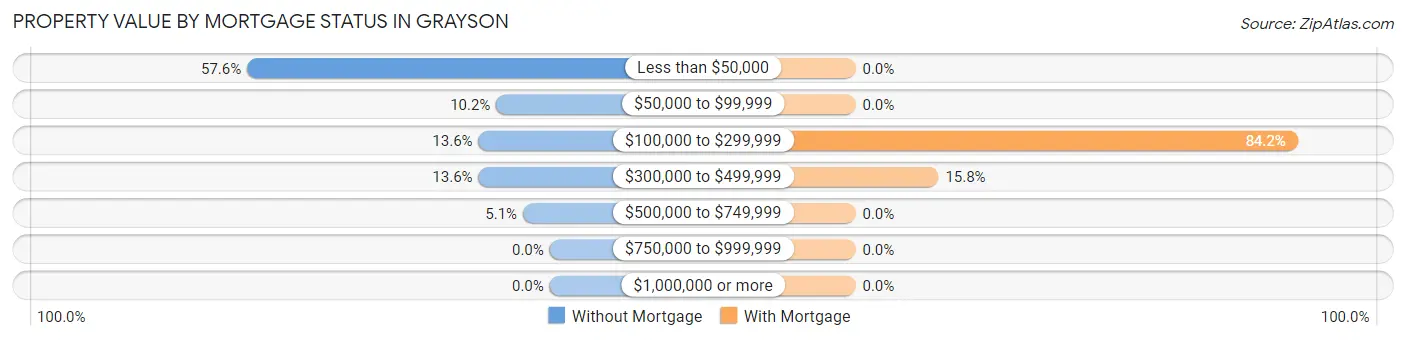
| Property Value | Without Mortgage | With Mortgage |
| Less than $50,000 | 34 (57.6%) | 0 (0.0%) |
| $50,000 to $99,999 | 6 (10.2%) | 0 (0.0%) |
| $100,000 to $299,999 | 8 (13.6%) | 32 (84.2%) |
| $300,000 to $499,999 | 8 (13.6%) | 6 (15.8%) |
| $500,000 to $749,999 | 3 (5.1%) | 0 (0.0%) |
| $750,000 to $999,999 | 0 (0.0%) | 0 (0.0%) |
| $1,000,000 or more | 0 (0.0%) | 0 (0.0%) |
| Total | 59 (100.0%) | 38 (100.0%) |
Household Income by Mortgage Status in Grayson
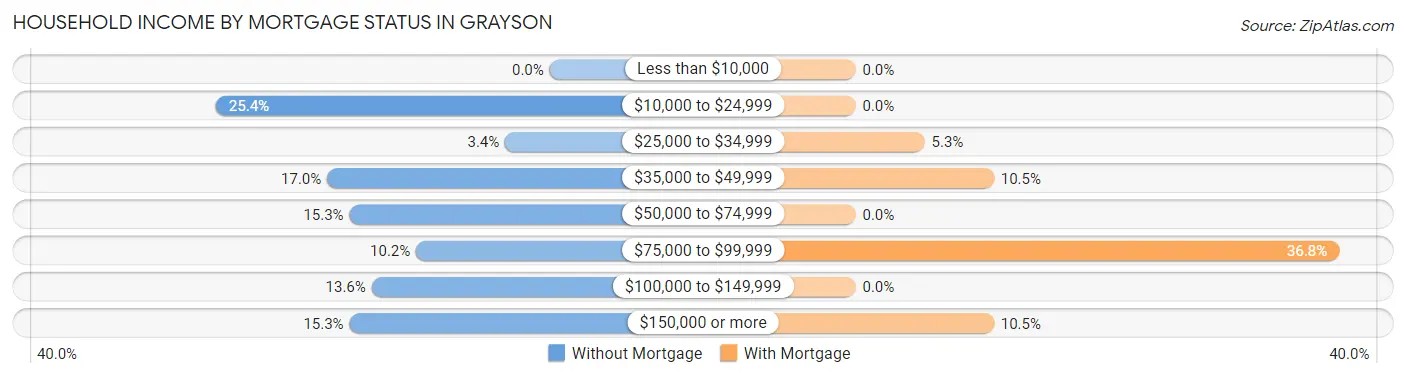
| Household Income | Without Mortgage | With Mortgage |
| Less than $10,000 | 0 (0.0%) | 0 (0.0%) |
| $10,000 to $24,999 | 15 (25.4%) | 0 (0.0%) |
| $25,000 to $34,999 | 2 (3.4%) | 2 (5.3%) |
| $35,000 to $49,999 | 10 (17.0%) | 4 (10.5%) |
| $50,000 to $74,999 | 9 (15.2%) | 0 (0.0%) |
| $75,000 to $99,999 | 6 (10.2%) | 14 (36.8%) |
| $100,000 to $149,999 | 8 (13.6%) | 0 (0.0%) |
| $150,000 or more | 9 (15.2%) | 4 (10.5%) |
| Total | 59 (100.0%) | 38 (100.0%) |
Property Value to Household Income Ratio in Grayson
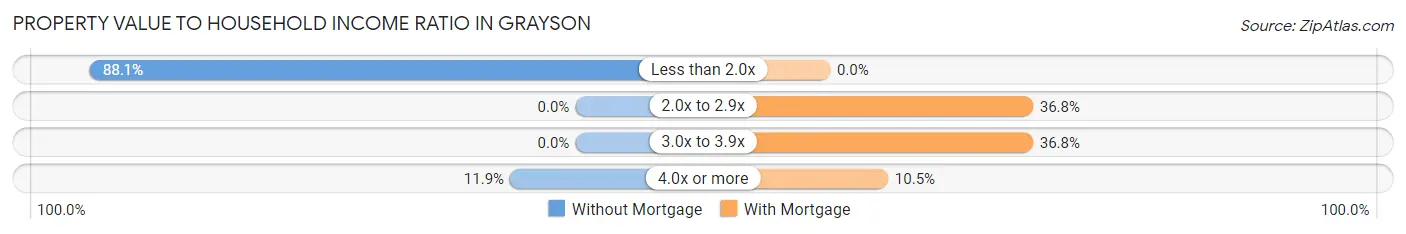
| Value-to-Income Ratio | Without Mortgage | With Mortgage |
| Less than 2.0x | 52 (88.1%) | 0 (0.0%) |
| 2.0x to 2.9x | 0 (0.0%) | 14 (36.8%) |
| 3.0x to 3.9x | 0 (0.0%) | 14 (36.8%) |
| 4.0x or more | 7 (11.9%) | 4 (10.5%) |
| Total | 59 (100.0%) | 38 (100.0%) |
Real Estate Taxes by Mortgage Status in Grayson
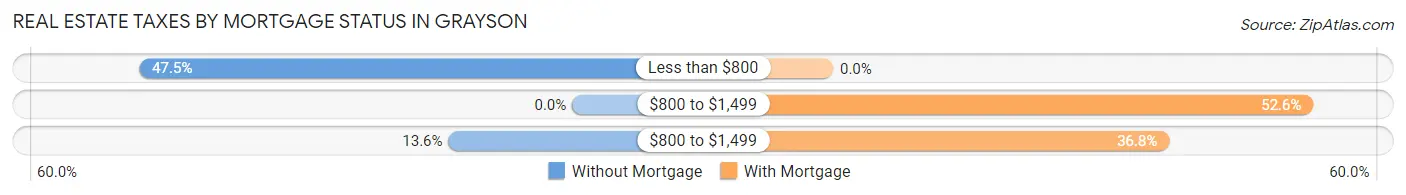
| Property Taxes | Without Mortgage | With Mortgage |
| Less than $800 | 28 (47.5%) | 0 (0.0%) |
| $800 to $1,499 | 0 (0.0%) | 20 (52.6%) |
| $800 to $1,499 | 8 (13.6%) | 14 (36.8%) |
| Total | 59 (100.0%) | 38 (100.0%) |
Health & Disability in Grayson
Health Insurance Coverage by Age in Grayson
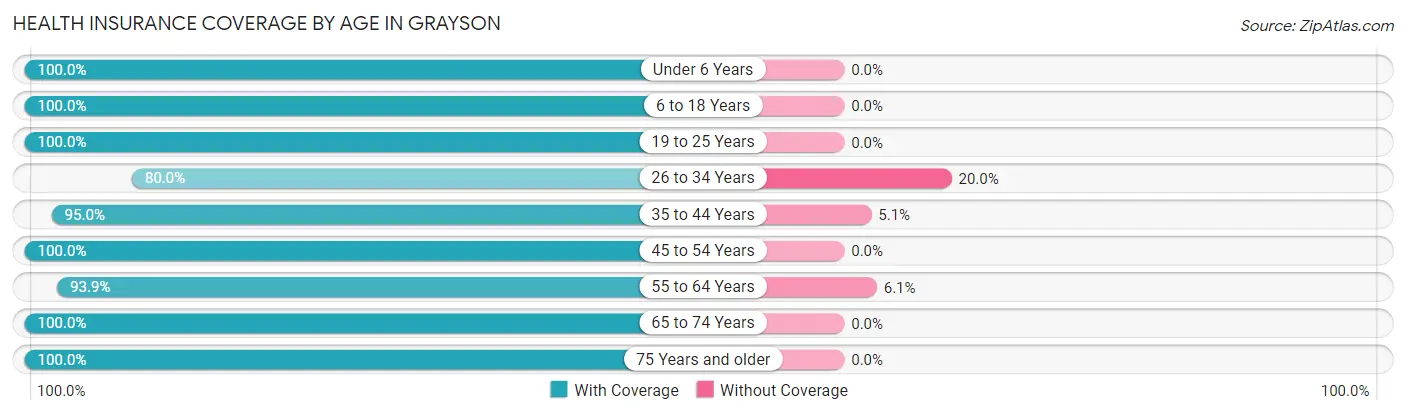
| Age Bracket | With Coverage | Without Coverage |
| Under 6 Years | 70 (100.0%) | 0 (0.0%) |
| 6 to 18 Years | 240 (100.0%) | 0 (0.0%) |
| 19 to 25 Years | 33 (100.0%) | 0 (0.0%) |
| 26 to 34 Years | 56 (80.0%) | 14 (20.0%) |
| 35 to 44 Years | 94 (95.0%) | 5 (5.1%) |
| 45 to 54 Years | 50 (100.0%) | 0 (0.0%) |
| 55 to 64 Years | 31 (93.9%) | 2 (6.1%) |
| 65 to 74 Years | 29 (100.0%) | 0 (0.0%) |
| 75 Years and older | 9 (100.0%) | 0 (0.0%) |
| Total | 612 (96.7%) | 21 (3.3%) |
Health Insurance Coverage by Citizenship Status in Grayson
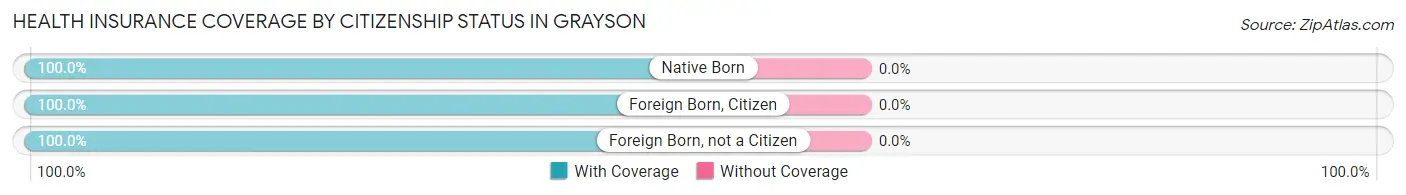
| Citizenship Status | With Coverage | Without Coverage |
| Native Born | 70 (100.0%) | 0 (0.0%) |
| Foreign Born, Citizen | 240 (100.0%) | 0 (0.0%) |
| Foreign Born, not a Citizen | 33 (100.0%) | 0 (0.0%) |
Health Insurance Coverage by Household Income in Grayson
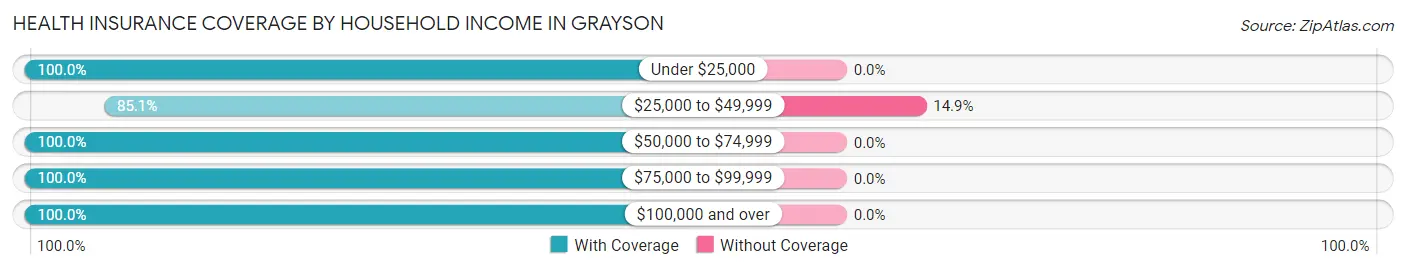
| Household Income | With Coverage | Without Coverage |
| Under $25,000 | 139 (100.0%) | 0 (0.0%) |
| $25,000 to $49,999 | 120 (85.1%) | 21 (14.9%) |
| $50,000 to $74,999 | 183 (100.0%) | 0 (0.0%) |
| $75,000 to $99,999 | 12 (100.0%) | 0 (0.0%) |
| $100,000 and over | 158 (100.0%) | 0 (0.0%) |
Public vs Private Health Insurance Coverage by Age in Grayson
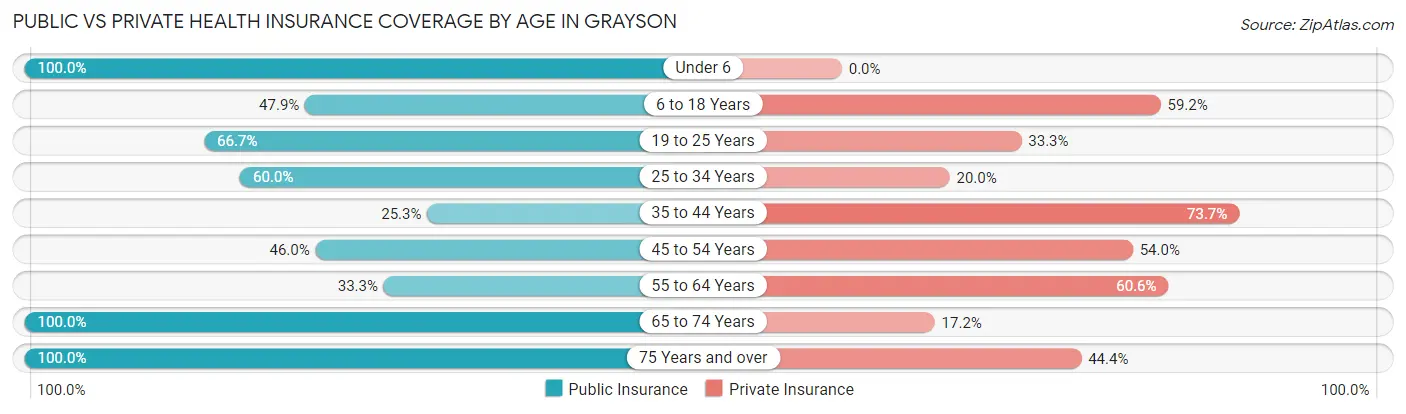
| Age Bracket | Public Insurance | Private Insurance |
| Under 6 | 70 (100.0%) | 0 (0.0%) |
| 6 to 18 Years | 115 (47.9%) | 142 (59.2%) |
| 19 to 25 Years | 22 (66.7%) | 11 (33.3%) |
| 25 to 34 Years | 42 (60.0%) | 14 (20.0%) |
| 35 to 44 Years | 25 (25.3%) | 73 (73.7%) |
| 45 to 54 Years | 23 (46.0%) | 27 (54.0%) |
| 55 to 64 Years | 11 (33.3%) | 20 (60.6%) |
| 65 to 74 Years | 29 (100.0%) | 5 (17.2%) |
| 75 Years and over | 9 (100.0%) | 4 (44.4%) |
| Total | 346 (54.7%) | 296 (46.8%) |
Disability Status by Sex by Age in Grayson
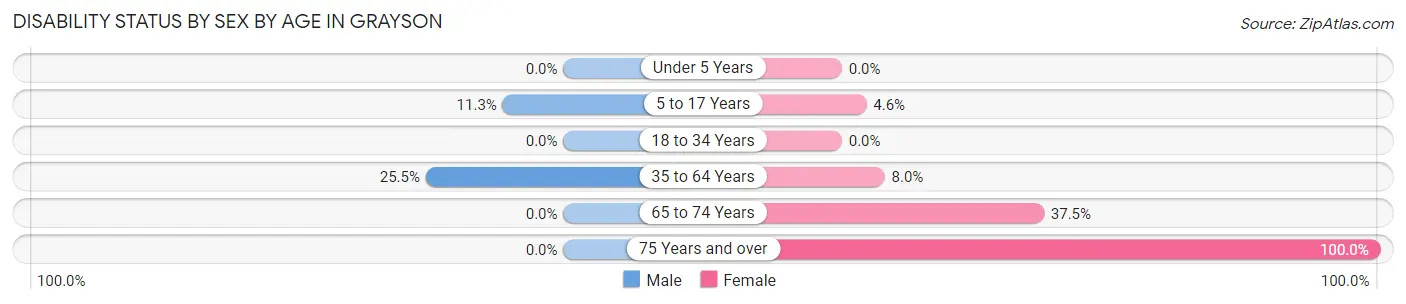
| Age Bracket | Male | Female |
| Under 5 Years | 0 (0.0%) | 0 (0.0%) |
| 5 to 17 Years | 8 (11.3%) | 8 (4.5%) |
| 18 to 34 Years | 0 (0.0%) | 0 (0.0%) |
| 35 to 64 Years | 24 (25.5%) | 7 (8.0%) |
| 65 to 74 Years | 0 (0.0%) | 3 (37.5%) |
| 75 Years and over | 0 (0.0%) | 6 (100.0%) |
Disability Class by Sex by Age in Grayson
Disability Class: Hearing Difficulty
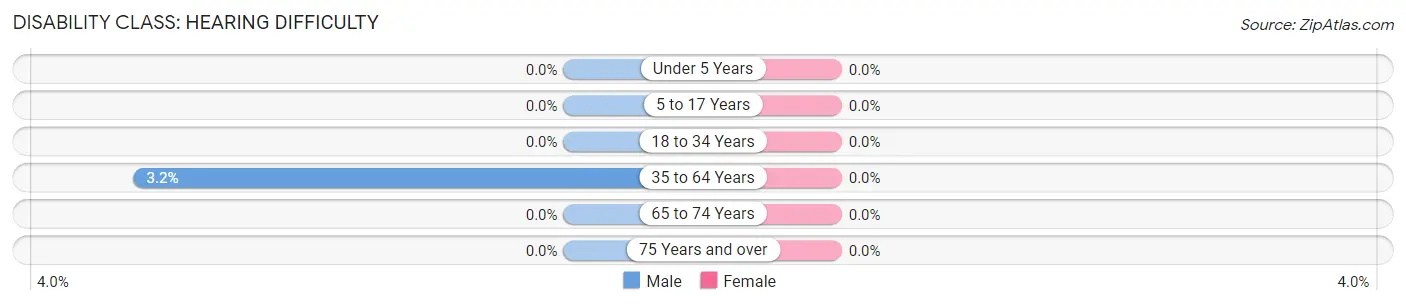
| Age Bracket | Male | Female |
| Under 5 Years | 0 (0.0%) | 0 (0.0%) |
| 5 to 17 Years | 0 (0.0%) | 0 (0.0%) |
| 18 to 34 Years | 0 (0.0%) | 0 (0.0%) |
| 35 to 64 Years | 3 (3.2%) | 0 (0.0%) |
| 65 to 74 Years | 0 (0.0%) | 0 (0.0%) |
| 75 Years and over | 0 (0.0%) | 0 (0.0%) |
Disability Class: Vision Difficulty
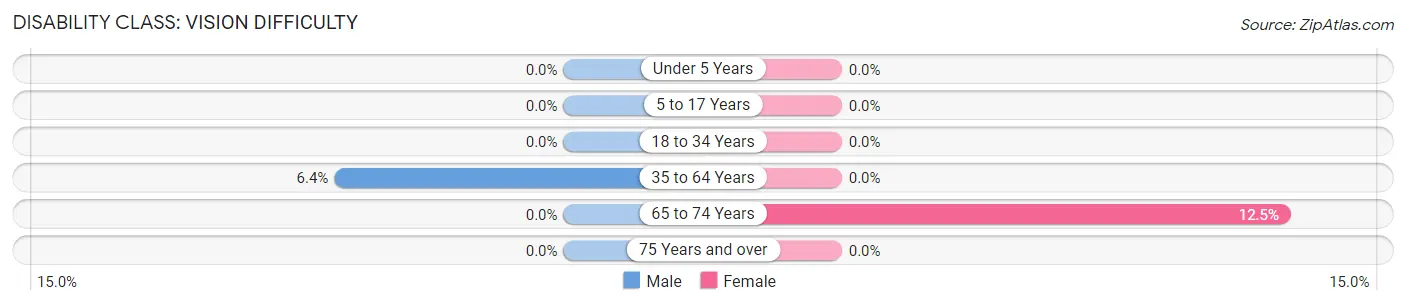
| Age Bracket | Male | Female |
| Under 5 Years | 0 (0.0%) | 0 (0.0%) |
| 5 to 17 Years | 0 (0.0%) | 0 (0.0%) |
| 18 to 34 Years | 0 (0.0%) | 0 (0.0%) |
| 35 to 64 Years | 6 (6.4%) | 0 (0.0%) |
| 65 to 74 Years | 0 (0.0%) | 1 (12.5%) |
| 75 Years and over | 0 (0.0%) | 0 (0.0%) |
Disability Class: Cognitive Difficulty
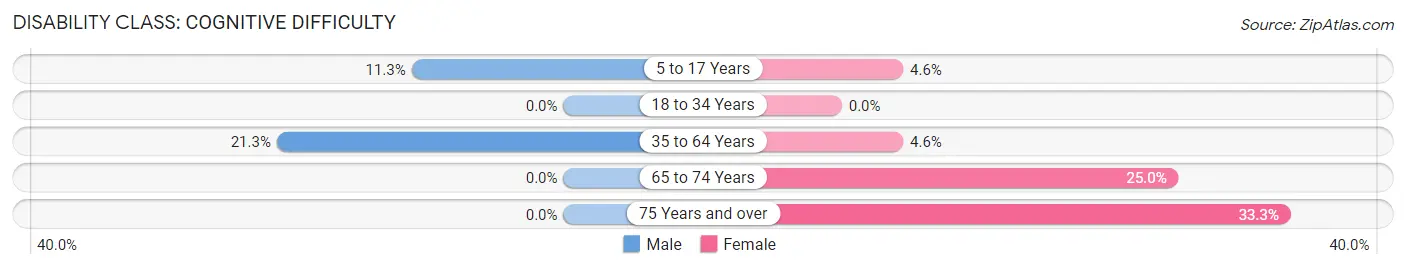
| Age Bracket | Male | Female |
| 5 to 17 Years | 8 (11.3%) | 8 (4.5%) |
| 18 to 34 Years | 0 (0.0%) | 0 (0.0%) |
| 35 to 64 Years | 20 (21.3%) | 4 (4.5%) |
| 65 to 74 Years | 0 (0.0%) | 2 (25.0%) |
| 75 Years and over | 0 (0.0%) | 2 (33.3%) |
Disability Class: Ambulatory Difficulty
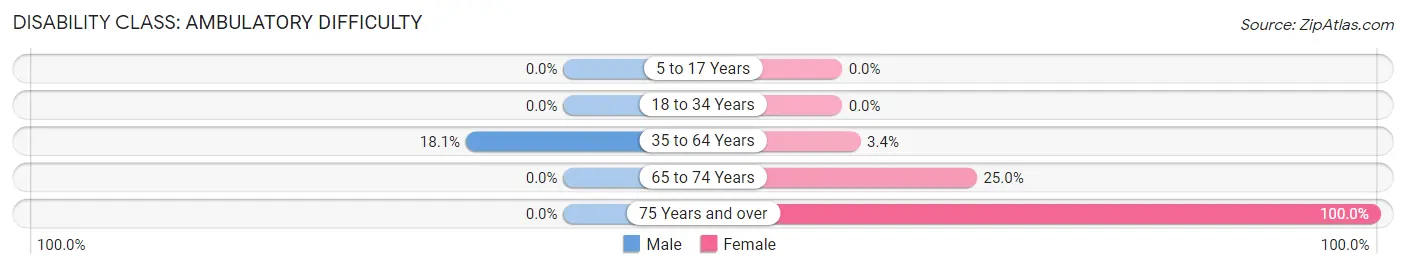
| Age Bracket | Male | Female |
| 5 to 17 Years | 0 (0.0%) | 0 (0.0%) |
| 18 to 34 Years | 0 (0.0%) | 0 (0.0%) |
| 35 to 64 Years | 17 (18.1%) | 3 (3.4%) |
| 65 to 74 Years | 0 (0.0%) | 2 (25.0%) |
| 75 Years and over | 0 (0.0%) | 6 (100.0%) |
Disability Class: Self-Care Difficulty
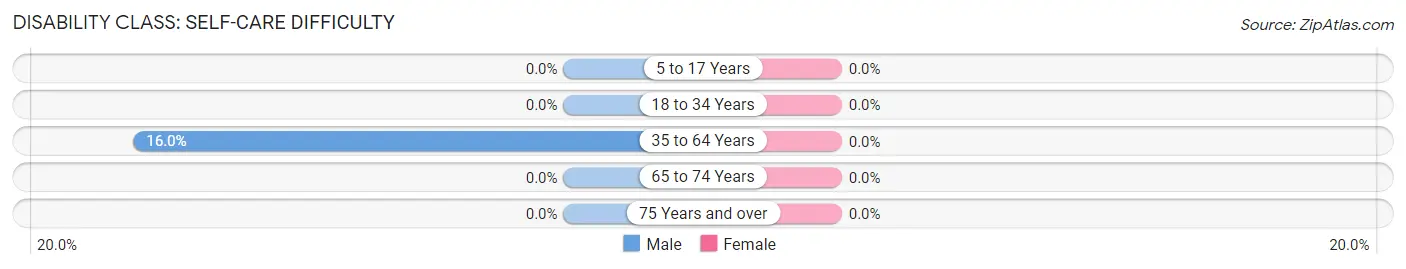
| Age Bracket | Male | Female |
| 5 to 17 Years | 0 (0.0%) | 0 (0.0%) |
| 18 to 34 Years | 0 (0.0%) | 0 (0.0%) |
| 35 to 64 Years | 15 (16.0%) | 0 (0.0%) |
| 65 to 74 Years | 0 (0.0%) | 0 (0.0%) |
| 75 Years and over | 0 (0.0%) | 0 (0.0%) |
Technology Access in Grayson
Computing Device Access in Grayson
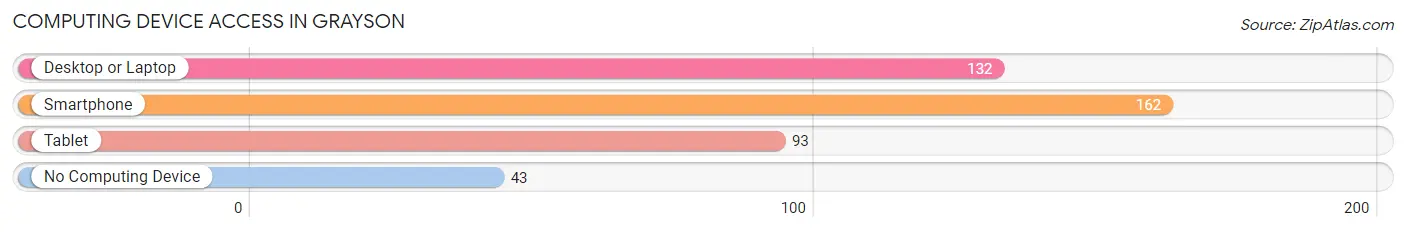
| Device Type | # Households | % Households |
| Desktop or Laptop | 132 | 63.2% |
| Smartphone | 162 | 77.5% |
| Tablet | 93 | 44.5% |
| No Computing Device | 43 | 20.6% |
| Total | 209 | 100.0% |
Internet Access in Grayson
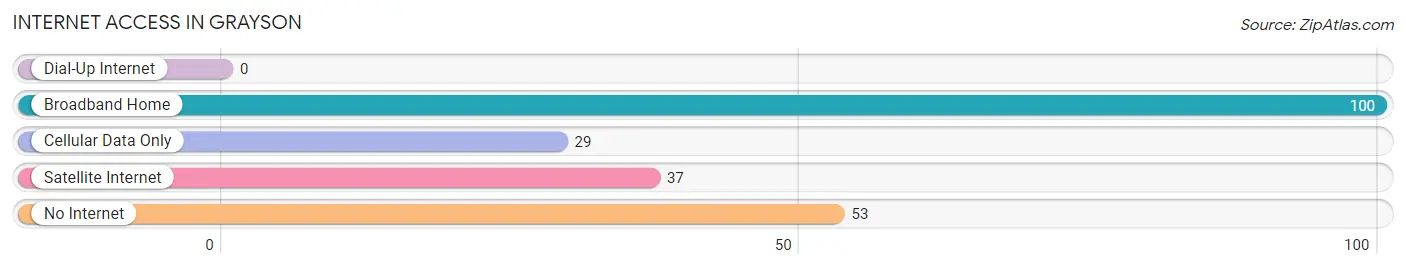
| Internet Type | # Households | % Households |
| Dial-Up Internet | 0 | 0.0% |
| Broadband Home | 100 | 47.8% |
| Cellular Data Only | 29 | 13.9% |
| Satellite Internet | 37 | 17.7% |
| No Internet | 53 | 25.4% |
| Total | 209 | 100.0% |
Grayson Summary
Grayson is a small town located in the state of Louisiana, in the United States of America. It is situated in the northern part of the state, in the parish of Jackson. The town has a population of approximately 1,000 people, and is located in a rural area.
Geography
Grayson is located in the northern part of Louisiana, in the parish of Jackson. It is situated in the northern part of the state, in the parish of Jackson. The town is located in a rural area, and is surrounded by forests and farmland. The town is located on the banks of the Red River, and is situated at an elevation of approximately 200 feet above sea level. The town is located in a humid subtropical climate zone, and experiences hot and humid summers, and mild winters.
History
Grayson was founded in 1845, and was originally known as “Grayson’s Landing”. The town was named after the Grayson family, who were the first settlers in the area. The town was originally a small farming community, and was home to a number of small businesses. In the late 19th century, the town began to grow, and a number of new businesses were established. In the early 20th century, the town experienced a period of growth, and a number of new businesses were established.
Economy
Grayson’s economy is largely based on agriculture and forestry. The town is home to a number of small businesses, including a number of farms, a sawmill, and a lumber yard. The town is also home to a number of small retail stores, and a number of restaurants. The town is also home to a number of small manufacturing businesses, including a furniture factory and a clothing factory.
Demographics
As of the 2010 census, the population of Grayson was 1,000 people. The town is predominantly white, with approximately 95% of the population being white. The town is also home to a small African American population, with approximately 4% of the population being African American. The town is also home to a small Hispanic population, with approximately 1% of the population being Hispanic.
Grayson is a small town with a rich history and a vibrant economy. The town is home to a number of small businesses, and is surrounded by forests and farmland. The town is also home to a diverse population, with a mix of white, African American, and Hispanic residents. The town is a great place to live, work, and raise a family.
Common Questions
What is Per Capita Income in Grayson?
Per Capita income in Grayson is $23,455.
What is the Median Family Income in Grayson?
Median Family Income in Grayson is $58,375.
What is the Median Household income in Grayson?
Median Household Income in Grayson is $47,917.
What is Income or Wage Gap in Grayson?
Income or Wage Gap in Grayson is 73.3%.
Women in Grayson earn 26.7 cents for every dollar earned by a man.
What is Family Income Deficit in Grayson?
Family Income Deficit in Grayson is $13,815.
Families that are below poverty line in Grayson earn $13,815 less on average than the poverty threshold level.
What is Inequality or Gini Index in Grayson?
Inequality or Gini Index in Grayson is 0.51.
What is the Total Population of Grayson?
Total Population of Grayson is 633.
What is the Total Male Population of Grayson?
Total Male Population of Grayson is 270.
What is the Total Female Population of Grayson?
Total Female Population of Grayson is 363.
What is the Ratio of Males per 100 Females in Grayson?
There are 74.38 Males per 100 Females in Grayson.
What is the Ratio of Females per 100 Males in Grayson?
There are 134.44 Females per 100 Males in Grayson.
What is the Median Population Age in Grayson?
Median Population Age in Grayson is 20.6 Years.
What is the Average Family Size in Grayson
Average Family Size in Grayson is 3.9 People.
What is the Average Household Size in Grayson
Average Household Size in Grayson is 3.0 People.
How Large is the Labor Force in Grayson?
There are 218 People in the Labor Forcein in Grayson.
What is the Percentage of People in the Labor Force in Grayson?
65.1% of People are in the Labor Force in Grayson.
What is the Unemployment Rate in Grayson?
Unemployment Rate in Grayson is 10.6%.