Gramercy, LA Map & Demographics
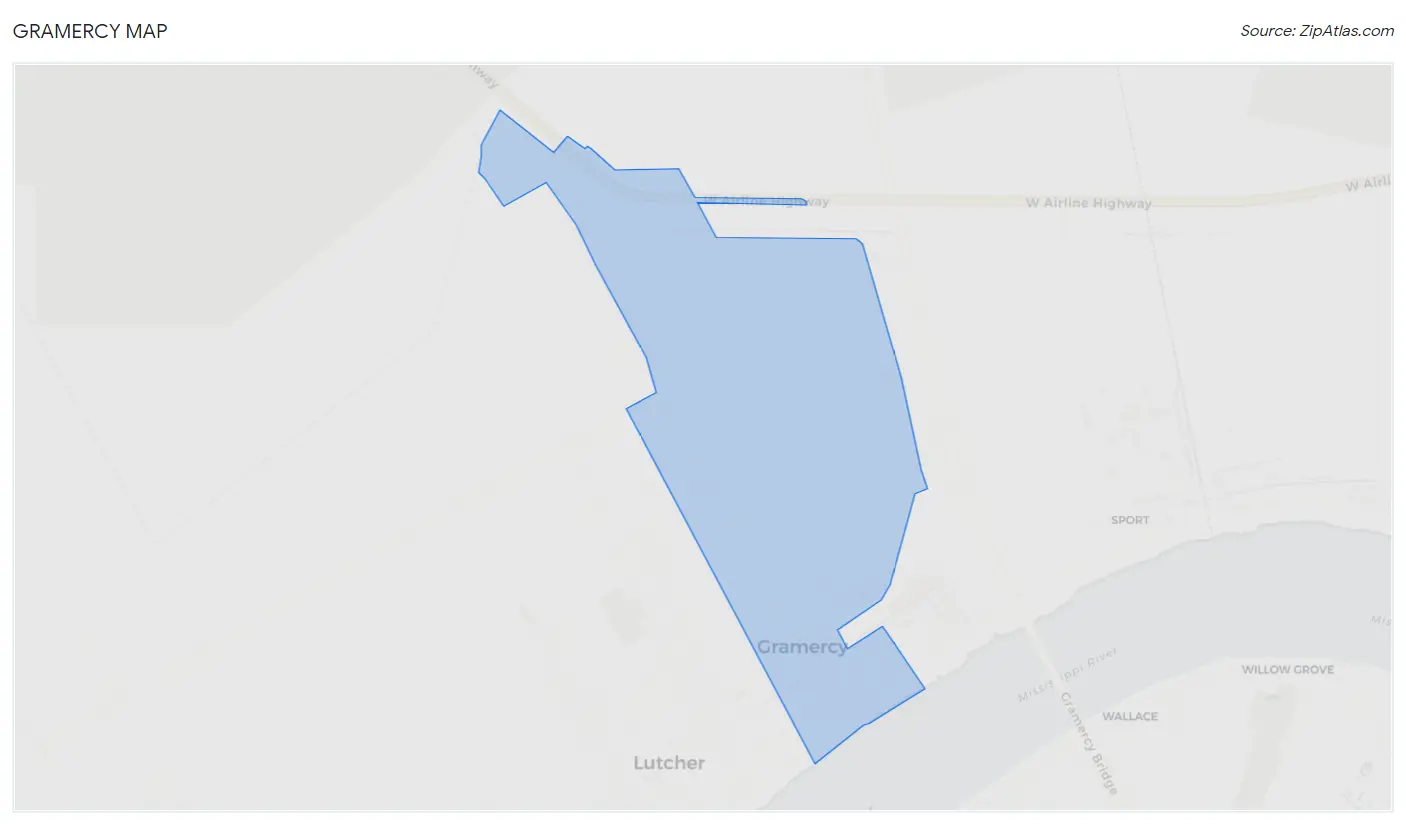
Gramercy Map
Gramercy Overview
$31,835
PER CAPITA INCOME
$87,310
AVG FAMILY INCOME
$81,438
AVG HOUSEHOLD INCOME
14.4%
WAGE / INCOME GAP [ % ]
85.6¢/ $1
WAGE / INCOME GAP [ $ ]
0.38
INEQUALITY / GINI INDEX
2,920
TOTAL POPULATION
1,378
MALE POPULATION
1,542
FEMALE POPULATION
89.36
MALES / 100 FEMALES
111.90
FEMALES / 100 MALES
41.3
MEDIAN AGE
3.4
AVG FAMILY SIZE
2.9
AVG HOUSEHOLD SIZE
1,621
LABOR FORCE [ PEOPLE ]
68.2%
PERCENT IN LABOR FORCE
4.4%
UNEMPLOYMENT RATE
Gramercy Zip Codes
Gramercy Area Codes
Income in Gramercy
Income Overview in Gramercy
Per Capita Income in Gramercy is $31,835, while median incomes of families and households are $87,310 and $81,438 respectively.
| Characteristic | Number | Measure |
| Per Capita Income | 2,920 | $31,835 |
| Median Family Income | 779 | $87,310 |
| Mean Family Income | 779 | $98,440 |
| Median Household Income | 1,009 | $81,438 |
| Mean Household Income | 1,009 | $87,037 |
| Income Deficit | 779 | $0 |
| Wage / Income Gap (%) | 2,920 | 14.37% |
| Wage / Income Gap ($) | 2,920 | 85.63¢ per $1 |
| Gini / Inequality Index | 2,920 | 0.38 |
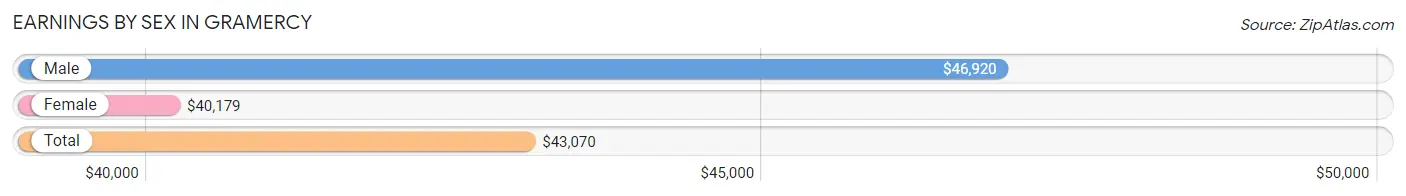
Earnings by Sex in Gramercy
Average Earnings in Gramercy are $43,070, $46,920 for men and $40,179 for women, a difference of 14.4%.
| Sex | Number | Average Earnings |
| Male | 769 (49.1%) | $46,920 |
| Female | 797 (50.9%) | $40,179 |
| Total | 1,566 (100.0%) | $43,070 |
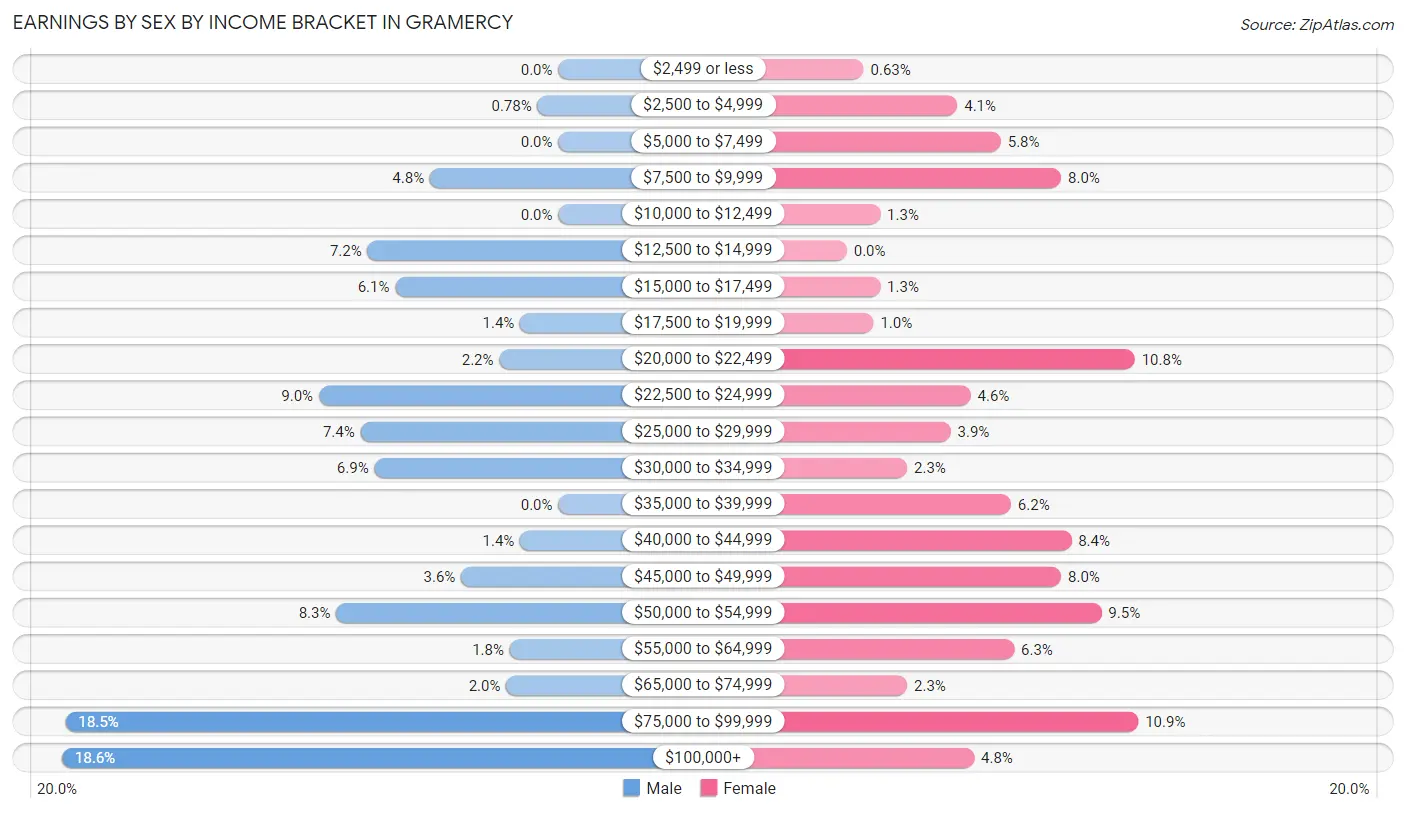
Earnings by Sex by Income Bracket in Gramercy
The most common earnings brackets in Gramercy are $100,000+ for men (143 | 18.6%) and $75,000 to $99,999 for women (87 | 10.9%).
| Income | Male | Female |
| $2,499 or less | 0 (0.0%) | 5 (0.6%) |
| $2,500 to $4,999 | 6 (0.8%) | 33 (4.1%) |
| $5,000 to $7,499 | 0 (0.0%) | 46 (5.8%) |
| $7,500 to $9,999 | 37 (4.8%) | 64 (8.0%) |
| $10,000 to $12,499 | 0 (0.0%) | 10 (1.3%) |
| $12,500 to $14,999 | 55 (7.1%) | 0 (0.0%) |
| $15,000 to $17,499 | 47 (6.1%) | 10 (1.3%) |
| $17,500 to $19,999 | 11 (1.4%) | 8 (1.0%) |
| $20,000 to $22,499 | 17 (2.2%) | 86 (10.8%) |
| $22,500 to $24,999 | 69 (9.0%) | 37 (4.6%) |
| $25,000 to $29,999 | 57 (7.4%) | 31 (3.9%) |
| $30,000 to $34,999 | 53 (6.9%) | 18 (2.3%) |
| $35,000 to $39,999 | 0 (0.0%) | 49 (6.1%) |
| $40,000 to $44,999 | 11 (1.4%) | 67 (8.4%) |
| $45,000 to $49,999 | 28 (3.6%) | 64 (8.0%) |
| $50,000 to $54,999 | 64 (8.3%) | 76 (9.5%) |
| $55,000 to $64,999 | 14 (1.8%) | 50 (6.3%) |
| $65,000 to $74,999 | 15 (1.9%) | 18 (2.3%) |
| $75,000 to $99,999 | 142 (18.5%) | 87 (10.9%) |
| $100,000+ | 143 (18.6%) | 38 (4.8%) |
| Total | 769 (100.0%) | 797 (100.0%) |
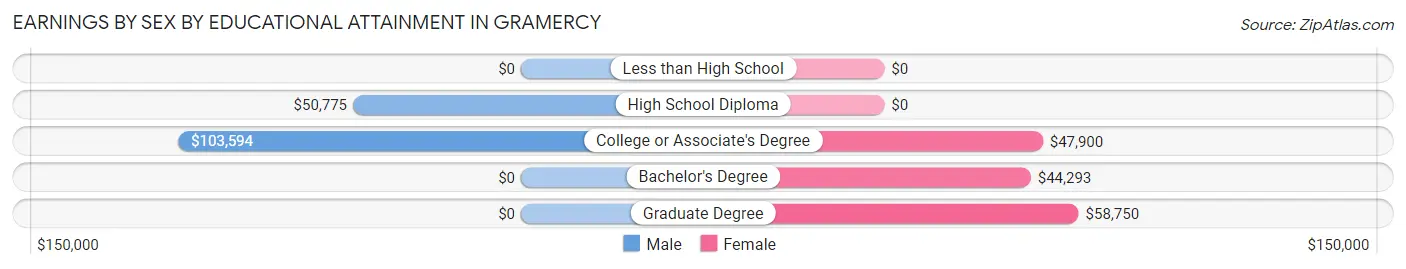
Earnings by Sex by Educational Attainment in Gramercy
Average earnings in Gramercy are $54,531 for men and $43,696 for women, a difference of 19.9%. Men with an educational attainment of college or associate's degree enjoy the highest average annual earnings of $103,594, while those with high school diploma education earn the least with $50,775. Women with an educational attainment of graduate degree earn the most with the average annual earnings of $58,750, while those with bachelor's degree education have the smallest earnings of $44,293.
| Educational Attainment | Male Income | Female Income |
| Less than High School | - | - |
| High School Diploma | $50,775 | $0 |
| College or Associate's Degree | $103,594 | $47,900 |
| Bachelor's Degree | - | - |
| Graduate Degree | - | - |
| Total | $54,531 | $43,696 |
Family Income in Gramercy
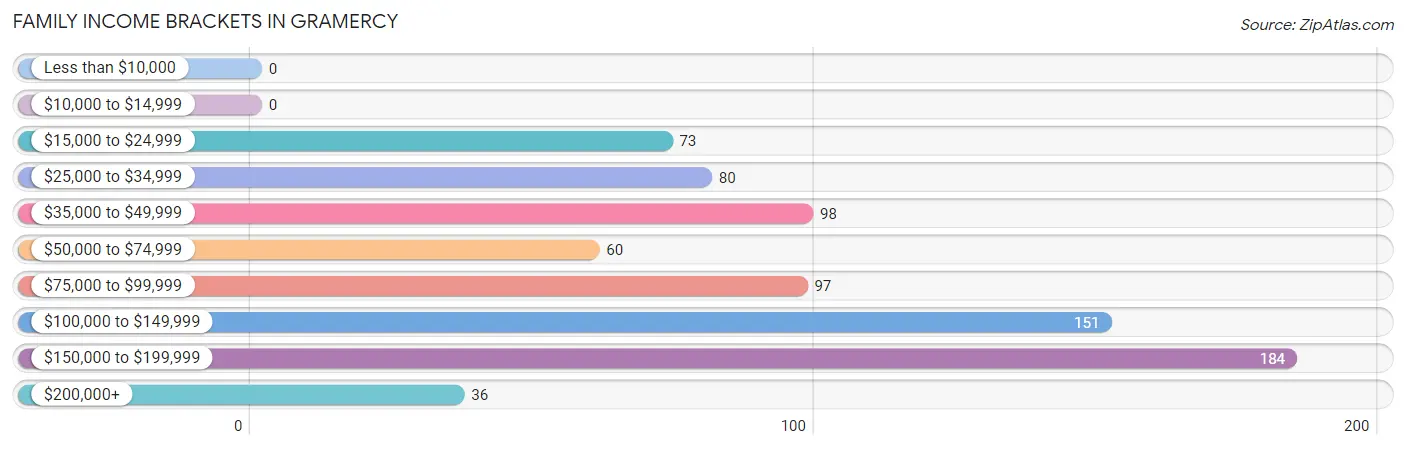
Family Income Brackets in Gramercy
According to the Gramercy family income data, there are 184 families falling into the $150,000 to $199,999 income range, which is the most common income bracket and makes up 23.6% of all families.
| Income Bracket | # Families | % Families |
| Less than $10,000 | 0 | 0.0% |
| $10,000 to $14,999 | 0 | 0.0% |
| $15,000 to $24,999 | 73 | 9.4% |
| $25,000 to $34,999 | 80 | 10.3% |
| $35,000 to $49,999 | 98 | 12.6% |
| $50,000 to $74,999 | 60 | 7.7% |
| $75,000 to $99,999 | 97 | 12.5% |
| $100,000 to $149,999 | 151 | 19.4% |
| $150,000 to $199,999 | 184 | 23.6% |
| $200,000+ | 36 | 4.6% |
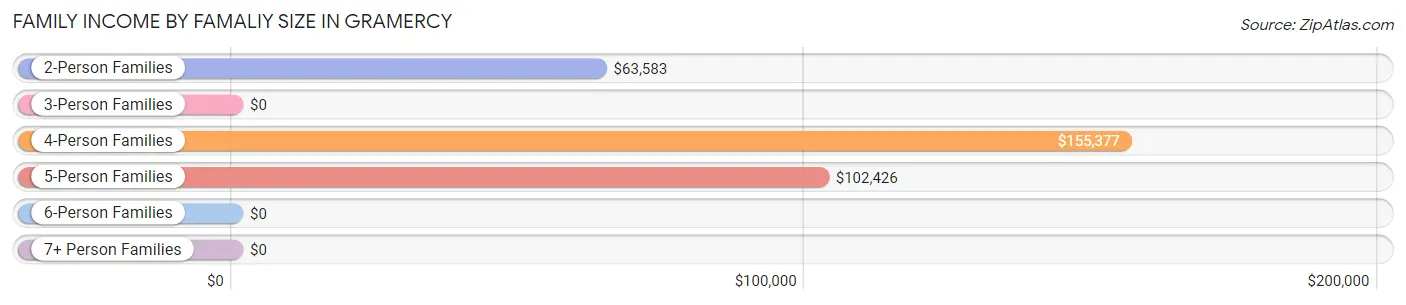
Family Income by Famaliy Size in Gramercy
4-person families (230 | 29.5%) account for the highest median family income in Gramercy with $155,377 per family, while 4-person families (230 | 29.5%) have the highest median income of $38,844 per family member.
| Income Bracket | # Families | Median Income |
| 2-Person Families | 315 (40.4%) | $63,583 |
| 3-Person Families | 164 (21.0%) | $0 |
| 4-Person Families | 230 (29.5%) | $155,377 |
| 5-Person Families | 41 (5.3%) | $102,426 |
| 6-Person Families | 0 (0.0%) | $0 |
| 7+ Person Families | 29 (3.7%) | $0 |
| Total | 779 (100.0%) | $87,310 |
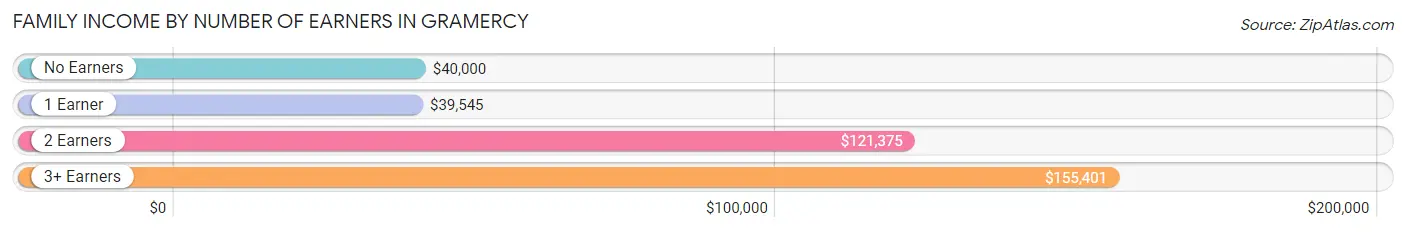
Family Income by Number of Earners in Gramercy
The median family income in Gramercy is $87,310, with families comprising 3+ earners (193) having the highest median family income of $155,401, while families with 1 earner (166) have the lowest median family income of $39,545, accounting for 24.8% and 21.3% of families, respectively.
| Number of Earners | # Families | Median Income |
| No Earners | 144 (18.5%) | $40,000 |
| 1 Earner | 166 (21.3%) | $39,545 |
| 2 Earners | 276 (35.4%) | $121,375 |
| 3+ Earners | 193 (24.8%) | $155,401 |
| Total | 779 (100.0%) | $87,310 |
Household Income in Gramercy
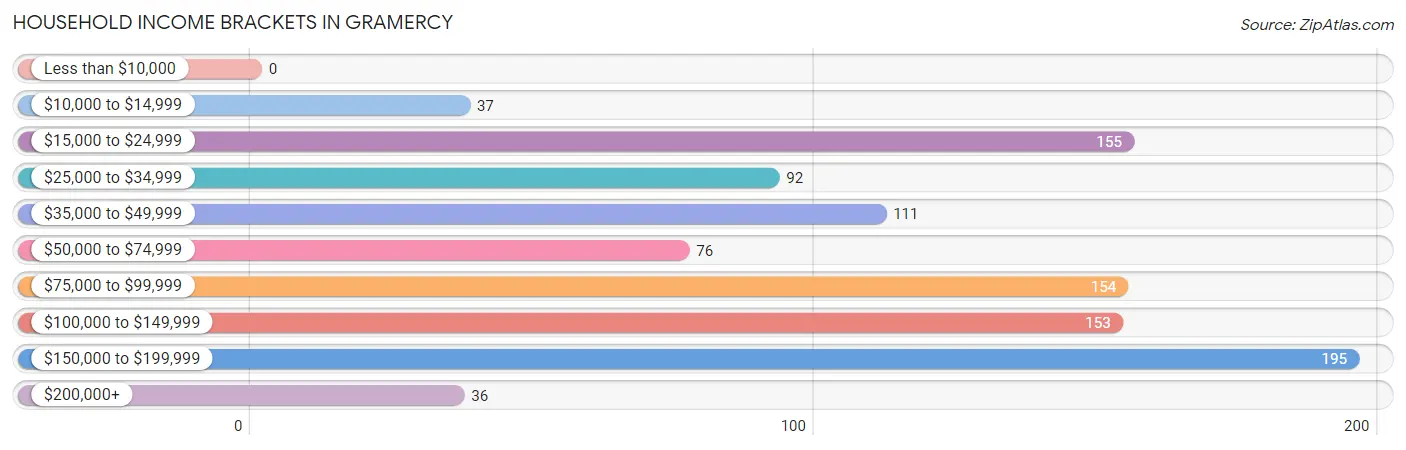
Household Income Brackets in Gramercy
With 195 households falling in the category, the $150,000 to $199,999 income range is the most frequent in Gramercy, accounting for 19.3% of all households.
| Income Bracket | # Households | % Households |
| Less than $10,000 | 0 | 0.0% |
| $10,000 to $14,999 | 37 | 3.7% |
| $15,000 to $24,999 | 155 | 15.4% |
| $25,000 to $34,999 | 92 | 9.1% |
| $35,000 to $49,999 | 111 | 11.0% |
| $50,000 to $74,999 | 76 | 7.5% |
| $75,000 to $99,999 | 154 | 15.3% |
| $100,000 to $149,999 | 153 | 15.2% |
| $150,000 to $199,999 | 195 | 19.3% |
| $200,000+ | 36 | 3.6% |
Household Income by Householder Age in Gramercy
The median household income in Gramercy is $81,438, with the highest median household income of $94,188 found in the 45 to 64 years age bracket for the primary householder. A total of 425 households (42.1%) fall into this category.
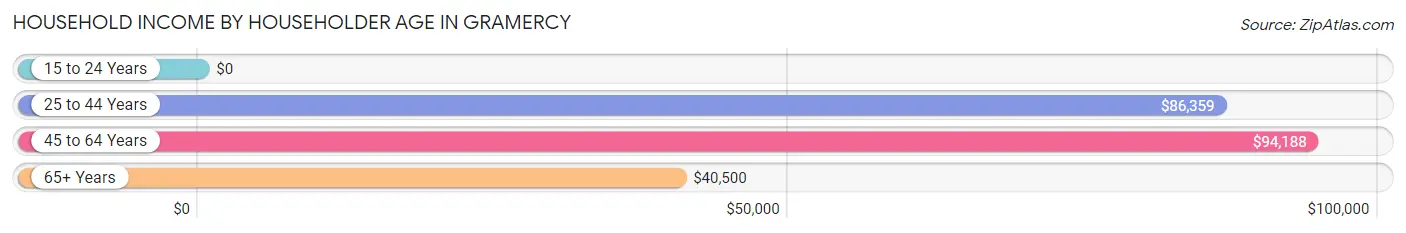
| Income Bracket | # Households | Median Income |
| 15 to 24 Years | 0 (0.0%) | $0 |
| 25 to 44 Years | 338 (33.5%) | $86,359 |
| 45 to 64 Years | 425 (42.1%) | $94,188 |
| 65+ Years | 246 (24.4%) | $40,500 |
| Total | 1,009 (100.0%) | $81,438 |
Poverty in Gramercy
Income Below Poverty by Sex and Age in Gramercy
With 4.6% poverty level for males and 14.1% for females among the residents of Gramercy, 16 and 17 year old males and 16 and 17 year old females are the most vulnerable to poverty, with 21 males (26.6%) and 36 females (100.0%) in their respective age groups living below the poverty level.
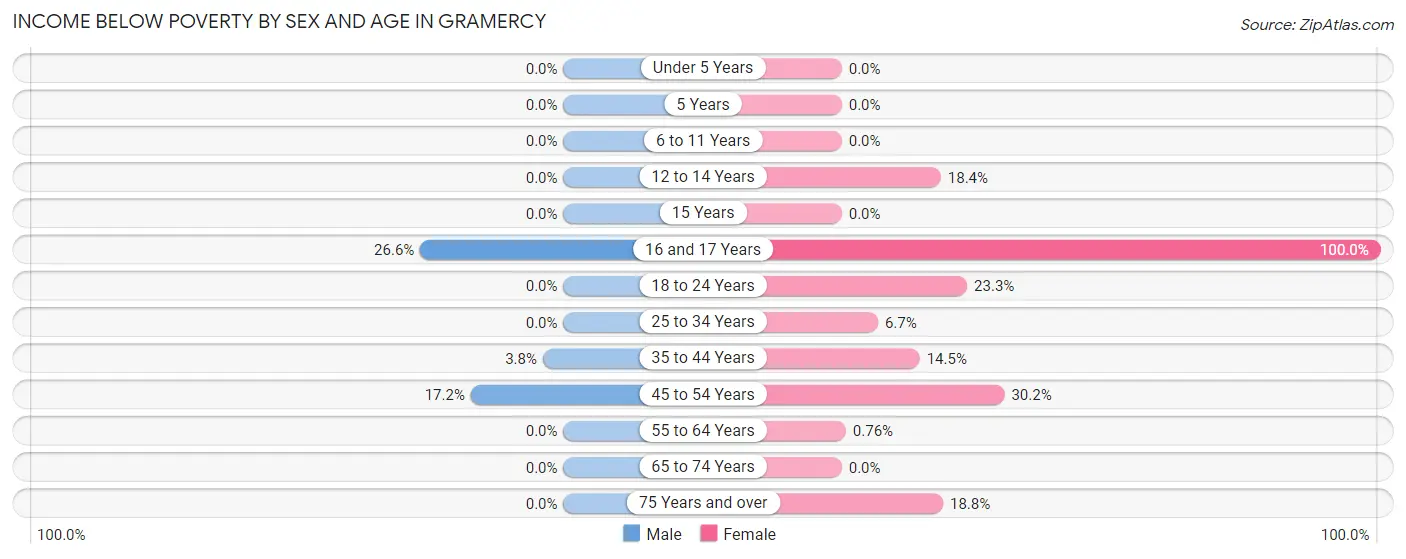
| Age Bracket | Male | Female |
| Under 5 Years | 0 (0.0%) | 0 (0.0%) |
| 5 Years | 0 (0.0%) | 0 (0.0%) |
| 6 to 11 Years | 0 (0.0%) | 0 (0.0%) |
| 12 to 14 Years | 0 (0.0%) | 16 (18.4%) |
| 15 Years | 0 (0.0%) | 0 (0.0%) |
| 16 and 17 Years | 21 (26.6%) | 36 (100.0%) |
| 18 to 24 Years | 0 (0.0%) | 47 (23.3%) |
| 25 to 34 Years | 0 (0.0%) | 10 (6.7%) |
| 35 to 44 Years | 9 (3.8%) | 33 (14.5%) |
| 45 to 54 Years | 33 (17.2%) | 45 (30.2%) |
| 55 to 64 Years | 0 (0.0%) | 2 (0.8%) |
| 65 to 74 Years | 0 (0.0%) | 0 (0.0%) |
| 75 Years and over | 0 (0.0%) | 28 (18.8%) |
| Total | 63 (4.6%) | 217 (14.1%) |
Income Above Poverty by Sex and Age in Gramercy
According to the poverty statistics in Gramercy, males aged under 5 years and females aged under 5 years are the age groups that are most secure financially, with 100.0% of males and 100.0% of females in these age groups living above the poverty line.
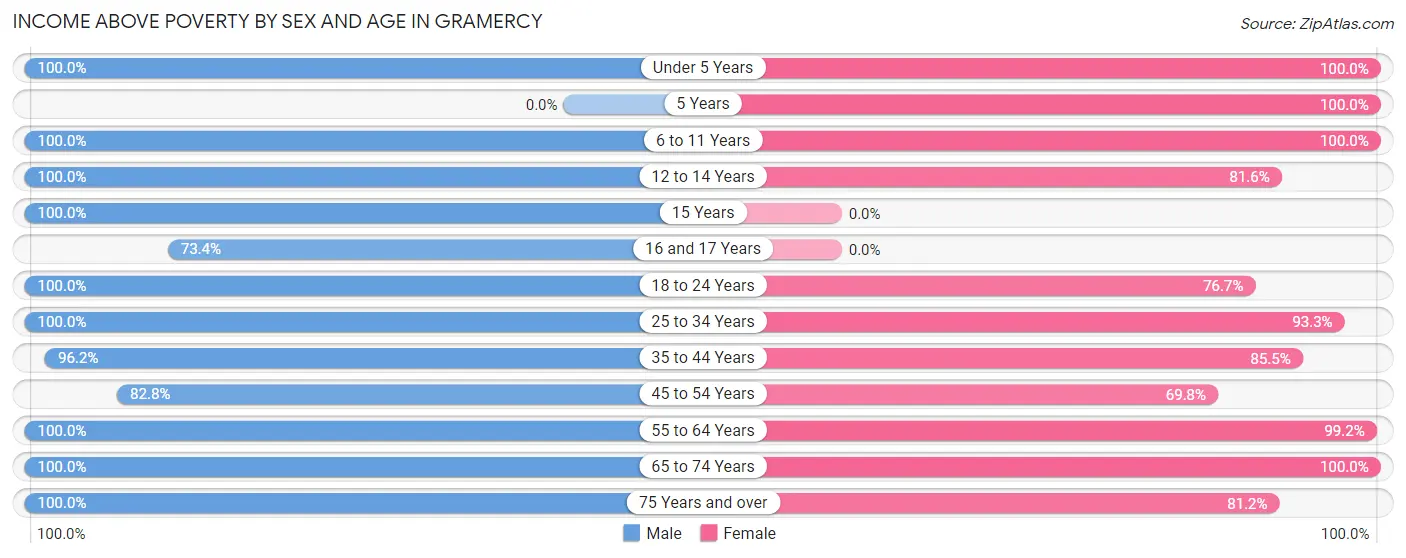
| Age Bracket | Male | Female |
| Under 5 Years | 42 (100.0%) | 28 (100.0%) |
| 5 Years | 0 (0.0%) | 34 (100.0%) |
| 6 to 11 Years | 168 (100.0%) | 120 (100.0%) |
| 12 to 14 Years | 6 (100.0%) | 71 (81.6%) |
| 15 Years | 50 (100.0%) | 0 (0.0%) |
| 16 and 17 Years | 58 (73.4%) | 0 (0.0%) |
| 18 to 24 Years | 138 (100.0%) | 155 (76.7%) |
| 25 to 34 Years | 101 (100.0%) | 139 (93.3%) |
| 35 to 44 Years | 227 (96.2%) | 195 (85.5%) |
| 45 to 54 Years | 159 (82.8%) | 104 (69.8%) |
| 55 to 64 Years | 212 (100.0%) | 260 (99.2%) |
| 65 to 74 Years | 102 (100.0%) | 98 (100.0%) |
| 75 Years and over | 44 (100.0%) | 121 (81.2%) |
| Total | 1,307 (95.4%) | 1,325 (85.9%) |
Income Below Poverty Among Married-Couple Families in Gramercy
The poverty statistics for married-couple families in Gramercy show that 2.9% or 17 of the total 597 families live below the poverty line. Families with 1 or 2 children have the highest poverty rate of 7.4%, comprising of 17 families. On the other hand, families with no children have the lowest poverty rate of 0.0%, which includes 0 families.
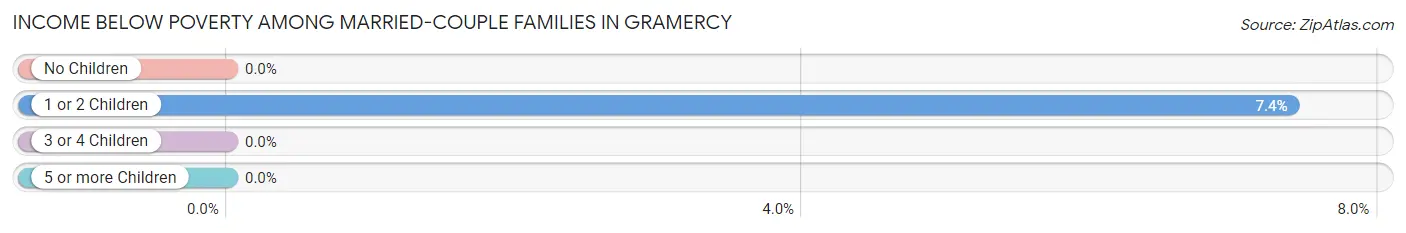
| Children | Above Poverty | Below Poverty |
| No Children | 325 (100.0%) | 0 (0.0%) |
| 1 or 2 Children | 213 (92.6%) | 17 (7.4%) |
| 3 or 4 Children | 42 (100.0%) | 0 (0.0%) |
| 5 or more Children | 0 (0.0%) | 0 (0.0%) |
| Total | 580 (97.2%) | 17 (2.9%) |
Income Below Poverty Among Single-Parent Households in Gramercy
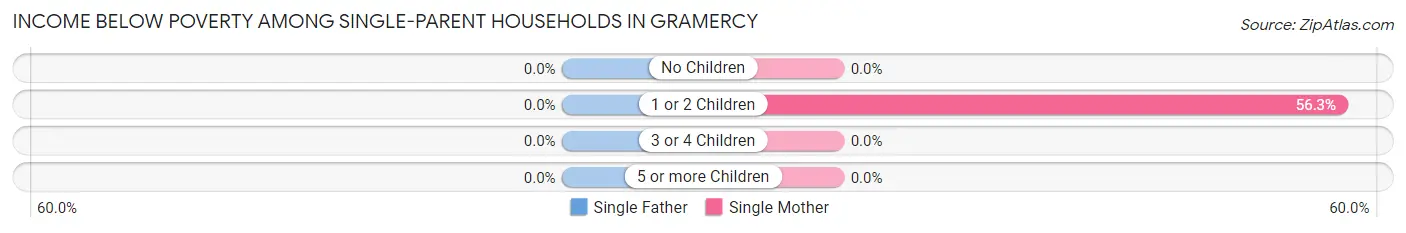
| Children | Single Father | Single Mother |
| No Children | 0 (0.0%) | 0 (0.0%) |
| 1 or 2 Children | 0 (0.0%) | 40 (56.3%) |
| 3 or 4 Children | 0 (0.0%) | 0 (0.0%) |
| 5 or more Children | 0 (0.0%) | 0 (0.0%) |
| Total | 0 (0.0%) | 40 (25.3%) |
Income Below Poverty Among Married-Couple vs Single-Parent Households in Gramercy
The poverty data for Gramercy shows that 17 of the married-couple family households (2.9%) and 40 of the single-parent households (22.0%) are living below the poverty level. Within the married-couple family households, those with 1 or 2 children have the highest poverty rate, with 17 households (7.4%) falling below the poverty line. Among the single-parent households, those with 1 or 2 children have the highest poverty rate, with 40 household (42.1%) living below poverty.
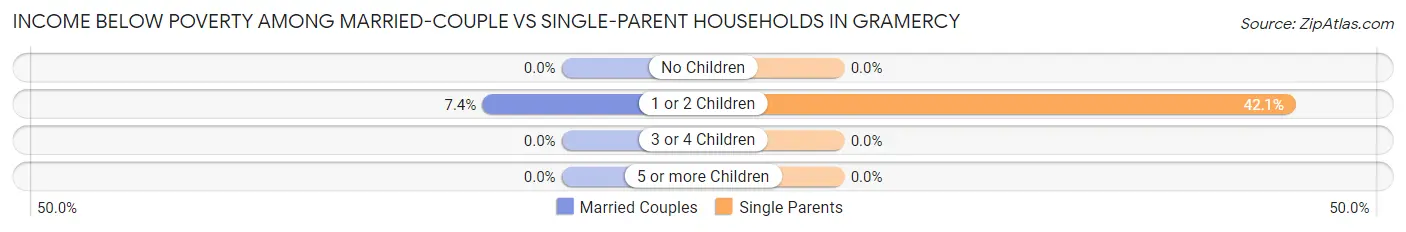
| Children | Married-Couple Families | Single-Parent Households |
| No Children | 0 (0.0%) | 0 (0.0%) |
| 1 or 2 Children | 17 (7.4%) | 40 (42.1%) |
| 3 or 4 Children | 0 (0.0%) | 0 (0.0%) |
| 5 or more Children | 0 (0.0%) | 0 (0.0%) |
| Total | 17 (2.9%) | 40 (22.0%) |
Race in Gramercy
The most populous races in Gramercy are Black / African American (1,778 | 60.9%), White / Caucasian (1,114 | 38.2%), and Two or more Races (18 | 0.6%).
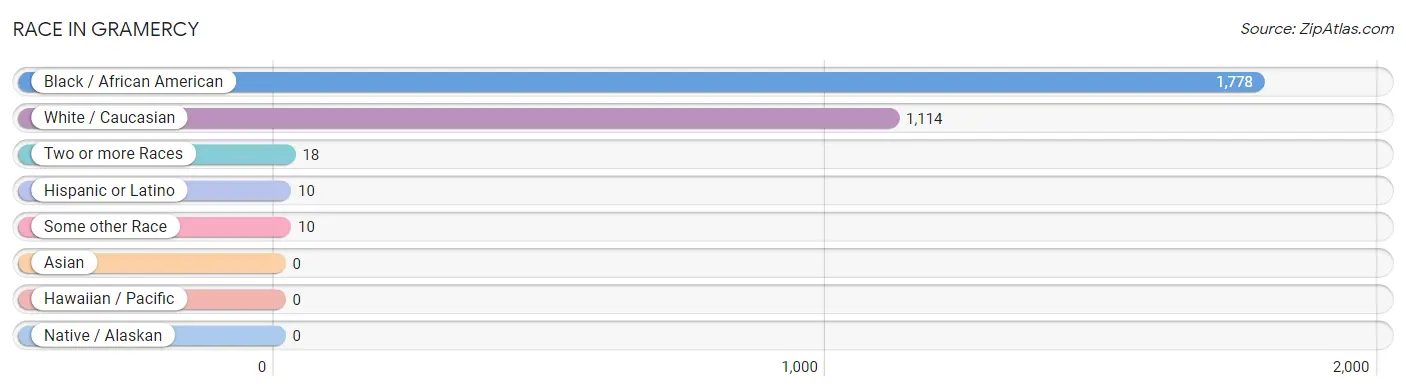
| Race | # Population | % Population |
| Asian | 0 | 0.0% |
| Black / African American | 1,778 | 60.9% |
| Hawaiian / Pacific | 0 | 0.0% |
| Hispanic or Latino | 10 | 0.3% |
| Native / Alaskan | 0 | 0.0% |
| White / Caucasian | 1,114 | 38.2% |
| Two or more Races | 18 | 0.6% |
| Some other Race | 10 | 0.3% |
| Total | 2,920 | 100.0% |
Ancestry in Gramercy
The most populous ancestries reported in Gramercy are American (332 | 11.4%), French (217 | 7.4%), German (95 | 3.3%), French Canadian (58 | 2.0%), and Irish (44 | 1.5%), together accounting for 25.6% of all Gramercy residents.
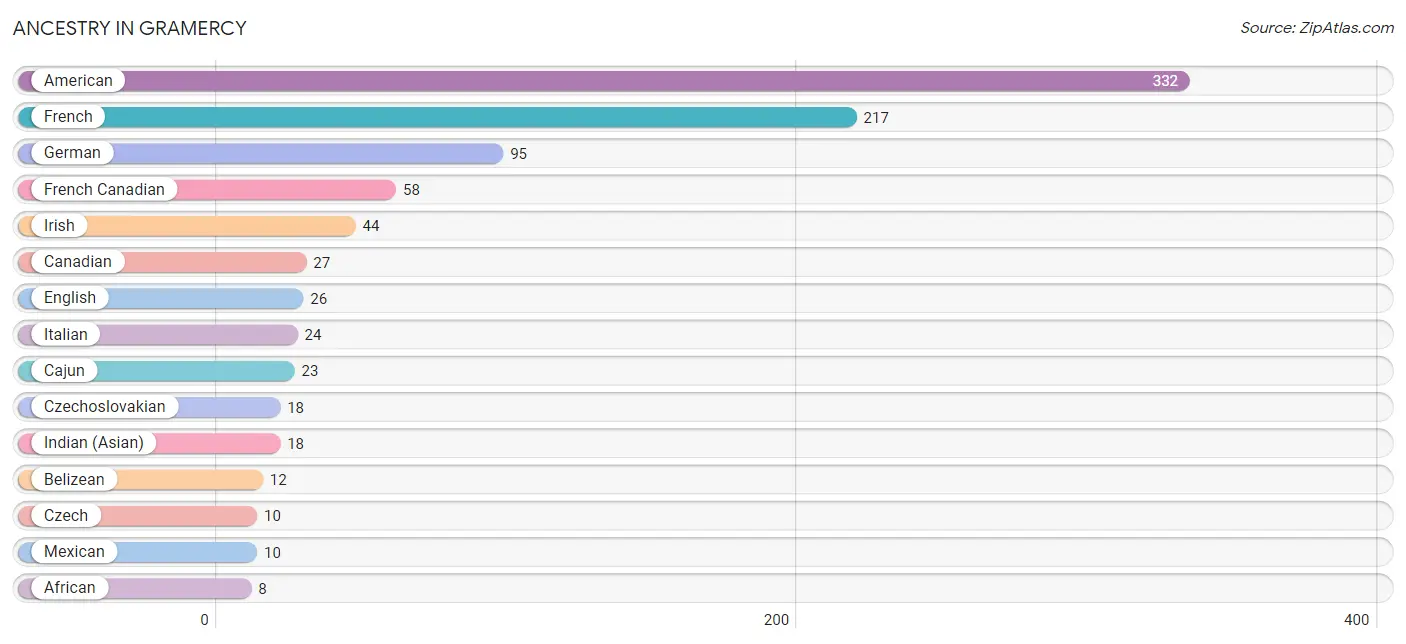
| Ancestry | # Population | % Population |
| African | 8 | 0.3% |
| American | 332 | 11.4% |
| Belizean | 12 | 0.4% |
| Cajun | 23 | 0.8% |
| Canadian | 27 | 0.9% |
| Czech | 10 | 0.3% |
| Czechoslovakian | 18 | 0.6% |
| English | 26 | 0.9% |
| French | 217 | 7.4% |
| French Canadian | 58 | 2.0% |
| German | 95 | 3.3% |
| Indian (Asian) | 18 | 0.6% |
| Irish | 44 | 1.5% |
| Italian | 24 | 0.8% |
| Mexican | 10 | 0.3% |
| Polish | 6 | 0.2% |
| Scotch-Irish | 6 | 0.2% |
| Subsaharan African | 8 | 0.3% | View All 18 Rows |
Immigrants in Gramercy
The most numerous immigrant groups reported in Gramercy came from , and Canada (27 | 0.9%), together accounting for 0.9% of all Gramercy residents.

| Immigration Origin | # Population | % Population |
| Canada | 27 | 0.9% | View All 1 Rows |
Sex and Age in Gramercy
Sex and Age in Gramercy
The most populous age groups in Gramercy are 15 to 19 Years (178 | 12.9%) for men and 40 to 44 Years (170 | 11.0%) for women.
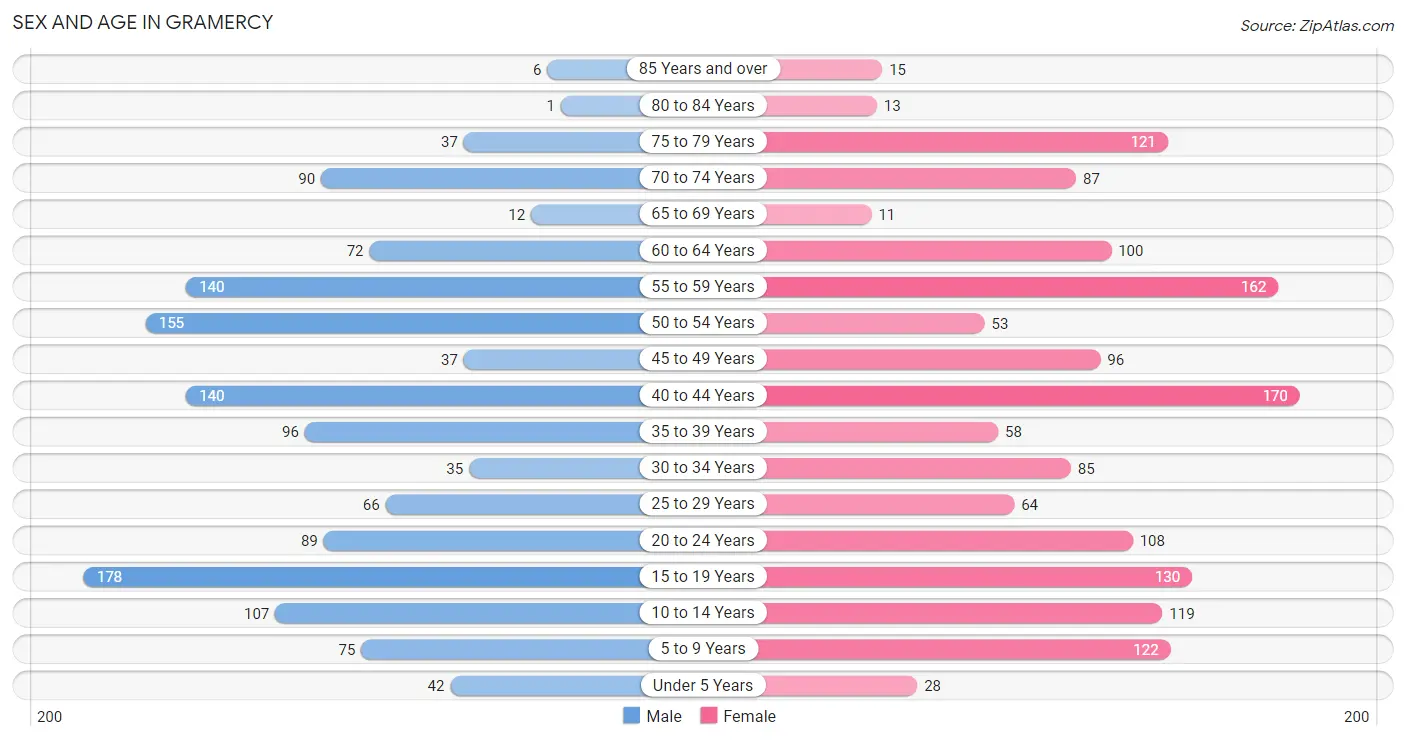
| Age Bracket | Male | Female |
| Under 5 Years | 42 (3.0%) | 28 (1.8%) |
| 5 to 9 Years | 75 (5.4%) | 122 (7.9%) |
| 10 to 14 Years | 107 (7.8%) | 119 (7.7%) |
| 15 to 19 Years | 178 (12.9%) | 130 (8.4%) |
| 20 to 24 Years | 89 (6.5%) | 108 (7.0%) |
| 25 to 29 Years | 66 (4.8%) | 64 (4.2%) |
| 30 to 34 Years | 35 (2.5%) | 85 (5.5%) |
| 35 to 39 Years | 96 (7.0%) | 58 (3.8%) |
| 40 to 44 Years | 140 (10.2%) | 170 (11.0%) |
| 45 to 49 Years | 37 (2.7%) | 96 (6.2%) |
| 50 to 54 Years | 155 (11.3%) | 53 (3.4%) |
| 55 to 59 Years | 140 (10.2%) | 162 (10.5%) |
| 60 to 64 Years | 72 (5.2%) | 100 (6.5%) |
| 65 to 69 Years | 12 (0.9%) | 11 (0.7%) |
| 70 to 74 Years | 90 (6.5%) | 87 (5.6%) |
| 75 to 79 Years | 37 (2.7%) | 121 (7.9%) |
| 80 to 84 Years | 1 (0.1%) | 13 (0.8%) |
| 85 Years and over | 6 (0.4%) | 15 (1.0%) |
| Total | 1,378 (100.0%) | 1,542 (100.0%) |
Families and Households in Gramercy
Median Family Size in Gramercy
The median family size in Gramercy is 3.38 persons per family, with married-couple families (597 | 76.6%) accounting for the largest median family size of 3.5 persons per family. On the other hand, single male/father families (24 | 3.1%) represent the smallest median family size with 1.92 persons per family.
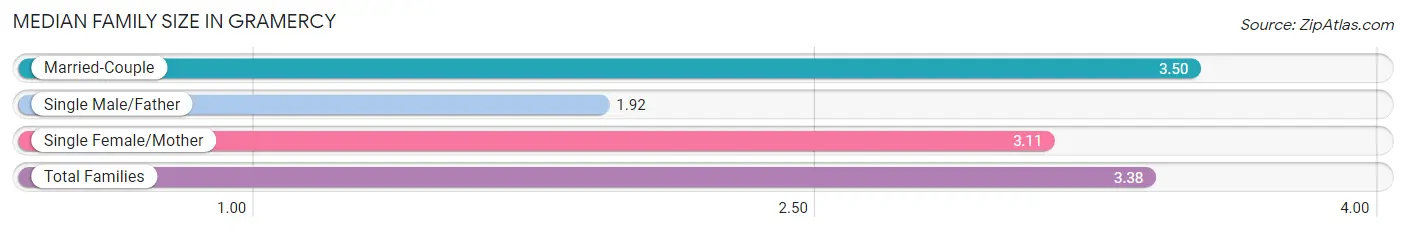
| Family Type | # Families | Family Size |
| Married-Couple | 597 (76.6%) | 3.50 |
| Single Male/Father | 24 (3.1%) | 1.92 |
| Single Female/Mother | 158 (20.3%) | 3.11 |
| Total Families | 779 (100.0%) | 3.38 |
Median Household Size in Gramercy
The median household size in Gramercy is 2.89 persons per household, with married-couple households (597 | 59.2%) accounting for the largest median household size of 3.5 persons per household. non-family households (230 | 22.8%) represent the smallest median household size with 1.23 persons per household.
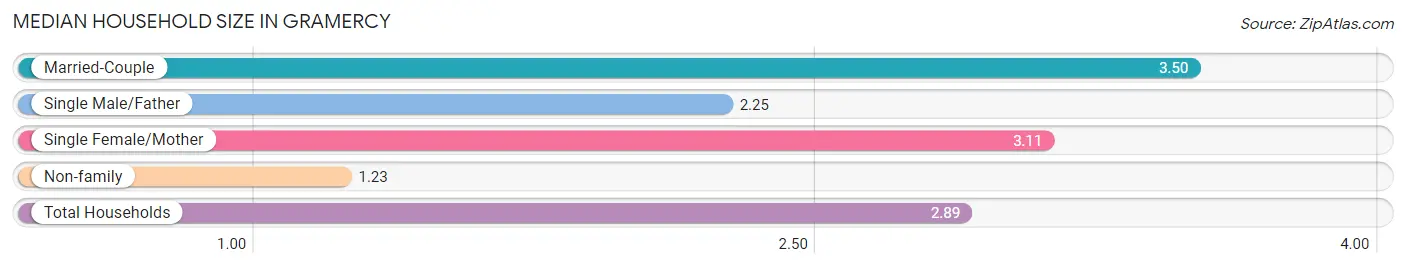
| Household Type | # Households | Household Size |
| Married-Couple | 597 (59.2%) | 3.50 |
| Single Male/Father | 24 (2.4%) | 2.25 |
| Single Female/Mother | 158 (15.7%) | 3.11 |
| Non-family | 230 (22.8%) | 1.23 |
| Total Households | 1,009 (100.0%) | 2.89 |
Household Size by Marriage Status in Gramercy
Out of a total of 1,009 households in Gramercy, 779 (77.2%) are family households, while 230 (22.8%) are nonfamily households. The most numerous type of family households are 2-person households, comprising 304, and the most common type of nonfamily households are 1-person households, comprising 182.
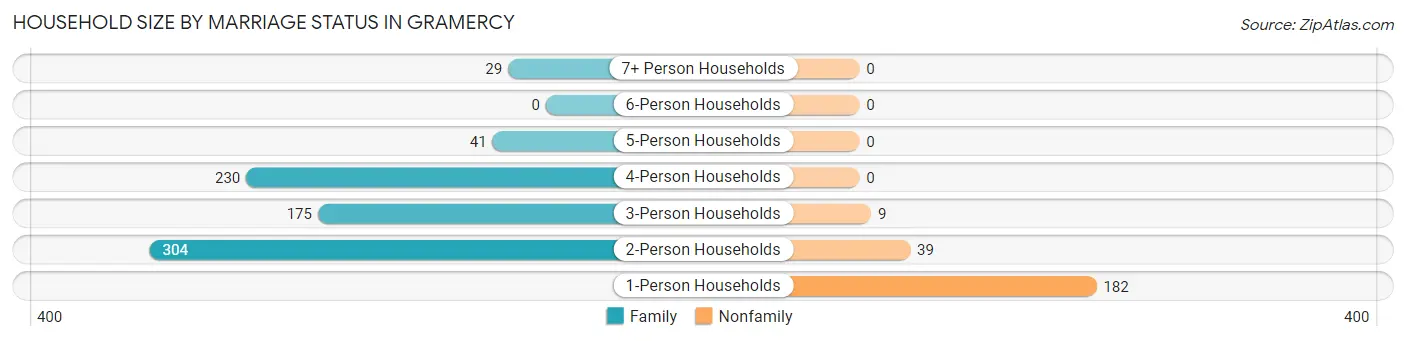
| Household Size | Family Households | Nonfamily Households |
| 1-Person Households | - | 182 (18.0%) |
| 2-Person Households | 304 (30.1%) | 39 (3.9%) |
| 3-Person Households | 175 (17.3%) | 9 (0.9%) |
| 4-Person Households | 230 (22.8%) | 0 (0.0%) |
| 5-Person Households | 41 (4.1%) | 0 (0.0%) |
| 6-Person Households | 0 (0.0%) | 0 (0.0%) |
| 7+ Person Households | 29 (2.9%) | 0 (0.0%) |
| Total | 779 (77.2%) | 230 (22.8%) |
Female Fertility in Gramercy
Fertility by Age in Gramercy
Average fertility rate in Gramercy is 14.0 births per 1,000 women. Women in the age bracket of 20 to 34 years have the highest fertility rate with 39.0 births per 1,000 women. Women in the age bracket of 20 to 34 years acount for 100.0% of all women with births.
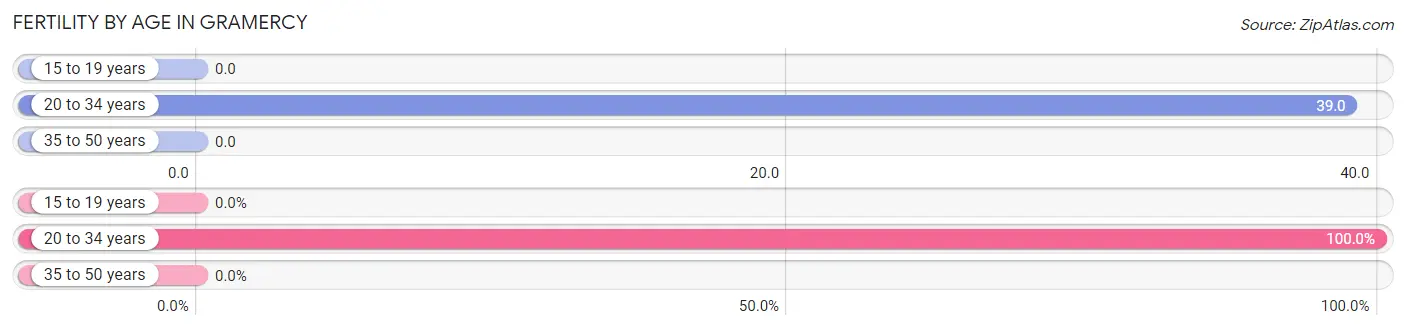
| Age Bracket | Women with Births | Births / 1,000 Women |
| 15 to 19 years | 0 (0.0%) | 0.0 |
| 20 to 34 years | 10 (100.0%) | 39.0 |
| 35 to 50 years | 0 (0.0%) | 0.0 |
| Total | 10 (100.0%) | 14.0 |
Fertility by Age by Marriage Status in Gramercy
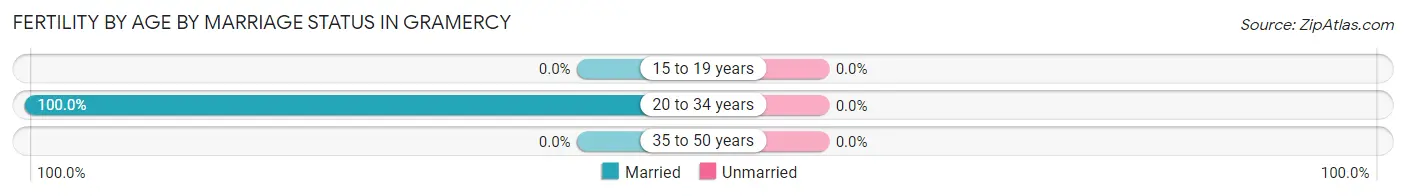
| Age Bracket | Married | Unmarried |
| 15 to 19 years | 0 (0.0%) | 0 (0.0%) |
| 20 to 34 years | 10 (100.0%) | 0 (0.0%) |
| 35 to 50 years | 0 (0.0%) | 0 (0.0%) |
| Total | 10 (100.0%) | 0 (0.0%) |
Fertility by Education in Gramercy
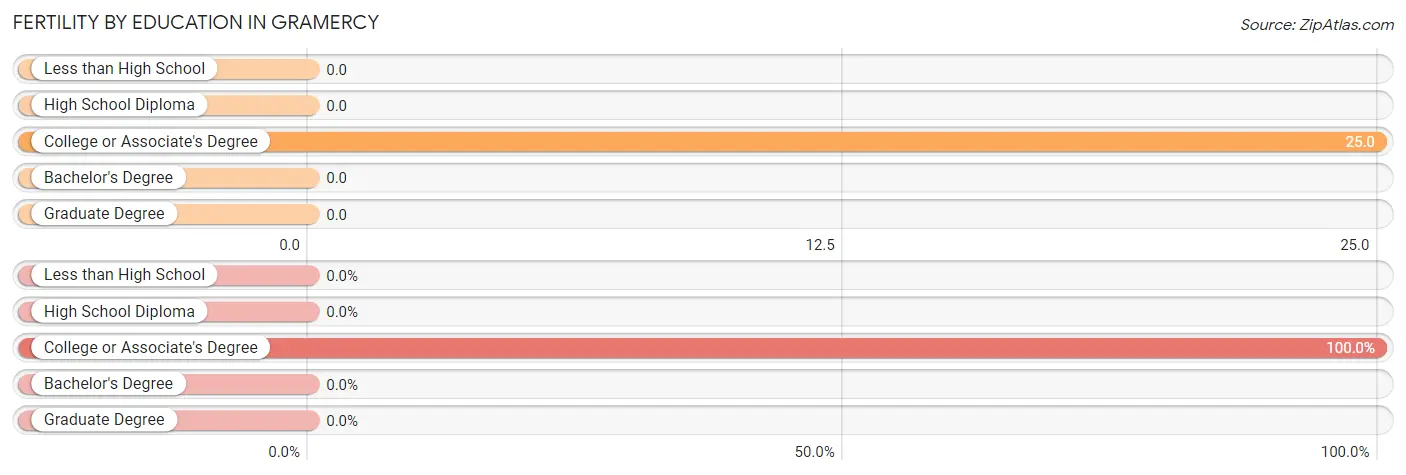
| Educational Attainment | Women with Births | Births / 1,000 Women |
| Less than High School | 0 (0.0%) | 0.0 |
| High School Diploma | 0 (0.0%) | 0.0 |
| College or Associate's Degree | 10 (100.0%) | 25.0 |
| Bachelor's Degree | 0 (0.0%) | 0.0 |
| Graduate Degree | 0 (0.0%) | 0.0 |
| Total | 10 (100.0%) | 14.0 |
Fertility by Education by Marriage Status in Gramercy
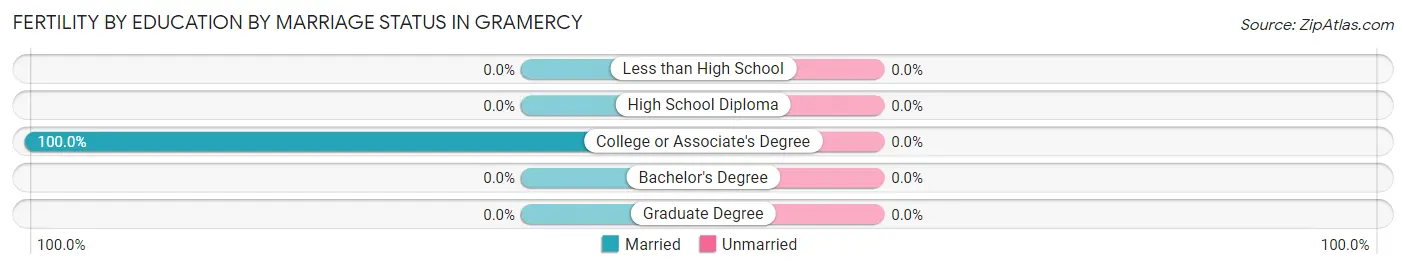
| Educational Attainment | Married | Unmarried |
| Less than High School | 0 (0.0%) | 0 (0.0%) |
| High School Diploma | 0 (0.0%) | 0 (0.0%) |
| College or Associate's Degree | 10 (100.0%) | 0 (0.0%) |
| Bachelor's Degree | 0 (0.0%) | 0 (0.0%) |
| Graduate Degree | 0 (0.0%) | 0 (0.0%) |
| Total | 10 (100.0%) | 0 (0.0%) |
Employment Characteristics in Gramercy
Employment by Class of Employer in Gramercy
Among the 1,550 employed individuals in Gramercy, private company employees (1,208 | 77.9%), local government employees (93 | 6.0%), and self-employed (incorporated) (90 | 5.8%) make up the most common classes of employment.
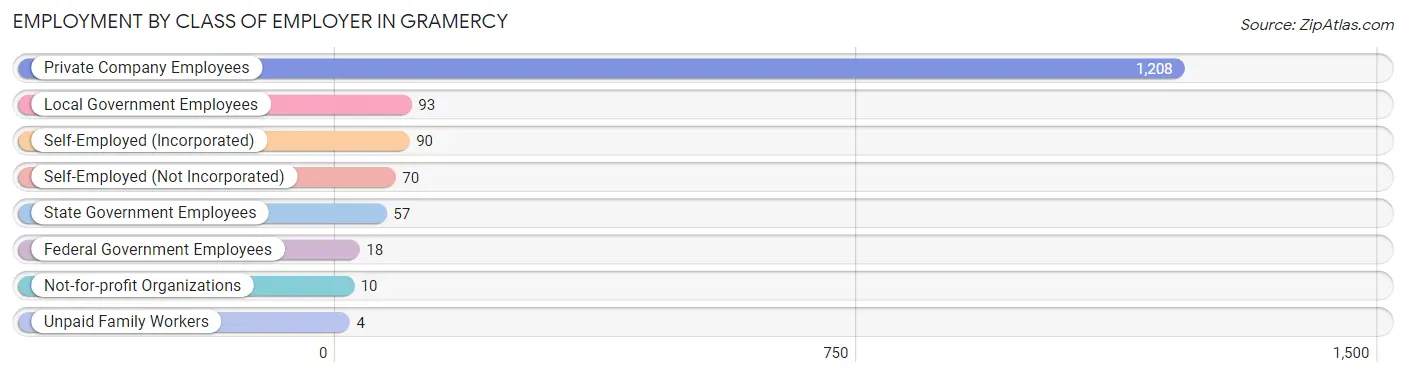
| Employer Class | # Employees | % Employees |
| Private Company Employees | 1,208 | 77.9% |
| Self-Employed (Incorporated) | 90 | 5.8% |
| Self-Employed (Not Incorporated) | 70 | 4.5% |
| Not-for-profit Organizations | 10 | 0.6% |
| Local Government Employees | 93 | 6.0% |
| State Government Employees | 57 | 3.7% |
| Federal Government Employees | 18 | 1.2% |
| Unpaid Family Workers | 4 | 0.3% |
| Total | 1,550 | 100.0% |
Employment Status by Age in Gramercy
According to the labor force statistics for Gramercy, out of the total population over 16 years of age (2,377), 68.2% or 1,621 individuals are in the labor force, with 4.4% or 71 of them unemployed. The age group with the highest labor force participation rate is 25 to 29 years, with 100.0% or 130 individuals in the labor force. Within the labor force, the 25 to 29 years age range has the highest percentage of unemployed individuals, with 25.4% or 33 of them being unemployed.
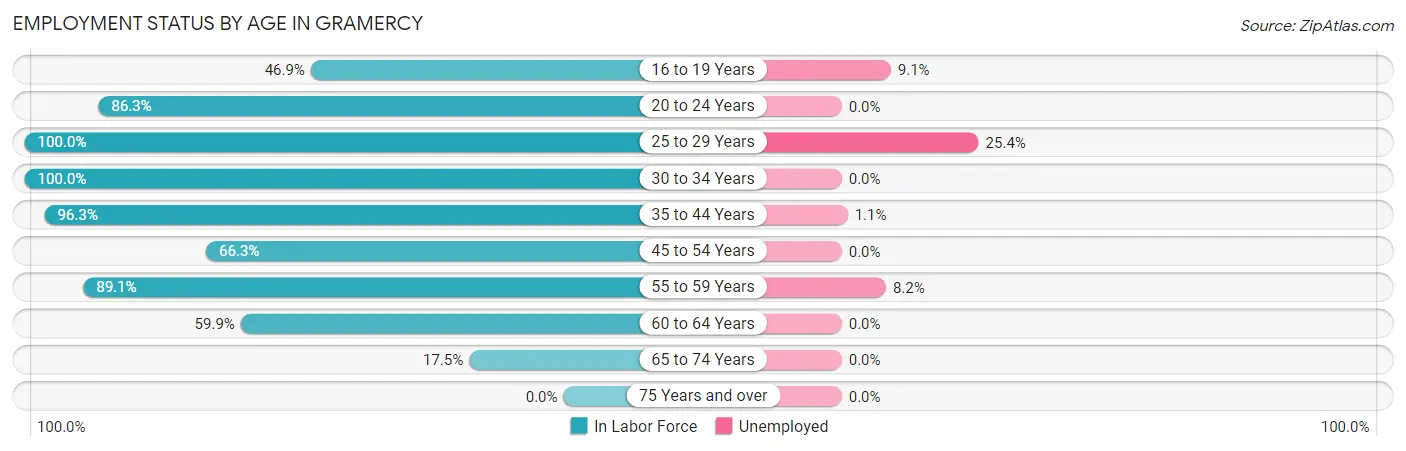
| Age Bracket | In Labor Force | Unemployed |
| 16 to 19 Years | 121 (46.9%) | 11 (9.1%) |
| 20 to 24 Years | 170 (86.3%) | 0 (0.0%) |
| 25 to 29 Years | 130 (100.0%) | 33 (25.4%) |
| 30 to 34 Years | 120 (100.0%) | 0 (0.0%) |
| 35 to 44 Years | 447 (96.3%) | 5 (1.1%) |
| 45 to 54 Years | 226 (66.3%) | 0 (0.0%) |
| 55 to 59 Years | 269 (89.1%) | 22 (8.2%) |
| 60 to 64 Years | 103 (59.9%) | 0 (0.0%) |
| 65 to 74 Years | 35 (17.5%) | 0 (0.0%) |
| 75 Years and over | 0 (0.0%) | 0 (0.0%) |
| Total | 1,621 (68.2%) | 71 (4.4%) |
Employment Status by Educational Attainment in Gramercy
According to labor force statistics for Gramercy, 84.7% of individuals (1,295) out of the total population between 25 and 64 years of age (1,529) are in the labor force, with 4.6% or 60 of them being unemployed. The group with the highest labor force participation rate are those with the educational attainment of college / associate degree, with 89.4% or 626 individuals in the labor force. Within the labor force, individuals with high school diploma education have the highest percentage of unemployment, with 7.5% or 35 of them being unemployed.
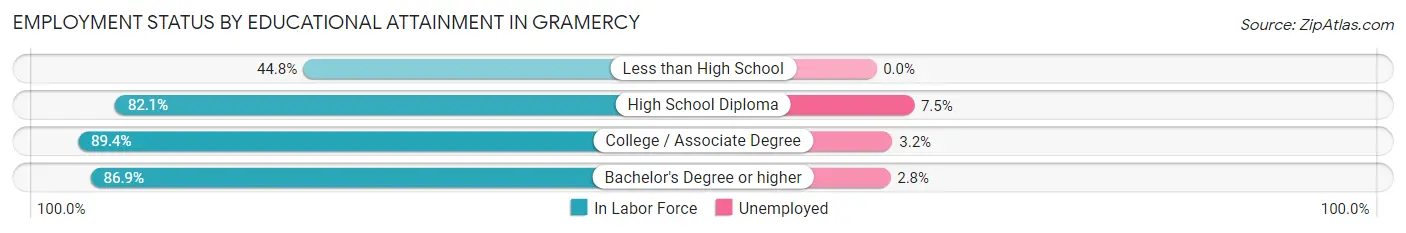
| Educational Attainment | In Labor Force | Unemployed |
| Less than High School | 26 (44.8%) | 0 (0.0%) |
| High School Diploma | 464 (82.1%) | 42 (7.5%) |
| College / Associate Degree | 626 (89.4%) | 22 (3.2%) |
| Bachelor's Degree or higher | 179 (86.9%) | 6 (2.8%) |
| Total | 1,295 (84.7%) | 70 (4.6%) |
Employment Occupations by Sex in Gramercy
Management, Business, Science and Arts Occupations
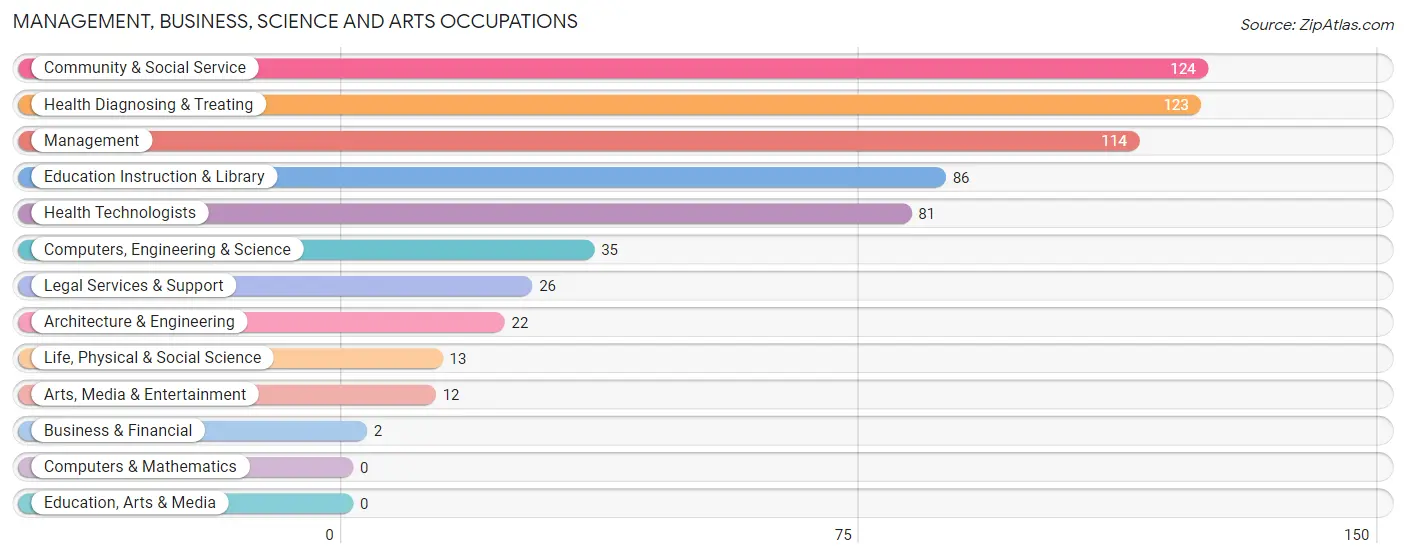
The most common Management, Business, Science and Arts occupations in Gramercy are Community & Social Service (124 | 8.0%), Health Diagnosing & Treating (123 | 7.9%), Management (114 | 7.3%), Education Instruction & Library (86 | 5.6%), and Health Technologists (81 | 5.2%).
Management, Business, Science and Arts Occupations by Sex
Within the Management, Business, Science and Arts occupations in Gramercy, the most male-oriented occupations are Architecture & Engineering (100.0%), Arts, Media & Entertainment (100.0%), and Computers, Engineering & Science (62.9%), while the most female-oriented occupations are Business & Financial (100.0%), Life, Physical & Social Science (100.0%), and Legal Services & Support (100.0%).
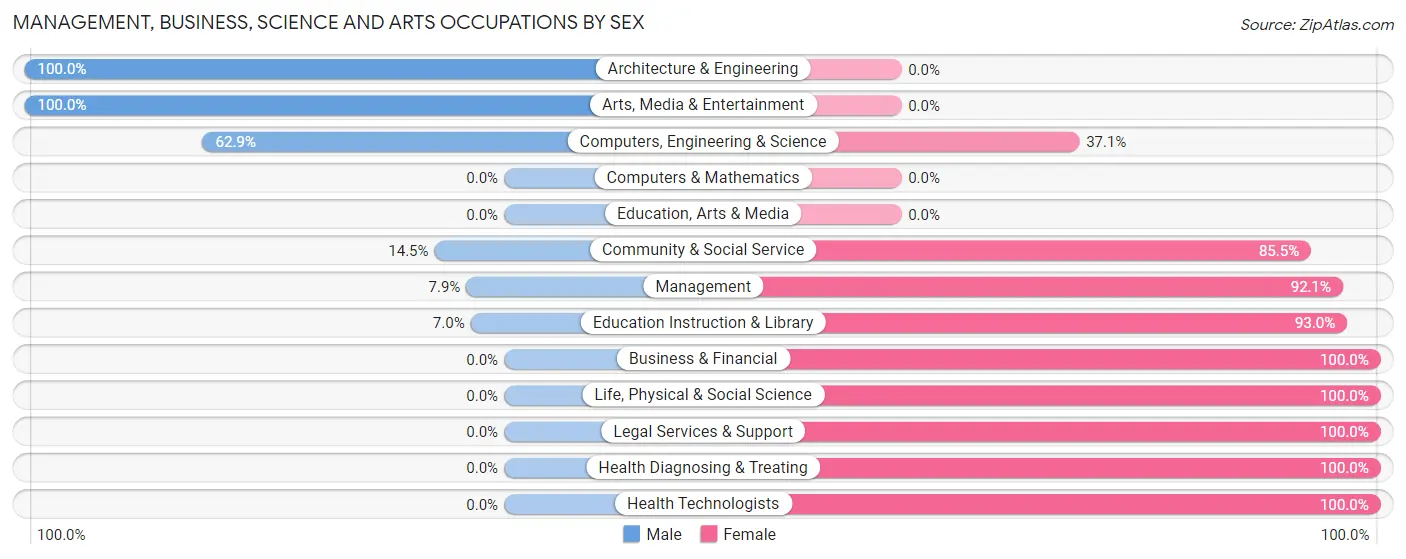
| Occupation | Male | Female |
| Management | 9 (7.9%) | 105 (92.1%) |
| Business & Financial | 0 (0.0%) | 2 (100.0%) |
| Computers, Engineering & Science | 22 (62.9%) | 13 (37.1%) |
| Computers & Mathematics | 0 (0.0%) | 0 (0.0%) |
| Architecture & Engineering | 22 (100.0%) | 0 (0.0%) |
| Life, Physical & Social Science | 0 (0.0%) | 13 (100.0%) |
| Community & Social Service | 18 (14.5%) | 106 (85.5%) |
| Education, Arts & Media | 0 (0.0%) | 0 (0.0%) |
| Legal Services & Support | 0 (0.0%) | 26 (100.0%) |
| Education Instruction & Library | 6 (7.0%) | 80 (93.0%) |
| Arts, Media & Entertainment | 12 (100.0%) | 0 (0.0%) |
| Health Diagnosing & Treating | 0 (0.0%) | 123 (100.0%) |
| Health Technologists | 0 (0.0%) | 81 (100.0%) |
| Total (Category) | 49 (12.3%) | 349 (87.7%) |
| Total (Overall) | 769 (49.6%) | 781 (50.4%) |
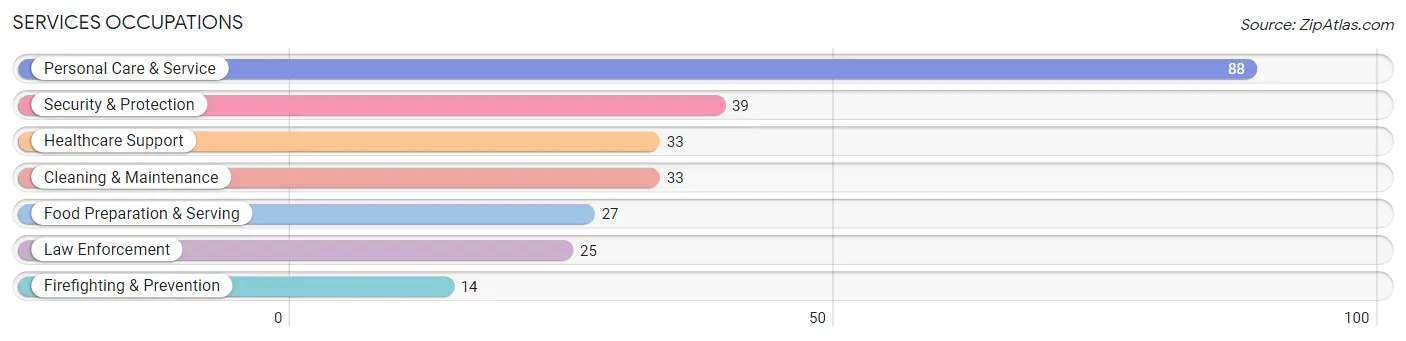
Services Occupations
The most common Services occupations in Gramercy are Personal Care & Service (88 | 5.7%), Security & Protection (39 | 2.5%), Healthcare Support (33 | 2.1%), Cleaning & Maintenance (33 | 2.1%), and Food Preparation & Serving (27 | 1.7%).
Services Occupations by Sex
Within the Services occupations in Gramercy, the most male-oriented occupations are Food Preparation & Serving (100.0%), Cleaning & Maintenance (100.0%), and Personal Care & Service (39.8%), while the most female-oriented occupations are Healthcare Support (100.0%), Security & Protection (100.0%), and Firefighting & Prevention (100.0%).
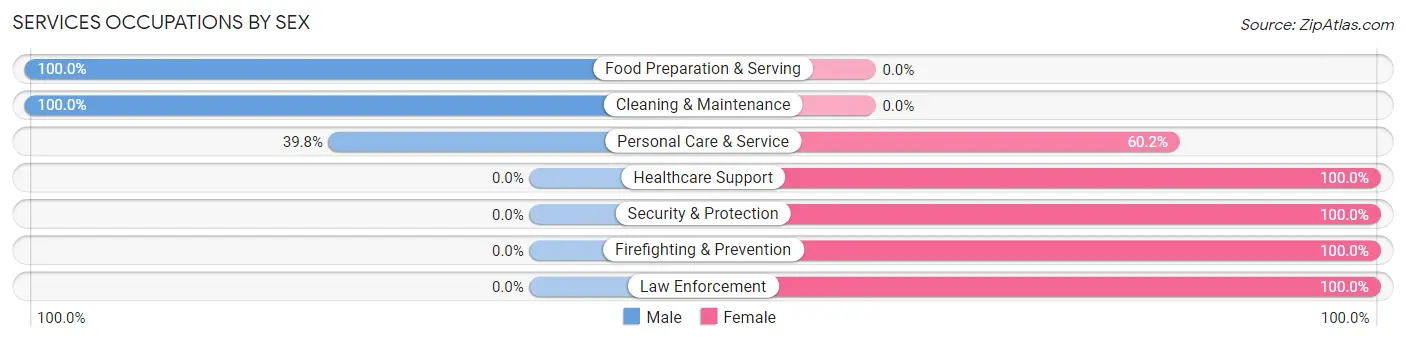
| Occupation | Male | Female |
| Healthcare Support | 0 (0.0%) | 33 (100.0%) |
| Security & Protection | 0 (0.0%) | 39 (100.0%) |
| Firefighting & Prevention | 0 (0.0%) | 14 (100.0%) |
| Law Enforcement | 0 (0.0%) | 25 (100.0%) |
| Food Preparation & Serving | 27 (100.0%) | 0 (0.0%) |
| Cleaning & Maintenance | 33 (100.0%) | 0 (0.0%) |
| Personal Care & Service | 35 (39.8%) | 53 (60.2%) |
| Total (Category) | 95 (43.2%) | 125 (56.8%) |
| Total (Overall) | 769 (49.6%) | 781 (50.4%) |
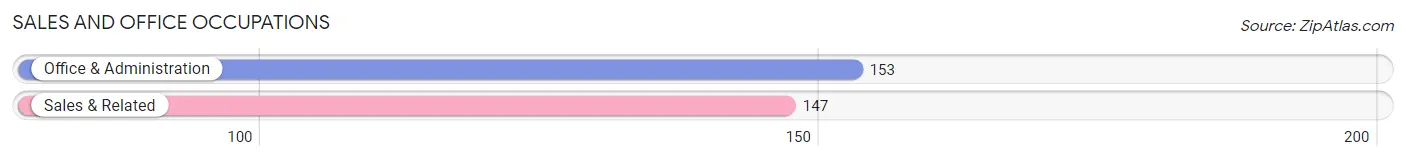
Sales and Office Occupations
The most common Sales and Office occupations in Gramercy are Office & Administration (153 | 9.9%), and Sales & Related (147 | 9.5%).
Sales and Office Occupations by Sex
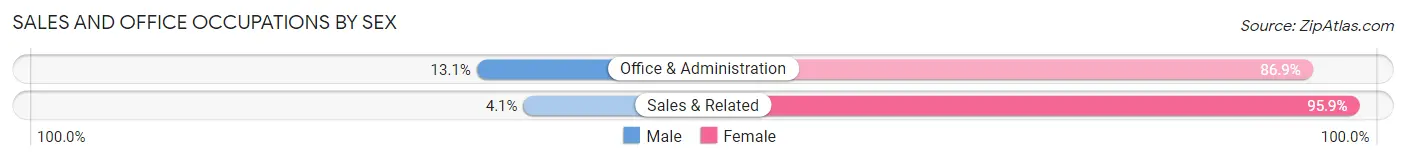
| Occupation | Male | Female |
| Sales & Related | 6 (4.1%) | 141 (95.9%) |
| Office & Administration | 20 (13.1%) | 133 (86.9%) |
| Total (Category) | 26 (8.7%) | 274 (91.3%) |
| Total (Overall) | 769 (49.6%) | 781 (50.4%) |
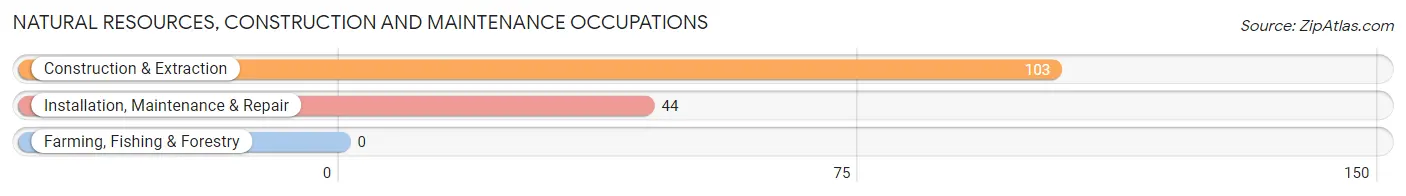
Natural Resources, Construction and Maintenance Occupations
The most common Natural Resources, Construction and Maintenance occupations in Gramercy are Construction & Extraction (103 | 6.7%), and Installation, Maintenance & Repair (44 | 2.8%).
Natural Resources, Construction and Maintenance Occupations by Sex
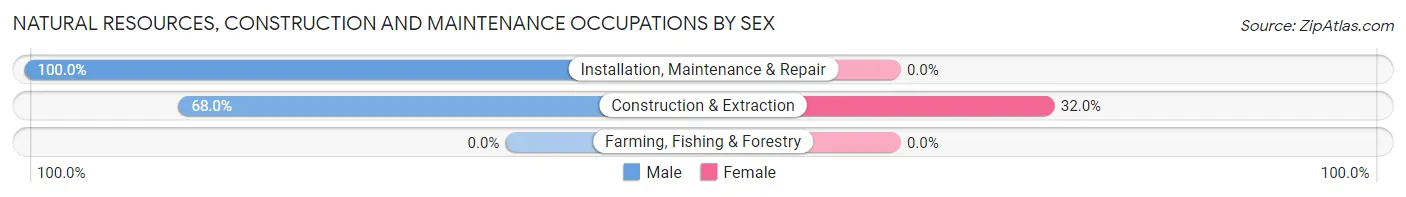
| Occupation | Male | Female |
| Farming, Fishing & Forestry | 0 (0.0%) | 0 (0.0%) |
| Construction & Extraction | 70 (68.0%) | 33 (32.0%) |
| Installation, Maintenance & Repair | 44 (100.0%) | 0 (0.0%) |
| Total (Category) | 114 (77.5%) | 33 (22.5%) |
| Total (Overall) | 769 (49.6%) | 781 (50.4%) |
Production, Transportation and Moving Occupations
The most common Production, Transportation and Moving occupations in Gramercy are Material Moving (182 | 11.7%), Production (180 | 11.6%), and Transportation (123 | 7.9%).

Production, Transportation and Moving Occupations by Sex
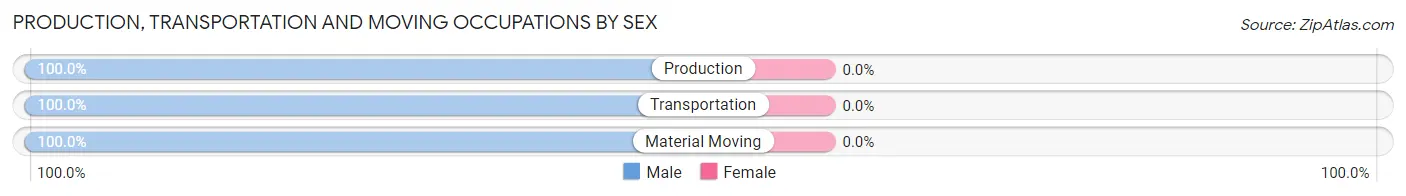
| Occupation | Male | Female |
| Production | 180 (100.0%) | 0 (0.0%) |
| Transportation | 123 (100.0%) | 0 (0.0%) |
| Material Moving | 182 (100.0%) | 0 (0.0%) |
| Total (Category) | 485 (100.0%) | 0 (0.0%) |
| Total (Overall) | 769 (49.6%) | 781 (50.4%) |
Employment Industries by Sex in Gramercy
Employment Industries in Gramercy
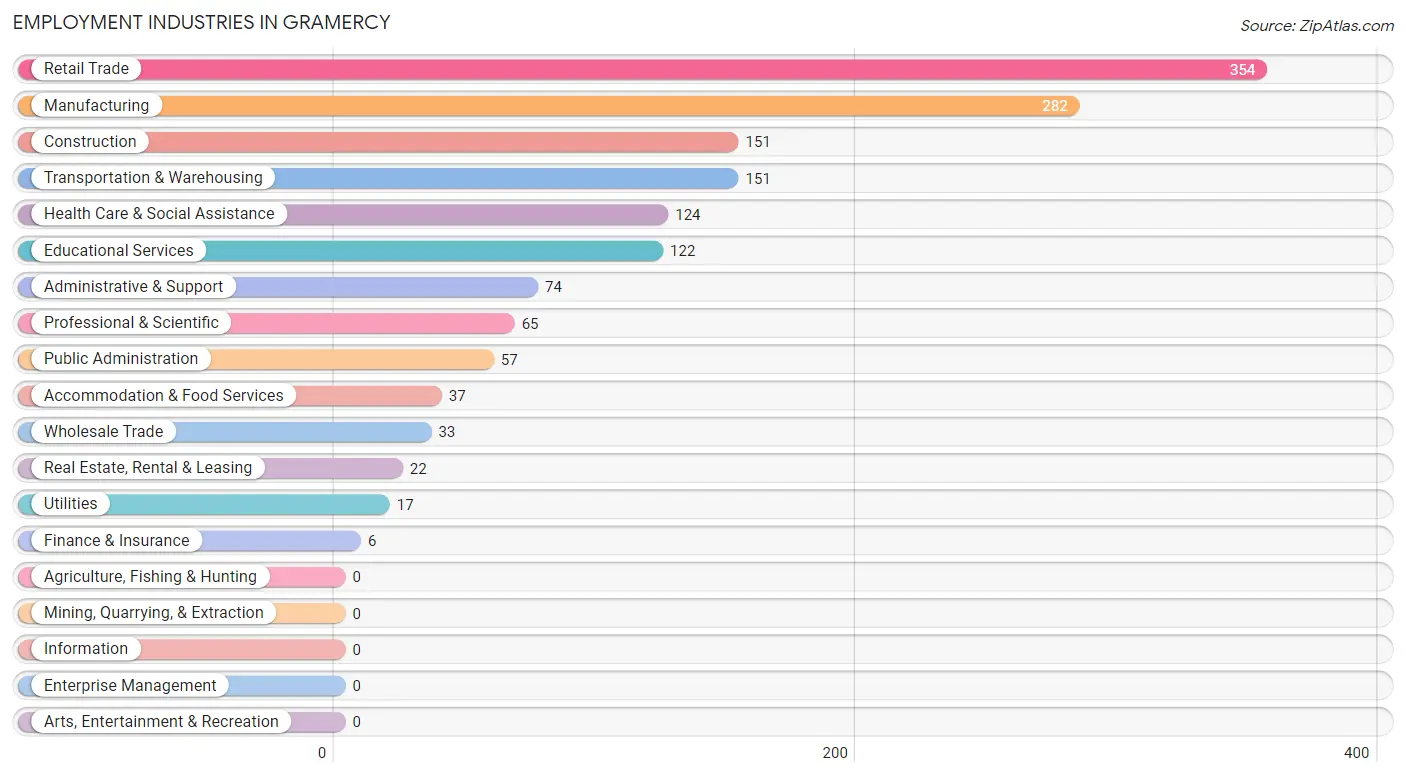
The major employment industries in Gramercy include Retail Trade (354 | 22.8%), Manufacturing (282 | 18.2%), Construction (151 | 9.7%), Transportation & Warehousing (151 | 9.7%), and Health Care & Social Assistance (124 | 8.0%).
Employment Industries by Sex in Gramercy
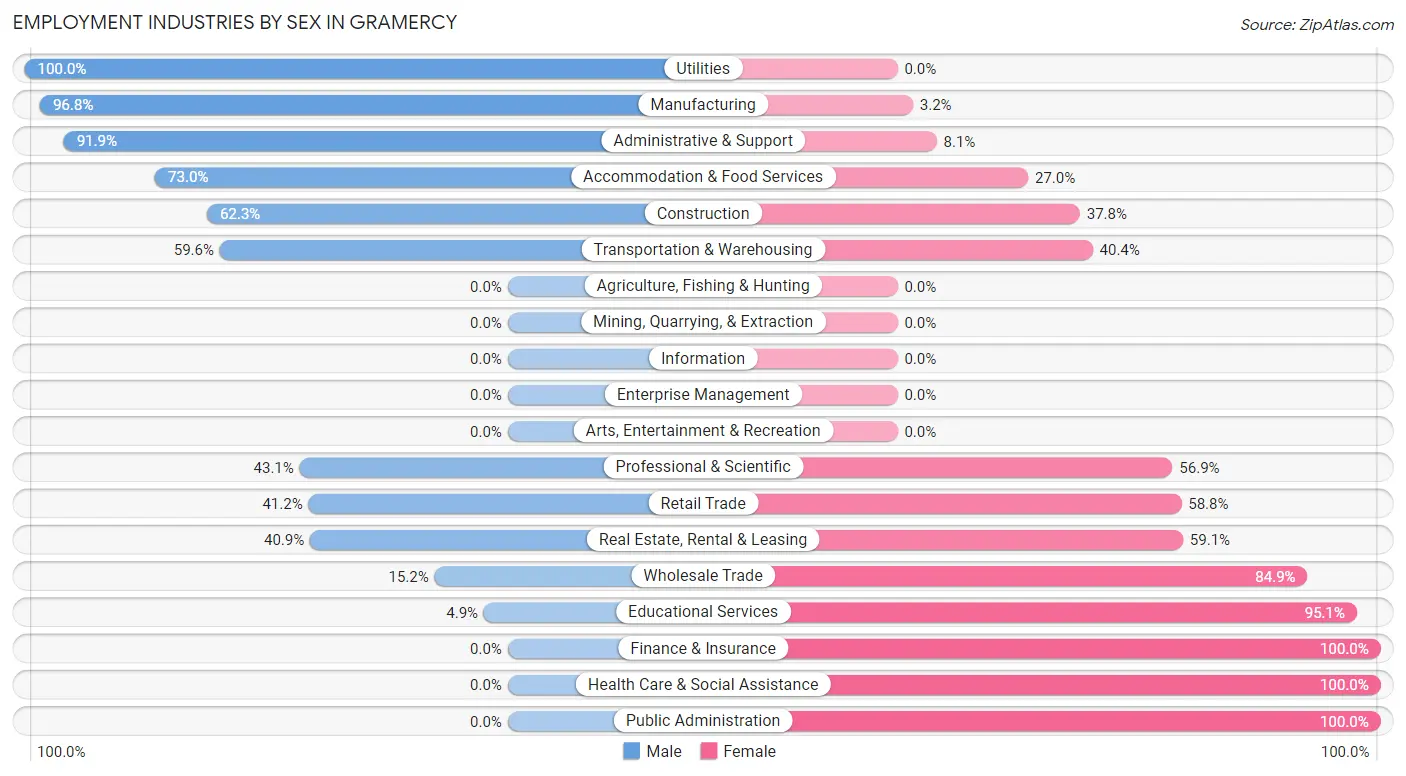
The Gramercy industries that see more men than women are Utilities (100.0%), Manufacturing (96.8%), and Administrative & Support (91.9%), whereas the industries that tend to have a higher number of women are Finance & Insurance (100.0%), Health Care & Social Assistance (100.0%), and Public Administration (100.0%).
| Industry | Male | Female |
| Agriculture, Fishing & Hunting | 0 (0.0%) | 0 (0.0%) |
| Mining, Quarrying, & Extraction | 0 (0.0%) | 0 (0.0%) |
| Construction | 94 (62.3%) | 57 (37.8%) |
| Manufacturing | 273 (96.8%) | 9 (3.2%) |
| Wholesale Trade | 5 (15.1%) | 28 (84.9%) |
| Retail Trade | 146 (41.2%) | 208 (58.8%) |
| Transportation & Warehousing | 90 (59.6%) | 61 (40.4%) |
| Utilities | 17 (100.0%) | 0 (0.0%) |
| Information | 0 (0.0%) | 0 (0.0%) |
| Finance & Insurance | 0 (0.0%) | 6 (100.0%) |
| Real Estate, Rental & Leasing | 9 (40.9%) | 13 (59.1%) |
| Professional & Scientific | 28 (43.1%) | 37 (56.9%) |
| Enterprise Management | 0 (0.0%) | 0 (0.0%) |
| Administrative & Support | 68 (91.9%) | 6 (8.1%) |
| Educational Services | 6 (4.9%) | 116 (95.1%) |
| Health Care & Social Assistance | 0 (0.0%) | 124 (100.0%) |
| Arts, Entertainment & Recreation | 0 (0.0%) | 0 (0.0%) |
| Accommodation & Food Services | 27 (73.0%) | 10 (27.0%) |
| Public Administration | 0 (0.0%) | 57 (100.0%) |
| Total | 769 (49.6%) | 781 (50.4%) |
Education in Gramercy
School Enrollment in Gramercy
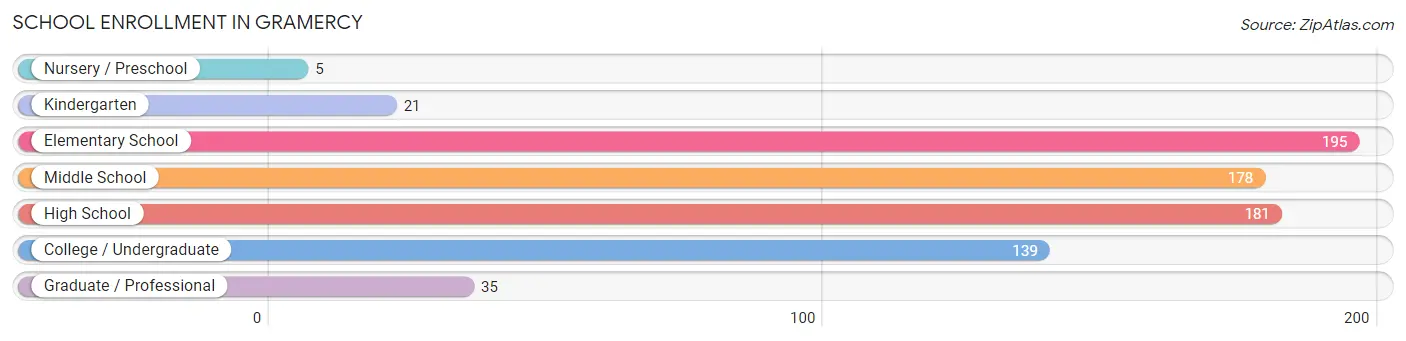
The most common levels of schooling among the 754 students in Gramercy are elementary school (195 | 25.9%), high school (181 | 24.0%), and middle school (178 | 23.6%).
| School Level | # Students | % Students |
| Nursery / Preschool | 5 | 0.7% |
| Kindergarten | 21 | 2.8% |
| Elementary School | 195 | 25.9% |
| Middle School | 178 | 23.6% |
| High School | 181 | 24.0% |
| College / Undergraduate | 139 | 18.4% |
| Graduate / Professional | 35 | 4.6% |
| Total | 754 | 100.0% |
School Enrollment by Age by Funding Source in Gramercy
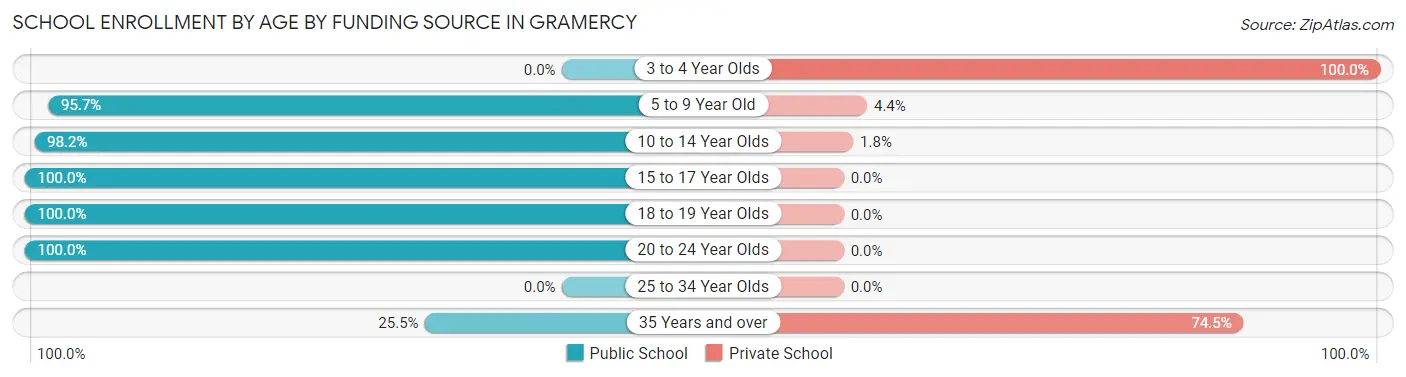
Out of a total of 754 students who are enrolled in schools in Gramercy, 52 (6.9%) attend a private institution, while the remaining 702 (93.1%) are enrolled in public schools. The age group of 3 to 4 year olds has the highest likelihood of being enrolled in private schools, with 5 (100.0% in the age bracket) enrolled. Conversely, the age group of 15 to 17 year olds has the lowest likelihood of being enrolled in a private school, with 165 (100.0% in the age bracket) attending a public institution.
| Age Bracket | Public School | Private School |
| 3 to 4 Year Olds | 0 (0.0%) | 5 (100.0%) |
| 5 to 9 Year Old | 176 (95.7%) | 8 (4.3%) |
| 10 to 14 Year Olds | 222 (98.2%) | 4 (1.8%) |
| 15 to 17 Year Olds | 165 (100.0%) | 0 (0.0%) |
| 18 to 19 Year Olds | 72 (100.0%) | 0 (0.0%) |
| 20 to 24 Year Olds | 55 (100.0%) | 0 (0.0%) |
| 25 to 34 Year Olds | 0 (0.0%) | 0 (0.0%) |
| 35 Years and over | 12 (25.5%) | 35 (74.5%) |
| Total | 702 (93.1%) | 52 (6.9%) |
Educational Attainment by Field of Study in Gramercy
Business (98 | 35.9%), liberal arts & history (52 | 19.1%), education (49 | 17.9%), arts & humanities (26 | 9.5%), and bio, nature & agricultural (20 | 7.3%) are the most common fields of study among 273 individuals in Gramercy who have obtained a bachelor's degree or higher.
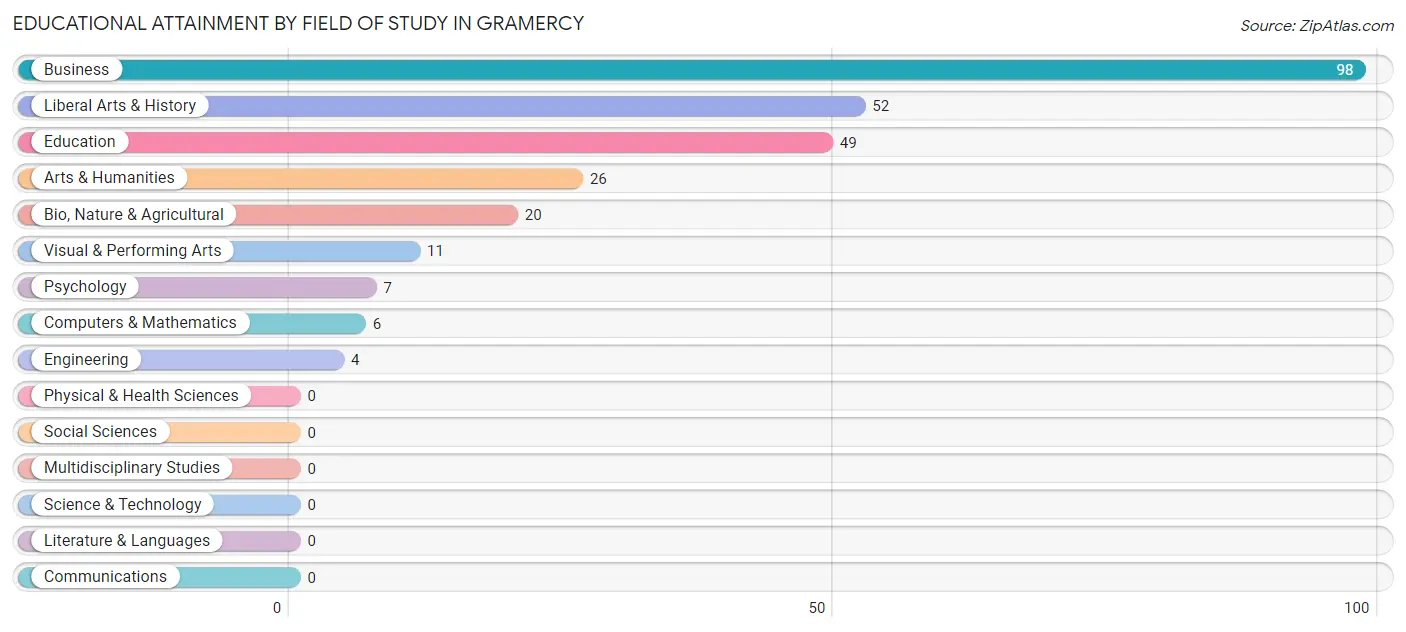
| Field of Study | # Graduates | % Graduates |
| Computers & Mathematics | 6 | 2.2% |
| Bio, Nature & Agricultural | 20 | 7.3% |
| Physical & Health Sciences | 0 | 0.0% |
| Psychology | 7 | 2.6% |
| Social Sciences | 0 | 0.0% |
| Engineering | 4 | 1.5% |
| Multidisciplinary Studies | 0 | 0.0% |
| Science & Technology | 0 | 0.0% |
| Business | 98 | 35.9% |
| Education | 49 | 17.9% |
| Literature & Languages | 0 | 0.0% |
| Liberal Arts & History | 52 | 19.1% |
| Visual & Performing Arts | 11 | 4.0% |
| Communications | 0 | 0.0% |
| Arts & Humanities | 26 | 9.5% |
| Total | 273 | 100.0% |
Transportation & Commute in Gramercy
Vehicle Availability by Sex in Gramercy
The most prevalent vehicle ownership categories in Gramercy are males with 2 vehicles (307, accounting for 39.9%) and females with 2 vehicles (396, making up 39.3%).
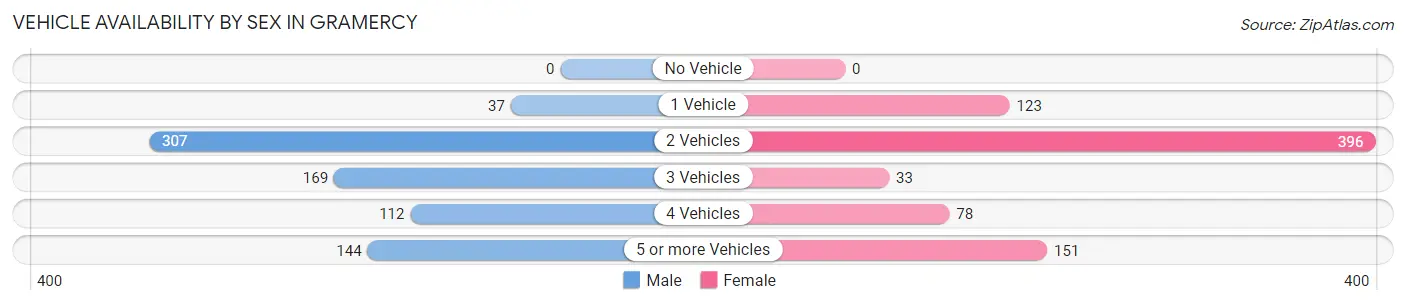
| Vehicles Available | Male | Female |
| No Vehicle | 0 (0.0%) | 0 (0.0%) |
| 1 Vehicle | 37 (4.8%) | 123 (15.8%) |
| 2 Vehicles | 307 (39.9%) | 396 (50.7%) |
| 3 Vehicles | 169 (22.0%) | 33 (4.2%) |
| 4 Vehicles | 112 (14.6%) | 78 (10.0%) |
| 5 or more Vehicles | 144 (18.7%) | 151 (19.3%) |
| Total | 769 (100.0%) | 781 (100.0%) |
Commute Time in Gramercy
The most frequently occuring commute durations in Gramercy are 20 to 24 minutes (280 commuters, 19.1%), 5 to 9 minutes (200 commuters, 13.6%), and 40 to 44 minutes (169 commuters, 11.5%).
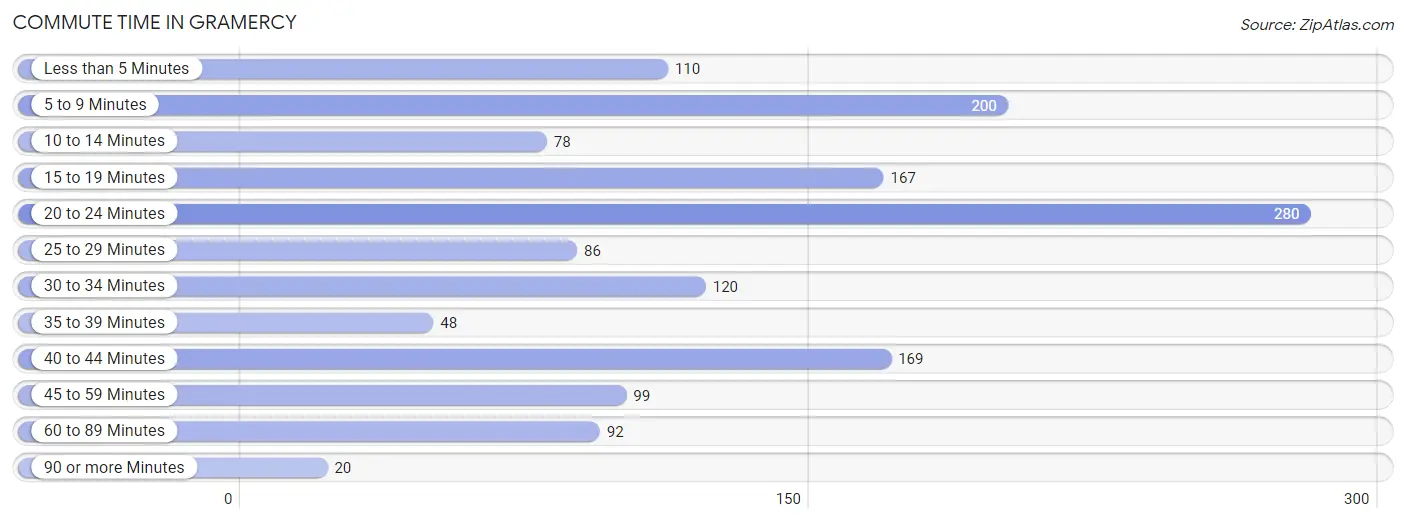
| Commute Time | # Commuters | % Commuters |
| Less than 5 Minutes | 110 | 7.5% |
| 5 to 9 Minutes | 200 | 13.6% |
| 10 to 14 Minutes | 78 | 5.3% |
| 15 to 19 Minutes | 167 | 11.4% |
| 20 to 24 Minutes | 280 | 19.1% |
| 25 to 29 Minutes | 86 | 5.9% |
| 30 to 34 Minutes | 120 | 8.2% |
| 35 to 39 Minutes | 48 | 3.3% |
| 40 to 44 Minutes | 169 | 11.5% |
| 45 to 59 Minutes | 99 | 6.7% |
| 60 to 89 Minutes | 92 | 6.3% |
| 90 or more Minutes | 20 | 1.4% |
Commute Time by Sex in Gramercy
The most common commute times in Gramercy are 20 to 24 minutes (181 commuters, 25.1%) for males and 5 to 9 minutes (130 commuters, 17.4%) for females.
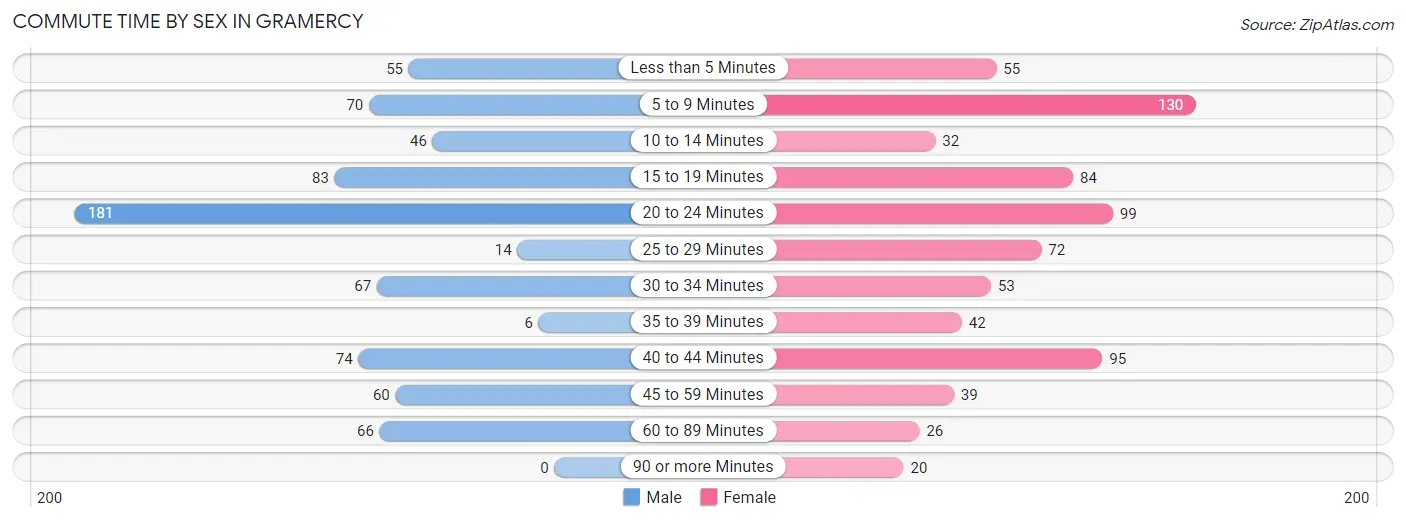
| Commute Time | Male | Female |
| Less than 5 Minutes | 55 (7.6%) | 55 (7.4%) |
| 5 to 9 Minutes | 70 (9.7%) | 130 (17.4%) |
| 10 to 14 Minutes | 46 (6.4%) | 32 (4.3%) |
| 15 to 19 Minutes | 83 (11.5%) | 84 (11.2%) |
| 20 to 24 Minutes | 181 (25.1%) | 99 (13.3%) |
| 25 to 29 Minutes | 14 (1.9%) | 72 (9.6%) |
| 30 to 34 Minutes | 67 (9.3%) | 53 (7.1%) |
| 35 to 39 Minutes | 6 (0.8%) | 42 (5.6%) |
| 40 to 44 Minutes | 74 (10.2%) | 95 (12.7%) |
| 45 to 59 Minutes | 60 (8.3%) | 39 (5.2%) |
| 60 to 89 Minutes | 66 (9.1%) | 26 (3.5%) |
| 90 or more Minutes | 0 (0.0%) | 20 (2.7%) |
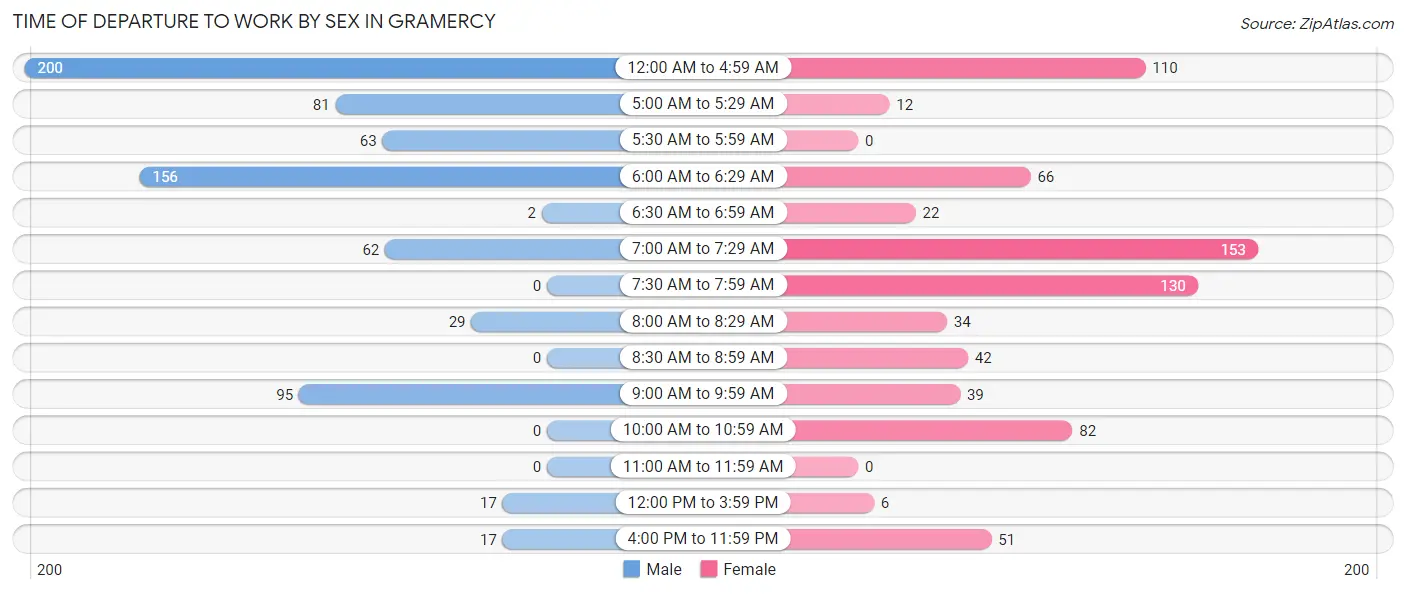
Time of Departure to Work by Sex in Gramercy
The most frequent times of departure to work in Gramercy are 12:00 AM to 4:59 AM (200, 27.7%) for males and 7:00 AM to 7:29 AM (153, 20.5%) for females.
| Time of Departure | Male | Female |
| 12:00 AM to 4:59 AM | 200 (27.7%) | 110 (14.7%) |
| 5:00 AM to 5:29 AM | 81 (11.2%) | 12 (1.6%) |
| 5:30 AM to 5:59 AM | 63 (8.7%) | 0 (0.0%) |
| 6:00 AM to 6:29 AM | 156 (21.6%) | 66 (8.8%) |
| 6:30 AM to 6:59 AM | 2 (0.3%) | 22 (2.9%) |
| 7:00 AM to 7:29 AM | 62 (8.6%) | 153 (20.5%) |
| 7:30 AM to 7:59 AM | 0 (0.0%) | 130 (17.4%) |
| 8:00 AM to 8:29 AM | 29 (4.0%) | 34 (4.5%) |
| 8:30 AM to 8:59 AM | 0 (0.0%) | 42 (5.6%) |
| 9:00 AM to 9:59 AM | 95 (13.2%) | 39 (5.2%) |
| 10:00 AM to 10:59 AM | 0 (0.0%) | 82 (11.0%) |
| 11:00 AM to 11:59 AM | 0 (0.0%) | 0 (0.0%) |
| 12:00 PM to 3:59 PM | 17 (2.4%) | 6 (0.8%) |
| 4:00 PM to 11:59 PM | 17 (2.4%) | 51 (6.8%) |
| Total | 722 (100.0%) | 747 (100.0%) |
Housing Occupancy in Gramercy
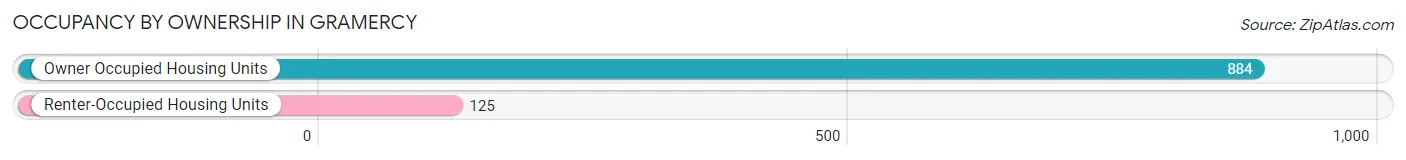
Occupancy by Ownership in Gramercy
Of the total 1,009 dwellings in Gramercy, owner-occupied units account for 884 (87.6%), while renter-occupied units make up 125 (12.4%).
| Occupancy | # Housing Units | % Housing Units |
| Owner Occupied Housing Units | 884 | 87.6% |
| Renter-Occupied Housing Units | 125 | 12.4% |
| Total Occupied Housing Units | 1,009 | 100.0% |
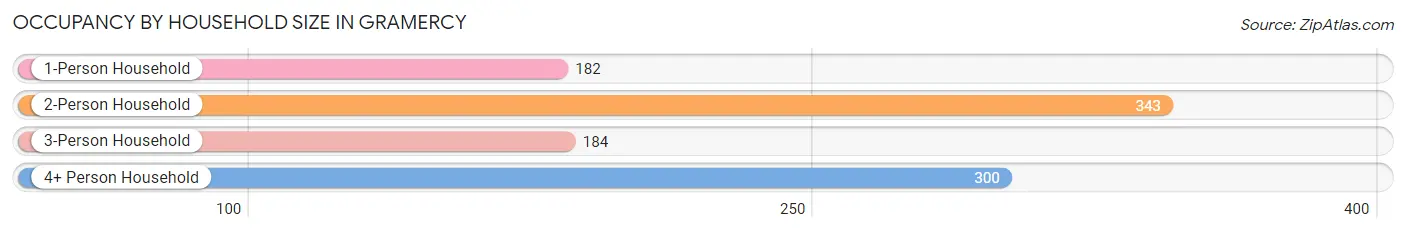
Occupancy by Household Size in Gramercy
| Household Size | # Housing Units | % Housing Units |
| 1-Person Household | 182 | 18.0% |
| 2-Person Household | 343 | 34.0% |
| 3-Person Household | 184 | 18.2% |
| 4+ Person Household | 300 | 29.7% |
| Total Housing Units | 1,009 | 100.0% |
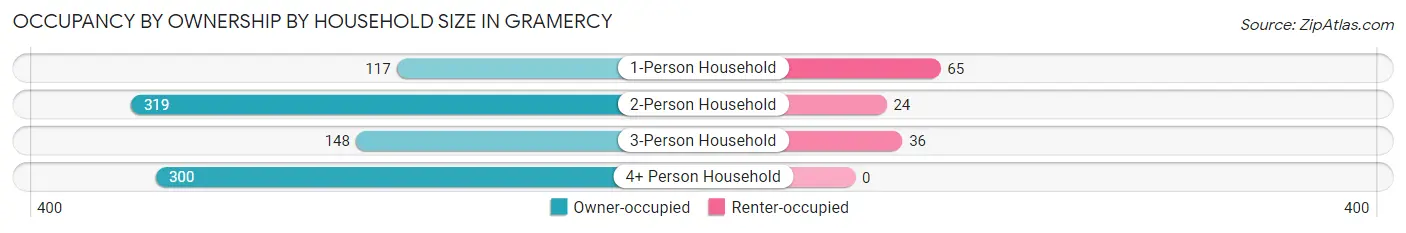
Occupancy by Ownership by Household Size in Gramercy
| Household Size | Owner-occupied | Renter-occupied |
| 1-Person Household | 117 (64.3%) | 65 (35.7%) |
| 2-Person Household | 319 (93.0%) | 24 (7.0%) |
| 3-Person Household | 148 (80.4%) | 36 (19.6%) |
| 4+ Person Household | 300 (100.0%) | 0 (0.0%) |
| Total Housing Units | 884 (87.6%) | 125 (12.4%) |
Occupancy by Educational Attainment in Gramercy
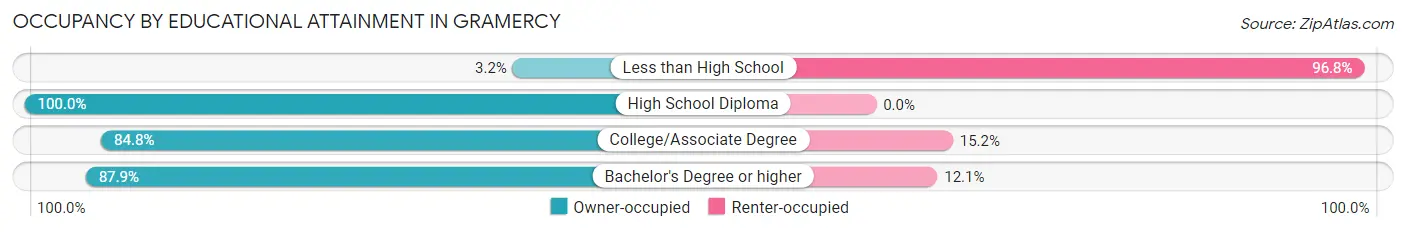
| Household Size | Owner-occupied | Renter-occupied |
| Less than High School | 1 (3.2%) | 30 (96.8%) |
| High School Diploma | 326 (100.0%) | 0 (0.0%) |
| College/Associate Degree | 441 (84.8%) | 79 (15.2%) |
| Bachelor's Degree or higher | 116 (87.9%) | 16 (12.1%) |
Occupancy by Age of Householder in Gramercy
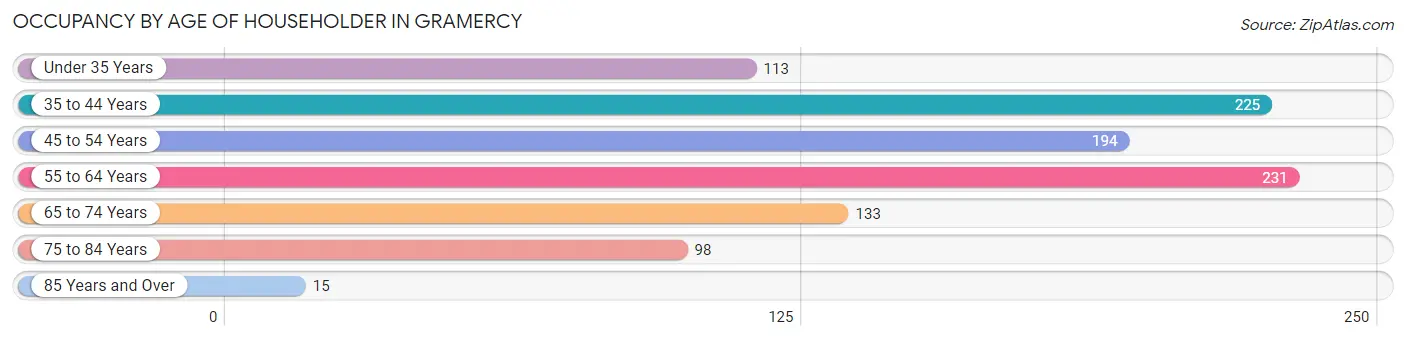
| Age Bracket | # Households | % Households |
| Under 35 Years | 113 | 11.2% |
| 35 to 44 Years | 225 | 22.3% |
| 45 to 54 Years | 194 | 19.2% |
| 55 to 64 Years | 231 | 22.9% |
| 65 to 74 Years | 133 | 13.2% |
| 75 to 84 Years | 98 | 9.7% |
| 85 Years and Over | 15 | 1.5% |
| Total | 1,009 | 100.0% |
Housing Finances in Gramercy
Median Income by Occupancy in Gramercy
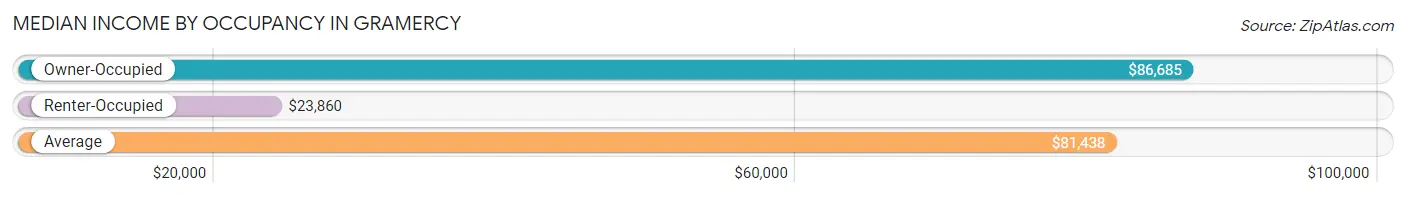
| Occupancy Type | # Households | Median Income |
| Owner-Occupied | 884 (87.6%) | $86,685 |
| Renter-Occupied | 125 (12.4%) | $23,860 |
| Average | 1,009 (100.0%) | $81,438 |
Occupancy by Householder Income Bracket in Gramercy
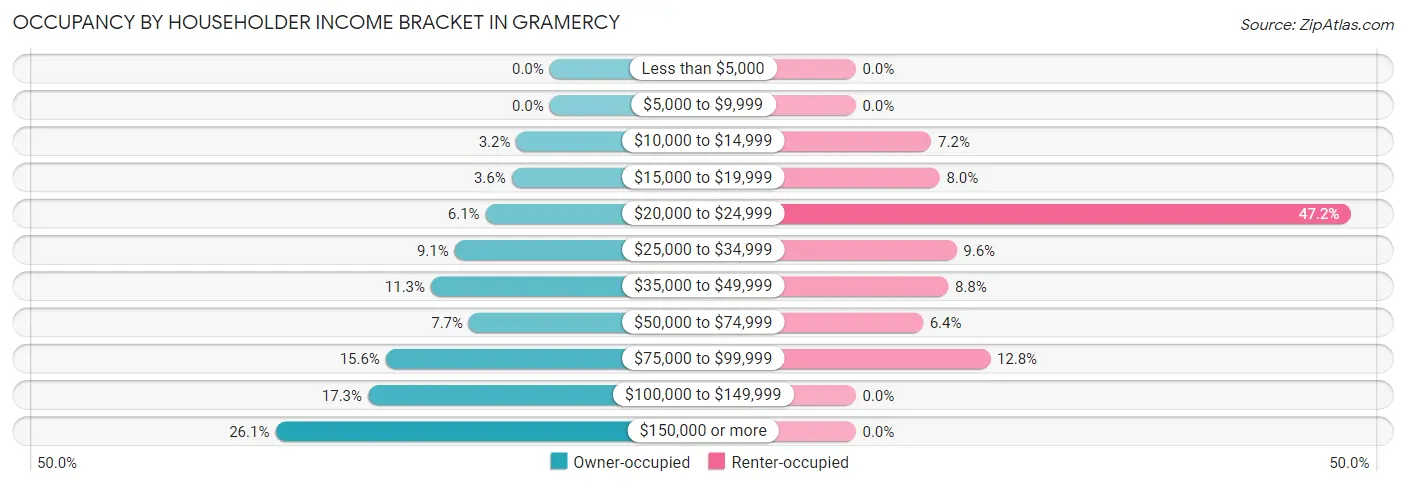
| Income Bracket | Owner-occupied | Renter-occupied |
| Less than $5,000 | 0 (0.0%) | 0 (0.0%) |
| $5,000 to $9,999 | 0 (0.0%) | 0 (0.0%) |
| $10,000 to $14,999 | 28 (3.2%) | 9 (7.2%) |
| $15,000 to $19,999 | 32 (3.6%) | 10 (8.0%) |
| $20,000 to $24,999 | 54 (6.1%) | 59 (47.2%) |
| $25,000 to $34,999 | 80 (9.0%) | 12 (9.6%) |
| $35,000 to $49,999 | 100 (11.3%) | 11 (8.8%) |
| $50,000 to $74,999 | 68 (7.7%) | 8 (6.4%) |
| $75,000 to $99,999 | 138 (15.6%) | 16 (12.8%) |
| $100,000 to $149,999 | 153 (17.3%) | 0 (0.0%) |
| $150,000 or more | 231 (26.1%) | 0 (0.0%) |
| Total | 884 (100.0%) | 125 (100.0%) |
Monthly Housing Cost Tiers in Gramercy
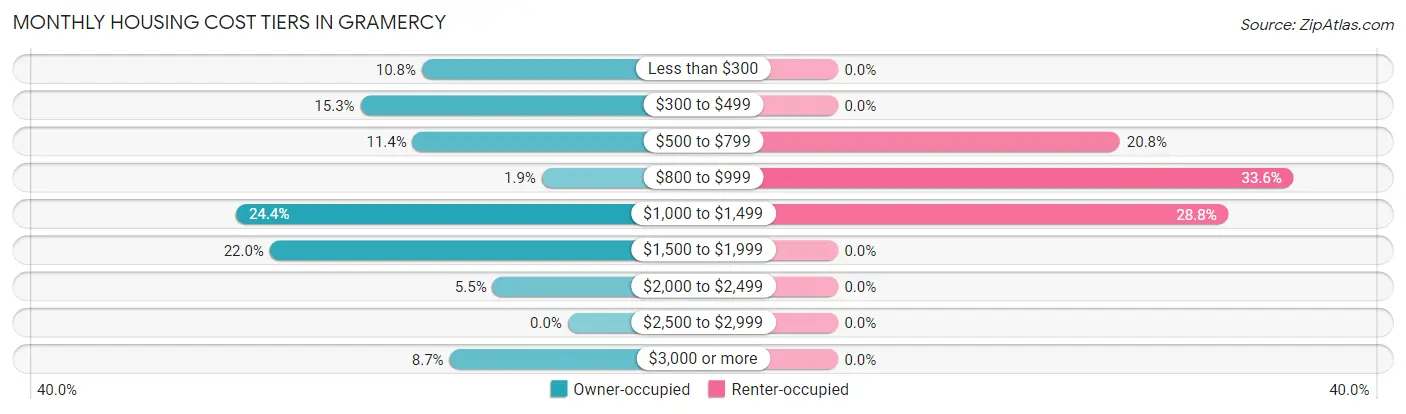
| Monthly Cost | Owner-occupied | Renter-occupied |
| Less than $300 | 95 (10.7%) | 0 (0.0%) |
| $300 to $499 | 135 (15.3%) | 0 (0.0%) |
| $500 to $799 | 101 (11.4%) | 26 (20.8%) |
| $800 to $999 | 17 (1.9%) | 42 (33.6%) |
| $1,000 to $1,499 | 216 (24.4%) | 36 (28.8%) |
| $1,500 to $1,999 | 194 (22.0%) | 0 (0.0%) |
| $2,000 to $2,499 | 49 (5.5%) | 0 (0.0%) |
| $2,500 to $2,999 | 0 (0.0%) | 0 (0.0%) |
| $3,000 or more | 77 (8.7%) | 0 (0.0%) |
| Total | 884 (100.0%) | 125 (100.0%) |
Physical Housing Characteristics in Gramercy
Housing Structures in Gramercy
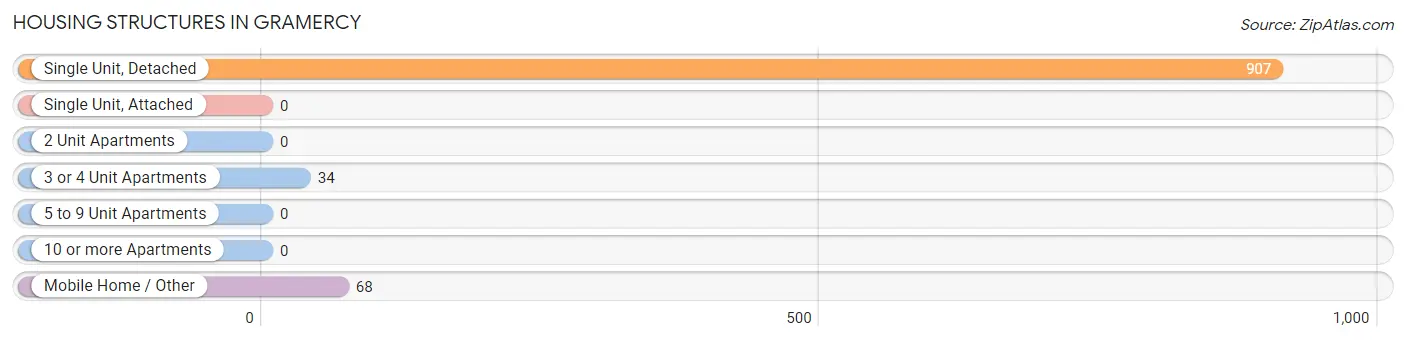
| Structure Type | # Housing Units | % Housing Units |
| Single Unit, Detached | 907 | 89.9% |
| Single Unit, Attached | 0 | 0.0% |
| 2 Unit Apartments | 0 | 0.0% |
| 3 or 4 Unit Apartments | 34 | 3.4% |
| 5 to 9 Unit Apartments | 0 | 0.0% |
| 10 or more Apartments | 0 | 0.0% |
| Mobile Home / Other | 68 | 6.7% |
| Total | 1,009 | 100.0% |
Housing Structures by Occupancy in Gramercy
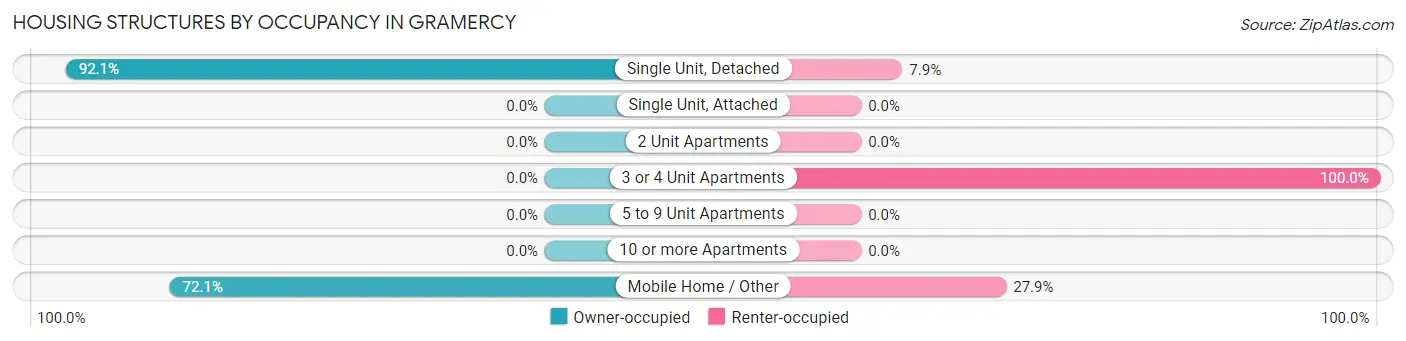
| Structure Type | Owner-occupied | Renter-occupied |
| Single Unit, Detached | 835 (92.1%) | 72 (7.9%) |
| Single Unit, Attached | 0 (0.0%) | 0 (0.0%) |
| 2 Unit Apartments | 0 (0.0%) | 0 (0.0%) |
| 3 or 4 Unit Apartments | 0 (0.0%) | 34 (100.0%) |
| 5 to 9 Unit Apartments | 0 (0.0%) | 0 (0.0%) |
| 10 or more Apartments | 0 (0.0%) | 0 (0.0%) |
| Mobile Home / Other | 49 (72.1%) | 19 (27.9%) |
| Total | 884 (87.6%) | 125 (12.4%) |
Housing Structures by Number of Rooms in Gramercy
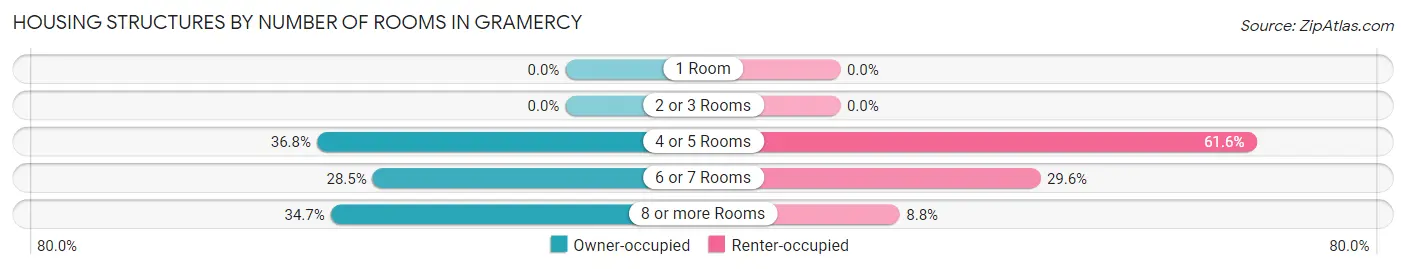
| Number of Rooms | Owner-occupied | Renter-occupied |
| 1 Room | 0 (0.0%) | 0 (0.0%) |
| 2 or 3 Rooms | 0 (0.0%) | 0 (0.0%) |
| 4 or 5 Rooms | 325 (36.8%) | 77 (61.6%) |
| 6 or 7 Rooms | 252 (28.5%) | 37 (29.6%) |
| 8 or more Rooms | 307 (34.7%) | 11 (8.8%) |
| Total | 884 (100.0%) | 125 (100.0%) |
Housing Structure by Heating Type in Gramercy
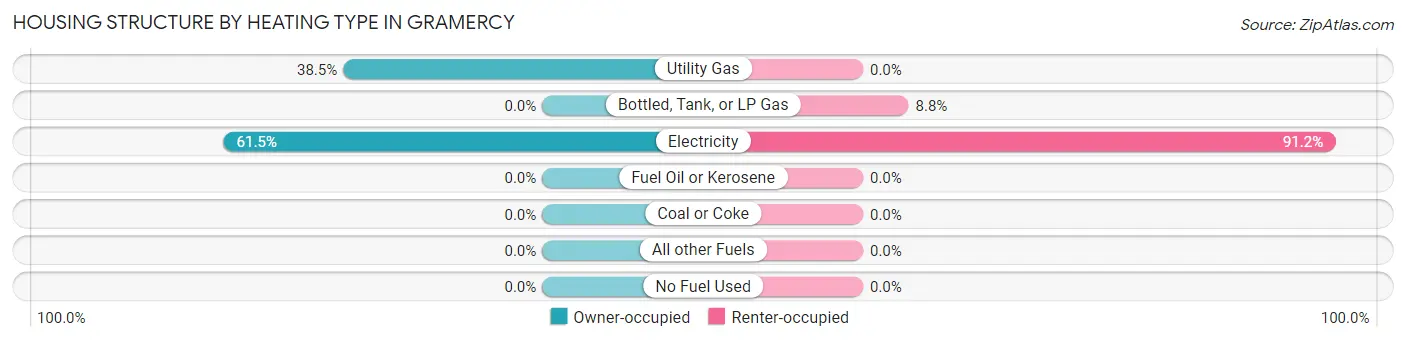
| Heating Type | Owner-occupied | Renter-occupied |
| Utility Gas | 340 (38.5%) | 0 (0.0%) |
| Bottled, Tank, or LP Gas | 0 (0.0%) | 11 (8.8%) |
| Electricity | 544 (61.5%) | 114 (91.2%) |
| Fuel Oil or Kerosene | 0 (0.0%) | 0 (0.0%) |
| Coal or Coke | 0 (0.0%) | 0 (0.0%) |
| All other Fuels | 0 (0.0%) | 0 (0.0%) |
| No Fuel Used | 0 (0.0%) | 0 (0.0%) |
| Total | 884 (100.0%) | 125 (100.0%) |
Household Vehicle Usage in Gramercy
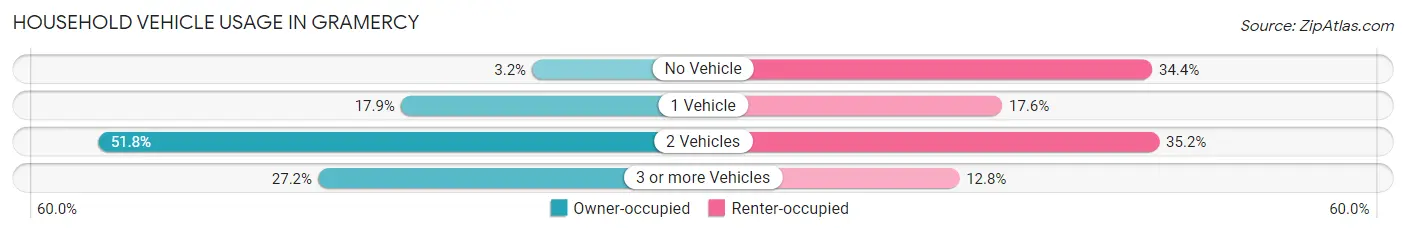
| Vehicles per Household | Owner-occupied | Renter-occupied |
| No Vehicle | 28 (3.2%) | 43 (34.4%) |
| 1 Vehicle | 158 (17.9%) | 22 (17.6%) |
| 2 Vehicles | 458 (51.8%) | 44 (35.2%) |
| 3 or more Vehicles | 240 (27.2%) | 16 (12.8%) |
| Total | 884 (100.0%) | 125 (100.0%) |
Real Estate & Mortgages in Gramercy
Real Estate and Mortgage Overview in Gramercy
| Characteristic | Without Mortgage | With Mortgage |
| Housing Units | 290 | 594 |
| Median Property Value | $171,400 | $223,000 |
| Median Household Income | $34,583 | $216 |
| Monthly Housing Costs | $404 | $77 |
| Real Estate Taxes | $516 | $70 |
Property Value by Mortgage Status in Gramercy
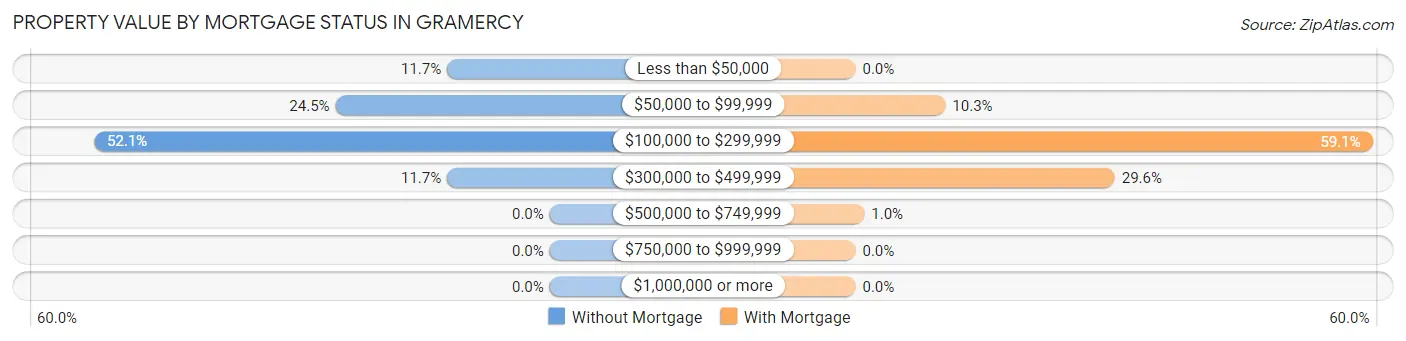
| Property Value | Without Mortgage | With Mortgage |
| Less than $50,000 | 34 (11.7%) | 0 (0.0%) |
| $50,000 to $99,999 | 71 (24.5%) | 61 (10.3%) |
| $100,000 to $299,999 | 151 (52.1%) | 351 (59.1%) |
| $300,000 to $499,999 | 34 (11.7%) | 176 (29.6%) |
| $500,000 to $749,999 | 0 (0.0%) | 6 (1.0%) |
| $750,000 to $999,999 | 0 (0.0%) | 0 (0.0%) |
| $1,000,000 or more | 0 (0.0%) | 0 (0.0%) |
| Total | 290 (100.0%) | 594 (100.0%) |
Household Income by Mortgage Status in Gramercy
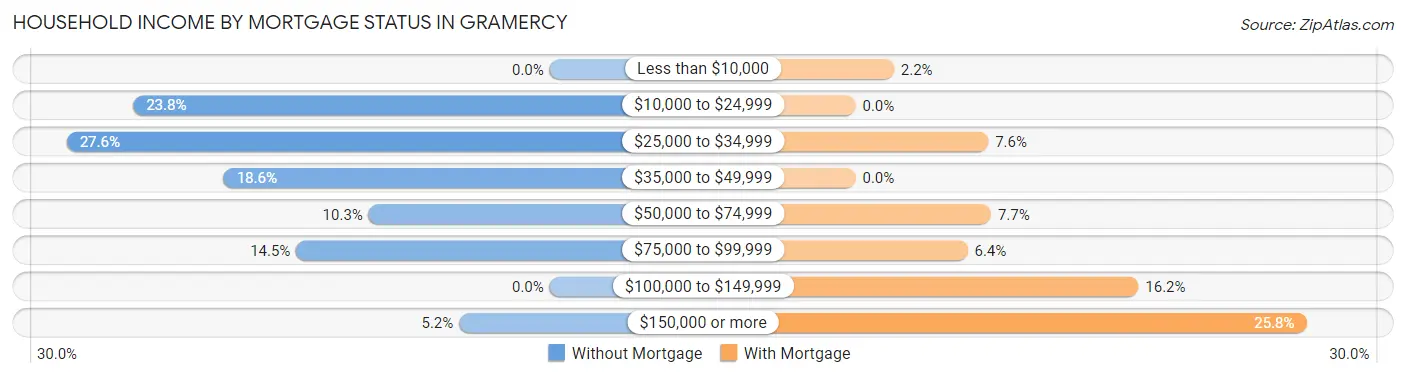
| Household Income | Without Mortgage | With Mortgage |
| Less than $10,000 | 0 (0.0%) | 13 (2.2%) |
| $10,000 to $24,999 | 69 (23.8%) | 0 (0.0%) |
| $25,000 to $34,999 | 80 (27.6%) | 45 (7.6%) |
| $35,000 to $49,999 | 54 (18.6%) | 0 (0.0%) |
| $50,000 to $74,999 | 30 (10.3%) | 46 (7.7%) |
| $75,000 to $99,999 | 42 (14.5%) | 38 (6.4%) |
| $100,000 to $149,999 | 0 (0.0%) | 96 (16.2%) |
| $150,000 or more | 15 (5.2%) | 153 (25.8%) |
| Total | 290 (100.0%) | 594 (100.0%) |
Property Value to Household Income Ratio in Gramercy
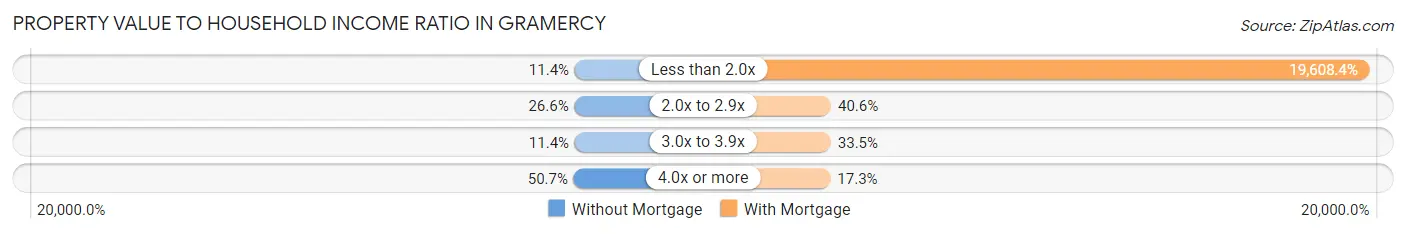
| Value-to-Income Ratio | Without Mortgage | With Mortgage |
| Less than 2.0x | 33 (11.4%) | 116,474 (19,608.4%) |
| 2.0x to 2.9x | 77 (26.6%) | 241 (40.6%) |
| 3.0x to 3.9x | 33 (11.4%) | 199 (33.5%) |
| 4.0x or more | 147 (50.7%) | 103 (17.3%) |
| Total | 290 (100.0%) | 594 (100.0%) |
Real Estate Taxes by Mortgage Status in Gramercy
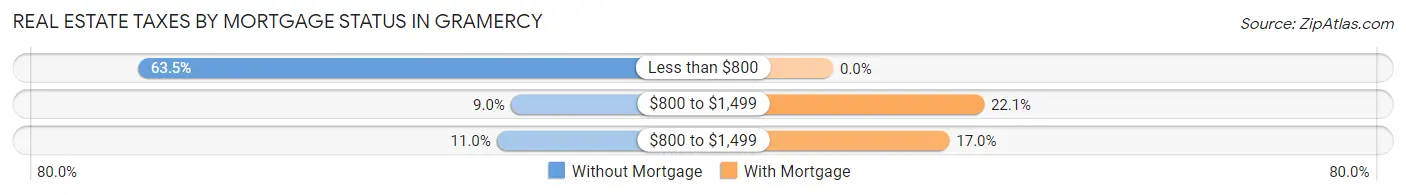
| Property Taxes | Without Mortgage | With Mortgage |
| Less than $800 | 184 (63.4%) | 0 (0.0%) |
| $800 to $1,499 | 26 (9.0%) | 131 (22.1%) |
| $800 to $1,499 | 32 (11.0%) | 101 (17.0%) |
| Total | 290 (100.0%) | 594 (100.0%) |
Health & Disability in Gramercy
Health Insurance Coverage by Age in Gramercy
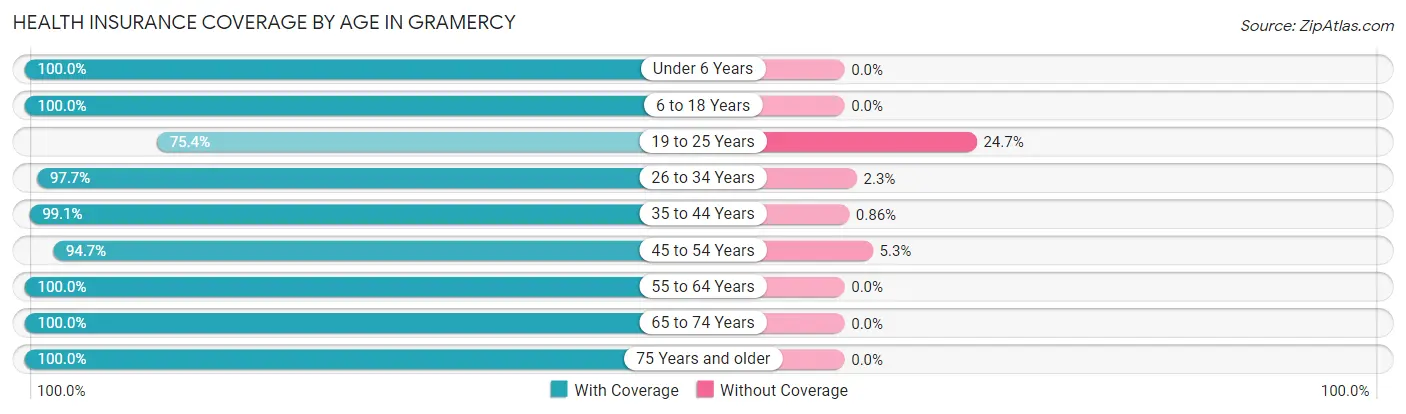
| Age Bracket | With Coverage | Without Coverage |
| Under 6 Years | 104 (100.0%) | 0 (0.0%) |
| 6 to 18 Years | 565 (100.0%) | 0 (0.0%) |
| 19 to 25 Years | 272 (75.3%) | 89 (24.6%) |
| 26 to 34 Years | 213 (97.7%) | 5 (2.3%) |
| 35 to 44 Years | 460 (99.1%) | 4 (0.9%) |
| 45 to 54 Years | 323 (94.7%) | 18 (5.3%) |
| 55 to 64 Years | 474 (100.0%) | 0 (0.0%) |
| 65 to 74 Years | 200 (100.0%) | 0 (0.0%) |
| 75 Years and older | 193 (100.0%) | 0 (0.0%) |
| Total | 2,804 (96.0%) | 116 (4.0%) |
Health Insurance Coverage by Citizenship Status in Gramercy
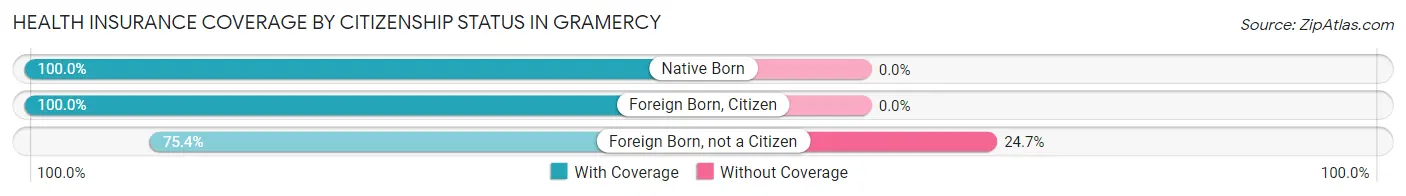
| Citizenship Status | With Coverage | Without Coverage |
| Native Born | 104 (100.0%) | 0 (0.0%) |
| Foreign Born, Citizen | 565 (100.0%) | 0 (0.0%) |
| Foreign Born, not a Citizen | 272 (75.3%) | 89 (24.6%) |
Health Insurance Coverage by Household Income in Gramercy
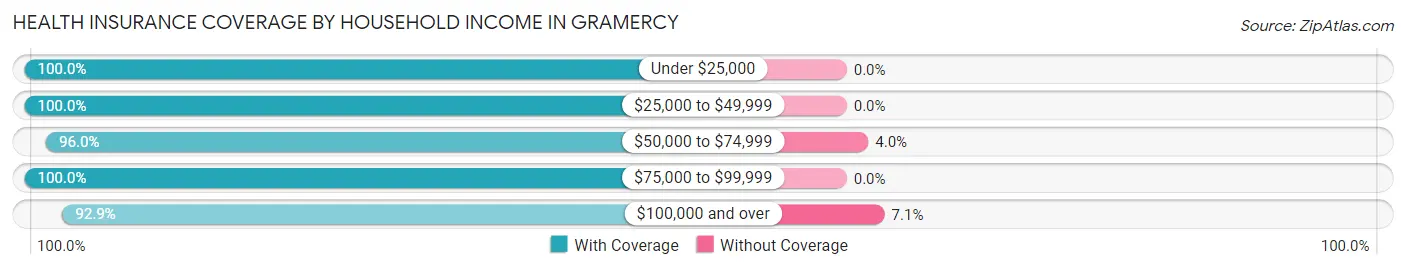
| Household Income | With Coverage | Without Coverage |
| Under $25,000 | 350 (100.0%) | 0 (0.0%) |
| $25,000 to $49,999 | 469 (100.0%) | 0 (0.0%) |
| $50,000 to $74,999 | 214 (96.0%) | 9 (4.0%) |
| $75,000 to $99,999 | 368 (100.0%) | 0 (0.0%) |
| $100,000 and over | 1,403 (92.9%) | 107 (7.1%) |
Public vs Private Health Insurance Coverage by Age in Gramercy
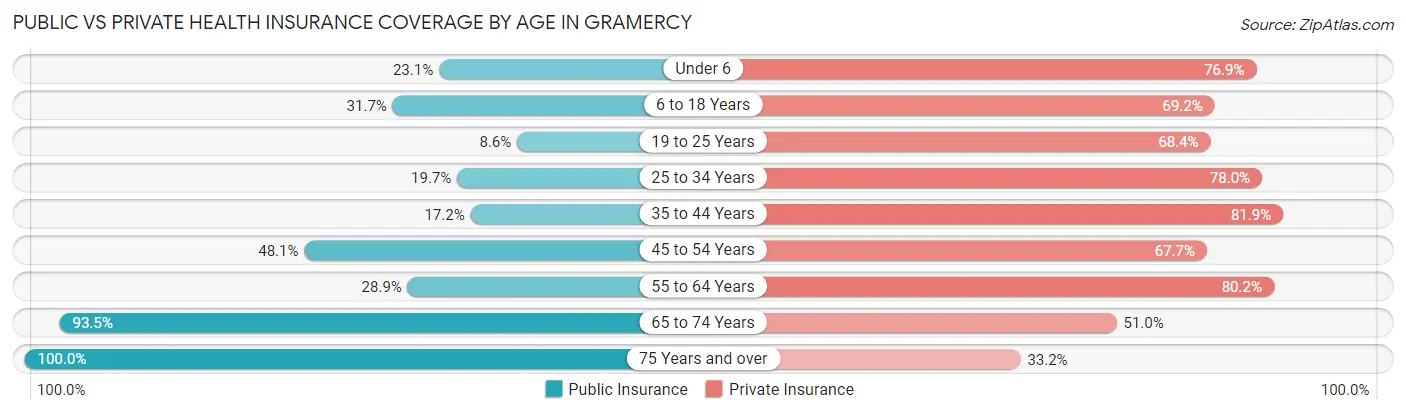
| Age Bracket | Public Insurance | Private Insurance |
| Under 6 | 24 (23.1%) | 80 (76.9%) |
| 6 to 18 Years | 179 (31.7%) | 391 (69.2%) |
| 19 to 25 Years | 31 (8.6%) | 247 (68.4%) |
| 25 to 34 Years | 43 (19.7%) | 170 (78.0%) |
| 35 to 44 Years | 80 (17.2%) | 380 (81.9%) |
| 45 to 54 Years | 164 (48.1%) | 231 (67.7%) |
| 55 to 64 Years | 137 (28.9%) | 380 (80.2%) |
| 65 to 74 Years | 187 (93.5%) | 102 (51.0%) |
| 75 Years and over | 193 (100.0%) | 64 (33.2%) |
| Total | 1,038 (35.5%) | 2,045 (70.0%) |
Disability Status by Sex by Age in Gramercy
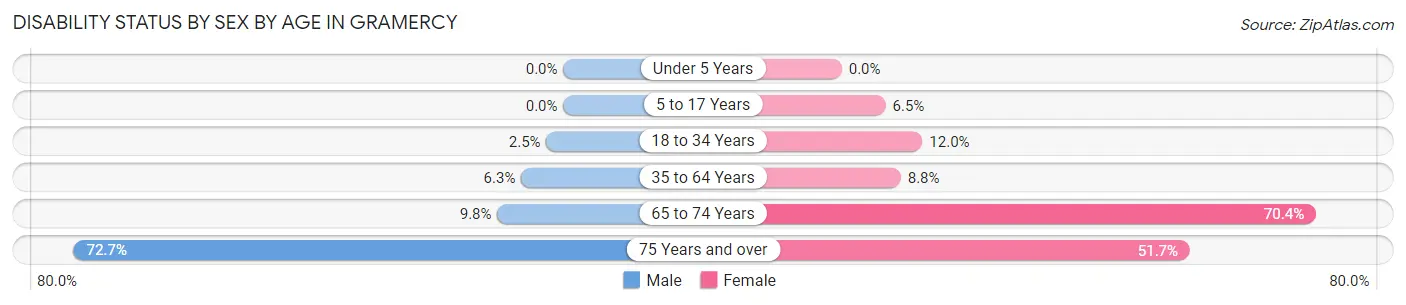
| Age Bracket | Male | Female |
| Under 5 Years | 0 (0.0%) | 0 (0.0%) |
| 5 to 17 Years | 0 (0.0%) | 18 (6.5%) |
| 18 to 34 Years | 6 (2.5%) | 42 (12.0%) |
| 35 to 64 Years | 40 (6.2%) | 56 (8.8%) |
| 65 to 74 Years | 10 (9.8%) | 69 (70.4%) |
| 75 Years and over | 32 (72.7%) | 77 (51.7%) |
Disability Class by Sex by Age in Gramercy
Disability Class: Hearing Difficulty
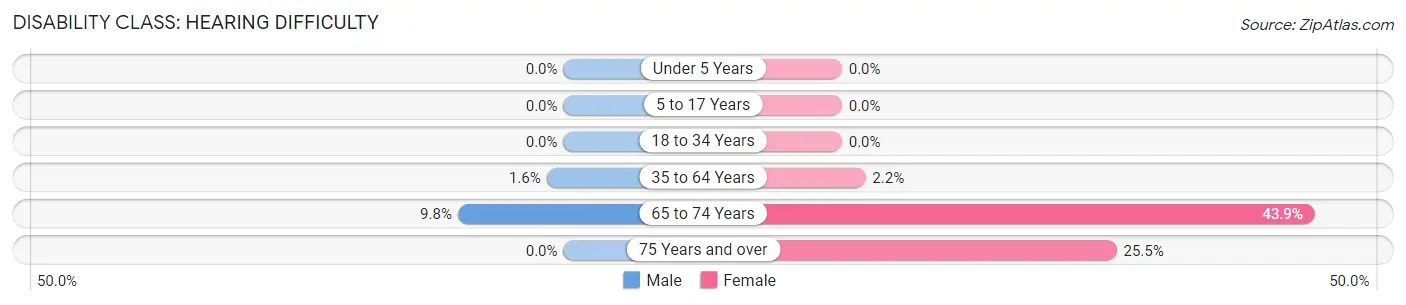
| Age Bracket | Male | Female |
| Under 5 Years | 0 (0.0%) | 0 (0.0%) |
| 5 to 17 Years | 0 (0.0%) | 0 (0.0%) |
| 18 to 34 Years | 0 (0.0%) | 0 (0.0%) |
| 35 to 64 Years | 10 (1.6%) | 14 (2.2%) |
| 65 to 74 Years | 10 (9.8%) | 43 (43.9%) |
| 75 Years and over | 0 (0.0%) | 38 (25.5%) |
Disability Class: Vision Difficulty
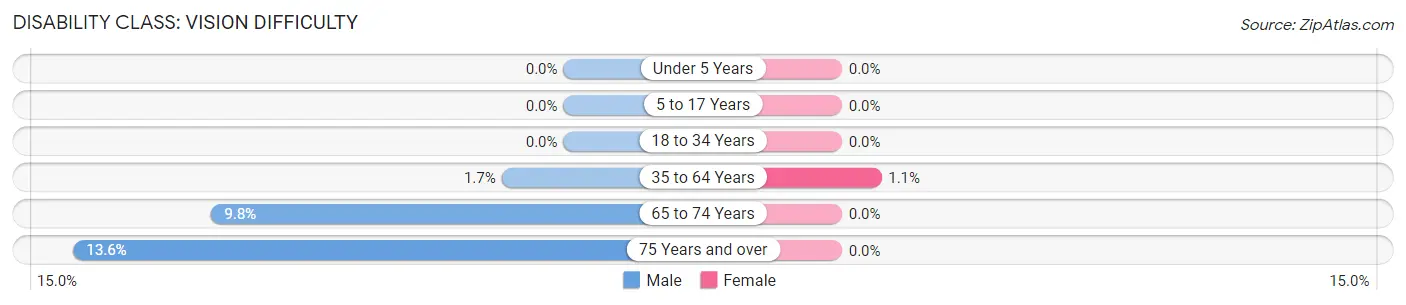
| Age Bracket | Male | Female |
| Under 5 Years | 0 (0.0%) | 0 (0.0%) |
| 5 to 17 Years | 0 (0.0%) | 0 (0.0%) |
| 18 to 34 Years | 0 (0.0%) | 0 (0.0%) |
| 35 to 64 Years | 11 (1.7%) | 7 (1.1%) |
| 65 to 74 Years | 10 (9.8%) | 0 (0.0%) |
| 75 Years and over | 6 (13.6%) | 0 (0.0%) |
Disability Class: Cognitive Difficulty
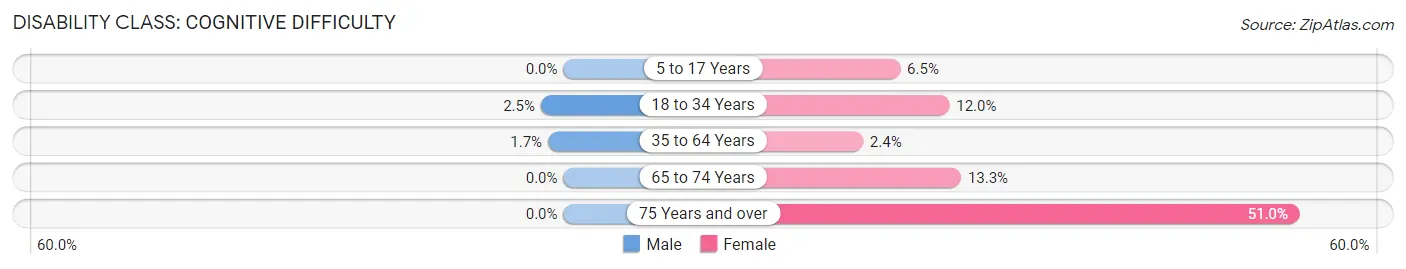
| Age Bracket | Male | Female |
| 5 to 17 Years | 0 (0.0%) | 18 (6.5%) |
| 18 to 34 Years | 6 (2.5%) | 42 (12.0%) |
| 35 to 64 Years | 11 (1.7%) | 15 (2.4%) |
| 65 to 74 Years | 0 (0.0%) | 13 (13.3%) |
| 75 Years and over | 0 (0.0%) | 76 (51.0%) |
Disability Class: Ambulatory Difficulty
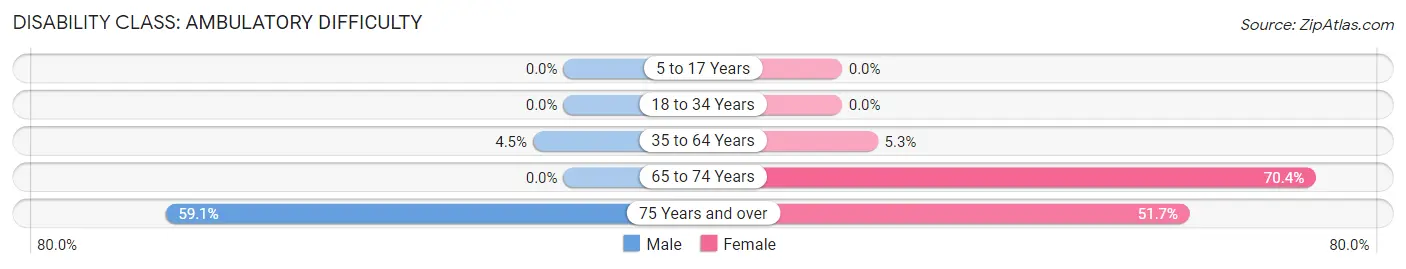
| Age Bracket | Male | Female |
| 5 to 17 Years | 0 (0.0%) | 0 (0.0%) |
| 18 to 34 Years | 0 (0.0%) | 0 (0.0%) |
| 35 to 64 Years | 29 (4.5%) | 34 (5.3%) |
| 65 to 74 Years | 0 (0.0%) | 69 (70.4%) |
| 75 Years and over | 26 (59.1%) | 77 (51.7%) |
Disability Class: Self-Care Difficulty
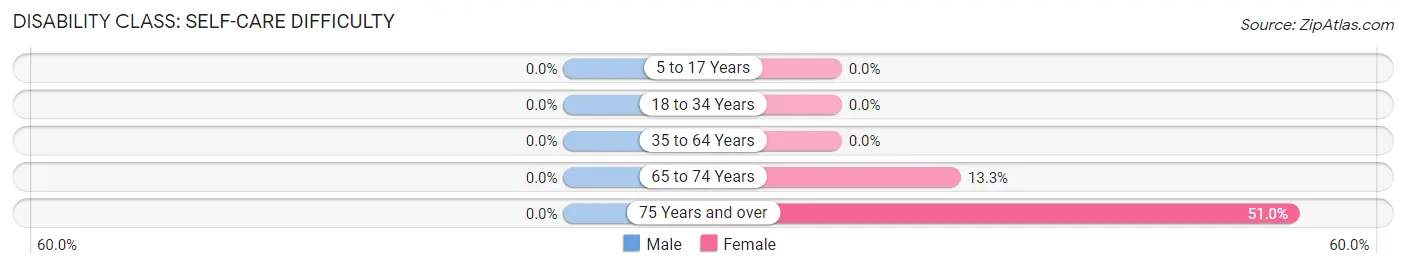
| Age Bracket | Male | Female |
| 5 to 17 Years | 0 (0.0%) | 0 (0.0%) |
| 18 to 34 Years | 0 (0.0%) | 0 (0.0%) |
| 35 to 64 Years | 0 (0.0%) | 0 (0.0%) |
| 65 to 74 Years | 0 (0.0%) | 13 (13.3%) |
| 75 Years and over | 0 (0.0%) | 76 (51.0%) |
Technology Access in Gramercy
Computing Device Access in Gramercy
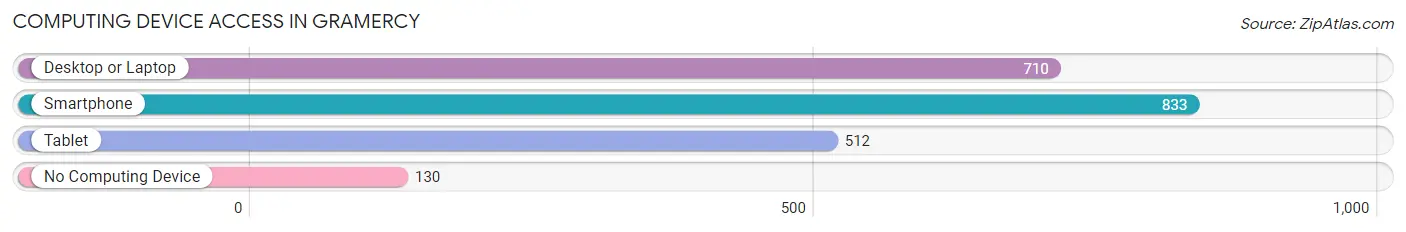
| Device Type | # Households | % Households |
| Desktop or Laptop | 710 | 70.4% |
| Smartphone | 833 | 82.6% |
| Tablet | 512 | 50.7% |
| No Computing Device | 130 | 12.9% |
| Total | 1,009 | 100.0% |
Internet Access in Gramercy
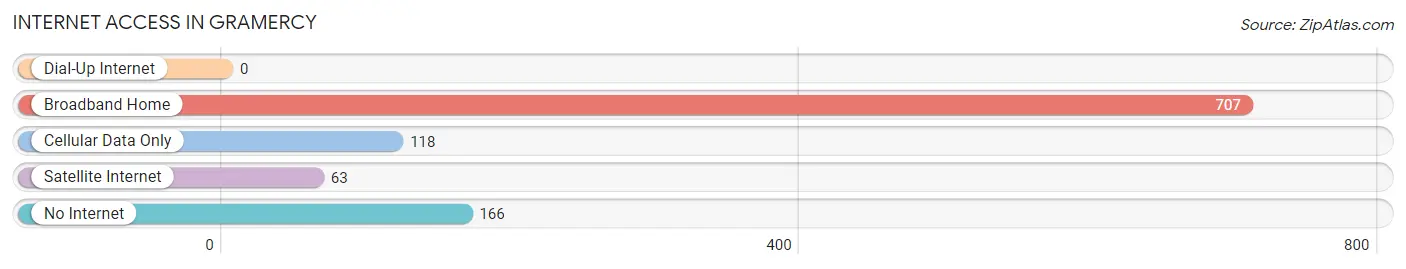
| Internet Type | # Households | % Households |
| Dial-Up Internet | 0 | 0.0% |
| Broadband Home | 707 | 70.1% |
| Cellular Data Only | 118 | 11.7% |
| Satellite Internet | 63 | 6.2% |
| No Internet | 166 | 16.5% |
| Total | 1,009 | 100.0% |
Gramercy Summary
Gramercy is a small town located in St. James Parish, Louisiana. It is situated on the west bank of the Mississippi River, about 25 miles south of Baton Rouge. The town has a population of approximately 2,500 people and is part of the Greater New Orleans Metropolitan Statistical Area.
History
Gramercy was founded in 1819 by a group of French-speaking settlers from the nearby town of St. James. The town was named after the French phrase “Grammaire de la ville”, which translates to “grammar of the town”. The settlers were attracted to the area due to its fertile soil and abundant natural resources.
Gramercy was an important port town during the 19th century, as it was located on the Mississippi River. The town was a major hub for the cotton and sugar industries, and it was also a popular destination for steamboat travel.
In the early 20th century, Gramercy experienced a period of economic decline due to the Great Depression and the decline of the steamboat industry. The town was also affected by the Great Mississippi Flood of 1927, which caused extensive damage to the area.
Geography
Gramercy is located in St. James Parish, Louisiana, on the west bank of the Mississippi River. The town is situated about 25 miles south of Baton Rouge and is part of the Greater New Orleans Metropolitan Statistical Area.
The town is located in a flat, low-lying area, with an elevation of about 10 feet above sea level. The climate is humid subtropical, with hot, humid summers and mild winters.
Economy
Gramercy’s economy is largely based on agriculture and tourism. The town is home to several large farms, which produce a variety of crops, including cotton, corn, soybeans, and sugar cane.
The town is also a popular tourist destination, as it is located on the Mississippi River and is close to several popular attractions, such as the French Quarter in New Orleans and the Audubon Zoo in New Orleans.
Demographics
As of the 2010 census, Gramercy had a population of 2,500 people. The racial makeup of the town was 79.2% White, 17.2% African American, 0.8% Native American, 0.4% Asian, and 2.4% from other races.
The median household income in Gramercy was $37,500, and the median family income was $45,000. The per capita income was $18,000. About 17.2% of the population was below the poverty line.
Conclusion
Gramercy is a small town located in St. James Parish, Louisiana. It is situated on the west bank of the Mississippi River, about 25 miles south of Baton Rouge. The town has a population of approximately 2,500 people and is part of the Greater New Orleans Metropolitan Statistical Area. Gramercy’s economy is largely based on agriculture and tourism, and the town is home to several large farms. The racial makeup of the town is 79.2% White, 17.2% African American, 0.8% Native American, 0.4% Asian, and 2.4% from other races. The median household income in Gramercy was $37,500, and the median family income was $45,000.
Common Questions
What is Per Capita Income in Gramercy?
Per Capita income in Gramercy is $31,835.
What is the Median Family Income in Gramercy?
Median Family Income in Gramercy is $87,310.
What is the Median Household income in Gramercy?
Median Household Income in Gramercy is $81,438.
What is Income or Wage Gap in Gramercy?
Income or Wage Gap in Gramercy is 14.4%.
Women in Gramercy earn 85.6 cents for every dollar earned by a man.
What is Inequality or Gini Index in Gramercy?
Inequality or Gini Index in Gramercy is 0.38.
What is the Total Population of Gramercy?
Total Population of Gramercy is 2,920.
What is the Total Male Population of Gramercy?
Total Male Population of Gramercy is 1,378.
What is the Total Female Population of Gramercy?
Total Female Population of Gramercy is 1,542.
What is the Ratio of Males per 100 Females in Gramercy?
There are 89.36 Males per 100 Females in Gramercy.
What is the Ratio of Females per 100 Males in Gramercy?
There are 111.90 Females per 100 Males in Gramercy.
What is the Median Population Age in Gramercy?
Median Population Age in Gramercy is 41.3 Years.
What is the Average Family Size in Gramercy
Average Family Size in Gramercy is 3.4 People.
What is the Average Household Size in Gramercy
Average Household Size in Gramercy is 2.9 People.
How Large is the Labor Force in Gramercy?
There are 1,621 People in the Labor Forcein in Gramercy.
What is the Percentage of People in the Labor Force in Gramercy?
68.2% of People are in the Labor Force in Gramercy.
What is the Unemployment Rate in Gramercy?
Unemployment Rate in Gramercy is 4.4%.