Glenmora, LA Map & Demographics
Glenmora Map
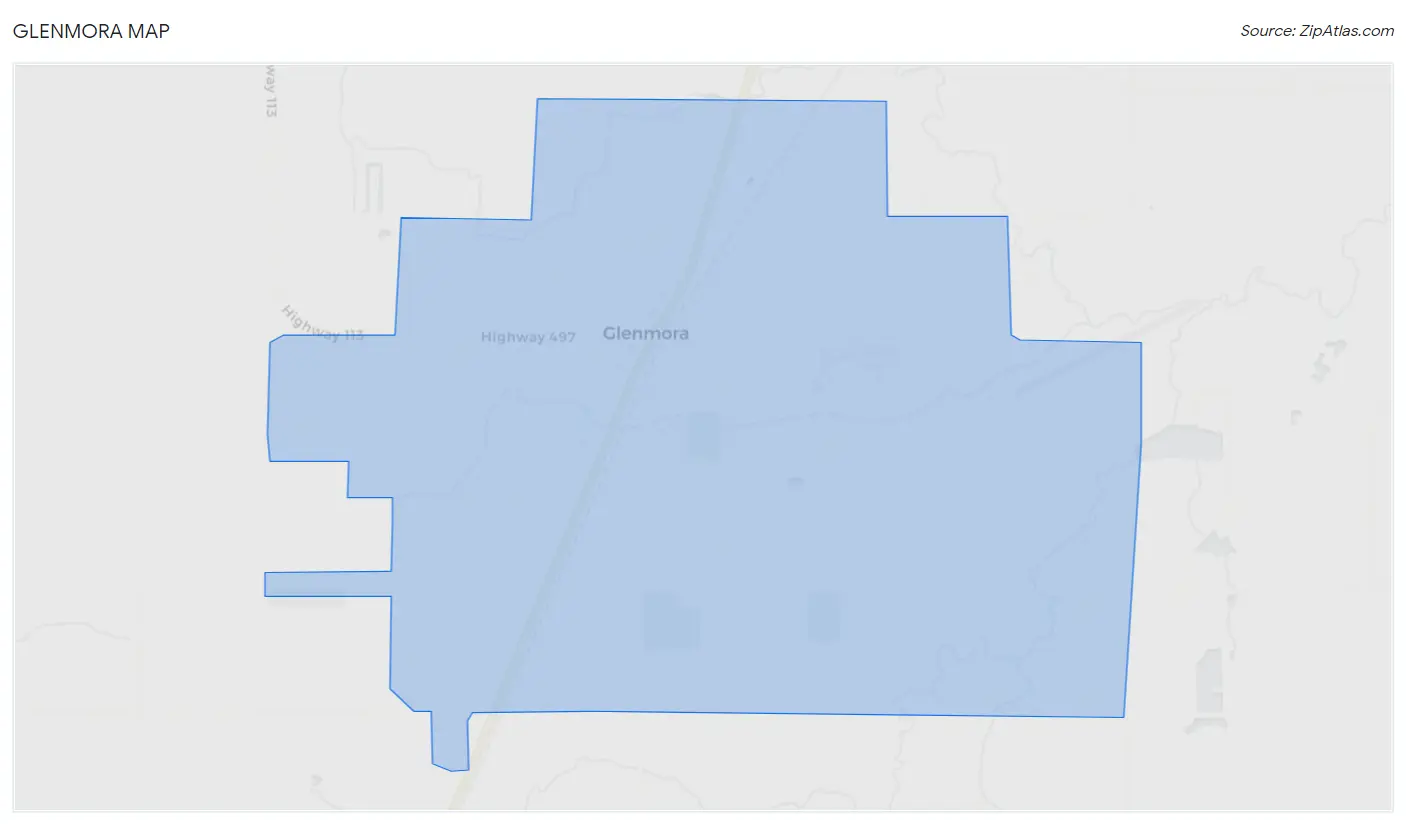
Glenmora Overview
$19,424
PER CAPITA INCOME
$38,700
AVG FAMILY INCOME
$34,865
AVG HOUSEHOLD INCOME
8.4%
WAGE / INCOME GAP [ % ]
91.6¢/ $1
WAGE / INCOME GAP [ $ ]
0.39
INEQUALITY / GINI INDEX
1,574
TOTAL POPULATION
748
MALE POPULATION
826
FEMALE POPULATION
90.56
MALES / 100 FEMALES
110.43
FEMALES / 100 MALES
30.9
MEDIAN AGE
3.8
AVG FAMILY SIZE
2.6
AVG HOUSEHOLD SIZE
688
LABOR FORCE [ PEOPLE ]
62.4%
PERCENT IN LABOR FORCE
6.8%
UNEMPLOYMENT RATE
Glenmora Zip Codes
Glenmora Area Codes
Income in Glenmora
Income Overview in Glenmora
Per Capita Income in Glenmora is $19,424, while median incomes of families and households are $38,700 and $34,865 respectively.
| Characteristic | Number | Measure |
| Per Capita Income | 1,574 | $19,424 |
| Median Family Income | 306 | $38,700 |
| Mean Family Income | 306 | $50,968 |
| Median Household Income | 602 | $34,865 |
| Mean Household Income | 602 | $46,695 |
| Income Deficit | 306 | $0 |
| Wage / Income Gap (%) | 1,574 | 8.39% |
| Wage / Income Gap ($) | 1,574 | 91.61¢ per $1 |
| Gini / Inequality Index | 1,574 | 0.39 |
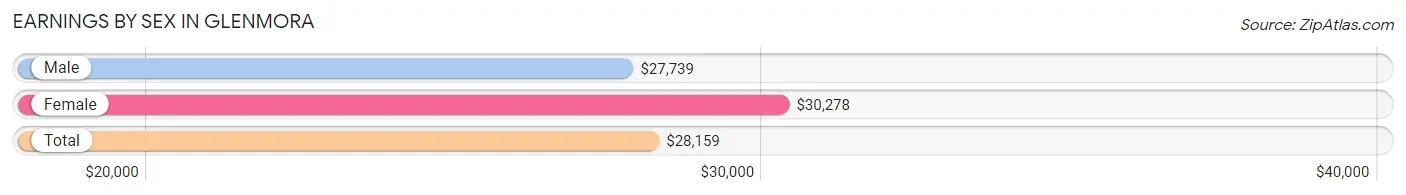
Earnings by Sex in Glenmora
Average Earnings in Glenmora are $28,159, $27,739 for men and $30,278 for women, a difference of 8.4%.
| Sex | Number | Average Earnings |
| Male | 387 (53.7%) | $27,739 |
| Female | 334 (46.3%) | $30,278 |
| Total | 721 (100.0%) | $28,159 |
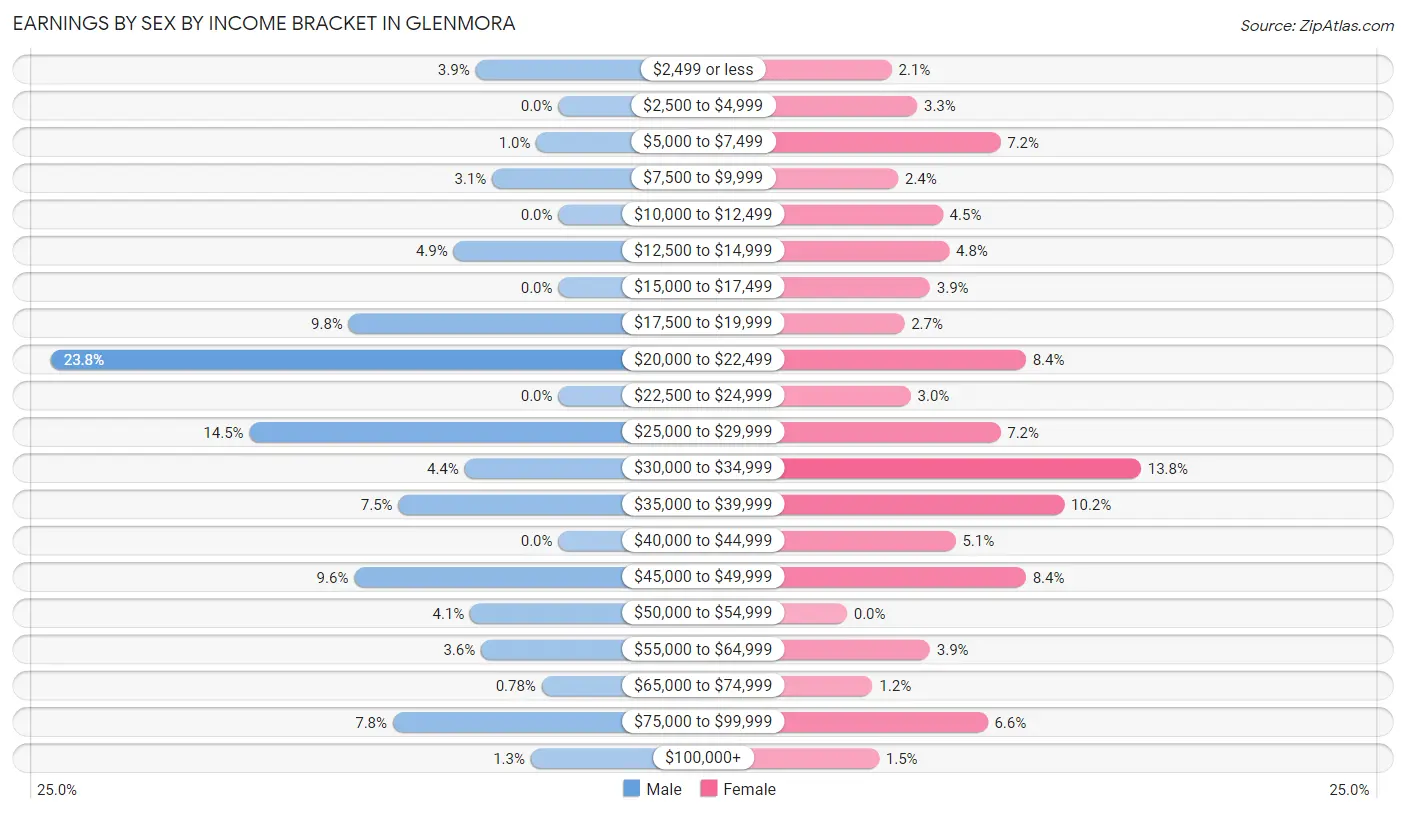
Earnings by Sex by Income Bracket in Glenmora
The most common earnings brackets in Glenmora are $20,000 to $22,499 for men (92 | 23.8%) and $30,000 to $34,999 for women (46 | 13.8%).
| Income | Male | Female |
| $2,499 or less | 15 (3.9%) | 7 (2.1%) |
| $2,500 to $4,999 | 0 (0.0%) | 11 (3.3%) |
| $5,000 to $7,499 | 4 (1.0%) | 24 (7.2%) |
| $7,500 to $9,999 | 12 (3.1%) | 8 (2.4%) |
| $10,000 to $12,499 | 0 (0.0%) | 15 (4.5%) |
| $12,500 to $14,999 | 19 (4.9%) | 16 (4.8%) |
| $15,000 to $17,499 | 0 (0.0%) | 13 (3.9%) |
| $17,500 to $19,999 | 38 (9.8%) | 9 (2.7%) |
| $20,000 to $22,499 | 92 (23.8%) | 28 (8.4%) |
| $22,500 to $24,999 | 0 (0.0%) | 10 (3.0%) |
| $25,000 to $29,999 | 56 (14.5%) | 24 (7.2%) |
| $30,000 to $34,999 | 17 (4.4%) | 46 (13.8%) |
| $35,000 to $39,999 | 29 (7.5%) | 34 (10.2%) |
| $40,000 to $44,999 | 0 (0.0%) | 17 (5.1%) |
| $45,000 to $49,999 | 37 (9.6%) | 28 (8.4%) |
| $50,000 to $54,999 | 16 (4.1%) | 0 (0.0%) |
| $55,000 to $64,999 | 14 (3.6%) | 13 (3.9%) |
| $65,000 to $74,999 | 3 (0.8%) | 4 (1.2%) |
| $75,000 to $99,999 | 30 (7.7%) | 22 (6.6%) |
| $100,000+ | 5 (1.3%) | 5 (1.5%) |
| Total | 387 (100.0%) | 334 (100.0%) |
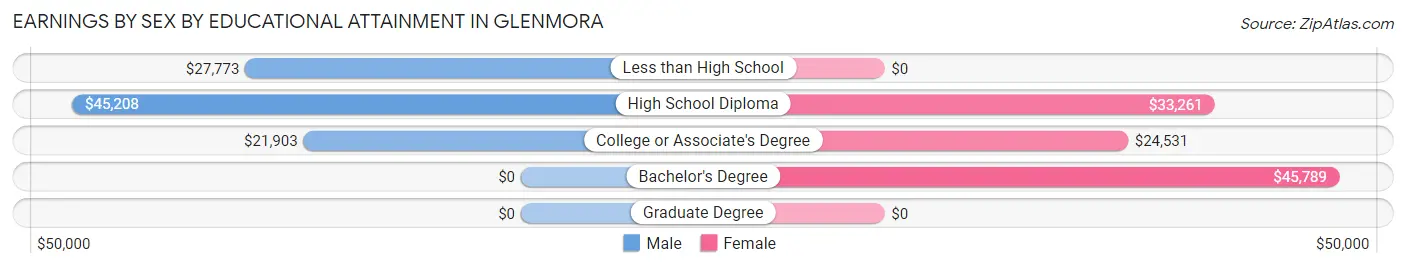
Earnings by Sex by Educational Attainment in Glenmora
Average earnings in Glenmora are $27,846 for men and $31,458 for women, a difference of 11.5%. Men with an educational attainment of high school diploma enjoy the highest average annual earnings of $45,208, while those with college or associate's degree education earn the least with $21,903. Women with an educational attainment of bachelor's degree earn the most with the average annual earnings of $45,789, while those with college or associate's degree education have the smallest earnings of $24,531.
| Educational Attainment | Male Income | Female Income |
| Less than High School | $27,773 | $0 |
| High School Diploma | $45,208 | $33,261 |
| College or Associate's Degree | $21,903 | $24,531 |
| Bachelor's Degree | - | - |
| Graduate Degree | - | - |
| Total | $27,846 | $31,458 |
Family Income in Glenmora
Family Income Brackets in Glenmora
According to the Glenmora family income data, there are 73 families falling into the $75,000 to $99,999 income range, which is the most common income bracket and makes up 23.9% of all families.
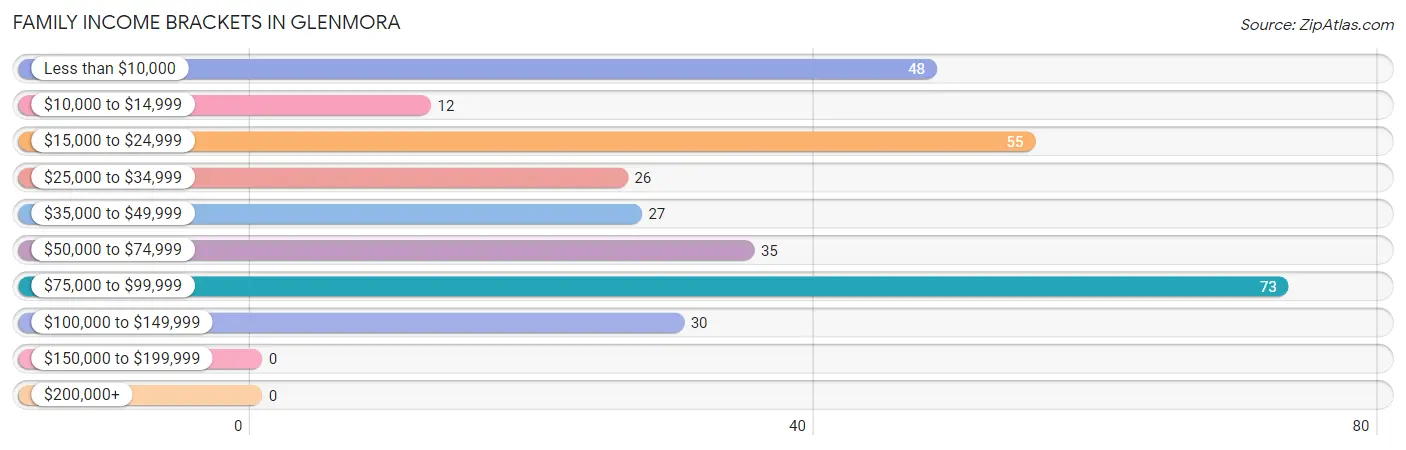
| Income Bracket | # Families | % Families |
| Less than $10,000 | 48 | 15.7% |
| $10,000 to $14,999 | 12 | 3.9% |
| $15,000 to $24,999 | 55 | 18.0% |
| $25,000 to $34,999 | 26 | 8.5% |
| $35,000 to $49,999 | 27 | 8.8% |
| $50,000 to $74,999 | 35 | 11.4% |
| $75,000 to $99,999 | 73 | 23.9% |
| $100,000 to $149,999 | 30 | 9.8% |
| $150,000 to $199,999 | 0 | 0.0% |
| $200,000+ | 0 | 0.0% |
Family Income by Famaliy Size in Glenmora
6-person families (30 | 9.8%) account for the highest median family income in Glenmora with $90,714 per family, while 2-person families (117 | 38.2%) have the highest median income of $29,438 per family member.
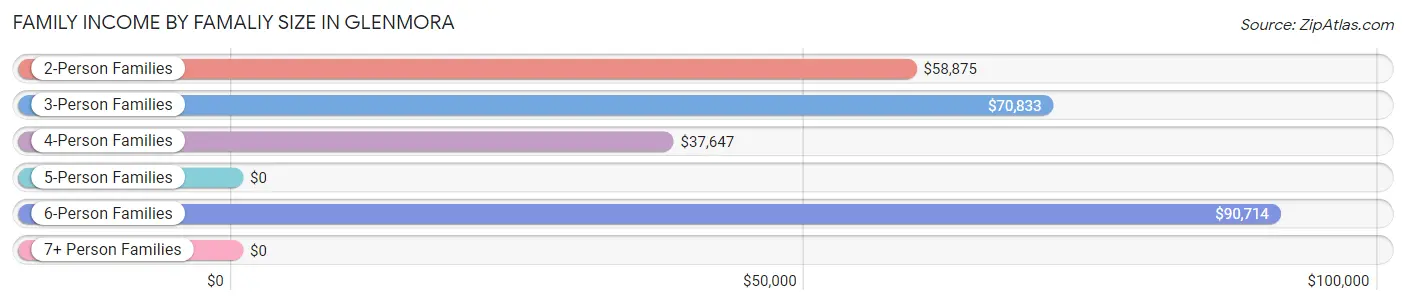
| Income Bracket | # Families | Median Income |
| 2-Person Families | 117 (38.2%) | $58,875 |
| 3-Person Families | 70 (22.9%) | $70,833 |
| 4-Person Families | 48 (15.7%) | $37,647 |
| 5-Person Families | 41 (13.4%) | $0 |
| 6-Person Families | 30 (9.8%) | $90,714 |
| 7+ Person Families | 0 (0.0%) | $0 |
| Total | 306 (100.0%) | $38,700 |
Family Income by Number of Earners in Glenmora
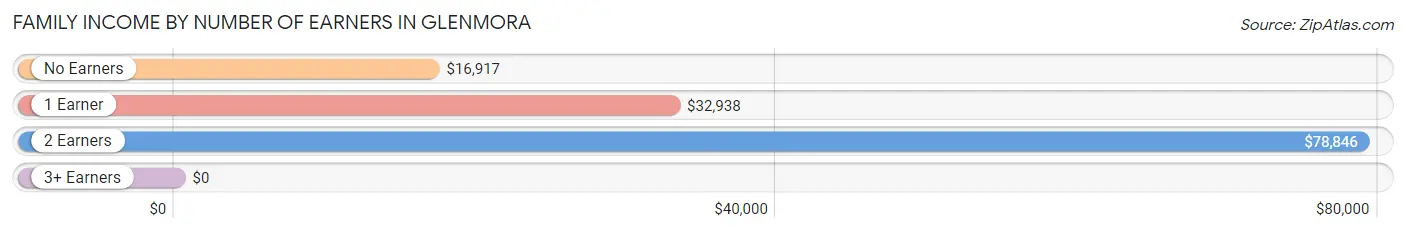
| Number of Earners | # Families | Median Income |
| No Earners | 35 (11.4%) | $16,917 |
| 1 Earner | 169 (55.2%) | $32,938 |
| 2 Earners | 94 (30.7%) | $78,846 |
| 3+ Earners | 8 (2.6%) | $0 |
| Total | 306 (100.0%) | $38,700 |
Household Income in Glenmora
Household Income Brackets in Glenmora
With 161 households falling in the category, the $15,000 to $24,999 income range is the most frequent in Glenmora, accounting for 26.7% of all households.
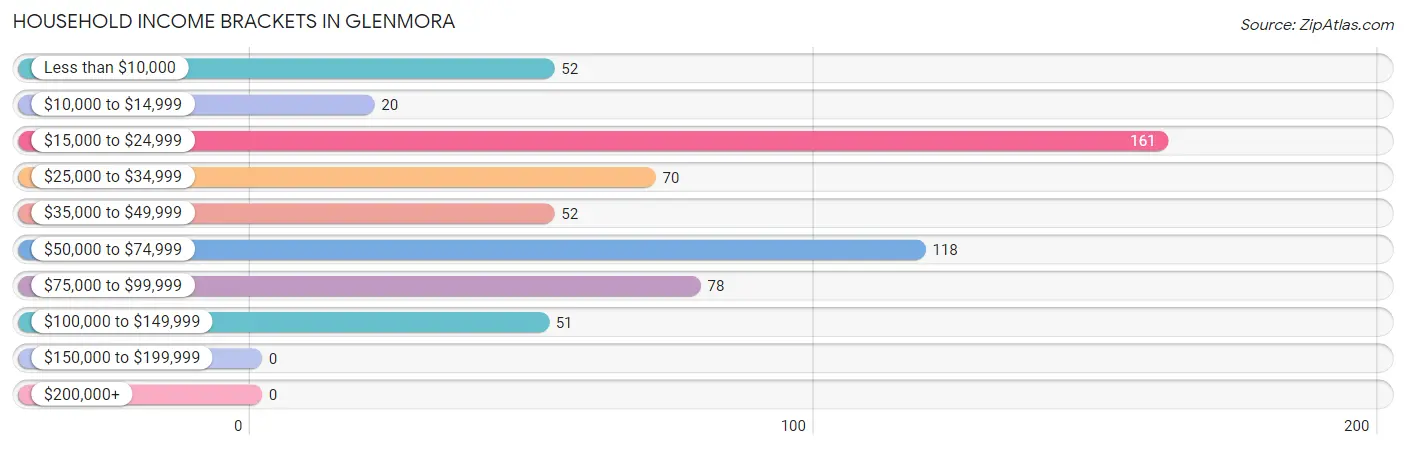
| Income Bracket | # Households | % Households |
| Less than $10,000 | 52 | 8.6% |
| $10,000 to $14,999 | 20 | 3.3% |
| $15,000 to $24,999 | 161 | 26.7% |
| $25,000 to $34,999 | 70 | 11.6% |
| $35,000 to $49,999 | 52 | 8.6% |
| $50,000 to $74,999 | 118 | 19.6% |
| $75,000 to $99,999 | 78 | 13.0% |
| $100,000 to $149,999 | 51 | 8.5% |
| $150,000 to $199,999 | 0 | 0.0% |
| $200,000+ | 0 | 0.0% |
Household Income by Householder Age in Glenmora
The median household income in Glenmora is $34,865, with the highest median household income of $71,023 found in the 45 to 64 years age bracket for the primary householder. A total of 142 households (23.6%) fall into this category. Meanwhile, the 15 to 24 years age bracket for the primary householder has the lowest median household income of $0, with 13 households (2.2%) in this group.
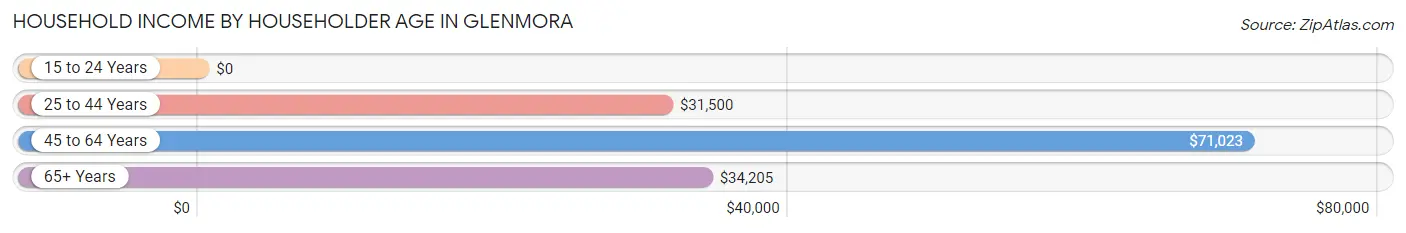
| Income Bracket | # Households | Median Income |
| 15 to 24 Years | 13 (2.2%) | $0 |
| 25 to 44 Years | 312 (51.8%) | $31,500 |
| 45 to 64 Years | 142 (23.6%) | $71,023 |
| 65+ Years | 135 (22.4%) | $34,205 |
| Total | 602 (100.0%) | $34,865 |
Poverty in Glenmora
Income Below Poverty by Sex and Age in Glenmora
With 33.0% poverty level for males and 42.2% for females among the residents of Glenmora, under 5 year old males and under 5 year old females are the most vulnerable to poverty, with 100 males (100.0%) and 123 females (88.5%) in their respective age groups living below the poverty level.
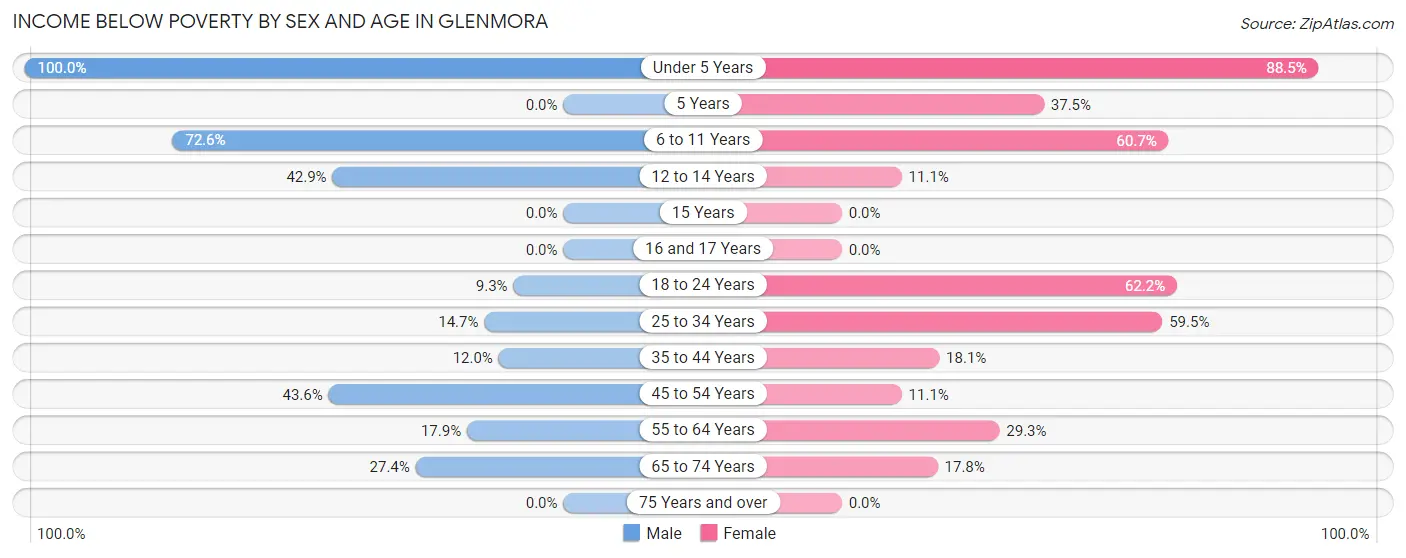
| Age Bracket | Male | Female |
| Under 5 Years | 100 (100.0%) | 123 (88.5%) |
| 5 Years | 0 (0.0%) | 3 (37.5%) |
| 6 to 11 Years | 45 (72.6%) | 37 (60.7%) |
| 12 to 14 Years | 12 (42.9%) | 5 (11.1%) |
| 15 Years | 0 (0.0%) | 0 (0.0%) |
| 16 and 17 Years | 0 (0.0%) | 0 (0.0%) |
| 18 to 24 Years | 5 (9.3%) | 28 (62.2%) |
| 25 to 34 Years | 16 (14.7%) | 91 (59.5%) |
| 35 to 44 Years | 18 (12.0%) | 15 (18.1%) |
| 45 to 54 Years | 17 (43.6%) | 8 (11.1%) |
| 55 to 64 Years | 17 (17.9%) | 31 (29.2%) |
| 65 to 74 Years | 17 (27.4%) | 8 (17.8%) |
| 75 Years and over | 0 (0.0%) | 0 (0.0%) |
| Total | 247 (33.0%) | 349 (42.2%) |
Income Above Poverty by Sex and Age in Glenmora
According to the poverty statistics in Glenmora, males aged 15 years and females aged 15 years are the age groups that are most secure financially, with 100.0% of males and 100.0% of females in these age groups living above the poverty line.
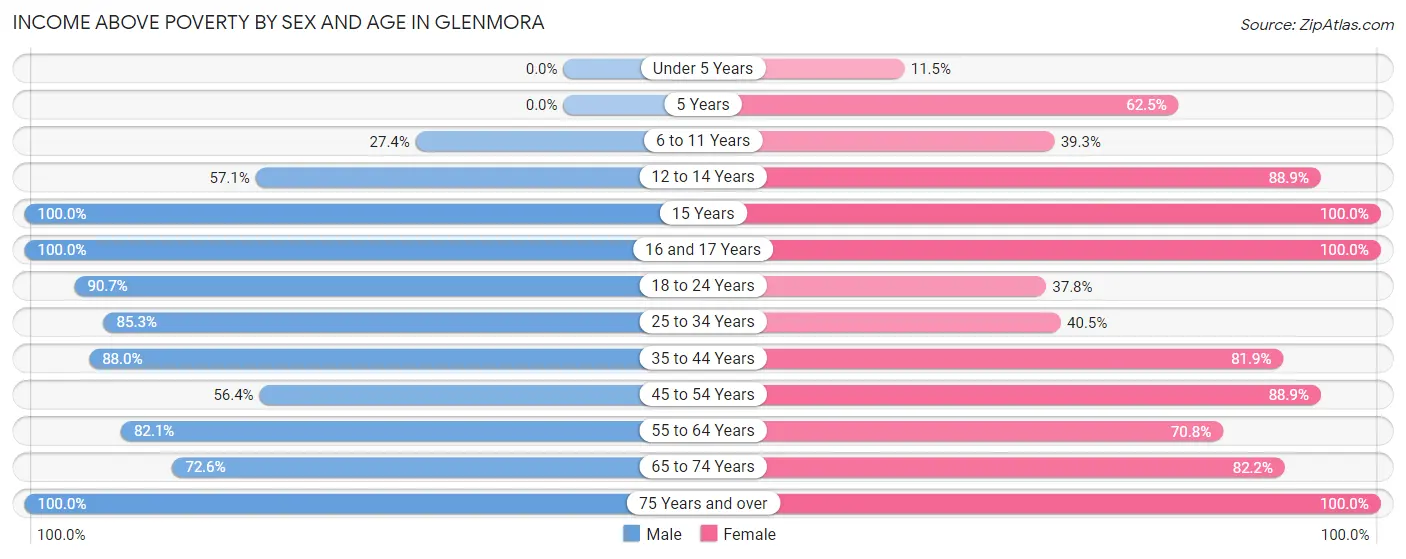
| Age Bracket | Male | Female |
| Under 5 Years | 0 (0.0%) | 16 (11.5%) |
| 5 Years | 0 (0.0%) | 5 (62.5%) |
| 6 to 11 Years | 17 (27.4%) | 24 (39.3%) |
| 12 to 14 Years | 16 (57.1%) | 40 (88.9%) |
| 15 Years | 21 (100.0%) | 7 (100.0%) |
| 16 and 17 Years | 23 (100.0%) | 2 (100.0%) |
| 18 to 24 Years | 49 (90.7%) | 17 (37.8%) |
| 25 to 34 Years | 93 (85.3%) | 62 (40.5%) |
| 35 to 44 Years | 132 (88.0%) | 68 (81.9%) |
| 45 to 54 Years | 22 (56.4%) | 64 (88.9%) |
| 55 to 64 Years | 78 (82.1%) | 75 (70.8%) |
| 65 to 74 Years | 45 (72.6%) | 37 (82.2%) |
| 75 Years and over | 5 (100.0%) | 60 (100.0%) |
| Total | 501 (67.0%) | 477 (57.8%) |
Income Below Poverty Among Married-Couple Families in Glenmora
The poverty statistics for married-couple families in Glenmora show that 7.0% or 9 of the total 128 families live below the poverty line. Families with 3 or 4 children have the highest poverty rate of 30.0%, comprising of 9 families. On the other hand, families with no children have the lowest poverty rate of 0.0%, which includes 0 families.
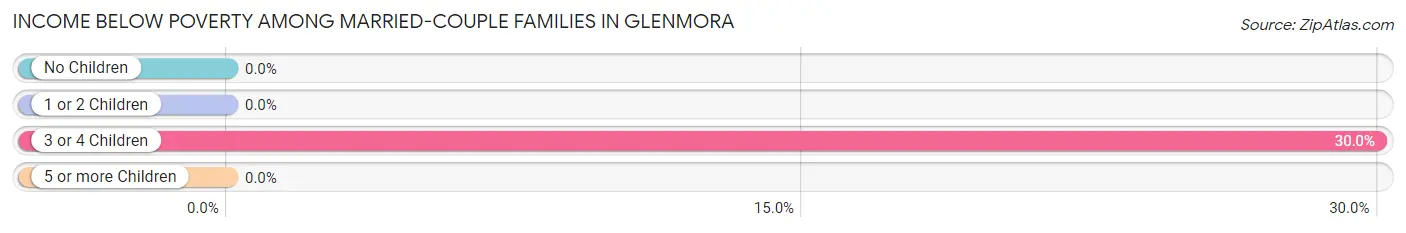
| Children | Above Poverty | Below Poverty |
| No Children | 83 (100.0%) | 0 (0.0%) |
| 1 or 2 Children | 15 (100.0%) | 0 (0.0%) |
| 3 or 4 Children | 21 (70.0%) | 9 (30.0%) |
| 5 or more Children | 0 (0.0%) | 0 (0.0%) |
| Total | 119 (93.0%) | 9 (7.0%) |
Income Below Poverty Among Single-Parent Households in Glenmora
According to the poverty data in Glenmora, 77.8% or 21 single-father households and 54.3% or 82 single-mother households are living below the poverty line. Among single-father households, those with 1 or 2 children have the highest poverty rate, with 16 households (100.0%) experiencing poverty. Likewise, among single-mother households, those with 3 or 4 children have the highest poverty rate, with 46 households (73.0%) falling below the poverty line.
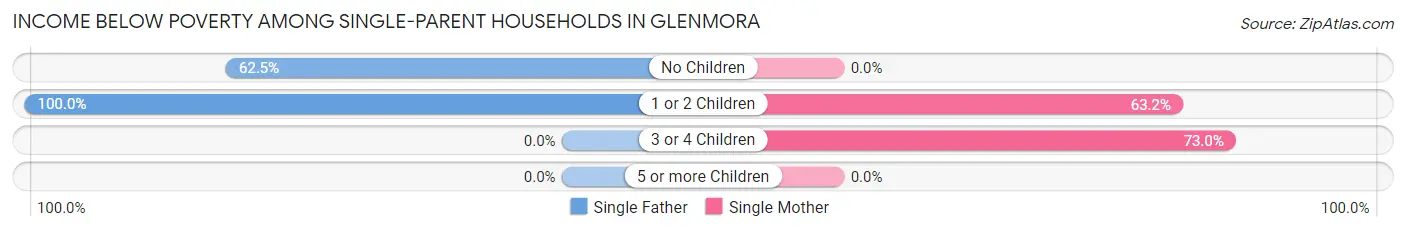
| Children | Single Father | Single Mother |
| No Children | 5 (62.5%) | 0 (0.0%) |
| 1 or 2 Children | 16 (100.0%) | 36 (63.2%) |
| 3 or 4 Children | 0 (0.0%) | 46 (73.0%) |
| 5 or more Children | 0 (0.0%) | 0 (0.0%) |
| Total | 21 (77.8%) | 82 (54.3%) |
Income Below Poverty Among Married-Couple vs Single-Parent Households in Glenmora
The poverty data for Glenmora shows that 9 of the married-couple family households (7.0%) and 103 of the single-parent households (57.9%) are living below the poverty level. Within the married-couple family households, those with 3 or 4 children have the highest poverty rate, with 9 households (30.0%) falling below the poverty line. Among the single-parent households, those with 1 or 2 children have the highest poverty rate, with 52 household (71.2%) living below poverty.
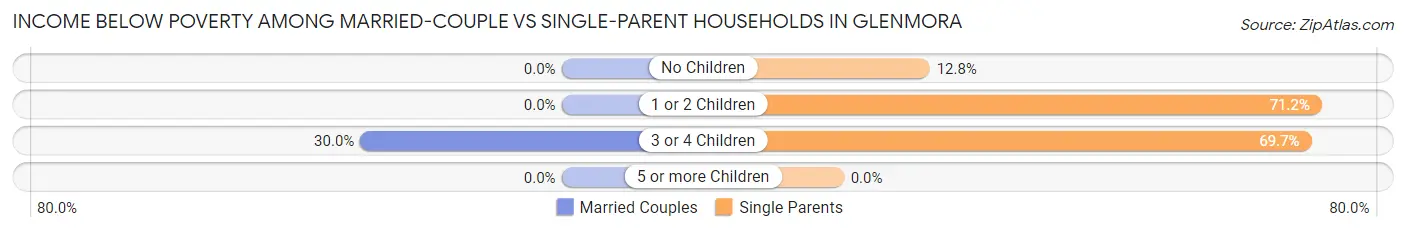
| Children | Married-Couple Families | Single-Parent Households |
| No Children | 0 (0.0%) | 5 (12.8%) |
| 1 or 2 Children | 0 (0.0%) | 52 (71.2%) |
| 3 or 4 Children | 9 (30.0%) | 46 (69.7%) |
| 5 or more Children | 0 (0.0%) | 0 (0.0%) |
| Total | 9 (7.0%) | 103 (57.9%) |
Race in Glenmora
The most populous races in Glenmora are White / Caucasian (752 | 47.8%), Black / African American (522 | 33.2%), and Hispanic or Latino (257 | 16.3%).
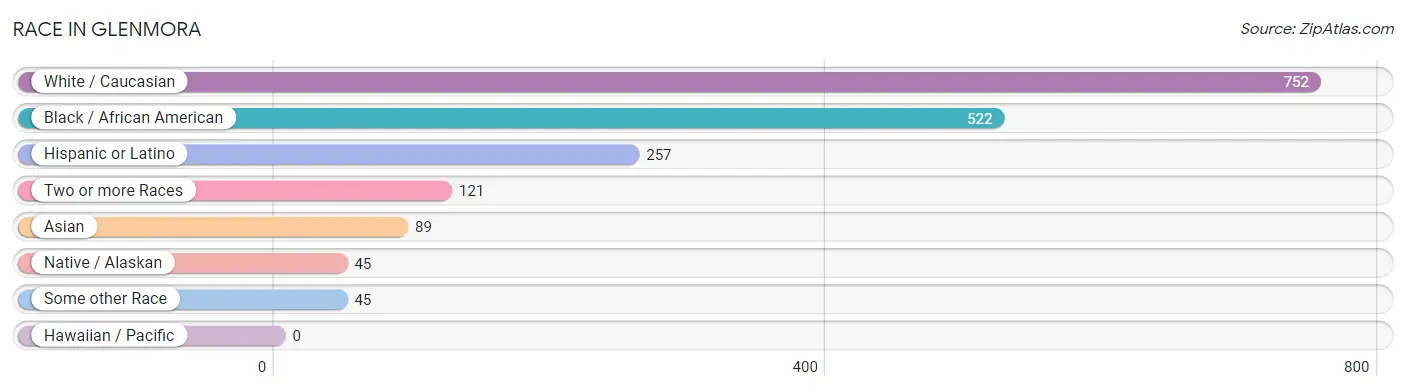
| Race | # Population | % Population |
| Asian | 89 | 5.7% |
| Black / African American | 522 | 33.2% |
| Hawaiian / Pacific | 0 | 0.0% |
| Hispanic or Latino | 257 | 16.3% |
| Native / Alaskan | 45 | 2.9% |
| White / Caucasian | 752 | 47.8% |
| Two or more Races | 121 | 7.7% |
| Some other Race | 45 | 2.9% |
| Total | 1,574 | 100.0% |
Ancestry in Glenmora
The most populous ancestries reported in Glenmora are American (681 | 43.3%), Mexican (257 | 16.3%), Malaysian (88 | 5.6%), English (85 | 5.4%), and German (43 | 2.7%), together accounting for 73.3% of all Glenmora residents.
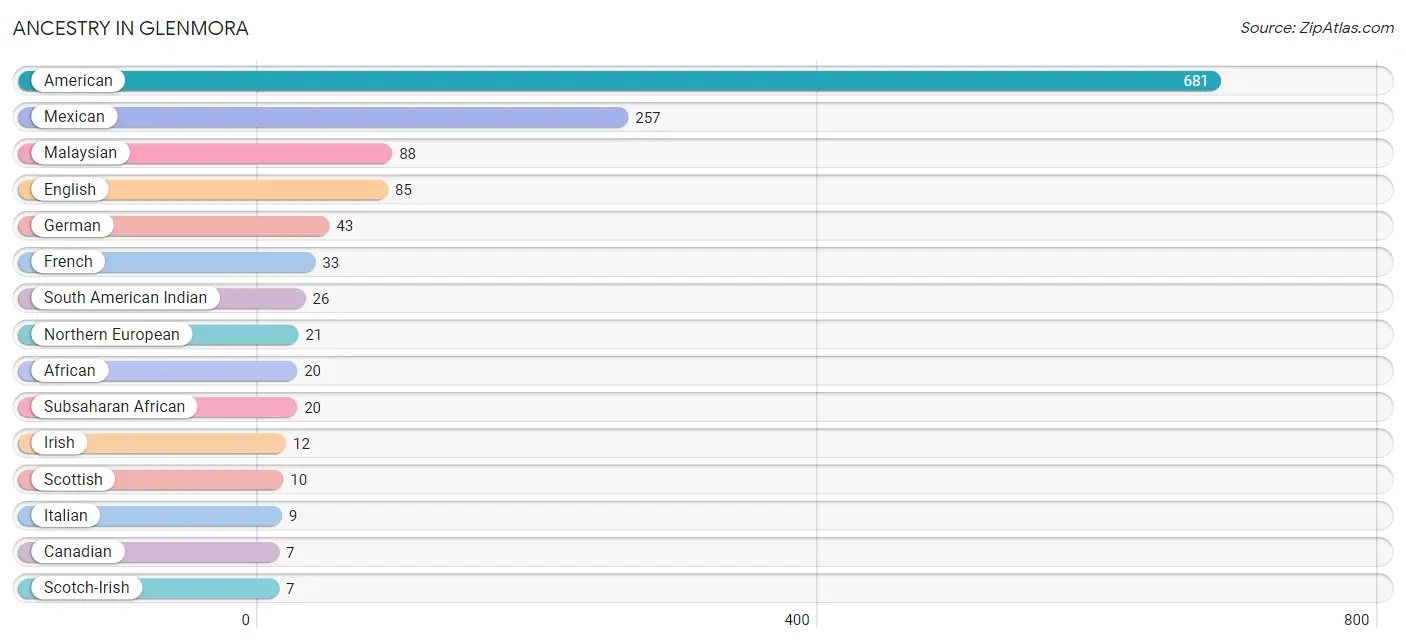
| Ancestry | # Population | % Population |
| African | 20 | 1.3% |
| American | 681 | 43.3% |
| British | 5 | 0.3% |
| Canadian | 7 | 0.4% |
| Cherokee | 2 | 0.1% |
| Dutch | 3 | 0.2% |
| English | 85 | 5.4% |
| French | 33 | 2.1% |
| German | 43 | 2.7% |
| Indian (Asian) | 1 | 0.1% |
| Irish | 12 | 0.8% |
| Italian | 9 | 0.6% |
| Malaysian | 88 | 5.6% |
| Mexican | 257 | 16.3% |
| Northern European | 21 | 1.3% |
| Scotch-Irish | 7 | 0.4% |
| Scottish | 10 | 0.6% |
| Slovak | 6 | 0.4% |
| South American Indian | 26 | 1.7% |
| Subsaharan African | 20 | 1.3% | View All 20 Rows |
Immigrants in Glenmora
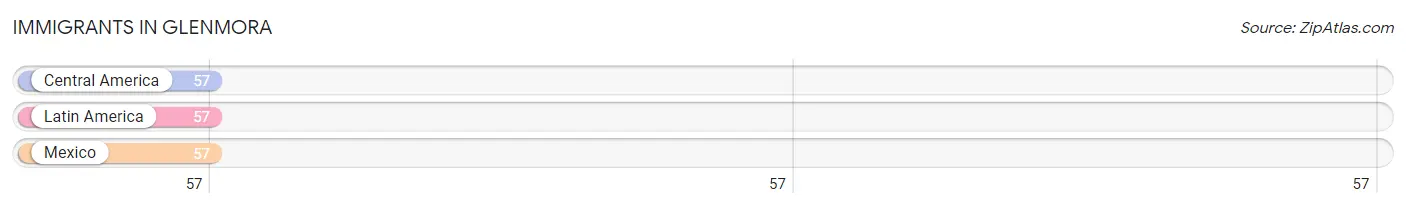
The most numerous immigrant groups reported in Glenmora came from Central America (57 | 3.6%), Latin America (57 | 3.6%), and Mexico (57 | 3.6%), together accounting for 10.9% of all Glenmora residents.
| Immigration Origin | # Population | % Population |
| Central America | 57 | 3.6% |
| Latin America | 57 | 3.6% |
| Mexico | 57 | 3.6% | View All 3 Rows |
Sex and Age in Glenmora
Sex and Age in Glenmora
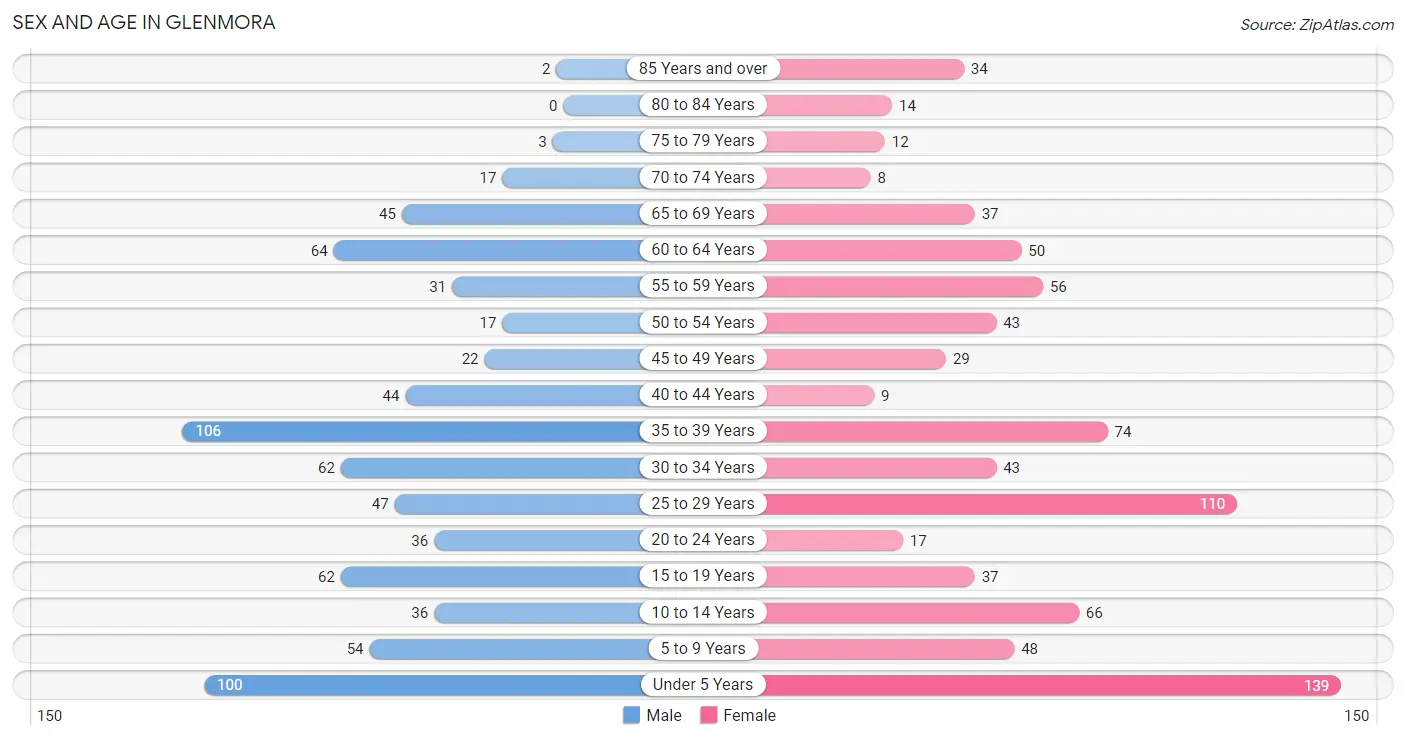
The most populous age groups in Glenmora are 35 to 39 Years (106 | 14.2%) for men and Under 5 Years (139 | 16.8%) for women.
| Age Bracket | Male | Female |
| Under 5 Years | 100 (13.4%) | 139 (16.8%) |
| 5 to 9 Years | 54 (7.2%) | 48 (5.8%) |
| 10 to 14 Years | 36 (4.8%) | 66 (8.0%) |
| 15 to 19 Years | 62 (8.3%) | 37 (4.5%) |
| 20 to 24 Years | 36 (4.8%) | 17 (2.1%) |
| 25 to 29 Years | 47 (6.3%) | 110 (13.3%) |
| 30 to 34 Years | 62 (8.3%) | 43 (5.2%) |
| 35 to 39 Years | 106 (14.2%) | 74 (9.0%) |
| 40 to 44 Years | 44 (5.9%) | 9 (1.1%) |
| 45 to 49 Years | 22 (2.9%) | 29 (3.5%) |
| 50 to 54 Years | 17 (2.3%) | 43 (5.2%) |
| 55 to 59 Years | 31 (4.1%) | 56 (6.8%) |
| 60 to 64 Years | 64 (8.6%) | 50 (6.0%) |
| 65 to 69 Years | 45 (6.0%) | 37 (4.5%) |
| 70 to 74 Years | 17 (2.3%) | 8 (1.0%) |
| 75 to 79 Years | 3 (0.4%) | 12 (1.5%) |
| 80 to 84 Years | 0 (0.0%) | 14 (1.7%) |
| 85 Years and over | 2 (0.3%) | 34 (4.1%) |
| Total | 748 (100.0%) | 826 (100.0%) |
Families and Households in Glenmora
Median Family Size in Glenmora
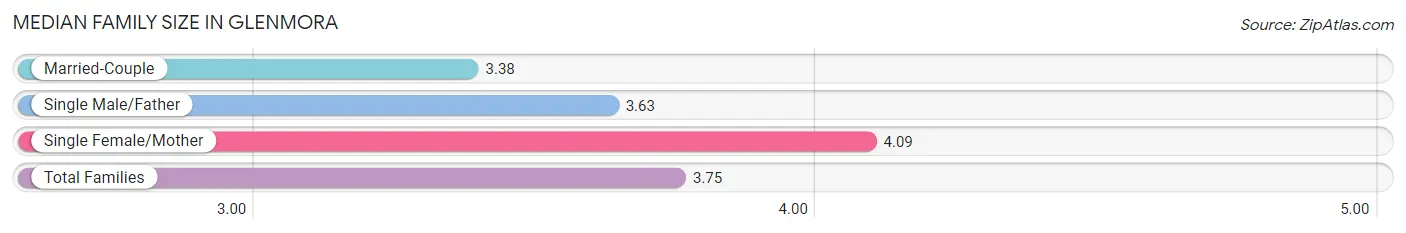
The median family size in Glenmora is 3.75 persons per family, with single female/mother families (151 | 49.3%) accounting for the largest median family size of 4.09 persons per family. On the other hand, married-couple families (128 | 41.8%) represent the smallest median family size with 3.38 persons per family.
| Family Type | # Families | Family Size |
| Married-Couple | 128 (41.8%) | 3.38 |
| Single Male/Father | 27 (8.8%) | 3.63 |
| Single Female/Mother | 151 (49.3%) | 4.09 |
| Total Families | 306 (100.0%) | 3.75 |
Median Household Size in Glenmora
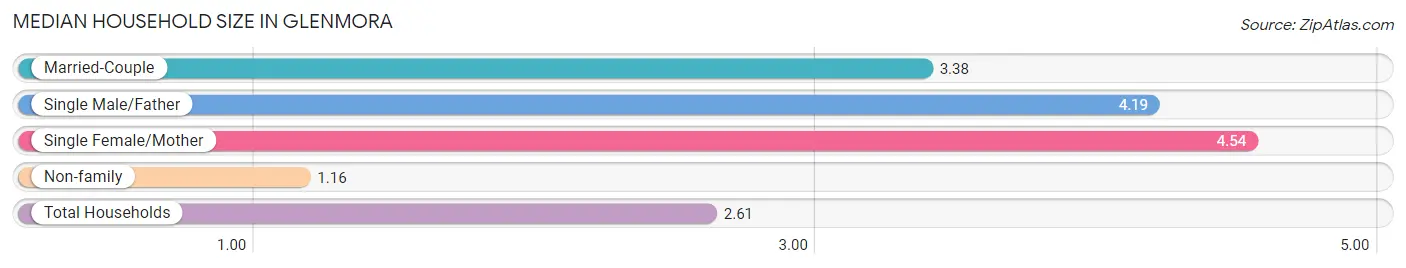
The median household size in Glenmora is 2.61 persons per household, with single female/mother households (151 | 25.1%) accounting for the largest median household size of 4.54 persons per household. non-family households (296 | 49.2%) represent the smallest median household size with 1.16 persons per household.
| Household Type | # Households | Household Size |
| Married-Couple | 128 (21.3%) | 3.38 |
| Single Male/Father | 27 (4.5%) | 4.19 |
| Single Female/Mother | 151 (25.1%) | 4.54 |
| Non-family | 296 (49.2%) | 1.16 |
| Total Households | 602 (100.0%) | 2.61 |
Household Size by Marriage Status in Glenmora
Out of a total of 602 households in Glenmora, 306 (50.8%) are family households, while 296 (49.2%) are nonfamily households. The most numerous type of family households are 2-person households, comprising 103, and the most common type of nonfamily households are 1-person households, comprising 257.
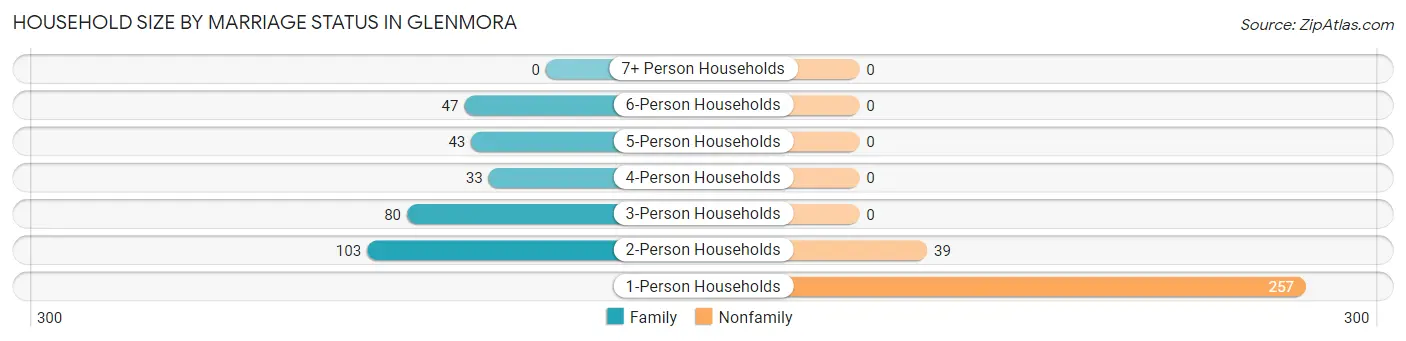
| Household Size | Family Households | Nonfamily Households |
| 1-Person Households | - | 257 (42.7%) |
| 2-Person Households | 103 (17.1%) | 39 (6.5%) |
| 3-Person Households | 80 (13.3%) | 0 (0.0%) |
| 4-Person Households | 33 (5.5%) | 0 (0.0%) |
| 5-Person Households | 43 (7.1%) | 0 (0.0%) |
| 6-Person Households | 47 (7.8%) | 0 (0.0%) |
| 7+ Person Households | 0 (0.0%) | 0 (0.0%) |
| Total | 306 (50.8%) | 296 (49.2%) |
Female Fertility in Glenmora
Fertility by Age in Glenmora
Average fertility rate in Glenmora is 109.0 births per 1,000 women. Women in the age bracket of 20 to 34 years have the highest fertility rate with 200.0 births per 1,000 women. Women in the age bracket of 20 to 34 years acount for 91.9% of all women with births.
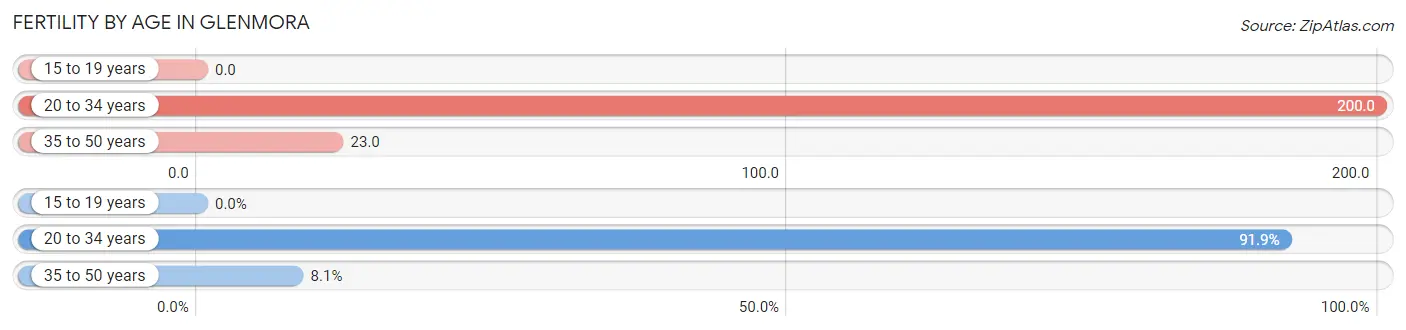
| Age Bracket | Women with Births | Births / 1,000 Women |
| 15 to 19 years | 0 (0.0%) | 0.0 |
| 20 to 34 years | 34 (91.9%) | 200.0 |
| 35 to 50 years | 3 (8.1%) | 23.0 |
| Total | 37 (100.0%) | 109.0 |
Fertility by Age by Marriage Status in Glenmora
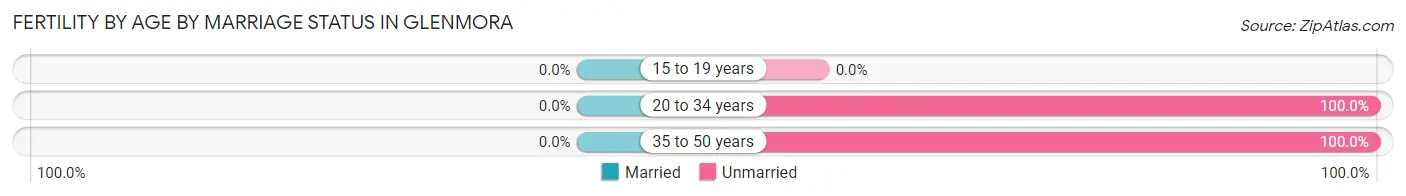
| Age Bracket | Married | Unmarried |
| 15 to 19 years | 0 (0.0%) | 0 (0.0%) |
| 20 to 34 years | 0 (0.0%) | 34 (100.0%) |
| 35 to 50 years | 0 (0.0%) | 3 (100.0%) |
| Total | 0 (0.0%) | 37 (100.0%) |
Fertility by Education in Glenmora
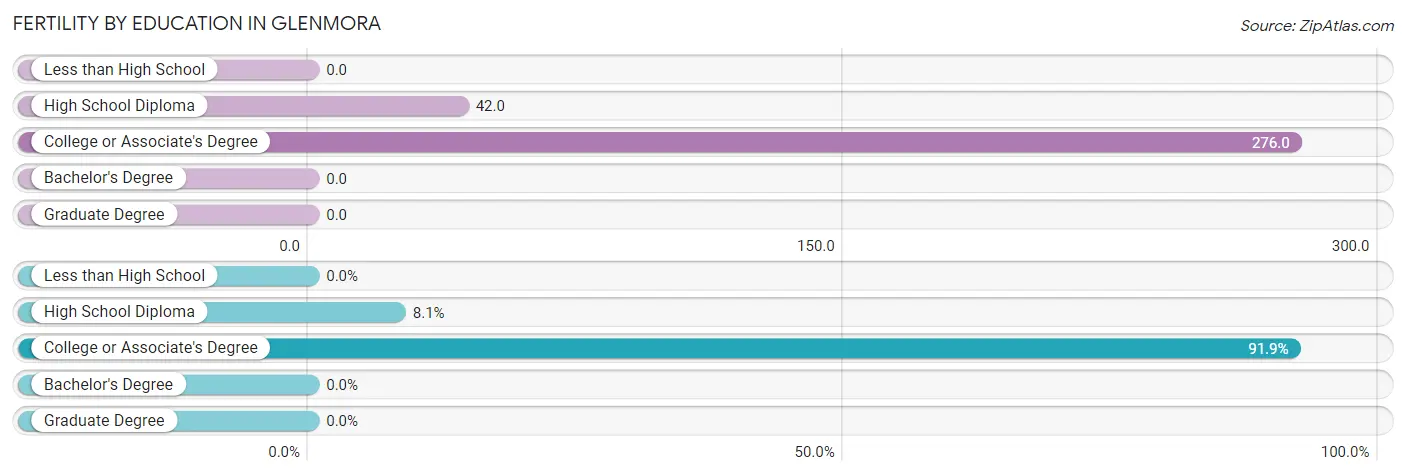
| Educational Attainment | Women with Births | Births / 1,000 Women |
| Less than High School | 0 (0.0%) | 0.0 |
| High School Diploma | 3 (8.1%) | 42.0 |
| College or Associate's Degree | 34 (91.9%) | 276.0 |
| Bachelor's Degree | 0 (0.0%) | 0.0 |
| Graduate Degree | 0 (0.0%) | 0.0 |
| Total | 37 (100.0%) | 109.0 |
Fertility by Education by Marriage Status in Glenmora
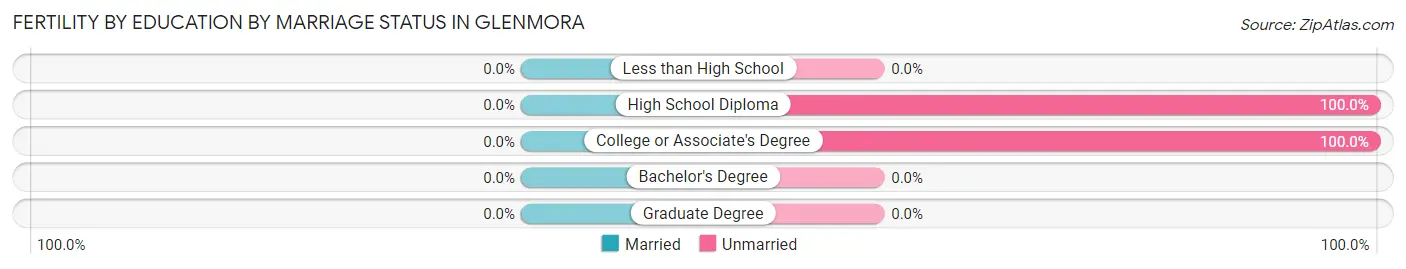
| Educational Attainment | Married | Unmarried |
| Less than High School | 0 (0.0%) | 0 (0.0%) |
| High School Diploma | 0 (0.0%) | 3 (100.0%) |
| College or Associate's Degree | 0 (0.0%) | 34 (100.0%) |
| Bachelor's Degree | 0 (0.0%) | 0 (0.0%) |
| Graduate Degree | 0 (0.0%) | 0 (0.0%) |
| Total | 0 (0.0%) | 37 (100.0%) |
Employment Characteristics in Glenmora
Employment by Class of Employer in Glenmora
Among the 638 employed individuals in Glenmora, private company employees (340 | 53.3%), self-employed (not incorporated) (102 | 16.0%), and federal government employees (66 | 10.3%) make up the most common classes of employment.
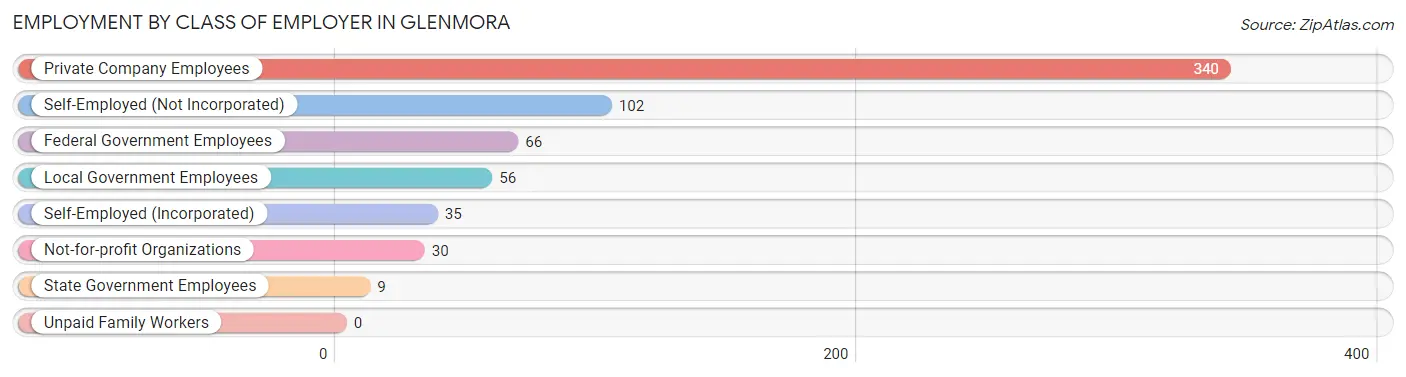
| Employer Class | # Employees | % Employees |
| Private Company Employees | 340 | 53.3% |
| Self-Employed (Incorporated) | 35 | 5.5% |
| Self-Employed (Not Incorporated) | 102 | 16.0% |
| Not-for-profit Organizations | 30 | 4.7% |
| Local Government Employees | 56 | 8.8% |
| State Government Employees | 9 | 1.4% |
| Federal Government Employees | 66 | 10.3% |
| Unpaid Family Workers | 0 | 0.0% |
| Total | 638 | 100.0% |
Employment Status by Age in Glenmora
According to the labor force statistics for Glenmora, out of the total population over 16 years of age (1,103), 62.4% or 688 individuals are in the labor force, with 6.8% or 47 of them unemployed. The age group with the highest labor force participation rate is 20 to 24 years, with 100.0% or 53 individuals in the labor force. Within the labor force, the 60 to 64 years age range has the highest percentage of unemployed individuals, with 28.3% or 17 of them being unemployed.
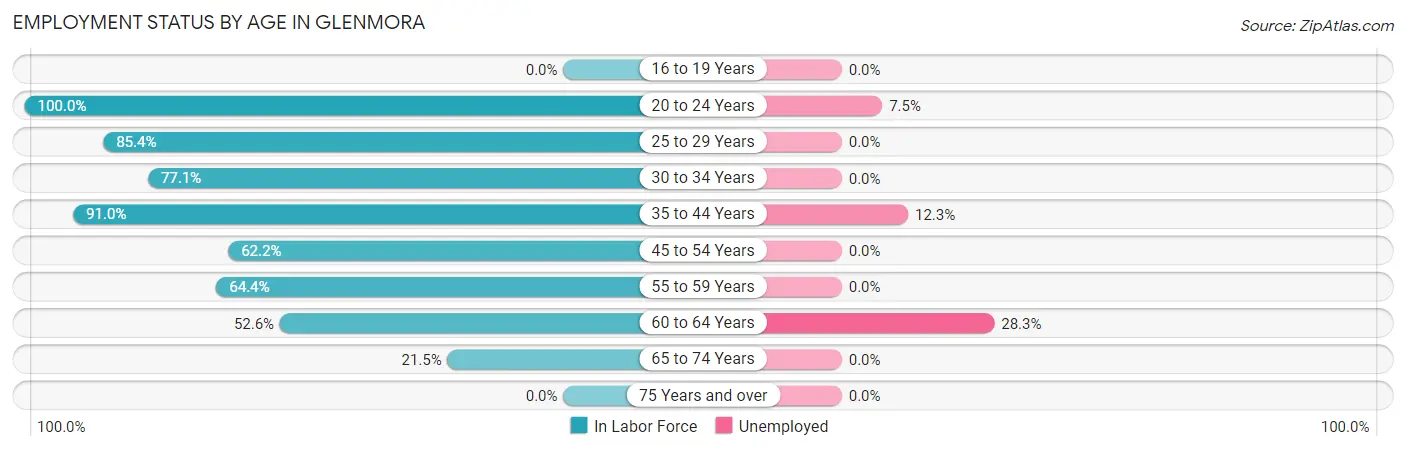
| Age Bracket | In Labor Force | Unemployed |
| 16 to 19 Years | 0 (0.0%) | 0 (0.0%) |
| 20 to 24 Years | 53 (100.0%) | 4 (7.5%) |
| 25 to 29 Years | 134 (85.4%) | 0 (0.0%) |
| 30 to 34 Years | 81 (77.1%) | 0 (0.0%) |
| 35 to 44 Years | 212 (91.0%) | 26 (12.3%) |
| 45 to 54 Years | 69 (62.2%) | 0 (0.0%) |
| 55 to 59 Years | 56 (64.4%) | 0 (0.0%) |
| 60 to 64 Years | 60 (52.6%) | 17 (28.3%) |
| 65 to 74 Years | 23 (21.5%) | 0 (0.0%) |
| 75 Years and over | 0 (0.0%) | 0 (0.0%) |
| Total | 688 (62.4%) | 47 (6.8%) |
Employment Status by Educational Attainment in Glenmora
According to labor force statistics for Glenmora, 75.8% of individuals (612) out of the total population between 25 and 64 years of age (807) are in the labor force, with 7.0% or 43 of them being unemployed. The group with the highest labor force participation rate are those with the educational attainment of less than high school, with 83.5% or 132 individuals in the labor force. Within the labor force, individuals with bachelor's degree or higher education have the highest percentage of unemployment, with 23.6% or 17 of them being unemployed.
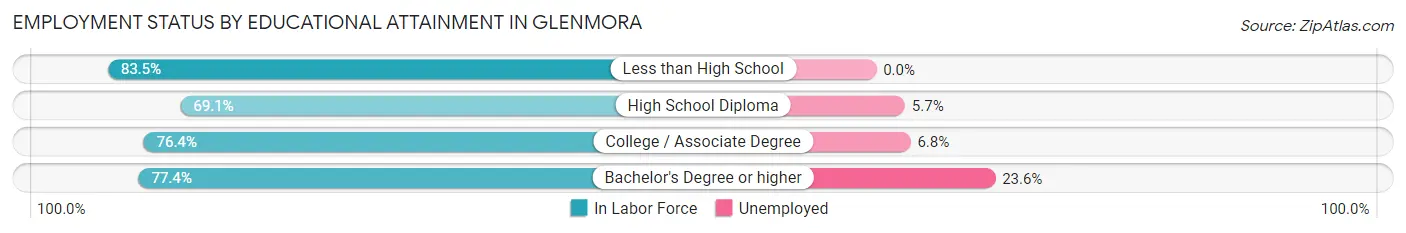
| Educational Attainment | In Labor Force | Unemployed |
| Less than High School | 132 (83.5%) | 0 (0.0%) |
| High School Diploma | 159 (69.1%) | 13 (5.7%) |
| College / Associate Degree | 249 (76.4%) | 22 (6.8%) |
| Bachelor's Degree or higher | 72 (77.4%) | 22 (23.6%) |
| Total | 612 (75.8%) | 56 (7.0%) |
Employment Occupations by Sex in Glenmora
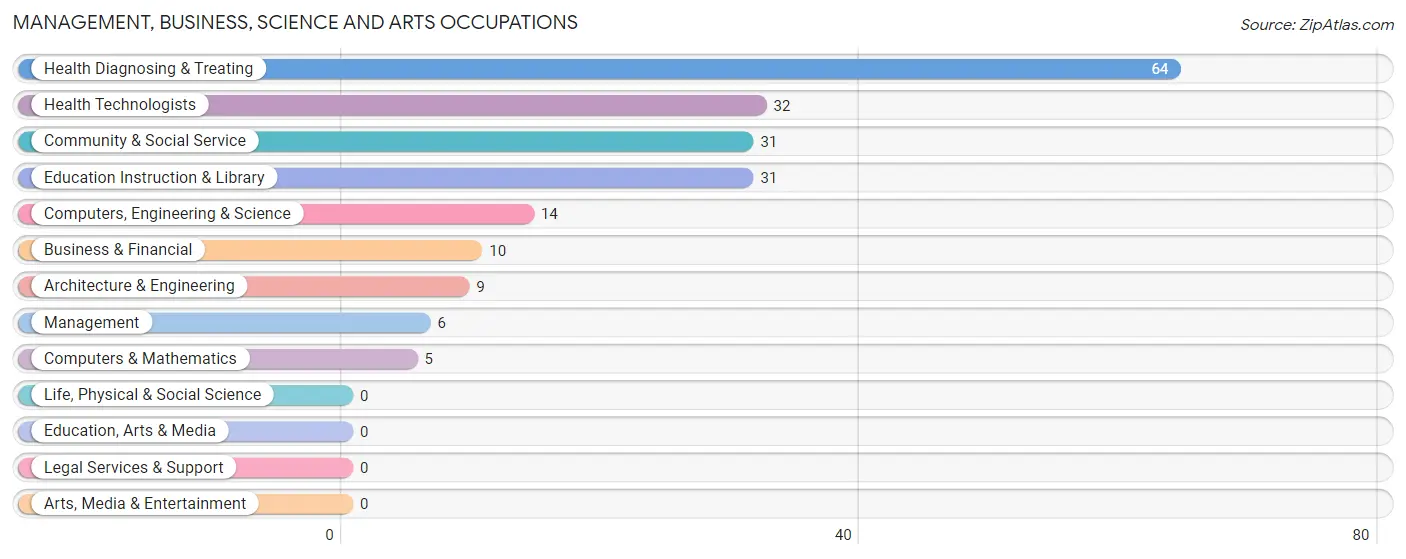
Management, Business, Science and Arts Occupations
The most common Management, Business, Science and Arts occupations in Glenmora are Health Diagnosing & Treating (64 | 10.0%), Health Technologists (32 | 5.0%), Community & Social Service (31 | 4.8%), Education Instruction & Library (31 | 4.8%), and Computers, Engineering & Science (14 | 2.2%).
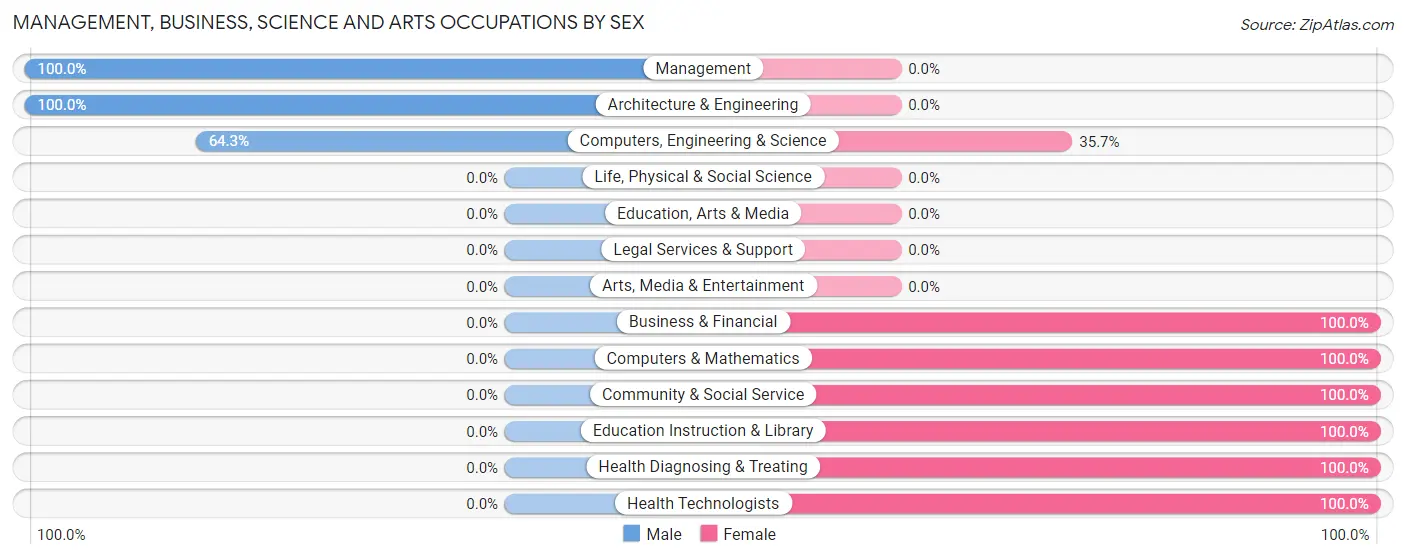
Management, Business, Science and Arts Occupations by Sex
Within the Management, Business, Science and Arts occupations in Glenmora, the most male-oriented occupations are Management (100.0%), Architecture & Engineering (100.0%), and Computers, Engineering & Science (64.3%), while the most female-oriented occupations are Business & Financial (100.0%), Computers & Mathematics (100.0%), and Community & Social Service (100.0%).
| Occupation | Male | Female |
| Management | 6 (100.0%) | 0 (0.0%) |
| Business & Financial | 0 (0.0%) | 10 (100.0%) |
| Computers, Engineering & Science | 9 (64.3%) | 5 (35.7%) |
| Computers & Mathematics | 0 (0.0%) | 5 (100.0%) |
| Architecture & Engineering | 9 (100.0%) | 0 (0.0%) |
| Life, Physical & Social Science | 0 (0.0%) | 0 (0.0%) |
| Community & Social Service | 0 (0.0%) | 31 (100.0%) |
| Education, Arts & Media | 0 (0.0%) | 0 (0.0%) |
| Legal Services & Support | 0 (0.0%) | 0 (0.0%) |
| Education Instruction & Library | 0 (0.0%) | 31 (100.0%) |
| Arts, Media & Entertainment | 0 (0.0%) | 0 (0.0%) |
| Health Diagnosing & Treating | 0 (0.0%) | 64 (100.0%) |
| Health Technologists | 0 (0.0%) | 32 (100.0%) |
| Total (Category) | 15 (12.0%) | 110 (88.0%) |
| Total (Overall) | 351 (54.8%) | 290 (45.2%) |
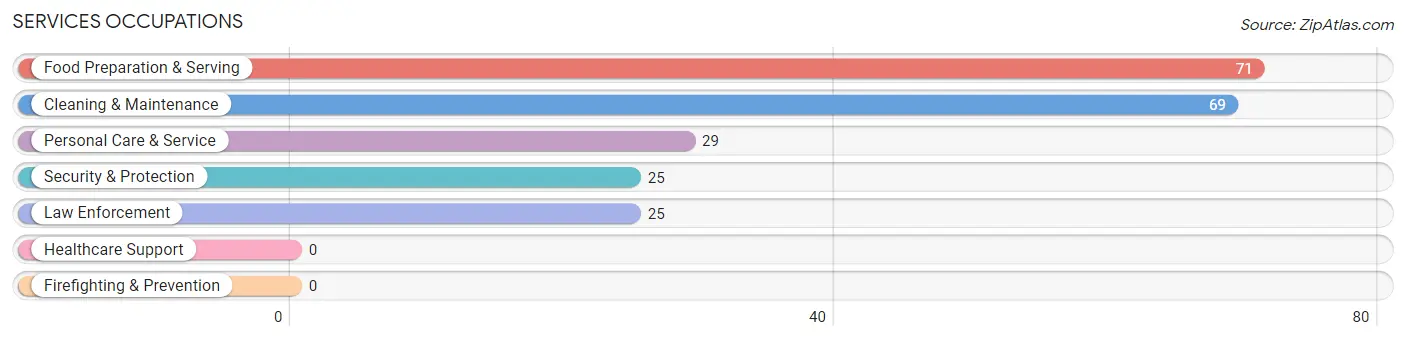
Services Occupations
The most common Services occupations in Glenmora are Food Preparation & Serving (71 | 11.1%), Cleaning & Maintenance (69 | 10.8%), Personal Care & Service (29 | 4.5%), Security & Protection (25 | 3.9%), and Law Enforcement (25 | 3.9%).
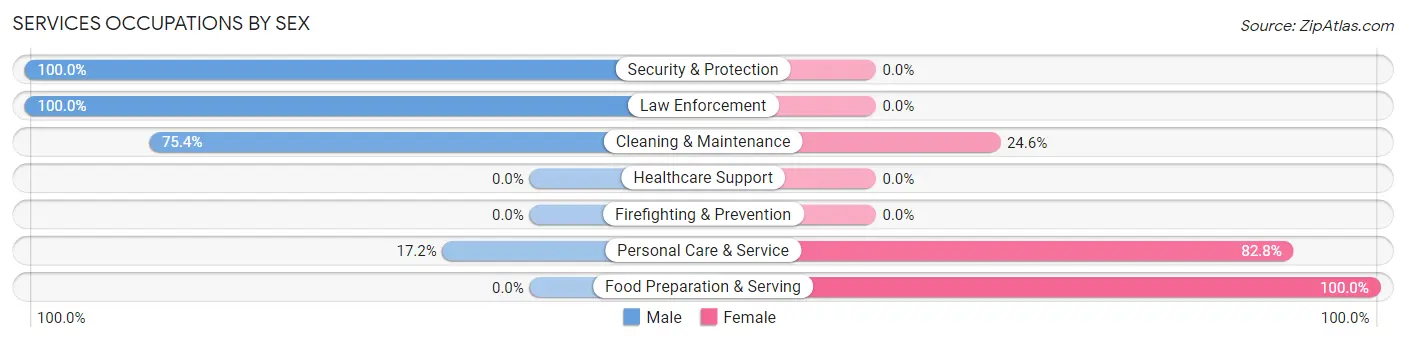
Services Occupations by Sex
Within the Services occupations in Glenmora, the most male-oriented occupations are Security & Protection (100.0%), Law Enforcement (100.0%), and Cleaning & Maintenance (75.4%), while the most female-oriented occupations are Food Preparation & Serving (100.0%), Personal Care & Service (82.8%), and Cleaning & Maintenance (24.6%).
| Occupation | Male | Female |
| Healthcare Support | 0 (0.0%) | 0 (0.0%) |
| Security & Protection | 25 (100.0%) | 0 (0.0%) |
| Firefighting & Prevention | 0 (0.0%) | 0 (0.0%) |
| Law Enforcement | 25 (100.0%) | 0 (0.0%) |
| Food Preparation & Serving | 0 (0.0%) | 71 (100.0%) |
| Cleaning & Maintenance | 52 (75.4%) | 17 (24.6%) |
| Personal Care & Service | 5 (17.2%) | 24 (82.8%) |
| Total (Category) | 82 (42.3%) | 112 (57.7%) |
| Total (Overall) | 351 (54.8%) | 290 (45.2%) |
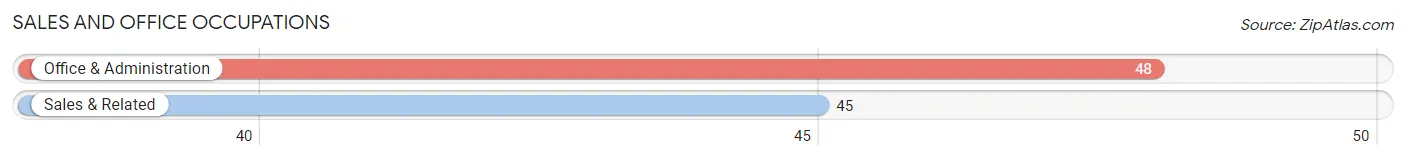
Sales and Office Occupations
The most common Sales and Office occupations in Glenmora are Office & Administration (48 | 7.5%), and Sales & Related (45 | 7.0%).
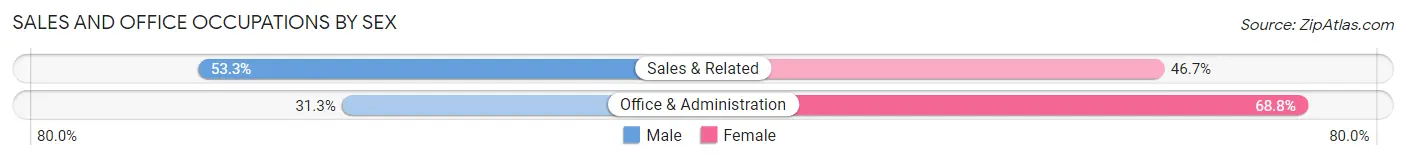
Sales and Office Occupations by Sex
| Occupation | Male | Female |
| Sales & Related | 24 (53.3%) | 21 (46.7%) |
| Office & Administration | 15 (31.2%) | 33 (68.8%) |
| Total (Category) | 39 (41.9%) | 54 (58.1%) |
| Total (Overall) | 351 (54.8%) | 290 (45.2%) |
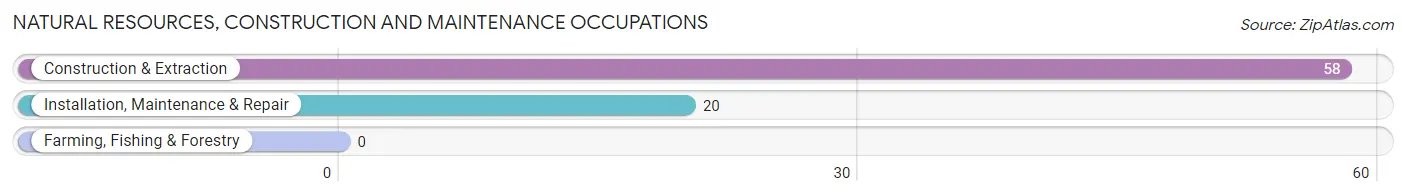
Natural Resources, Construction and Maintenance Occupations
The most common Natural Resources, Construction and Maintenance occupations in Glenmora are Construction & Extraction (58 | 9.0%), and Installation, Maintenance & Repair (20 | 3.1%).
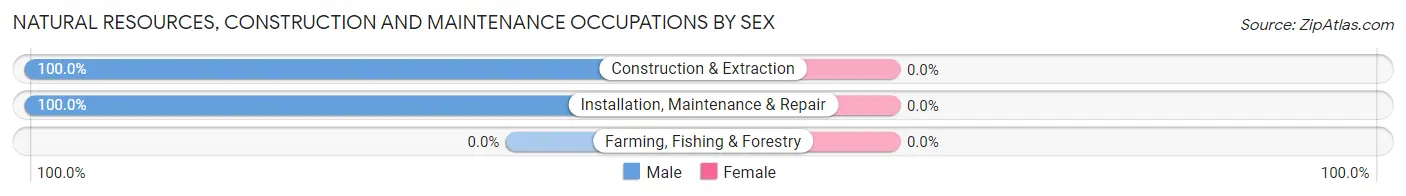
Natural Resources, Construction and Maintenance Occupations by Sex
| Occupation | Male | Female |
| Farming, Fishing & Forestry | 0 (0.0%) | 0 (0.0%) |
| Construction & Extraction | 58 (100.0%) | 0 (0.0%) |
| Installation, Maintenance & Repair | 20 (100.0%) | 0 (0.0%) |
| Total (Category) | 78 (100.0%) | 0 (0.0%) |
| Total (Overall) | 351 (54.8%) | 290 (45.2%) |
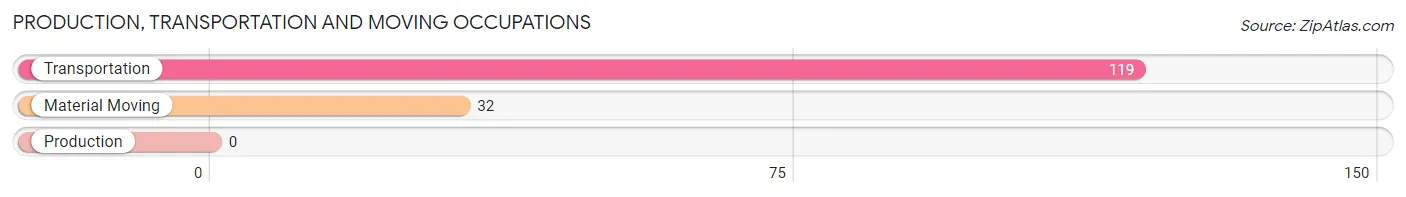
Production, Transportation and Moving Occupations
The most common Production, Transportation and Moving occupations in Glenmora are Transportation (119 | 18.6%), and Material Moving (32 | 5.0%).
Production, Transportation and Moving Occupations by Sex
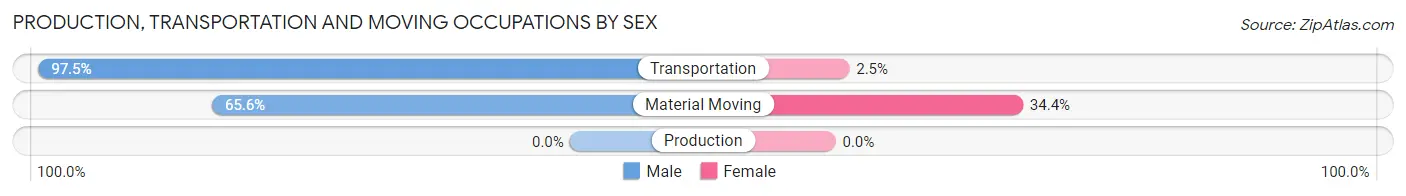
| Occupation | Male | Female |
| Production | 0 (0.0%) | 0 (0.0%) |
| Transportation | 116 (97.5%) | 3 (2.5%) |
| Material Moving | 21 (65.6%) | 11 (34.4%) |
| Total (Category) | 137 (90.7%) | 14 (9.3%) |
| Total (Overall) | 351 (54.8%) | 290 (45.2%) |
Employment Industries by Sex in Glenmora
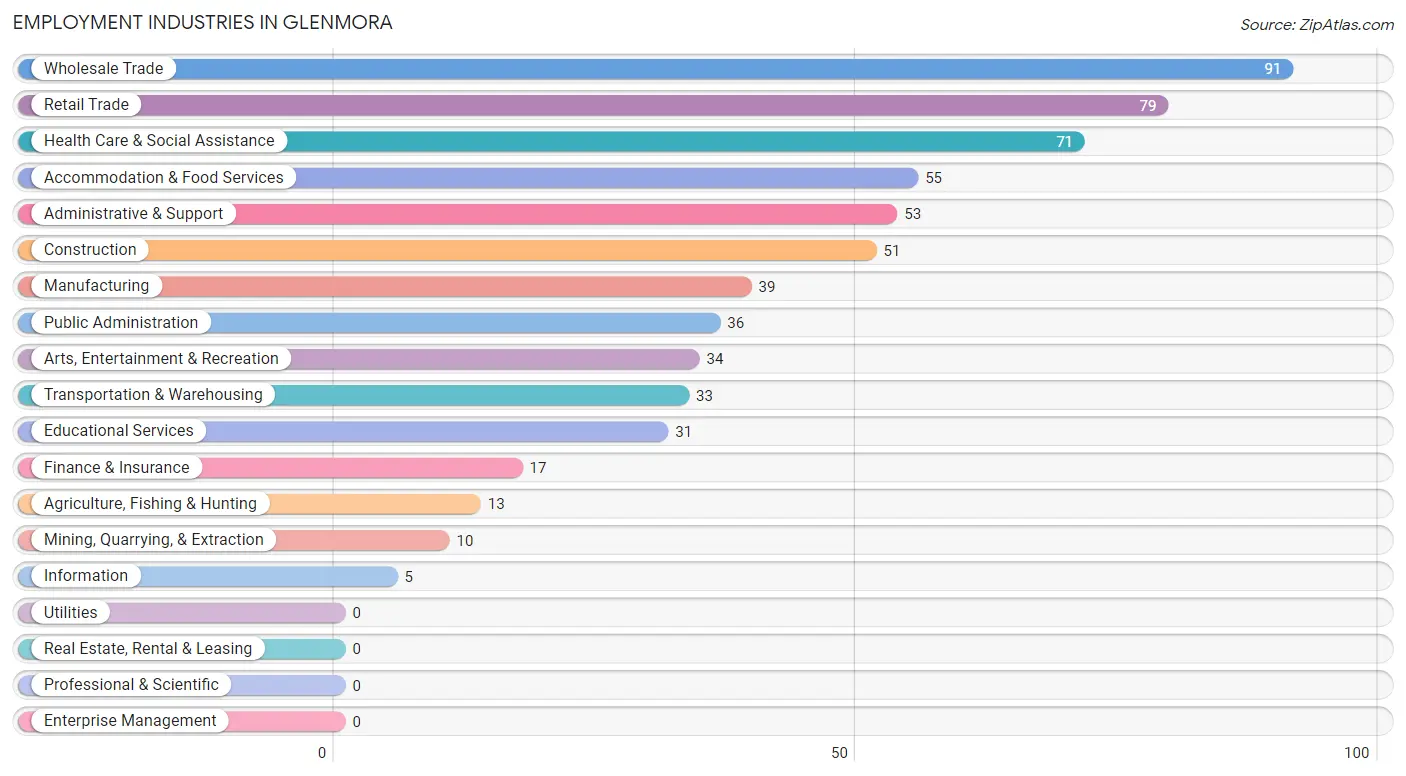
Employment Industries in Glenmora
The major employment industries in Glenmora include Wholesale Trade (91 | 14.2%), Retail Trade (79 | 12.3%), Health Care & Social Assistance (71 | 11.1%), Accommodation & Food Services (55 | 8.6%), and Administrative & Support (53 | 8.3%).
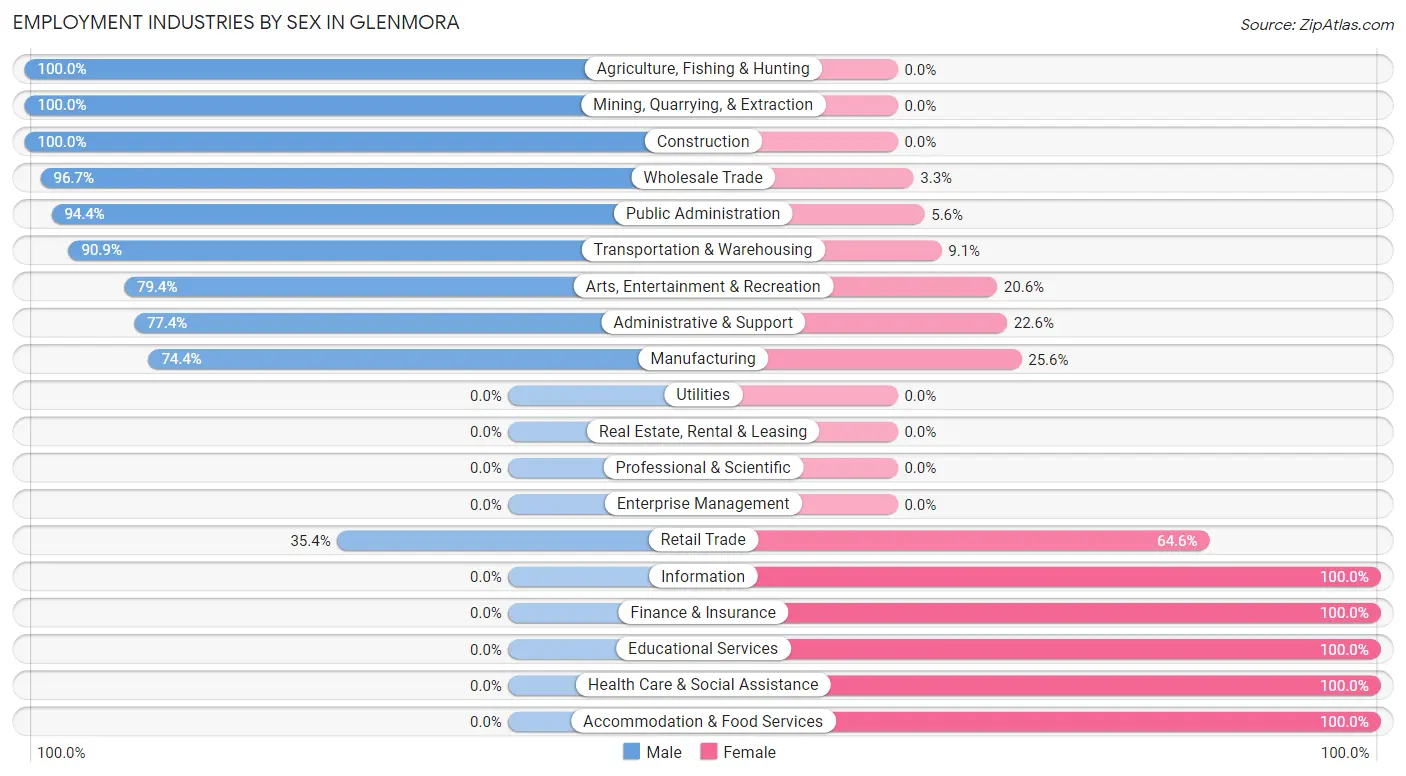
Employment Industries by Sex in Glenmora
The Glenmora industries that see more men than women are Agriculture, Fishing & Hunting (100.0%), Mining, Quarrying, & Extraction (100.0%), and Construction (100.0%), whereas the industries that tend to have a higher number of women are Information (100.0%), Finance & Insurance (100.0%), and Educational Services (100.0%).
| Industry | Male | Female |
| Agriculture, Fishing & Hunting | 13 (100.0%) | 0 (0.0%) |
| Mining, Quarrying, & Extraction | 10 (100.0%) | 0 (0.0%) |
| Construction | 51 (100.0%) | 0 (0.0%) |
| Manufacturing | 29 (74.4%) | 10 (25.6%) |
| Wholesale Trade | 88 (96.7%) | 3 (3.3%) |
| Retail Trade | 28 (35.4%) | 51 (64.6%) |
| Transportation & Warehousing | 30 (90.9%) | 3 (9.1%) |
| Utilities | 0 (0.0%) | 0 (0.0%) |
| Information | 0 (0.0%) | 5 (100.0%) |
| Finance & Insurance | 0 (0.0%) | 17 (100.0%) |
| Real Estate, Rental & Leasing | 0 (0.0%) | 0 (0.0%) |
| Professional & Scientific | 0 (0.0%) | 0 (0.0%) |
| Enterprise Management | 0 (0.0%) | 0 (0.0%) |
| Administrative & Support | 41 (77.4%) | 12 (22.6%) |
| Educational Services | 0 (0.0%) | 31 (100.0%) |
| Health Care & Social Assistance | 0 (0.0%) | 71 (100.0%) |
| Arts, Entertainment & Recreation | 27 (79.4%) | 7 (20.6%) |
| Accommodation & Food Services | 0 (0.0%) | 55 (100.0%) |
| Public Administration | 34 (94.4%) | 2 (5.6%) |
| Total | 351 (54.8%) | 290 (45.2%) |
Education in Glenmora
School Enrollment in Glenmora
The most common levels of schooling among the 447 students in Glenmora are middle school (102 | 22.8%), elementary school (94 | 21.0%), and high school (81 | 18.1%).
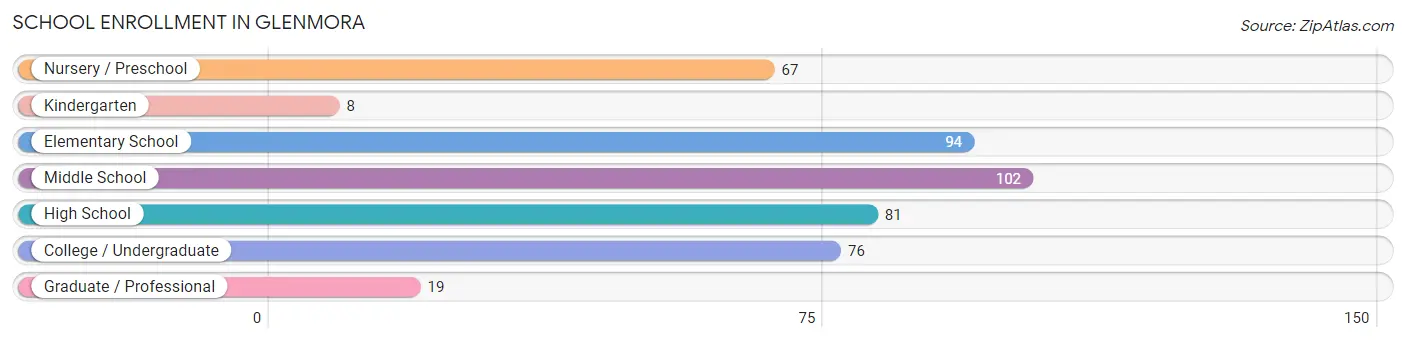
| School Level | # Students | % Students |
| Nursery / Preschool | 67 | 15.0% |
| Kindergarten | 8 | 1.8% |
| Elementary School | 94 | 21.0% |
| Middle School | 102 | 22.8% |
| High School | 81 | 18.1% |
| College / Undergraduate | 76 | 17.0% |
| Graduate / Professional | 19 | 4.3% |
| Total | 447 | 100.0% |
School Enrollment by Age by Funding Source in Glenmora
Out of a total of 447 students who are enrolled in schools in Glenmora, 17 (3.8%) attend a private institution, while the remaining 430 (96.2%) are enrolled in public schools. The age group of 25 to 34 year olds has the highest likelihood of being enrolled in private schools, with 6 (16.2% in the age bracket) enrolled. Conversely, the age group of 3 to 4 year olds has the lowest likelihood of being enrolled in a private school, with 67 (100.0% in the age bracket) attending a public institution.
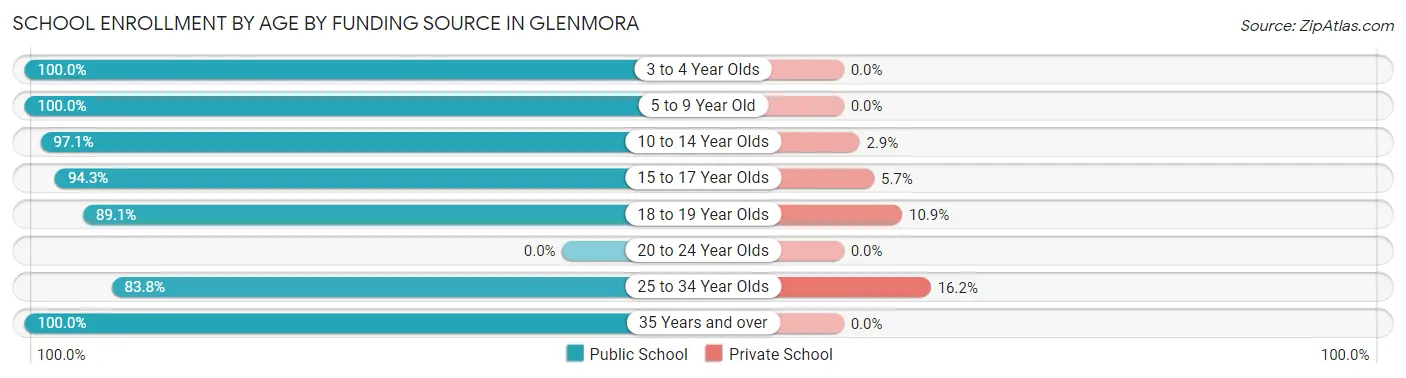
| Age Bracket | Public School | Private School |
| 3 to 4 Year Olds | 67 (100.0%) | 0 (0.0%) |
| 5 to 9 Year Old | 102 (100.0%) | 0 (0.0%) |
| 10 to 14 Year Olds | 99 (97.1%) | 3 (2.9%) |
| 15 to 17 Year Olds | 50 (94.3%) | 3 (5.7%) |
| 18 to 19 Year Olds | 41 (89.1%) | 5 (10.9%) |
| 20 to 24 Year Olds | 0 (0.0%) | 0 (0.0%) |
| 25 to 34 Year Olds | 31 (83.8%) | 6 (16.2%) |
| 35 Years and over | 40 (100.0%) | 0 (0.0%) |
| Total | 430 (96.2%) | 17 (3.8%) |
Educational Attainment by Field of Study in Glenmora
Business (28 | 26.4%), science & technology (24 | 22.6%), education (20 | 18.9%), literature & languages (16 | 15.1%), and bio, nature & agricultural (12 | 11.3%) are the most common fields of study among 106 individuals in Glenmora who have obtained a bachelor's degree or higher.
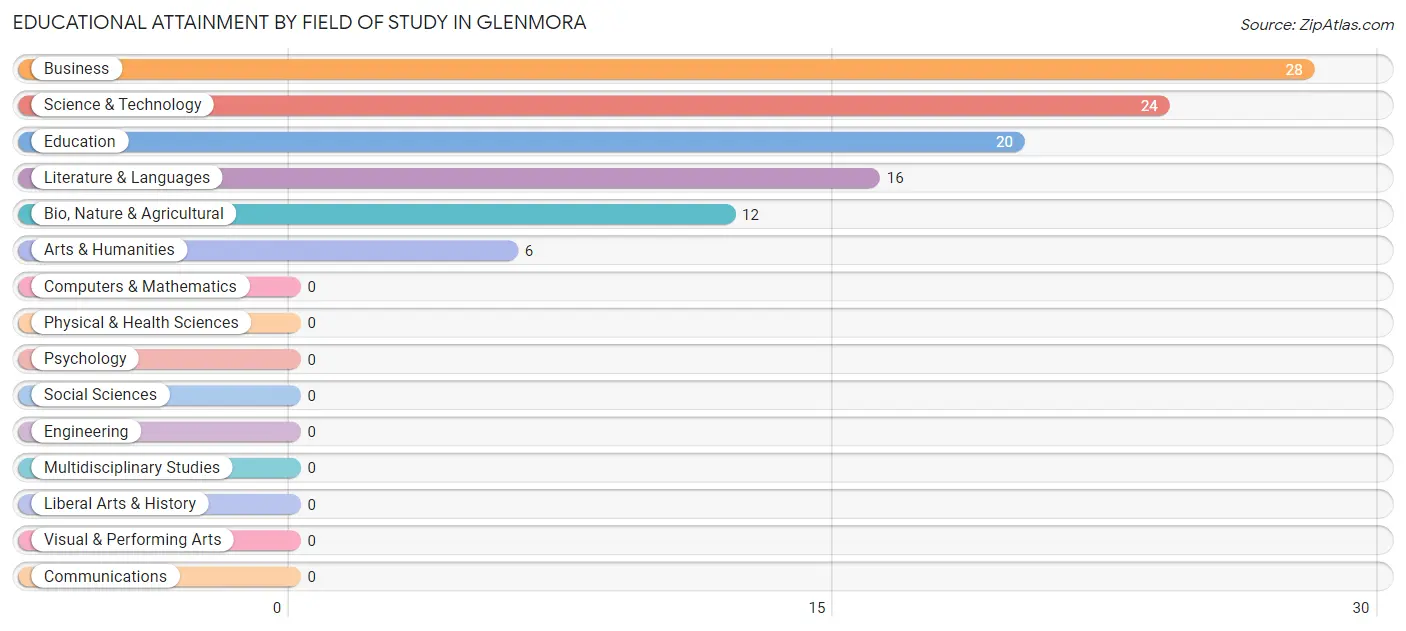
| Field of Study | # Graduates | % Graduates |
| Computers & Mathematics | 0 | 0.0% |
| Bio, Nature & Agricultural | 12 | 11.3% |
| Physical & Health Sciences | 0 | 0.0% |
| Psychology | 0 | 0.0% |
| Social Sciences | 0 | 0.0% |
| Engineering | 0 | 0.0% |
| Multidisciplinary Studies | 0 | 0.0% |
| Science & Technology | 24 | 22.6% |
| Business | 28 | 26.4% |
| Education | 20 | 18.9% |
| Literature & Languages | 16 | 15.1% |
| Liberal Arts & History | 0 | 0.0% |
| Visual & Performing Arts | 0 | 0.0% |
| Communications | 0 | 0.0% |
| Arts & Humanities | 6 | 5.7% |
| Total | 106 | 100.0% |
Transportation & Commute in Glenmora
Vehicle Availability by Sex in Glenmora
The most prevalent vehicle ownership categories in Glenmora are males with 1 vehicle (151, accounting for 43.0%) and females with 1 vehicle (105, making up 52.6%).
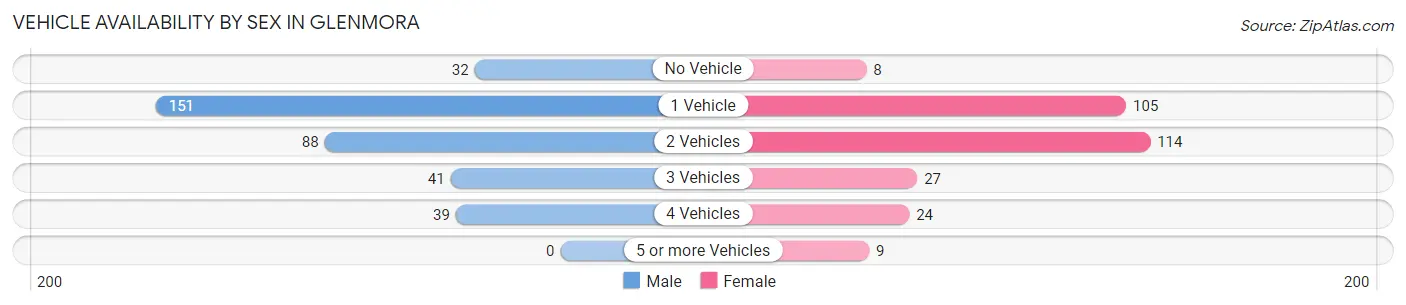
| Vehicles Available | Male | Female |
| No Vehicle | 32 (9.1%) | 8 (2.8%) |
| 1 Vehicle | 151 (43.0%) | 105 (36.6%) |
| 2 Vehicles | 88 (25.1%) | 114 (39.7%) |
| 3 Vehicles | 41 (11.7%) | 27 (9.4%) |
| 4 Vehicles | 39 (11.1%) | 24 (8.4%) |
| 5 or more Vehicles | 0 (0.0%) | 9 (3.1%) |
| Total | 351 (100.0%) | 287 (100.0%) |
Commute Time in Glenmora
The most frequently occuring commute durations in Glenmora are 5 to 9 minutes (165 commuters, 26.6%), 30 to 34 minutes (104 commuters, 16.8%), and 90 or more minutes (63 commuters, 10.2%).
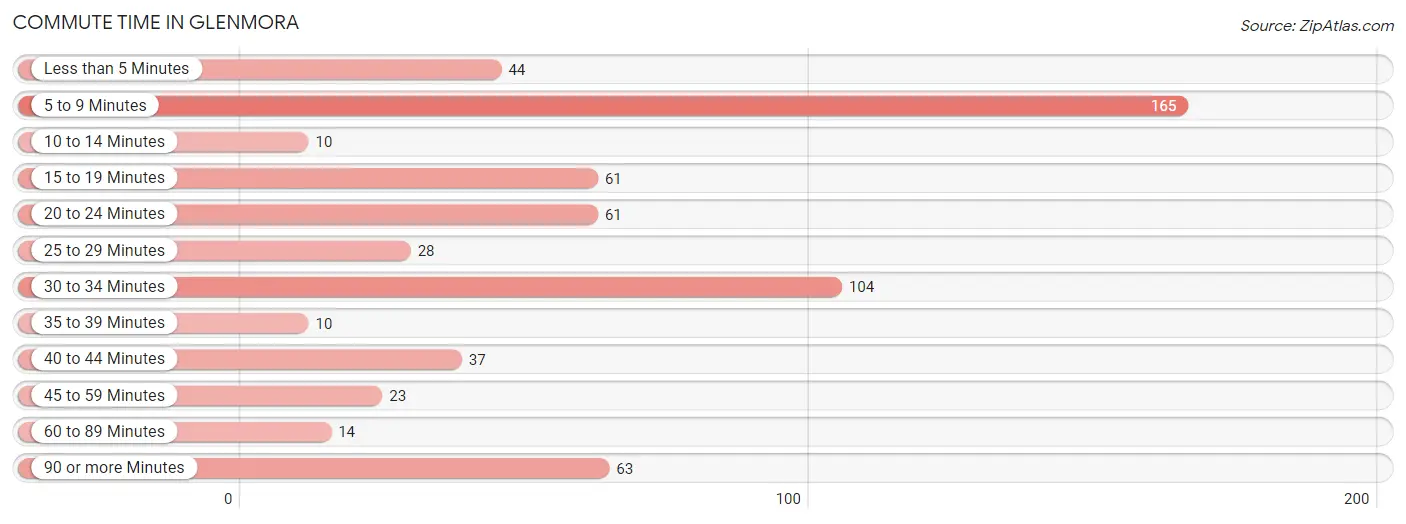
| Commute Time | # Commuters | % Commuters |
| Less than 5 Minutes | 44 | 7.1% |
| 5 to 9 Minutes | 165 | 26.6% |
| 10 to 14 Minutes | 10 | 1.6% |
| 15 to 19 Minutes | 61 | 9.8% |
| 20 to 24 Minutes | 61 | 9.8% |
| 25 to 29 Minutes | 28 | 4.5% |
| 30 to 34 Minutes | 104 | 16.8% |
| 35 to 39 Minutes | 10 | 1.6% |
| 40 to 44 Minutes | 37 | 6.0% |
| 45 to 59 Minutes | 23 | 3.7% |
| 60 to 89 Minutes | 14 | 2.3% |
| 90 or more Minutes | 63 | 10.2% |
Commute Time by Sex in Glenmora
The most common commute times in Glenmora are 5 to 9 minutes (136 commuters, 39.8%) for males and 30 to 34 minutes (58 commuters, 20.9%) for females.
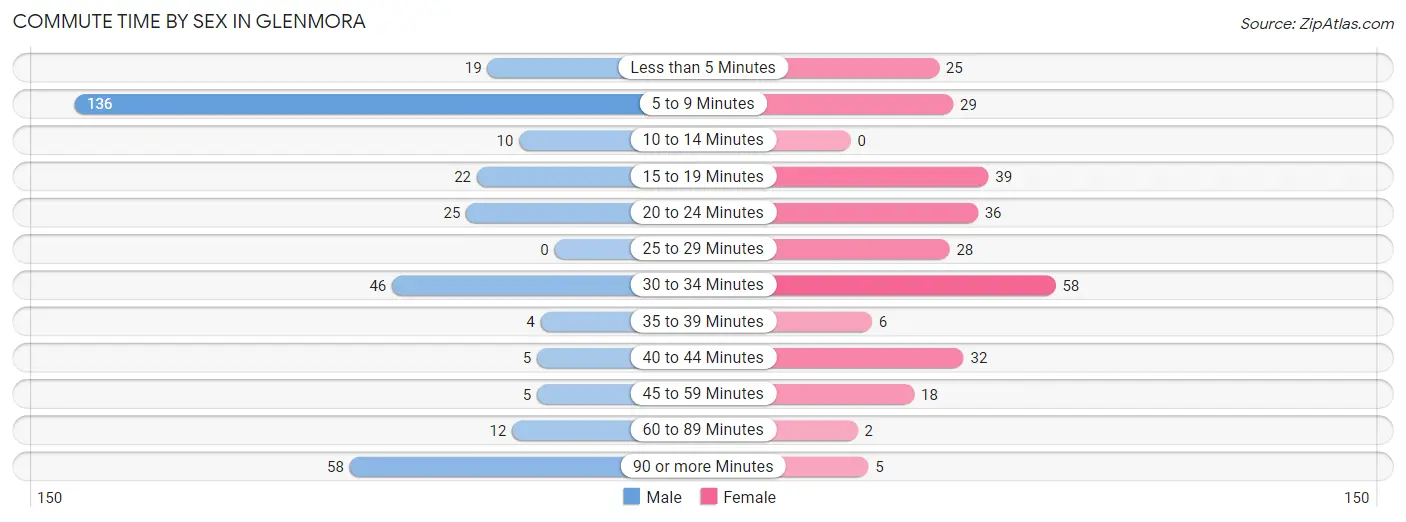
| Commute Time | Male | Female |
| Less than 5 Minutes | 19 (5.6%) | 25 (9.0%) |
| 5 to 9 Minutes | 136 (39.8%) | 29 (10.4%) |
| 10 to 14 Minutes | 10 (2.9%) | 0 (0.0%) |
| 15 to 19 Minutes | 22 (6.4%) | 39 (14.0%) |
| 20 to 24 Minutes | 25 (7.3%) | 36 (13.0%) |
| 25 to 29 Minutes | 0 (0.0%) | 28 (10.1%) |
| 30 to 34 Minutes | 46 (13.5%) | 58 (20.9%) |
| 35 to 39 Minutes | 4 (1.2%) | 6 (2.2%) |
| 40 to 44 Minutes | 5 (1.5%) | 32 (11.5%) |
| 45 to 59 Minutes | 5 (1.5%) | 18 (6.5%) |
| 60 to 89 Minutes | 12 (3.5%) | 2 (0.7%) |
| 90 or more Minutes | 58 (17.0%) | 5 (1.8%) |
Time of Departure to Work by Sex in Glenmora
The most frequent times of departure to work in Glenmora are 8:00 AM to 8:29 AM (88, 25.7%) for males and 7:00 AM to 7:29 AM (77, 27.7%) for females.
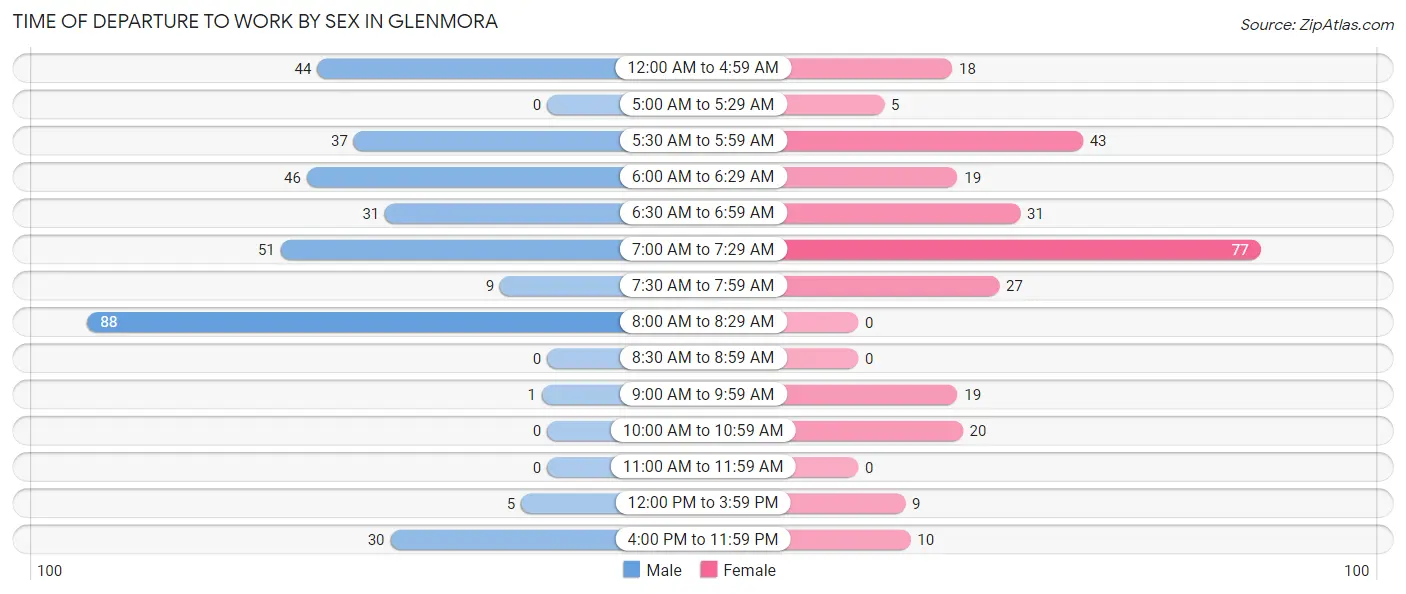
| Time of Departure | Male | Female |
| 12:00 AM to 4:59 AM | 44 (12.9%) | 18 (6.5%) |
| 5:00 AM to 5:29 AM | 0 (0.0%) | 5 (1.8%) |
| 5:30 AM to 5:59 AM | 37 (10.8%) | 43 (15.5%) |
| 6:00 AM to 6:29 AM | 46 (13.5%) | 19 (6.8%) |
| 6:30 AM to 6:59 AM | 31 (9.1%) | 31 (11.2%) |
| 7:00 AM to 7:29 AM | 51 (14.9%) | 77 (27.7%) |
| 7:30 AM to 7:59 AM | 9 (2.6%) | 27 (9.7%) |
| 8:00 AM to 8:29 AM | 88 (25.7%) | 0 (0.0%) |
| 8:30 AM to 8:59 AM | 0 (0.0%) | 0 (0.0%) |
| 9:00 AM to 9:59 AM | 1 (0.3%) | 19 (6.8%) |
| 10:00 AM to 10:59 AM | 0 (0.0%) | 20 (7.2%) |
| 11:00 AM to 11:59 AM | 0 (0.0%) | 0 (0.0%) |
| 12:00 PM to 3:59 PM | 5 (1.5%) | 9 (3.2%) |
| 4:00 PM to 11:59 PM | 30 (8.8%) | 10 (3.6%) |
| Total | 342 (100.0%) | 278 (100.0%) |
Housing Occupancy in Glenmora
Occupancy by Ownership in Glenmora
Of the total 602 dwellings in Glenmora, owner-occupied units account for 379 (63.0%), while renter-occupied units make up 223 (37.0%).
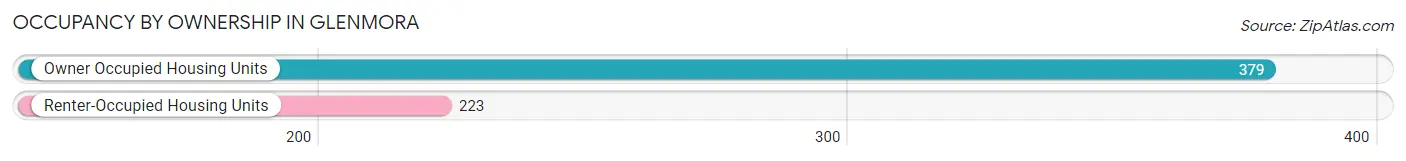
| Occupancy | # Housing Units | % Housing Units |
| Owner Occupied Housing Units | 379 | 63.0% |
| Renter-Occupied Housing Units | 223 | 37.0% |
| Total Occupied Housing Units | 602 | 100.0% |
Occupancy by Household Size in Glenmora
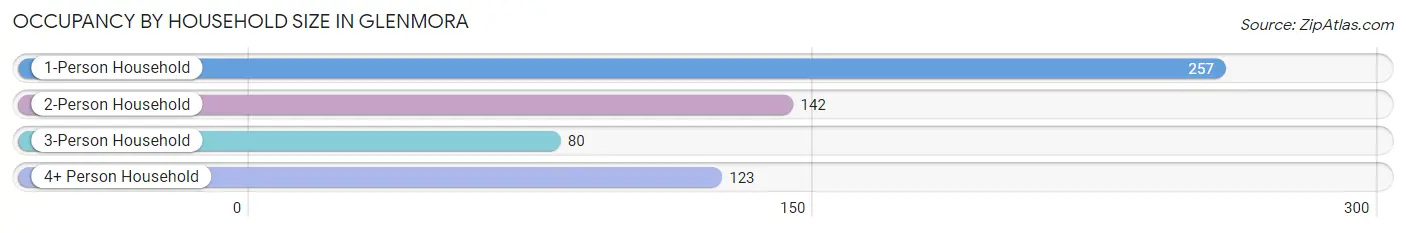
| Household Size | # Housing Units | % Housing Units |
| 1-Person Household | 257 | 42.7% |
| 2-Person Household | 142 | 23.6% |
| 3-Person Household | 80 | 13.3% |
| 4+ Person Household | 123 | 20.4% |
| Total Housing Units | 602 | 100.0% |
Occupancy by Ownership by Household Size in Glenmora
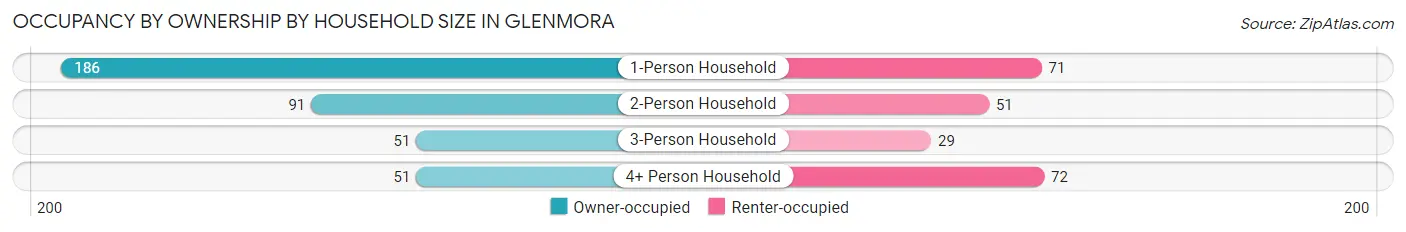
| Household Size | Owner-occupied | Renter-occupied |
| 1-Person Household | 186 (72.4%) | 71 (27.6%) |
| 2-Person Household | 91 (64.1%) | 51 (35.9%) |
| 3-Person Household | 51 (63.7%) | 29 (36.2%) |
| 4+ Person Household | 51 (41.5%) | 72 (58.5%) |
| Total Housing Units | 379 (63.0%) | 223 (37.0%) |
Occupancy by Educational Attainment in Glenmora
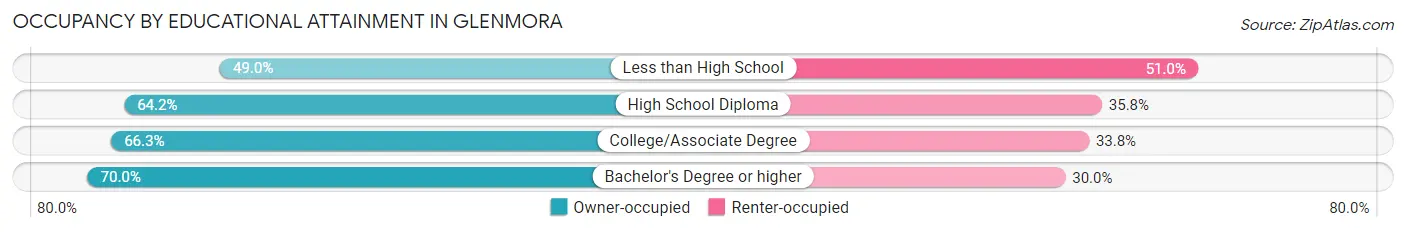
| Household Size | Owner-occupied | Renter-occupied |
| Less than High School | 49 (49.0%) | 51 (51.0%) |
| High School Diploma | 104 (64.2%) | 58 (35.8%) |
| College/Associate Degree | 212 (66.2%) | 108 (33.8%) |
| Bachelor's Degree or higher | 14 (70.0%) | 6 (30.0%) |
Occupancy by Age of Householder in Glenmora
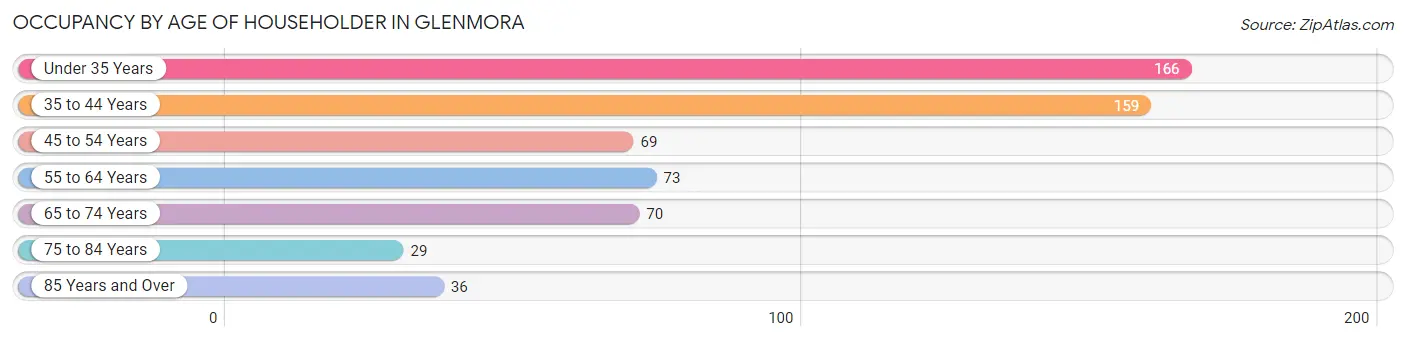
| Age Bracket | # Households | % Households |
| Under 35 Years | 166 | 27.6% |
| 35 to 44 Years | 159 | 26.4% |
| 45 to 54 Years | 69 | 11.5% |
| 55 to 64 Years | 73 | 12.1% |
| 65 to 74 Years | 70 | 11.6% |
| 75 to 84 Years | 29 | 4.8% |
| 85 Years and Over | 36 | 6.0% |
| Total | 602 | 100.0% |
Housing Finances in Glenmora
Median Income by Occupancy in Glenmora
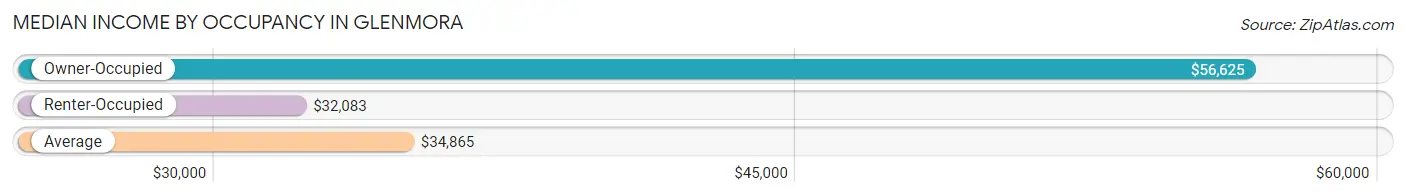
| Occupancy Type | # Households | Median Income |
| Owner-Occupied | 379 (63.0%) | $56,625 |
| Renter-Occupied | 223 (37.0%) | $32,083 |
| Average | 602 (100.0%) | $34,865 |
Occupancy by Householder Income Bracket in Glenmora
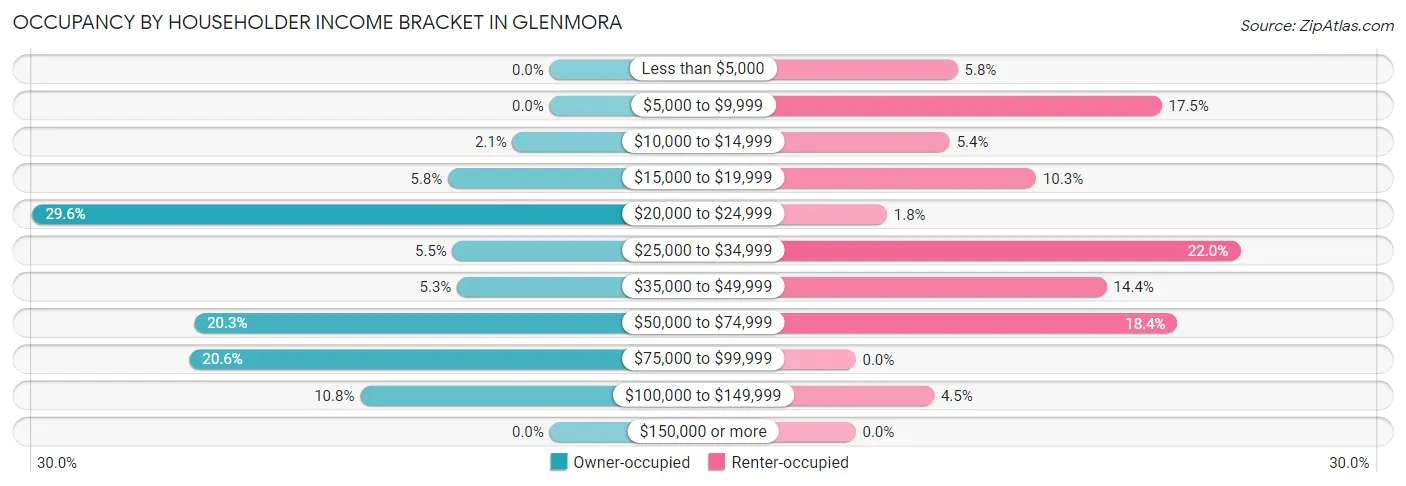
| Income Bracket | Owner-occupied | Renter-occupied |
| Less than $5,000 | 0 (0.0%) | 13 (5.8%) |
| $5,000 to $9,999 | 0 (0.0%) | 39 (17.5%) |
| $10,000 to $14,999 | 8 (2.1%) | 12 (5.4%) |
| $15,000 to $19,999 | 22 (5.8%) | 23 (10.3%) |
| $20,000 to $24,999 | 112 (29.5%) | 4 (1.8%) |
| $25,000 to $34,999 | 21 (5.5%) | 49 (22.0%) |
| $35,000 to $49,999 | 20 (5.3%) | 32 (14.3%) |
| $50,000 to $74,999 | 77 (20.3%) | 41 (18.4%) |
| $75,000 to $99,999 | 78 (20.6%) | 0 (0.0%) |
| $100,000 to $149,999 | 41 (10.8%) | 10 (4.5%) |
| $150,000 or more | 0 (0.0%) | 0 (0.0%) |
| Total | 379 (100.0%) | 223 (100.0%) |
Monthly Housing Cost Tiers in Glenmora
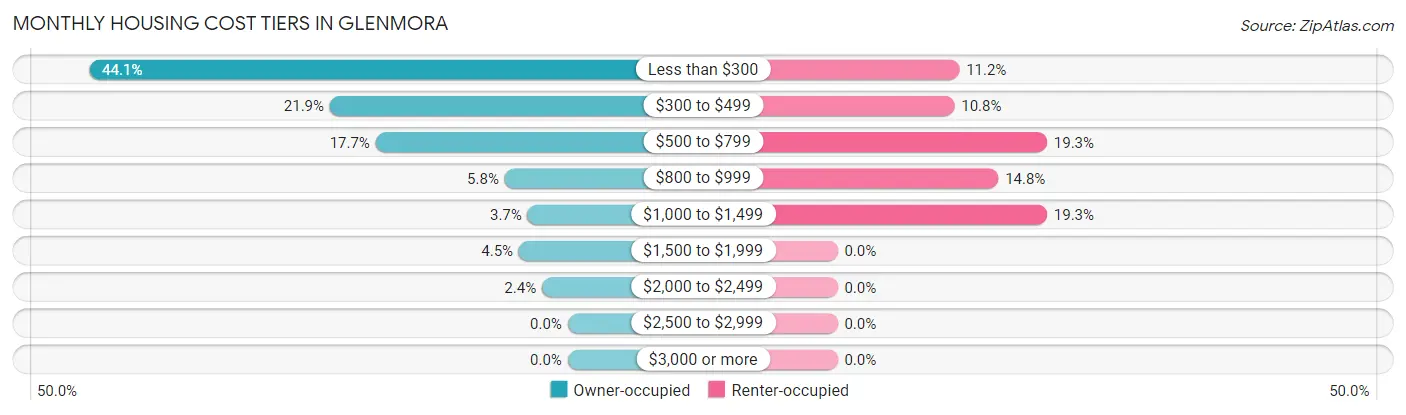
| Monthly Cost | Owner-occupied | Renter-occupied |
| Less than $300 | 167 (44.1%) | 25 (11.2%) |
| $300 to $499 | 83 (21.9%) | 24 (10.8%) |
| $500 to $799 | 67 (17.7%) | 43 (19.3%) |
| $800 to $999 | 22 (5.8%) | 33 (14.8%) |
| $1,000 to $1,499 | 14 (3.7%) | 43 (19.3%) |
| $1,500 to $1,999 | 17 (4.5%) | 0 (0.0%) |
| $2,000 to $2,499 | 9 (2.4%) | 0 (0.0%) |
| $2,500 to $2,999 | 0 (0.0%) | 0 (0.0%) |
| $3,000 or more | 0 (0.0%) | 0 (0.0%) |
| Total | 379 (100.0%) | 223 (100.0%) |
Physical Housing Characteristics in Glenmora
Housing Structures in Glenmora
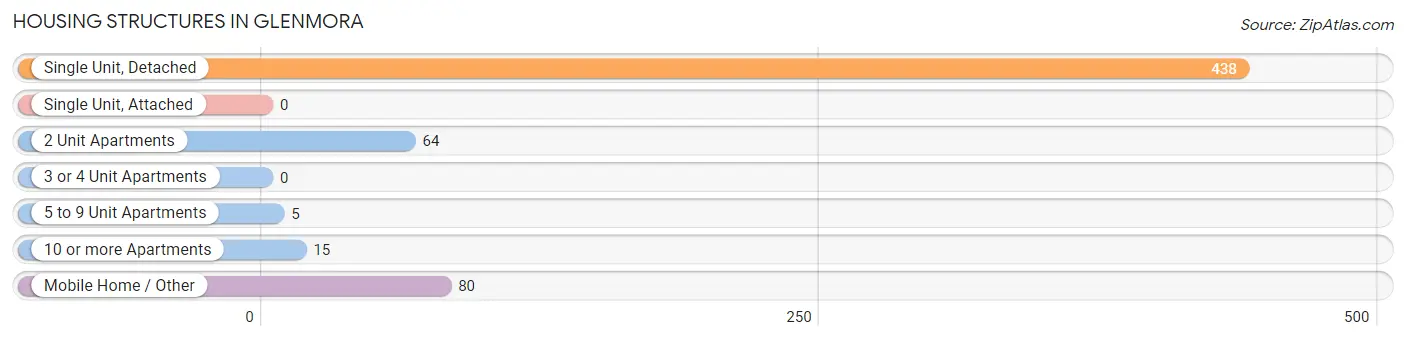
| Structure Type | # Housing Units | % Housing Units |
| Single Unit, Detached | 438 | 72.8% |
| Single Unit, Attached | 0 | 0.0% |
| 2 Unit Apartments | 64 | 10.6% |
| 3 or 4 Unit Apartments | 0 | 0.0% |
| 5 to 9 Unit Apartments | 5 | 0.8% |
| 10 or more Apartments | 15 | 2.5% |
| Mobile Home / Other | 80 | 13.3% |
| Total | 602 | 100.0% |
Housing Structures by Occupancy in Glenmora
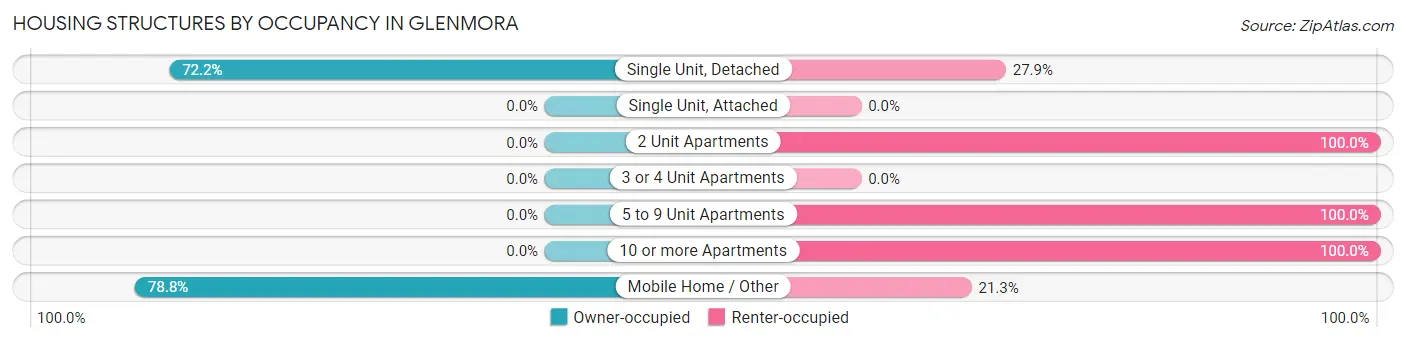
| Structure Type | Owner-occupied | Renter-occupied |
| Single Unit, Detached | 316 (72.2%) | 122 (27.9%) |
| Single Unit, Attached | 0 (0.0%) | 0 (0.0%) |
| 2 Unit Apartments | 0 (0.0%) | 64 (100.0%) |
| 3 or 4 Unit Apartments | 0 (0.0%) | 0 (0.0%) |
| 5 to 9 Unit Apartments | 0 (0.0%) | 5 (100.0%) |
| 10 or more Apartments | 0 (0.0%) | 15 (100.0%) |
| Mobile Home / Other | 63 (78.7%) | 17 (21.2%) |
| Total | 379 (63.0%) | 223 (37.0%) |
Housing Structures by Number of Rooms in Glenmora
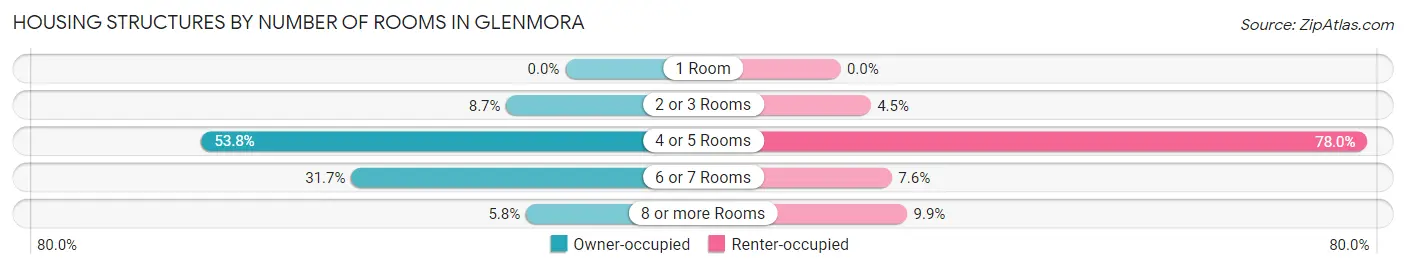
| Number of Rooms | Owner-occupied | Renter-occupied |
| 1 Room | 0 (0.0%) | 0 (0.0%) |
| 2 or 3 Rooms | 33 (8.7%) | 10 (4.5%) |
| 4 or 5 Rooms | 204 (53.8%) | 174 (78.0%) |
| 6 or 7 Rooms | 120 (31.7%) | 17 (7.6%) |
| 8 or more Rooms | 22 (5.8%) | 22 (9.9%) |
| Total | 379 (100.0%) | 223 (100.0%) |
Housing Structure by Heating Type in Glenmora
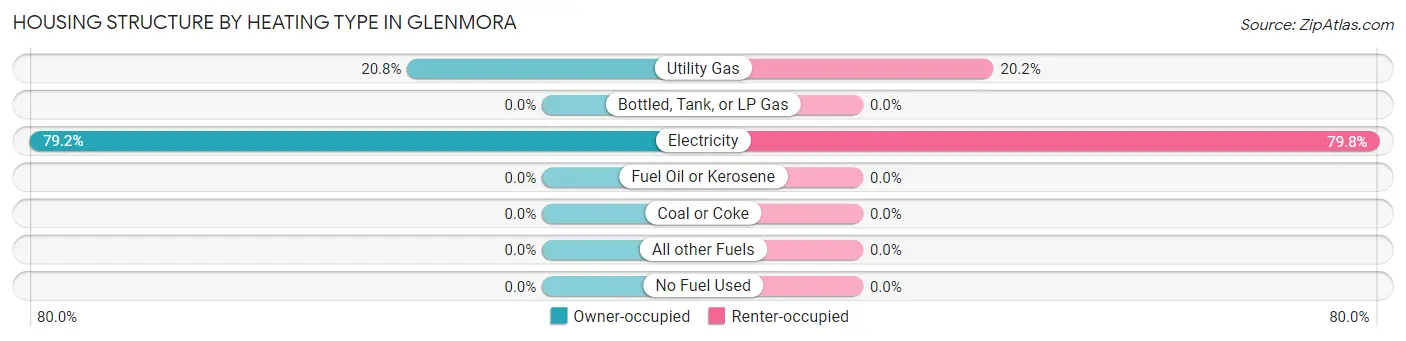
| Heating Type | Owner-occupied | Renter-occupied |
| Utility Gas | 79 (20.8%) | 45 (20.2%) |
| Bottled, Tank, or LP Gas | 0 (0.0%) | 0 (0.0%) |
| Electricity | 300 (79.2%) | 178 (79.8%) |
| Fuel Oil or Kerosene | 0 (0.0%) | 0 (0.0%) |
| Coal or Coke | 0 (0.0%) | 0 (0.0%) |
| All other Fuels | 0 (0.0%) | 0 (0.0%) |
| No Fuel Used | 0 (0.0%) | 0 (0.0%) |
| Total | 379 (100.0%) | 223 (100.0%) |
Household Vehicle Usage in Glenmora
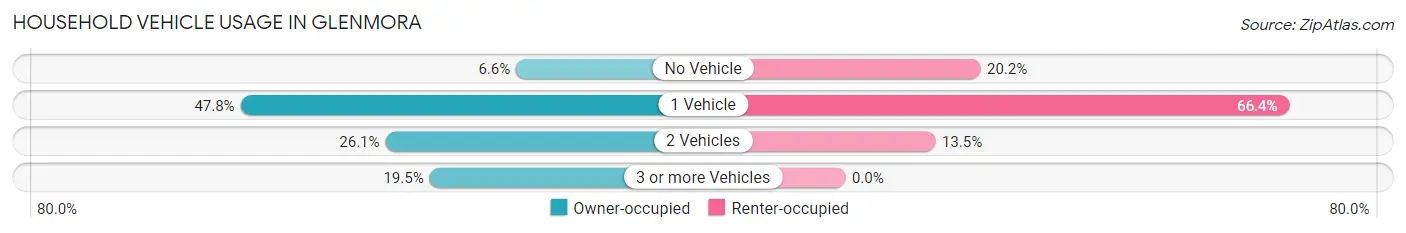
| Vehicles per Household | Owner-occupied | Renter-occupied |
| No Vehicle | 25 (6.6%) | 45 (20.2%) |
| 1 Vehicle | 181 (47.8%) | 148 (66.4%) |
| 2 Vehicles | 99 (26.1%) | 30 (13.5%) |
| 3 or more Vehicles | 74 (19.5%) | 0 (0.0%) |
| Total | 379 (100.0%) | 223 (100.0%) |
Real Estate & Mortgages in Glenmora
Real Estate and Mortgage Overview in Glenmora
| Characteristic | Without Mortgage | With Mortgage |
| Housing Units | 300 | 79 |
| Median Property Value | - | - |
| Median Household Income | $48,000 | $0 |
| Monthly Housing Costs | $234 | $0 |
| Real Estate Taxes | $199 | $14 |
Property Value by Mortgage Status in Glenmora
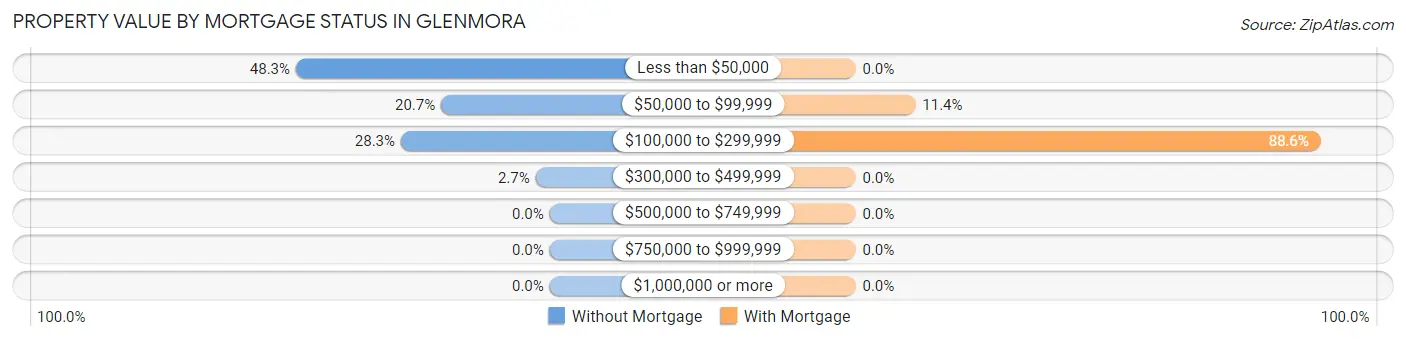
| Property Value | Without Mortgage | With Mortgage |
| Less than $50,000 | 145 (48.3%) | 0 (0.0%) |
| $50,000 to $99,999 | 62 (20.7%) | 9 (11.4%) |
| $100,000 to $299,999 | 85 (28.3%) | 70 (88.6%) |
| $300,000 to $499,999 | 8 (2.7%) | 0 (0.0%) |
| $500,000 to $749,999 | 0 (0.0%) | 0 (0.0%) |
| $750,000 to $999,999 | 0 (0.0%) | 0 (0.0%) |
| $1,000,000 or more | 0 (0.0%) | 0 (0.0%) |
| Total | 300 (100.0%) | 79 (100.0%) |
Household Income by Mortgage Status in Glenmora
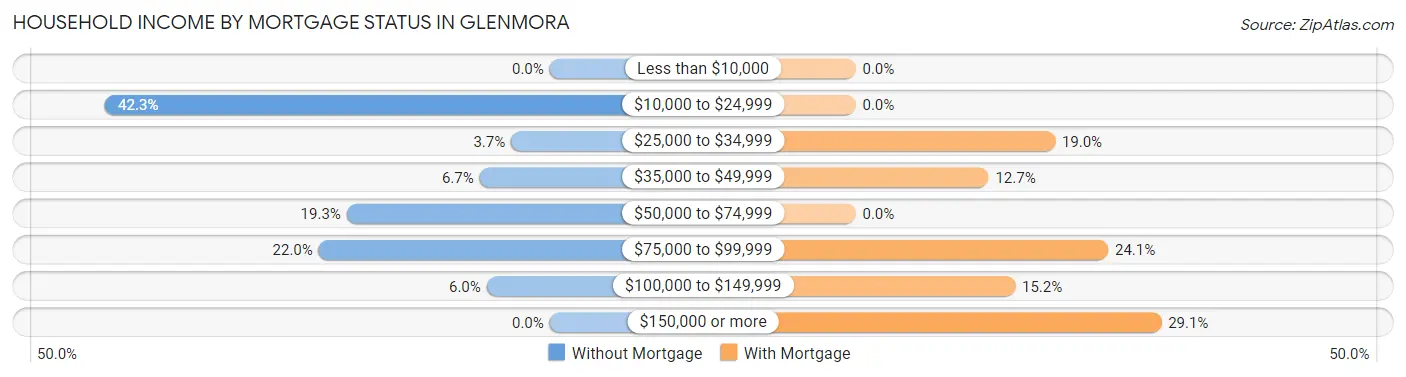
| Household Income | Without Mortgage | With Mortgage |
| Less than $10,000 | 0 (0.0%) | 0 (0.0%) |
| $10,000 to $24,999 | 127 (42.3%) | 0 (0.0%) |
| $25,000 to $34,999 | 11 (3.7%) | 15 (19.0%) |
| $35,000 to $49,999 | 20 (6.7%) | 10 (12.7%) |
| $50,000 to $74,999 | 58 (19.3%) | 0 (0.0%) |
| $75,000 to $99,999 | 66 (22.0%) | 19 (24.0%) |
| $100,000 to $149,999 | 18 (6.0%) | 12 (15.2%) |
| $150,000 or more | 0 (0.0%) | 23 (29.1%) |
| Total | 300 (100.0%) | 79 (100.0%) |
Property Value to Household Income Ratio in Glenmora
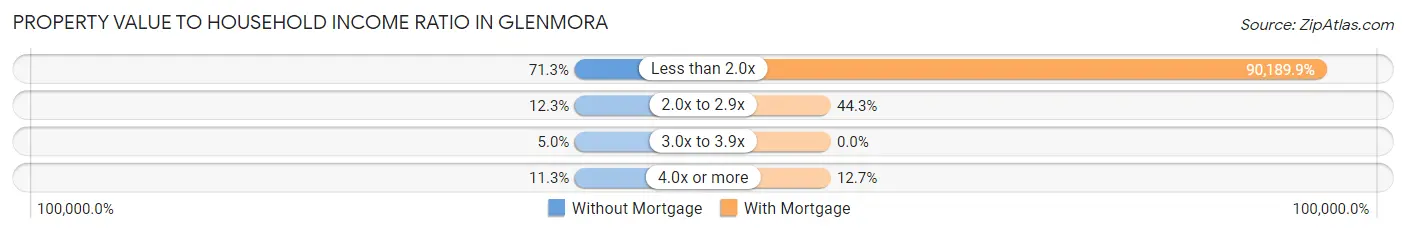
| Value-to-Income Ratio | Without Mortgage | With Mortgage |
| Less than 2.0x | 214 (71.3%) | 71,250 (90,189.9%) |
| 2.0x to 2.9x | 37 (12.3%) | 35 (44.3%) |
| 3.0x to 3.9x | 15 (5.0%) | 0 (0.0%) |
| 4.0x or more | 34 (11.3%) | 10 (12.7%) |
| Total | 300 (100.0%) | 79 (100.0%) |
Real Estate Taxes by Mortgage Status in Glenmora
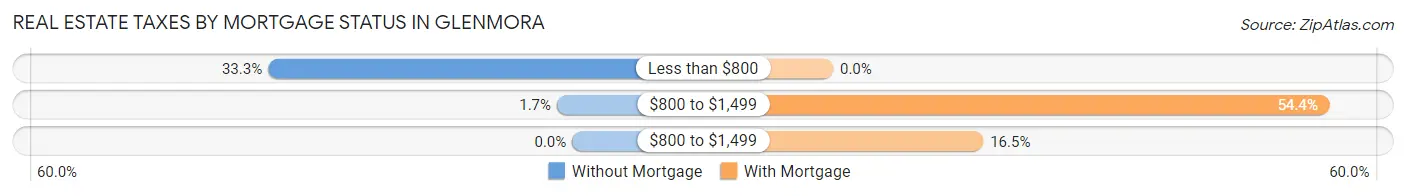
| Property Taxes | Without Mortgage | With Mortgage |
| Less than $800 | 100 (33.3%) | 0 (0.0%) |
| $800 to $1,499 | 5 (1.7%) | 43 (54.4%) |
| $800 to $1,499 | 0 (0.0%) | 13 (16.5%) |
| Total | 300 (100.0%) | 79 (100.0%) |
Health & Disability in Glenmora
Health Insurance Coverage by Age in Glenmora
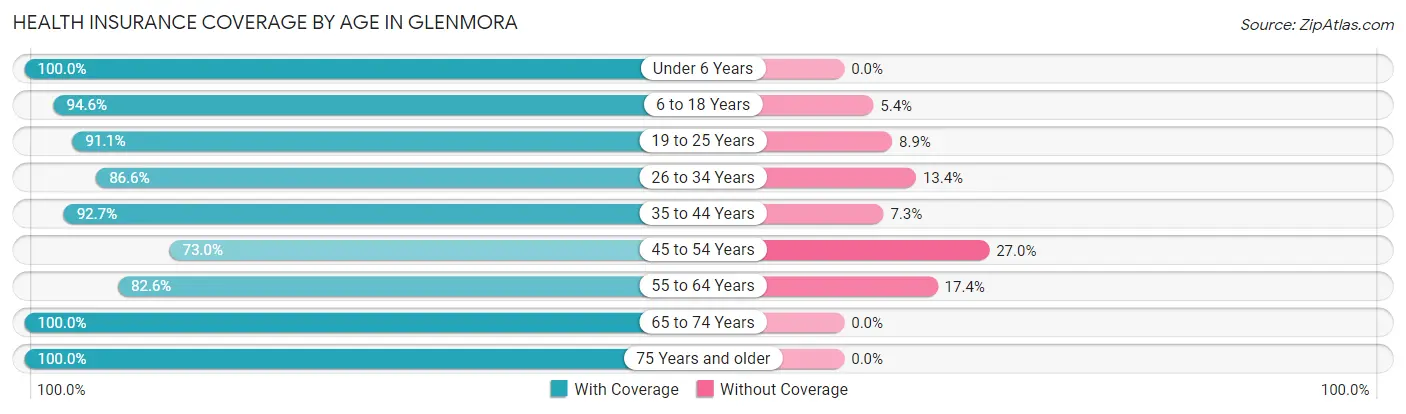
| Age Bracket | With Coverage | Without Coverage |
| Under 6 Years | 247 (100.0%) | 0 (0.0%) |
| 6 to 18 Years | 262 (94.6%) | 15 (5.4%) |
| 19 to 25 Years | 92 (91.1%) | 9 (8.9%) |
| 26 to 34 Years | 201 (86.6%) | 31 (13.4%) |
| 35 to 44 Years | 216 (92.7%) | 17 (7.3%) |
| 45 to 54 Years | 81 (73.0%) | 30 (27.0%) |
| 55 to 64 Years | 166 (82.6%) | 35 (17.4%) |
| 65 to 74 Years | 107 (100.0%) | 0 (0.0%) |
| 75 Years and older | 65 (100.0%) | 0 (0.0%) |
| Total | 1,437 (91.3%) | 137 (8.7%) |
Health Insurance Coverage by Citizenship Status in Glenmora
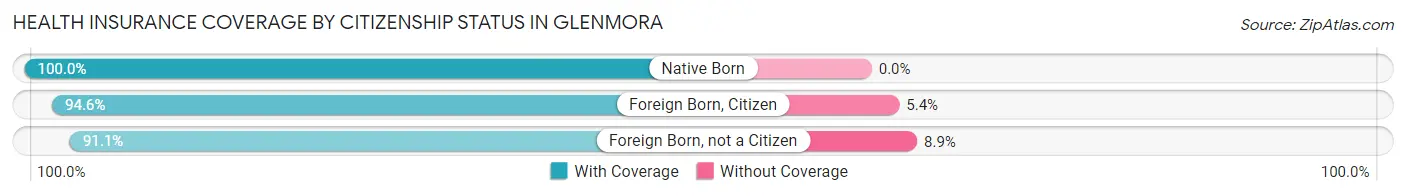
| Citizenship Status | With Coverage | Without Coverage |
| Native Born | 247 (100.0%) | 0 (0.0%) |
| Foreign Born, Citizen | 262 (94.6%) | 15 (5.4%) |
| Foreign Born, not a Citizen | 92 (91.1%) | 9 (8.9%) |
Health Insurance Coverage by Household Income in Glenmora
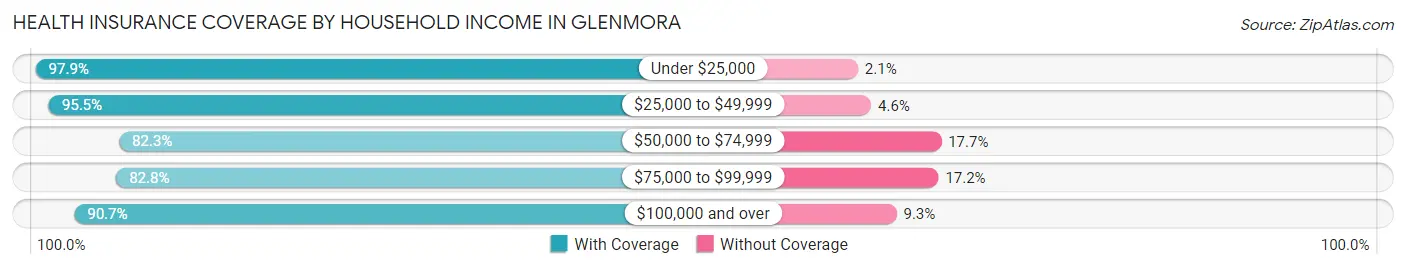
| Household Income | With Coverage | Without Coverage |
| Under $25,000 | 471 (97.9%) | 10 (2.1%) |
| $25,000 to $49,999 | 399 (95.5%) | 19 (4.5%) |
| $50,000 to $74,999 | 214 (82.3%) | 46 (17.7%) |
| $75,000 to $99,999 | 246 (82.8%) | 51 (17.2%) |
| $100,000 and over | 107 (90.7%) | 11 (9.3%) |
Public vs Private Health Insurance Coverage by Age in Glenmora
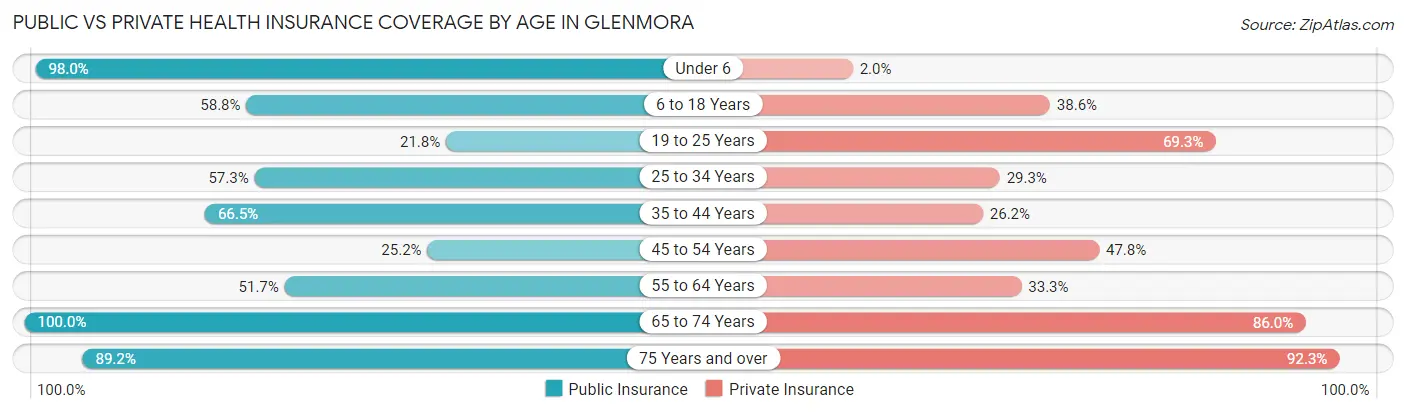
| Age Bracket | Public Insurance | Private Insurance |
| Under 6 | 242 (98.0%) | 5 (2.0%) |
| 6 to 18 Years | 163 (58.8%) | 107 (38.6%) |
| 19 to 25 Years | 22 (21.8%) | 70 (69.3%) |
| 25 to 34 Years | 133 (57.3%) | 68 (29.3%) |
| 35 to 44 Years | 155 (66.5%) | 61 (26.2%) |
| 45 to 54 Years | 28 (25.2%) | 53 (47.7%) |
| 55 to 64 Years | 104 (51.7%) | 67 (33.3%) |
| 65 to 74 Years | 107 (100.0%) | 92 (86.0%) |
| 75 Years and over | 58 (89.2%) | 60 (92.3%) |
| Total | 1,012 (64.3%) | 583 (37.0%) |
Disability Status by Sex by Age in Glenmora
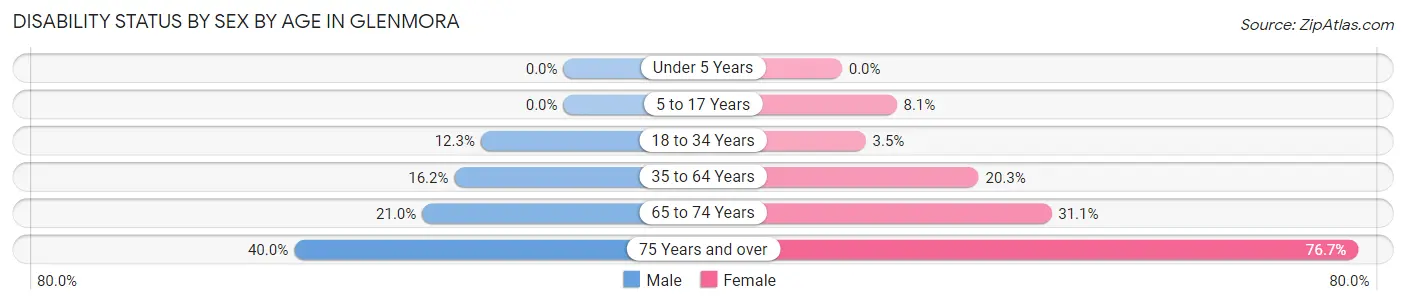
| Age Bracket | Male | Female |
| Under 5 Years | 0 (0.0%) | 0 (0.0%) |
| 5 to 17 Years | 0 (0.0%) | 10 (8.1%) |
| 18 to 34 Years | 20 (12.3%) | 7 (3.5%) |
| 35 to 64 Years | 46 (16.2%) | 53 (20.3%) |
| 65 to 74 Years | 13 (21.0%) | 14 (31.1%) |
| 75 Years and over | 2 (40.0%) | 46 (76.7%) |
Disability Class by Sex by Age in Glenmora
Disability Class: Hearing Difficulty
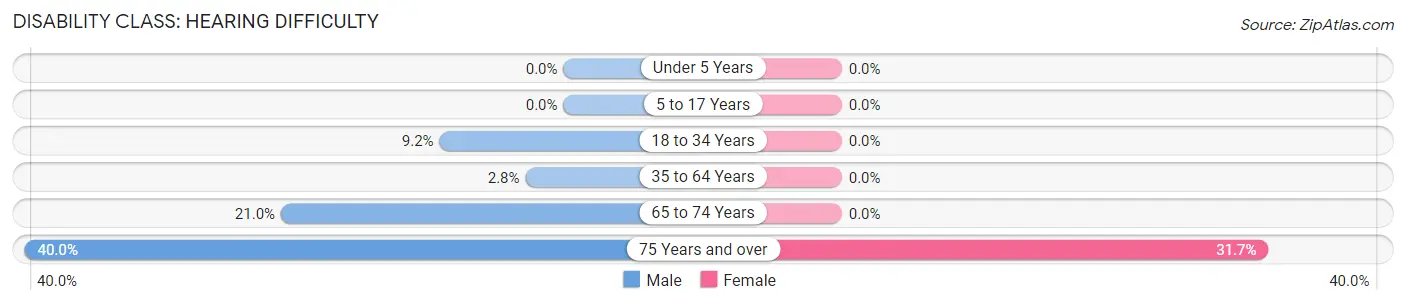
| Age Bracket | Male | Female |
| Under 5 Years | 0 (0.0%) | 0 (0.0%) |
| 5 to 17 Years | 0 (0.0%) | 0 (0.0%) |
| 18 to 34 Years | 15 (9.2%) | 0 (0.0%) |
| 35 to 64 Years | 8 (2.8%) | 0 (0.0%) |
| 65 to 74 Years | 13 (21.0%) | 0 (0.0%) |
| 75 Years and over | 2 (40.0%) | 19 (31.7%) |
Disability Class: Vision Difficulty
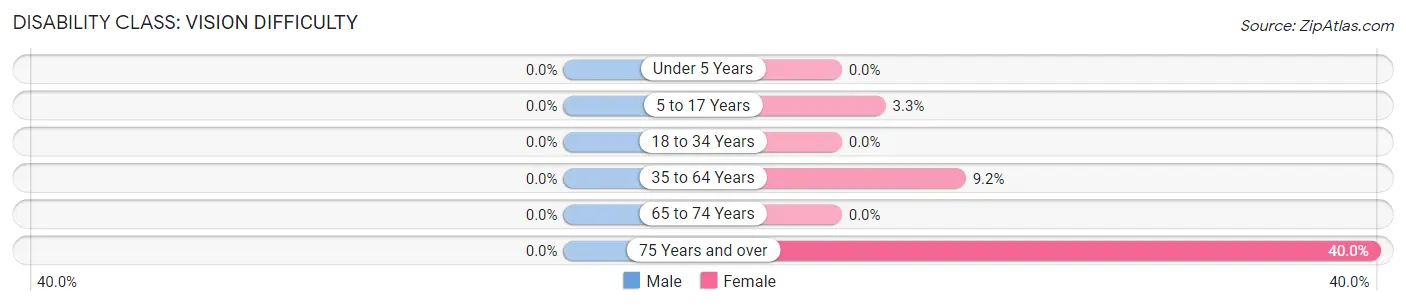
| Age Bracket | Male | Female |
| Under 5 Years | 0 (0.0%) | 0 (0.0%) |
| 5 to 17 Years | 0 (0.0%) | 4 (3.3%) |
| 18 to 34 Years | 0 (0.0%) | 0 (0.0%) |
| 35 to 64 Years | 0 (0.0%) | 24 (9.2%) |
| 65 to 74 Years | 0 (0.0%) | 0 (0.0%) |
| 75 Years and over | 0 (0.0%) | 24 (40.0%) |
Disability Class: Cognitive Difficulty
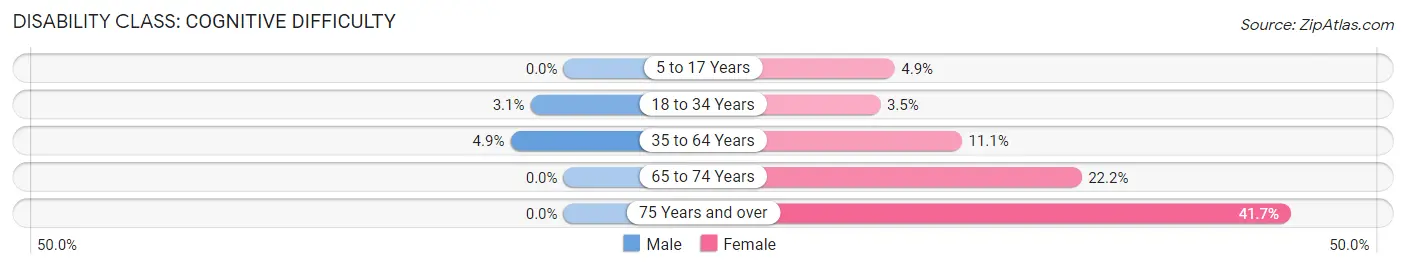
| Age Bracket | Male | Female |
| 5 to 17 Years | 0 (0.0%) | 6 (4.9%) |
| 18 to 34 Years | 5 (3.1%) | 7 (3.5%) |
| 35 to 64 Years | 14 (4.9%) | 29 (11.1%) |
| 65 to 74 Years | 0 (0.0%) | 10 (22.2%) |
| 75 Years and over | 0 (0.0%) | 25 (41.7%) |
Disability Class: Ambulatory Difficulty
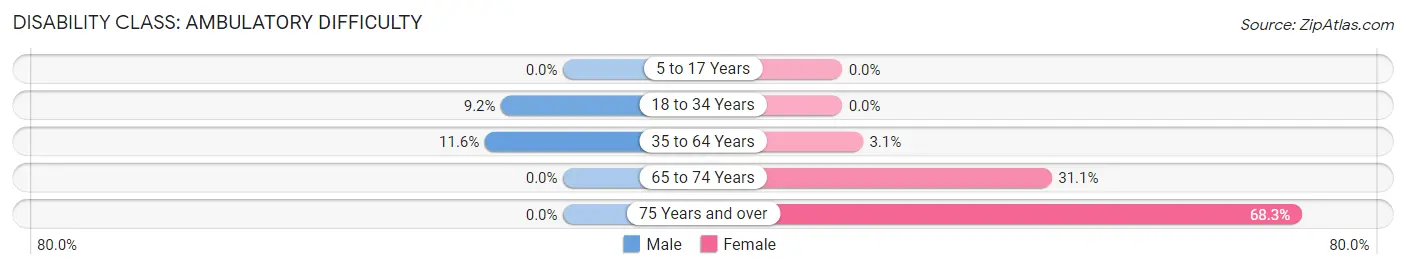
| Age Bracket | Male | Female |
| 5 to 17 Years | 0 (0.0%) | 0 (0.0%) |
| 18 to 34 Years | 15 (9.2%) | 0 (0.0%) |
| 35 to 64 Years | 33 (11.6%) | 8 (3.1%) |
| 65 to 74 Years | 0 (0.0%) | 14 (31.1%) |
| 75 Years and over | 0 (0.0%) | 41 (68.3%) |
Disability Class: Self-Care Difficulty
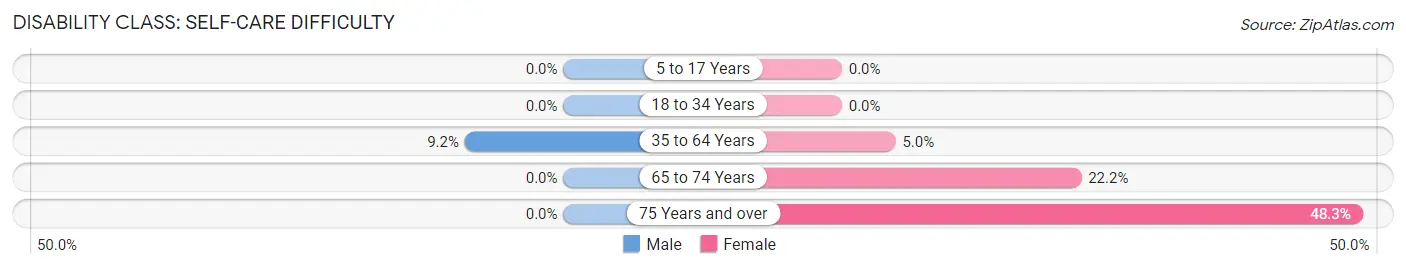
| Age Bracket | Male | Female |
| 5 to 17 Years | 0 (0.0%) | 0 (0.0%) |
| 18 to 34 Years | 0 (0.0%) | 0 (0.0%) |
| 35 to 64 Years | 26 (9.1%) | 13 (5.0%) |
| 65 to 74 Years | 0 (0.0%) | 10 (22.2%) |
| 75 Years and over | 0 (0.0%) | 29 (48.3%) |
Technology Access in Glenmora
Computing Device Access in Glenmora
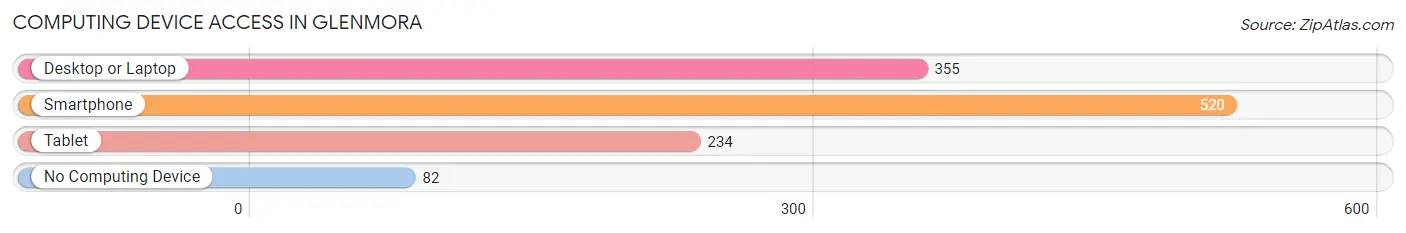
| Device Type | # Households | % Households |
| Desktop or Laptop | 355 | 59.0% |
| Smartphone | 520 | 86.4% |
| Tablet | 234 | 38.9% |
| No Computing Device | 82 | 13.6% |
| Total | 602 | 100.0% |
Internet Access in Glenmora
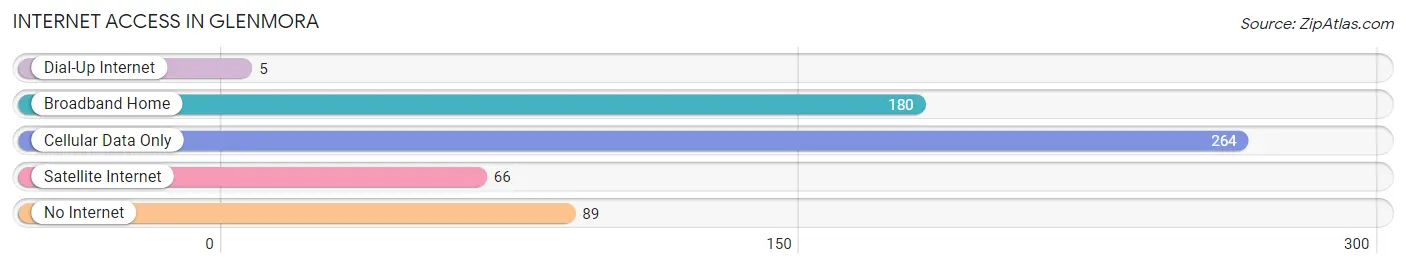
| Internet Type | # Households | % Households |
| Dial-Up Internet | 5 | 0.8% |
| Broadband Home | 180 | 29.9% |
| Cellular Data Only | 264 | 43.9% |
| Satellite Internet | 66 | 11.0% |
| No Internet | 89 | 14.8% |
| Total | 602 | 100.0% |
Glenmora Summary
Glenmora is a small town located in the central part of Louisiana, United States. It is situated in the northern part of Rapides Parish, about 25 miles south of Alexandria. The town has a population of 1,845 people, according to the 2010 census.
Geography
Glenmora is located at the intersection of U.S. Route 165 and Louisiana Highway 112. It is situated in the northern part of Rapides Parish, about 25 miles south of Alexandria. The town is surrounded by pine forests and rolling hills. The nearest major cities are Alexandria, Natchitoches, and Monroe.
Climate
Glenmora has a humid subtropical climate, with hot, humid summers and mild winters. The average annual temperature is around 68°F (20°C). The average annual precipitation is around 50 inches (127 cm).
History
Glenmora was founded in 1883 by a group of settlers from Scotland. The town was named after the Scottish town of Glenmora. The settlers built a sawmill and a gristmill, and the town quickly grew. By the early 1900s, Glenmora had become a thriving community with a population of over 1,000 people.
The town was incorporated in 1908 and the first mayor was elected in 1909. In the early 1900s, the town was a major center for the lumber industry. The sawmill and gristmill were the main sources of employment for the townspeople.
In the 1920s, the town began to decline as the lumber industry moved away. The population decreased and the town became a quiet, rural community.
Economy
The economy of Glenmora is largely based on agriculture. The town is home to several farms, which produce cotton, soybeans, corn, and other crops. The town also has a few small businesses, including a grocery store, a hardware store, and a few restaurants.
Demographics
According to the 2010 census, the population of Glenmora was 1,845 people. The racial makeup of the town was 79.3% White, 17.7% African American, 0.7% Native American, 0.2% Asian, 0.1% Pacific Islander, and 1.9% from other races. The median household income was $30,938.
Conclusion
Glenmora is a small town located in the central part of Louisiana. It has a population of 1,845 people and is surrounded by pine forests and rolling hills. The town has a humid subtropical climate and is largely based on agriculture. The racial makeup of the town is 79.3% White, 17.7% African American, 0.7% Native American, 0.2% Asian, 0.1% Pacific Islander, and 1.9% from other races. The median household income was $30,938.
Common Questions
What is Per Capita Income in Glenmora?
Per Capita income in Glenmora is $19,424.
What is the Median Family Income in Glenmora?
Median Family Income in Glenmora is $38,700.
What is the Median Household income in Glenmora?
Median Household Income in Glenmora is $34,865.
What is Income or Wage Gap in Glenmora?
Income or Wage Gap in Glenmora is 8.4%.
Women in Glenmora earn 91.6 cents for every dollar earned by a man.
What is Inequality or Gini Index in Glenmora?
Inequality or Gini Index in Glenmora is 0.39.
What is the Total Population of Glenmora?
Total Population of Glenmora is 1,574.
What is the Total Male Population of Glenmora?
Total Male Population of Glenmora is 748.
What is the Total Female Population of Glenmora?
Total Female Population of Glenmora is 826.
What is the Ratio of Males per 100 Females in Glenmora?
There are 90.56 Males per 100 Females in Glenmora.
What is the Ratio of Females per 100 Males in Glenmora?
There are 110.43 Females per 100 Males in Glenmora.
What is the Median Population Age in Glenmora?
Median Population Age in Glenmora is 30.9 Years.
What is the Average Family Size in Glenmora
Average Family Size in Glenmora is 3.8 People.
What is the Average Household Size in Glenmora
Average Household Size in Glenmora is 2.6 People.
How Large is the Labor Force in Glenmora?
There are 688 People in the Labor Forcein in Glenmora.
What is the Percentage of People in the Labor Force in Glenmora?
62.4% of People are in the Labor Force in Glenmora.
What is the Unemployment Rate in Glenmora?
Unemployment Rate in Glenmora is 6.8%.