Fisher, LA Map & Demographics
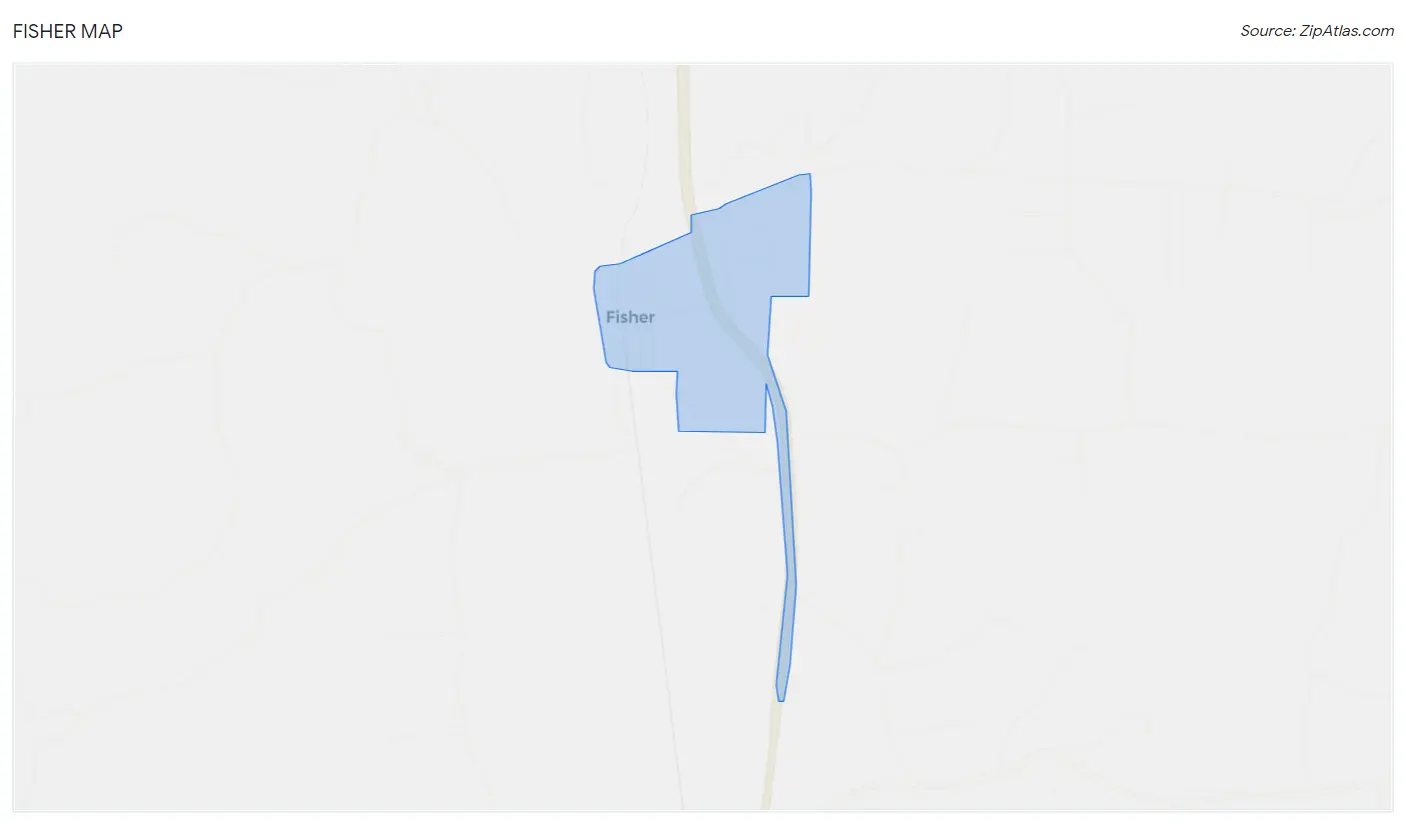
Fisher Map
Fisher Overview
$17,116
PER CAPITA INCOME
$46,250
AVG FAMILY INCOME
$32,344
AVG HOUSEHOLD INCOME
0.38
INEQUALITY / GINI INDEX
199
TOTAL POPULATION
90
MALE POPULATION
109
FEMALE POPULATION
82.57
MALES / 100 FEMALES
121.11
FEMALES / 100 MALES
51.6
MEDIAN AGE
3.9
AVG FAMILY SIZE
3.0
AVG HOUSEHOLD SIZE
66
LABOR FORCE [ PEOPLE ]
38.8%
PERCENT IN LABOR FORCE
4.5%
UNEMPLOYMENT RATE
Fisher Zip Codes
Fisher Area Codes
Income in Fisher
Income Overview in Fisher
Per Capita Income in Fisher is $17,116, while median incomes of families and households are $46,250 and $32,344 respectively.
| Characteristic | Number | Measure |
| Per Capita Income | 199 | $17,116 |
| Median Family Income | 44 | $46,250 |
| Mean Family Income | 44 | $52,445 |
| Median Household Income | 67 | $32,344 |
| Mean Household Income | 67 | $40,597 |
| Income Deficit | 44 | $0 |
| Wage / Income Gap (%) | 199 | 0.00% |
| Wage / Income Gap ($) | 199 | 100.00¢ per $1 |
| Gini / Inequality Index | 199 | 0.38 |
Earnings by Sex in Fisher
| Sex | Number | Average Earnings |
| Male | 43 (66.1%) | $0 |
| Female | 22 (33.9%) | $0 |
| Total | 65 (100.0%) | $0 |
Earnings by Sex by Income Bracket in Fisher
The most common earnings brackets in Fisher are $10,000 to $12,499 for men (16 | 37.2%) and $65,000 to $74,999 for women (7 | 31.8%).
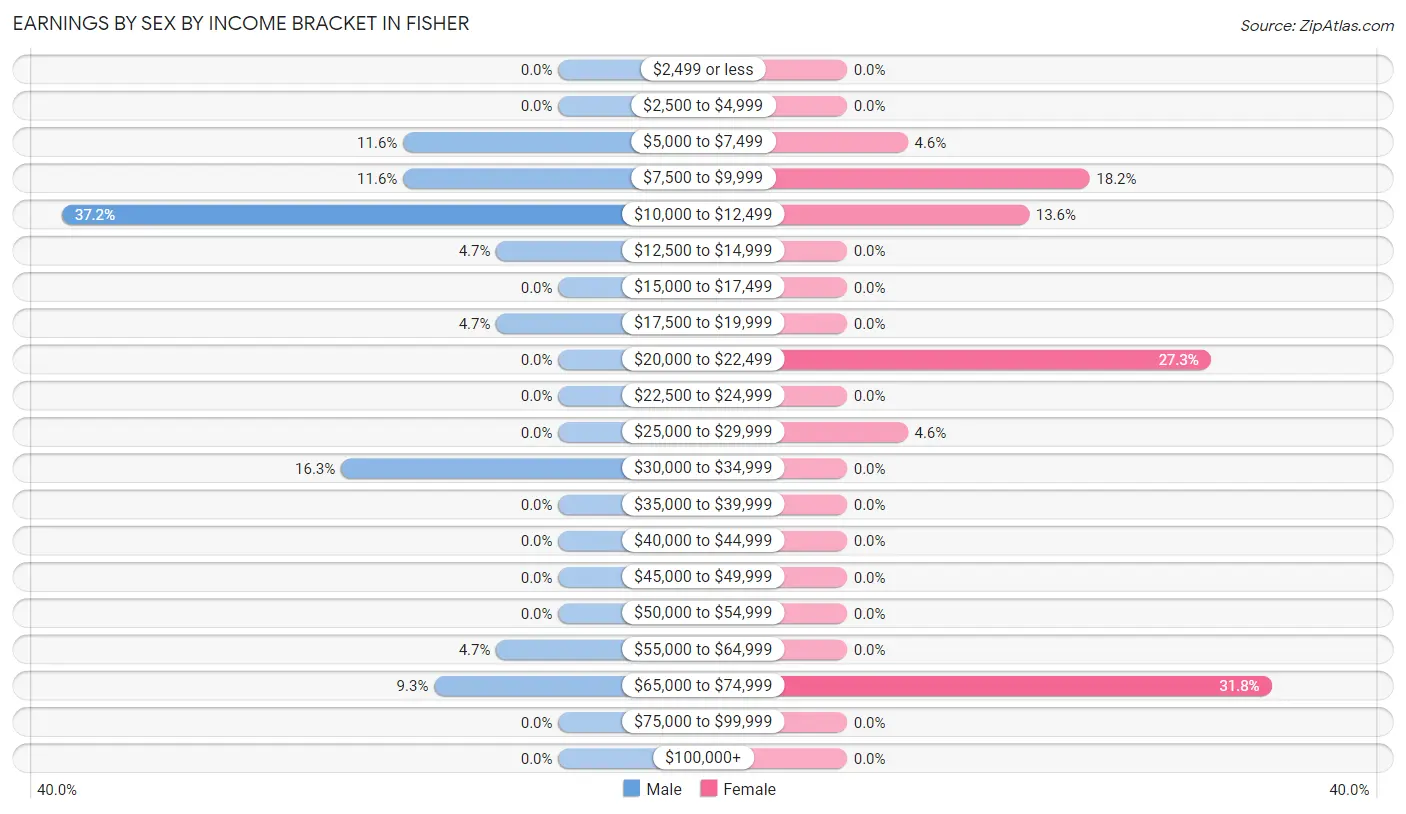
| Income | Male | Female |
| $2,499 or less | 0 (0.0%) | 0 (0.0%) |
| $2,500 to $4,999 | 0 (0.0%) | 0 (0.0%) |
| $5,000 to $7,499 | 5 (11.6%) | 1 (4.5%) |
| $7,500 to $9,999 | 5 (11.6%) | 4 (18.2%) |
| $10,000 to $12,499 | 16 (37.2%) | 3 (13.6%) |
| $12,500 to $14,999 | 2 (4.6%) | 0 (0.0%) |
| $15,000 to $17,499 | 0 (0.0%) | 0 (0.0%) |
| $17,500 to $19,999 | 2 (4.6%) | 0 (0.0%) |
| $20,000 to $22,499 | 0 (0.0%) | 6 (27.3%) |
| $22,500 to $24,999 | 0 (0.0%) | 0 (0.0%) |
| $25,000 to $29,999 | 0 (0.0%) | 1 (4.5%) |
| $30,000 to $34,999 | 7 (16.3%) | 0 (0.0%) |
| $35,000 to $39,999 | 0 (0.0%) | 0 (0.0%) |
| $40,000 to $44,999 | 0 (0.0%) | 0 (0.0%) |
| $45,000 to $49,999 | 0 (0.0%) | 0 (0.0%) |
| $50,000 to $54,999 | 0 (0.0%) | 0 (0.0%) |
| $55,000 to $64,999 | 2 (4.6%) | 0 (0.0%) |
| $65,000 to $74,999 | 4 (9.3%) | 7 (31.8%) |
| $75,000 to $99,999 | 0 (0.0%) | 0 (0.0%) |
| $100,000+ | 0 (0.0%) | 0 (0.0%) |
| Total | 43 (100.0%) | 22 (100.0%) |
Earnings by Sex by Educational Attainment in Fisher
| Educational Attainment | Male Income | Female Income |
| Less than High School | - | - |
| High School Diploma | - | - |
| College or Associate's Degree | - | - |
| Bachelor's Degree | - | - |
| Graduate Degree | - | - |
| Total | $11,484 | $0 |
Family Income in Fisher
Family Income Brackets in Fisher
According to the Fisher family income data, there are 13 families falling into the $25,000 to $34,999 income range, which is the most common income bracket and makes up 29.5% of all families.
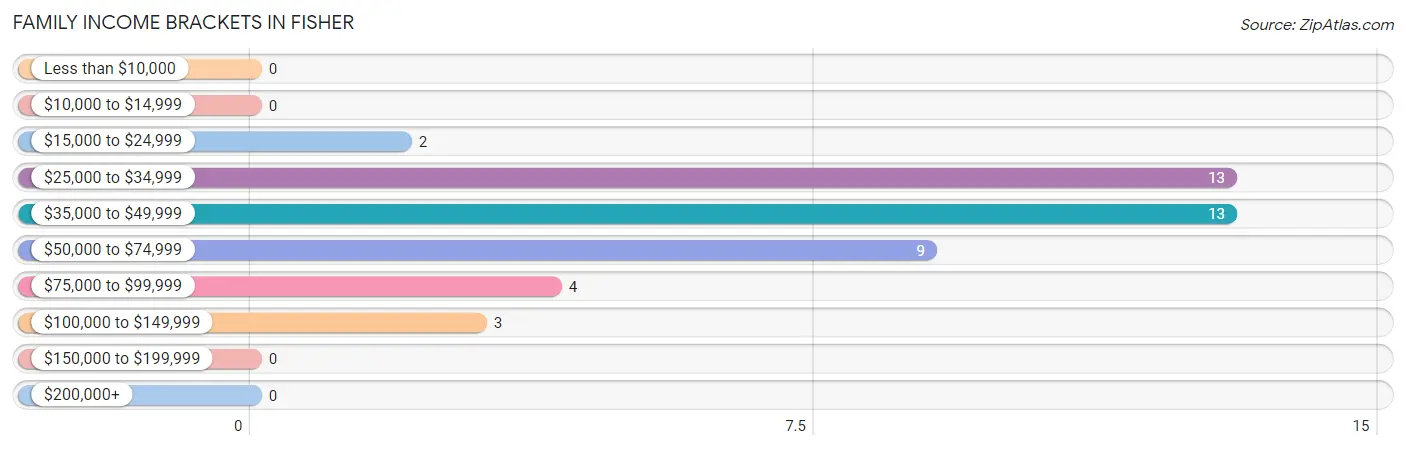
| Income Bracket | # Families | % Families |
| Less than $10,000 | 0 | 0.0% |
| $10,000 to $14,999 | 0 | 0.0% |
| $15,000 to $24,999 | 2 | 4.5% |
| $25,000 to $34,999 | 13 | 29.5% |
| $35,000 to $49,999 | 13 | 29.5% |
| $50,000 to $74,999 | 9 | 20.5% |
| $75,000 to $99,999 | 4 | 9.1% |
| $100,000 to $149,999 | 3 | 6.8% |
| $150,000 to $199,999 | 0 | 0.0% |
| $200,000+ | 0 | 0.0% |
Family Income by Famaliy Size in Fisher
2-person families (25 | 56.8%) account for the highest median family income in Fisher with $49,375 per family, while 2-person families (25 | 56.8%) have the highest median income of $24,688 per family member.
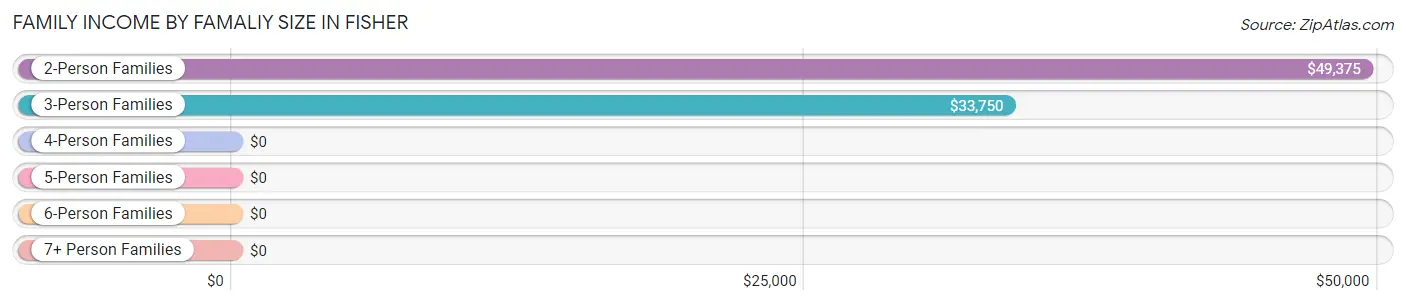
| Income Bracket | # Families | Median Income |
| 2-Person Families | 25 (56.8%) | $49,375 |
| 3-Person Families | 14 (31.8%) | $33,750 |
| 4-Person Families | 0 (0.0%) | $0 |
| 5-Person Families | 2 (4.5%) | $0 |
| 6-Person Families | 0 (0.0%) | $0 |
| 7+ Person Families | 3 (6.8%) | $0 |
| Total | 44 (100.0%) | $46,250 |
Family Income by Number of Earners in Fisher
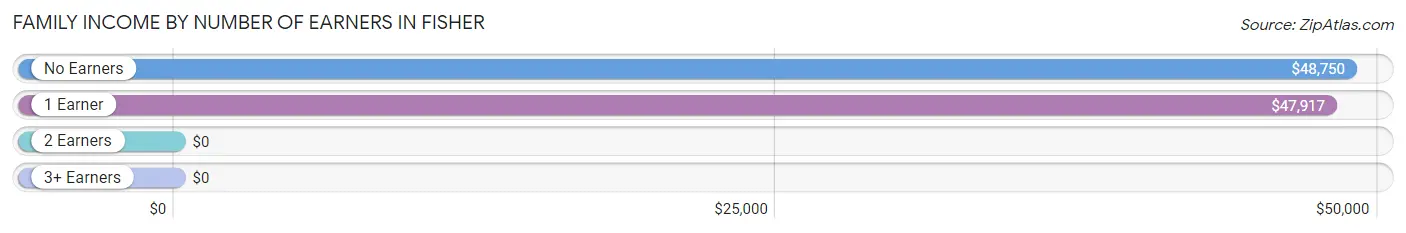
| Number of Earners | # Families | Median Income |
| No Earners | 17 (38.6%) | $48,750 |
| 1 Earner | 13 (29.5%) | $47,917 |
| 2 Earners | 12 (27.3%) | $0 |
| 3+ Earners | 2 (4.5%) | $0 |
| Total | 44 (100.0%) | $46,250 |
Household Income in Fisher
Household Income Brackets in Fisher
With 17 households falling in the category, the $25,000 to $34,999 income range is the most frequent in Fisher, accounting for 25.4% of all households.
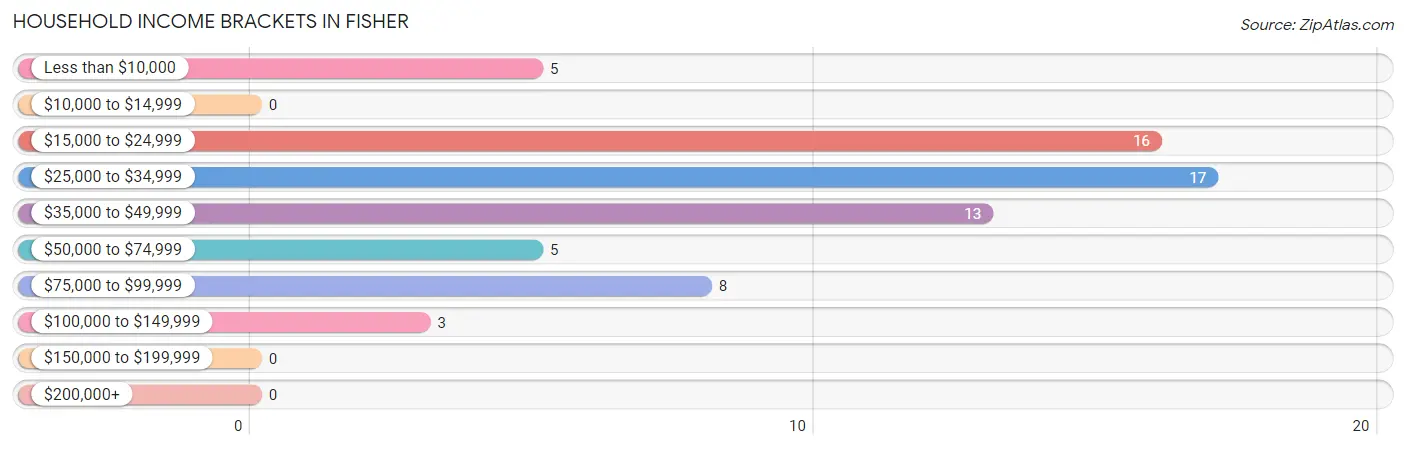
| Income Bracket | # Households | % Households |
| Less than $10,000 | 5 | 7.5% |
| $10,000 to $14,999 | 0 | 0.0% |
| $15,000 to $24,999 | 16 | 23.9% |
| $25,000 to $34,999 | 17 | 25.4% |
| $35,000 to $49,999 | 13 | 19.4% |
| $50,000 to $74,999 | 5 | 7.5% |
| $75,000 to $99,999 | 8 | 11.9% |
| $100,000 to $149,999 | 3 | 4.5% |
| $150,000 to $199,999 | 0 | 0.0% |
| $200,000+ | 0 | 0.0% |
Household Income by Householder Age in Fisher
The median household income in Fisher is $32,344, with the highest median household income of $31,563 found in the 45 to 64 years age bracket for the primary householder. A total of 26 households (38.8%) fall into this category. Meanwhile, the 15 to 24 years age bracket for the primary householder has the lowest median household income of $0, with 4 households (6.0%) in this group.
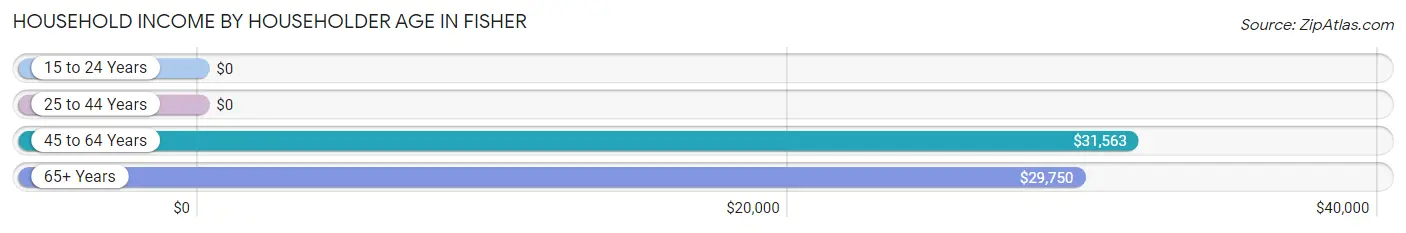
| Income Bracket | # Households | Median Income |
| 15 to 24 Years | 4 (6.0%) | $0 |
| 25 to 44 Years | 6 (9.0%) | $0 |
| 45 to 64 Years | 26 (38.8%) | $31,563 |
| 65+ Years | 31 (46.3%) | $29,750 |
| Total | 67 (100.0%) | $32,344 |
Poverty in Fisher
Income Below Poverty by Sex and Age in Fisher
With 11.1% poverty level for males and 11.9% for females among the residents of Fisher, 6 to 11 year old males and 6 to 11 year old females are the most vulnerable to poverty, with 3 males (100.0%) and 1 females (100.0%) in their respective age groups living below the poverty level.
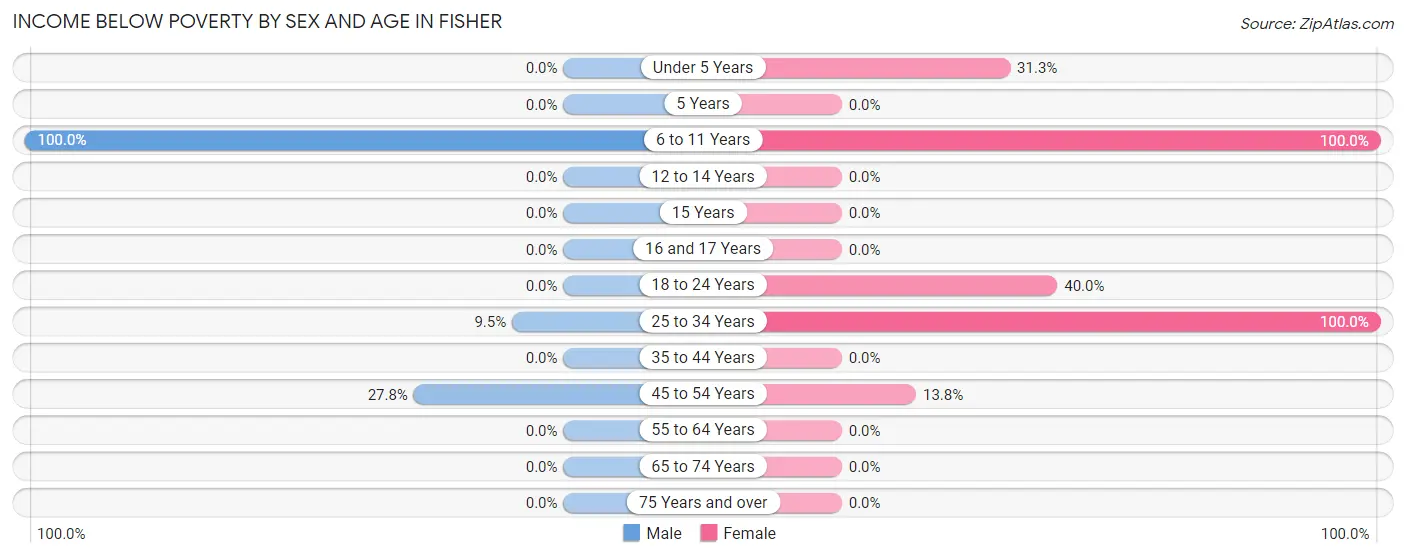
| Age Bracket | Male | Female |
| Under 5 Years | 0 (0.0%) | 5 (31.2%) |
| 5 Years | 0 (0.0%) | 0 (0.0%) |
| 6 to 11 Years | 3 (100.0%) | 1 (100.0%) |
| 12 to 14 Years | 0 (0.0%) | 0 (0.0%) |
| 15 Years | 0 (0.0%) | 0 (0.0%) |
| 16 and 17 Years | 0 (0.0%) | 0 (0.0%) |
| 18 to 24 Years | 0 (0.0%) | 2 (40.0%) |
| 25 to 34 Years | 2 (9.5%) | 1 (100.0%) |
| 35 to 44 Years | 0 (0.0%) | 0 (0.0%) |
| 45 to 54 Years | 5 (27.8%) | 4 (13.8%) |
| 55 to 64 Years | 0 (0.0%) | 0 (0.0%) |
| 65 to 74 Years | 0 (0.0%) | 0 (0.0%) |
| 75 Years and over | 0 (0.0%) | 0 (0.0%) |
| Total | 10 (11.1%) | 13 (11.9%) |
Income Above Poverty by Sex and Age in Fisher
According to the poverty statistics in Fisher, males aged under 5 years and females aged 55 to 64 years are the age groups that are most secure financially, with 100.0% of males and 100.0% of females in these age groups living above the poverty line.
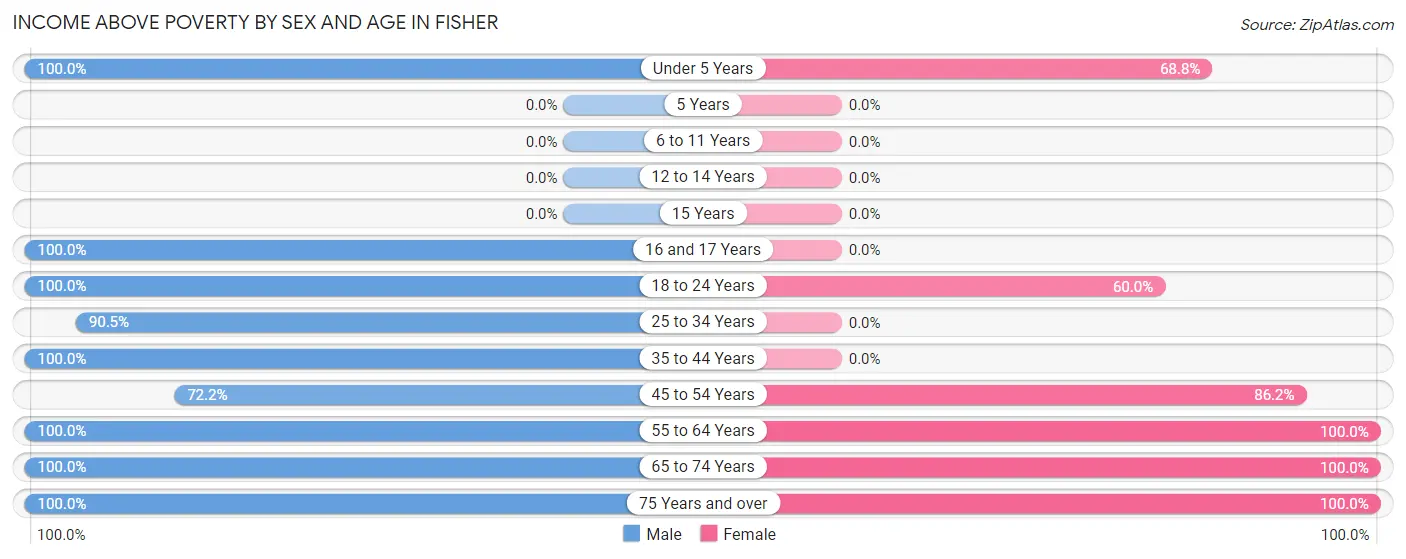
| Age Bracket | Male | Female |
| Under 5 Years | 9 (100.0%) | 11 (68.8%) |
| 5 Years | 0 (0.0%) | 0 (0.0%) |
| 6 to 11 Years | 0 (0.0%) | 0 (0.0%) |
| 12 to 14 Years | 0 (0.0%) | 0 (0.0%) |
| 15 Years | 0 (0.0%) | 0 (0.0%) |
| 16 and 17 Years | 2 (100.0%) | 0 (0.0%) |
| 18 to 24 Years | 4 (100.0%) | 3 (60.0%) |
| 25 to 34 Years | 19 (90.5%) | 0 (0.0%) |
| 35 to 44 Years | 5 (100.0%) | 0 (0.0%) |
| 45 to 54 Years | 13 (72.2%) | 25 (86.2%) |
| 55 to 64 Years | 6 (100.0%) | 12 (100.0%) |
| 65 to 74 Years | 12 (100.0%) | 35 (100.0%) |
| 75 Years and over | 10 (100.0%) | 10 (100.0%) |
| Total | 80 (88.9%) | 96 (88.1%) |
Income Below Poverty Among Married-Couple Families in Fisher
The poverty statistics for married-couple families in Fisher show that 5.4% or 2 of the total 37 families live below the poverty line. Families with 3 or 4 children have the highest poverty rate of 100.0%, comprising of 2 families. On the other hand, families with no children have the lowest poverty rate of 0.0%, which includes 0 families.
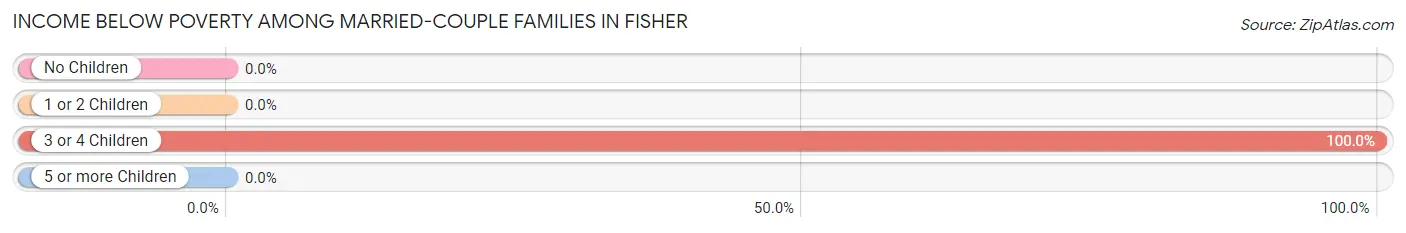
| Children | Above Poverty | Below Poverty |
| No Children | 30 (100.0%) | 0 (0.0%) |
| 1 or 2 Children | 5 (100.0%) | 0 (0.0%) |
| 3 or 4 Children | 0 (0.0%) | 2 (100.0%) |
| 5 or more Children | 0 (0.0%) | 0 (0.0%) |
| Total | 35 (94.6%) | 2 (5.4%) |
Income Below Poverty Among Single-Parent Households in Fisher
| Children | Single Father | Single Mother |
| No Children | 0 (0.0%) | 0 (0.0%) |
| 1 or 2 Children | 0 (0.0%) | 0 (0.0%) |
| 3 or 4 Children | 0 (0.0%) | 0 (0.0%) |
| 5 or more Children | 0 (0.0%) | 0 (0.0%) |
| Total | 0 (0.0%) | 0 (0.0%) |
Income Below Poverty Among Married-Couple vs Single-Parent Households in Fisher
| Children | Married-Couple Families | Single-Parent Households |
| No Children | 0 (0.0%) | 0 (0.0%) |
| 1 or 2 Children | 0 (0.0%) | 0 (0.0%) |
| 3 or 4 Children | 2 (100.0%) | 0 (0.0%) |
| 5 or more Children | 0 (0.0%) | 0 (0.0%) |
| Total | 2 (5.4%) | 0 (0.0%) |
Race in Fisher
The most populous races in Fisher are Black / African American (98 | 49.2%), White / Caucasian (84 | 42.2%), and Two or more Races (17 | 8.5%).
| Race | # Population | % Population |
| Asian | 0 | 0.0% |
| Black / African American | 98 | 49.2% |
| Hawaiian / Pacific | 0 | 0.0% |
| Hispanic or Latino | 0 | 0.0% |
| Native / Alaskan | 0 | 0.0% |
| White / Caucasian | 84 | 42.2% |
| Two or more Races | 17 | 8.5% |
| Some other Race | 0 | 0.0% |
| Total | 199 | 100.0% |
Ancestry in Fisher
The most populous ancestries reported in Fisher are Irish (18 | 9.0%), American (11 | 5.5%), African (7 | 3.5%), Subsaharan African (7 | 3.5%), and French (6 | 3.0%), together accounting for 24.6% of all Fisher residents.
| Ancestry | # Population | % Population |
| African | 7 | 3.5% |
| American | 11 | 5.5% |
| Dutch | 3 | 1.5% |
| English | 4 | 2.0% |
| French | 6 | 3.0% |
| German | 5 | 2.5% |
| Irish | 18 | 9.0% |
| Italian | 2 | 1.0% |
| Subsaharan African | 7 | 3.5% | View All 9 Rows |
Immigrants in Fisher

| Immigration Origin | # Population | % Population | View All 0 Rows |
Sex and Age in Fisher
Sex and Age in Fisher
The most populous age groups in Fisher are 30 to 34 Years (16 | 17.8%) for men and 65 to 69 Years (30 | 27.5%) for women.
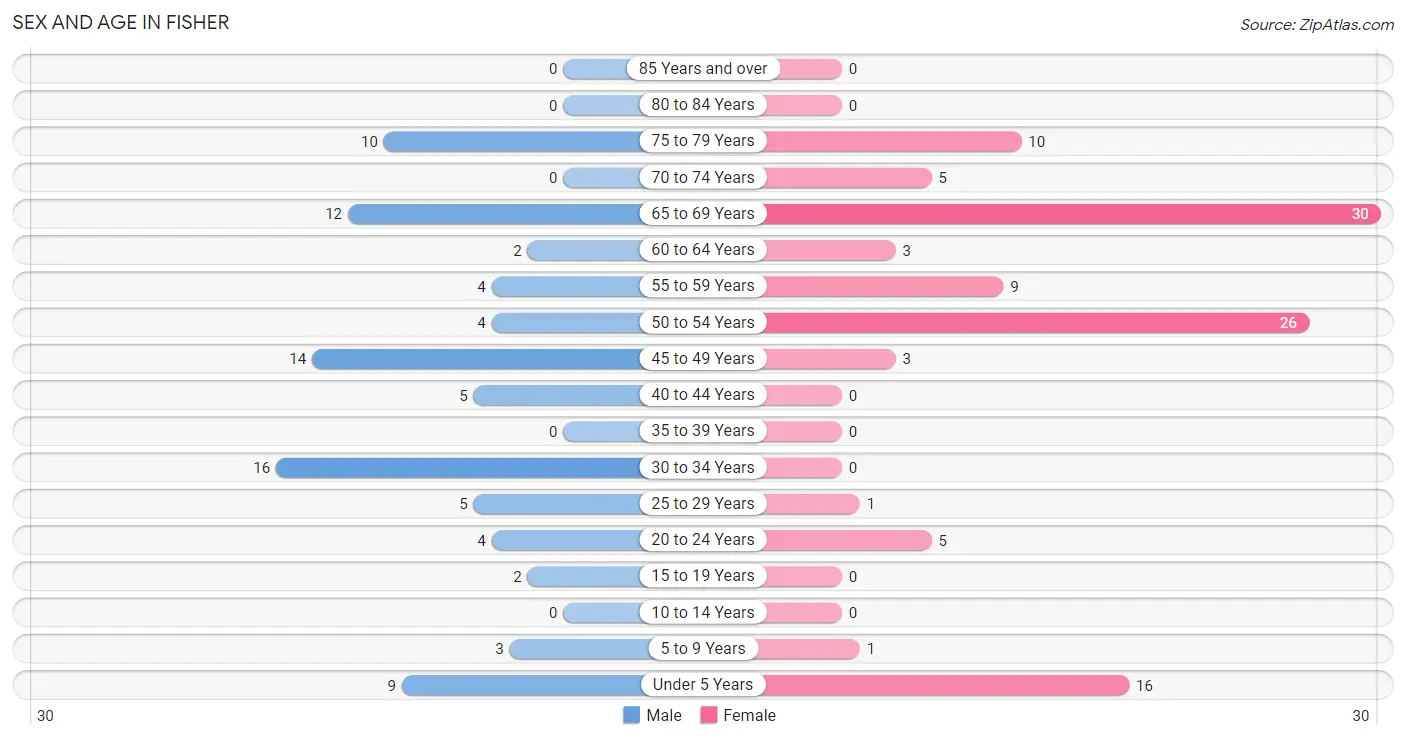
| Age Bracket | Male | Female |
| Under 5 Years | 9 (10.0%) | 16 (14.7%) |
| 5 to 9 Years | 3 (3.3%) | 1 (0.9%) |
| 10 to 14 Years | 0 (0.0%) | 0 (0.0%) |
| 15 to 19 Years | 2 (2.2%) | 0 (0.0%) |
| 20 to 24 Years | 4 (4.4%) | 5 (4.6%) |
| 25 to 29 Years | 5 (5.6%) | 1 (0.9%) |
| 30 to 34 Years | 16 (17.8%) | 0 (0.0%) |
| 35 to 39 Years | 0 (0.0%) | 0 (0.0%) |
| 40 to 44 Years | 5 (5.6%) | 0 (0.0%) |
| 45 to 49 Years | 14 (15.6%) | 3 (2.8%) |
| 50 to 54 Years | 4 (4.4%) | 26 (23.8%) |
| 55 to 59 Years | 4 (4.4%) | 9 (8.3%) |
| 60 to 64 Years | 2 (2.2%) | 3 (2.8%) |
| 65 to 69 Years | 12 (13.3%) | 30 (27.5%) |
| 70 to 74 Years | 0 (0.0%) | 5 (4.6%) |
| 75 to 79 Years | 10 (11.1%) | 10 (9.2%) |
| 80 to 84 Years | 0 (0.0%) | 0 (0.0%) |
| 85 Years and over | 0 (0.0%) | 0 (0.0%) |
| Total | 90 (100.0%) | 109 (100.0%) |
Families and Households in Fisher
Median Family Size in Fisher
The median family size in Fisher is 3.91 persons per family, with single female/mother families (3 | 6.8%) accounting for the largest median family size of 15.67 persons per family. On the other hand, single male/father families (4 | 9.1%) represent the smallest median family size with 2.50 persons per family.
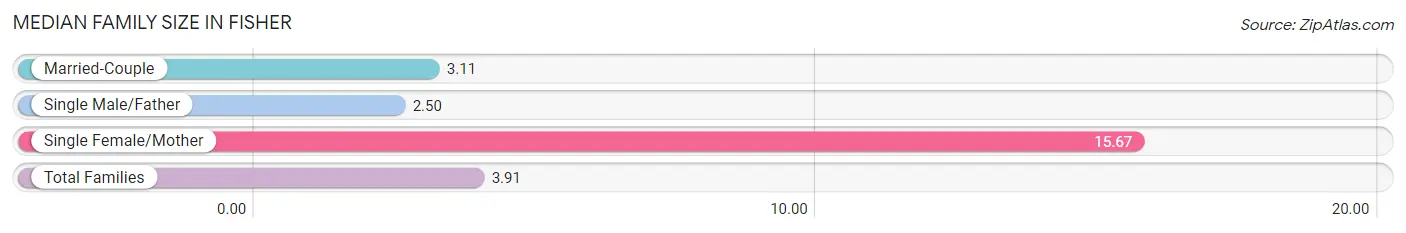
| Family Type | # Families | Family Size |
| Married-Couple | 37 (84.1%) | 3.11 |
| Single Male/Father | 4 (9.1%) | 2.50 |
| Single Female/Mother | 3 (6.8%) | 15.67 |
| Total Families | 44 (100.0%) | 3.91 |
Median Household Size in Fisher
The median household size in Fisher is 2.97 persons per household, with single female/mother households (3 | 4.5%) accounting for the largest median household size of 15.67 persons per household. non-family households (23 | 34.3%) represent the smallest median household size with 1.09 persons per household.
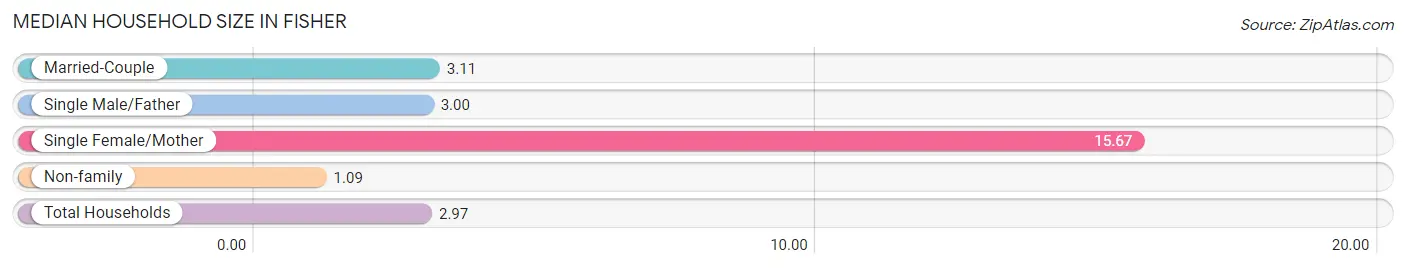
| Household Type | # Households | Household Size |
| Married-Couple | 37 (55.2%) | 3.11 |
| Single Male/Father | 4 (6.0%) | 3.00 |
| Single Female/Mother | 3 (4.5%) | 15.67 |
| Non-family | 23 (34.3%) | 1.09 |
| Total Households | 67 (100.0%) | 2.97 |
Household Size by Marriage Status in Fisher
Out of a total of 67 households in Fisher, 44 (65.7%) are family households, while 23 (34.3%) are nonfamily households. The most numerous type of family households are 2-person households, comprising 21, and the most common type of nonfamily households are 1-person households, comprising 21.
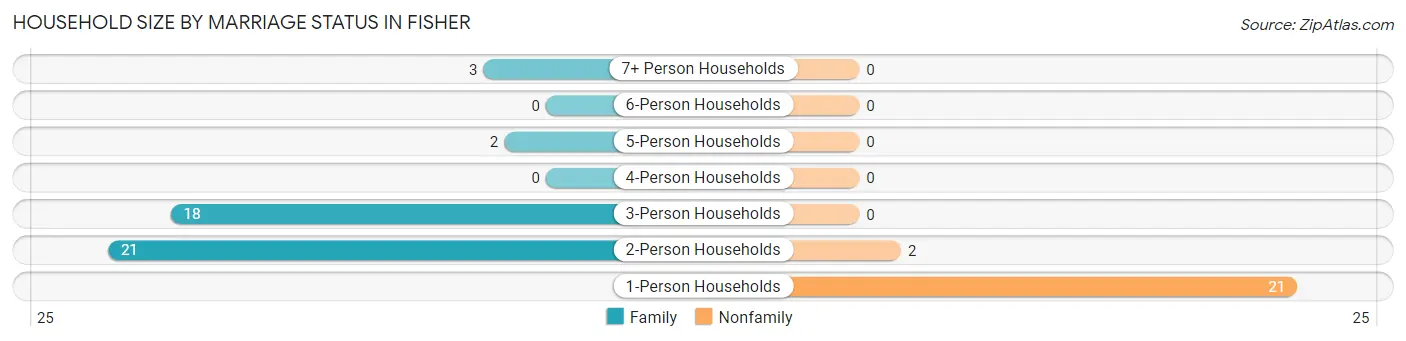
| Household Size | Family Households | Nonfamily Households |
| 1-Person Households | - | 21 (31.3%) |
| 2-Person Households | 21 (31.3%) | 2 (3.0%) |
| 3-Person Households | 18 (26.9%) | 0 (0.0%) |
| 4-Person Households | 0 (0.0%) | 0 (0.0%) |
| 5-Person Households | 2 (3.0%) | 0 (0.0%) |
| 6-Person Households | 0 (0.0%) | 0 (0.0%) |
| 7+ Person Households | 3 (4.5%) | 0 (0.0%) |
| Total | 44 (65.7%) | 23 (34.3%) |
Female Fertility in Fisher
Fertility by Age in Fisher
Average fertility rate in Fisher is 333.0 births per 1,000 women. Women in the age bracket of 20 to 34 years have the highest fertility rate with 500.0 births per 1,000 women. Women in the age bracket of 20 to 34 years acount for 100.0% of all women with births.
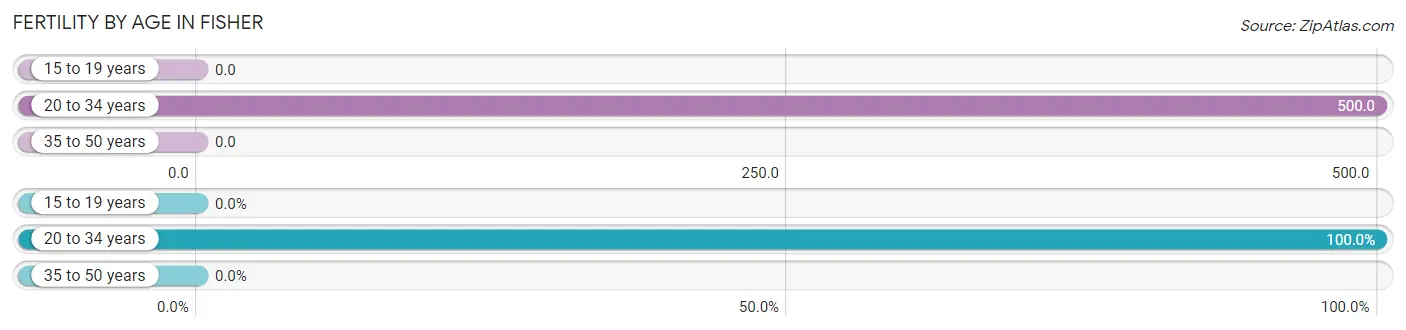
| Age Bracket | Women with Births | Births / 1,000 Women |
| 15 to 19 years | 0 (0.0%) | 0.0 |
| 20 to 34 years | 3 (100.0%) | 500.0 |
| 35 to 50 years | 0 (0.0%) | 0.0 |
| Total | 3 (100.0%) | 333.0 |
Fertility by Age by Marriage Status in Fisher
33.3% of women with births (3) in Fisher are married. The highest percentage of unmarried women with births falls into 20 to 34 years age bracket with 66.7% of them unmarried at the time of birth, while the lowest percentage of unmarried women with births belong to 20 to 34 years age bracket with 66.7% of them unmarried.
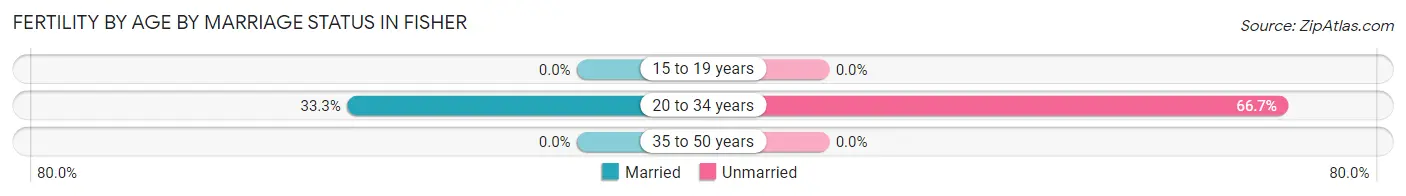
| Age Bracket | Married | Unmarried |
| 15 to 19 years | 0 (0.0%) | 0 (0.0%) |
| 20 to 34 years | 1 (33.3%) | 2 (66.7%) |
| 35 to 50 years | 0 (0.0%) | 0 (0.0%) |
| Total | 1 (33.3%) | 2 (66.7%) |
Fertility by Education in Fisher
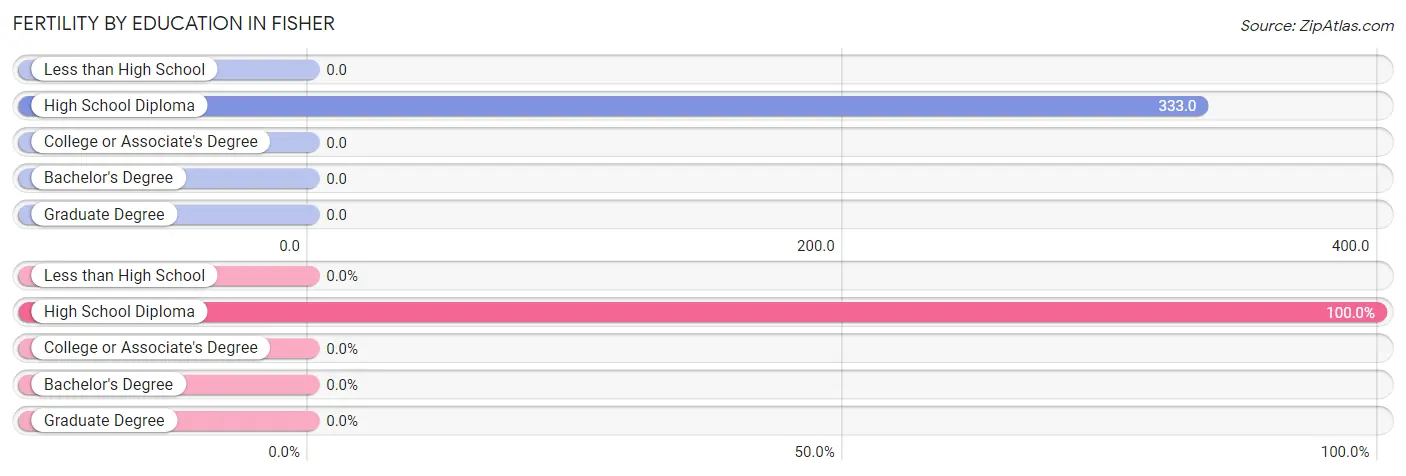
| Educational Attainment | Women with Births | Births / 1,000 Women |
| Less than High School | 0 (0.0%) | 0.0 |
| High School Diploma | 3 (100.0%) | 333.0 |
| College or Associate's Degree | 0 (0.0%) | 0.0 |
| Bachelor's Degree | 0 (0.0%) | 0.0 |
| Graduate Degree | 0 (0.0%) | 0.0 |
| Total | 3 (100.0%) | 333.0 |
Fertility by Education by Marriage Status in Fisher
66.7% of women with births in Fisher are unmarried. Women with the educational attainment of high school diploma are most likely to be married with 33.3% of them married at childbirth, while women with the educational attainment of high school diploma are least likely to be married with 66.7% of them unmarried at childbirth.
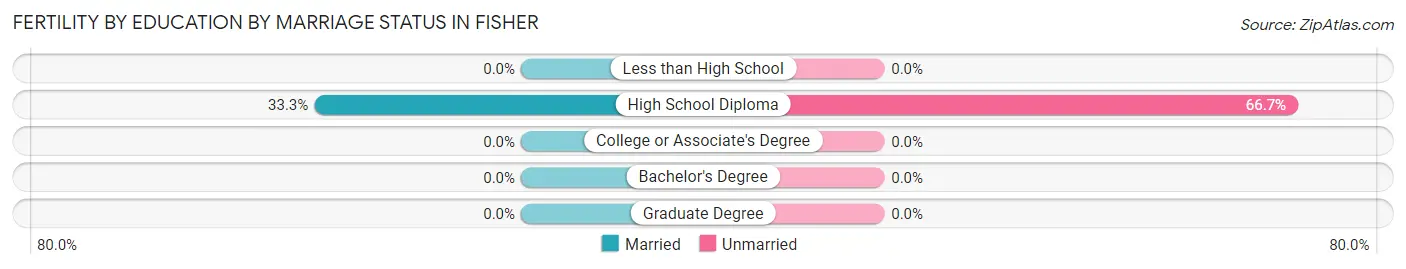
| Educational Attainment | Married | Unmarried |
| Less than High School | 0 (0.0%) | 0 (0.0%) |
| High School Diploma | 1 (33.3%) | 2 (66.7%) |
| College or Associate's Degree | 0 (0.0%) | 0 (0.0%) |
| Bachelor's Degree | 0 (0.0%) | 0 (0.0%) |
| Graduate Degree | 0 (0.0%) | 0 (0.0%) |
| Total | 1 (33.3%) | 2 (66.7%) |
Employment Characteristics in Fisher
Employment by Class of Employer in Fisher
Among the 63 employed individuals in Fisher, private company employees (42 | 66.7%), state government employees (9 | 14.3%), and local government employees (7 | 11.1%) make up the most common classes of employment.
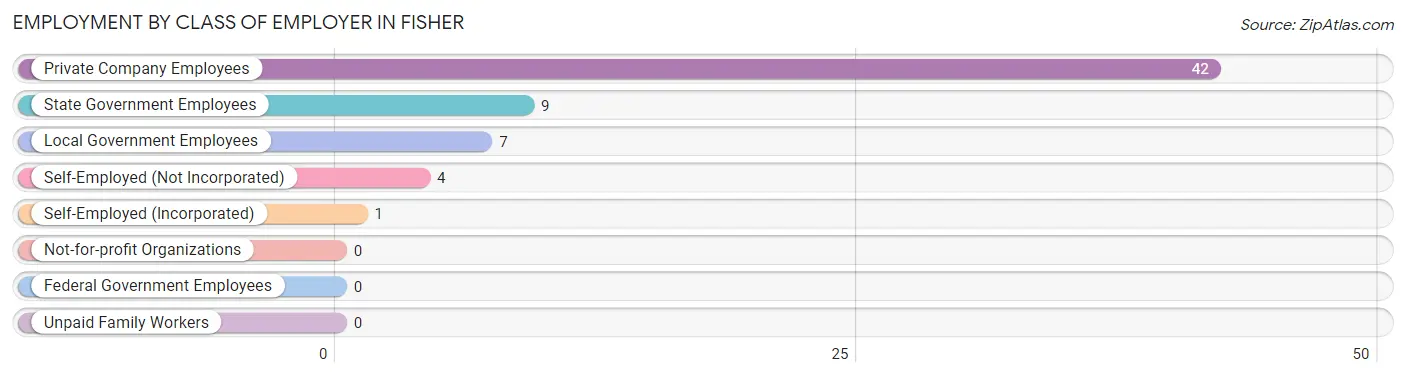
| Employer Class | # Employees | % Employees |
| Private Company Employees | 42 | 66.7% |
| Self-Employed (Incorporated) | 1 | 1.6% |
| Self-Employed (Not Incorporated) | 4 | 6.4% |
| Not-for-profit Organizations | 0 | 0.0% |
| Local Government Employees | 7 | 11.1% |
| State Government Employees | 9 | 14.3% |
| Federal Government Employees | 0 | 0.0% |
| Unpaid Family Workers | 0 | 0.0% |
| Total | 63 | 100.0% |
Employment Status by Age in Fisher
According to the labor force statistics for Fisher, out of the total population over 16 years of age (170), 38.8% or 66 individuals are in the labor force, with 4.5% or 3 of them unemployed. The age group with the highest labor force participation rate is 25 to 29 years, with 100.0% or 6 individuals in the labor force. Within the labor force, the 45 to 54 years age range has the highest percentage of unemployed individuals, with 11.5% or 3 of them being unemployed.
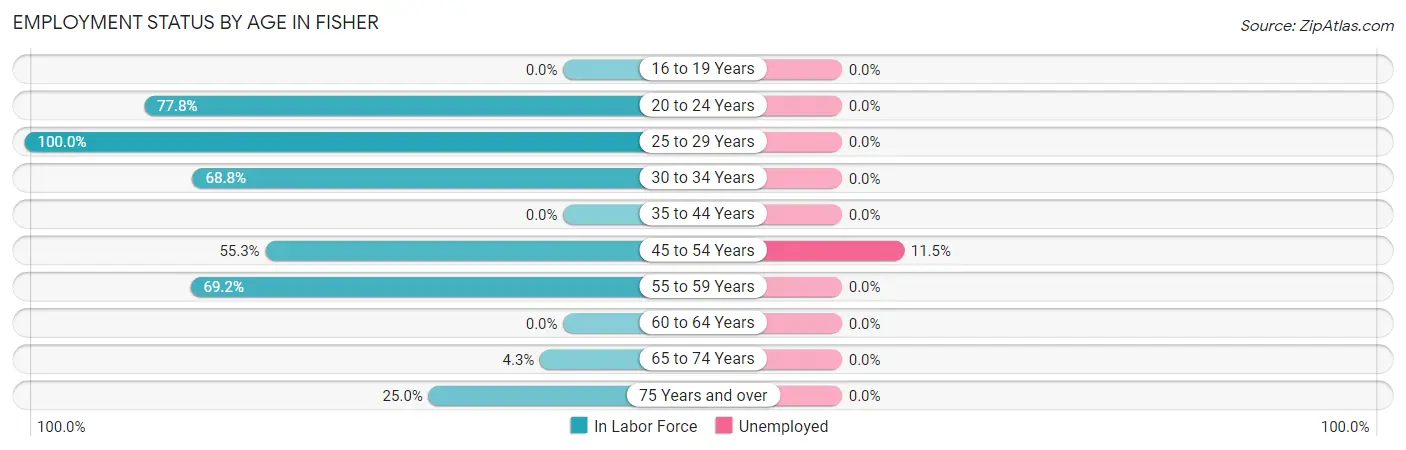
| Age Bracket | In Labor Force | Unemployed |
| 16 to 19 Years | 0 (0.0%) | 0 (0.0%) |
| 20 to 24 Years | 7 (77.8%) | 0 (0.0%) |
| 25 to 29 Years | 6 (100.0%) | 0 (0.0%) |
| 30 to 34 Years | 11 (68.8%) | 0 (0.0%) |
| 35 to 44 Years | 0 (0.0%) | 0 (0.0%) |
| 45 to 54 Years | 26 (55.3%) | 3 (11.5%) |
| 55 to 59 Years | 9 (69.2%) | 0 (0.0%) |
| 60 to 64 Years | 0 (0.0%) | 0 (0.0%) |
| 65 to 74 Years | 2 (4.3%) | 0 (0.0%) |
| 75 Years and over | 5 (25.0%) | 0 (0.0%) |
| Total | 66 (38.8%) | 3 (4.5%) |
Employment Status by Educational Attainment in Fisher
According to labor force statistics for Fisher, 56.5% of individuals (52) out of the total population between 25 and 64 years of age (92) are in the labor force, with 5.8% or 3 of them being unemployed. The group with the highest labor force participation rate are those with the educational attainment of bachelor's degree or higher, with 100.0% or 7 individuals in the labor force. Within the labor force, individuals with less than high school education have the highest percentage of unemployment, with 21.4% or 3 of them being unemployed.
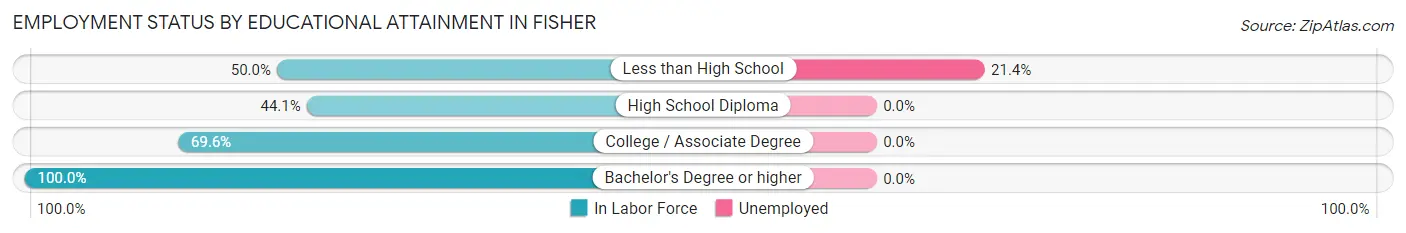
| Educational Attainment | In Labor Force | Unemployed |
| Less than High School | 14 (50.0%) | 6 (21.4%) |
| High School Diploma | 15 (44.1%) | 0 (0.0%) |
| College / Associate Degree | 16 (69.6%) | 0 (0.0%) |
| Bachelor's Degree or higher | 7 (100.0%) | 0 (0.0%) |
| Total | 52 (56.5%) | 5 (5.8%) |
Employment Occupations by Sex in Fisher
Management, Business, Science and Arts Occupations
The most common Management, Business, Science and Arts occupations in Fisher are Health Diagnosing & Treating (7 | 11.1%), Health Technologists (7 | 11.1%), and Management (3 | 4.8%).
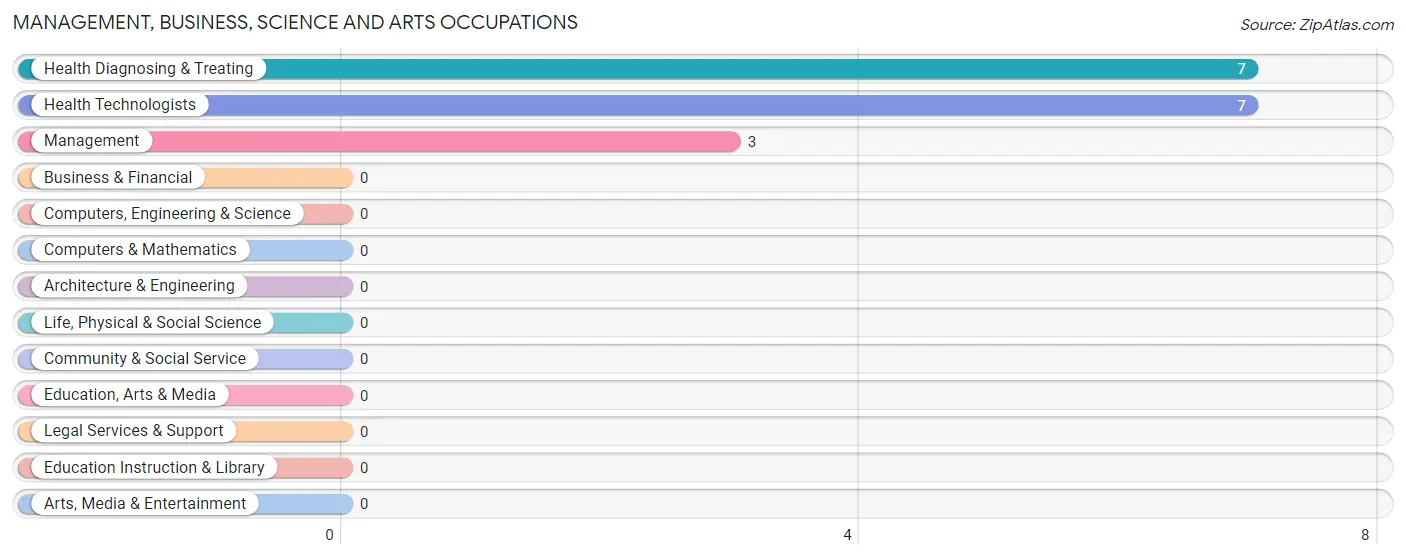
Management, Business, Science and Arts Occupations by Sex
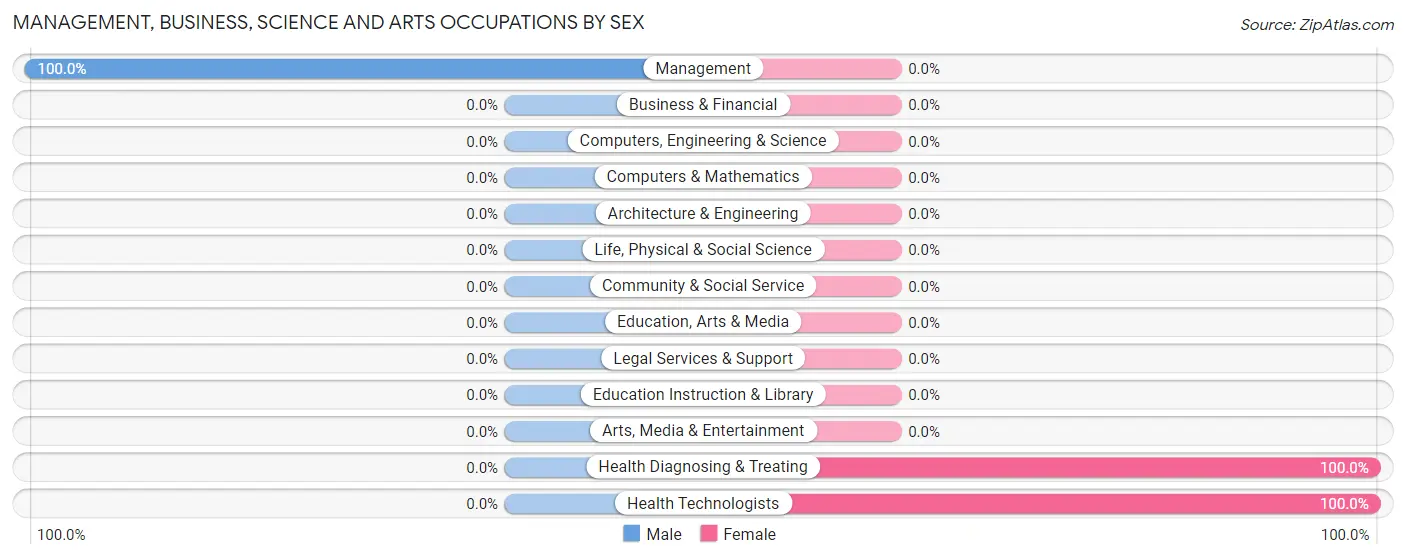
| Occupation | Male | Female |
| Management | 3 (100.0%) | 0 (0.0%) |
| Business & Financial | 0 (0.0%) | 0 (0.0%) |
| Computers, Engineering & Science | 0 (0.0%) | 0 (0.0%) |
| Computers & Mathematics | 0 (0.0%) | 0 (0.0%) |
| Architecture & Engineering | 0 (0.0%) | 0 (0.0%) |
| Life, Physical & Social Science | 0 (0.0%) | 0 (0.0%) |
| Community & Social Service | 0 (0.0%) | 0 (0.0%) |
| Education, Arts & Media | 0 (0.0%) | 0 (0.0%) |
| Legal Services & Support | 0 (0.0%) | 0 (0.0%) |
| Education Instruction & Library | 0 (0.0%) | 0 (0.0%) |
| Arts, Media & Entertainment | 0 (0.0%) | 0 (0.0%) |
| Health Diagnosing & Treating | 0 (0.0%) | 7 (100.0%) |
| Health Technologists | 0 (0.0%) | 7 (100.0%) |
| Total (Category) | 3 (30.0%) | 7 (70.0%) |
| Total (Overall) | 43 (68.2%) | 20 (31.8%) |
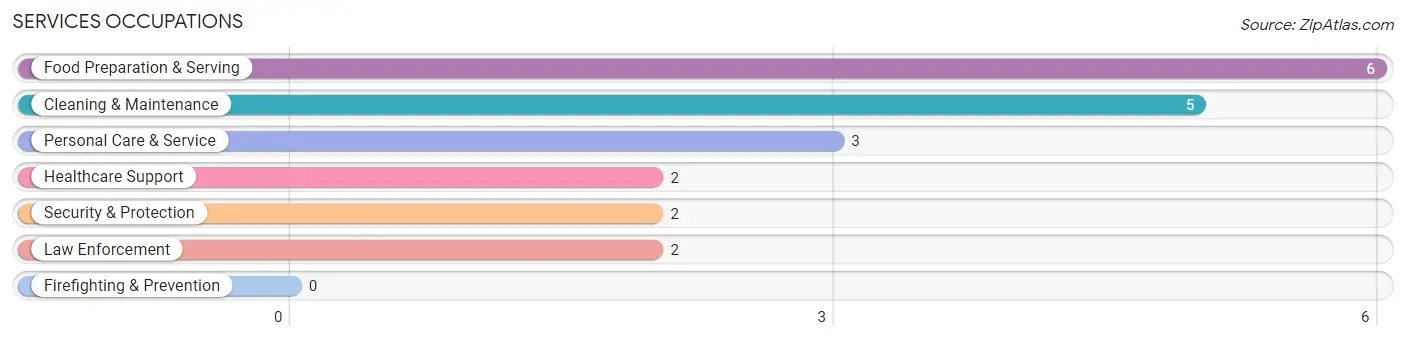
Services Occupations
The most common Services occupations in Fisher are Food Preparation & Serving (6 | 9.5%), Cleaning & Maintenance (5 | 7.9%), Personal Care & Service (3 | 4.8%), Healthcare Support (2 | 3.2%), and Security & Protection (2 | 3.2%).
Services Occupations by Sex
Within the Services occupations in Fisher, the most male-oriented occupations are Security & Protection (100.0%), Law Enforcement (100.0%), and Cleaning & Maintenance (100.0%), while the most female-oriented occupations are Healthcare Support (100.0%), Personal Care & Service (100.0%), and Food Preparation & Serving (16.7%).
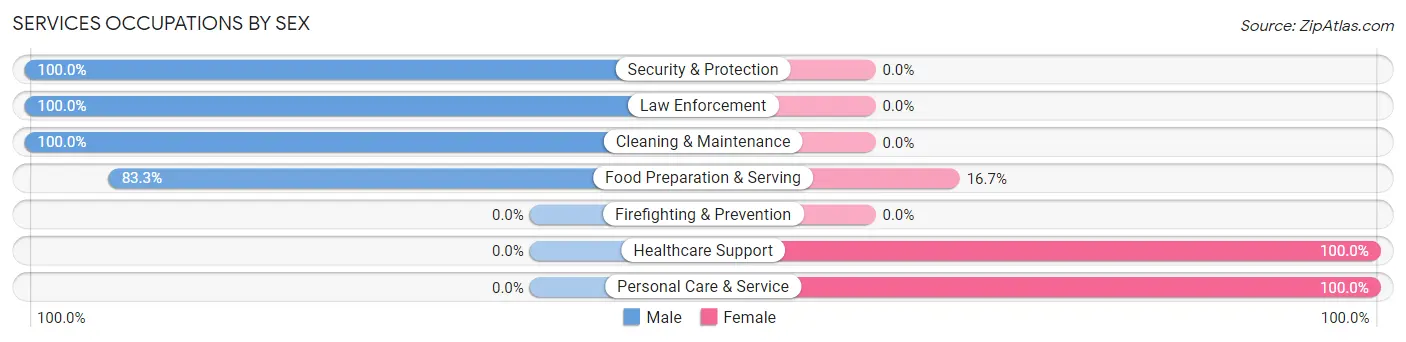
| Occupation | Male | Female |
| Healthcare Support | 0 (0.0%) | 2 (100.0%) |
| Security & Protection | 2 (100.0%) | 0 (0.0%) |
| Firefighting & Prevention | 0 (0.0%) | 0 (0.0%) |
| Law Enforcement | 2 (100.0%) | 0 (0.0%) |
| Food Preparation & Serving | 5 (83.3%) | 1 (16.7%) |
| Cleaning & Maintenance | 5 (100.0%) | 0 (0.0%) |
| Personal Care & Service | 0 (0.0%) | 3 (100.0%) |
| Total (Category) | 12 (66.7%) | 6 (33.3%) |
| Total (Overall) | 43 (68.2%) | 20 (31.8%) |
Sales and Office Occupations
The most common Sales and Office occupations in Fisher are , and Sales & Related (6 | 9.5%).
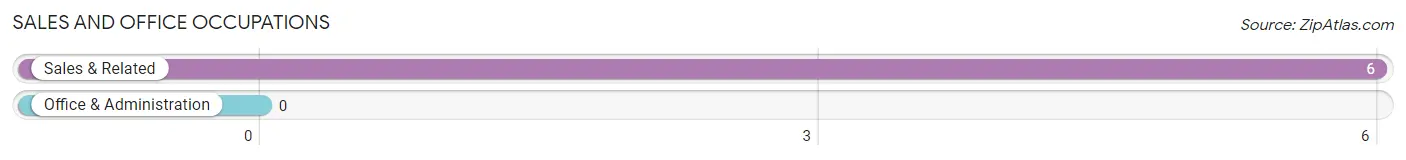
Sales and Office Occupations by Sex
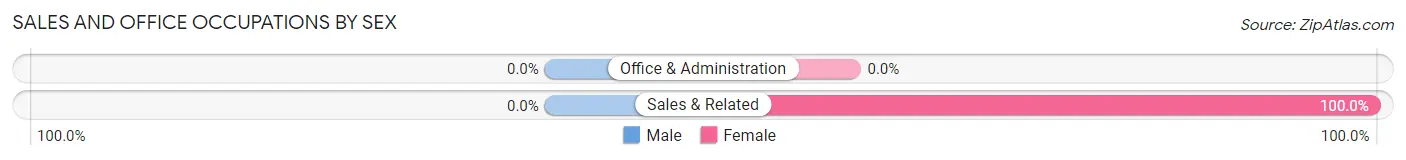
| Occupation | Male | Female |
| Sales & Related | 0 (0.0%) | 6 (100.0%) |
| Office & Administration | 0 (0.0%) | 0 (0.0%) |
| Total (Category) | 0 (0.0%) | 6 (100.0%) |
| Total (Overall) | 43 (68.2%) | 20 (31.8%) |
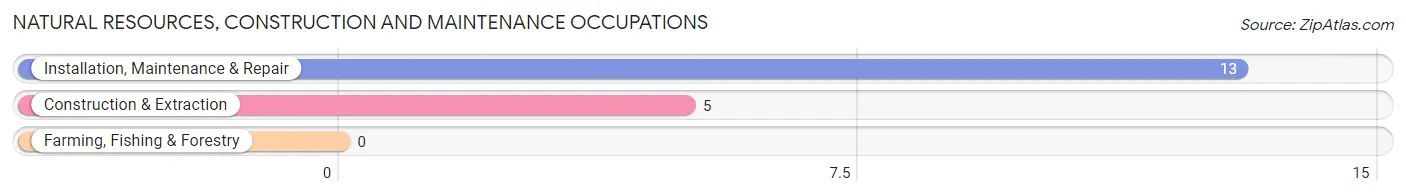
Natural Resources, Construction and Maintenance Occupations
The most common Natural Resources, Construction and Maintenance occupations in Fisher are Installation, Maintenance & Repair (13 | 20.6%), and Construction & Extraction (5 | 7.9%).
Natural Resources, Construction and Maintenance Occupations by Sex
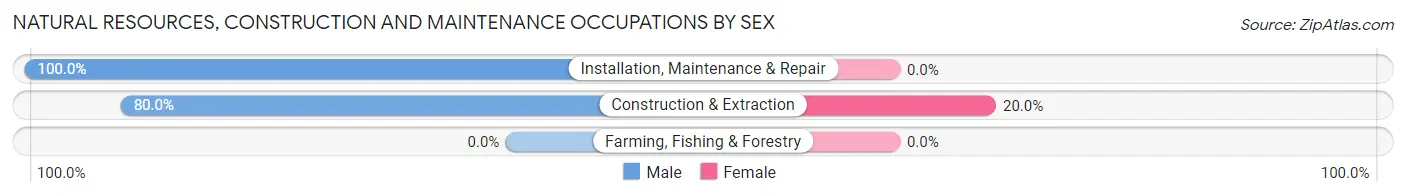
| Occupation | Male | Female |
| Farming, Fishing & Forestry | 0 (0.0%) | 0 (0.0%) |
| Construction & Extraction | 4 (80.0%) | 1 (20.0%) |
| Installation, Maintenance & Repair | 13 (100.0%) | 0 (0.0%) |
| Total (Category) | 17 (94.4%) | 1 (5.6%) |
| Total (Overall) | 43 (68.2%) | 20 (31.8%) |
Production, Transportation and Moving Occupations
The most common Production, Transportation and Moving occupations in Fisher are Production (7 | 11.1%), and Material Moving (4 | 6.4%).
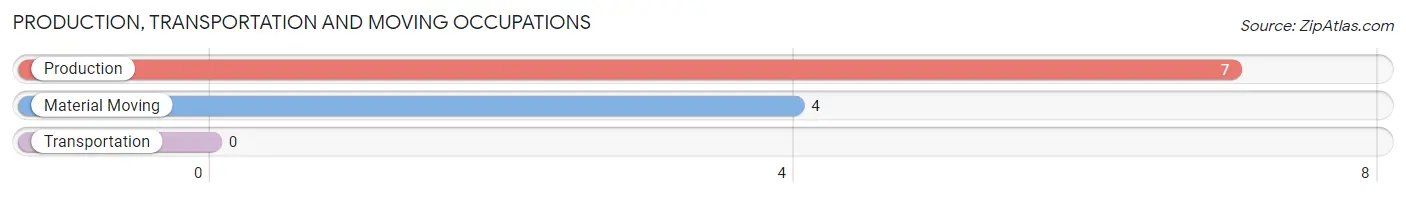
Production, Transportation and Moving Occupations by Sex
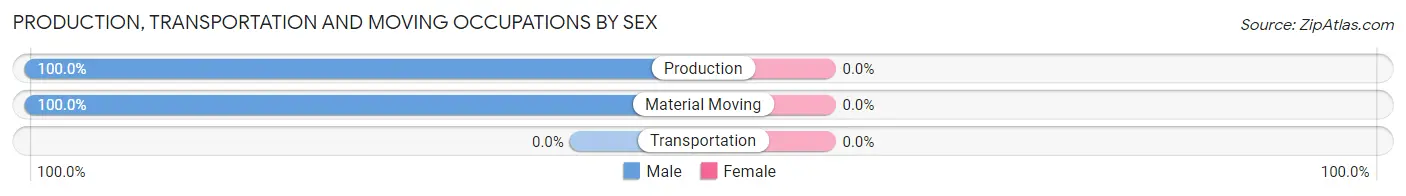
| Occupation | Male | Female |
| Production | 7 (100.0%) | 0 (0.0%) |
| Transportation | 0 (0.0%) | 0 (0.0%) |
| Material Moving | 4 (100.0%) | 0 (0.0%) |
| Total (Category) | 11 (100.0%) | 0 (0.0%) |
| Total (Overall) | 43 (68.2%) | 20 (31.8%) |
Employment Industries by Sex in Fisher
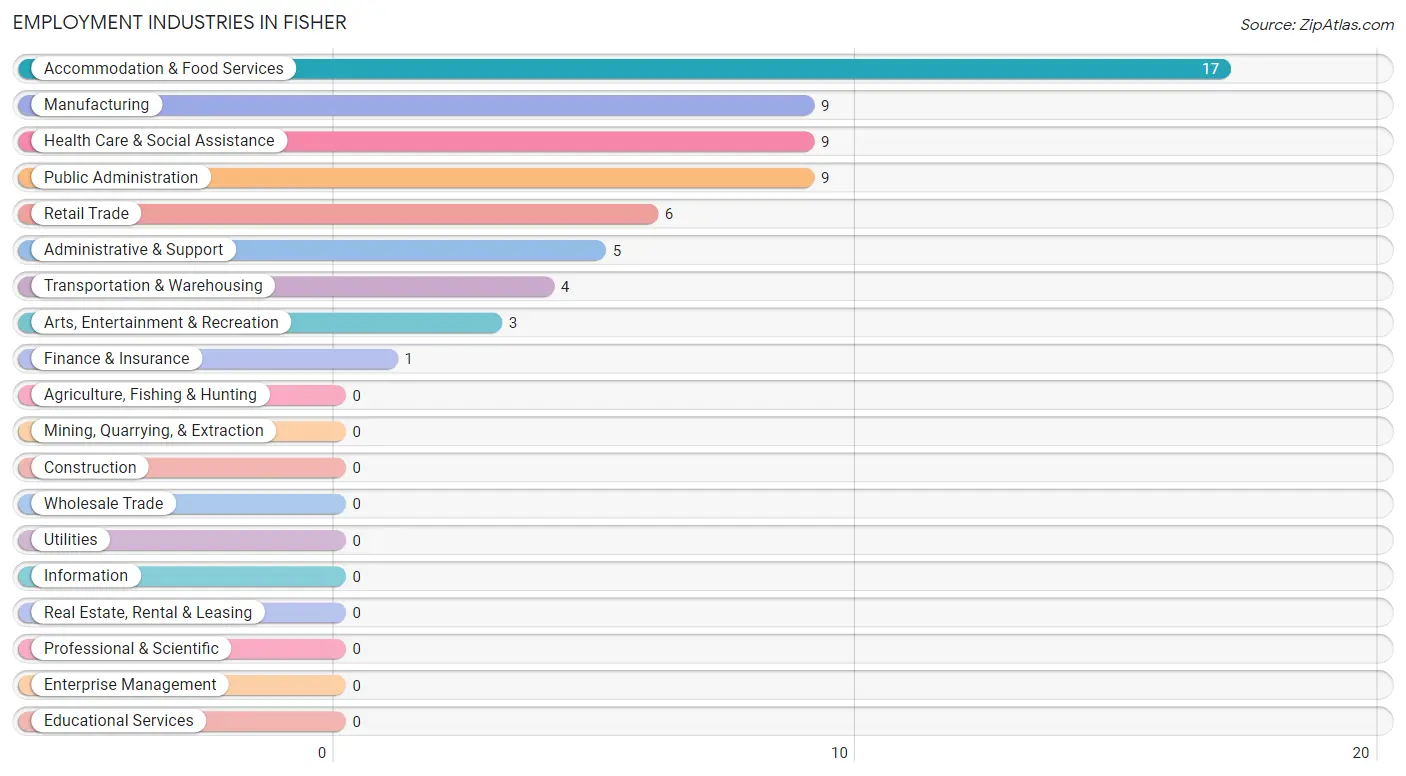
Employment Industries in Fisher
The major employment industries in Fisher include Accommodation & Food Services (17 | 27.0%), Manufacturing (9 | 14.3%), Health Care & Social Assistance (9 | 14.3%), Public Administration (9 | 14.3%), and Retail Trade (6 | 9.5%).
Employment Industries by Sex in Fisher
The Fisher industries that see more men than women are Manufacturing (100.0%), Transportation & Warehousing (100.0%), and Administrative & Support (100.0%), whereas the industries that tend to have a higher number of women are Retail Trade (100.0%), Finance & Insurance (100.0%), and Health Care & Social Assistance (100.0%).
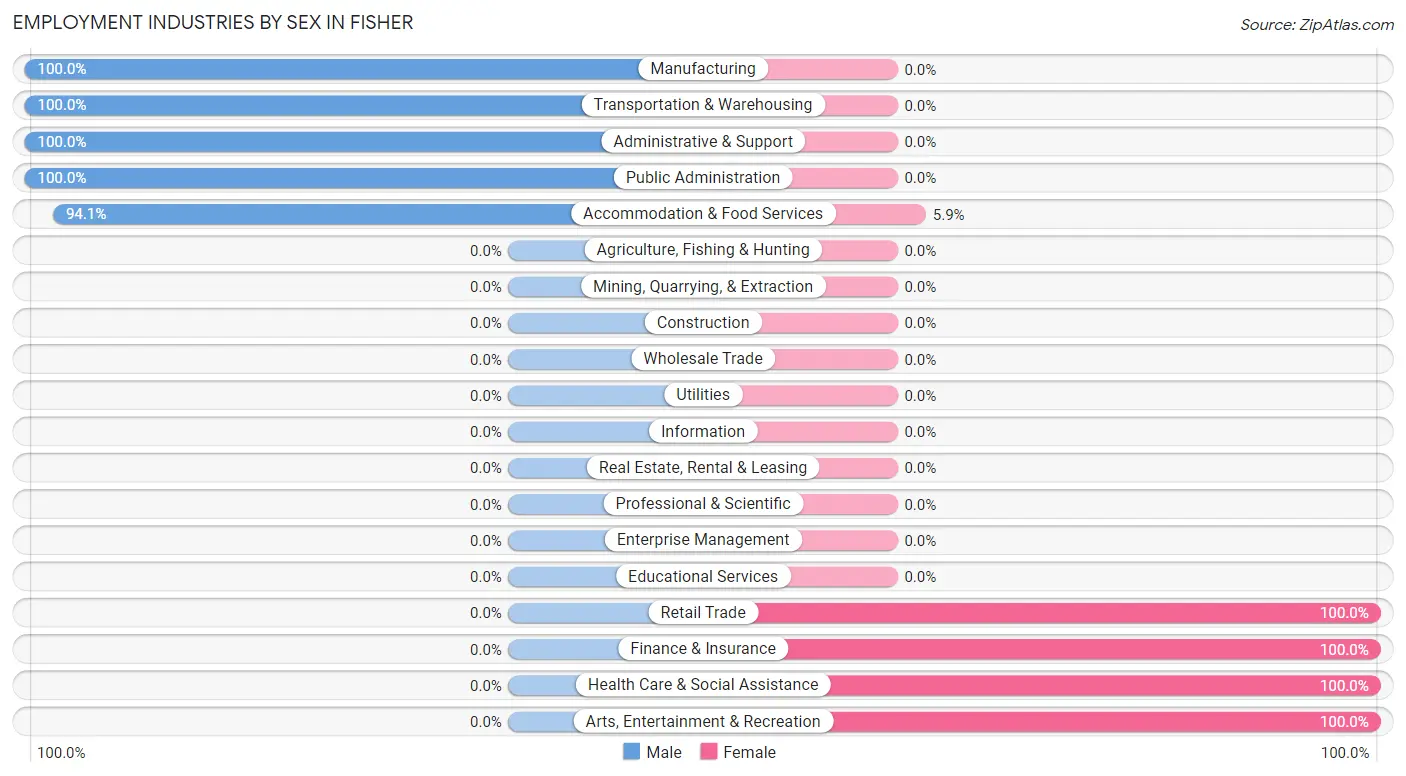
| Industry | Male | Female |
| Agriculture, Fishing & Hunting | 0 (0.0%) | 0 (0.0%) |
| Mining, Quarrying, & Extraction | 0 (0.0%) | 0 (0.0%) |
| Construction | 0 (0.0%) | 0 (0.0%) |
| Manufacturing | 9 (100.0%) | 0 (0.0%) |
| Wholesale Trade | 0 (0.0%) | 0 (0.0%) |
| Retail Trade | 0 (0.0%) | 6 (100.0%) |
| Transportation & Warehousing | 4 (100.0%) | 0 (0.0%) |
| Utilities | 0 (0.0%) | 0 (0.0%) |
| Information | 0 (0.0%) | 0 (0.0%) |
| Finance & Insurance | 0 (0.0%) | 1 (100.0%) |
| Real Estate, Rental & Leasing | 0 (0.0%) | 0 (0.0%) |
| Professional & Scientific | 0 (0.0%) | 0 (0.0%) |
| Enterprise Management | 0 (0.0%) | 0 (0.0%) |
| Administrative & Support | 5 (100.0%) | 0 (0.0%) |
| Educational Services | 0 (0.0%) | 0 (0.0%) |
| Health Care & Social Assistance | 0 (0.0%) | 9 (100.0%) |
| Arts, Entertainment & Recreation | 0 (0.0%) | 3 (100.0%) |
| Accommodation & Food Services | 16 (94.1%) | 1 (5.9%) |
| Public Administration | 9 (100.0%) | 0 (0.0%) |
| Total | 43 (68.2%) | 20 (31.8%) |
Education in Fisher
School Enrollment in Fisher
The most common levels of schooling among the 6 students in Fisher are elementary school (4 | 66.7%), and high school (2 | 33.3%).
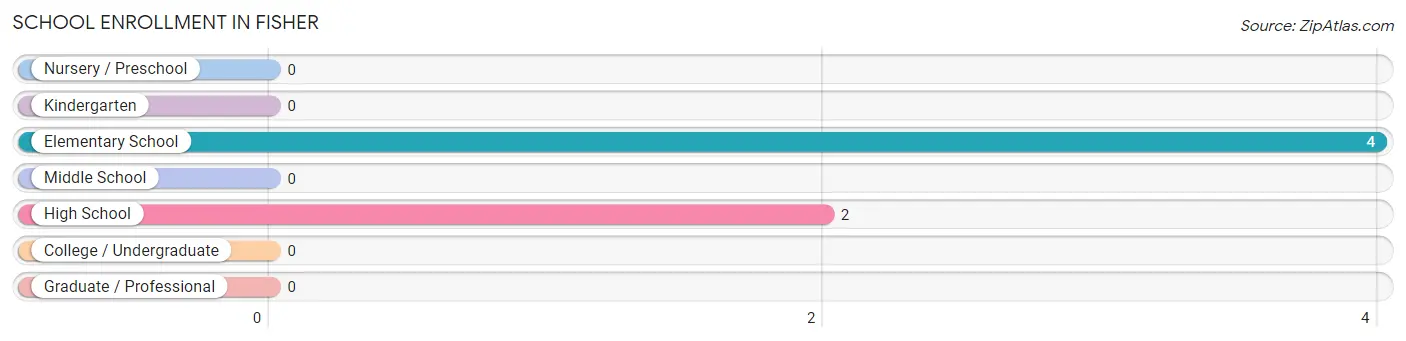
| School Level | # Students | % Students |
| Nursery / Preschool | 0 | 0.0% |
| Kindergarten | 0 | 0.0% |
| Elementary School | 4 | 66.7% |
| Middle School | 0 | 0.0% |
| High School | 2 | 33.3% |
| College / Undergraduate | 0 | 0.0% |
| Graduate / Professional | 0 | 0.0% |
| Total | 6 | 100.0% |
School Enrollment by Age by Funding Source in Fisher
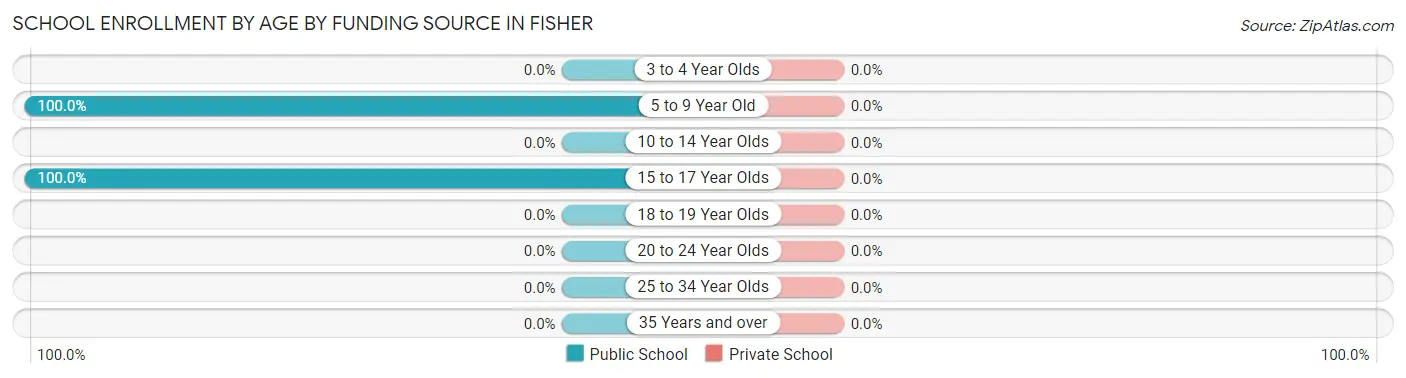
| Age Bracket | Public School | Private School |
| 3 to 4 Year Olds | 0 (0.0%) | 0 (0.0%) |
| 5 to 9 Year Old | 4 (100.0%) | 0 (0.0%) |
| 10 to 14 Year Olds | 0 (0.0%) | 0 (0.0%) |
| 15 to 17 Year Olds | 2 (100.0%) | 0 (0.0%) |
| 18 to 19 Year Olds | 0 (0.0%) | 0 (0.0%) |
| 20 to 24 Year Olds | 0 (0.0%) | 0 (0.0%) |
| 25 to 34 Year Olds | 0 (0.0%) | 0 (0.0%) |
| 35 Years and over | 0 (0.0%) | 0 (0.0%) |
| Total | 6 (100.0%) | 0 (0.0%) |
Educational Attainment by Field of Study in Fisher
Psychology (7 | 50.0%), business (5 | 35.7%), and education (2 | 14.3%) are the most common fields of study among 14 individuals in Fisher who have obtained a bachelor's degree or higher.
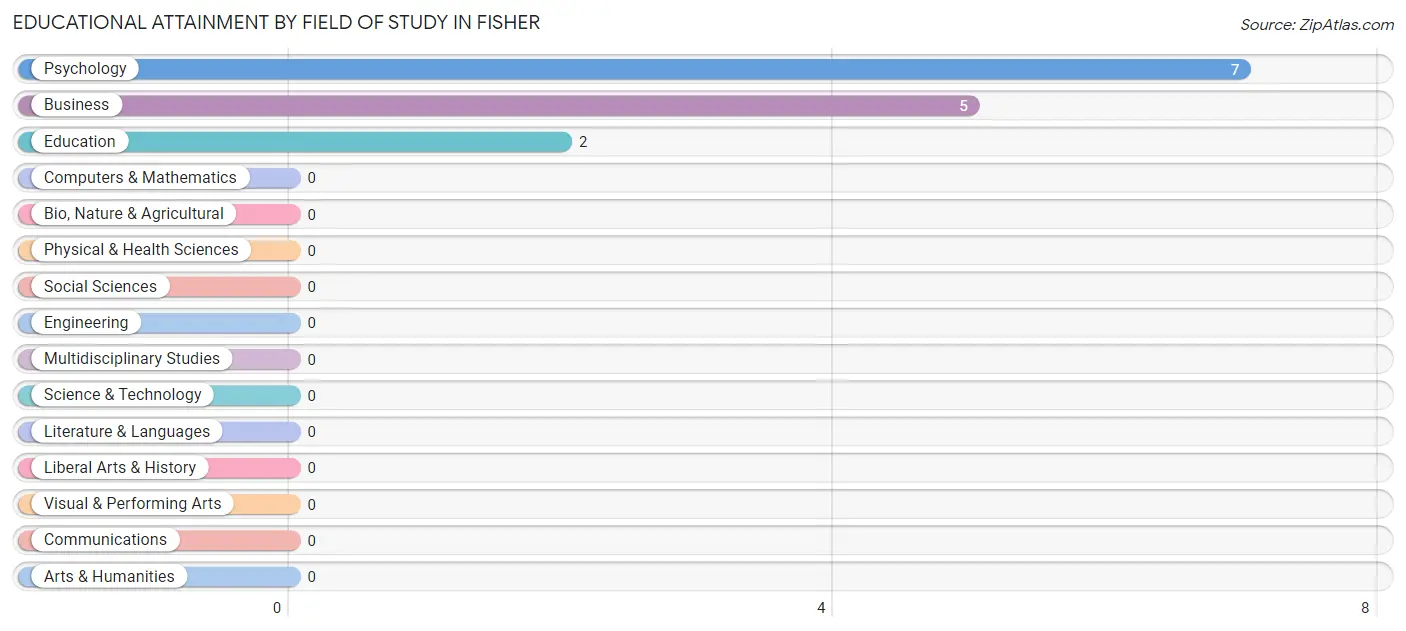
| Field of Study | # Graduates | % Graduates |
| Computers & Mathematics | 0 | 0.0% |
| Bio, Nature & Agricultural | 0 | 0.0% |
| Physical & Health Sciences | 0 | 0.0% |
| Psychology | 7 | 50.0% |
| Social Sciences | 0 | 0.0% |
| Engineering | 0 | 0.0% |
| Multidisciplinary Studies | 0 | 0.0% |
| Science & Technology | 0 | 0.0% |
| Business | 5 | 35.7% |
| Education | 2 | 14.3% |
| Literature & Languages | 0 | 0.0% |
| Liberal Arts & History | 0 | 0.0% |
| Visual & Performing Arts | 0 | 0.0% |
| Communications | 0 | 0.0% |
| Arts & Humanities | 0 | 0.0% |
| Total | 14 | 100.0% |
Transportation & Commute in Fisher
Vehicle Availability by Sex in Fisher
The most prevalent vehicle ownership categories in Fisher are males with 2 vehicles (29, accounting for 67.4%) and females with 2 vehicles (9, making up 145.0%).
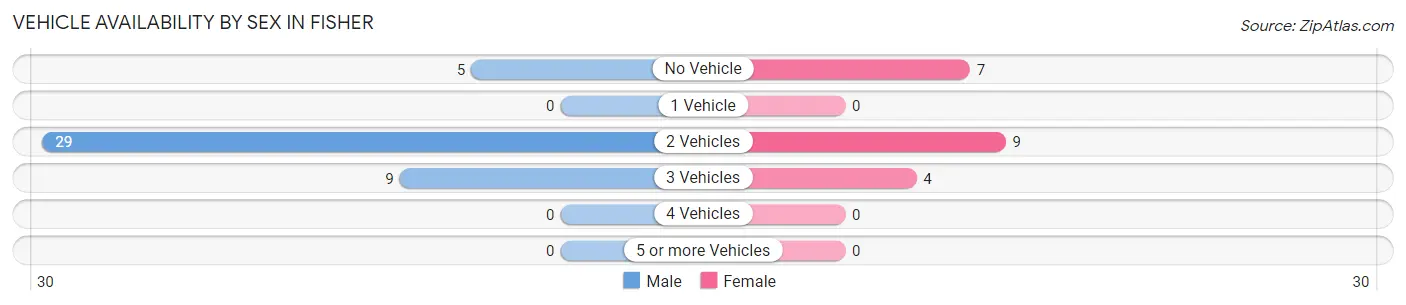
| Vehicles Available | Male | Female |
| No Vehicle | 5 (11.6%) | 7 (35.0%) |
| 1 Vehicle | 0 (0.0%) | 0 (0.0%) |
| 2 Vehicles | 29 (67.4%) | 9 (45.0%) |
| 3 Vehicles | 9 (20.9%) | 4 (20.0%) |
| 4 Vehicles | 0 (0.0%) | 0 (0.0%) |
| 5 or more Vehicles | 0 (0.0%) | 0 (0.0%) |
| Total | 43 (100.0%) | 20 (100.0%) |
Commute Time in Fisher
The most frequently occuring commute durations in Fisher are 20 to 24 minutes (17 commuters, 28.8%), 10 to 14 minutes (14 commuters, 23.7%), and 15 to 19 minutes (11 commuters, 18.6%).
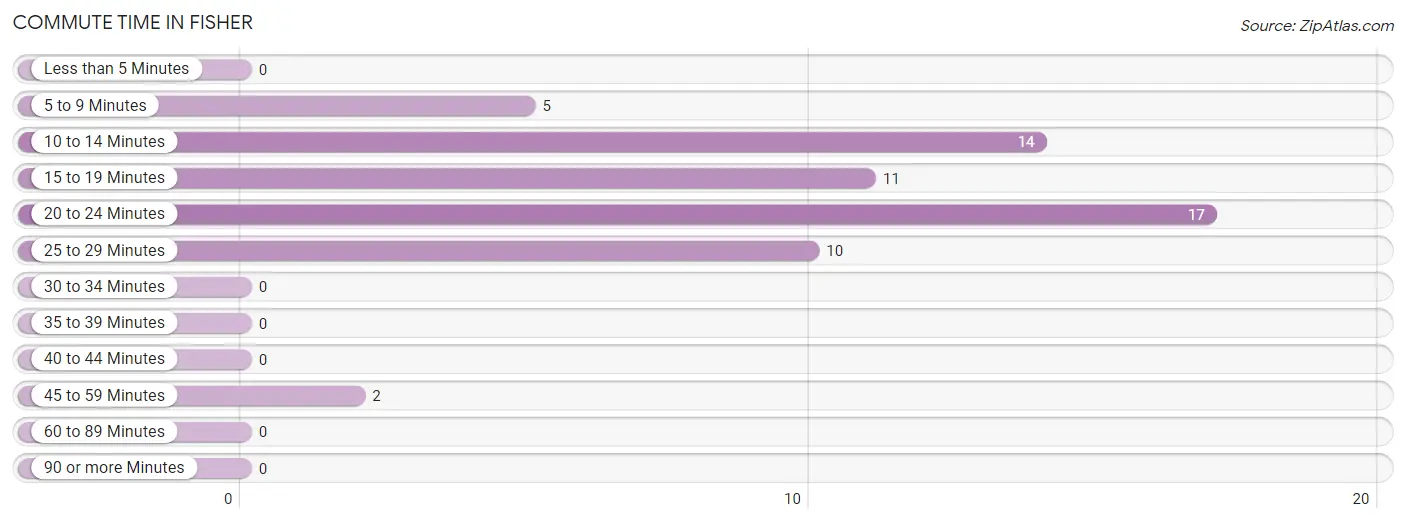
| Commute Time | # Commuters | % Commuters |
| Less than 5 Minutes | 0 | 0.0% |
| 5 to 9 Minutes | 5 | 8.5% |
| 10 to 14 Minutes | 14 | 23.7% |
| 15 to 19 Minutes | 11 | 18.6% |
| 20 to 24 Minutes | 17 | 28.8% |
| 25 to 29 Minutes | 10 | 17.0% |
| 30 to 34 Minutes | 0 | 0.0% |
| 35 to 39 Minutes | 0 | 0.0% |
| 40 to 44 Minutes | 0 | 0.0% |
| 45 to 59 Minutes | 2 | 3.4% |
| 60 to 89 Minutes | 0 | 0.0% |
| 90 or more Minutes | 0 | 0.0% |
Commute Time by Sex in Fisher
The most common commute times in Fisher are 15 to 19 minutes (11 commuters, 25.6%) for males and 10 to 14 minutes (7 commuters, 43.8%) for females.
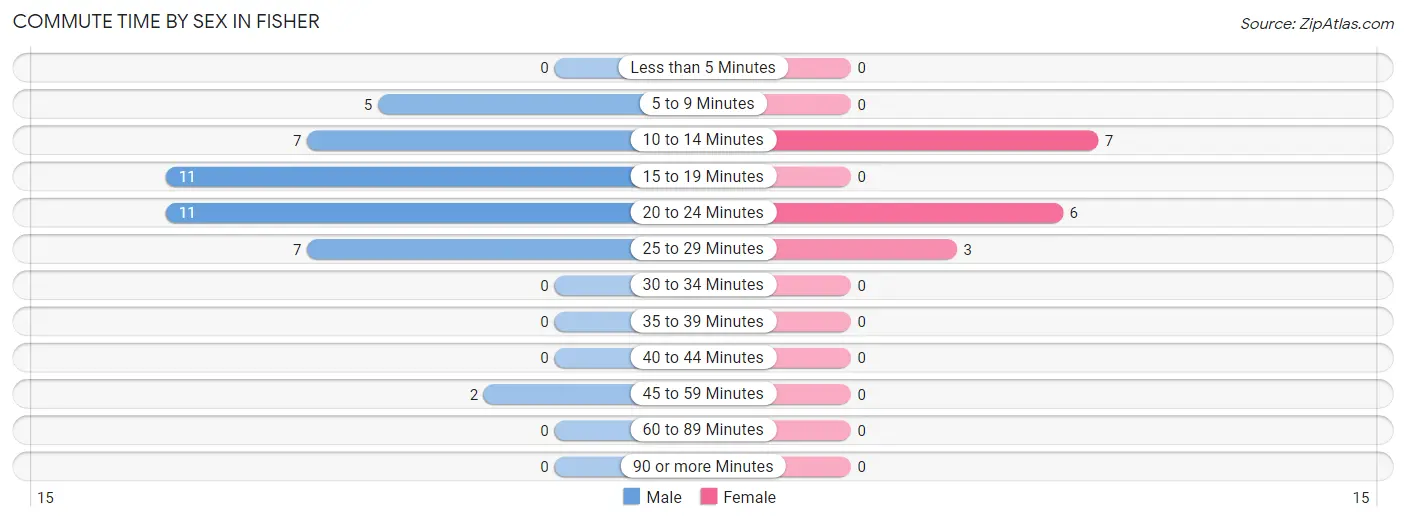
| Commute Time | Male | Female |
| Less than 5 Minutes | 0 (0.0%) | 0 (0.0%) |
| 5 to 9 Minutes | 5 (11.6%) | 0 (0.0%) |
| 10 to 14 Minutes | 7 (16.3%) | 7 (43.8%) |
| 15 to 19 Minutes | 11 (25.6%) | 0 (0.0%) |
| 20 to 24 Minutes | 11 (25.6%) | 6 (37.5%) |
| 25 to 29 Minutes | 7 (16.3%) | 3 (18.8%) |
| 30 to 34 Minutes | 0 (0.0%) | 0 (0.0%) |
| 35 to 39 Minutes | 0 (0.0%) | 0 (0.0%) |
| 40 to 44 Minutes | 0 (0.0%) | 0 (0.0%) |
| 45 to 59 Minutes | 2 (4.6%) | 0 (0.0%) |
| 60 to 89 Minutes | 0 (0.0%) | 0 (0.0%) |
| 90 or more Minutes | 0 (0.0%) | 0 (0.0%) |
Time of Departure to Work by Sex in Fisher
The most frequent times of departure to work in Fisher are 5:00 AM to 5:29 AM (14, 32.6%) for males and 7:00 AM to 7:29 AM (7, 43.8%) for females.
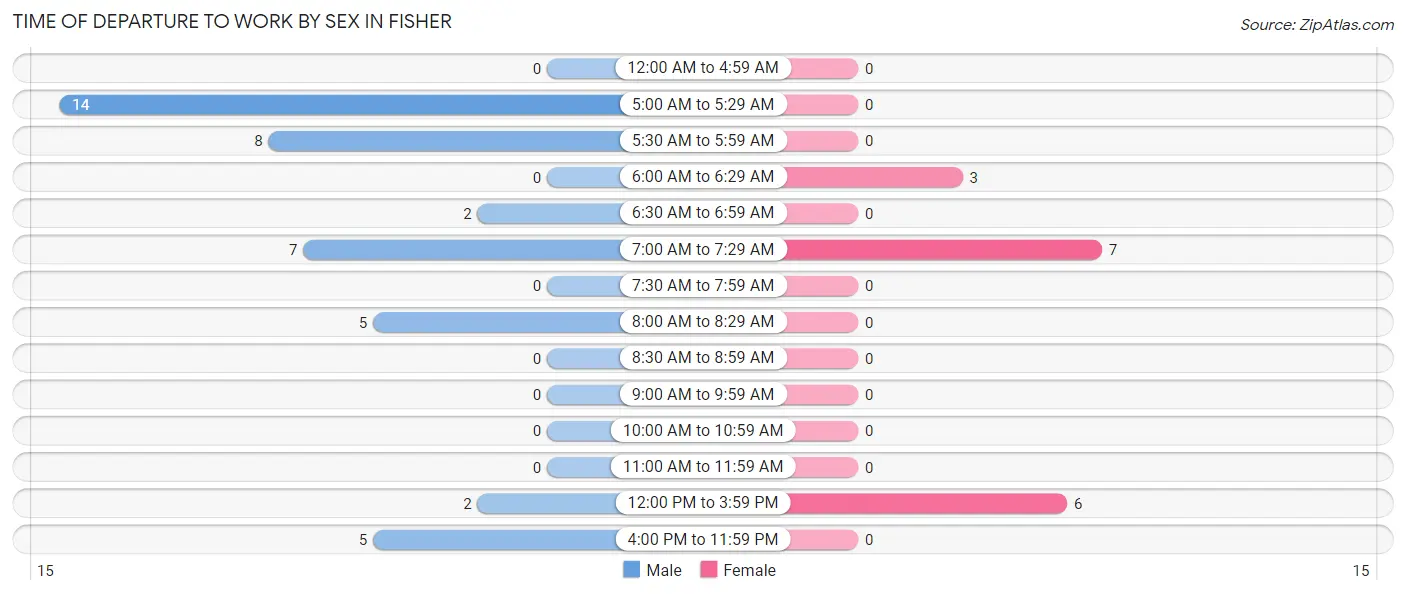
| Time of Departure | Male | Female |
| 12:00 AM to 4:59 AM | 0 (0.0%) | 0 (0.0%) |
| 5:00 AM to 5:29 AM | 14 (32.6%) | 0 (0.0%) |
| 5:30 AM to 5:59 AM | 8 (18.6%) | 0 (0.0%) |
| 6:00 AM to 6:29 AM | 0 (0.0%) | 3 (18.8%) |
| 6:30 AM to 6:59 AM | 2 (4.6%) | 0 (0.0%) |
| 7:00 AM to 7:29 AM | 7 (16.3%) | 7 (43.8%) |
| 7:30 AM to 7:59 AM | 0 (0.0%) | 0 (0.0%) |
| 8:00 AM to 8:29 AM | 5 (11.6%) | 0 (0.0%) |
| 8:30 AM to 8:59 AM | 0 (0.0%) | 0 (0.0%) |
| 9:00 AM to 9:59 AM | 0 (0.0%) | 0 (0.0%) |
| 10:00 AM to 10:59 AM | 0 (0.0%) | 0 (0.0%) |
| 11:00 AM to 11:59 AM | 0 (0.0%) | 0 (0.0%) |
| 12:00 PM to 3:59 PM | 2 (4.6%) | 6 (37.5%) |
| 4:00 PM to 11:59 PM | 5 (11.6%) | 0 (0.0%) |
| Total | 43 (100.0%) | 16 (100.0%) |
Housing Occupancy in Fisher
Occupancy by Ownership in Fisher
Of the total 67 dwellings in Fisher, owner-occupied units account for 37 (55.2%), while renter-occupied units make up 30 (44.8%).
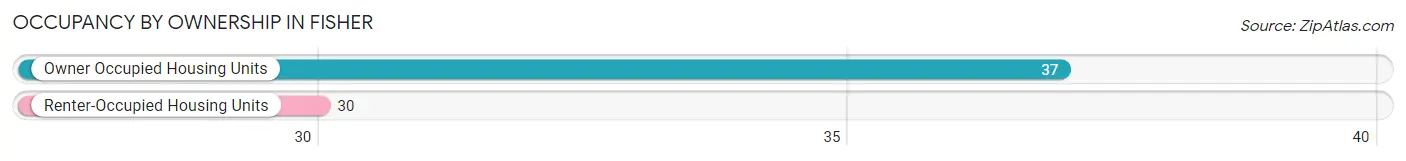
| Occupancy | # Housing Units | % Housing Units |
| Owner Occupied Housing Units | 37 | 55.2% |
| Renter-Occupied Housing Units | 30 | 44.8% |
| Total Occupied Housing Units | 67 | 100.0% |
Occupancy by Household Size in Fisher
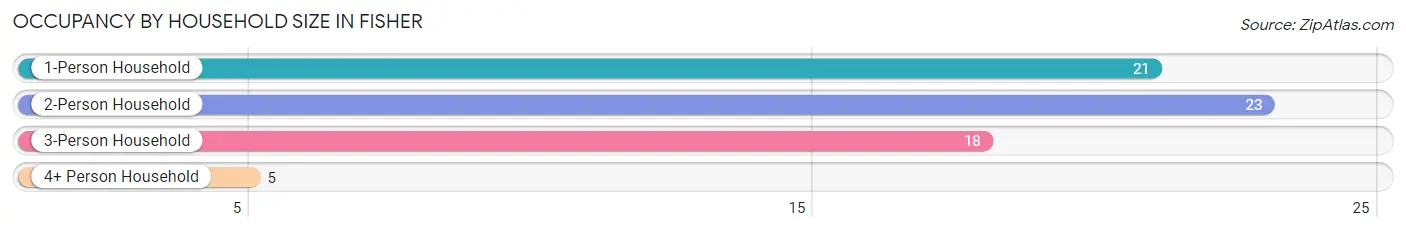
| Household Size | # Housing Units | % Housing Units |
| 1-Person Household | 21 | 31.3% |
| 2-Person Household | 23 | 34.3% |
| 3-Person Household | 18 | 26.9% |
| 4+ Person Household | 5 | 7.5% |
| Total Housing Units | 67 | 100.0% |
Occupancy by Ownership by Household Size in Fisher
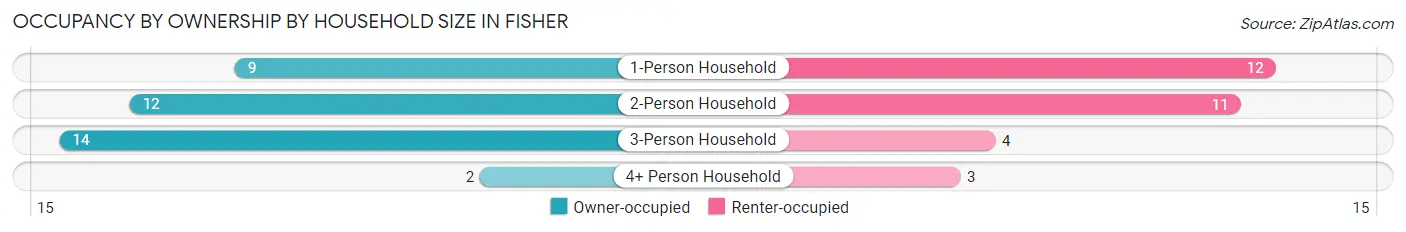
| Household Size | Owner-occupied | Renter-occupied |
| 1-Person Household | 9 (42.9%) | 12 (57.1%) |
| 2-Person Household | 12 (52.2%) | 11 (47.8%) |
| 3-Person Household | 14 (77.8%) | 4 (22.2%) |
| 4+ Person Household | 2 (40.0%) | 3 (60.0%) |
| Total Housing Units | 37 (55.2%) | 30 (44.8%) |
Occupancy by Educational Attainment in Fisher
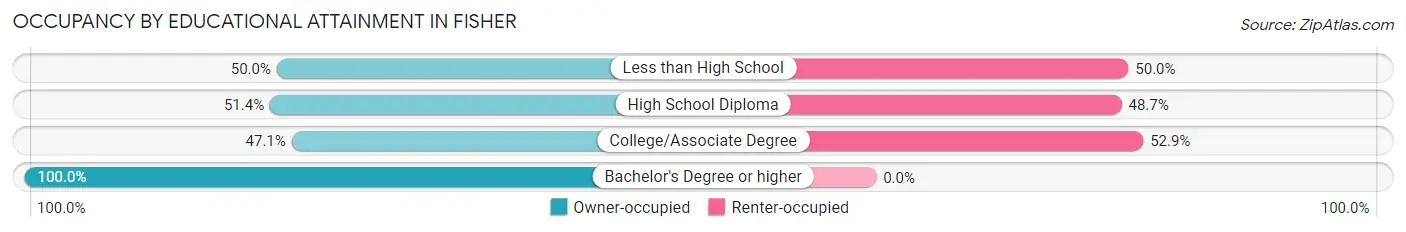
| Household Size | Owner-occupied | Renter-occupied |
| Less than High School | 3 (50.0%) | 3 (50.0%) |
| High School Diploma | 19 (51.3%) | 18 (48.6%) |
| College/Associate Degree | 8 (47.1%) | 9 (52.9%) |
| Bachelor's Degree or higher | 7 (100.0%) | 0 (0.0%) |
Occupancy by Age of Householder in Fisher
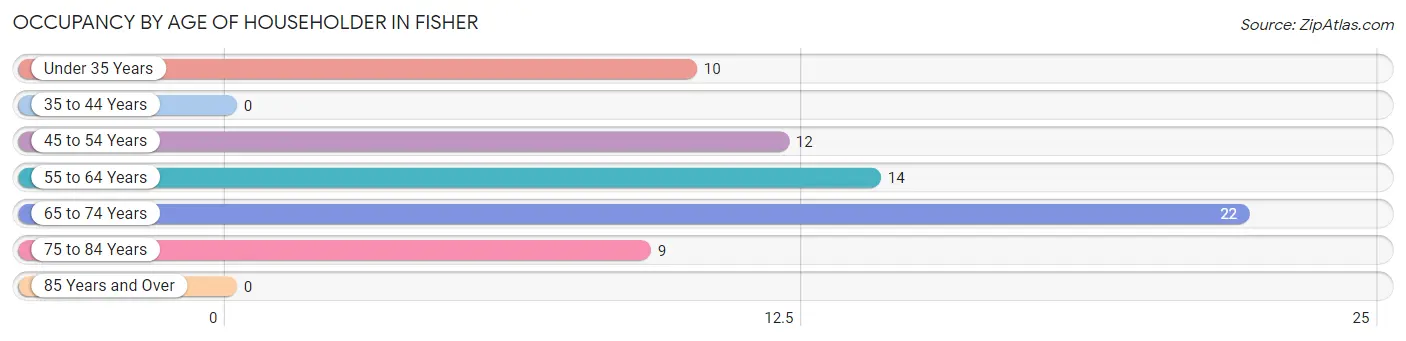
| Age Bracket | # Households | % Households |
| Under 35 Years | 10 | 14.9% |
| 35 to 44 Years | 0 | 0.0% |
| 45 to 54 Years | 12 | 17.9% |
| 55 to 64 Years | 14 | 20.9% |
| 65 to 74 Years | 22 | 32.8% |
| 75 to 84 Years | 9 | 13.4% |
| 85 Years and Over | 0 | 0.0% |
| Total | 67 | 100.0% |
Housing Finances in Fisher
Median Income by Occupancy in Fisher
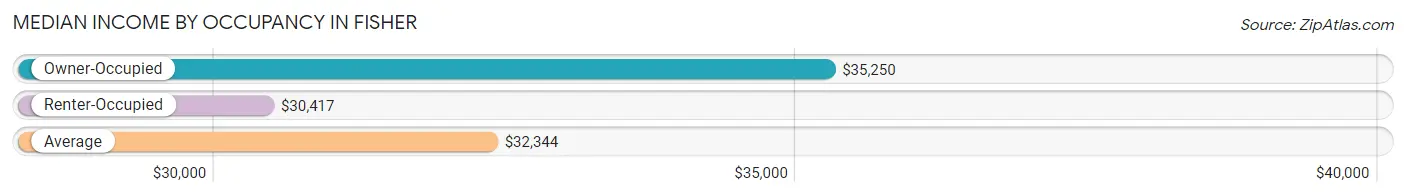
| Occupancy Type | # Households | Median Income |
| Owner-Occupied | 37 (55.2%) | $35,250 |
| Renter-Occupied | 30 (44.8%) | $30,417 |
| Average | 67 (100.0%) | $32,344 |
Occupancy by Householder Income Bracket in Fisher
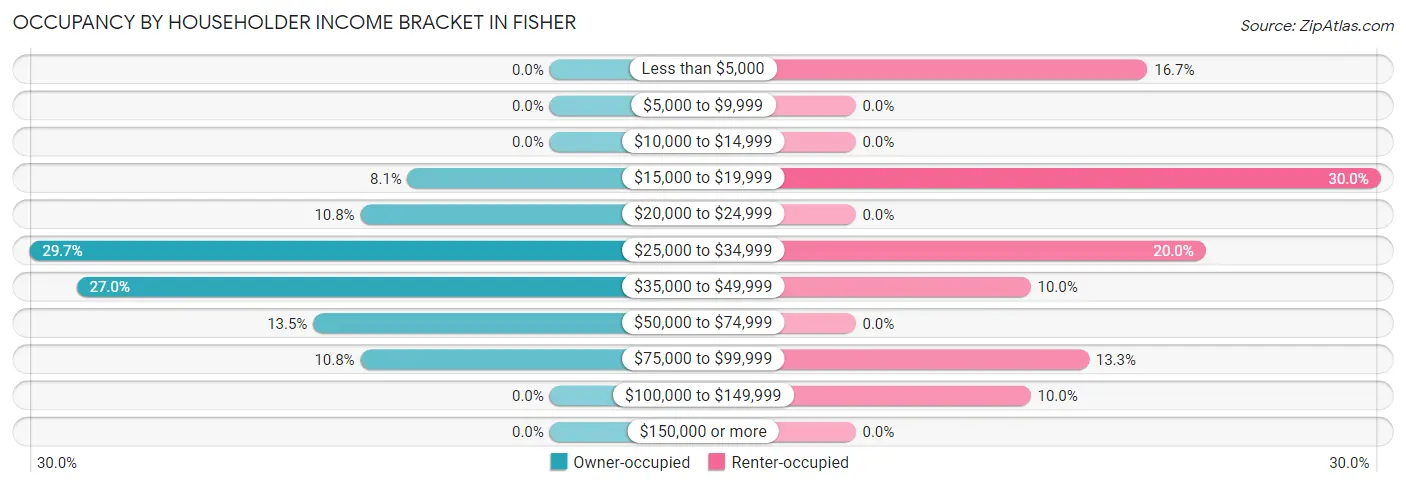
| Income Bracket | Owner-occupied | Renter-occupied |
| Less than $5,000 | 0 (0.0%) | 5 (16.7%) |
| $5,000 to $9,999 | 0 (0.0%) | 0 (0.0%) |
| $10,000 to $14,999 | 0 (0.0%) | 0 (0.0%) |
| $15,000 to $19,999 | 3 (8.1%) | 9 (30.0%) |
| $20,000 to $24,999 | 4 (10.8%) | 0 (0.0%) |
| $25,000 to $34,999 | 11 (29.7%) | 6 (20.0%) |
| $35,000 to $49,999 | 10 (27.0%) | 3 (10.0%) |
| $50,000 to $74,999 | 5 (13.5%) | 0 (0.0%) |
| $75,000 to $99,999 | 4 (10.8%) | 4 (13.3%) |
| $100,000 to $149,999 | 0 (0.0%) | 3 (10.0%) |
| $150,000 or more | 0 (0.0%) | 0 (0.0%) |
| Total | 37 (100.0%) | 30 (100.0%) |
Monthly Housing Cost Tiers in Fisher
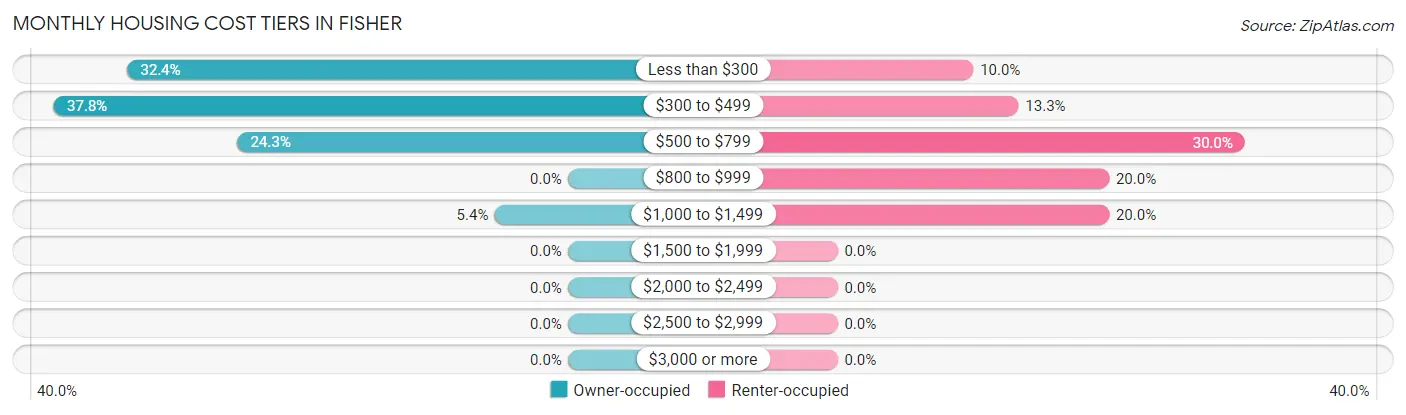
| Monthly Cost | Owner-occupied | Renter-occupied |
| Less than $300 | 12 (32.4%) | 3 (10.0%) |
| $300 to $499 | 14 (37.8%) | 4 (13.3%) |
| $500 to $799 | 9 (24.3%) | 9 (30.0%) |
| $800 to $999 | 0 (0.0%) | 6 (20.0%) |
| $1,000 to $1,499 | 2 (5.4%) | 6 (20.0%) |
| $1,500 to $1,999 | 0 (0.0%) | 0 (0.0%) |
| $2,000 to $2,499 | 0 (0.0%) | 0 (0.0%) |
| $2,500 to $2,999 | 0 (0.0%) | 0 (0.0%) |
| $3,000 or more | 0 (0.0%) | 0 (0.0%) |
| Total | 37 (100.0%) | 30 (100.0%) |
Physical Housing Characteristics in Fisher
Housing Structures in Fisher
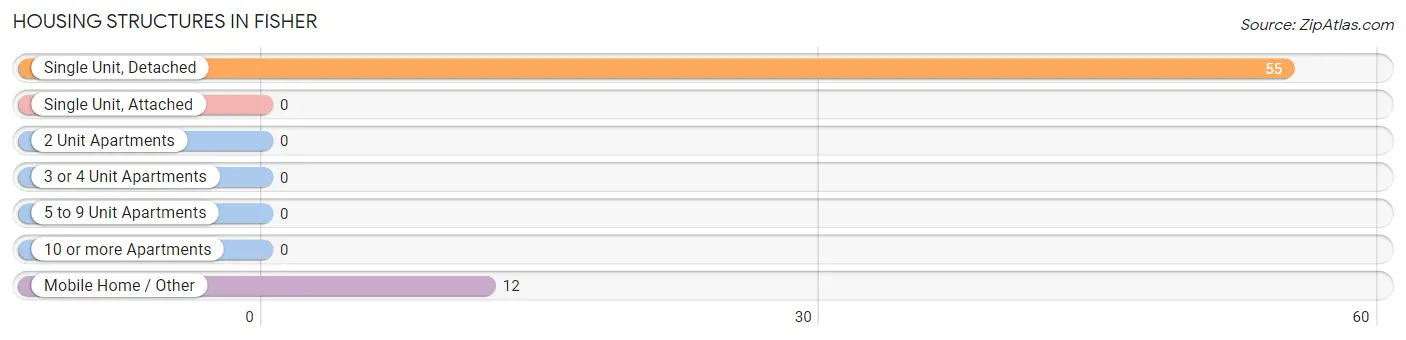
| Structure Type | # Housing Units | % Housing Units |
| Single Unit, Detached | 55 | 82.1% |
| Single Unit, Attached | 0 | 0.0% |
| 2 Unit Apartments | 0 | 0.0% |
| 3 or 4 Unit Apartments | 0 | 0.0% |
| 5 to 9 Unit Apartments | 0 | 0.0% |
| 10 or more Apartments | 0 | 0.0% |
| Mobile Home / Other | 12 | 17.9% |
| Total | 67 | 100.0% |
Housing Structures by Occupancy in Fisher
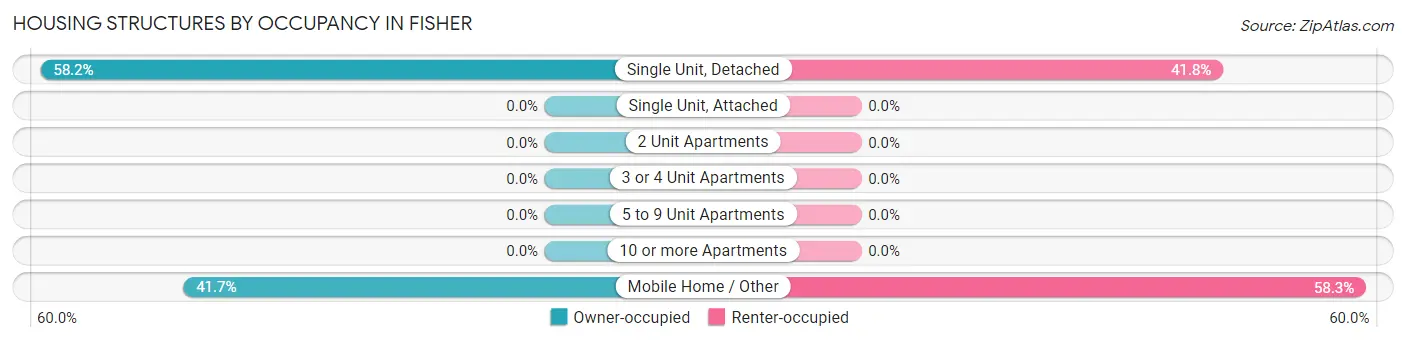
| Structure Type | Owner-occupied | Renter-occupied |
| Single Unit, Detached | 32 (58.2%) | 23 (41.8%) |
| Single Unit, Attached | 0 (0.0%) | 0 (0.0%) |
| 2 Unit Apartments | 0 (0.0%) | 0 (0.0%) |
| 3 or 4 Unit Apartments | 0 (0.0%) | 0 (0.0%) |
| 5 to 9 Unit Apartments | 0 (0.0%) | 0 (0.0%) |
| 10 or more Apartments | 0 (0.0%) | 0 (0.0%) |
| Mobile Home / Other | 5 (41.7%) | 7 (58.3%) |
| Total | 37 (55.2%) | 30 (44.8%) |
Housing Structures by Number of Rooms in Fisher
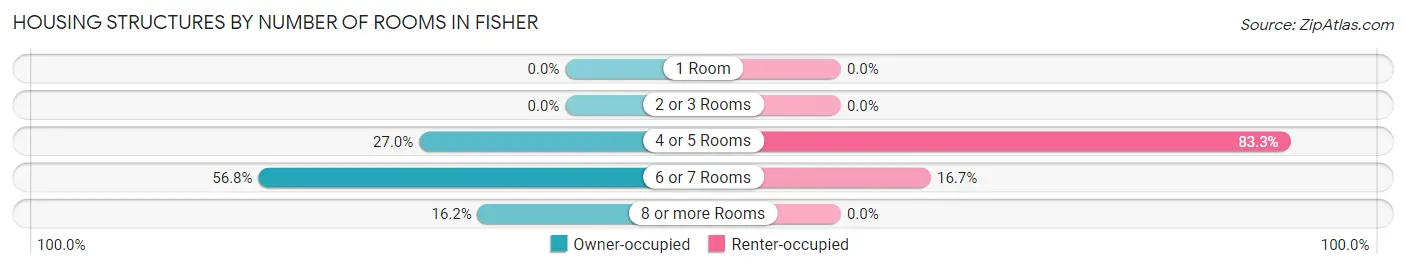
| Number of Rooms | Owner-occupied | Renter-occupied |
| 1 Room | 0 (0.0%) | 0 (0.0%) |
| 2 or 3 Rooms | 0 (0.0%) | 0 (0.0%) |
| 4 or 5 Rooms | 10 (27.0%) | 25 (83.3%) |
| 6 or 7 Rooms | 21 (56.8%) | 5 (16.7%) |
| 8 or more Rooms | 6 (16.2%) | 0 (0.0%) |
| Total | 37 (100.0%) | 30 (100.0%) |
Housing Structure by Heating Type in Fisher
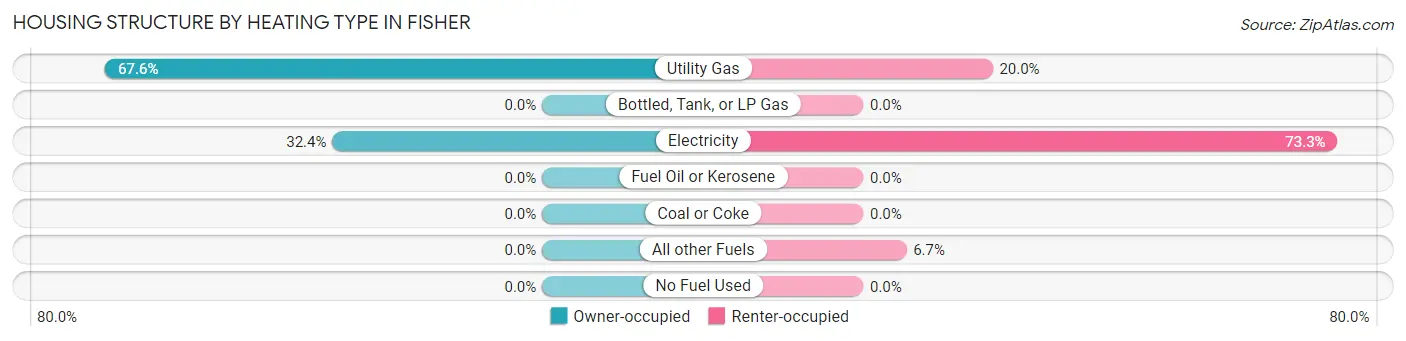
| Heating Type | Owner-occupied | Renter-occupied |
| Utility Gas | 25 (67.6%) | 6 (20.0%) |
| Bottled, Tank, or LP Gas | 0 (0.0%) | 0 (0.0%) |
| Electricity | 12 (32.4%) | 22 (73.3%) |
| Fuel Oil or Kerosene | 0 (0.0%) | 0 (0.0%) |
| Coal or Coke | 0 (0.0%) | 0 (0.0%) |
| All other Fuels | 0 (0.0%) | 2 (6.7%) |
| No Fuel Used | 0 (0.0%) | 0 (0.0%) |
| Total | 37 (100.0%) | 30 (100.0%) |
Household Vehicle Usage in Fisher
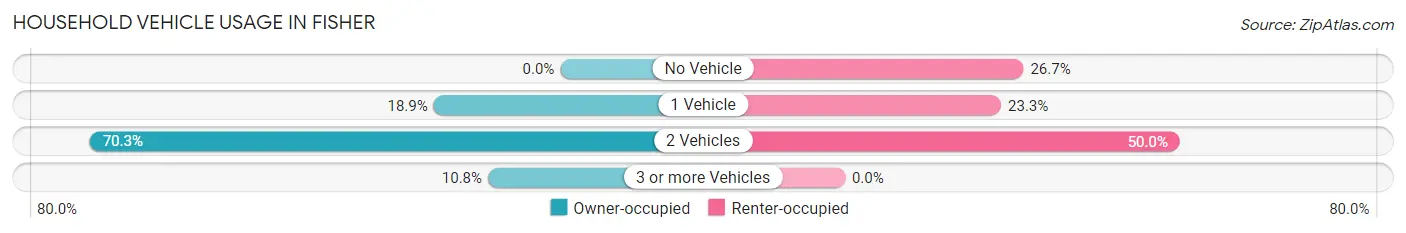
| Vehicles per Household | Owner-occupied | Renter-occupied |
| No Vehicle | 0 (0.0%) | 8 (26.7%) |
| 1 Vehicle | 7 (18.9%) | 7 (23.3%) |
| 2 Vehicles | 26 (70.3%) | 15 (50.0%) |
| 3 or more Vehicles | 4 (10.8%) | 0 (0.0%) |
| Total | 37 (100.0%) | 30 (100.0%) |
Real Estate & Mortgages in Fisher
Real Estate and Mortgage Overview in Fisher
| Characteristic | Without Mortgage | With Mortgage |
| Housing Units | 33 | 4 |
| Median Property Value | - | - |
| Median Household Income | $35,250 | $0 |
| Monthly Housing Costs | $323 | $0 |
| Real Estate Taxes | $199 | $2 |
Property Value by Mortgage Status in Fisher
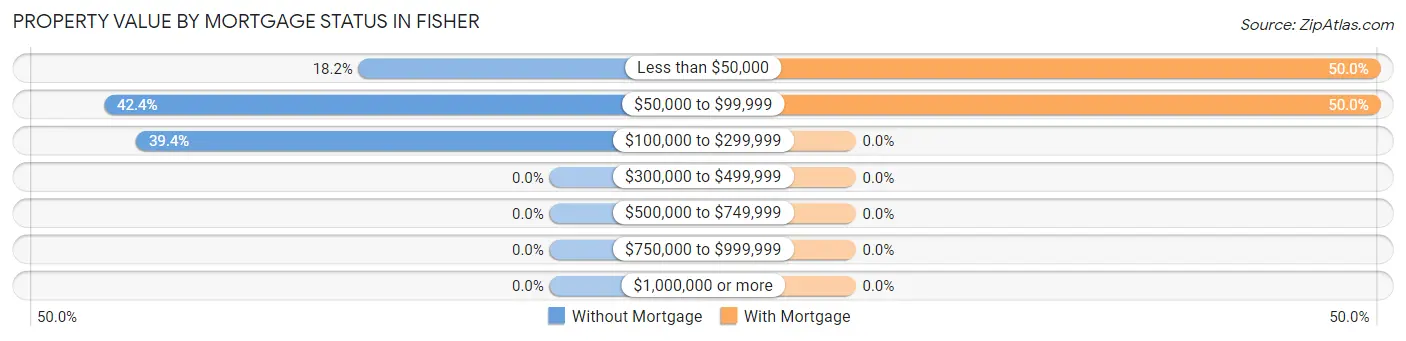
| Property Value | Without Mortgage | With Mortgage |
| Less than $50,000 | 6 (18.2%) | 2 (50.0%) |
| $50,000 to $99,999 | 14 (42.4%) | 2 (50.0%) |
| $100,000 to $299,999 | 13 (39.4%) | 0 (0.0%) |
| $300,000 to $499,999 | 0 (0.0%) | 0 (0.0%) |
| $500,000 to $749,999 | 0 (0.0%) | 0 (0.0%) |
| $750,000 to $999,999 | 0 (0.0%) | 0 (0.0%) |
| $1,000,000 or more | 0 (0.0%) | 0 (0.0%) |
| Total | 33 (100.0%) | 4 (100.0%) |
Household Income by Mortgage Status in Fisher
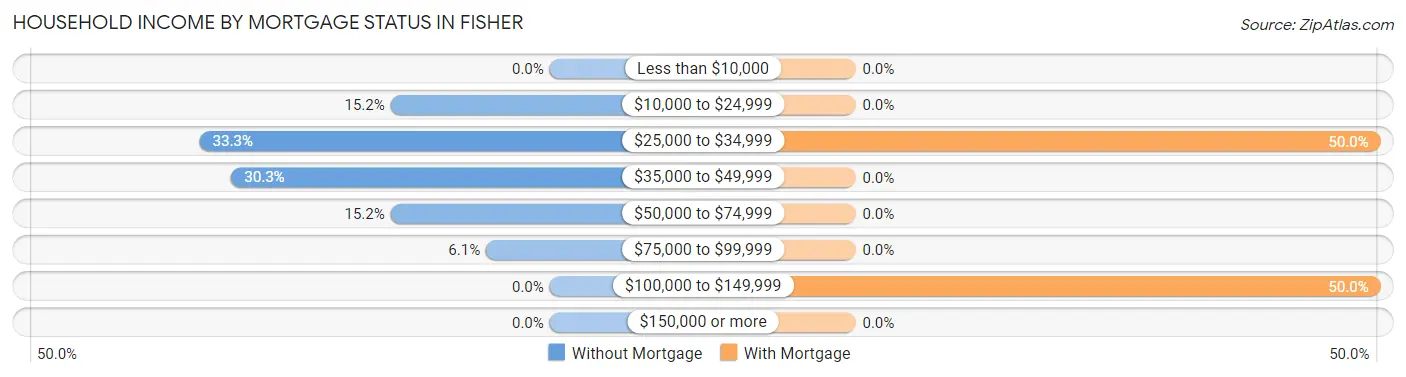
| Household Income | Without Mortgage | With Mortgage |
| Less than $10,000 | 0 (0.0%) | 0 (0.0%) |
| $10,000 to $24,999 | 5 (15.1%) | 0 (0.0%) |
| $25,000 to $34,999 | 11 (33.3%) | 2 (50.0%) |
| $35,000 to $49,999 | 10 (30.3%) | 0 (0.0%) |
| $50,000 to $74,999 | 5 (15.1%) | 0 (0.0%) |
| $75,000 to $99,999 | 2 (6.1%) | 0 (0.0%) |
| $100,000 to $149,999 | 0 (0.0%) | 2 (50.0%) |
| $150,000 or more | 0 (0.0%) | 0 (0.0%) |
| Total | 33 (100.0%) | 4 (100.0%) |
Property Value to Household Income Ratio in Fisher
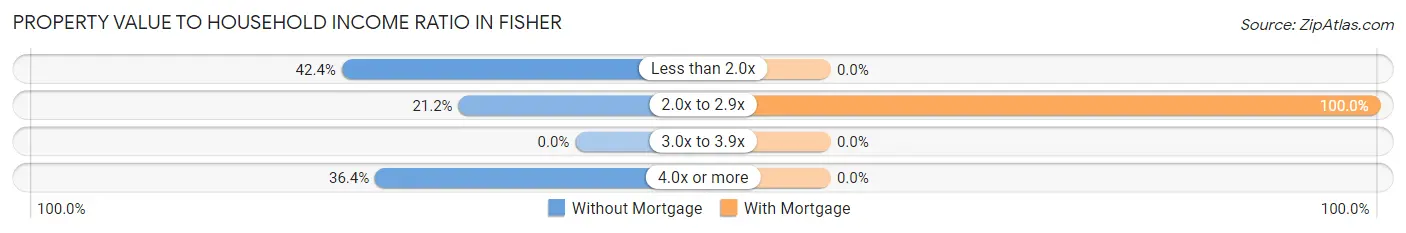
| Value-to-Income Ratio | Without Mortgage | With Mortgage |
| Less than 2.0x | 14 (42.4%) | 0 (0.0%) |
| 2.0x to 2.9x | 7 (21.2%) | 4 (100.0%) |
| 3.0x to 3.9x | 0 (0.0%) | 0 (0.0%) |
| 4.0x or more | 12 (36.4%) | 0 (0.0%) |
| Total | 33 (100.0%) | 4 (100.0%) |
Real Estate Taxes by Mortgage Status in Fisher
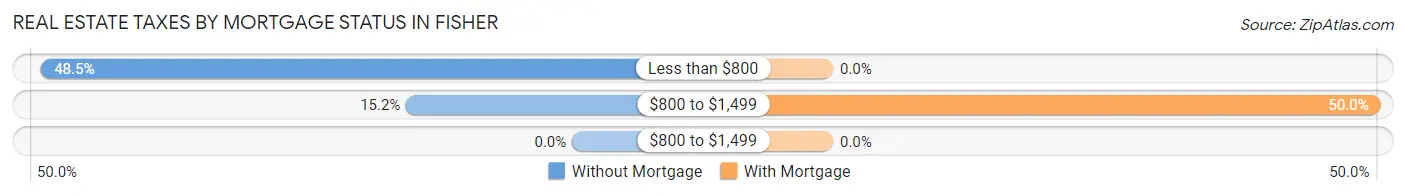
| Property Taxes | Without Mortgage | With Mortgage |
| Less than $800 | 16 (48.5%) | 0 (0.0%) |
| $800 to $1,499 | 5 (15.1%) | 2 (50.0%) |
| $800 to $1,499 | 0 (0.0%) | 0 (0.0%) |
| Total | 33 (100.0%) | 4 (100.0%) |
Health & Disability in Fisher
Health Insurance Coverage by Age in Fisher
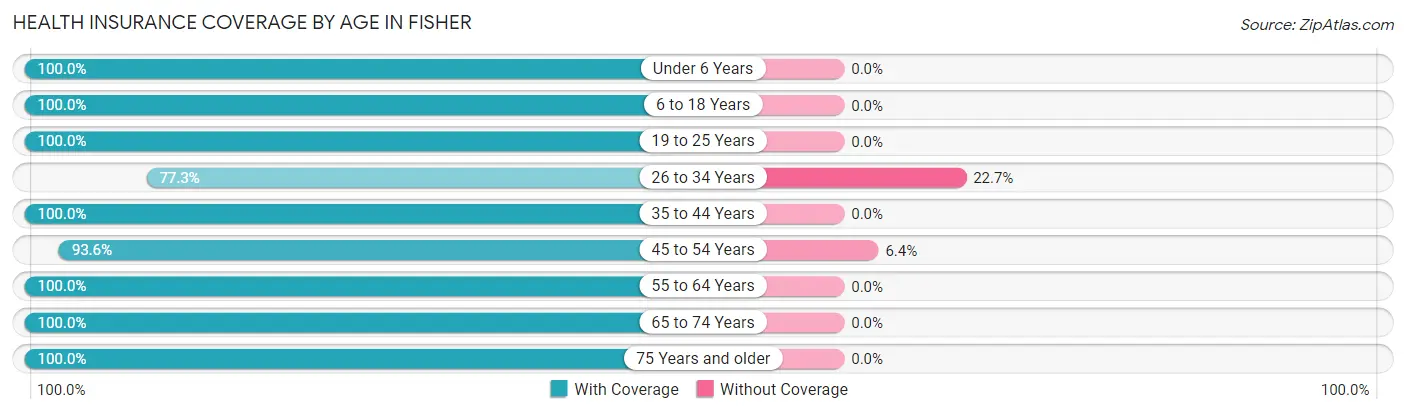
| Age Bracket | With Coverage | Without Coverage |
| Under 6 Years | 25 (100.0%) | 0 (0.0%) |
| 6 to 18 Years | 6 (100.0%) | 0 (0.0%) |
| 19 to 25 Years | 9 (100.0%) | 0 (0.0%) |
| 26 to 34 Years | 17 (77.3%) | 5 (22.7%) |
| 35 to 44 Years | 5 (100.0%) | 0 (0.0%) |
| 45 to 54 Years | 44 (93.6%) | 3 (6.4%) |
| 55 to 64 Years | 18 (100.0%) | 0 (0.0%) |
| 65 to 74 Years | 47 (100.0%) | 0 (0.0%) |
| 75 Years and older | 20 (100.0%) | 0 (0.0%) |
| Total | 191 (96.0%) | 8 (4.0%) |
Health Insurance Coverage by Citizenship Status in Fisher
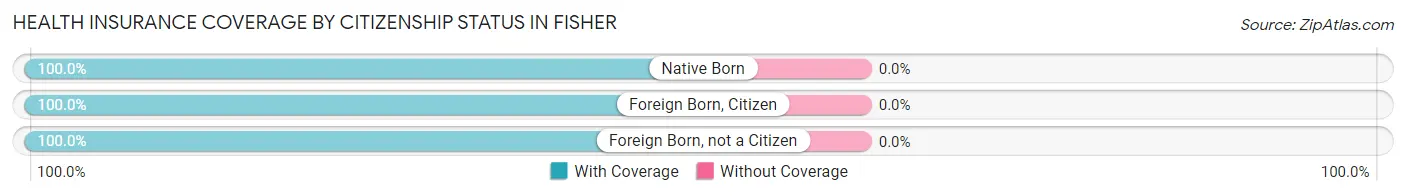
| Citizenship Status | With Coverage | Without Coverage |
| Native Born | 25 (100.0%) | 0 (0.0%) |
| Foreign Born, Citizen | 6 (100.0%) | 0 (0.0%) |
| Foreign Born, not a Citizen | 9 (100.0%) | 0 (0.0%) |
Health Insurance Coverage by Household Income in Fisher
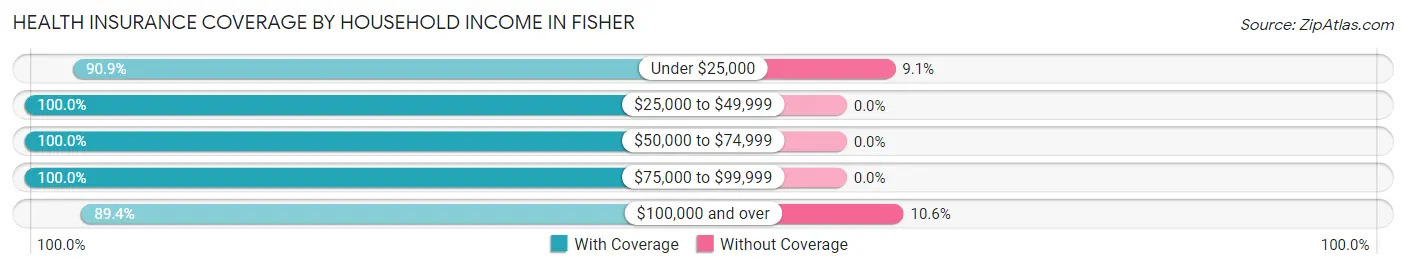
| Household Income | With Coverage | Without Coverage |
| Under $25,000 | 30 (90.9%) | 3 (9.1%) |
| $25,000 to $49,999 | 87 (100.0%) | 0 (0.0%) |
| $50,000 to $74,999 | 11 (100.0%) | 0 (0.0%) |
| $75,000 to $99,999 | 21 (100.0%) | 0 (0.0%) |
| $100,000 and over | 42 (89.4%) | 5 (10.6%) |
Public vs Private Health Insurance Coverage by Age in Fisher
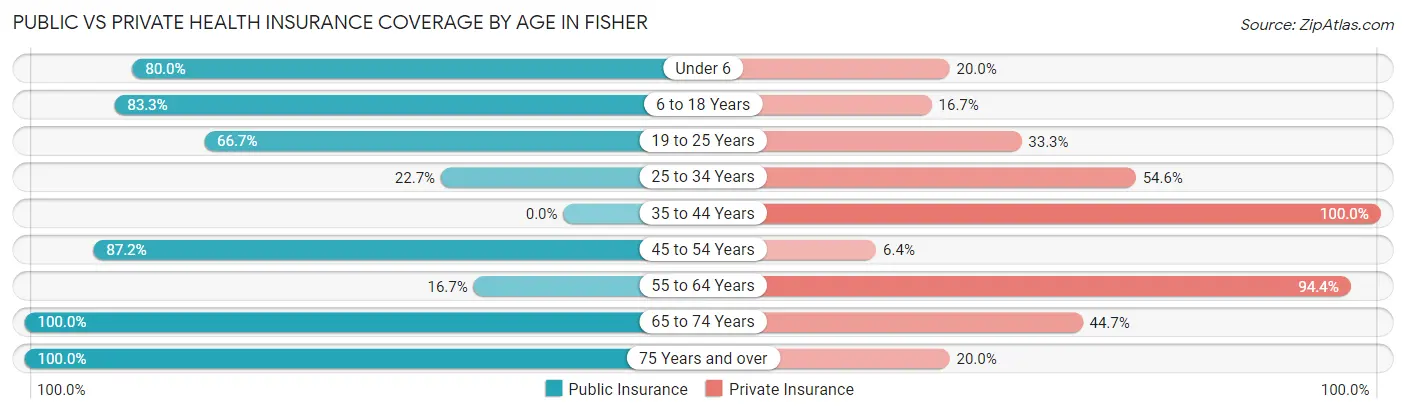
| Age Bracket | Public Insurance | Private Insurance |
| Under 6 | 20 (80.0%) | 5 (20.0%) |
| 6 to 18 Years | 5 (83.3%) | 1 (16.7%) |
| 19 to 25 Years | 6 (66.7%) | 3 (33.3%) |
| 25 to 34 Years | 5 (22.7%) | 12 (54.5%) |
| 35 to 44 Years | 0 (0.0%) | 5 (100.0%) |
| 45 to 54 Years | 41 (87.2%) | 3 (6.4%) |
| 55 to 64 Years | 3 (16.7%) | 17 (94.4%) |
| 65 to 74 Years | 47 (100.0%) | 21 (44.7%) |
| 75 Years and over | 20 (100.0%) | 4 (20.0%) |
| Total | 147 (73.9%) | 71 (35.7%) |
Disability Status by Sex by Age in Fisher
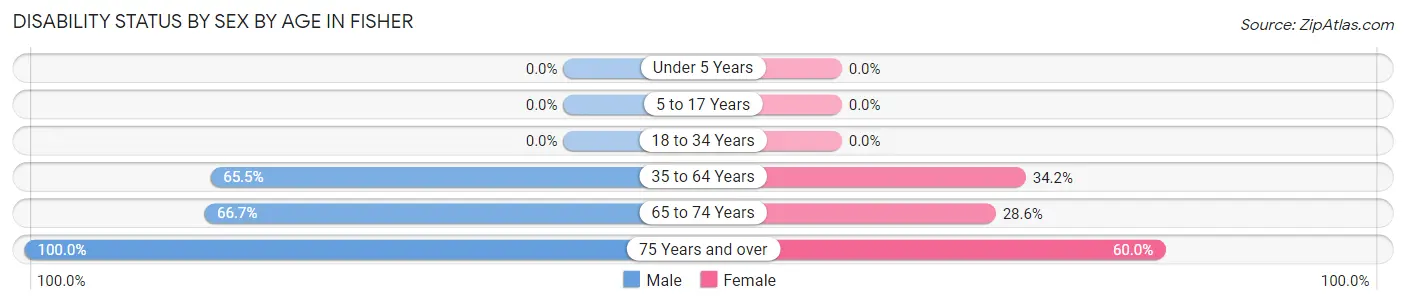
| Age Bracket | Male | Female |
| Under 5 Years | 0 (0.0%) | 0 (0.0%) |
| 5 to 17 Years | 0 (0.0%) | 0 (0.0%) |
| 18 to 34 Years | 0 (0.0%) | 0 (0.0%) |
| 35 to 64 Years | 19 (65.5%) | 14 (34.2%) |
| 65 to 74 Years | 8 (66.7%) | 10 (28.6%) |
| 75 Years and over | 10 (100.0%) | 6 (60.0%) |
Disability Class by Sex by Age in Fisher
Disability Class: Hearing Difficulty
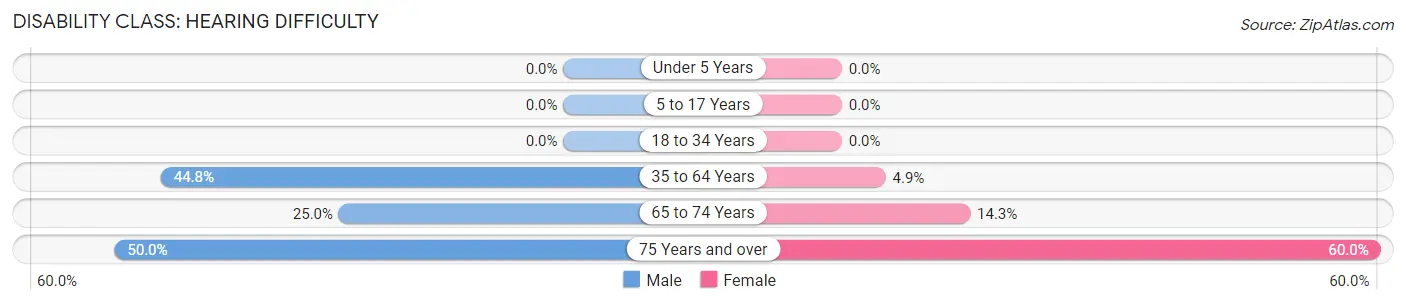
| Age Bracket | Male | Female |
| Under 5 Years | 0 (0.0%) | 0 (0.0%) |
| 5 to 17 Years | 0 (0.0%) | 0 (0.0%) |
| 18 to 34 Years | 0 (0.0%) | 0 (0.0%) |
| 35 to 64 Years | 13 (44.8%) | 2 (4.9%) |
| 65 to 74 Years | 3 (25.0%) | 5 (14.3%) |
| 75 Years and over | 5 (50.0%) | 6 (60.0%) |
Disability Class: Vision Difficulty
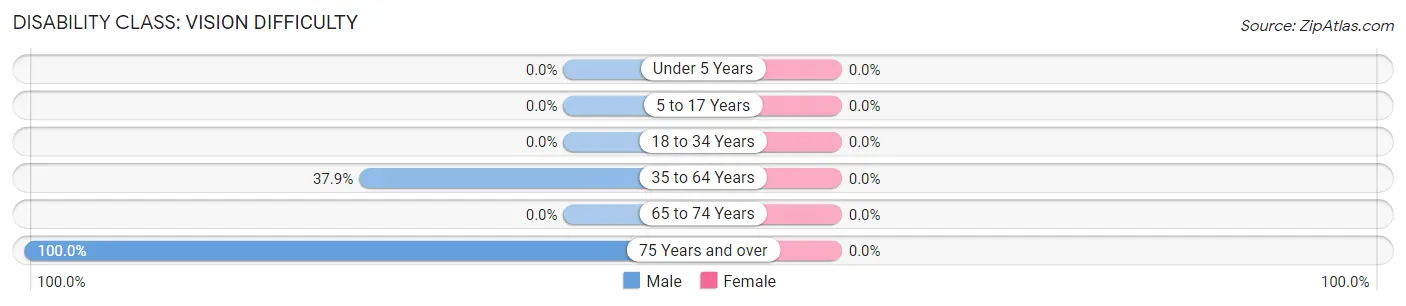
| Age Bracket | Male | Female |
| Under 5 Years | 0 (0.0%) | 0 (0.0%) |
| 5 to 17 Years | 0 (0.0%) | 0 (0.0%) |
| 18 to 34 Years | 0 (0.0%) | 0 (0.0%) |
| 35 to 64 Years | 11 (37.9%) | 0 (0.0%) |
| 65 to 74 Years | 0 (0.0%) | 0 (0.0%) |
| 75 Years and over | 10 (100.0%) | 0 (0.0%) |
Disability Class: Cognitive Difficulty
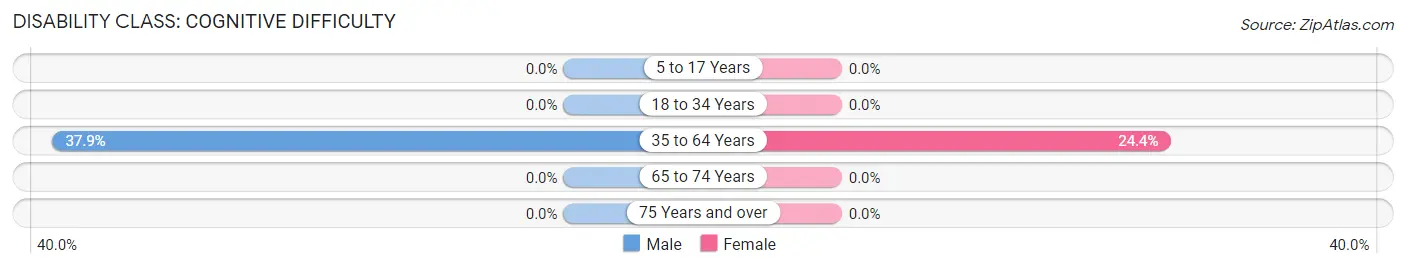
| Age Bracket | Male | Female |
| 5 to 17 Years | 0 (0.0%) | 0 (0.0%) |
| 18 to 34 Years | 0 (0.0%) | 0 (0.0%) |
| 35 to 64 Years | 11 (37.9%) | 10 (24.4%) |
| 65 to 74 Years | 0 (0.0%) | 0 (0.0%) |
| 75 Years and over | 0 (0.0%) | 0 (0.0%) |
Disability Class: Ambulatory Difficulty
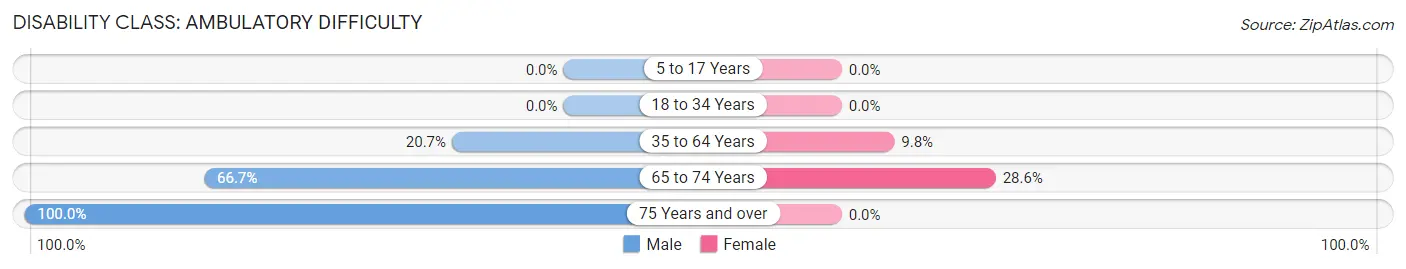
| Age Bracket | Male | Female |
| 5 to 17 Years | 0 (0.0%) | 0 (0.0%) |
| 18 to 34 Years | 0 (0.0%) | 0 (0.0%) |
| 35 to 64 Years | 6 (20.7%) | 4 (9.8%) |
| 65 to 74 Years | 8 (66.7%) | 10 (28.6%) |
| 75 Years and over | 10 (100.0%) | 0 (0.0%) |
Disability Class: Self-Care Difficulty
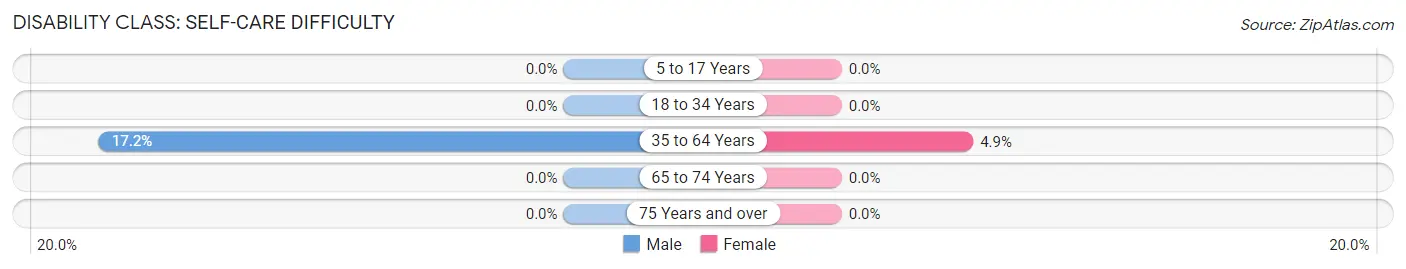
| Age Bracket | Male | Female |
| 5 to 17 Years | 0 (0.0%) | 0 (0.0%) |
| 18 to 34 Years | 0 (0.0%) | 0 (0.0%) |
| 35 to 64 Years | 5 (17.2%) | 2 (4.9%) |
| 65 to 74 Years | 0 (0.0%) | 0 (0.0%) |
| 75 Years and over | 0 (0.0%) | 0 (0.0%) |
Technology Access in Fisher
Computing Device Access in Fisher
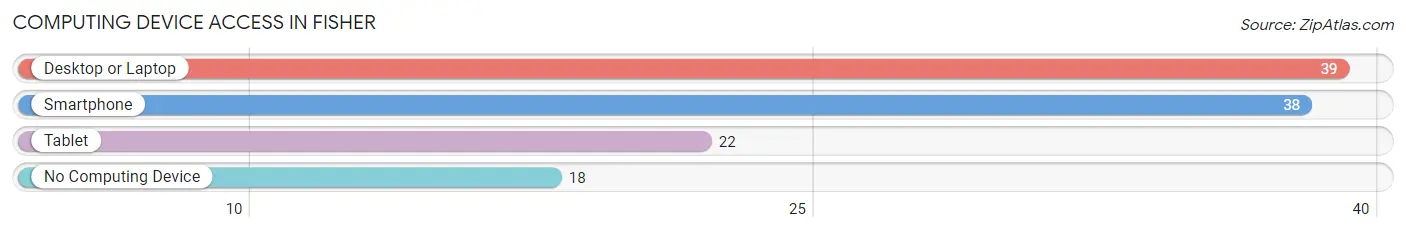
| Device Type | # Households | % Households |
| Desktop or Laptop | 39 | 58.2% |
| Smartphone | 38 | 56.7% |
| Tablet | 22 | 32.8% |
| No Computing Device | 18 | 26.9% |
| Total | 67 | 100.0% |
Internet Access in Fisher
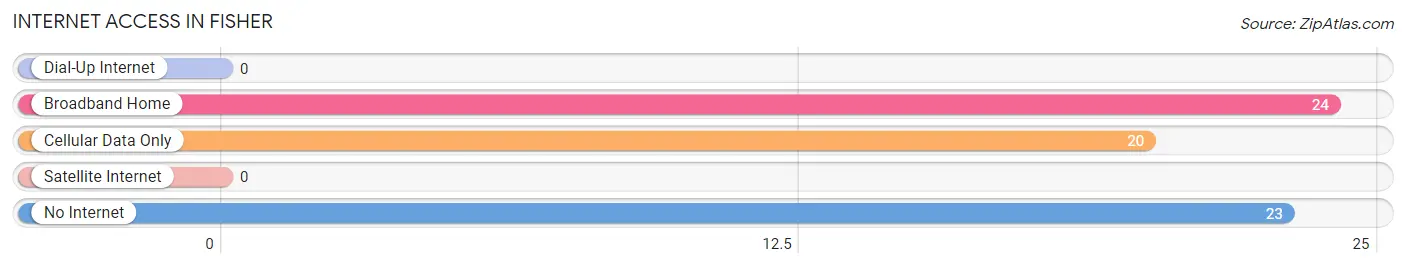
| Internet Type | # Households | % Households |
| Dial-Up Internet | 0 | 0.0% |
| Broadband Home | 24 | 35.8% |
| Cellular Data Only | 20 | 29.8% |
| Satellite Internet | 0 | 0.0% |
| No Internet | 23 | 34.3% |
| Total | 67 | 100.0% |
Fisher Summary
Fisher, Louisiana is a small town located in the northern part of the state, in the parish of Rapides. It is situated on the banks of the Red River, and is part of the Alexandria metropolitan area. The town has a population of just over 1,000 people, and is known for its rural charm and friendly atmosphere.
History
Fisher was founded in 1845 by a group of settlers from the nearby town of Alexandria. The town was named after the Fisher family, who were among the first settlers. The town was originally a farming community, and the main crops grown were cotton, corn, and sugar cane. The town also had a sawmill and a gristmill, which provided lumber and grain for the local population.
In the late 19th century, the town began to grow and develop. The railroad arrived in 1887, and the town was incorporated in 1888. The railroad brought new businesses and industries to the area, and the town began to prosper.
In the early 20th century, the town experienced a period of growth and development. The population increased, and new businesses and industries were established. The town also became a popular tourist destination, and many people from the surrounding area came to visit.
Geography
Fisher is located in the northern part of the state, in the parish of Rapides. It is situated on the banks of the Red River, and is part of the Alexandria metropolitan area. The town is surrounded by rolling hills and forests, and is located near the Kisatchie National Forest. The climate in the area is humid subtropical, with hot summers and mild winters.
Economy
Fisher’s economy is largely based on agriculture and tourism. The town is home to several farms, which produce a variety of crops, including cotton, corn, and sugar cane. The town also has a number of small businesses, including restaurants, shops, and other services. Tourism is also an important part of the local economy, as the town is a popular destination for visitors from the surrounding area.
Demographics
As of the 2010 census, the population of Fisher was 1,072. The racial makeup of the town was 79.2% White, 17.3% African American, 0.7% Native American, 0.3% Asian, 0.1% Pacific Islander, and 2.4% from other races. The median household income was $31,250, and the median family income was $37,500. The per capita income was $17,845.
Fisher is a small town with a rich history and a friendly atmosphere. The town is surrounded by beautiful scenery, and is home to a variety of businesses and industries. The town is a popular tourist destination, and is a great place to visit for those looking for a rural getaway.
Common Questions
What is Per Capita Income in Fisher?
Per Capita income in Fisher is $17,116.
What is the Median Family Income in Fisher?
Median Family Income in Fisher is $46,250.
What is the Median Household income in Fisher?
Median Household Income in Fisher is $32,344.
What is Inequality or Gini Index in Fisher?
Inequality or Gini Index in Fisher is 0.38.
What is the Total Population of Fisher?
Total Population of Fisher is 199.
What is the Total Male Population of Fisher?
Total Male Population of Fisher is 90.
What is the Total Female Population of Fisher?
Total Female Population of Fisher is 109.
What is the Ratio of Males per 100 Females in Fisher?
There are 82.57 Males per 100 Females in Fisher.
What is the Ratio of Females per 100 Males in Fisher?
There are 121.11 Females per 100 Males in Fisher.
What is the Median Population Age in Fisher?
Median Population Age in Fisher is 51.6 Years.
What is the Average Family Size in Fisher
Average Family Size in Fisher is 3.9 People.
What is the Average Household Size in Fisher
Average Household Size in Fisher is 3.0 People.
How Large is the Labor Force in Fisher?
There are 66 People in the Labor Forcein in Fisher.
What is the Percentage of People in the Labor Force in Fisher?
38.8% of People are in the Labor Force in Fisher.
What is the Unemployment Rate in Fisher?
Unemployment Rate in Fisher is 4.5%.