Dubberly, LA Map & Demographics
Dubberly Map
Dubberly Overview
$28,277
PER CAPITA INCOME
$72,917
AVG FAMILY INCOME
$39,464
AVG HOUSEHOLD INCOME
0.46
INEQUALITY / GINI INDEX
390
TOTAL POPULATION
203
MALE POPULATION
187
FEMALE POPULATION
108.56
MALES / 100 FEMALES
92.12
FEMALES / 100 MALES
37.0
MEDIAN AGE
3.4
AVG FAMILY SIZE
2.8
AVG HOUSEHOLD SIZE
173
LABOR FORCE [ PEOPLE ]
56.9%
PERCENT IN LABOR FORCE
1.2%
UNEMPLOYMENT RATE
Dubberly Zip Codes
Dubberly Area Codes
Income in Dubberly
Income Overview in Dubberly
Per Capita Income in Dubberly is $28,277, while median incomes of families and households are $72,917 and $39,464 respectively.
| Characteristic | Number | Measure |
| Per Capita Income | 390 | $28,277 |
| Median Family Income | 105 | $72,917 |
| Mean Family Income | 105 | $87,875 |
| Median Household Income | 141 | $39,464 |
| Mean Household Income | 141 | $70,892 |
| Income Deficit | 105 | $0 |
| Wage / Income Gap (%) | 390 | 0.00% |
| Wage / Income Gap ($) | 390 | 100.00¢ per $1 |
| Gini / Inequality Index | 390 | 0.46 |
Earnings by Sex in Dubberly
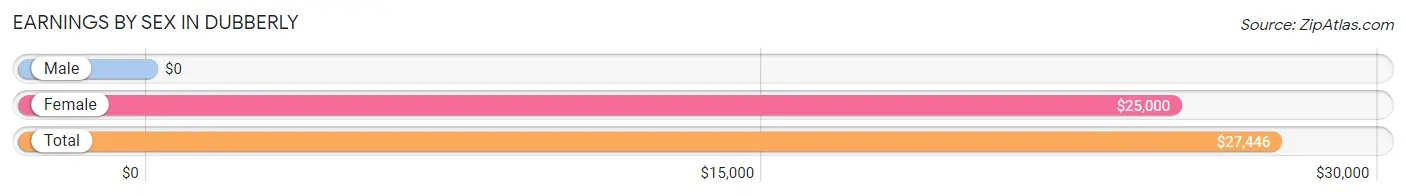
| Sex | Number | Average Earnings |
| Male | 113 (62.4%) | $0 |
| Female | 68 (37.6%) | $25,000 |
| Total | 181 (100.0%) | $27,446 |
Earnings by Sex by Income Bracket in Dubberly
The most common earnings brackets in Dubberly are $22,500 to $24,999 for men (27 | 23.9%) and $20,000 to $22,499 for women (14 | 20.6%).
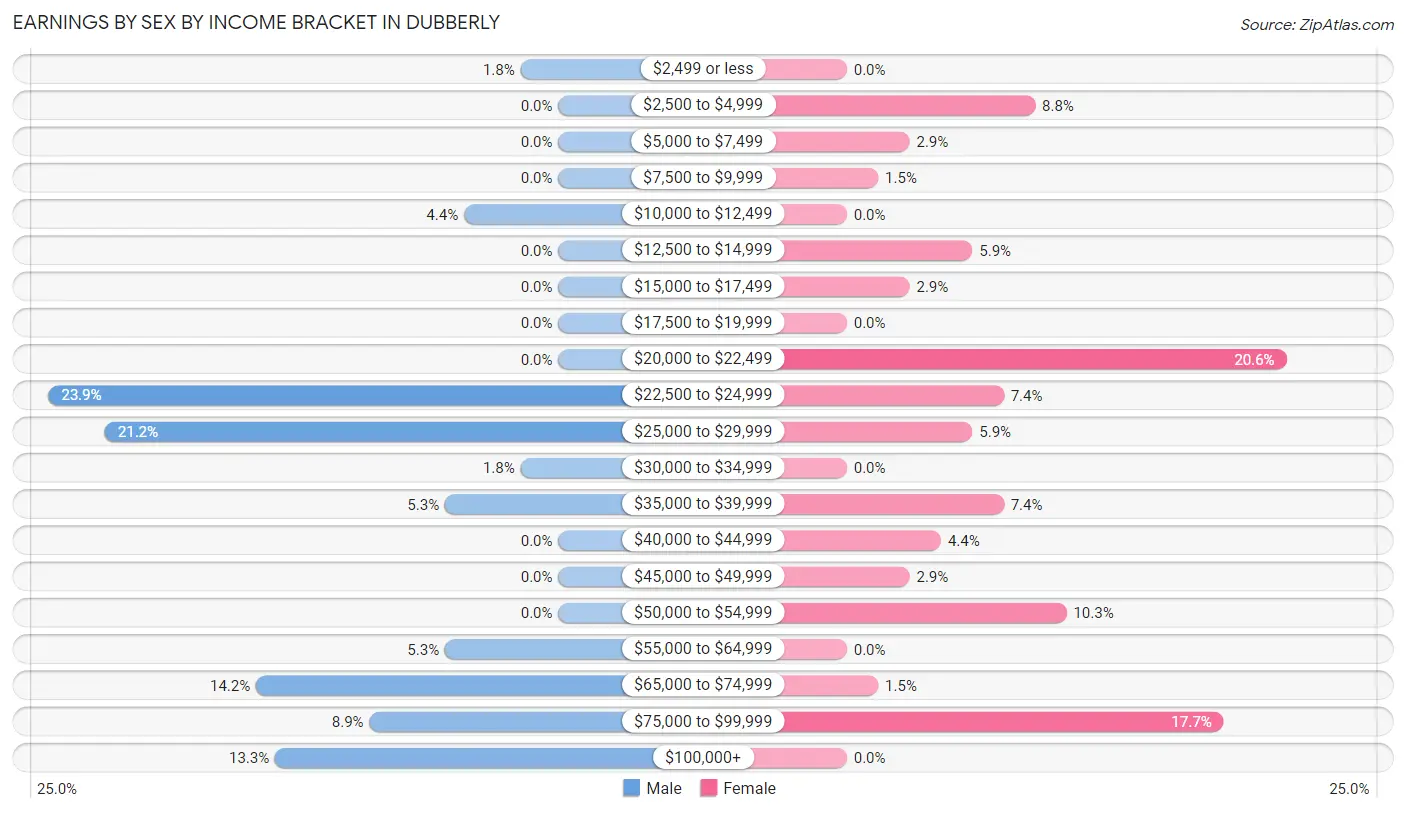
| Income | Male | Female |
| $2,499 or less | 2 (1.8%) | 0 (0.0%) |
| $2,500 to $4,999 | 0 (0.0%) | 6 (8.8%) |
| $5,000 to $7,499 | 0 (0.0%) | 2 (2.9%) |
| $7,500 to $9,999 | 0 (0.0%) | 1 (1.5%) |
| $10,000 to $12,499 | 5 (4.4%) | 0 (0.0%) |
| $12,500 to $14,999 | 0 (0.0%) | 4 (5.9%) |
| $15,000 to $17,499 | 0 (0.0%) | 2 (2.9%) |
| $17,500 to $19,999 | 0 (0.0%) | 0 (0.0%) |
| $20,000 to $22,499 | 0 (0.0%) | 14 (20.6%) |
| $22,500 to $24,999 | 27 (23.9%) | 5 (7.3%) |
| $25,000 to $29,999 | 24 (21.2%) | 4 (5.9%) |
| $30,000 to $34,999 | 2 (1.8%) | 0 (0.0%) |
| $35,000 to $39,999 | 6 (5.3%) | 5 (7.3%) |
| $40,000 to $44,999 | 0 (0.0%) | 3 (4.4%) |
| $45,000 to $49,999 | 0 (0.0%) | 2 (2.9%) |
| $50,000 to $54,999 | 0 (0.0%) | 7 (10.3%) |
| $55,000 to $64,999 | 6 (5.3%) | 0 (0.0%) |
| $65,000 to $74,999 | 16 (14.2%) | 1 (1.5%) |
| $75,000 to $99,999 | 10 (8.8%) | 12 (17.6%) |
| $100,000+ | 15 (13.3%) | 0 (0.0%) |
| Total | 113 (100.0%) | 68 (100.0%) |
Earnings by Sex by Educational Attainment in Dubberly
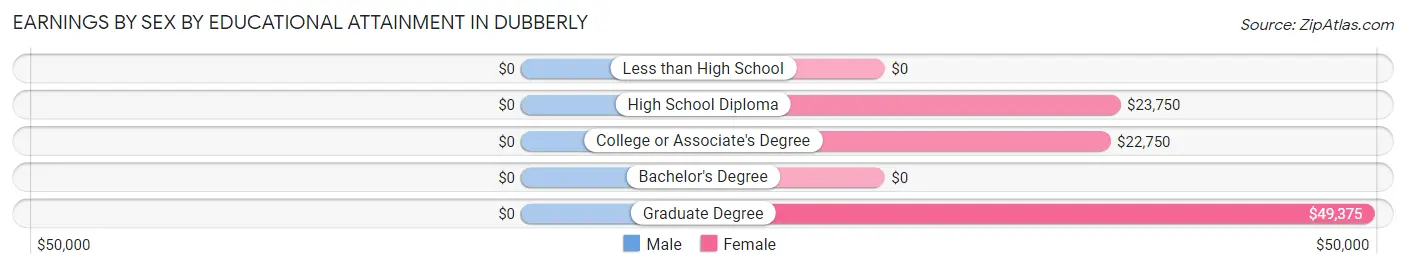
| Educational Attainment | Male Income | Female Income |
| Less than High School | - | - |
| High School Diploma | - | - |
| College or Associate's Degree | - | - |
| Bachelor's Degree | - | - |
| Graduate Degree | - | - |
| Total | - | - |
Family Income in Dubberly
Family Income Brackets in Dubberly
According to the Dubberly family income data, there are 25 families falling into the $100,000 to $149,999 income range, which is the most common income bracket and makes up 23.8% of all families.
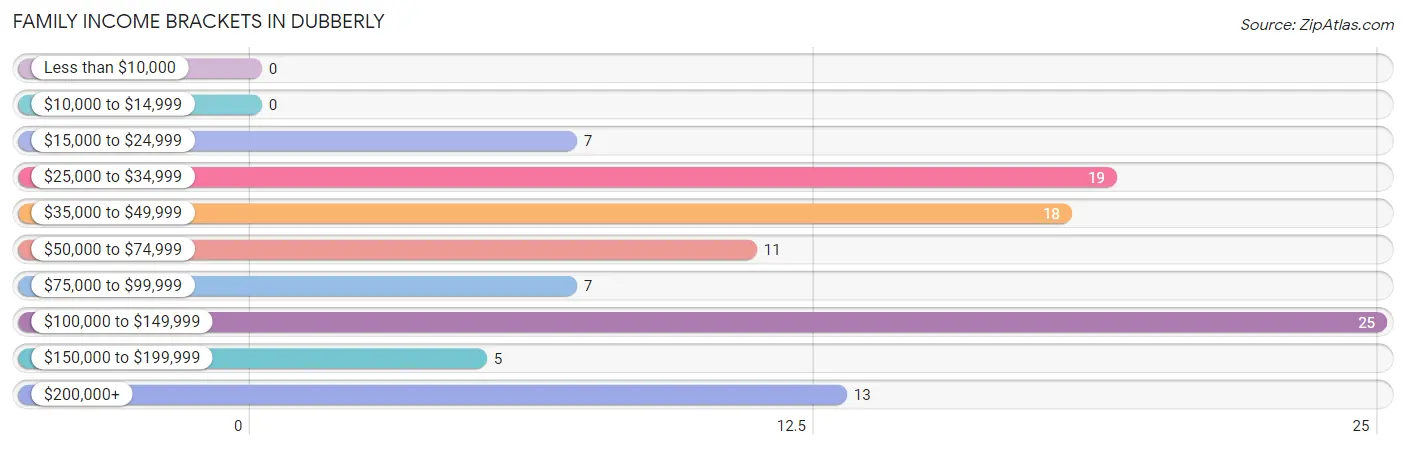
| Income Bracket | # Families | % Families |
| Less than $10,000 | 0 | 0.0% |
| $10,000 to $14,999 | 0 | 0.0% |
| $15,000 to $24,999 | 7 | 6.7% |
| $25,000 to $34,999 | 19 | 18.1% |
| $35,000 to $49,999 | 18 | 17.1% |
| $50,000 to $74,999 | 11 | 10.5% |
| $75,000 to $99,999 | 7 | 6.7% |
| $100,000 to $149,999 | 25 | 23.8% |
| $150,000 to $199,999 | 5 | 4.8% |
| $200,000+ | 13 | 12.4% |
Family Income by Famaliy Size in Dubberly
2-person families (54 | 51.4%) account for the highest median family income in Dubberly with $78,750 per family, while 2-person families (54 | 51.4%) have the highest median income of $39,375 per family member.
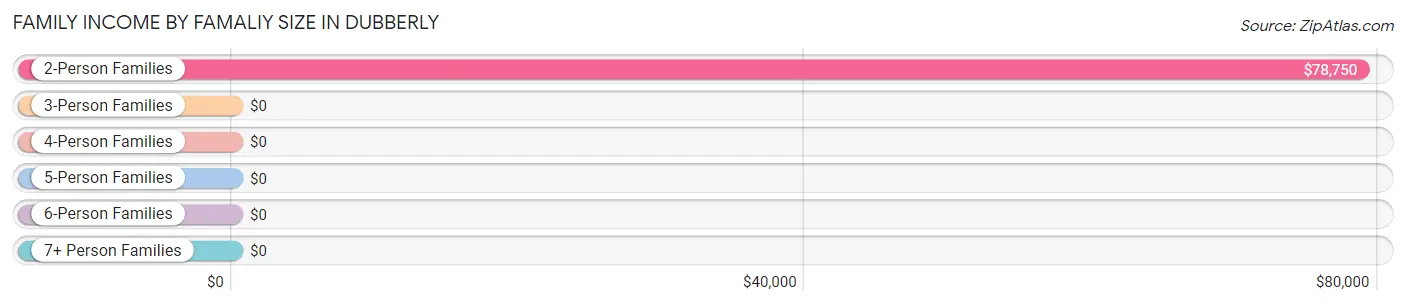
| Income Bracket | # Families | Median Income |
| 2-Person Families | 54 (51.4%) | $78,750 |
| 3-Person Families | 24 (22.9%) | $0 |
| 4-Person Families | 17 (16.2%) | $0 |
| 5-Person Families | 10 (9.5%) | $0 |
| 6-Person Families | 0 (0.0%) | $0 |
| 7+ Person Families | 0 (0.0%) | $0 |
| Total | 105 (100.0%) | $72,917 |
Family Income by Number of Earners in Dubberly
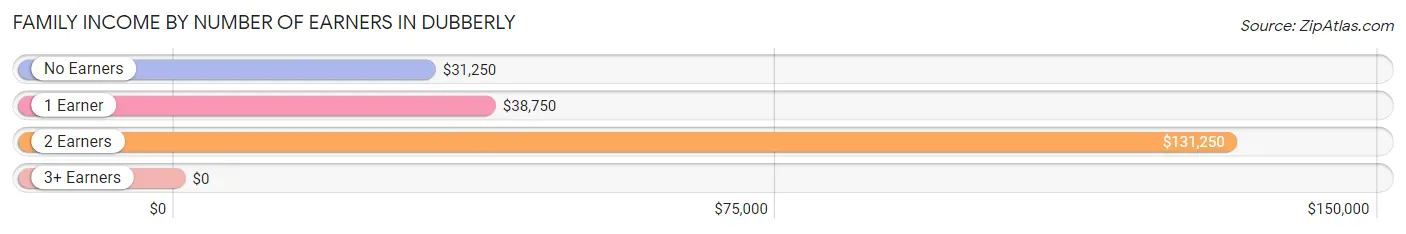
| Number of Earners | # Families | Median Income |
| No Earners | 9 (8.6%) | $31,250 |
| 1 Earner | 55 (52.4%) | $38,750 |
| 2 Earners | 36 (34.3%) | $131,250 |
| 3+ Earners | 5 (4.8%) | $0 |
| Total | 105 (100.0%) | $72,917 |
Household Income in Dubberly
Household Income Brackets in Dubberly
With 25 households falling in the category, the $100,000 to $149,999 income range is the most frequent in Dubberly, accounting for 17.7% of all households. In contrast, only 5 households (3.5%) fall into the $150,000 to $199,999 income bracket, making it the least populous group.
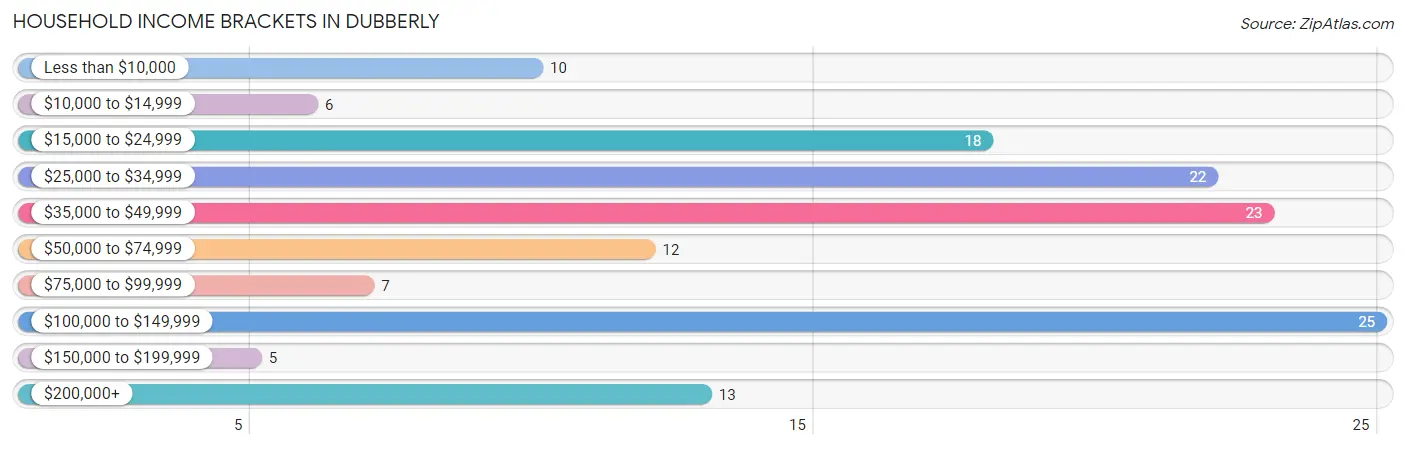
| Income Bracket | # Households | % Households |
| Less than $10,000 | 10 | 7.1% |
| $10,000 to $14,999 | 6 | 4.3% |
| $15,000 to $24,999 | 18 | 12.8% |
| $25,000 to $34,999 | 22 | 15.6% |
| $35,000 to $49,999 | 23 | 16.3% |
| $50,000 to $74,999 | 12 | 8.5% |
| $75,000 to $99,999 | 7 | 5.0% |
| $100,000 to $149,999 | 25 | 17.7% |
| $150,000 to $199,999 | 5 | 3.5% |
| $200,000+ | 13 | 9.2% |
Household Income by Householder Age in Dubberly
The median household income in Dubberly is $39,464, with the highest median household income of $63,125 found in the 65+ years age bracket for the primary householder. A total of 43 households (30.5%) fall into this category. Meanwhile, the 15 to 24 years age bracket for the primary householder has the lowest median household income of $0, with 1 households (0.7%) in this group.
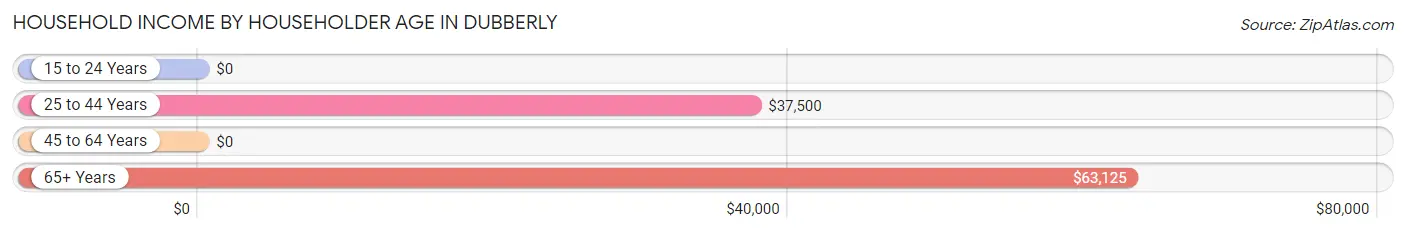
| Income Bracket | # Households | Median Income |
| 15 to 24 Years | 1 (0.7%) | $0 |
| 25 to 44 Years | 40 (28.4%) | $37,500 |
| 45 to 64 Years | 57 (40.4%) | $0 |
| 65+ Years | 43 (30.5%) | $63,125 |
| Total | 141 (100.0%) | $39,464 |
Poverty in Dubberly
Income Below Poverty by Sex and Age in Dubberly
With 20.7% poverty level for males and 13.4% for females among the residents of Dubberly, 6 to 11 year old males and 55 to 64 year old females are the most vulnerable to poverty, with 12 males (80.0%) and 14 females (40.0%) in their respective age groups living below the poverty level.
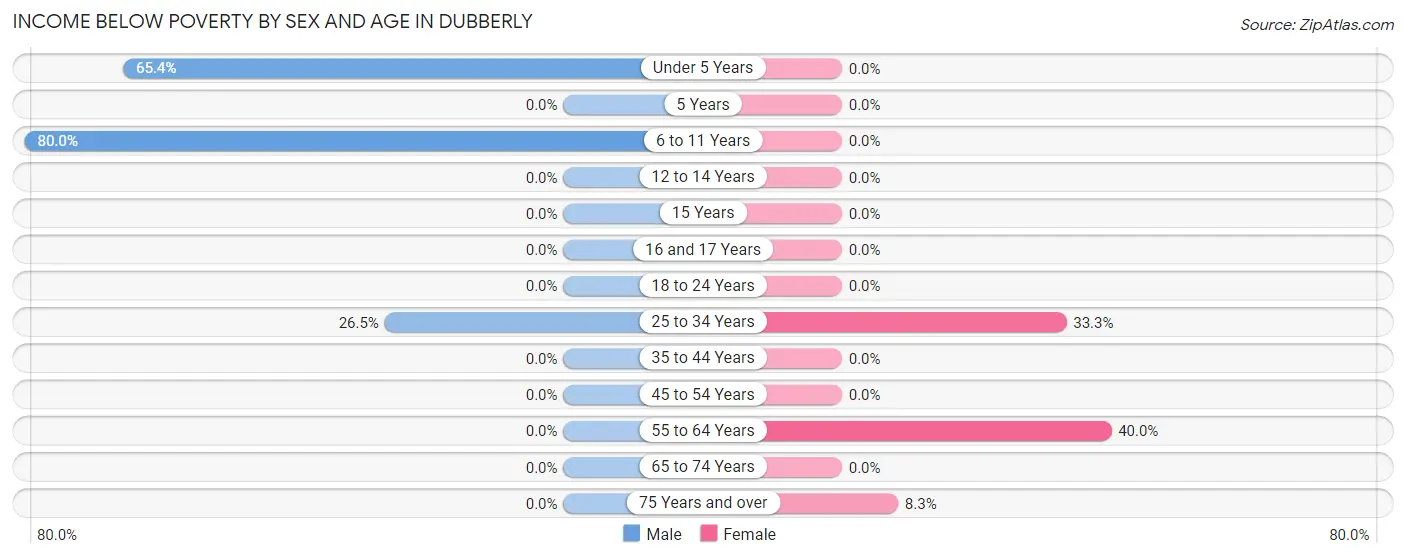
| Age Bracket | Male | Female |
| Under 5 Years | 17 (65.4%) | 0 (0.0%) |
| 5 Years | 0 (0.0%) | 0 (0.0%) |
| 6 to 11 Years | 12 (80.0%) | 0 (0.0%) |
| 12 to 14 Years | 0 (0.0%) | 0 (0.0%) |
| 15 Years | 0 (0.0%) | 0 (0.0%) |
| 16 and 17 Years | 0 (0.0%) | 0 (0.0%) |
| 18 to 24 Years | 0 (0.0%) | 0 (0.0%) |
| 25 to 34 Years | 13 (26.5%) | 10 (33.3%) |
| 35 to 44 Years | 0 (0.0%) | 0 (0.0%) |
| 45 to 54 Years | 0 (0.0%) | 0 (0.0%) |
| 55 to 64 Years | 0 (0.0%) | 14 (40.0%) |
| 65 to 74 Years | 0 (0.0%) | 0 (0.0%) |
| 75 Years and over | 0 (0.0%) | 1 (8.3%) |
| Total | 42 (20.7%) | 25 (13.4%) |
Income Above Poverty by Sex and Age in Dubberly
According to the poverty statistics in Dubberly, males aged 12 to 14 years and females aged under 5 years are the age groups that are most secure financially, with 100.0% of males and 100.0% of females in these age groups living above the poverty line.
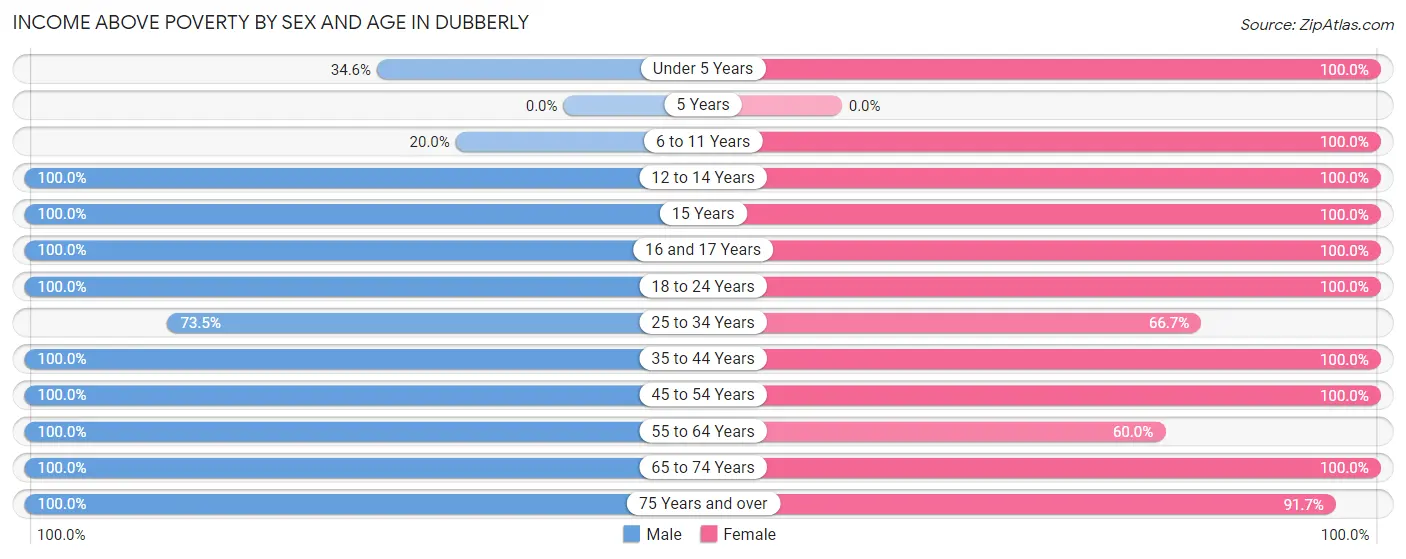
| Age Bracket | Male | Female |
| Under 5 Years | 9 (34.6%) | 21 (100.0%) |
| 5 Years | 0 (0.0%) | 0 (0.0%) |
| 6 to 11 Years | 3 (20.0%) | 12 (100.0%) |
| 12 to 14 Years | 2 (100.0%) | 3 (100.0%) |
| 15 Years | 5 (100.0%) | 2 (100.0%) |
| 16 and 17 Years | 2 (100.0%) | 1 (100.0%) |
| 18 to 24 Years | 12 (100.0%) | 5 (100.0%) |
| 25 to 34 Years | 36 (73.5%) | 20 (66.7%) |
| 35 to 44 Years | 9 (100.0%) | 15 (100.0%) |
| 45 to 54 Years | 16 (100.0%) | 25 (100.0%) |
| 55 to 64 Years | 24 (100.0%) | 21 (60.0%) |
| 65 to 74 Years | 39 (100.0%) | 26 (100.0%) |
| 75 Years and over | 4 (100.0%) | 11 (91.7%) |
| Total | 161 (79.3%) | 162 (86.6%) |
Income Below Poverty Among Married-Couple Families in Dubberly
The poverty statistics for married-couple families in Dubberly show that 10.0% or 10 of the total 100 families live below the poverty line. Families with 1 or 2 children have the highest poverty rate of 34.5%, comprising of 10 families. On the other hand, families with no children have the lowest poverty rate of 0.0%, which includes 0 families.
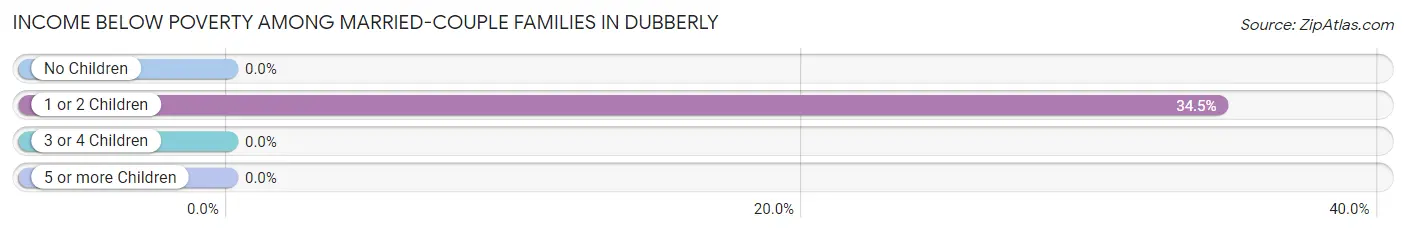
| Children | Above Poverty | Below Poverty |
| No Children | 64 (100.0%) | 0 (0.0%) |
| 1 or 2 Children | 19 (65.5%) | 10 (34.5%) |
| 3 or 4 Children | 7 (100.0%) | 0 (0.0%) |
| 5 or more Children | 0 (0.0%) | 0 (0.0%) |
| Total | 90 (90.0%) | 10 (10.0%) |
Income Below Poverty Among Single-Parent Households in Dubberly
| Children | Single Father | Single Mother |
| No Children | 0 (0.0%) | 0 (0.0%) |
| 1 or 2 Children | 0 (0.0%) | 0 (0.0%) |
| 3 or 4 Children | 0 (0.0%) | 0 (0.0%) |
| 5 or more Children | 0 (0.0%) | 0 (0.0%) |
| Total | 0 (0.0%) | 0 (0.0%) |
Income Below Poverty Among Married-Couple vs Single-Parent Households in Dubberly
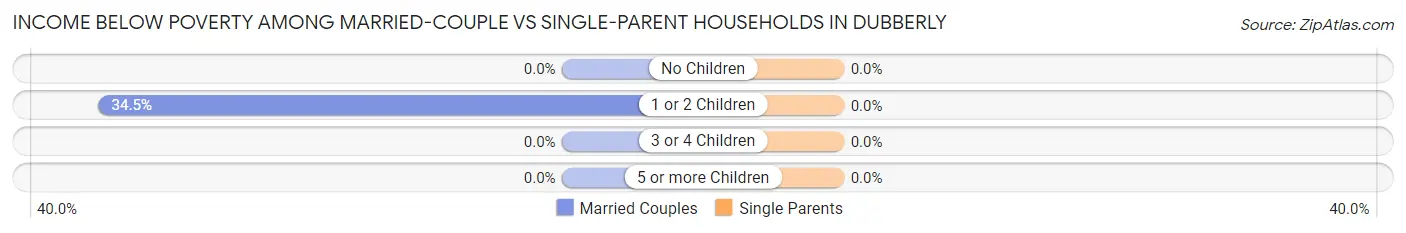
| Children | Married-Couple Families | Single-Parent Households |
| No Children | 0 (0.0%) | 0 (0.0%) |
| 1 or 2 Children | 10 (34.5%) | 0 (0.0%) |
| 3 or 4 Children | 0 (0.0%) | 0 (0.0%) |
| 5 or more Children | 0 (0.0%) | 0 (0.0%) |
| Total | 10 (10.0%) | 0 (0.0%) |
Race in Dubberly
The most populous races in Dubberly are White / Caucasian (367 | 94.1%), Black / African American (20 | 5.1%), and Two or more Races (3 | 0.8%).
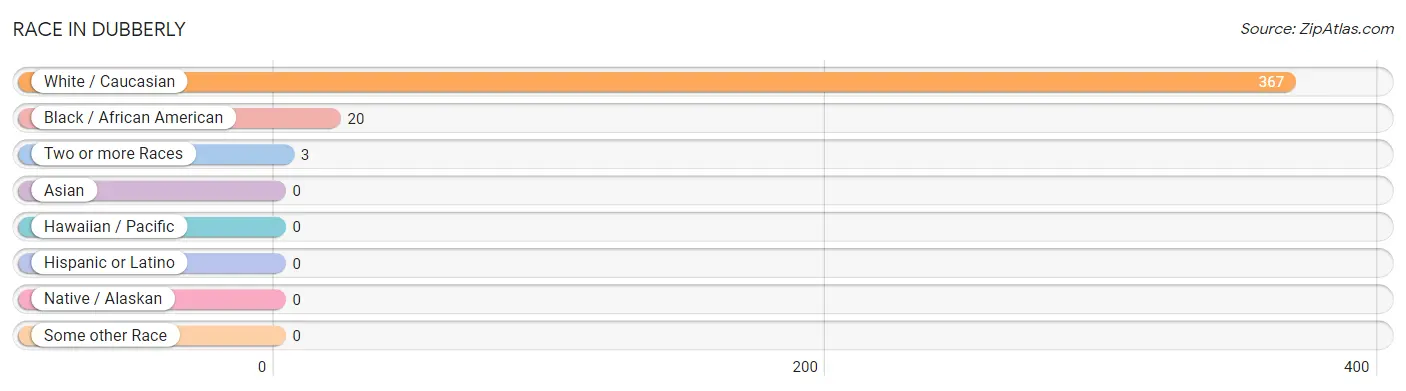
| Race | # Population | % Population |
| Asian | 0 | 0.0% |
| Black / African American | 20 | 5.1% |
| Hawaiian / Pacific | 0 | 0.0% |
| Hispanic or Latino | 0 | 0.0% |
| Native / Alaskan | 0 | 0.0% |
| White / Caucasian | 367 | 94.1% |
| Two or more Races | 3 | 0.8% |
| Some other Race | 0 | 0.0% |
| Total | 390 | 100.0% |
Ancestry in Dubberly
The most populous ancestries reported in Dubberly are American (194 | 49.7%), Scottish (22 | 5.6%), English (17 | 4.4%), French (16 | 4.1%), and German (15 | 3.8%), together accounting for 67.7% of all Dubberly residents.
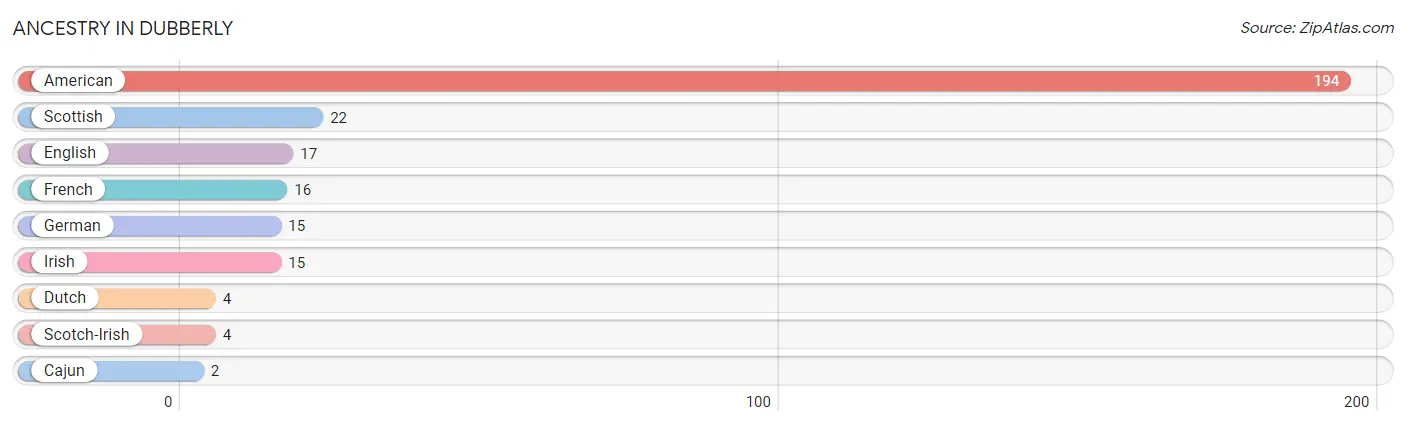
| Ancestry | # Population | % Population |
| American | 194 | 49.7% |
| Cajun | 2 | 0.5% |
| Dutch | 4 | 1.0% |
| English | 17 | 4.4% |
| French | 16 | 4.1% |
| German | 15 | 3.8% |
| Irish | 15 | 3.8% |
| Scotch-Irish | 4 | 1.0% |
| Scottish | 22 | 5.6% | View All 9 Rows |
Immigrants in Dubberly
The most numerous immigrant groups reported in Dubberly came from England (4 | 1.0%), Europe (4 | 1.0%), and Northern Europe (4 | 1.0%), together accounting for 3.1% of all Dubberly residents.
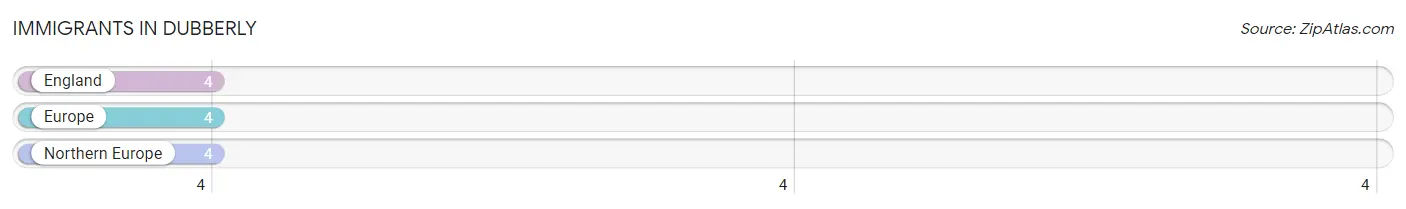
| Immigration Origin | # Population | % Population |
| England | 4 | 1.0% |
| Europe | 4 | 1.0% |
| Northern Europe | 4 | 1.0% | View All 3 Rows |
Sex and Age in Dubberly
Sex and Age in Dubberly
The most populous age groups in Dubberly are 30 to 34 Years (40 | 19.7%) for men and 55 to 59 Years (24 | 12.8%) for women.
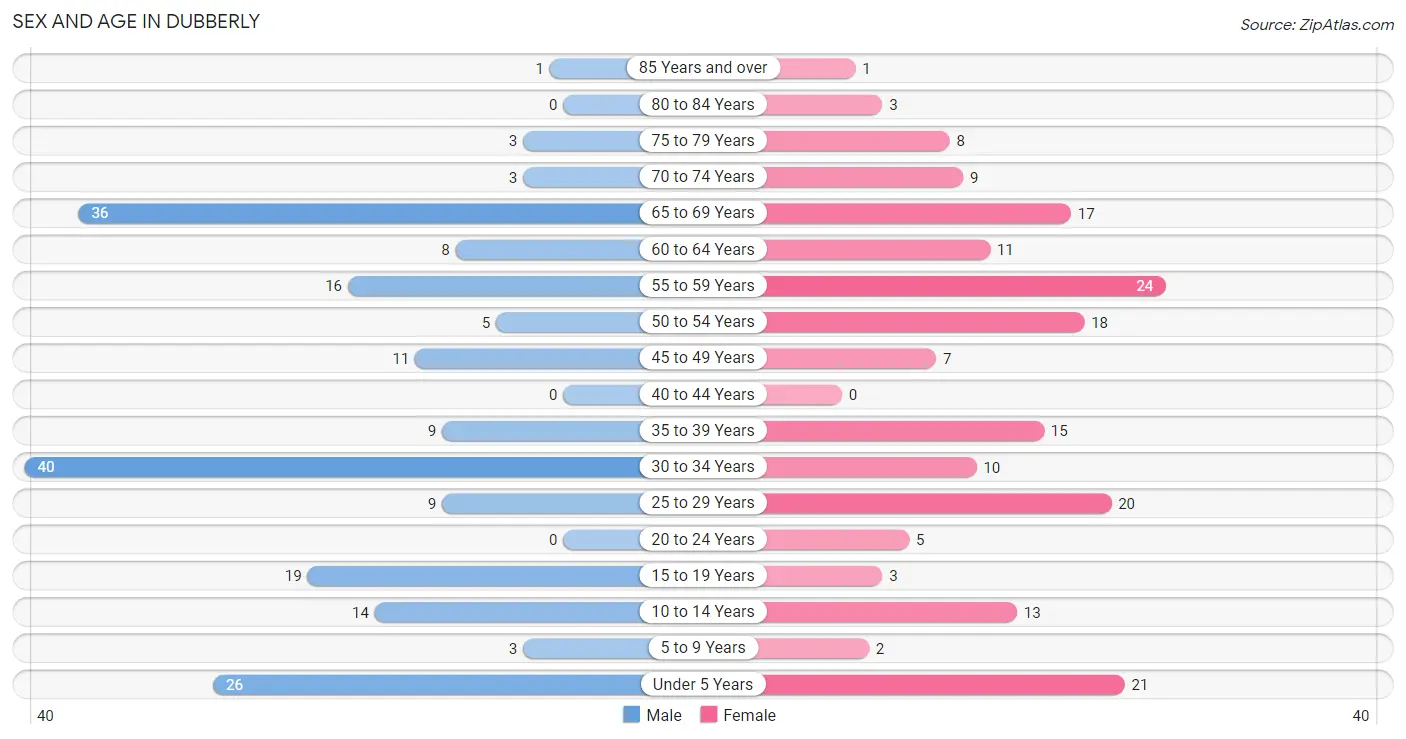
| Age Bracket | Male | Female |
| Under 5 Years | 26 (12.8%) | 21 (11.2%) |
| 5 to 9 Years | 3 (1.5%) | 2 (1.1%) |
| 10 to 14 Years | 14 (6.9%) | 13 (7.0%) |
| 15 to 19 Years | 19 (9.4%) | 3 (1.6%) |
| 20 to 24 Years | 0 (0.0%) | 5 (2.7%) |
| 25 to 29 Years | 9 (4.4%) | 20 (10.7%) |
| 30 to 34 Years | 40 (19.7%) | 10 (5.3%) |
| 35 to 39 Years | 9 (4.4%) | 15 (8.0%) |
| 40 to 44 Years | 0 (0.0%) | 0 (0.0%) |
| 45 to 49 Years | 11 (5.4%) | 7 (3.7%) |
| 50 to 54 Years | 5 (2.5%) | 18 (9.6%) |
| 55 to 59 Years | 16 (7.9%) | 24 (12.8%) |
| 60 to 64 Years | 8 (3.9%) | 11 (5.9%) |
| 65 to 69 Years | 36 (17.7%) | 17 (9.1%) |
| 70 to 74 Years | 3 (1.5%) | 9 (4.8%) |
| 75 to 79 Years | 3 (1.5%) | 8 (4.3%) |
| 80 to 84 Years | 0 (0.0%) | 3 (1.6%) |
| 85 Years and over | 1 (0.5%) | 1 (0.5%) |
| Total | 203 (100.0%) | 187 (100.0%) |
Families and Households in Dubberly
Median Family Size in Dubberly
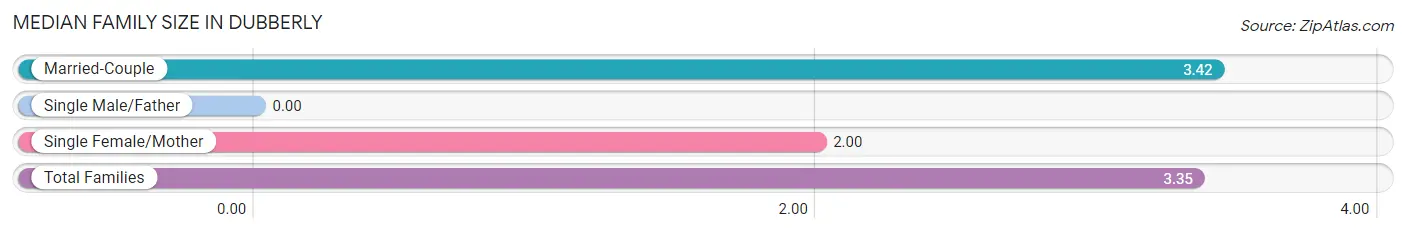
| Family Type | # Families | Family Size |
| Married-Couple | 100 (95.2%) | 3.42 |
| Single Male/Father | 0 (0.0%) | - |
| Single Female/Mother | 5 (4.8%) | 2.00 |
| Total Families | 105 (100.0%) | 3.35 |
Median Household Size in Dubberly
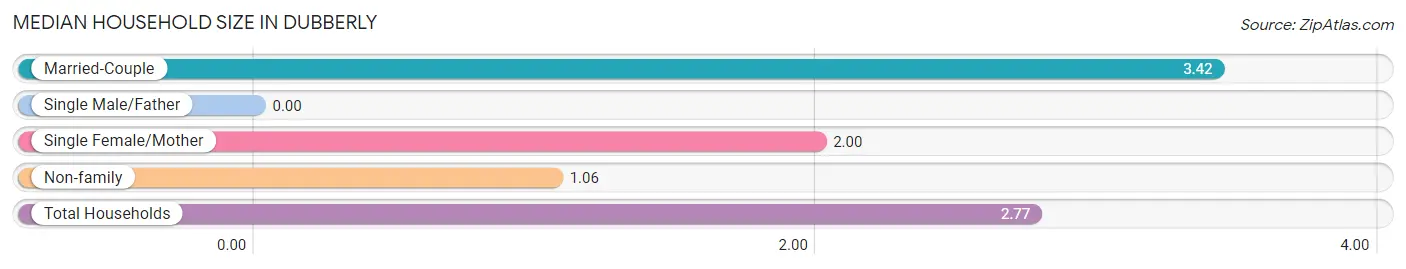
| Household Type | # Households | Household Size |
| Married-Couple | 100 (70.9%) | 3.42 |
| Single Male/Father | 0 (0.0%) | - |
| Single Female/Mother | 5 (3.5%) | 2.00 |
| Non-family | 36 (25.5%) | 1.06 |
| Total Households | 141 (100.0%) | 2.77 |
Household Size by Marriage Status in Dubberly
Out of a total of 141 households in Dubberly, 105 (74.5%) are family households, while 36 (25.5%) are nonfamily households. The most numerous type of family households are 2-person households, comprising 54, and the most common type of nonfamily households are 1-person households, comprising 34.
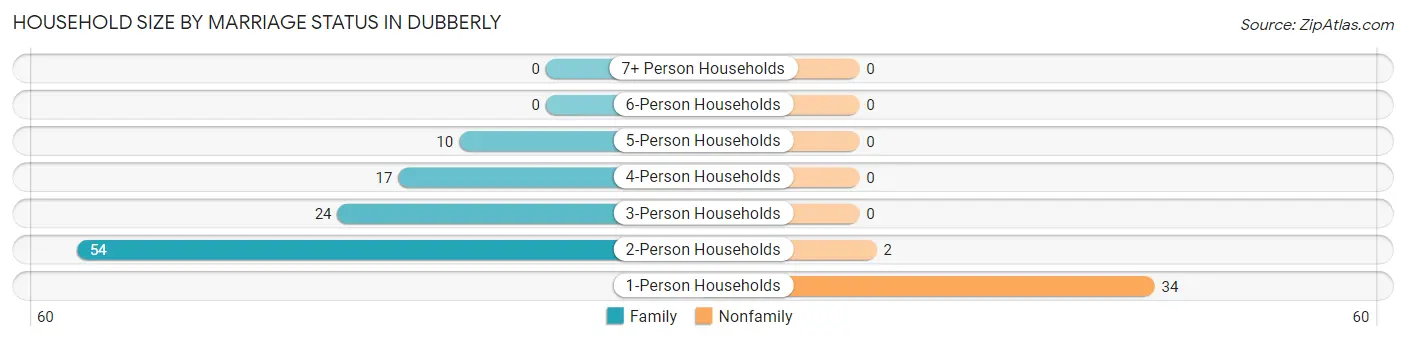
| Household Size | Family Households | Nonfamily Households |
| 1-Person Households | - | 34 (24.1%) |
| 2-Person Households | 54 (38.3%) | 2 (1.4%) |
| 3-Person Households | 24 (17.0%) | 0 (0.0%) |
| 4-Person Households | 17 (12.1%) | 0 (0.0%) |
| 5-Person Households | 10 (7.1%) | 0 (0.0%) |
| 6-Person Households | 0 (0.0%) | 0 (0.0%) |
| 7+ Person Households | 0 (0.0%) | 0 (0.0%) |
| Total | 105 (74.5%) | 36 (25.5%) |
Female Fertility in Dubberly
Fertility by Age in Dubberly
Average fertility rate in Dubberly is 83.0 births per 1,000 women. Women in the age bracket of 20 to 34 years have the highest fertility rate with 143.0 births per 1,000 women. Women in the age bracket of 20 to 34 years acount for 100.0% of all women with births.
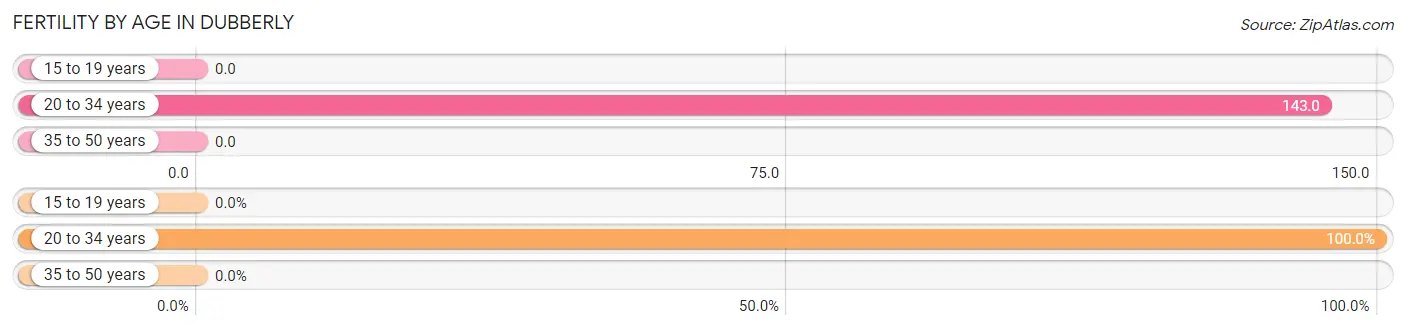
| Age Bracket | Women with Births | Births / 1,000 Women |
| 15 to 19 years | 0 (0.0%) | 0.0 |
| 20 to 34 years | 5 (100.0%) | 143.0 |
| 35 to 50 years | 0 (0.0%) | 0.0 |
| Total | 5 (100.0%) | 83.0 |
Fertility by Age by Marriage Status in Dubberly
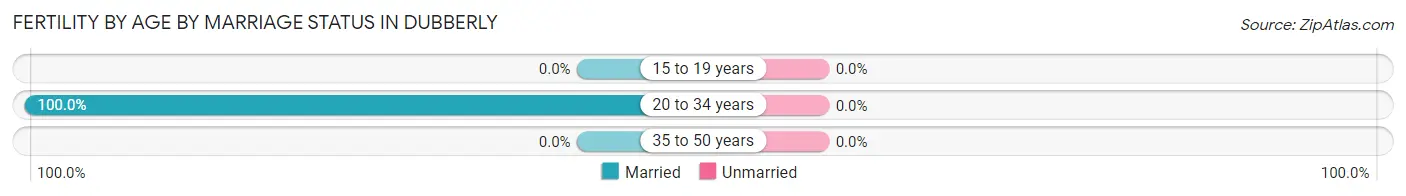
| Age Bracket | Married | Unmarried |
| 15 to 19 years | 0 (0.0%) | 0 (0.0%) |
| 20 to 34 years | 5 (100.0%) | 0 (0.0%) |
| 35 to 50 years | 0 (0.0%) | 0 (0.0%) |
| Total | 5 (100.0%) | 0 (0.0%) |
Fertility by Education in Dubberly
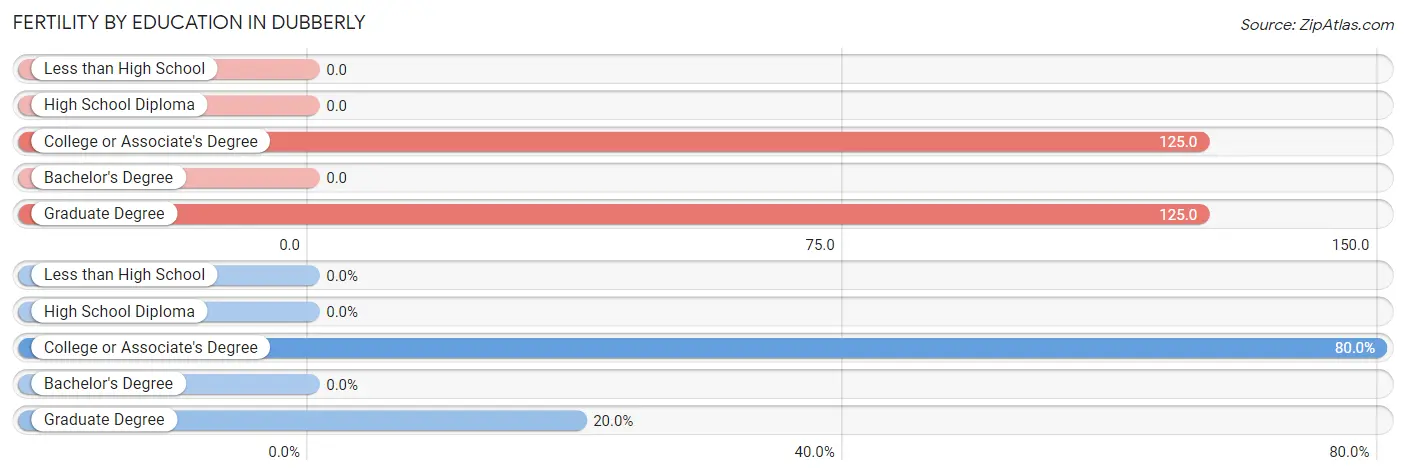
| Educational Attainment | Women with Births | Births / 1,000 Women |
| Less than High School | 0 (0.0%) | 0.0 |
| High School Diploma | 0 (0.0%) | 0.0 |
| College or Associate's Degree | 4 (80.0%) | 125.0 |
| Bachelor's Degree | 0 (0.0%) | 0.0 |
| Graduate Degree | 1 (20.0%) | 125.0 |
| Total | 5 (100.0%) | 83.0 |
Fertility by Education by Marriage Status in Dubberly
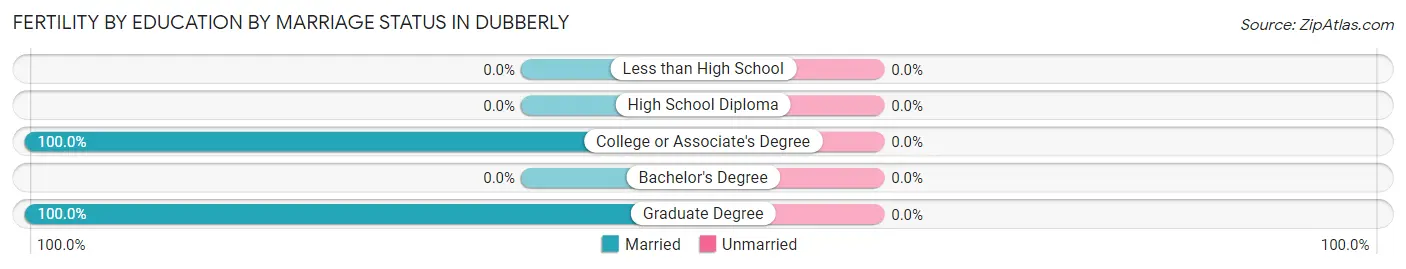
| Educational Attainment | Married | Unmarried |
| Less than High School | 0 (0.0%) | 0 (0.0%) |
| High School Diploma | 0 (0.0%) | 0 (0.0%) |
| College or Associate's Degree | 4 (100.0%) | 0 (0.0%) |
| Bachelor's Degree | 0 (0.0%) | 0 (0.0%) |
| Graduate Degree | 1 (100.0%) | 0 (0.0%) |
| Total | 5 (100.0%) | 0 (0.0%) |
Employment Characteristics in Dubberly
Employment by Class of Employer in Dubberly
Among the 171 employed individuals in Dubberly, private company employees (124 | 72.5%), self-employed (incorporated) (16 | 9.4%), and local government employees (11 | 6.4%) make up the most common classes of employment.
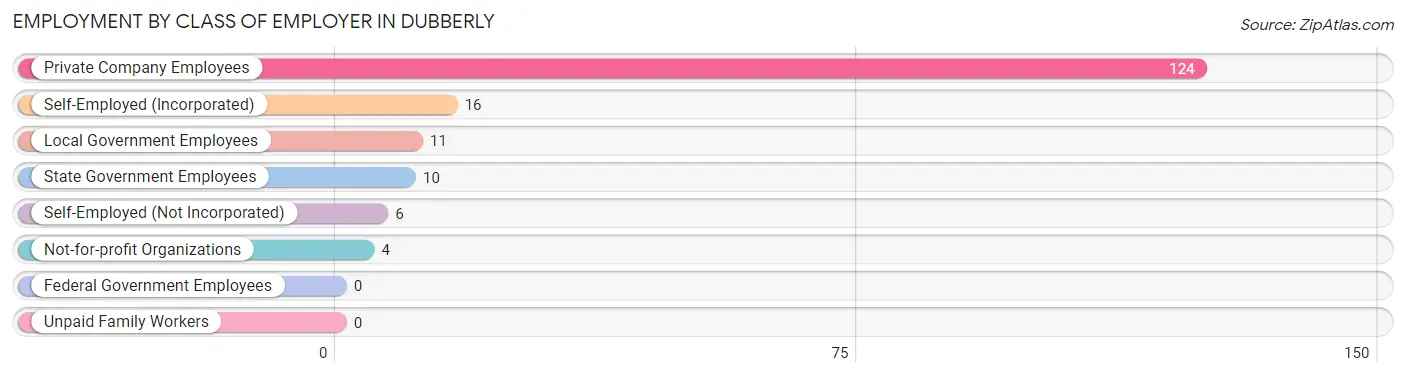
| Employer Class | # Employees | % Employees |
| Private Company Employees | 124 | 72.5% |
| Self-Employed (Incorporated) | 16 | 9.4% |
| Self-Employed (Not Incorporated) | 6 | 3.5% |
| Not-for-profit Organizations | 4 | 2.3% |
| Local Government Employees | 11 | 6.4% |
| State Government Employees | 10 | 5.9% |
| Federal Government Employees | 0 | 0.0% |
| Unpaid Family Workers | 0 | 0.0% |
| Total | 171 | 100.0% |
Employment Status by Age in Dubberly
According to the labor force statistics for Dubberly, out of the total population over 16 years of age (304), 56.9% or 173 individuals are in the labor force, with 1.2% or 2 of them unemployed. The age group with the highest labor force participation rate is 45 to 54 years, with 95.1% or 39 individuals in the labor force. Within the labor force, the 45 to 54 years age range has the highest percentage of unemployed individuals, with 5.1% or 2 of them being unemployed.
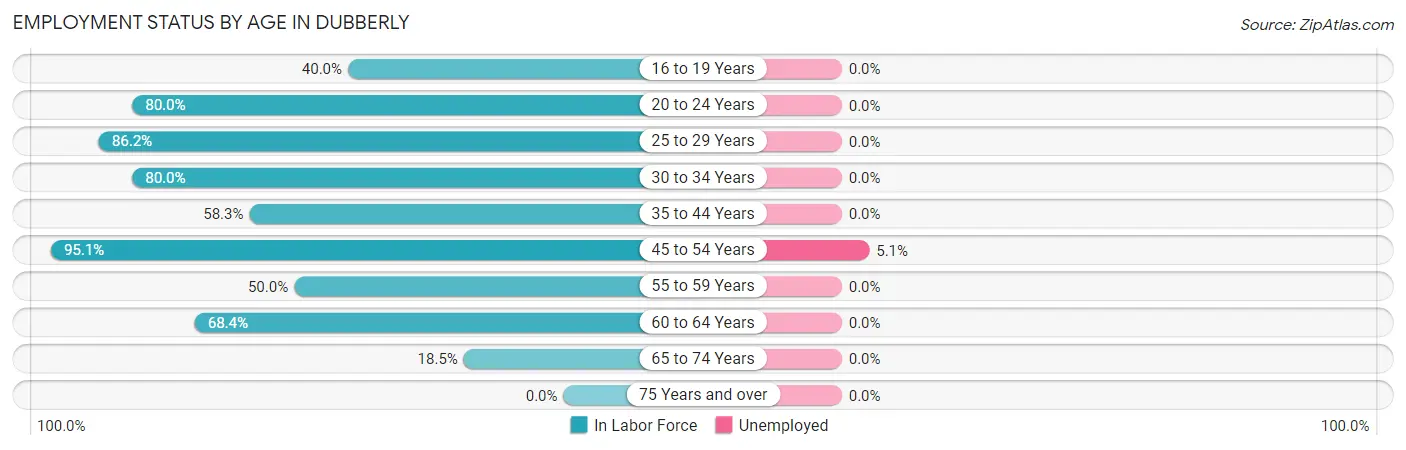
| Age Bracket | In Labor Force | Unemployed |
| 16 to 19 Years | 6 (40.0%) | 0 (0.0%) |
| 20 to 24 Years | 4 (80.0%) | 0 (0.0%) |
| 25 to 29 Years | 25 (86.2%) | 0 (0.0%) |
| 30 to 34 Years | 40 (80.0%) | 0 (0.0%) |
| 35 to 44 Years | 14 (58.3%) | 0 (0.0%) |
| 45 to 54 Years | 39 (95.1%) | 2 (5.1%) |
| 55 to 59 Years | 20 (50.0%) | 0 (0.0%) |
| 60 to 64 Years | 13 (68.4%) | 0 (0.0%) |
| 65 to 74 Years | 12 (18.5%) | 0 (0.0%) |
| 75 Years and over | 0 (0.0%) | 0 (0.0%) |
| Total | 173 (56.9%) | 2 (1.2%) |
Employment Status by Educational Attainment in Dubberly
According to labor force statistics for Dubberly, 74.4% of individuals (151) out of the total population between 25 and 64 years of age (203) are in the labor force, with 1.3% or 2 of them being unemployed. The group with the highest labor force participation rate are those with the educational attainment of less than high school, with 100.0% or 4 individuals in the labor force. Within the labor force, individuals with high school diploma education have the highest percentage of unemployment, with 3.8% or 2 of them being unemployed.
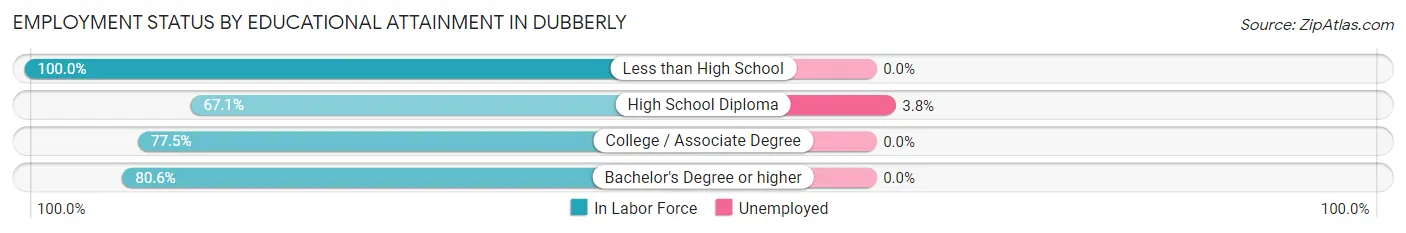
| Educational Attainment | In Labor Force | Unemployed |
| Less than High School | 4 (100.0%) | 0 (0.0%) |
| High School Diploma | 53 (67.1%) | 3 (3.8%) |
| College / Associate Degree | 69 (77.5%) | 0 (0.0%) |
| Bachelor's Degree or higher | 25 (80.6%) | 0 (0.0%) |
| Total | 151 (74.4%) | 3 (1.3%) |
Employment Occupations by Sex in Dubberly
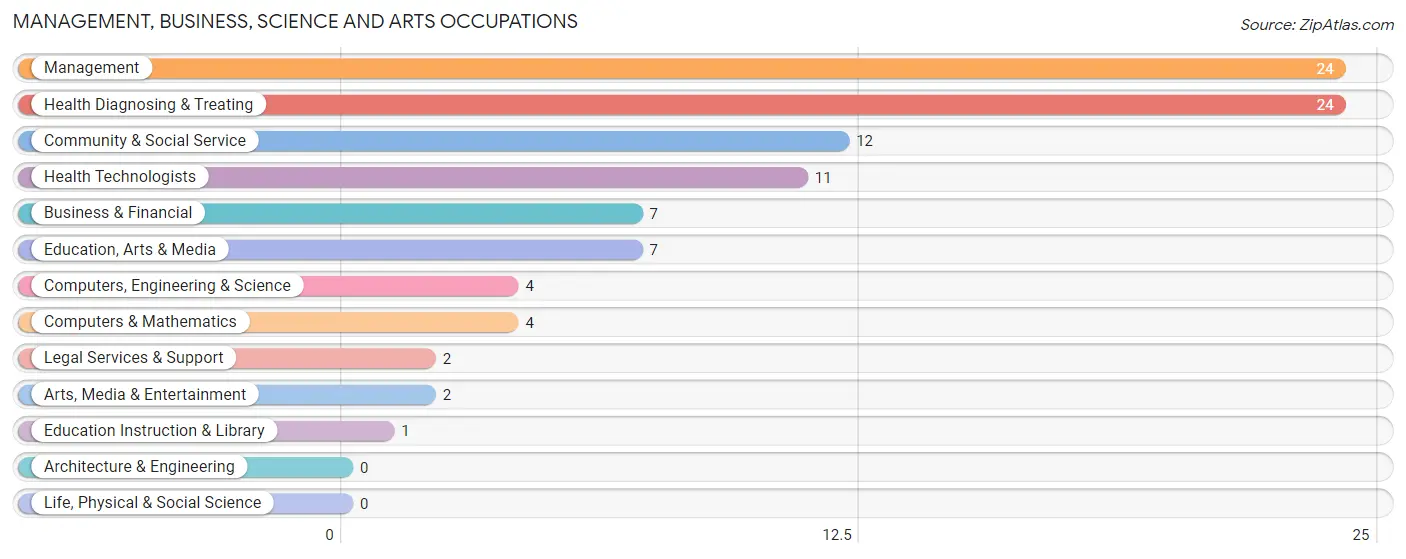
Management, Business, Science and Arts Occupations
The most common Management, Business, Science and Arts occupations in Dubberly are Management (24 | 14.0%), Health Diagnosing & Treating (24 | 14.0%), Community & Social Service (12 | 7.0%), Health Technologists (11 | 6.4%), and Business & Financial (7 | 4.1%).
Management, Business, Science and Arts Occupations by Sex
Within the Management, Business, Science and Arts occupations in Dubberly, the most male-oriented occupations are Business & Financial (100.0%), Computers, Engineering & Science (100.0%), and Computers & Mathematics (100.0%), while the most female-oriented occupations are Education Instruction & Library (100.0%), Health Diagnosing & Treating (79.2%), and Management (58.3%).
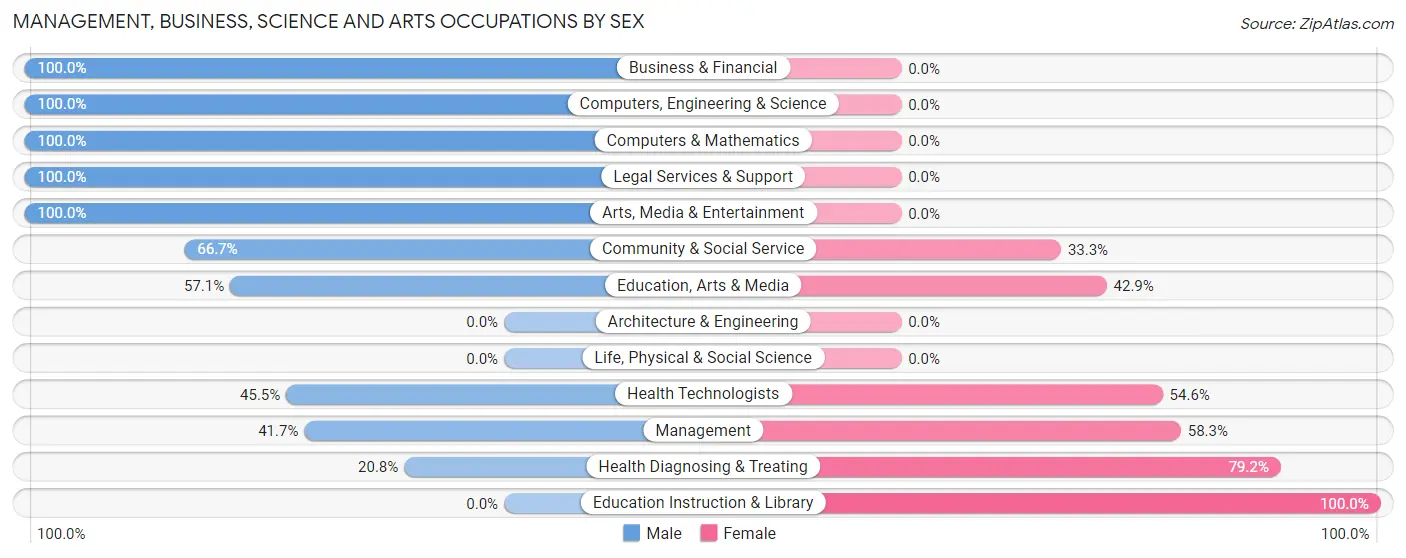
| Occupation | Male | Female |
| Management | 10 (41.7%) | 14 (58.3%) |
| Business & Financial | 7 (100.0%) | 0 (0.0%) |
| Computers, Engineering & Science | 4 (100.0%) | 0 (0.0%) |
| Computers & Mathematics | 4 (100.0%) | 0 (0.0%) |
| Architecture & Engineering | 0 (0.0%) | 0 (0.0%) |
| Life, Physical & Social Science | 0 (0.0%) | 0 (0.0%) |
| Community & Social Service | 8 (66.7%) | 4 (33.3%) |
| Education, Arts & Media | 4 (57.1%) | 3 (42.9%) |
| Legal Services & Support | 2 (100.0%) | 0 (0.0%) |
| Education Instruction & Library | 0 (0.0%) | 1 (100.0%) |
| Arts, Media & Entertainment | 2 (100.0%) | 0 (0.0%) |
| Health Diagnosing & Treating | 5 (20.8%) | 19 (79.2%) |
| Health Technologists | 5 (45.5%) | 6 (54.5%) |
| Total (Category) | 34 (47.9%) | 37 (52.1%) |
| Total (Overall) | 111 (64.9%) | 60 (35.1%) |
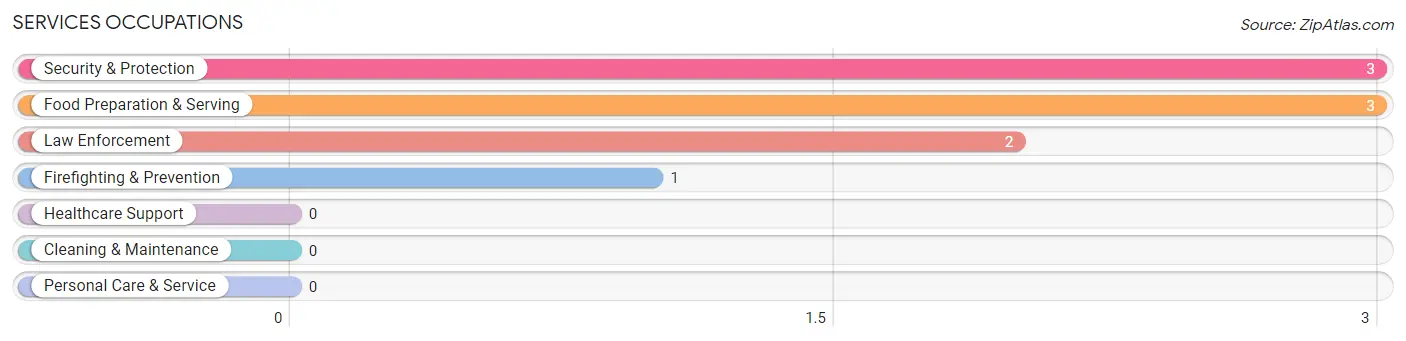
Services Occupations
The most common Services occupations in Dubberly are Security & Protection (3 | 1.8%), Food Preparation & Serving (3 | 1.8%), Law Enforcement (2 | 1.2%), and Firefighting & Prevention (1 | 0.6%).
Services Occupations by Sex
Within the Services occupations in Dubberly, the most male-oriented occupations are Law Enforcement (100.0%), and Security & Protection (66.7%), while the most female-oriented occupations are Firefighting & Prevention (100.0%), Food Preparation & Serving (100.0%), and Security & Protection (33.3%).
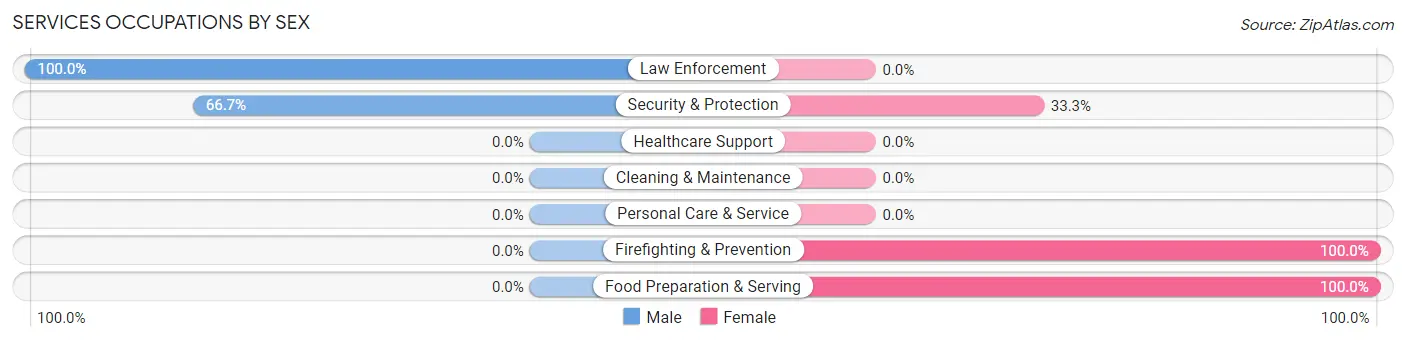
| Occupation | Male | Female |
| Healthcare Support | 0 (0.0%) | 0 (0.0%) |
| Security & Protection | 2 (66.7%) | 1 (33.3%) |
| Firefighting & Prevention | 0 (0.0%) | 1 (100.0%) |
| Law Enforcement | 2 (100.0%) | 0 (0.0%) |
| Food Preparation & Serving | 0 (0.0%) | 3 (100.0%) |
| Cleaning & Maintenance | 0 (0.0%) | 0 (0.0%) |
| Personal Care & Service | 0 (0.0%) | 0 (0.0%) |
| Total (Category) | 2 (33.3%) | 4 (66.7%) |
| Total (Overall) | 111 (64.9%) | 60 (35.1%) |
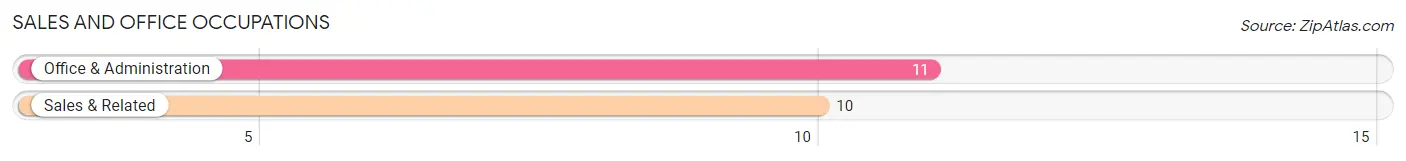
Sales and Office Occupations
The most common Sales and Office occupations in Dubberly are Office & Administration (11 | 6.4%), and Sales & Related (10 | 5.9%).
Sales and Office Occupations by Sex
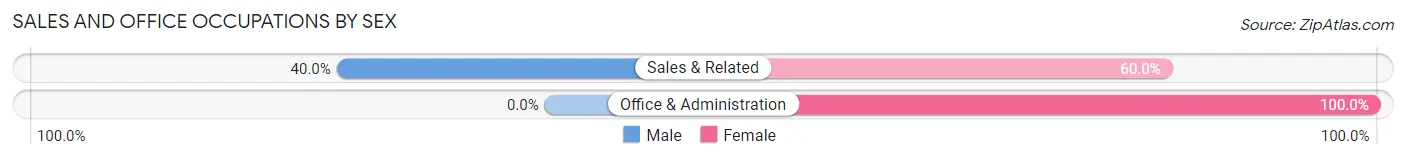
| Occupation | Male | Female |
| Sales & Related | 4 (40.0%) | 6 (60.0%) |
| Office & Administration | 0 (0.0%) | 11 (100.0%) |
| Total (Category) | 4 (19.1%) | 17 (80.9%) |
| Total (Overall) | 111 (64.9%) | 60 (35.1%) |
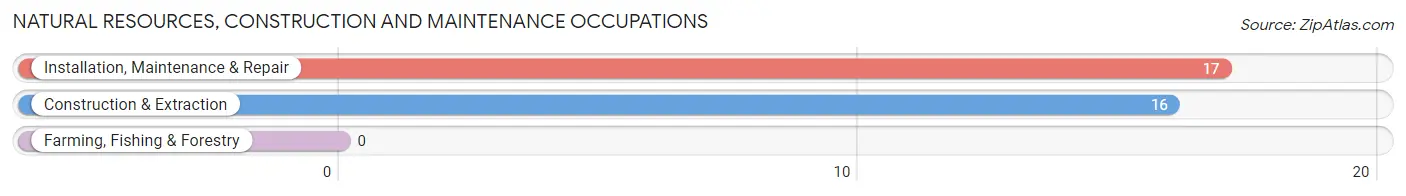
Natural Resources, Construction and Maintenance Occupations
The most common Natural Resources, Construction and Maintenance occupations in Dubberly are Installation, Maintenance & Repair (17 | 9.9%), and Construction & Extraction (16 | 9.4%).
Natural Resources, Construction and Maintenance Occupations by Sex
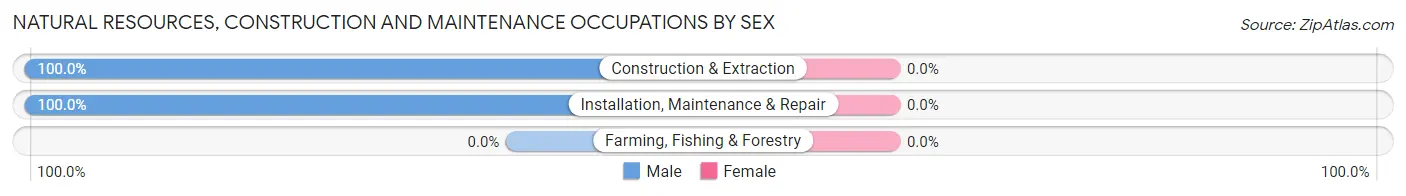
| Occupation | Male | Female |
| Farming, Fishing & Forestry | 0 (0.0%) | 0 (0.0%) |
| Construction & Extraction | 16 (100.0%) | 0 (0.0%) |
| Installation, Maintenance & Repair | 17 (100.0%) | 0 (0.0%) |
| Total (Category) | 33 (100.0%) | 0 (0.0%) |
| Total (Overall) | 111 (64.9%) | 60 (35.1%) |
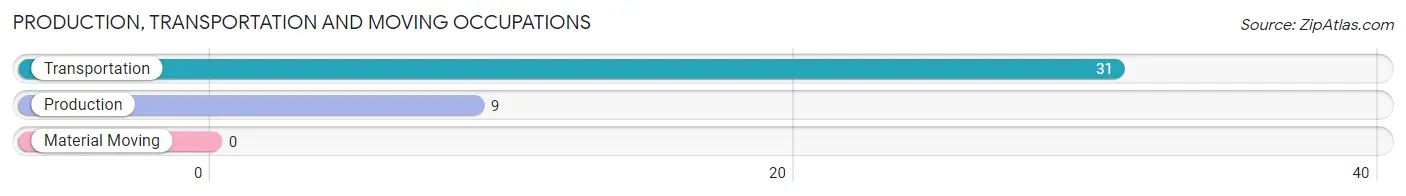
Production, Transportation and Moving Occupations
The most common Production, Transportation and Moving occupations in Dubberly are Transportation (31 | 18.1%), and Production (9 | 5.3%).
Production, Transportation and Moving Occupations by Sex
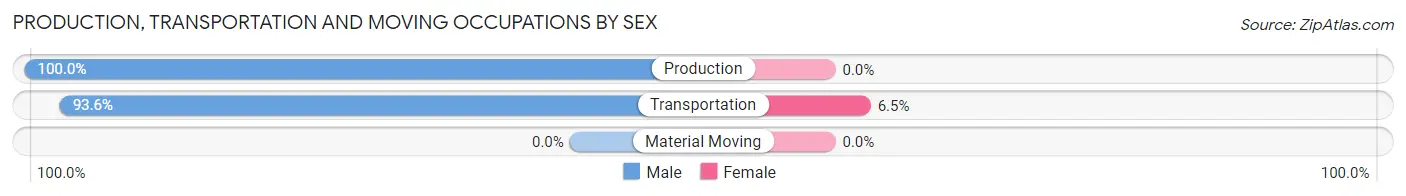
| Occupation | Male | Female |
| Production | 9 (100.0%) | 0 (0.0%) |
| Transportation | 29 (93.5%) | 2 (6.5%) |
| Material Moving | 0 (0.0%) | 0 (0.0%) |
| Total (Category) | 38 (95.0%) | 2 (5.0%) |
| Total (Overall) | 111 (64.9%) | 60 (35.1%) |
Employment Industries by Sex in Dubberly
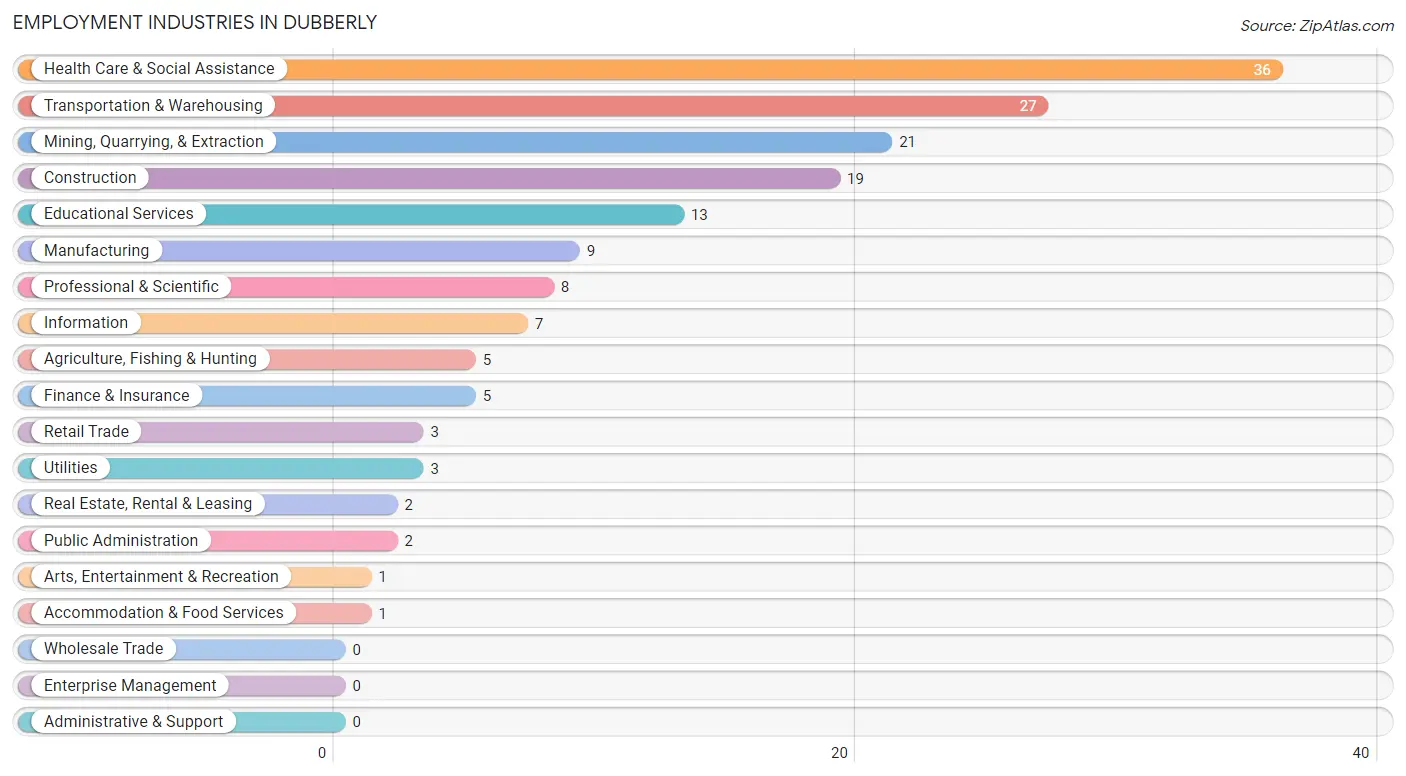
Employment Industries in Dubberly
The major employment industries in Dubberly include Health Care & Social Assistance (36 | 21.0%), Transportation & Warehousing (27 | 15.8%), Mining, Quarrying, & Extraction (21 | 12.3%), Construction (19 | 11.1%), and Educational Services (13 | 7.6%).
Employment Industries by Sex in Dubberly
The Dubberly industries that see more men than women are Agriculture, Fishing & Hunting (100.0%), Mining, Quarrying, & Extraction (100.0%), and Manufacturing (100.0%), whereas the industries that tend to have a higher number of women are Finance & Insurance (100.0%), Educational Services (100.0%), and Arts, Entertainment & Recreation (100.0%).
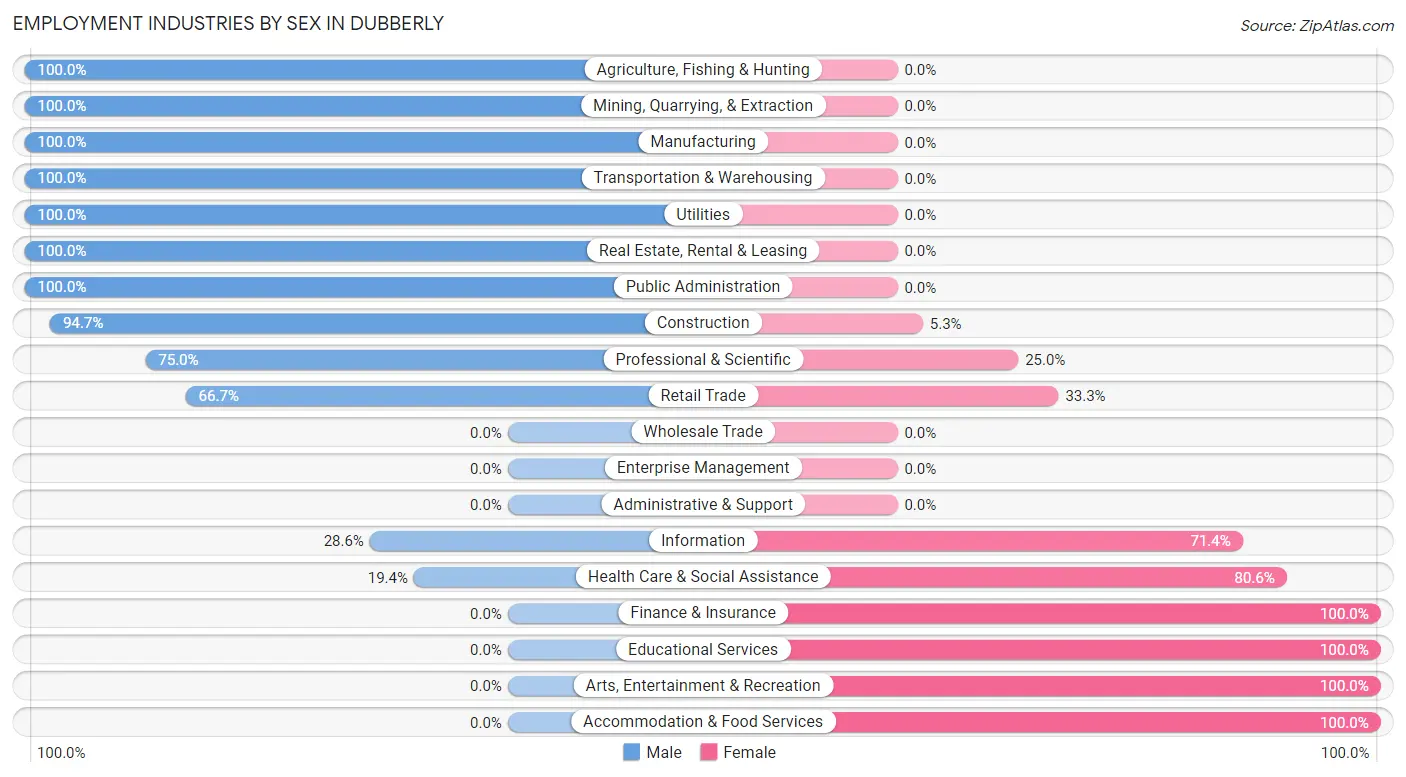
| Industry | Male | Female |
| Agriculture, Fishing & Hunting | 5 (100.0%) | 0 (0.0%) |
| Mining, Quarrying, & Extraction | 21 (100.0%) | 0 (0.0%) |
| Construction | 18 (94.7%) | 1 (5.3%) |
| Manufacturing | 9 (100.0%) | 0 (0.0%) |
| Wholesale Trade | 0 (0.0%) | 0 (0.0%) |
| Retail Trade | 2 (66.7%) | 1 (33.3%) |
| Transportation & Warehousing | 27 (100.0%) | 0 (0.0%) |
| Utilities | 3 (100.0%) | 0 (0.0%) |
| Information | 2 (28.6%) | 5 (71.4%) |
| Finance & Insurance | 0 (0.0%) | 5 (100.0%) |
| Real Estate, Rental & Leasing | 2 (100.0%) | 0 (0.0%) |
| Professional & Scientific | 6 (75.0%) | 2 (25.0%) |
| Enterprise Management | 0 (0.0%) | 0 (0.0%) |
| Administrative & Support | 0 (0.0%) | 0 (0.0%) |
| Educational Services | 0 (0.0%) | 13 (100.0%) |
| Health Care & Social Assistance | 7 (19.4%) | 29 (80.6%) |
| Arts, Entertainment & Recreation | 0 (0.0%) | 1 (100.0%) |
| Accommodation & Food Services | 0 (0.0%) | 1 (100.0%) |
| Public Administration | 2 (100.0%) | 0 (0.0%) |
| Total | 111 (64.9%) | 60 (35.1%) |
Education in Dubberly
School Enrollment in Dubberly
The most common levels of schooling among the 68 students in Dubberly are middle school (24 | 35.3%), college / undergraduate (17 | 25.0%), and high school (13 | 19.1%).
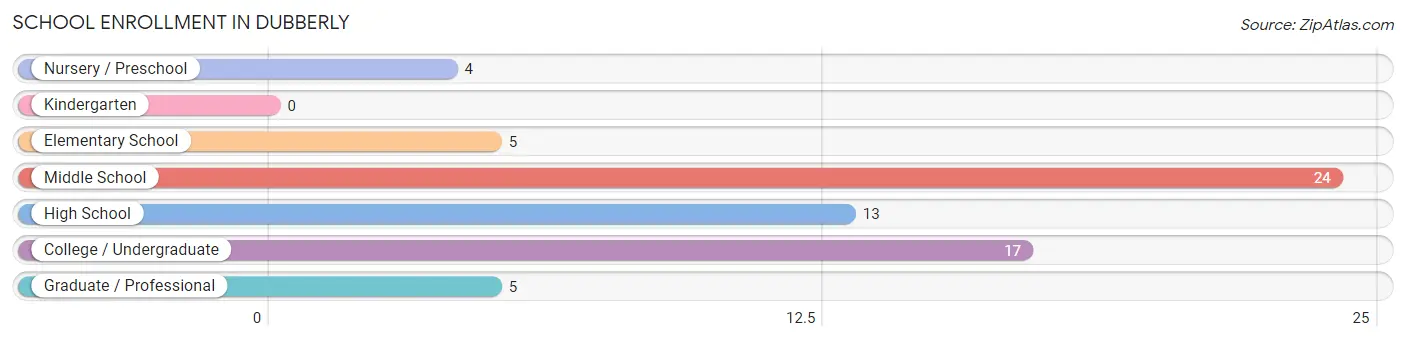
| School Level | # Students | % Students |
| Nursery / Preschool | 4 | 5.9% |
| Kindergarten | 0 | 0.0% |
| Elementary School | 5 | 7.3% |
| Middle School | 24 | 35.3% |
| High School | 13 | 19.1% |
| College / Undergraduate | 17 | 25.0% |
| Graduate / Professional | 5 | 7.3% |
| Total | 68 | 100.0% |
School Enrollment by Age by Funding Source in Dubberly
Out of a total of 68 students who are enrolled in schools in Dubberly, 5 (7.4%) attend a private institution, while the remaining 63 (92.6%) are enrolled in public schools. The age group of 25 to 34 year olds has the highest likelihood of being enrolled in private schools, with 5 (100.0% in the age bracket) enrolled. Conversely, the age group of 3 to 4 year olds has the lowest likelihood of being enrolled in a private school, with 4 (100.0% in the age bracket) attending a public institution.
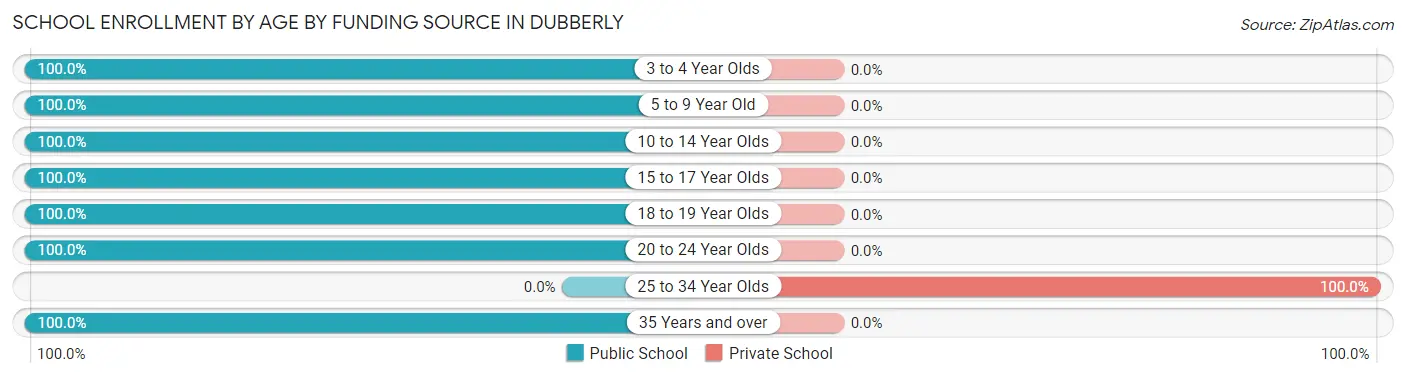
| Age Bracket | Public School | Private School |
| 3 to 4 Year Olds | 4 (100.0%) | 0 (0.0%) |
| 5 to 9 Year Old | 5 (100.0%) | 0 (0.0%) |
| 10 to 14 Year Olds | 27 (100.0%) | 0 (0.0%) |
| 15 to 17 Year Olds | 10 (100.0%) | 0 (0.0%) |
| 18 to 19 Year Olds | 9 (100.0%) | 0 (0.0%) |
| 20 to 24 Year Olds | 1 (100.0%) | 0 (0.0%) |
| 25 to 34 Year Olds | 0 (0.0%) | 5 (100.0%) |
| 35 Years and over | 7 (100.0%) | 0 (0.0%) |
| Total | 63 (92.6%) | 5 (7.4%) |
Educational Attainment by Field of Study in Dubberly
Business (10 | 25.0%), education (10 | 25.0%), science & technology (9 | 22.5%), psychology (4 | 10.0%), and arts & humanities (3 | 7.5%) are the most common fields of study among 40 individuals in Dubberly who have obtained a bachelor's degree or higher.
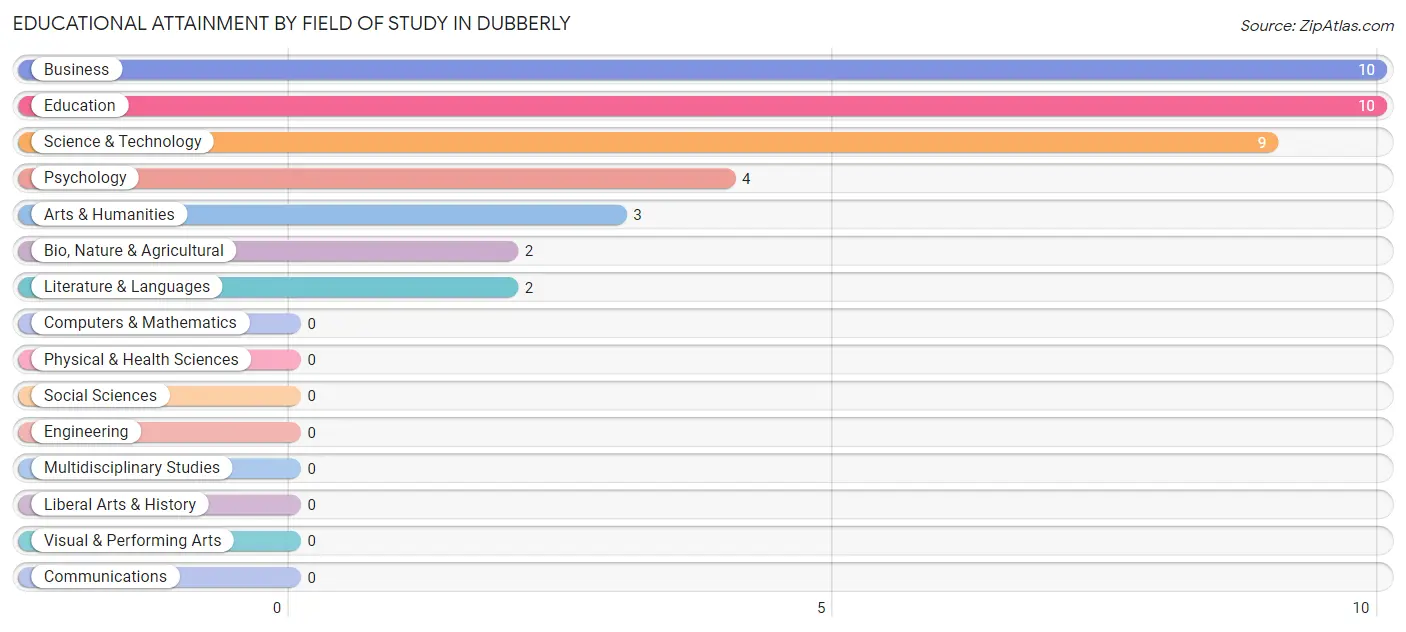
| Field of Study | # Graduates | % Graduates |
| Computers & Mathematics | 0 | 0.0% |
| Bio, Nature & Agricultural | 2 | 5.0% |
| Physical & Health Sciences | 0 | 0.0% |
| Psychology | 4 | 10.0% |
| Social Sciences | 0 | 0.0% |
| Engineering | 0 | 0.0% |
| Multidisciplinary Studies | 0 | 0.0% |
| Science & Technology | 9 | 22.5% |
| Business | 10 | 25.0% |
| Education | 10 | 25.0% |
| Literature & Languages | 2 | 5.0% |
| Liberal Arts & History | 0 | 0.0% |
| Visual & Performing Arts | 0 | 0.0% |
| Communications | 0 | 0.0% |
| Arts & Humanities | 3 | 7.5% |
| Total | 40 | 100.0% |
Transportation & Commute in Dubberly
Vehicle Availability by Sex in Dubberly
The most prevalent vehicle ownership categories in Dubberly are males with 3 vehicles (48, accounting for 43.2%) and females with 3 vehicles (9, making up 80.0%).
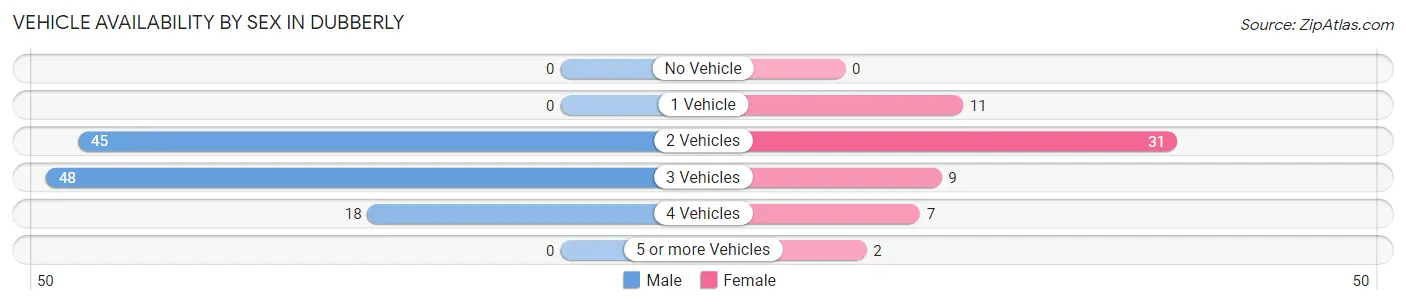
| Vehicles Available | Male | Female |
| No Vehicle | 0 (0.0%) | 0 (0.0%) |
| 1 Vehicle | 0 (0.0%) | 11 (18.3%) |
| 2 Vehicles | 45 (40.5%) | 31 (51.7%) |
| 3 Vehicles | 48 (43.2%) | 9 (15.0%) |
| 4 Vehicles | 18 (16.2%) | 7 (11.7%) |
| 5 or more Vehicles | 0 (0.0%) | 2 (3.3%) |
| Total | 111 (100.0%) | 60 (100.0%) |
Commute Time in Dubberly
The most frequently occuring commute durations in Dubberly are 45 to 59 minutes (30 commuters, 17.7%), 15 to 19 minutes (28 commuters, 16.6%), and 5 to 9 minutes (26 commuters, 15.4%).
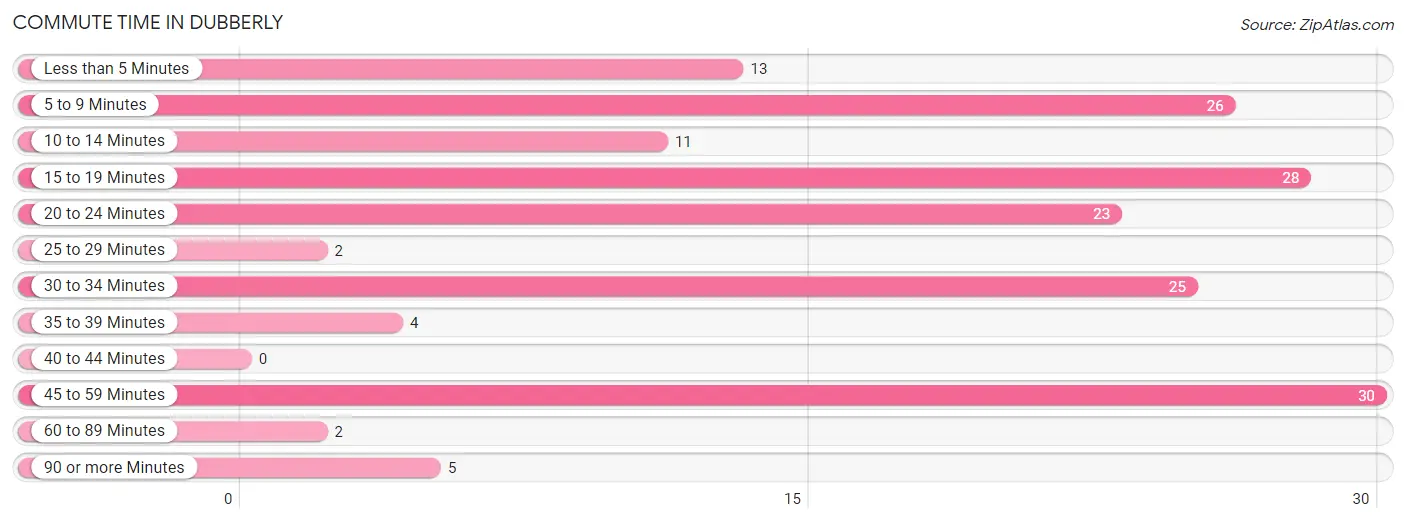
| Commute Time | # Commuters | % Commuters |
| Less than 5 Minutes | 13 | 7.7% |
| 5 to 9 Minutes | 26 | 15.4% |
| 10 to 14 Minutes | 11 | 6.5% |
| 15 to 19 Minutes | 28 | 16.6% |
| 20 to 24 Minutes | 23 | 13.6% |
| 25 to 29 Minutes | 2 | 1.2% |
| 30 to 34 Minutes | 25 | 14.8% |
| 35 to 39 Minutes | 4 | 2.4% |
| 40 to 44 Minutes | 0 | 0.0% |
| 45 to 59 Minutes | 30 | 17.7% |
| 60 to 89 Minutes | 2 | 1.2% |
| 90 or more Minutes | 5 | 3.0% |
Commute Time by Sex in Dubberly
The most common commute times in Dubberly are 45 to 59 minutes (30 commuters, 27.0%) for males and 15 to 19 minutes (18 commuters, 31.0%) for females.
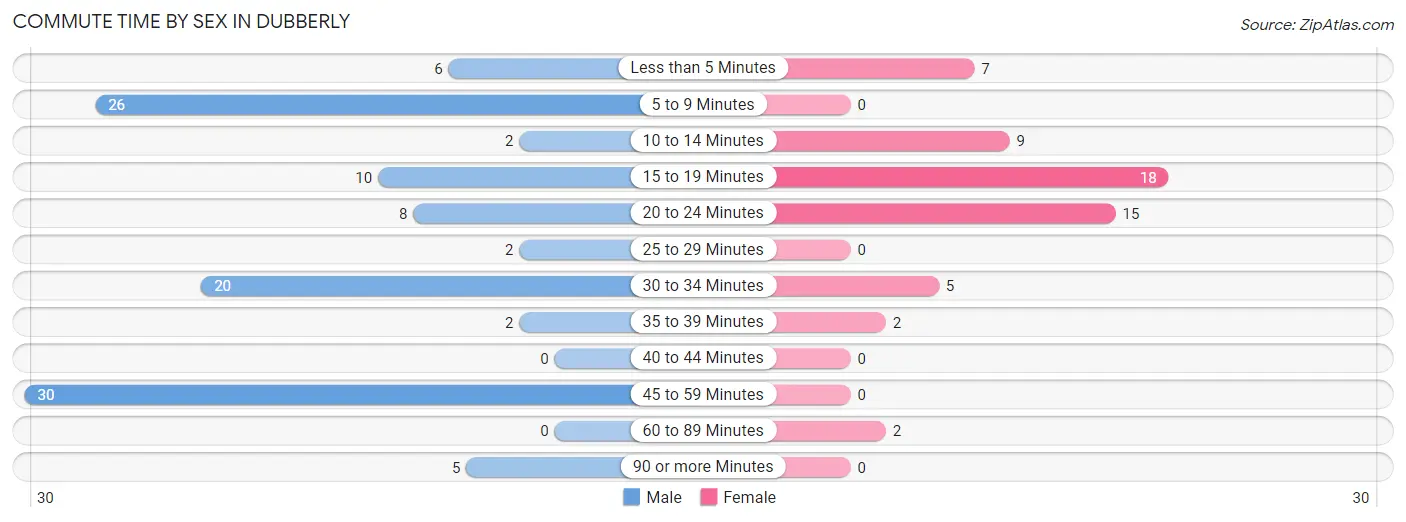
| Commute Time | Male | Female |
| Less than 5 Minutes | 6 (5.4%) | 7 (12.1%) |
| 5 to 9 Minutes | 26 (23.4%) | 0 (0.0%) |
| 10 to 14 Minutes | 2 (1.8%) | 9 (15.5%) |
| 15 to 19 Minutes | 10 (9.0%) | 18 (31.0%) |
| 20 to 24 Minutes | 8 (7.2%) | 15 (25.9%) |
| 25 to 29 Minutes | 2 (1.8%) | 0 (0.0%) |
| 30 to 34 Minutes | 20 (18.0%) | 5 (8.6%) |
| 35 to 39 Minutes | 2 (1.8%) | 2 (3.5%) |
| 40 to 44 Minutes | 0 (0.0%) | 0 (0.0%) |
| 45 to 59 Minutes | 30 (27.0%) | 0 (0.0%) |
| 60 to 89 Minutes | 0 (0.0%) | 2 (3.5%) |
| 90 or more Minutes | 5 (4.5%) | 0 (0.0%) |
Time of Departure to Work by Sex in Dubberly
The most frequent times of departure to work in Dubberly are 12:00 AM to 4:59 AM (36, 32.4%) for males and 7:30 AM to 7:59 AM (21, 36.2%) for females.
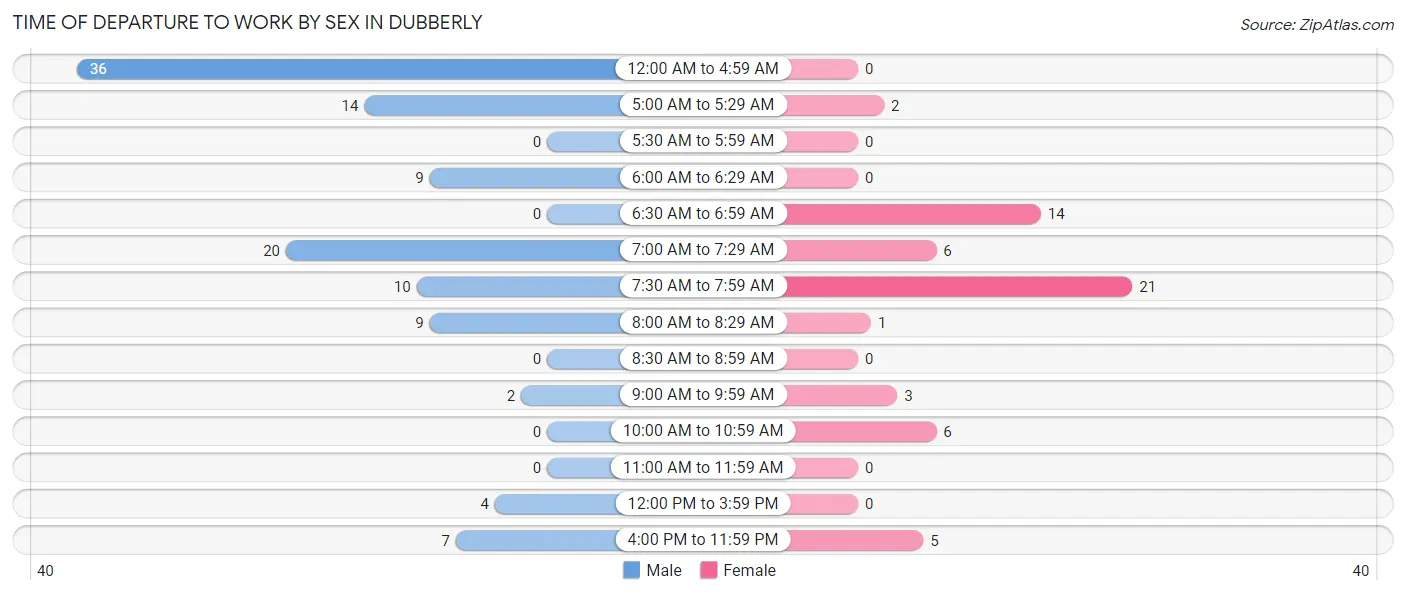
| Time of Departure | Male | Female |
| 12:00 AM to 4:59 AM | 36 (32.4%) | 0 (0.0%) |
| 5:00 AM to 5:29 AM | 14 (12.6%) | 2 (3.5%) |
| 5:30 AM to 5:59 AM | 0 (0.0%) | 0 (0.0%) |
| 6:00 AM to 6:29 AM | 9 (8.1%) | 0 (0.0%) |
| 6:30 AM to 6:59 AM | 0 (0.0%) | 14 (24.1%) |
| 7:00 AM to 7:29 AM | 20 (18.0%) | 6 (10.3%) |
| 7:30 AM to 7:59 AM | 10 (9.0%) | 21 (36.2%) |
| 8:00 AM to 8:29 AM | 9 (8.1%) | 1 (1.7%) |
| 8:30 AM to 8:59 AM | 0 (0.0%) | 0 (0.0%) |
| 9:00 AM to 9:59 AM | 2 (1.8%) | 3 (5.2%) |
| 10:00 AM to 10:59 AM | 0 (0.0%) | 6 (10.3%) |
| 11:00 AM to 11:59 AM | 0 (0.0%) | 0 (0.0%) |
| 12:00 PM to 3:59 PM | 4 (3.6%) | 0 (0.0%) |
| 4:00 PM to 11:59 PM | 7 (6.3%) | 5 (8.6%) |
| Total | 111 (100.0%) | 58 (100.0%) |
Housing Occupancy in Dubberly
Occupancy by Ownership in Dubberly
Of the total 141 dwellings in Dubberly, owner-occupied units account for 125 (88.6%), while renter-occupied units make up 16 (11.4%).
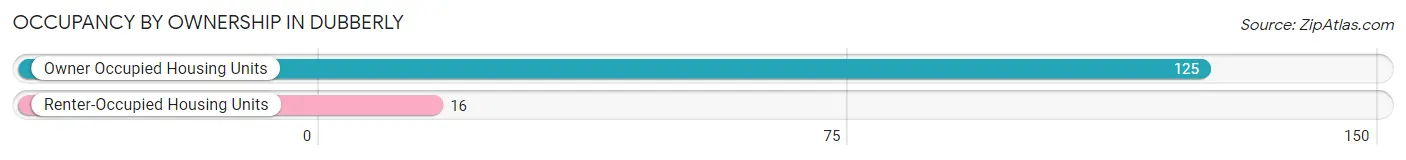
| Occupancy | # Housing Units | % Housing Units |
| Owner Occupied Housing Units | 125 | 88.6% |
| Renter-Occupied Housing Units | 16 | 11.4% |
| Total Occupied Housing Units | 141 | 100.0% |
Occupancy by Household Size in Dubberly
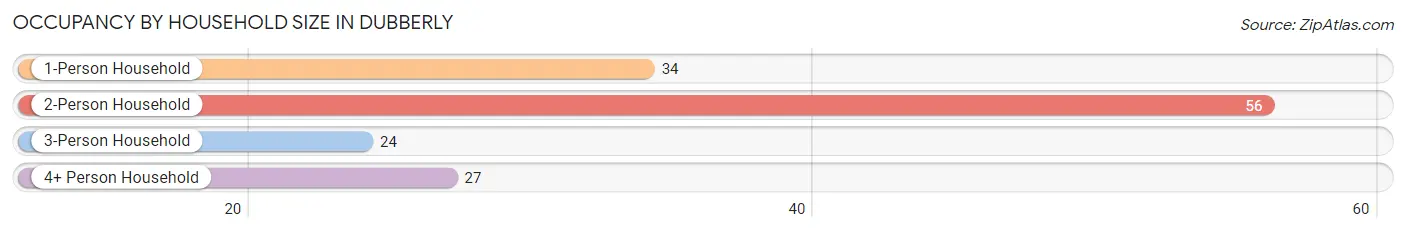
| Household Size | # Housing Units | % Housing Units |
| 1-Person Household | 34 | 24.1% |
| 2-Person Household | 56 | 39.7% |
| 3-Person Household | 24 | 17.0% |
| 4+ Person Household | 27 | 19.2% |
| Total Housing Units | 141 | 100.0% |
Occupancy by Ownership by Household Size in Dubberly
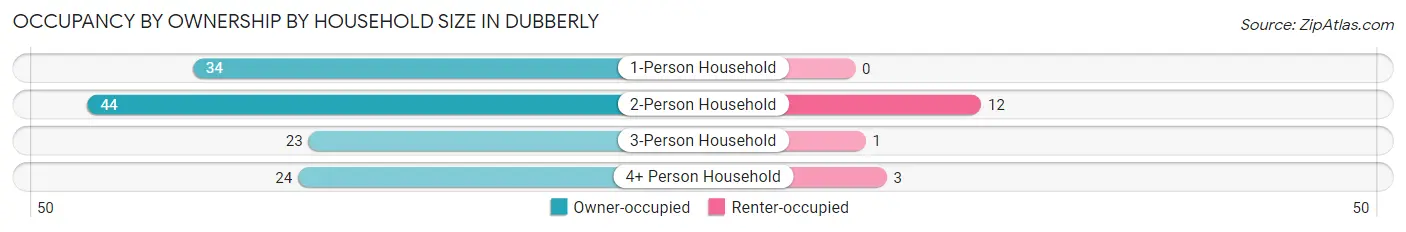
| Household Size | Owner-occupied | Renter-occupied |
| 1-Person Household | 34 (100.0%) | 0 (0.0%) |
| 2-Person Household | 44 (78.6%) | 12 (21.4%) |
| 3-Person Household | 23 (95.8%) | 1 (4.2%) |
| 4+ Person Household | 24 (88.9%) | 3 (11.1%) |
| Total Housing Units | 125 (88.6%) | 16 (11.4%) |
Occupancy by Educational Attainment in Dubberly
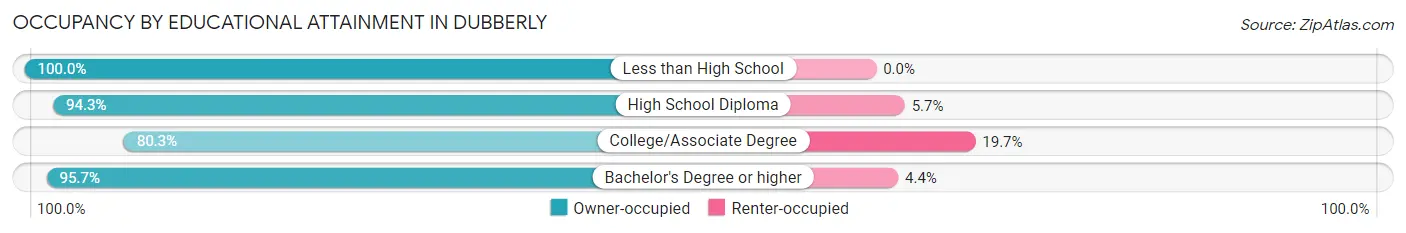
| Household Size | Owner-occupied | Renter-occupied |
| Less than High School | 4 (100.0%) | 0 (0.0%) |
| High School Diploma | 50 (94.3%) | 3 (5.7%) |
| College/Associate Degree | 49 (80.3%) | 12 (19.7%) |
| Bachelor's Degree or higher | 22 (95.7%) | 1 (4.3%) |
Occupancy by Age of Householder in Dubberly
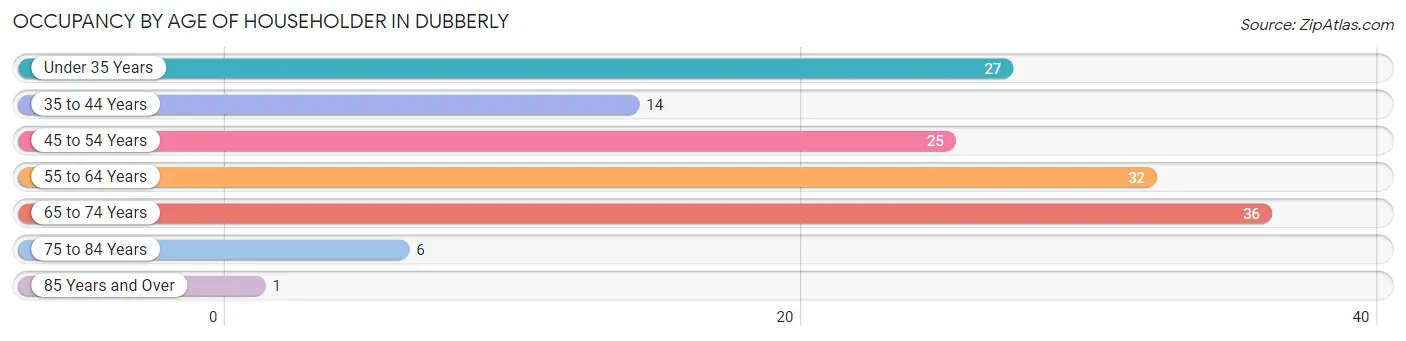
| Age Bracket | # Households | % Households |
| Under 35 Years | 27 | 19.2% |
| 35 to 44 Years | 14 | 9.9% |
| 45 to 54 Years | 25 | 17.7% |
| 55 to 64 Years | 32 | 22.7% |
| 65 to 74 Years | 36 | 25.5% |
| 75 to 84 Years | 6 | 4.3% |
| 85 Years and Over | 1 | 0.7% |
| Total | 141 | 100.0% |
Housing Finances in Dubberly
Median Income by Occupancy in Dubberly
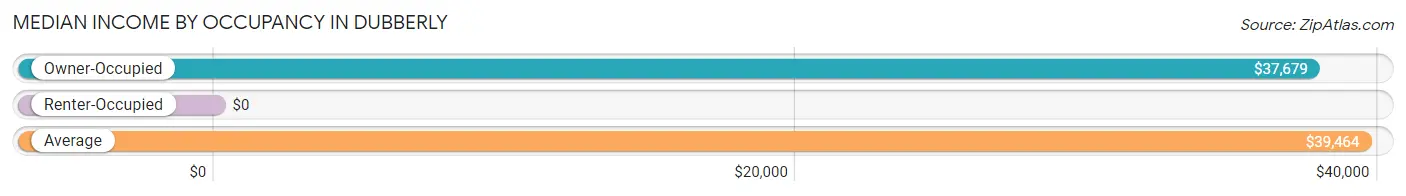
| Occupancy Type | # Households | Median Income |
| Owner-Occupied | 125 (88.6%) | $37,679 |
| Renter-Occupied | 16 (11.4%) | $0 |
| Average | 141 (100.0%) | $39,464 |
Occupancy by Householder Income Bracket in Dubberly
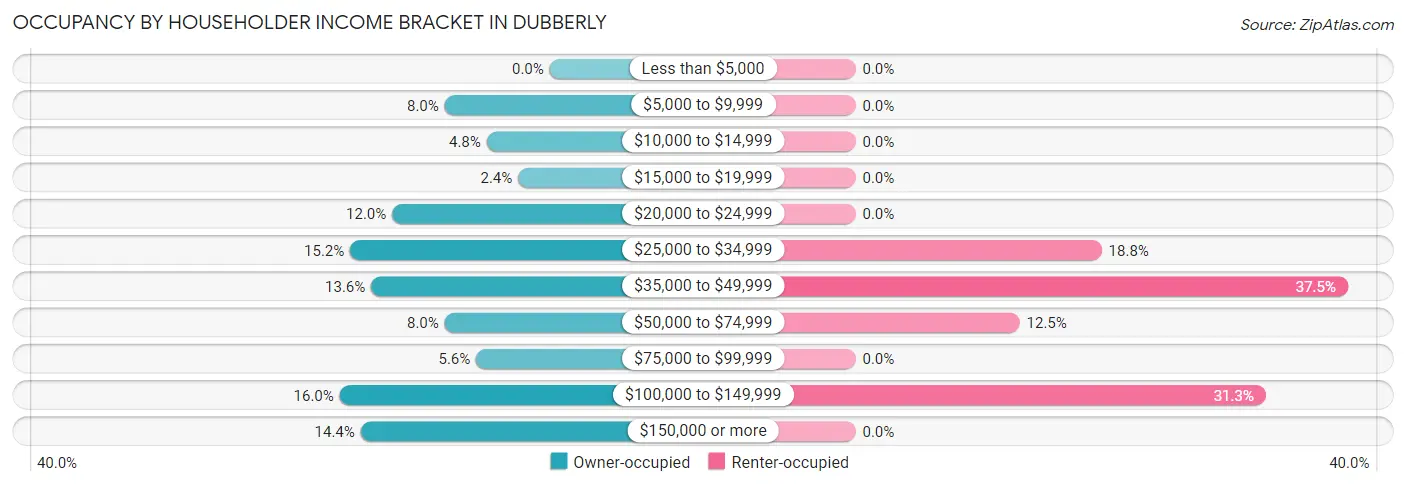
| Income Bracket | Owner-occupied | Renter-occupied |
| Less than $5,000 | 0 (0.0%) | 0 (0.0%) |
| $5,000 to $9,999 | 10 (8.0%) | 0 (0.0%) |
| $10,000 to $14,999 | 6 (4.8%) | 0 (0.0%) |
| $15,000 to $19,999 | 3 (2.4%) | 0 (0.0%) |
| $20,000 to $24,999 | 15 (12.0%) | 0 (0.0%) |
| $25,000 to $34,999 | 19 (15.2%) | 3 (18.8%) |
| $35,000 to $49,999 | 17 (13.6%) | 6 (37.5%) |
| $50,000 to $74,999 | 10 (8.0%) | 2 (12.5%) |
| $75,000 to $99,999 | 7 (5.6%) | 0 (0.0%) |
| $100,000 to $149,999 | 20 (16.0%) | 5 (31.2%) |
| $150,000 or more | 18 (14.4%) | 0 (0.0%) |
| Total | 125 (100.0%) | 16 (100.0%) |
Monthly Housing Cost Tiers in Dubberly
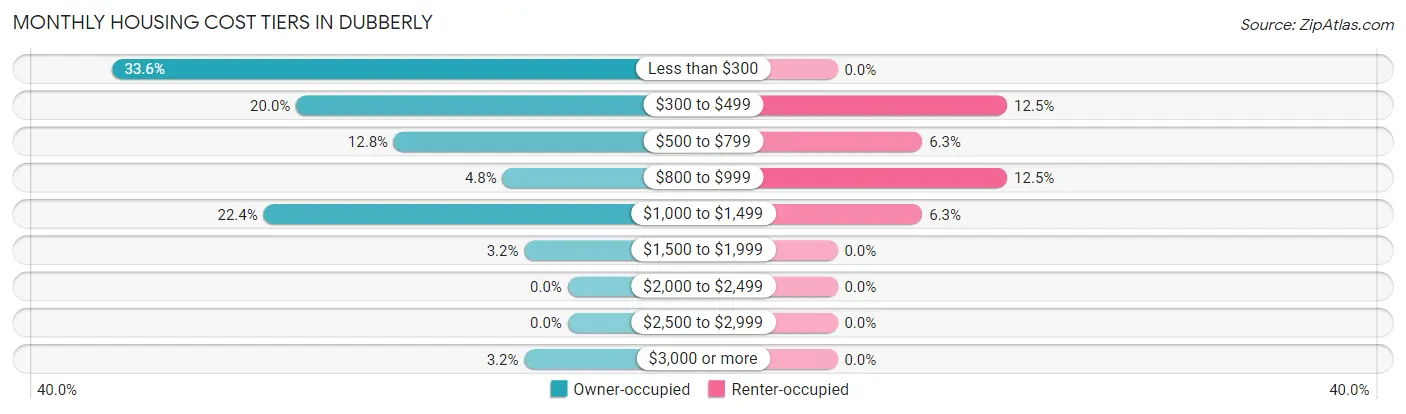
| Monthly Cost | Owner-occupied | Renter-occupied |
| Less than $300 | 42 (33.6%) | 0 (0.0%) |
| $300 to $499 | 25 (20.0%) | 2 (12.5%) |
| $500 to $799 | 16 (12.8%) | 1 (6.2%) |
| $800 to $999 | 6 (4.8%) | 2 (12.5%) |
| $1,000 to $1,499 | 28 (22.4%) | 1 (6.2%) |
| $1,500 to $1,999 | 4 (3.2%) | 0 (0.0%) |
| $2,000 to $2,499 | 0 (0.0%) | 0 (0.0%) |
| $2,500 to $2,999 | 0 (0.0%) | 0 (0.0%) |
| $3,000 or more | 4 (3.2%) | 0 (0.0%) |
| Total | 125 (100.0%) | 16 (100.0%) |
Physical Housing Characteristics in Dubberly
Housing Structures in Dubberly
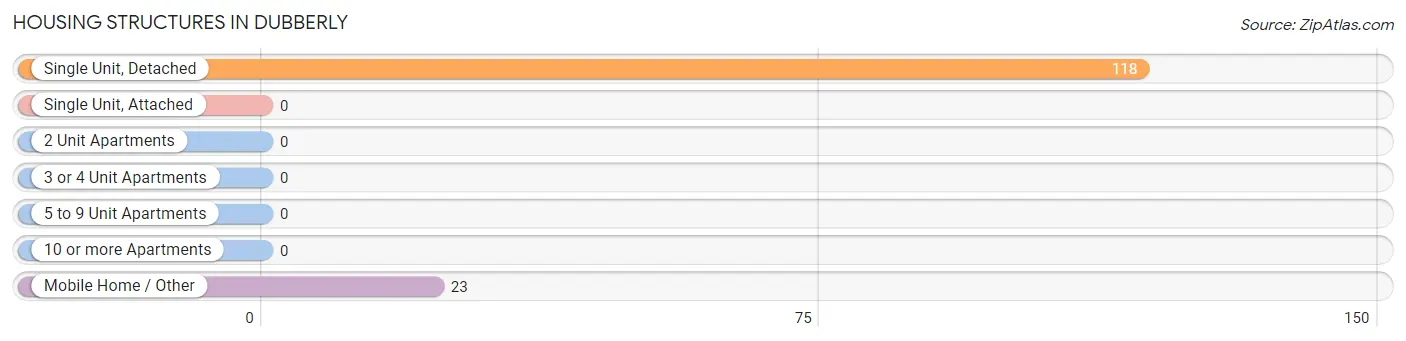
| Structure Type | # Housing Units | % Housing Units |
| Single Unit, Detached | 118 | 83.7% |
| Single Unit, Attached | 0 | 0.0% |
| 2 Unit Apartments | 0 | 0.0% |
| 3 or 4 Unit Apartments | 0 | 0.0% |
| 5 to 9 Unit Apartments | 0 | 0.0% |
| 10 or more Apartments | 0 | 0.0% |
| Mobile Home / Other | 23 | 16.3% |
| Total | 141 | 100.0% |
Housing Structures by Occupancy in Dubberly
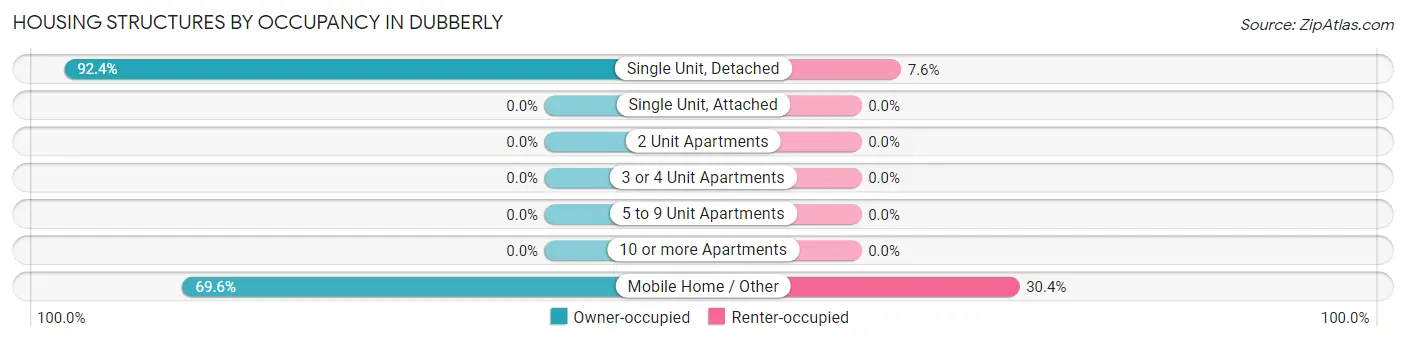
| Structure Type | Owner-occupied | Renter-occupied |
| Single Unit, Detached | 109 (92.4%) | 9 (7.6%) |
| Single Unit, Attached | 0 (0.0%) | 0 (0.0%) |
| 2 Unit Apartments | 0 (0.0%) | 0 (0.0%) |
| 3 or 4 Unit Apartments | 0 (0.0%) | 0 (0.0%) |
| 5 to 9 Unit Apartments | 0 (0.0%) | 0 (0.0%) |
| 10 or more Apartments | 0 (0.0%) | 0 (0.0%) |
| Mobile Home / Other | 16 (69.6%) | 7 (30.4%) |
| Total | 125 (88.6%) | 16 (11.4%) |
Housing Structures by Number of Rooms in Dubberly
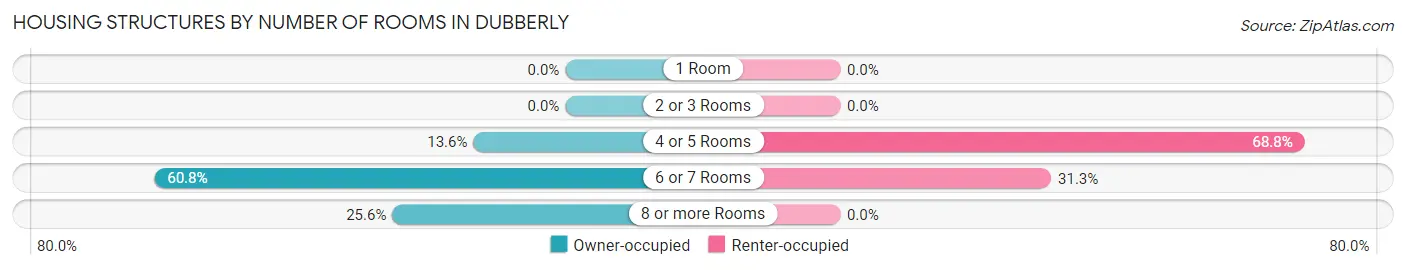
| Number of Rooms | Owner-occupied | Renter-occupied |
| 1 Room | 0 (0.0%) | 0 (0.0%) |
| 2 or 3 Rooms | 0 (0.0%) | 0 (0.0%) |
| 4 or 5 Rooms | 17 (13.6%) | 11 (68.8%) |
| 6 or 7 Rooms | 76 (60.8%) | 5 (31.2%) |
| 8 or more Rooms | 32 (25.6%) | 0 (0.0%) |
| Total | 125 (100.0%) | 16 (100.0%) |
Housing Structure by Heating Type in Dubberly
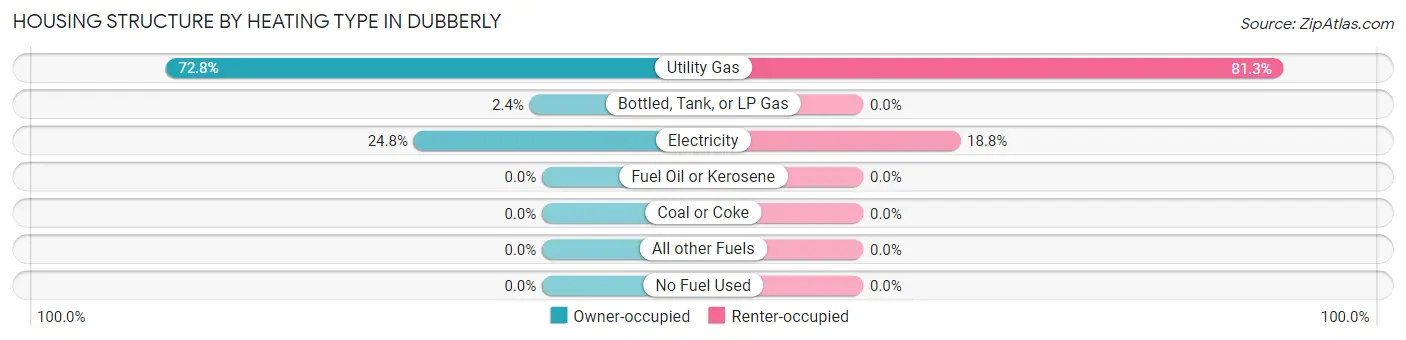
| Heating Type | Owner-occupied | Renter-occupied |
| Utility Gas | 91 (72.8%) | 13 (81.2%) |
| Bottled, Tank, or LP Gas | 3 (2.4%) | 0 (0.0%) |
| Electricity | 31 (24.8%) | 3 (18.8%) |
| Fuel Oil or Kerosene | 0 (0.0%) | 0 (0.0%) |
| Coal or Coke | 0 (0.0%) | 0 (0.0%) |
| All other Fuels | 0 (0.0%) | 0 (0.0%) |
| No Fuel Used | 0 (0.0%) | 0 (0.0%) |
| Total | 125 (100.0%) | 16 (100.0%) |
Household Vehicle Usage in Dubberly
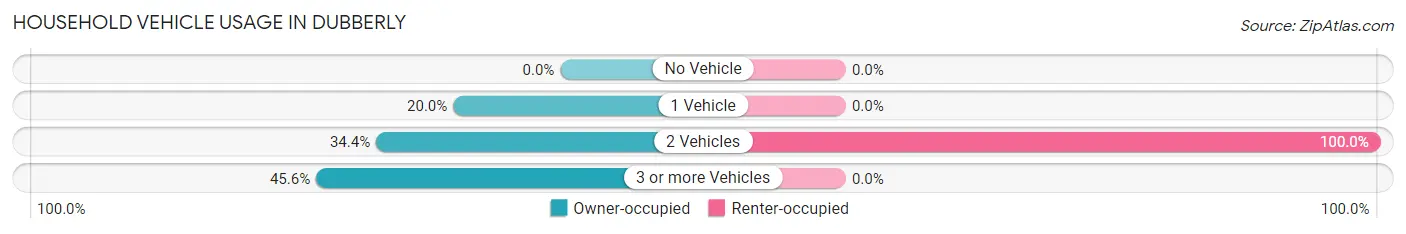
| Vehicles per Household | Owner-occupied | Renter-occupied |
| No Vehicle | 0 (0.0%) | 0 (0.0%) |
| 1 Vehicle | 25 (20.0%) | 0 (0.0%) |
| 2 Vehicles | 43 (34.4%) | 16 (100.0%) |
| 3 or more Vehicles | 57 (45.6%) | 0 (0.0%) |
| Total | 125 (100.0%) | 16 (100.0%) |
Real Estate & Mortgages in Dubberly
Real Estate and Mortgage Overview in Dubberly
| Characteristic | Without Mortgage | With Mortgage |
| Housing Units | 79 | 46 |
| Median Property Value | $143,800 | $181,300 |
| Median Household Income | - | - |
| Monthly Housing Costs | $282 | $4 |
| Real Estate Taxes | - | - |
Property Value by Mortgage Status in Dubberly
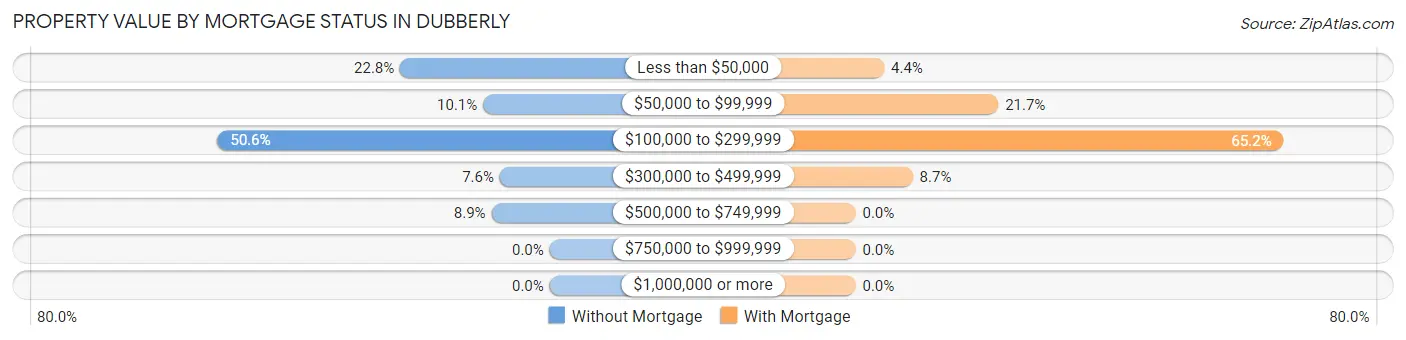
| Property Value | Without Mortgage | With Mortgage |
| Less than $50,000 | 18 (22.8%) | 2 (4.3%) |
| $50,000 to $99,999 | 8 (10.1%) | 10 (21.7%) |
| $100,000 to $299,999 | 40 (50.6%) | 30 (65.2%) |
| $300,000 to $499,999 | 6 (7.6%) | 4 (8.7%) |
| $500,000 to $749,999 | 7 (8.9%) | 0 (0.0%) |
| $750,000 to $999,999 | 0 (0.0%) | 0 (0.0%) |
| $1,000,000 or more | 0 (0.0%) | 0 (0.0%) |
| Total | 79 (100.0%) | 46 (100.0%) |
Household Income by Mortgage Status in Dubberly
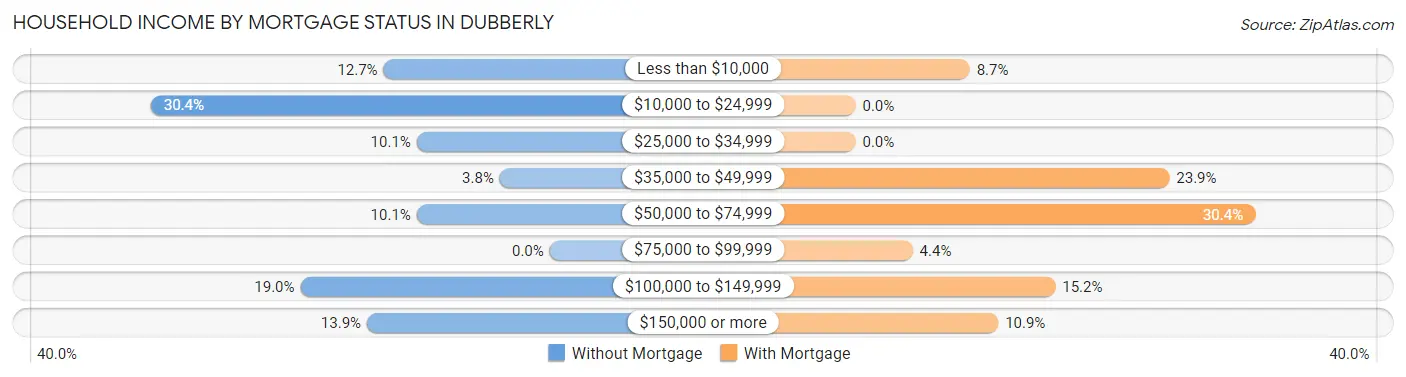
| Household Income | Without Mortgage | With Mortgage |
| Less than $10,000 | 10 (12.7%) | 4 (8.7%) |
| $10,000 to $24,999 | 24 (30.4%) | 0 (0.0%) |
| $25,000 to $34,999 | 8 (10.1%) | 0 (0.0%) |
| $35,000 to $49,999 | 3 (3.8%) | 11 (23.9%) |
| $50,000 to $74,999 | 8 (10.1%) | 14 (30.4%) |
| $75,000 to $99,999 | 0 (0.0%) | 2 (4.3%) |
| $100,000 to $149,999 | 15 (19.0%) | 7 (15.2%) |
| $150,000 or more | 11 (13.9%) | 5 (10.9%) |
| Total | 79 (100.0%) | 46 (100.0%) |
Property Value to Household Income Ratio in Dubberly
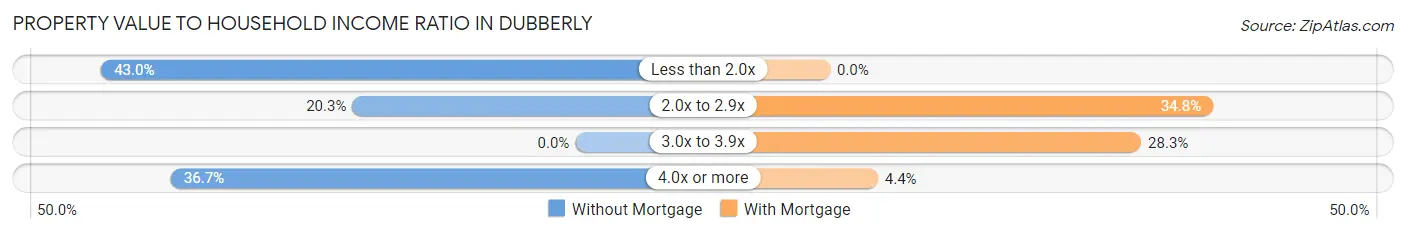
| Value-to-Income Ratio | Without Mortgage | With Mortgage |
| Less than 2.0x | 34 (43.0%) | 0 (0.0%) |
| 2.0x to 2.9x | 16 (20.3%) | 16 (34.8%) |
| 3.0x to 3.9x | 0 (0.0%) | 13 (28.3%) |
| 4.0x or more | 29 (36.7%) | 2 (4.3%) |
| Total | 79 (100.0%) | 46 (100.0%) |
Real Estate Taxes by Mortgage Status in Dubberly
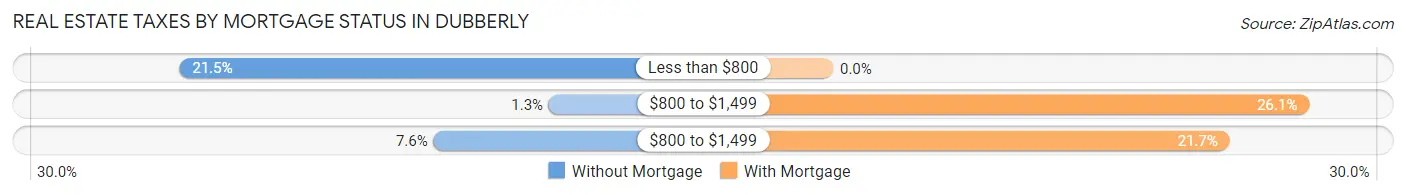
| Property Taxes | Without Mortgage | With Mortgage |
| Less than $800 | 17 (21.5%) | 0 (0.0%) |
| $800 to $1,499 | 1 (1.3%) | 12 (26.1%) |
| $800 to $1,499 | 6 (7.6%) | 10 (21.7%) |
| Total | 79 (100.0%) | 46 (100.0%) |
Health & Disability in Dubberly
Health Insurance Coverage by Age in Dubberly
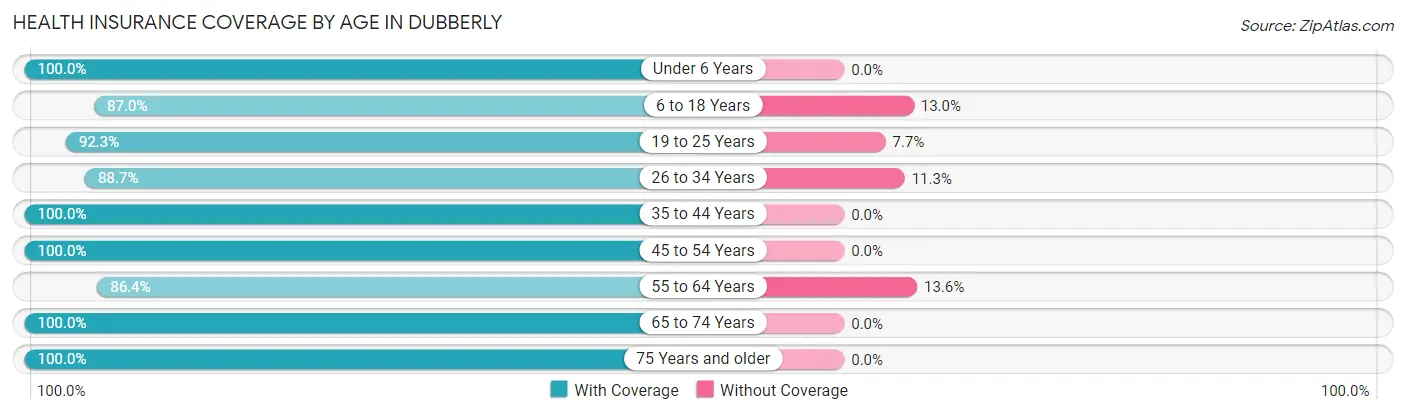
| Age Bracket | With Coverage | Without Coverage |
| Under 6 Years | 47 (100.0%) | 0 (0.0%) |
| 6 to 18 Years | 47 (87.0%) | 7 (13.0%) |
| 19 to 25 Years | 12 (92.3%) | 1 (7.7%) |
| 26 to 34 Years | 63 (88.7%) | 8 (11.3%) |
| 35 to 44 Years | 24 (100.0%) | 0 (0.0%) |
| 45 to 54 Years | 41 (100.0%) | 0 (0.0%) |
| 55 to 64 Years | 51 (86.4%) | 8 (13.6%) |
| 65 to 74 Years | 65 (100.0%) | 0 (0.0%) |
| 75 Years and older | 16 (100.0%) | 0 (0.0%) |
| Total | 366 (93.9%) | 24 (6.1%) |
Health Insurance Coverage by Citizenship Status in Dubberly
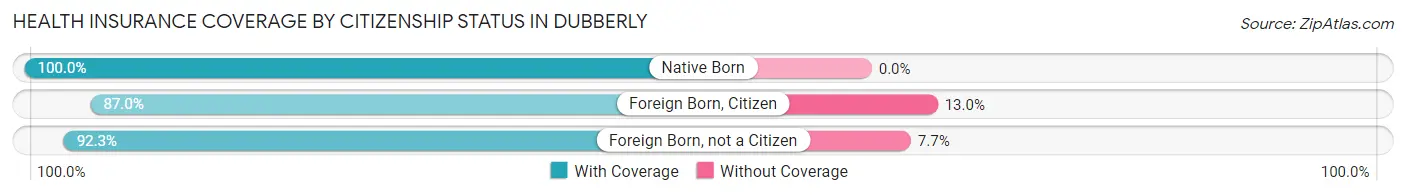
| Citizenship Status | With Coverage | Without Coverage |
| Native Born | 47 (100.0%) | 0 (0.0%) |
| Foreign Born, Citizen | 47 (87.0%) | 7 (13.0%) |
| Foreign Born, not a Citizen | 12 (92.3%) | 1 (7.7%) |
Health Insurance Coverage by Household Income in Dubberly
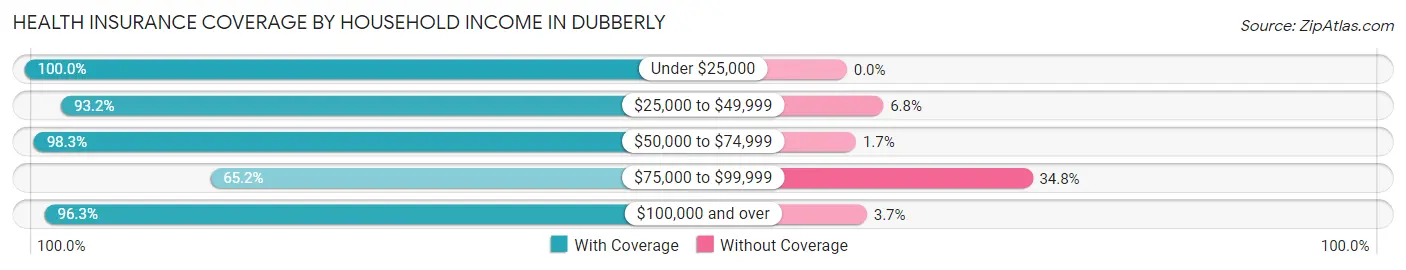
| Household Income | With Coverage | Without Coverage |
| Under $25,000 | 41 (100.0%) | 0 (0.0%) |
| $25,000 to $49,999 | 150 (93.2%) | 11 (6.8%) |
| $50,000 to $74,999 | 57 (98.3%) | 1 (1.7%) |
| $75,000 to $99,999 | 15 (65.2%) | 8 (34.8%) |
| $100,000 and over | 103 (96.3%) | 4 (3.7%) |
Public vs Private Health Insurance Coverage by Age in Dubberly
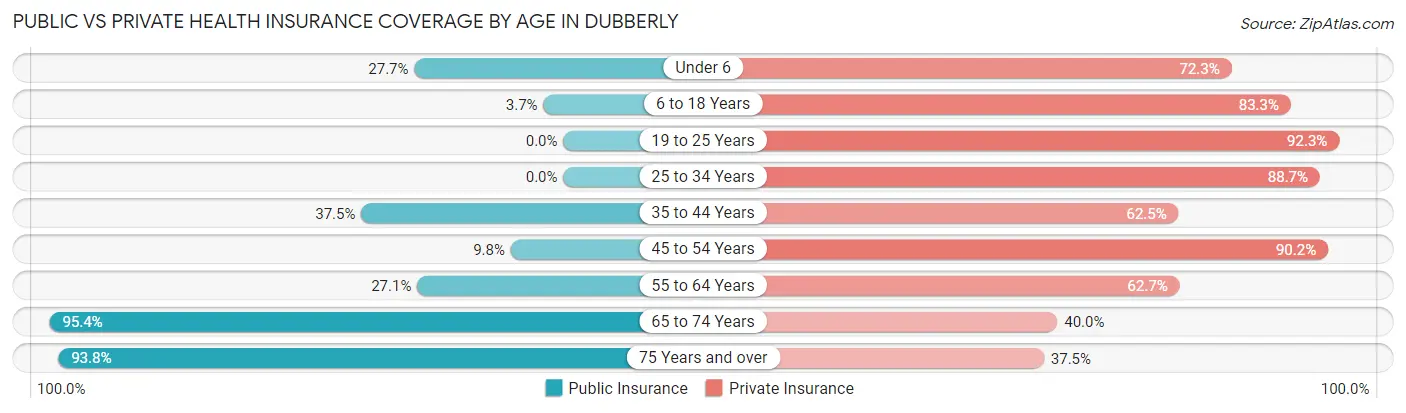
| Age Bracket | Public Insurance | Private Insurance |
| Under 6 | 13 (27.7%) | 34 (72.3%) |
| 6 to 18 Years | 2 (3.7%) | 45 (83.3%) |
| 19 to 25 Years | 0 (0.0%) | 12 (92.3%) |
| 25 to 34 Years | 0 (0.0%) | 63 (88.7%) |
| 35 to 44 Years | 9 (37.5%) | 15 (62.5%) |
| 45 to 54 Years | 4 (9.8%) | 37 (90.2%) |
| 55 to 64 Years | 16 (27.1%) | 37 (62.7%) |
| 65 to 74 Years | 62 (95.4%) | 26 (40.0%) |
| 75 Years and over | 15 (93.8%) | 6 (37.5%) |
| Total | 121 (31.0%) | 275 (70.5%) |
Disability Status by Sex by Age in Dubberly
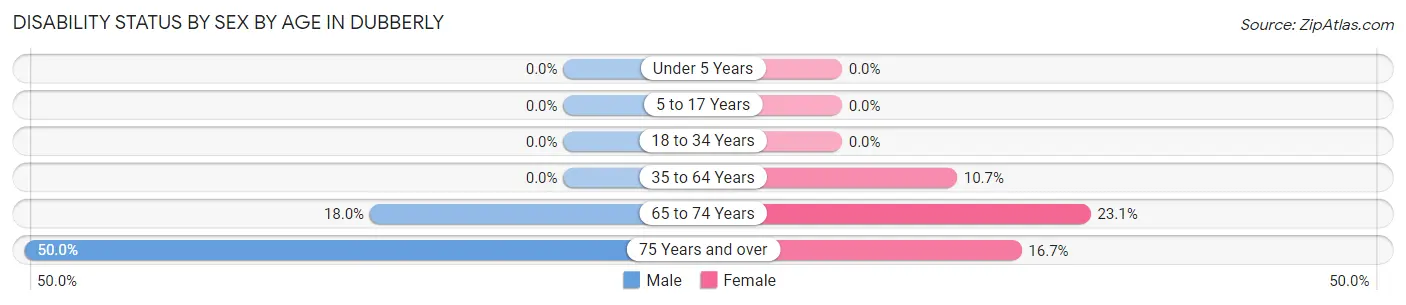
| Age Bracket | Male | Female |
| Under 5 Years | 0 (0.0%) | 0 (0.0%) |
| 5 to 17 Years | 0 (0.0%) | 0 (0.0%) |
| 18 to 34 Years | 0 (0.0%) | 0 (0.0%) |
| 35 to 64 Years | 0 (0.0%) | 8 (10.7%) |
| 65 to 74 Years | 7 (17.9%) | 6 (23.1%) |
| 75 Years and over | 2 (50.0%) | 2 (16.7%) |
Disability Class by Sex by Age in Dubberly
Disability Class: Hearing Difficulty
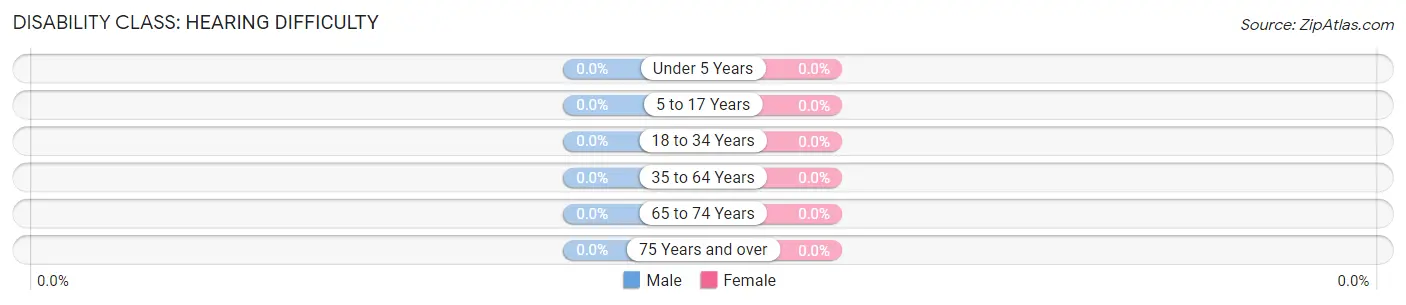
| Age Bracket | Male | Female |
| Under 5 Years | 0 (0.0%) | 0 (0.0%) |
| 5 to 17 Years | 0 (0.0%) | 0 (0.0%) |
| 18 to 34 Years | 0 (0.0%) | 0 (0.0%) |
| 35 to 64 Years | 0 (0.0%) | 0 (0.0%) |
| 65 to 74 Years | 0 (0.0%) | 0 (0.0%) |
| 75 Years and over | 0 (0.0%) | 0 (0.0%) |
Disability Class: Vision Difficulty
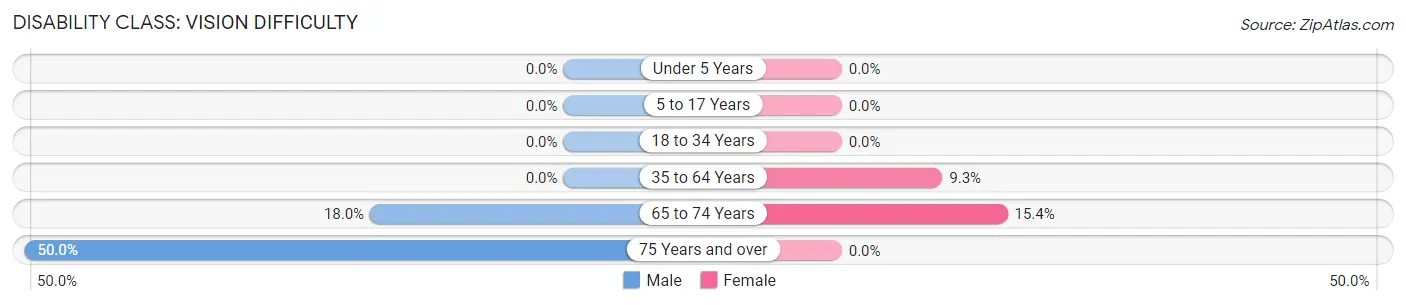
| Age Bracket | Male | Female |
| Under 5 Years | 0 (0.0%) | 0 (0.0%) |
| 5 to 17 Years | 0 (0.0%) | 0 (0.0%) |
| 18 to 34 Years | 0 (0.0%) | 0 (0.0%) |
| 35 to 64 Years | 0 (0.0%) | 7 (9.3%) |
| 65 to 74 Years | 7 (17.9%) | 4 (15.4%) |
| 75 Years and over | 2 (50.0%) | 0 (0.0%) |
Disability Class: Cognitive Difficulty
| Age Bracket | Male | Female |
| 5 to 17 Years | 0 (0.0%) | 0 (0.0%) |
| 18 to 34 Years | 0 (0.0%) | 0 (0.0%) |
| 35 to 64 Years | 0 (0.0%) | 0 (0.0%) |
| 65 to 74 Years | 0 (0.0%) | 0 (0.0%) |
| 75 Years and over | 0 (0.0%) | 0 (0.0%) |
Disability Class: Ambulatory Difficulty
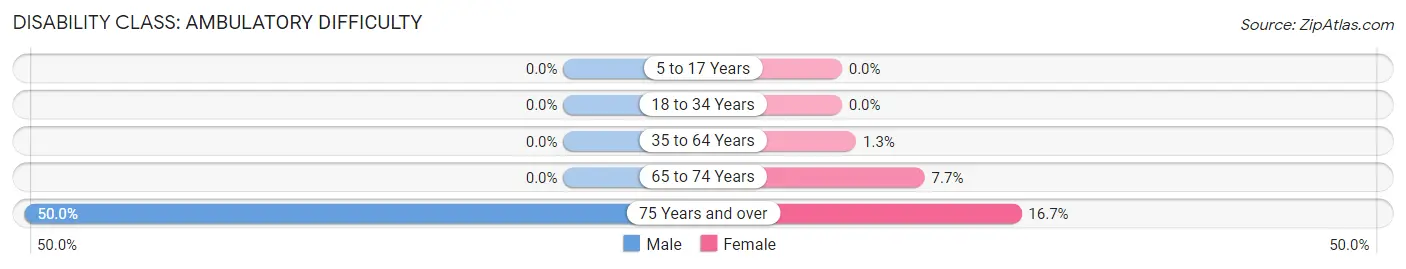
| Age Bracket | Male | Female |
| 5 to 17 Years | 0 (0.0%) | 0 (0.0%) |
| 18 to 34 Years | 0 (0.0%) | 0 (0.0%) |
| 35 to 64 Years | 0 (0.0%) | 1 (1.3%) |
| 65 to 74 Years | 0 (0.0%) | 2 (7.7%) |
| 75 Years and over | 2 (50.0%) | 2 (16.7%) |
Disability Class: Self-Care Difficulty
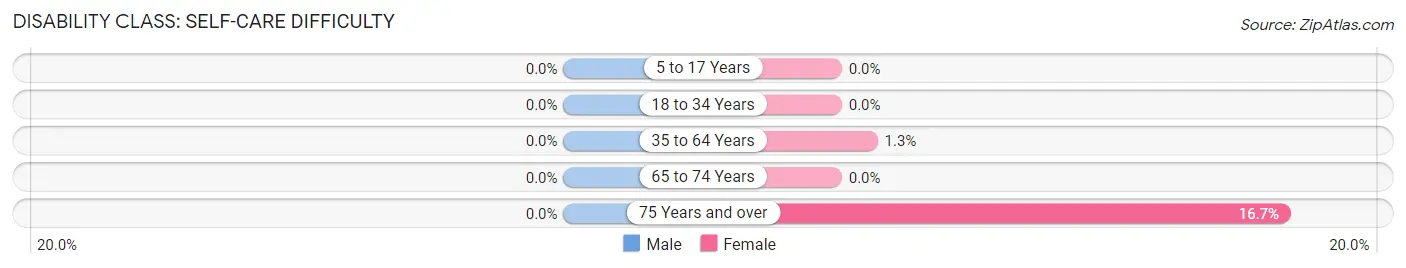
| Age Bracket | Male | Female |
| 5 to 17 Years | 0 (0.0%) | 0 (0.0%) |
| 18 to 34 Years | 0 (0.0%) | 0 (0.0%) |
| 35 to 64 Years | 0 (0.0%) | 1 (1.3%) |
| 65 to 74 Years | 0 (0.0%) | 0 (0.0%) |
| 75 Years and over | 0 (0.0%) | 2 (16.7%) |
Technology Access in Dubberly
Computing Device Access in Dubberly
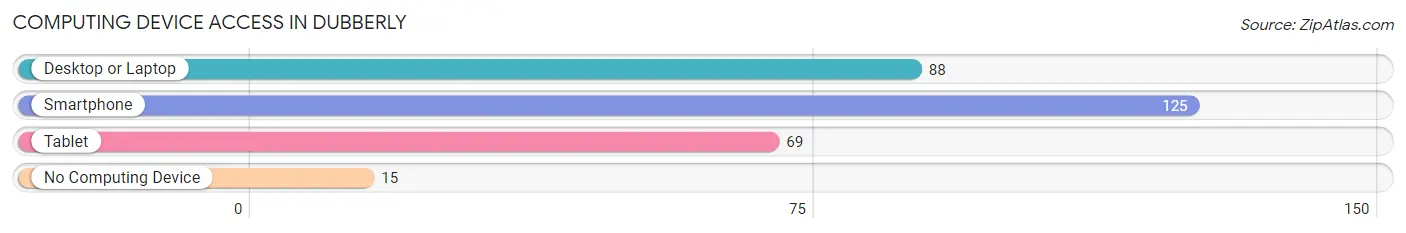
| Device Type | # Households | % Households |
| Desktop or Laptop | 88 | 62.4% |
| Smartphone | 125 | 88.6% |
| Tablet | 69 | 48.9% |
| No Computing Device | 15 | 10.6% |
| Total | 141 | 100.0% |
Internet Access in Dubberly
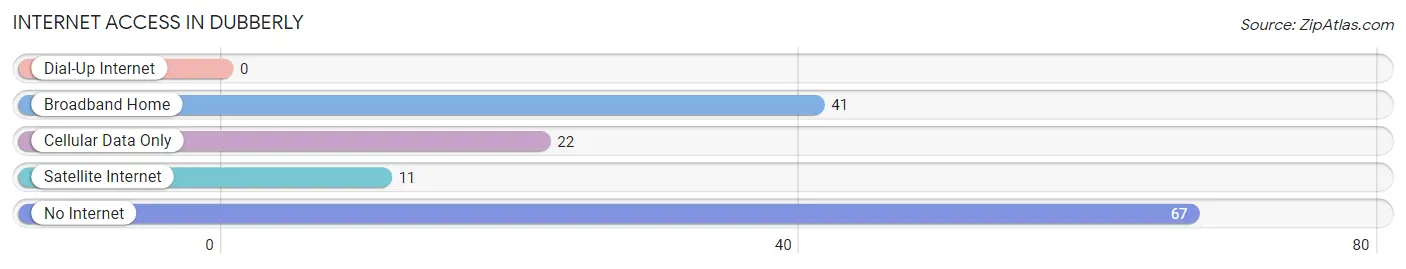
| Internet Type | # Households | % Households |
| Dial-Up Internet | 0 | 0.0% |
| Broadband Home | 41 | 29.1% |
| Cellular Data Only | 22 | 15.6% |
| Satellite Internet | 11 | 7.8% |
| No Internet | 67 | 47.5% |
| Total | 141 | 100.0% |
Dubberly Summary
DUBBERLY LOUISIANA
Dubberly is a small unincorporated community located in Webster Parish, Louisiana. It is situated on the western edge of the parish, near the border with Bossier Parish. The community is located along Louisiana Highway 531, approximately 8 miles south of Minden, the parish seat. Dubberly is part of the Minden Micropolitan Statistical Area, which includes all of Webster Parish.
History
The area that is now Dubberly was first settled in the early 19th century by a group of settlers from Georgia. The settlement was originally known as “Georgia Settlement”, and was located near the present-day intersection of Louisiana Highway 531 and Louisiana Highway 532. The settlement was later renamed “Dubberly”, after a prominent local family.
The first post office in the area was established in 1883, and the community was officially incorporated in 1884. The town was named after the Dubberly family, who were prominent landowners in the area.
Geography
Dubberly is located in western Webster Parish, near the border with Bossier Parish. The community is situated along Louisiana Highway 531, approximately 8 miles south of Minden, the parish seat. The nearest major city is Shreveport, which is located approximately 25 miles to the north.
The terrain around Dubberly is mostly flat, with some rolling hills. The area is heavily forested, with pine and hardwood trees dominating the landscape. The climate is humid subtropical, with hot, humid summers and mild winters.
Economy
The economy of Dubberly is largely based on agriculture and forestry. The area is home to several large timber companies, which harvest pine and hardwood trees for use in the lumber industry. The area is also home to several large farms, which produce a variety of crops, including cotton, soybeans, corn, and wheat.
The area is also home to several small businesses, including convenience stores, restaurants, and gas stations. The nearest major employers are located in Minden and Shreveport.
Demographics
As of the 2010 census, the population of Dubberly was 1,092. The racial makeup of the town was 94.3% White, 3.2% African American, 0.7% Native American, 0.2% Asian, and 1.6% from other races. The median household income was $37,500, and the median family income was $45,000.
The town is served by the Webster Parish School District, which operates several elementary, middle, and high schools in the area. The nearest college is Louisiana State University in Shreveport.
Conclusion
Dubberly is a small unincorporated community located in Webster Parish, Louisiana. The town is situated along Louisiana Highway 531, approximately 8 miles south of Minden, the parish seat. The economy of Dubberly is largely based on agriculture and forestry, and the area is home to several small businesses. As of the 2010 census, the population of Dubberly was 1,092. The town is served by the Webster Parish School District, which operates several elementary, middle, and high schools in the area.
Common Questions
What is Per Capita Income in Dubberly?
Per Capita income in Dubberly is $28,277.
What is the Median Family Income in Dubberly?
Median Family Income in Dubberly is $72,917.
What is the Median Household income in Dubberly?
Median Household Income in Dubberly is $39,464.
What is Inequality or Gini Index in Dubberly?
Inequality or Gini Index in Dubberly is 0.46.
What is the Total Population of Dubberly?
Total Population of Dubberly is 390.
What is the Total Male Population of Dubberly?
Total Male Population of Dubberly is 203.
What is the Total Female Population of Dubberly?
Total Female Population of Dubberly is 187.
What is the Ratio of Males per 100 Females in Dubberly?
There are 108.56 Males per 100 Females in Dubberly.
What is the Ratio of Females per 100 Males in Dubberly?
There are 92.12 Females per 100 Males in Dubberly.
What is the Median Population Age in Dubberly?
Median Population Age in Dubberly is 37.0 Years.
What is the Average Family Size in Dubberly
Average Family Size in Dubberly is 3.4 People.
What is the Average Household Size in Dubberly
Average Household Size in Dubberly is 2.8 People.
How Large is the Labor Force in Dubberly?
There are 173 People in the Labor Forcein in Dubberly.
What is the Percentage of People in the Labor Force in Dubberly?
56.9% of People are in the Labor Force in Dubberly.
What is the Unemployment Rate in Dubberly?
Unemployment Rate in Dubberly is 1.2%.