Dry Prong, LA Map & Demographics
Dry Prong Map
Dry Prong Overview
$33,754
PER CAPITA INCOME
$86,875
AVG FAMILY INCOME
$65,781
AVG HOUSEHOLD INCOME
44.5%
WAGE / INCOME GAP [ % ]
55.5¢/ $1
WAGE / INCOME GAP [ $ ]
0.42
INEQUALITY / GINI INDEX
428
TOTAL POPULATION
209
MALE POPULATION
219
FEMALE POPULATION
95.43
MALES / 100 FEMALES
104.78
FEMALES / 100 MALES
49.0
MEDIAN AGE
3.5
AVG FAMILY SIZE
2.7
AVG HOUSEHOLD SIZE
218
LABOR FORCE [ PEOPLE ]
57.8%
PERCENT IN LABOR FORCE
Dry Prong Zip Codes
Dry Prong Area Codes
Income in Dry Prong
Income Overview in Dry Prong
Per Capita Income in Dry Prong is $33,754, while median incomes of families and households are $86,875 and $65,781 respectively.
| Characteristic | Number | Measure |
| Per Capita Income | 428 | $33,754 |
| Median Family Income | 104 | $86,875 |
| Mean Family Income | 104 | $98,908 |
| Median Household Income | 158 | $65,781 |
| Mean Household Income | 158 | $81,654 |
| Income Deficit | 104 | $0 |
| Wage / Income Gap (%) | 428 | 44.52% |
| Wage / Income Gap ($) | 428 | 55.48¢ per $1 |
| Gini / Inequality Index | 428 | 0.42 |
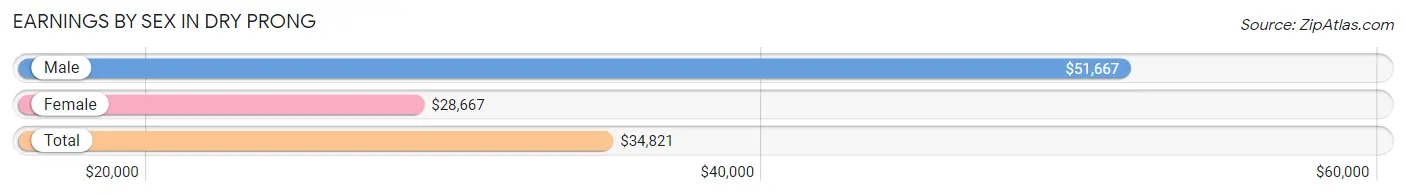
Earnings by Sex in Dry Prong
Average Earnings in Dry Prong are $34,821, $51,667 for men and $28,667 for women, a difference of 44.5%.
| Sex | Number | Average Earnings |
| Male | 112 (49.6%) | $51,667 |
| Female | 114 (50.4%) | $28,667 |
| Total | 226 (100.0%) | $34,821 |
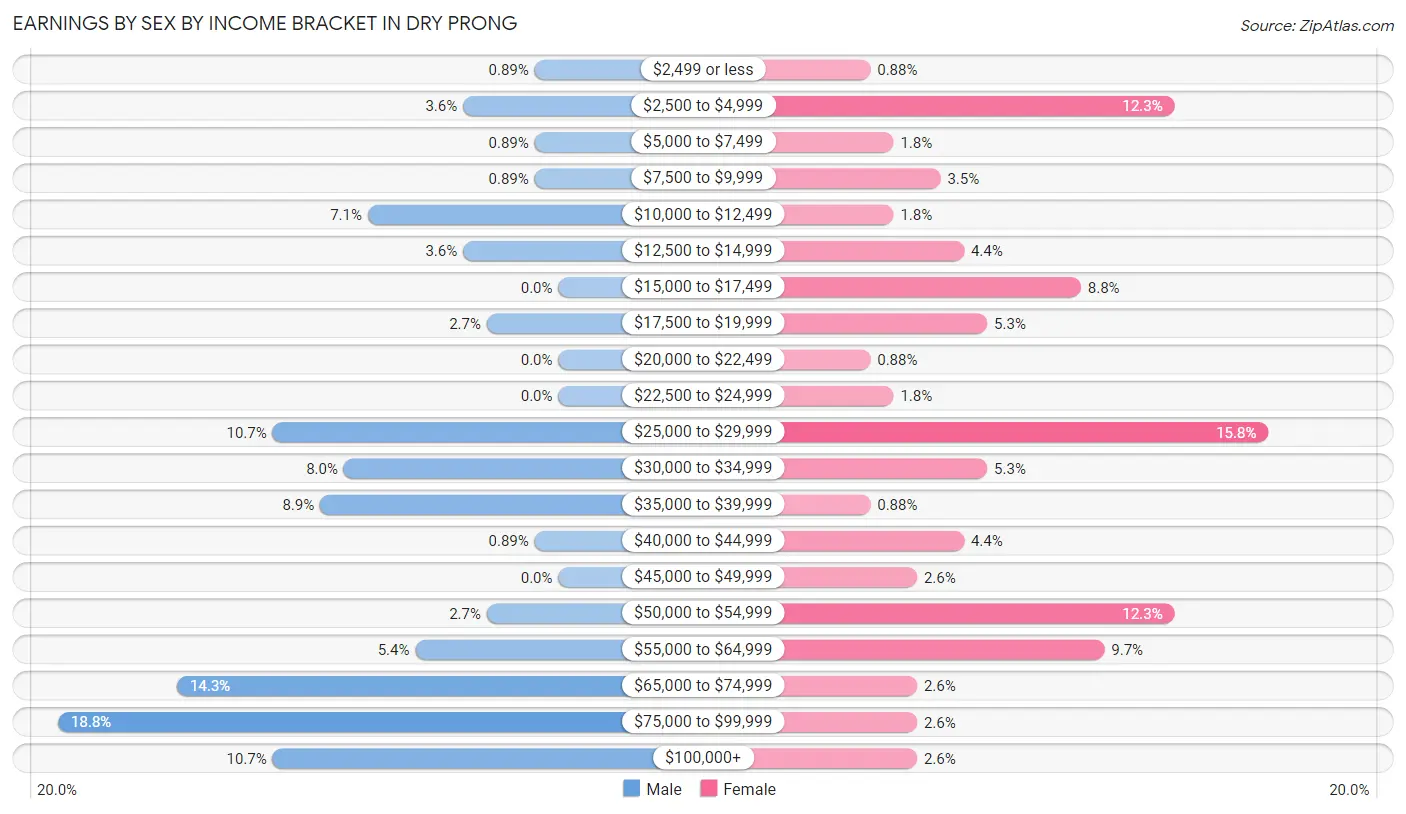
Earnings by Sex by Income Bracket in Dry Prong
The most common earnings brackets in Dry Prong are $75,000 to $99,999 for men (21 | 18.8%) and $25,000 to $29,999 for women (18 | 15.8%).
| Income | Male | Female |
| $2,499 or less | 1 (0.9%) | 1 (0.9%) |
| $2,500 to $4,999 | 4 (3.6%) | 14 (12.3%) |
| $5,000 to $7,499 | 1 (0.9%) | 2 (1.8%) |
| $7,500 to $9,999 | 1 (0.9%) | 4 (3.5%) |
| $10,000 to $12,499 | 8 (7.1%) | 2 (1.8%) |
| $12,500 to $14,999 | 4 (3.6%) | 5 (4.4%) |
| $15,000 to $17,499 | 0 (0.0%) | 10 (8.8%) |
| $17,500 to $19,999 | 3 (2.7%) | 6 (5.3%) |
| $20,000 to $22,499 | 0 (0.0%) | 1 (0.9%) |
| $22,500 to $24,999 | 0 (0.0%) | 2 (1.8%) |
| $25,000 to $29,999 | 12 (10.7%) | 18 (15.8%) |
| $30,000 to $34,999 | 9 (8.0%) | 6 (5.3%) |
| $35,000 to $39,999 | 10 (8.9%) | 1 (0.9%) |
| $40,000 to $44,999 | 1 (0.9%) | 5 (4.4%) |
| $45,000 to $49,999 | 0 (0.0%) | 3 (2.6%) |
| $50,000 to $54,999 | 3 (2.7%) | 14 (12.3%) |
| $55,000 to $64,999 | 6 (5.4%) | 11 (9.7%) |
| $65,000 to $74,999 | 16 (14.3%) | 3 (2.6%) |
| $75,000 to $99,999 | 21 (18.8%) | 3 (2.6%) |
| $100,000+ | 12 (10.7%) | 3 (2.6%) |
| Total | 112 (100.0%) | 114 (100.0%) |
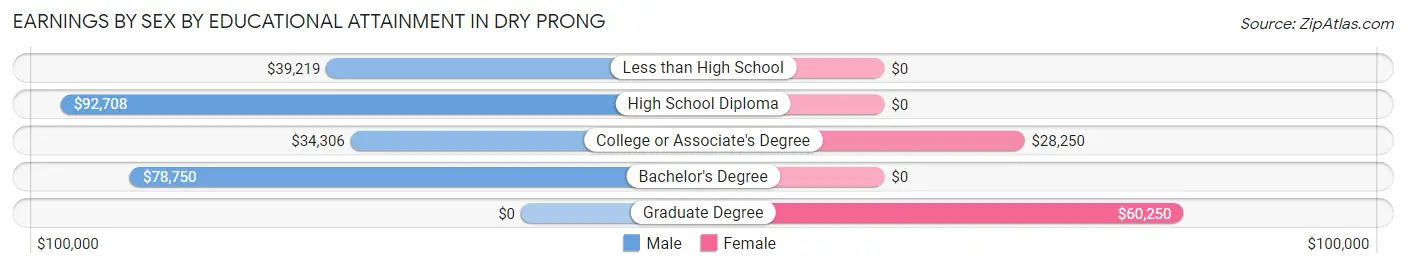
Earnings by Sex by Educational Attainment in Dry Prong
Average earnings in Dry Prong are $63,125 for men and $29,500 for women, a difference of 53.3%. Men with an educational attainment of high school diploma enjoy the highest average annual earnings of $92,708, while those with college or associate's degree education earn the least with $34,306. Women with an educational attainment of graduate degree earn the most with the average annual earnings of $60,250, while those with college or associate's degree education have the smallest earnings of $28,250.
| Educational Attainment | Male Income | Female Income |
| Less than High School | $39,219 | $0 |
| High School Diploma | $92,708 | $0 |
| College or Associate's Degree | $34,306 | $28,250 |
| Bachelor's Degree | $78,750 | $0 |
| Graduate Degree | - | - |
| Total | $63,125 | $29,500 |
Family Income in Dry Prong
Family Income Brackets in Dry Prong
According to the Dry Prong family income data, there are 25 families falling into the $100,000 to $149,999 income range, which is the most common income bracket and makes up 24.0% of all families. Conversely, the $10,000 to $14,999 income bracket is the least frequent group with only 1 families (1.0%) belonging to this category.
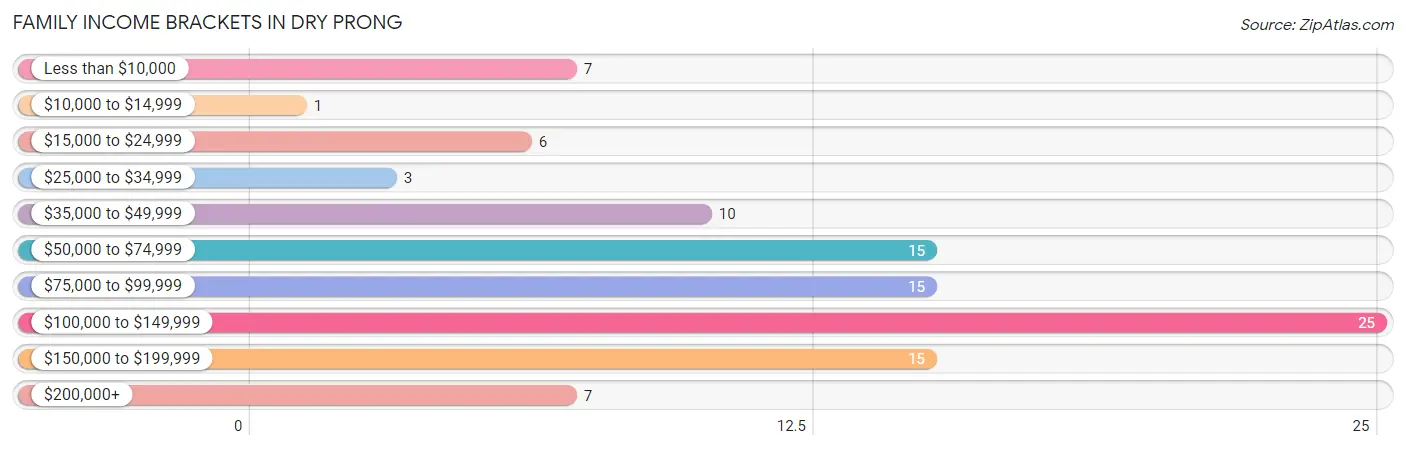
| Income Bracket | # Families | % Families |
| Less than $10,000 | 7 | 6.7% |
| $10,000 to $14,999 | 1 | 1.0% |
| $15,000 to $24,999 | 6 | 5.8% |
| $25,000 to $34,999 | 3 | 2.9% |
| $35,000 to $49,999 | 10 | 9.6% |
| $50,000 to $74,999 | 15 | 14.4% |
| $75,000 to $99,999 | 15 | 14.4% |
| $100,000 to $149,999 | 25 | 24.0% |
| $150,000 to $199,999 | 15 | 14.4% |
| $200,000+ | 7 | 6.7% |
Family Income by Famaliy Size in Dry Prong
3-person families (19 | 18.3%) account for the highest median family income in Dry Prong with $149,375 per family, while 3-person families (19 | 18.3%) have the highest median income of $49,792 per family member.
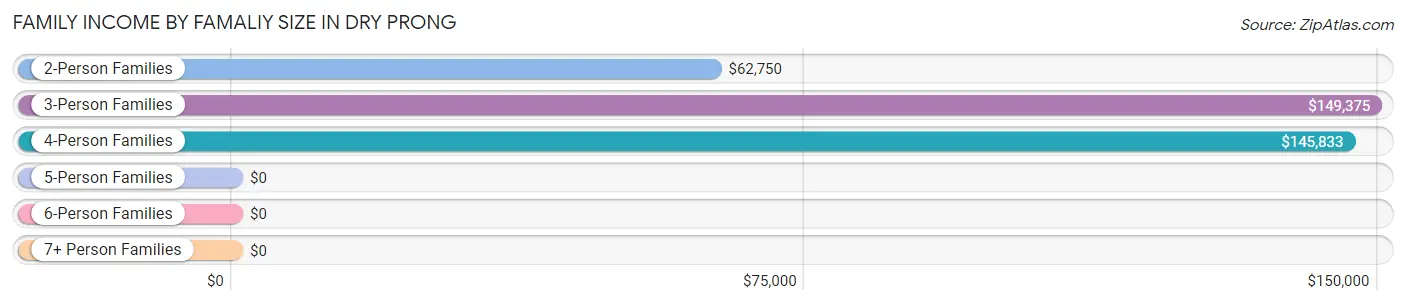
| Income Bracket | # Families | Median Income |
| 2-Person Families | 63 (60.6%) | $62,750 |
| 3-Person Families | 19 (18.3%) | $149,375 |
| 4-Person Families | 14 (13.5%) | $145,833 |
| 5-Person Families | 4 (3.8%) | $0 |
| 6-Person Families | 2 (1.9%) | $0 |
| 7+ Person Families | 2 (1.9%) | $0 |
| Total | 104 (100.0%) | $86,875 |
Family Income by Number of Earners in Dry Prong
The median family income in Dry Prong is $86,875, with families comprising 3+ earners (15) having the highest median family income of $173,750, while families with no earners (28) have the lowest median family income of $33,750, accounting for 14.4% and 26.9% of families, respectively.
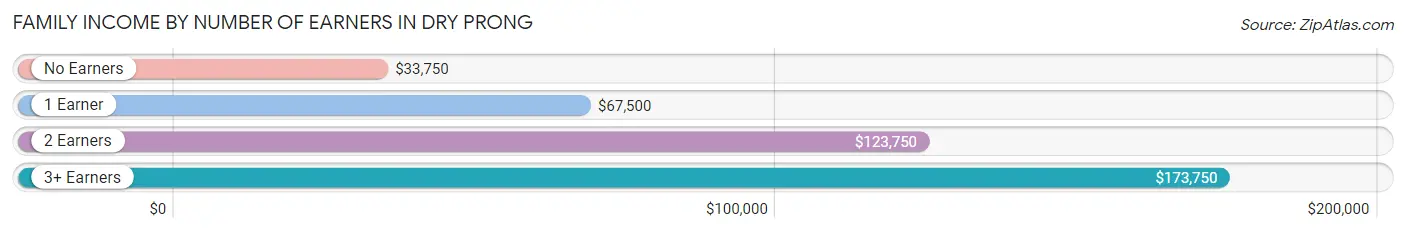
| Number of Earners | # Families | Median Income |
| No Earners | 28 (26.9%) | $33,750 |
| 1 Earner | 20 (19.2%) | $67,500 |
| 2 Earners | 41 (39.4%) | $123,750 |
| 3+ Earners | 15 (14.4%) | $173,750 |
| Total | 104 (100.0%) | $86,875 |
Household Income in Dry Prong
Household Income Brackets in Dry Prong
With 37 households falling in the category, the $50,000 to $74,999 income range is the most frequent in Dry Prong, accounting for 23.4% of all households. In contrast, only 5 households (3.2%) fall into the $25,000 to $34,999 income bracket, making it the least populous group.
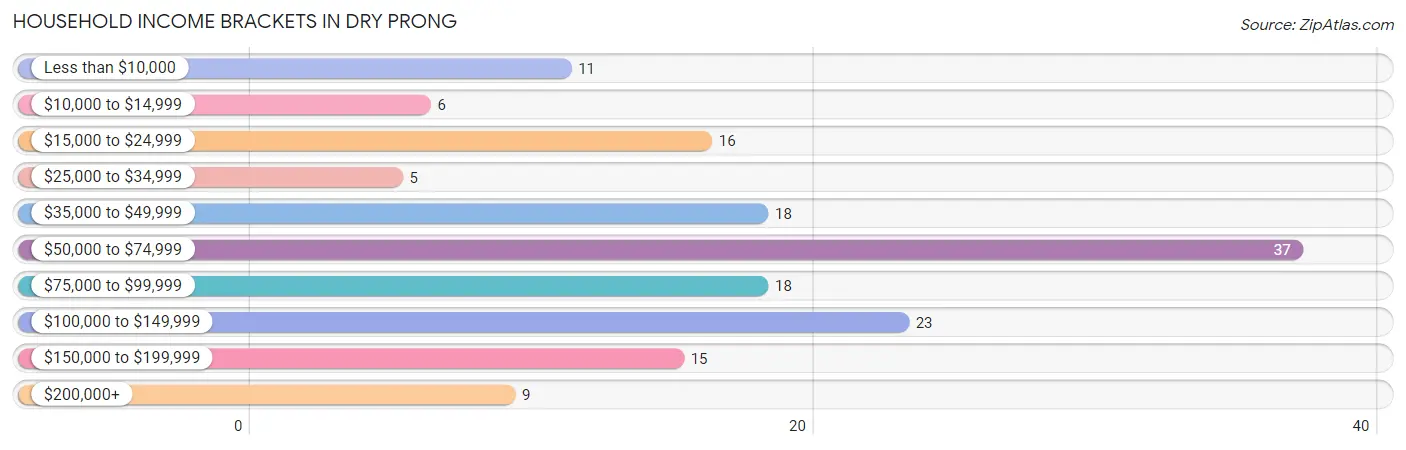
| Income Bracket | # Households | % Households |
| Less than $10,000 | 11 | 7.0% |
| $10,000 to $14,999 | 6 | 3.8% |
| $15,000 to $24,999 | 16 | 10.1% |
| $25,000 to $34,999 | 5 | 3.2% |
| $35,000 to $49,999 | 18 | 11.4% |
| $50,000 to $74,999 | 37 | 23.4% |
| $75,000 to $99,999 | 18 | 11.4% |
| $100,000 to $149,999 | 23 | 14.6% |
| $150,000 to $199,999 | 15 | 9.5% |
| $200,000+ | 9 | 5.7% |
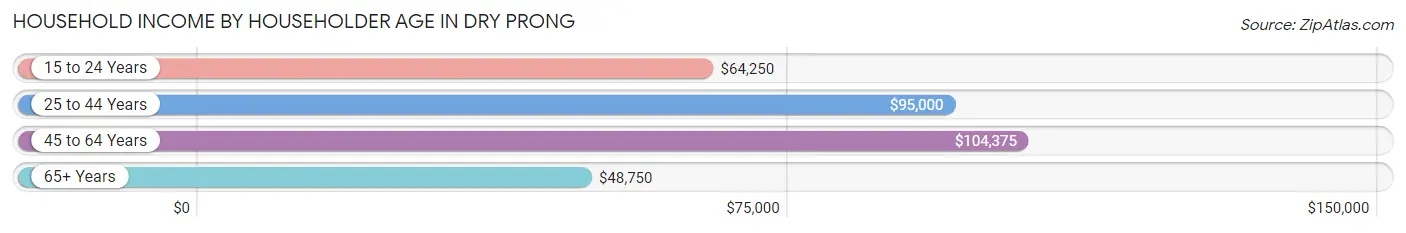
Household Income by Householder Age in Dry Prong
The median household income in Dry Prong is $65,781, with the highest median household income of $104,375 found in the 45 to 64 years age bracket for the primary householder. A total of 61 households (38.6%) fall into this category. Meanwhile, the 65+ years age bracket for the primary householder has the lowest median household income of $48,750, with 68 households (43.0%) in this group.
| Income Bracket | # Households | Median Income |
| 15 to 24 Years | 9 (5.7%) | $64,250 |
| 25 to 44 Years | 20 (12.7%) | $95,000 |
| 45 to 64 Years | 61 (38.6%) | $104,375 |
| 65+ Years | 68 (43.0%) | $48,750 |
| Total | 158 (100.0%) | $65,781 |
Poverty in Dry Prong
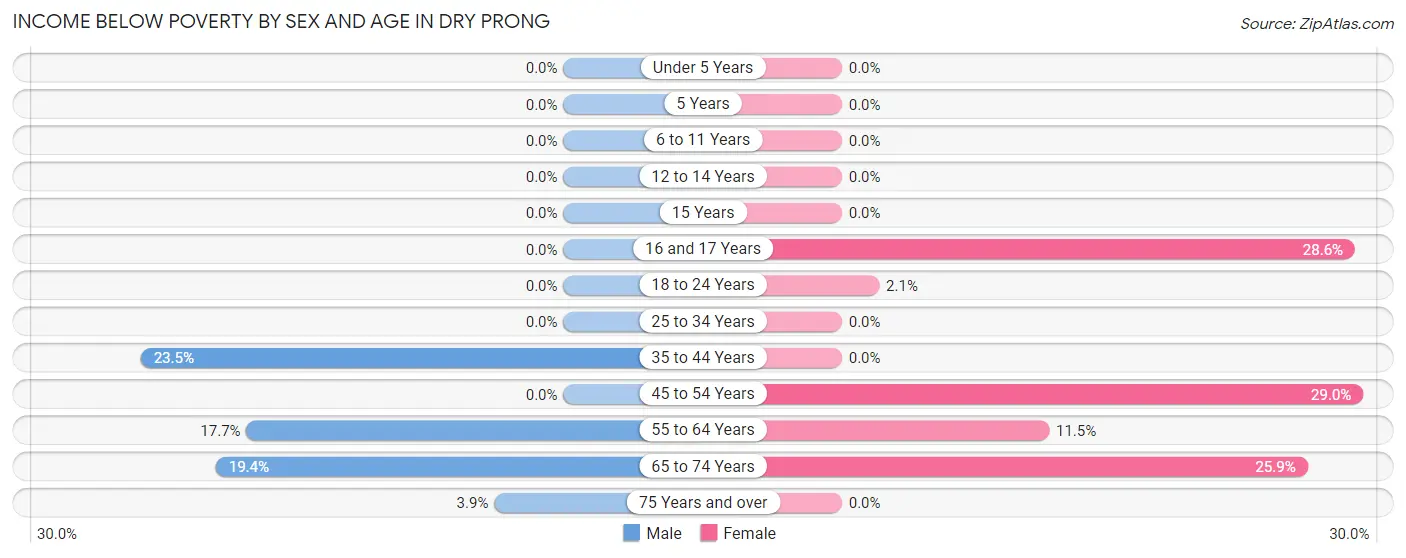
Income Below Poverty by Sex and Age in Dry Prong
With 8.1% poverty level for males and 10.1% for females among the residents of Dry Prong, 35 to 44 year old males and 45 to 54 year old females are the most vulnerable to poverty, with 4 males (23.5%) and 9 females (29.0%) in their respective age groups living below the poverty level.
| Age Bracket | Male | Female |
| Under 5 Years | 0 (0.0%) | 0 (0.0%) |
| 5 Years | 0 (0.0%) | 0 (0.0%) |
| 6 to 11 Years | 0 (0.0%) | 0 (0.0%) |
| 12 to 14 Years | 0 (0.0%) | 0 (0.0%) |
| 15 Years | 0 (0.0%) | 0 (0.0%) |
| 16 and 17 Years | 0 (0.0%) | 2 (28.6%) |
| 18 to 24 Years | 0 (0.0%) | 1 (2.1%) |
| 25 to 34 Years | 0 (0.0%) | 0 (0.0%) |
| 35 to 44 Years | 4 (23.5%) | 0 (0.0%) |
| 45 to 54 Years | 0 (0.0%) | 9 (29.0%) |
| 55 to 64 Years | 6 (17.6%) | 3 (11.5%) |
| 65 to 74 Years | 6 (19.4%) | 7 (25.9%) |
| 75 Years and over | 1 (3.8%) | 0 (0.0%) |
| Total | 17 (8.1%) | 22 (10.1%) |
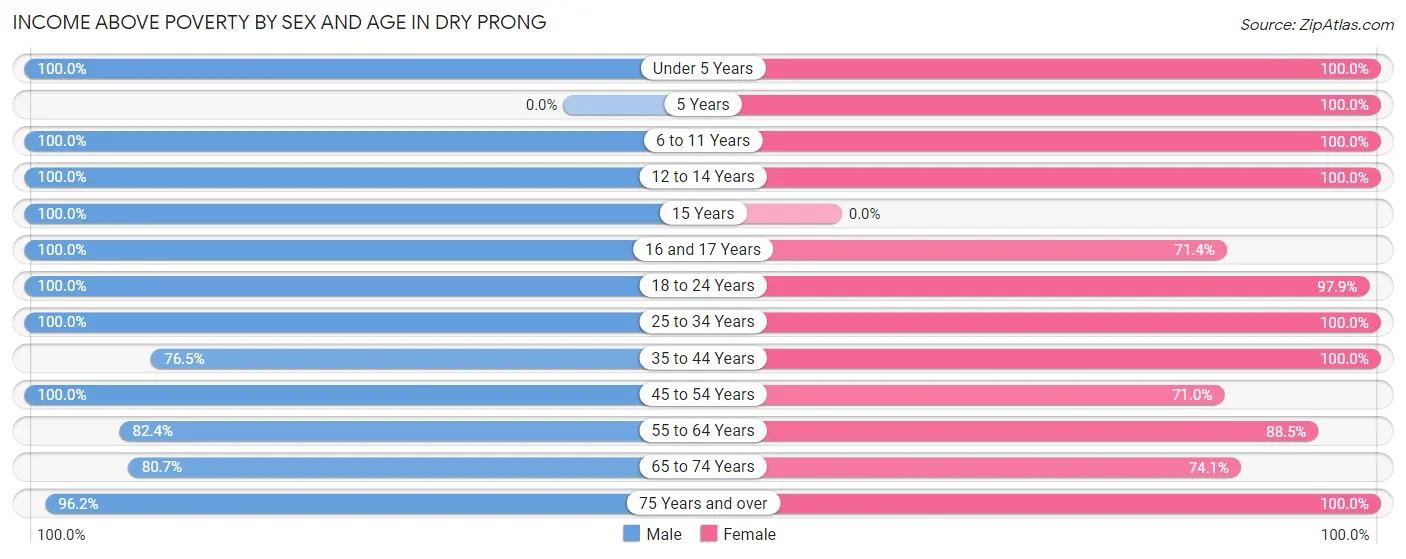
Income Above Poverty by Sex and Age in Dry Prong
According to the poverty statistics in Dry Prong, males aged under 5 years and females aged under 5 years are the age groups that are most secure financially, with 100.0% of males and 100.0% of females in these age groups living above the poverty line.
| Age Bracket | Male | Female |
| Under 5 Years | 4 (100.0%) | 6 (100.0%) |
| 5 Years | 0 (0.0%) | 1 (100.0%) |
| 6 to 11 Years | 10 (100.0%) | 14 (100.0%) |
| 12 to 14 Years | 1 (100.0%) | 9 (100.0%) |
| 15 Years | 6 (100.0%) | 0 (0.0%) |
| 16 and 17 Years | 2 (100.0%) | 5 (71.4%) |
| 18 to 24 Years | 17 (100.0%) | 47 (97.9%) |
| 25 to 34 Years | 16 (100.0%) | 14 (100.0%) |
| 35 to 44 Years | 13 (76.5%) | 18 (100.0%) |
| 45 to 54 Years | 45 (100.0%) | 22 (71.0%) |
| 55 to 64 Years | 28 (82.4%) | 23 (88.5%) |
| 65 to 74 Years | 25 (80.6%) | 20 (74.1%) |
| 75 Years and over | 25 (96.2%) | 18 (100.0%) |
| Total | 192 (91.9%) | 197 (89.9%) |
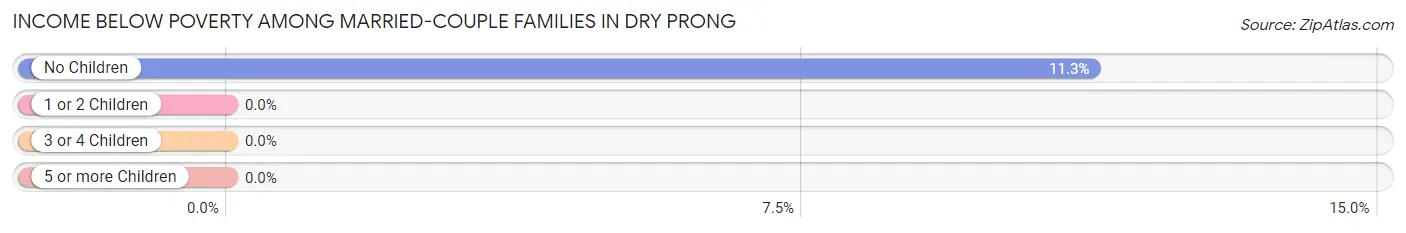
Income Below Poverty Among Married-Couple Families in Dry Prong
The poverty statistics for married-couple families in Dry Prong show that 8.8% or 8 of the total 91 families live below the poverty line. Families with no children have the highest poverty rate of 11.3%, comprising of 8 families. On the other hand, families with 1 or 2 children have the lowest poverty rate of 0.0%, which includes 0 families.
| Children | Above Poverty | Below Poverty |
| No Children | 63 (88.7%) | 8 (11.3%) |
| 1 or 2 Children | 17 (100.0%) | 0 (0.0%) |
| 3 or 4 Children | 3 (100.0%) | 0 (0.0%) |
| 5 or more Children | 0 (0.0%) | 0 (0.0%) |
| Total | 83 (91.2%) | 8 (8.8%) |
Income Below Poverty Among Single-Parent Households in Dry Prong
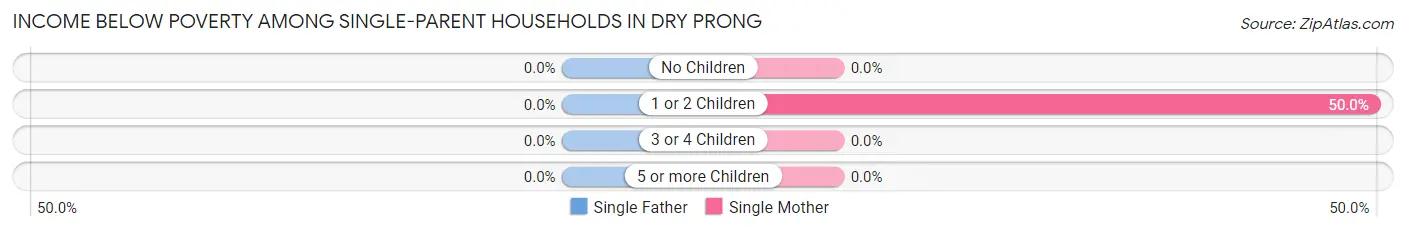
| Children | Single Father | Single Mother |
| No Children | 0 (0.0%) | 0 (0.0%) |
| 1 or 2 Children | 0 (0.0%) | 1 (50.0%) |
| 3 or 4 Children | 0 (0.0%) | 0 (0.0%) |
| 5 or more Children | 0 (0.0%) | 0 (0.0%) |
| Total | 0 (0.0%) | 1 (11.1%) |
Income Below Poverty Among Married-Couple vs Single-Parent Households in Dry Prong
The poverty data for Dry Prong shows that 8 of the married-couple family households (8.8%) and 1 of the single-parent households (7.7%) are living below the poverty level. Within the married-couple family households, those with no children have the highest poverty rate, with 8 households (11.3%) falling below the poverty line. Among the single-parent households, those with 1 or 2 children have the highest poverty rate, with 1 household (50.0%) living below poverty.
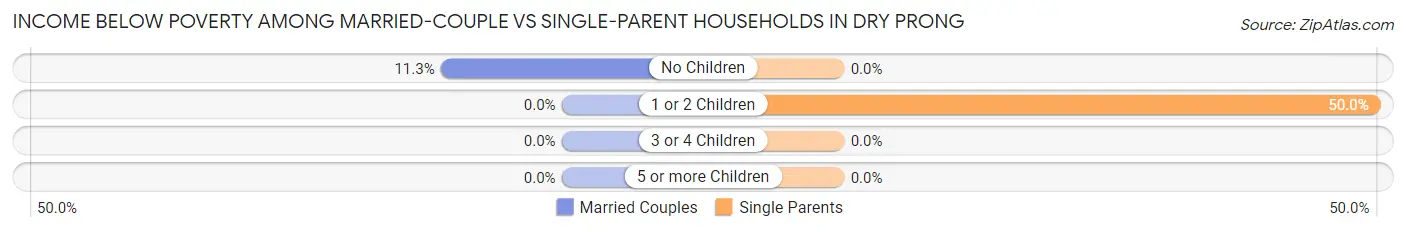
| Children | Married-Couple Families | Single-Parent Households |
| No Children | 8 (11.3%) | 0 (0.0%) |
| 1 or 2 Children | 0 (0.0%) | 1 (50.0%) |
| 3 or 4 Children | 0 (0.0%) | 0 (0.0%) |
| 5 or more Children | 0 (0.0%) | 0 (0.0%) |
| Total | 8 (8.8%) | 1 (7.7%) |
Race in Dry Prong
The most populous races in Dry Prong are White / Caucasian (382 | 89.2%), Two or more Races (26 | 6.1%), and Hispanic or Latino (19 | 4.4%).
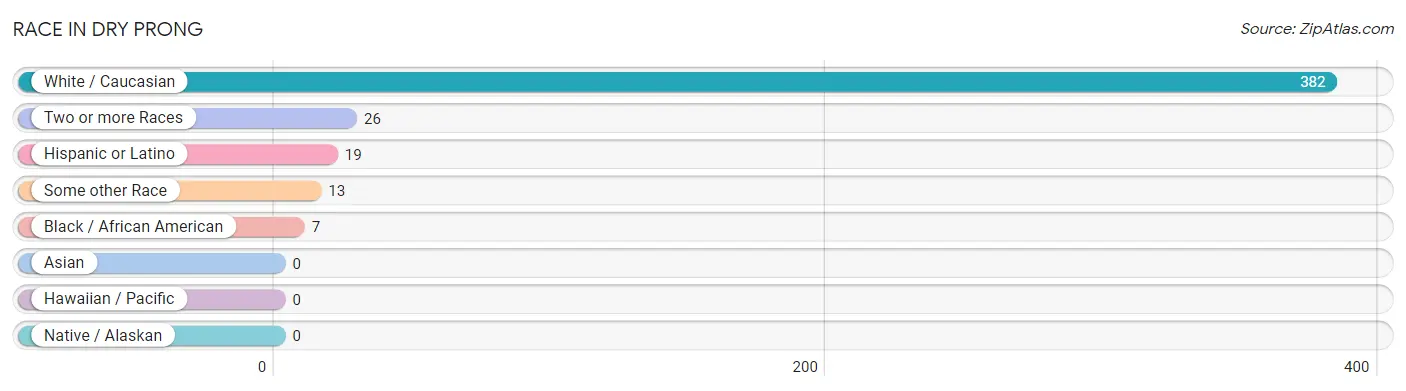
| Race | # Population | % Population |
| Asian | 0 | 0.0% |
| Black / African American | 7 | 1.6% |
| Hawaiian / Pacific | 0 | 0.0% |
| Hispanic or Latino | 19 | 4.4% |
| Native / Alaskan | 0 | 0.0% |
| White / Caucasian | 382 | 89.2% |
| Two or more Races | 26 | 6.1% |
| Some other Race | 13 | 3.0% |
| Total | 428 | 100.0% |
Ancestry in Dry Prong
The most populous ancestries reported in Dry Prong are Irish (51 | 11.9%), English (47 | 11.0%), French (33 | 7.7%), American (32 | 7.5%), and German (9 | 2.1%), together accounting for 40.2% of all Dry Prong residents.
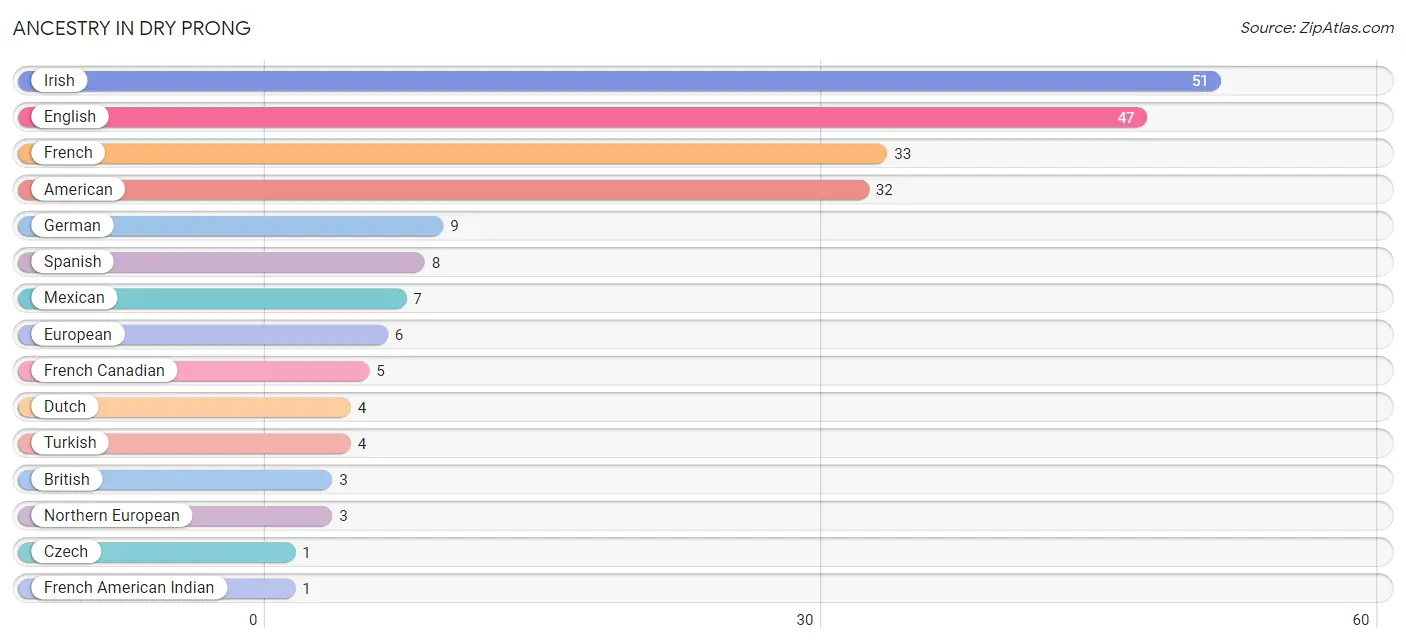
| Ancestry | # Population | % Population |
| American | 32 | 7.5% |
| British | 3 | 0.7% |
| Czech | 1 | 0.2% |
| Dutch | 4 | 0.9% |
| English | 47 | 11.0% |
| European | 6 | 1.4% |
| French | 33 | 7.7% |
| French American Indian | 1 | 0.2% |
| French Canadian | 5 | 1.2% |
| German | 9 | 2.1% |
| Irish | 51 | 11.9% |
| Italian | 1 | 0.2% |
| Mexican | 7 | 1.6% |
| Northern European | 3 | 0.7% |
| Portuguese | 1 | 0.2% |
| Spaniard | 1 | 0.2% |
| Spanish | 8 | 1.9% |
| Turkish | 4 | 0.9% | View All 18 Rows |
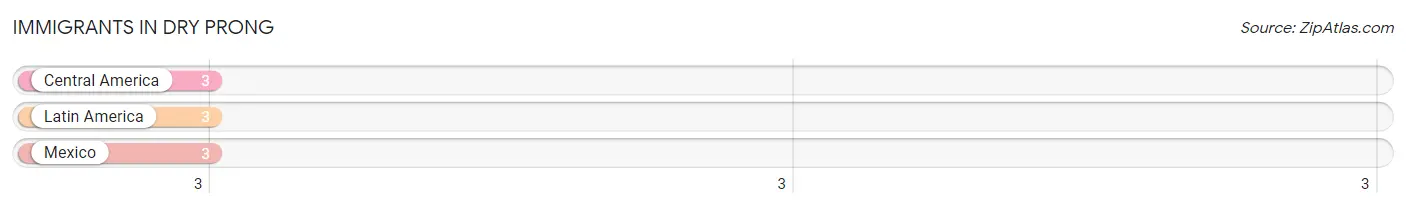
Immigrants in Dry Prong
The most numerous immigrant groups reported in Dry Prong came from Central America (3 | 0.7%), Latin America (3 | 0.7%), and Mexico (3 | 0.7%), together accounting for 2.1% of all Dry Prong residents.
| Immigration Origin | # Population | % Population |
| Central America | 3 | 0.7% |
| Latin America | 3 | 0.7% |
| Mexico | 3 | 0.7% | View All 3 Rows |
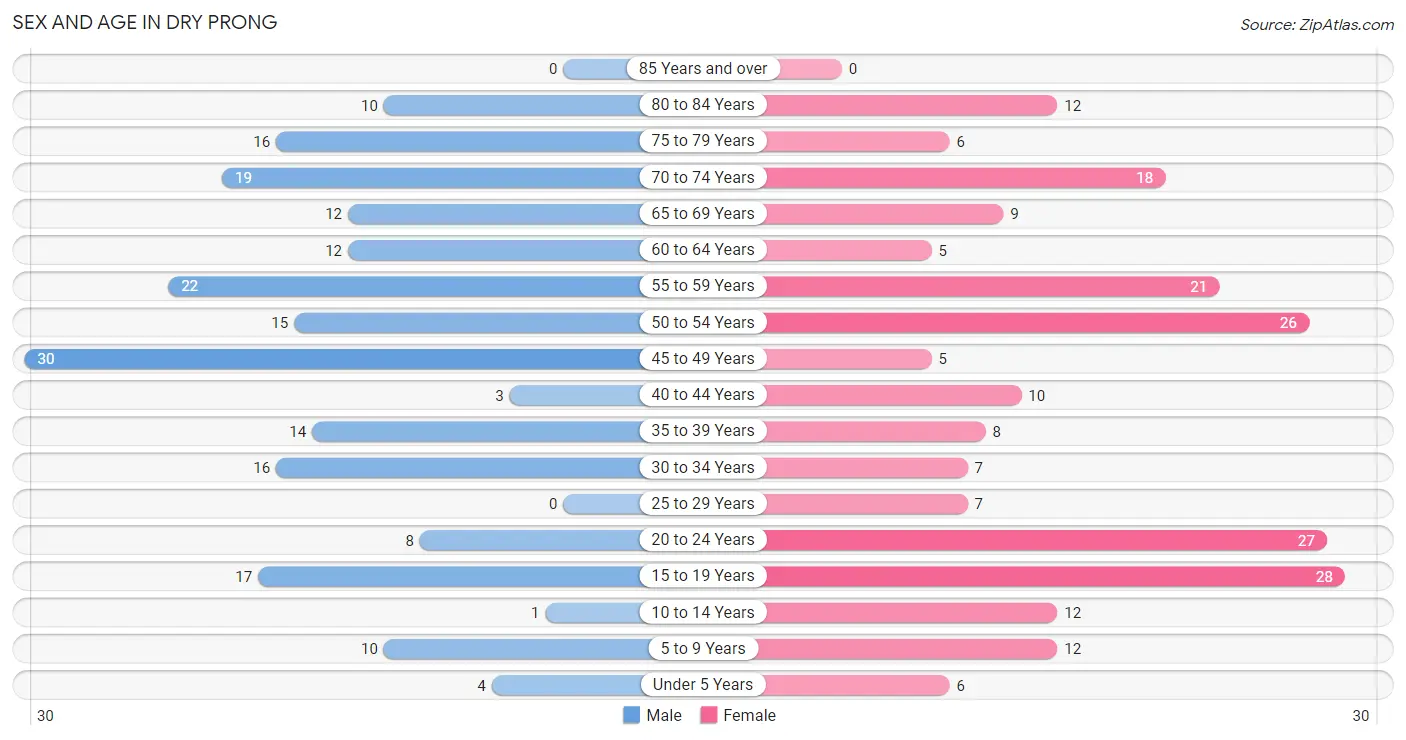
Sex and Age in Dry Prong
Sex and Age in Dry Prong
The most populous age groups in Dry Prong are 45 to 49 Years (30 | 14.3%) for men and 15 to 19 Years (28 | 12.8%) for women.
| Age Bracket | Male | Female |
| Under 5 Years | 4 (1.9%) | 6 (2.7%) |
| 5 to 9 Years | 10 (4.8%) | 12 (5.5%) |
| 10 to 14 Years | 1 (0.5%) | 12 (5.5%) |
| 15 to 19 Years | 17 (8.1%) | 28 (12.8%) |
| 20 to 24 Years | 8 (3.8%) | 27 (12.3%) |
| 25 to 29 Years | 0 (0.0%) | 7 (3.2%) |
| 30 to 34 Years | 16 (7.7%) | 7 (3.2%) |
| 35 to 39 Years | 14 (6.7%) | 8 (3.6%) |
| 40 to 44 Years | 3 (1.4%) | 10 (4.6%) |
| 45 to 49 Years | 30 (14.3%) | 5 (2.3%) |
| 50 to 54 Years | 15 (7.2%) | 26 (11.9%) |
| 55 to 59 Years | 22 (10.5%) | 21 (9.6%) |
| 60 to 64 Years | 12 (5.7%) | 5 (2.3%) |
| 65 to 69 Years | 12 (5.7%) | 9 (4.1%) |
| 70 to 74 Years | 19 (9.1%) | 18 (8.2%) |
| 75 to 79 Years | 16 (7.7%) | 6 (2.7%) |
| 80 to 84 Years | 10 (4.8%) | 12 (5.5%) |
| 85 Years and over | 0 (0.0%) | 0 (0.0%) |
| Total | 209 (100.0%) | 219 (100.0%) |
Families and Households in Dry Prong
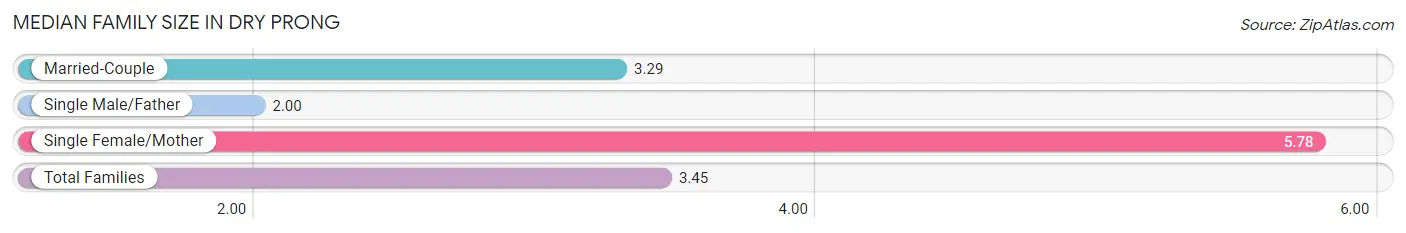
Median Family Size in Dry Prong
The median family size in Dry Prong is 3.45 persons per family, with single female/mother families (9 | 8.6%) accounting for the largest median family size of 5.78 persons per family. On the other hand, single male/father families (4 | 3.8%) represent the smallest median family size with 2.00 persons per family.
| Family Type | # Families | Family Size |
| Married-Couple | 91 (87.5%) | 3.29 |
| Single Male/Father | 4 (3.8%) | 2.00 |
| Single Female/Mother | 9 (8.6%) | 5.78 |
| Total Families | 104 (100.0%) | 3.45 |
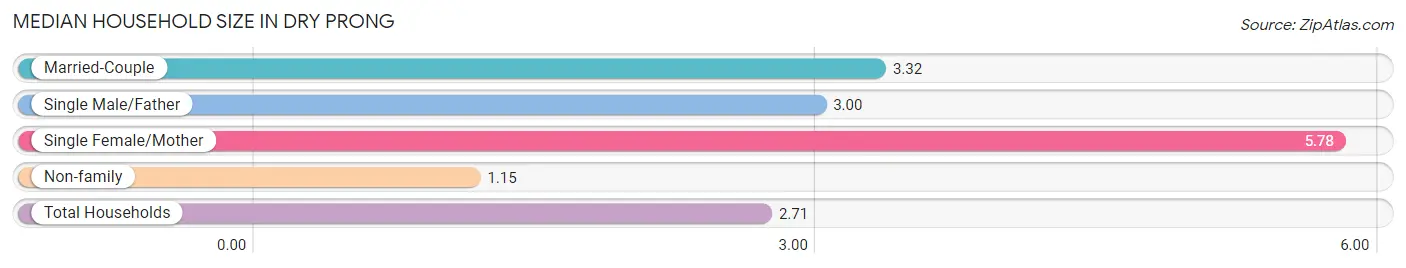
Median Household Size in Dry Prong
The median household size in Dry Prong is 2.71 persons per household, with single female/mother households (9 | 5.7%) accounting for the largest median household size of 5.78 persons per household. non-family households (54 | 34.2%) represent the smallest median household size with 1.15 persons per household.
| Household Type | # Households | Household Size |
| Married-Couple | 91 (57.6%) | 3.32 |
| Single Male/Father | 4 (2.5%) | 3.00 |
| Single Female/Mother | 9 (5.7%) | 5.78 |
| Non-family | 54 (34.2%) | 1.15 |
| Total Households | 158 (100.0%) | 2.71 |
Household Size by Marriage Status in Dry Prong
Out of a total of 158 households in Dry Prong, 104 (65.8%) are family households, while 54 (34.2%) are nonfamily households. The most numerous type of family households are 2-person households, comprising 59, and the most common type of nonfamily households are 1-person households, comprising 48.

| Household Size | Family Households | Nonfamily Households |
| 1-Person Households | - | 48 (30.4%) |
| 2-Person Households | 59 (37.3%) | 6 (3.8%) |
| 3-Person Households | 21 (13.3%) | 0 (0.0%) |
| 4-Person Households | 16 (10.1%) | 0 (0.0%) |
| 5-Person Households | 4 (2.5%) | 0 (0.0%) |
| 6-Person Households | 2 (1.3%) | 0 (0.0%) |
| 7+ Person Households | 2 (1.3%) | 0 (0.0%) |
| Total | 104 (65.8%) | 54 (34.2%) |
Female Fertility in Dry Prong
Fertility by Age in Dry Prong
| Age Bracket | Women with Births | Births / 1,000 Women |
| 15 to 19 years | 0 (0.0%) | 0.0 |
| 20 to 34 years | 0 (0.0%) | 0.0 |
| 35 to 50 years | 0 (0.0%) | 0.0 |
| Total | 0 (0.0%) | 0.0 |
Fertility by Age by Marriage Status in Dry Prong
| Age Bracket | Married | Unmarried |
| 15 to 19 years | 0 (0.0%) | 0 (0.0%) |
| 20 to 34 years | 0 (0.0%) | 0 (0.0%) |
| 35 to 50 years | 0 (0.0%) | 0 (0.0%) |
| Total | 0 (0.0%) | 0 (0.0%) |
Fertility by Education in Dry Prong
| Educational Attainment | Women with Births | Births / 1,000 Women |
| Less than High School | 0 (0.0%) | 0.0 |
| High School Diploma | 0 (0.0%) | 0.0 |
| College or Associate's Degree | 0 (0.0%) | 0.0 |
| Bachelor's Degree | 0 (0.0%) | 0.0 |
| Graduate Degree | 0 (0.0%) | 0.0 |
| Total | 0 (0.0%) | 0.0 |
Fertility by Education by Marriage Status in Dry Prong
| Educational Attainment | Married | Unmarried |
| Less than High School | 0 (0.0%) | 0 (0.0%) |
| High School Diploma | 0 (0.0%) | 0 (0.0%) |
| College or Associate's Degree | 0 (0.0%) | 0 (0.0%) |
| Bachelor's Degree | 0 (0.0%) | 0 (0.0%) |
| Graduate Degree | 0 (0.0%) | 0 (0.0%) |
| Total | 0 (0.0%) | 0 (0.0%) |
Employment Characteristics in Dry Prong
Employment by Class of Employer in Dry Prong
Among the 212 employed individuals in Dry Prong, private company employees (130 | 61.3%), local government employees (29 | 13.7%), and self-employed (not incorporated) (17 | 8.0%) make up the most common classes of employment.
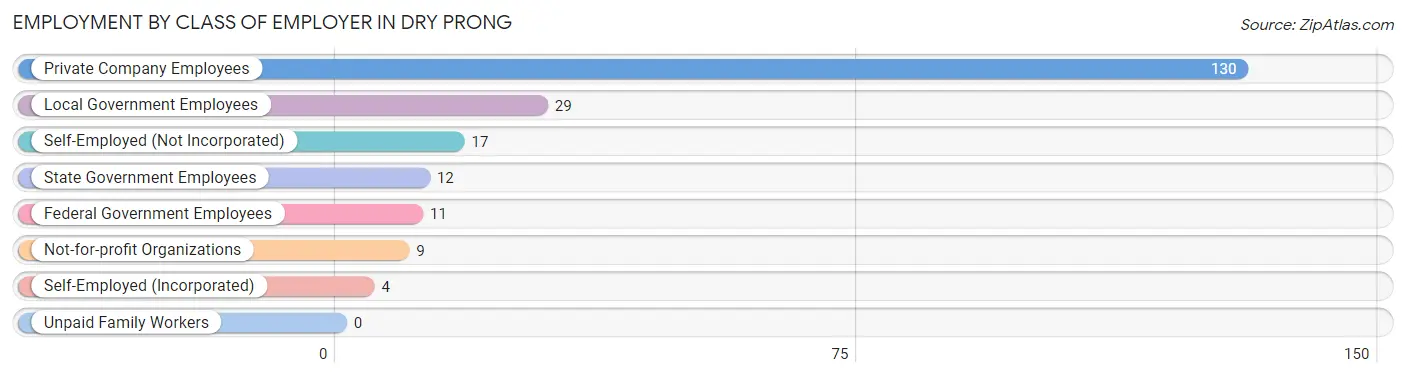
| Employer Class | # Employees | % Employees |
| Private Company Employees | 130 | 61.3% |
| Self-Employed (Incorporated) | 4 | 1.9% |
| Self-Employed (Not Incorporated) | 17 | 8.0% |
| Not-for-profit Organizations | 9 | 4.3% |
| Local Government Employees | 29 | 13.7% |
| State Government Employees | 12 | 5.7% |
| Federal Government Employees | 11 | 5.2% |
| Unpaid Family Workers | 0 | 0.0% |
| Total | 212 | 100.0% |
Employment Status by Age in Dry Prong
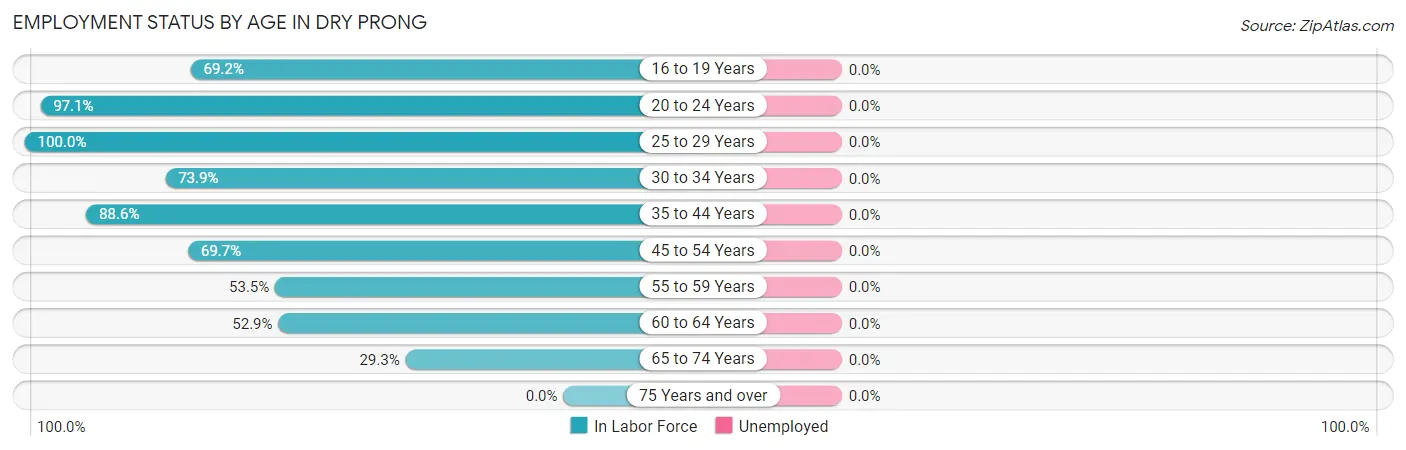
| Age Bracket | In Labor Force | Unemployed |
| 16 to 19 Years | 27 (69.2%) | 0 (0.0%) |
| 20 to 24 Years | 34 (97.1%) | 0 (0.0%) |
| 25 to 29 Years | 7 (100.0%) | 0 (0.0%) |
| 30 to 34 Years | 17 (73.9%) | 0 (0.0%) |
| 35 to 44 Years | 31 (88.6%) | 0 (0.0%) |
| 45 to 54 Years | 53 (69.7%) | 0 (0.0%) |
| 55 to 59 Years | 23 (53.5%) | 0 (0.0%) |
| 60 to 64 Years | 9 (52.9%) | 0 (0.0%) |
| 65 to 74 Years | 17 (29.3%) | 0 (0.0%) |
| 75 Years and over | 0 (0.0%) | 0 (0.0%) |
| Total | 218 (57.8%) | 0 (0.0%) |
Employment Status by Educational Attainment in Dry Prong
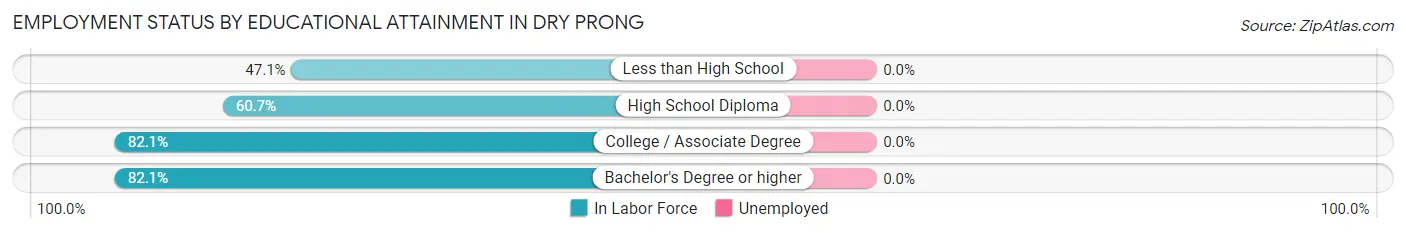
| Educational Attainment | In Labor Force | Unemployed |
| Less than High School | 16 (47.1%) | 0 (0.0%) |
| High School Diploma | 37 (60.7%) | 0 (0.0%) |
| College / Associate Degree | 55 (82.1%) | 0 (0.0%) |
| Bachelor's Degree or higher | 32 (82.1%) | 0 (0.0%) |
| Total | 140 (69.7%) | 0 (0.0%) |
Employment Occupations by Sex in Dry Prong
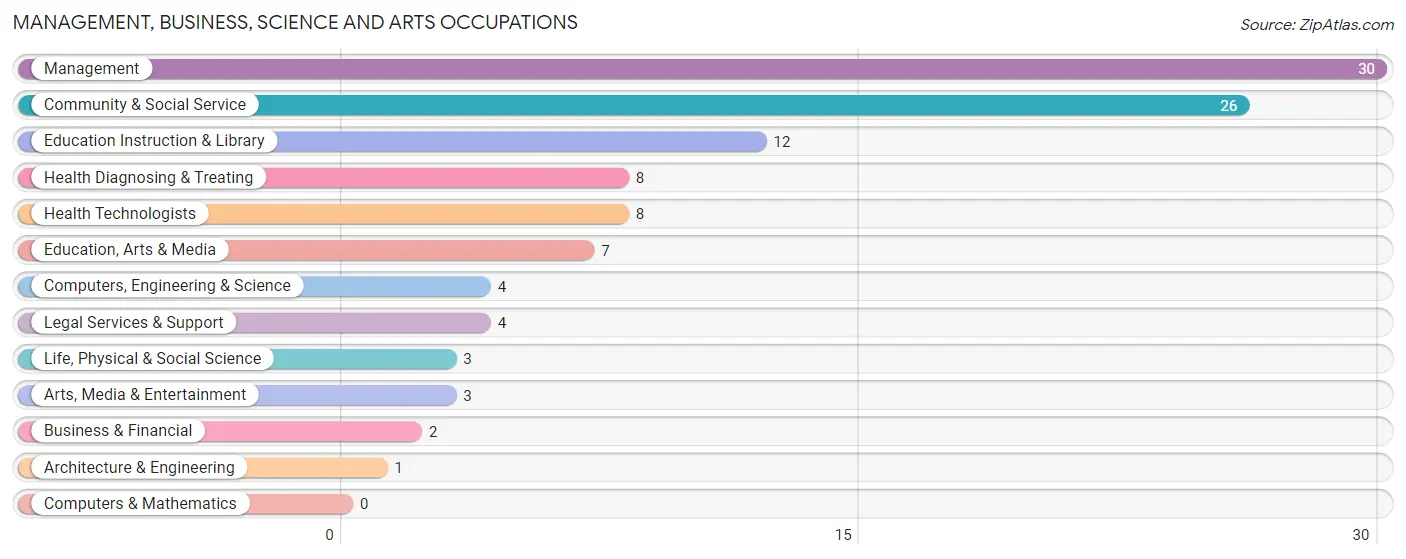
Management, Business, Science and Arts Occupations
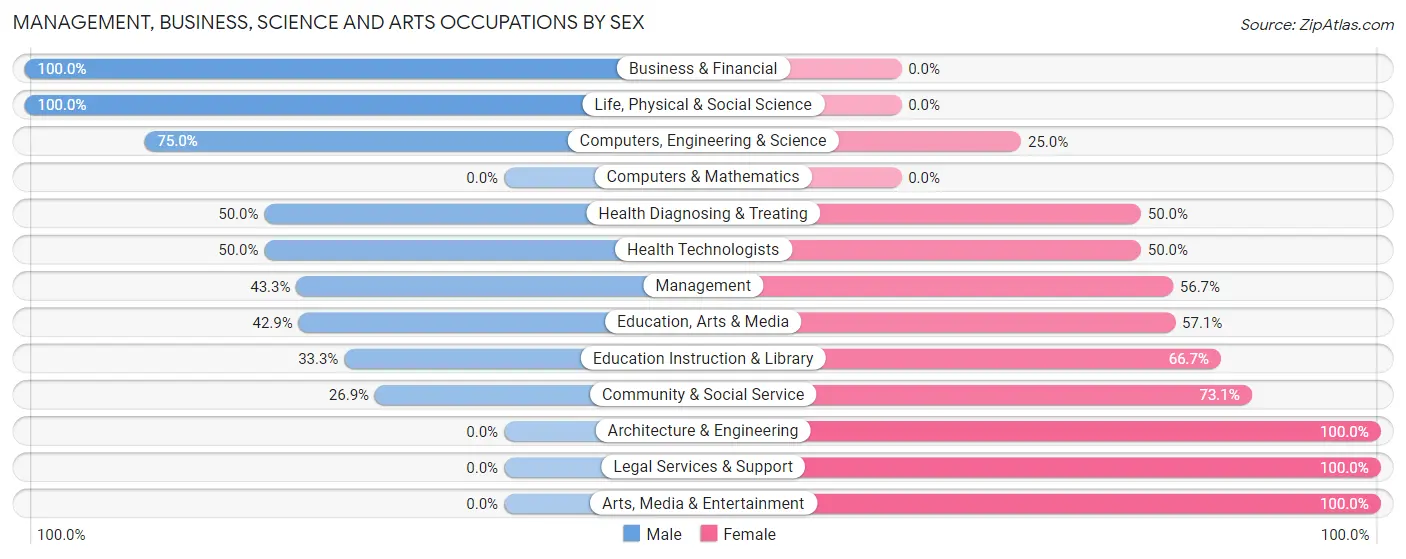
The most common Management, Business, Science and Arts occupations in Dry Prong are Management (30 | 13.8%), Community & Social Service (26 | 11.9%), Education Instruction & Library (12 | 5.5%), Health Diagnosing & Treating (8 | 3.7%), and Health Technologists (8 | 3.7%).
Management, Business, Science and Arts Occupations by Sex
Within the Management, Business, Science and Arts occupations in Dry Prong, the most male-oriented occupations are Business & Financial (100.0%), Life, Physical & Social Science (100.0%), and Computers, Engineering & Science (75.0%), while the most female-oriented occupations are Architecture & Engineering (100.0%), Legal Services & Support (100.0%), and Arts, Media & Entertainment (100.0%).
| Occupation | Male | Female |
| Management | 13 (43.3%) | 17 (56.7%) |
| Business & Financial | 2 (100.0%) | 0 (0.0%) |
| Computers, Engineering & Science | 3 (75.0%) | 1 (25.0%) |
| Computers & Mathematics | 0 (0.0%) | 0 (0.0%) |
| Architecture & Engineering | 0 (0.0%) | 1 (100.0%) |
| Life, Physical & Social Science | 3 (100.0%) | 0 (0.0%) |
| Community & Social Service | 7 (26.9%) | 19 (73.1%) |
| Education, Arts & Media | 3 (42.9%) | 4 (57.1%) |
| Legal Services & Support | 0 (0.0%) | 4 (100.0%) |
| Education Instruction & Library | 4 (33.3%) | 8 (66.7%) |
| Arts, Media & Entertainment | 0 (0.0%) | 3 (100.0%) |
| Health Diagnosing & Treating | 4 (50.0%) | 4 (50.0%) |
| Health Technologists | 4 (50.0%) | 4 (50.0%) |
| Total (Category) | 29 (41.4%) | 41 (58.6%) |
| Total (Overall) | 107 (49.1%) | 111 (50.9%) |
Services Occupations
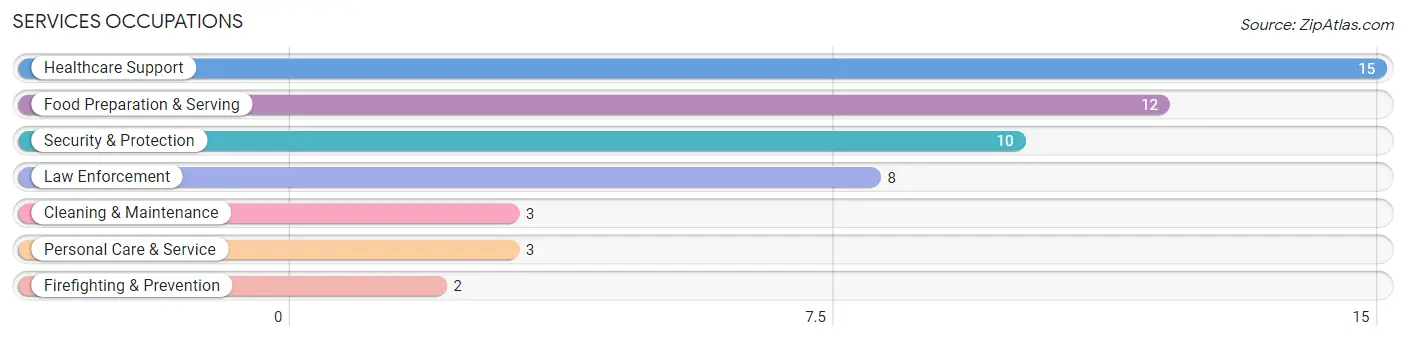
The most common Services occupations in Dry Prong are Healthcare Support (15 | 6.9%), Food Preparation & Serving (12 | 5.5%), Security & Protection (10 | 4.6%), Law Enforcement (8 | 3.7%), and Cleaning & Maintenance (3 | 1.4%).
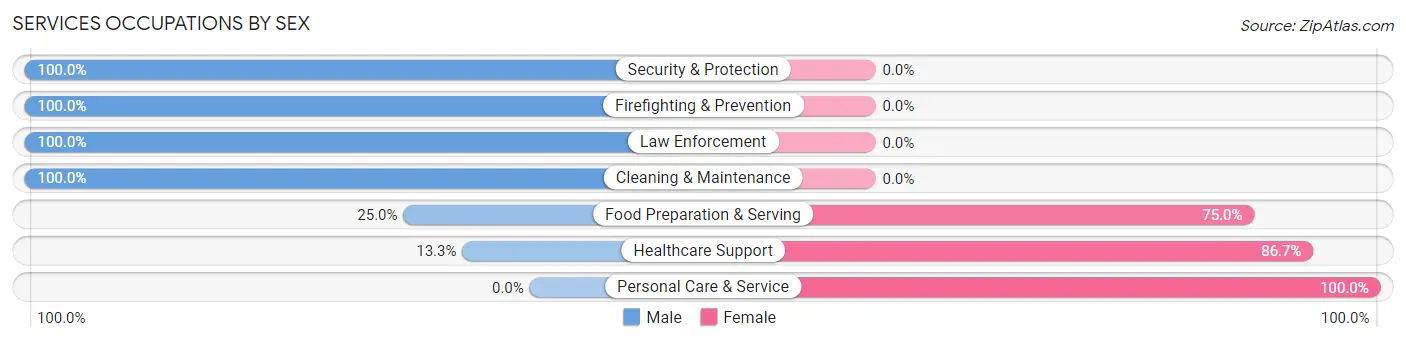
Services Occupations by Sex
Within the Services occupations in Dry Prong, the most male-oriented occupations are Security & Protection (100.0%), Firefighting & Prevention (100.0%), and Law Enforcement (100.0%), while the most female-oriented occupations are Personal Care & Service (100.0%), Healthcare Support (86.7%), and Food Preparation & Serving (75.0%).
| Occupation | Male | Female |
| Healthcare Support | 2 (13.3%) | 13 (86.7%) |
| Security & Protection | 10 (100.0%) | 0 (0.0%) |
| Firefighting & Prevention | 2 (100.0%) | 0 (0.0%) |
| Law Enforcement | 8 (100.0%) | 0 (0.0%) |
| Food Preparation & Serving | 3 (25.0%) | 9 (75.0%) |
| Cleaning & Maintenance | 3 (100.0%) | 0 (0.0%) |
| Personal Care & Service | 0 (0.0%) | 3 (100.0%) |
| Total (Category) | 18 (41.9%) | 25 (58.1%) |
| Total (Overall) | 107 (49.1%) | 111 (50.9%) |
Sales and Office Occupations
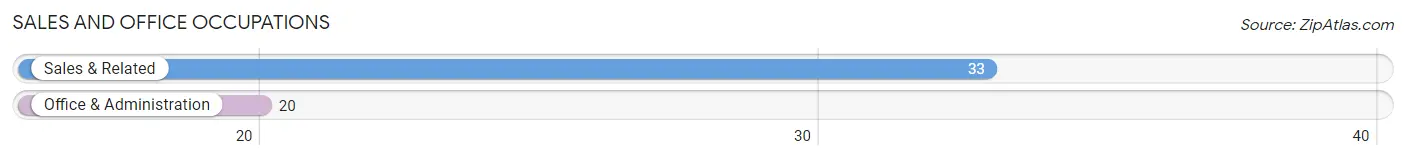
The most common Sales and Office occupations in Dry Prong are Sales & Related (33 | 15.1%), and Office & Administration (20 | 9.2%).
Sales and Office Occupations by Sex
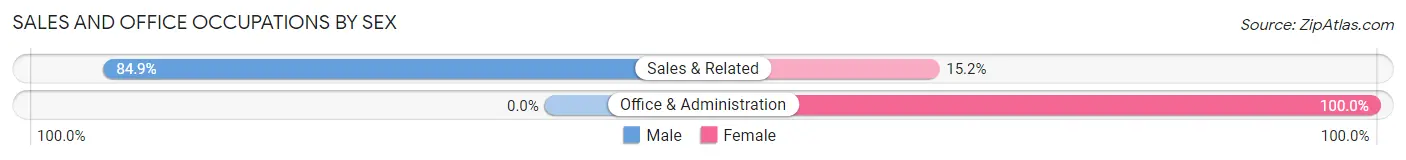
| Occupation | Male | Female |
| Sales & Related | 28 (84.9%) | 5 (15.1%) |
| Office & Administration | 0 (0.0%) | 20 (100.0%) |
| Total (Category) | 28 (52.8%) | 25 (47.2%) |
| Total (Overall) | 107 (49.1%) | 111 (50.9%) |
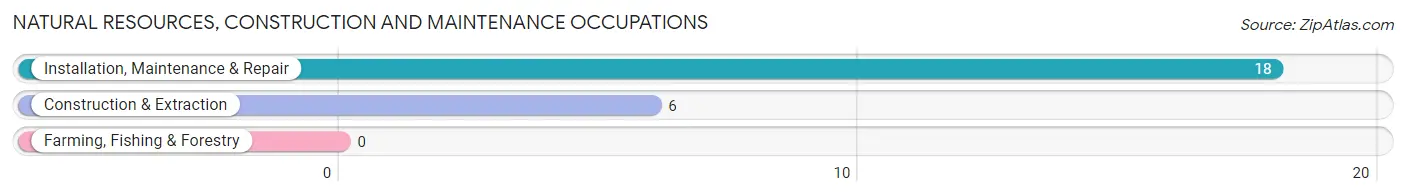
Natural Resources, Construction and Maintenance Occupations
The most common Natural Resources, Construction and Maintenance occupations in Dry Prong are Installation, Maintenance & Repair (18 | 8.3%), and Construction & Extraction (6 | 2.8%).
Natural Resources, Construction and Maintenance Occupations by Sex
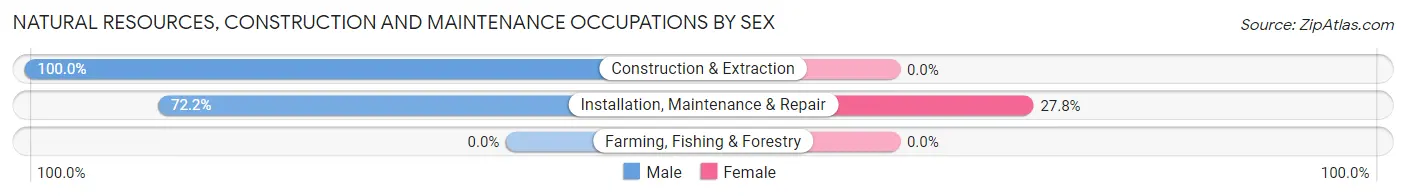
| Occupation | Male | Female |
| Farming, Fishing & Forestry | 0 (0.0%) | 0 (0.0%) |
| Construction & Extraction | 6 (100.0%) | 0 (0.0%) |
| Installation, Maintenance & Repair | 13 (72.2%) | 5 (27.8%) |
| Total (Category) | 19 (79.2%) | 5 (20.8%) |
| Total (Overall) | 107 (49.1%) | 111 (50.9%) |
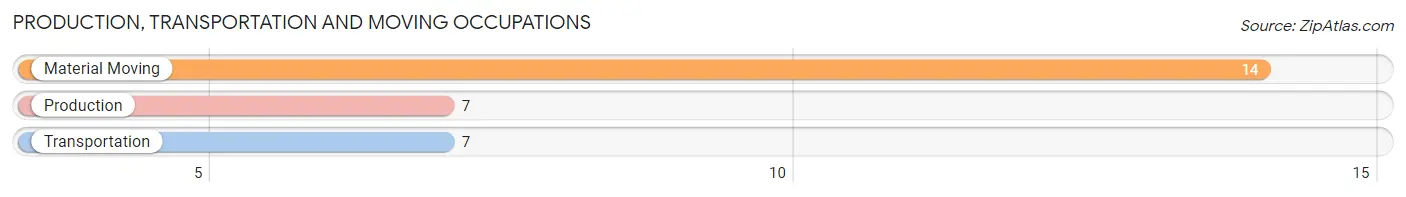
Production, Transportation and Moving Occupations
The most common Production, Transportation and Moving occupations in Dry Prong are Material Moving (14 | 6.4%), Production (7 | 3.2%), and Transportation (7 | 3.2%).
Production, Transportation and Moving Occupations by Sex
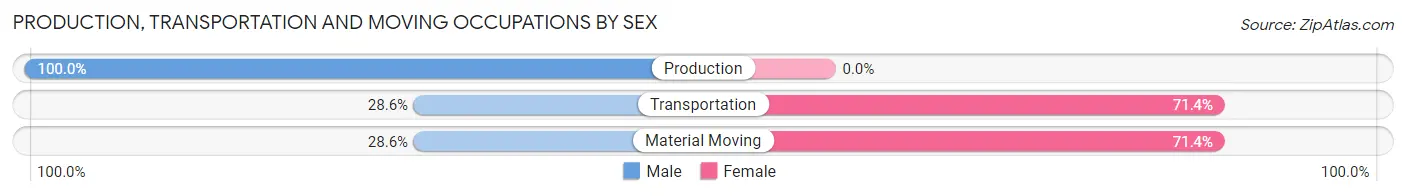
| Occupation | Male | Female |
| Production | 7 (100.0%) | 0 (0.0%) |
| Transportation | 2 (28.6%) | 5 (71.4%) |
| Material Moving | 4 (28.6%) | 10 (71.4%) |
| Total (Category) | 13 (46.4%) | 15 (53.6%) |
| Total (Overall) | 107 (49.1%) | 111 (50.9%) |
Employment Industries by Sex in Dry Prong
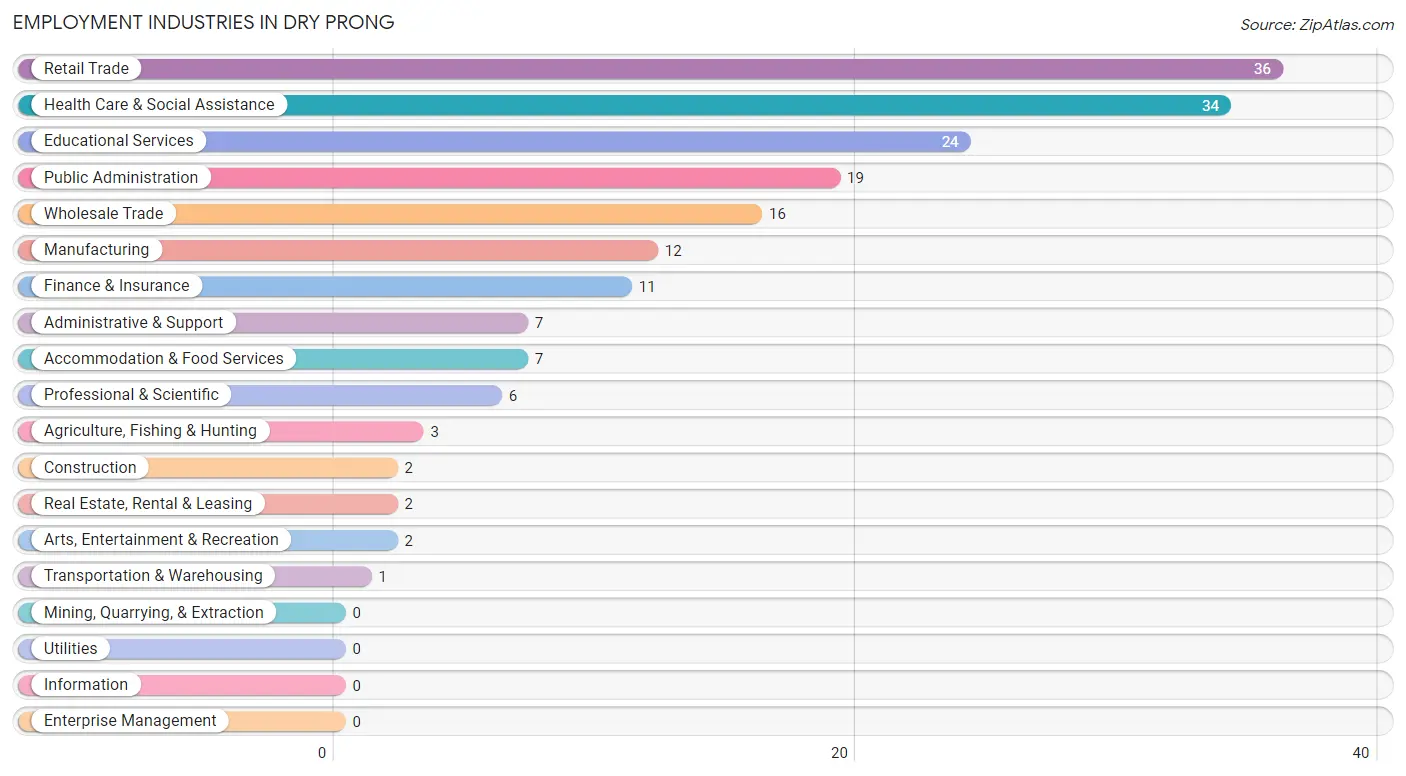
Employment Industries in Dry Prong
The major employment industries in Dry Prong include Retail Trade (36 | 16.5%), Health Care & Social Assistance (34 | 15.6%), Educational Services (24 | 11.0%), Public Administration (19 | 8.7%), and Wholesale Trade (16 | 7.3%).
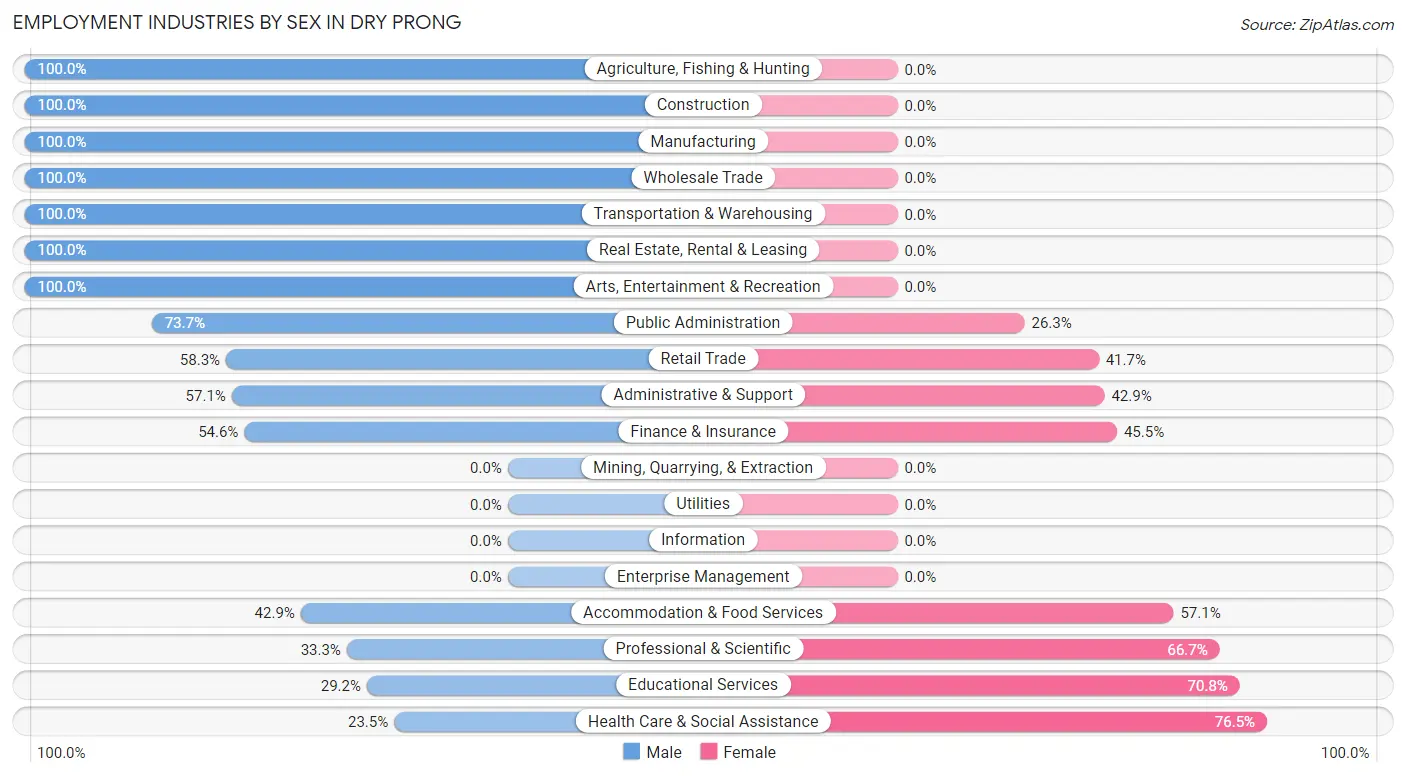
Employment Industries by Sex in Dry Prong
The Dry Prong industries that see more men than women are Agriculture, Fishing & Hunting (100.0%), Construction (100.0%), and Manufacturing (100.0%), whereas the industries that tend to have a higher number of women are Health Care & Social Assistance (76.5%), Educational Services (70.8%), and Professional & Scientific (66.7%).
| Industry | Male | Female |
| Agriculture, Fishing & Hunting | 3 (100.0%) | 0 (0.0%) |
| Mining, Quarrying, & Extraction | 0 (0.0%) | 0 (0.0%) |
| Construction | 2 (100.0%) | 0 (0.0%) |
| Manufacturing | 12 (100.0%) | 0 (0.0%) |
| Wholesale Trade | 16 (100.0%) | 0 (0.0%) |
| Retail Trade | 21 (58.3%) | 15 (41.7%) |
| Transportation & Warehousing | 1 (100.0%) | 0 (0.0%) |
| Utilities | 0 (0.0%) | 0 (0.0%) |
| Information | 0 (0.0%) | 0 (0.0%) |
| Finance & Insurance | 6 (54.5%) | 5 (45.5%) |
| Real Estate, Rental & Leasing | 2 (100.0%) | 0 (0.0%) |
| Professional & Scientific | 2 (33.3%) | 4 (66.7%) |
| Enterprise Management | 0 (0.0%) | 0 (0.0%) |
| Administrative & Support | 4 (57.1%) | 3 (42.9%) |
| Educational Services | 7 (29.2%) | 17 (70.8%) |
| Health Care & Social Assistance | 8 (23.5%) | 26 (76.5%) |
| Arts, Entertainment & Recreation | 2 (100.0%) | 0 (0.0%) |
| Accommodation & Food Services | 3 (42.9%) | 4 (57.1%) |
| Public Administration | 14 (73.7%) | 5 (26.3%) |
| Total | 107 (49.1%) | 111 (50.9%) |
Education in Dry Prong
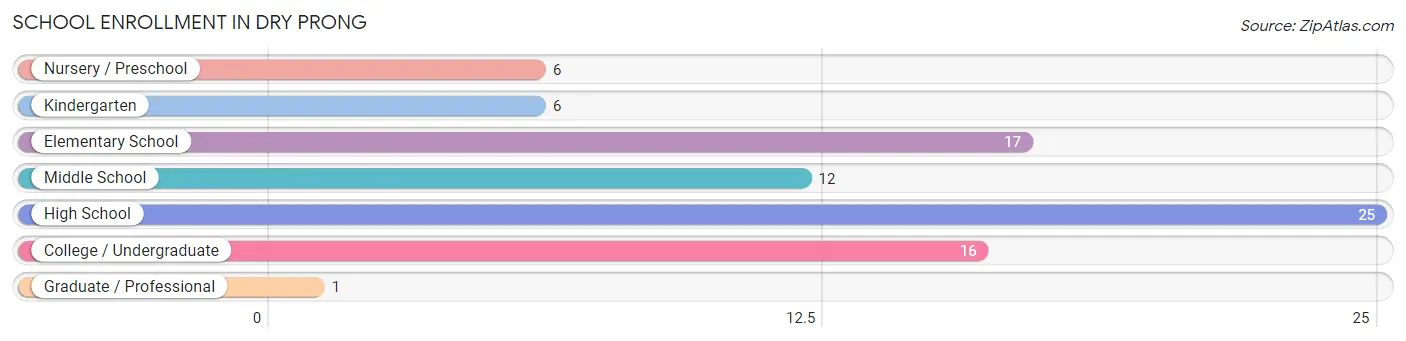
School Enrollment in Dry Prong
The most common levels of schooling among the 83 students in Dry Prong are high school (25 | 30.1%), elementary school (17 | 20.5%), and college / undergraduate (16 | 19.3%).
| School Level | # Students | % Students |
| Nursery / Preschool | 6 | 7.2% |
| Kindergarten | 6 | 7.2% |
| Elementary School | 17 | 20.5% |
| Middle School | 12 | 14.5% |
| High School | 25 | 30.1% |
| College / Undergraduate | 16 | 19.3% |
| Graduate / Professional | 1 | 1.2% |
| Total | 83 | 100.0% |
School Enrollment by Age by Funding Source in Dry Prong
Out of a total of 83 students who are enrolled in schools in Dry Prong, 27 (32.5%) attend a private institution, while the remaining 56 (67.5%) are enrolled in public schools. The age group of 3 to 4 year olds has the highest likelihood of being enrolled in private schools, with 6 (100.0% in the age bracket) enrolled. Conversely, the age group of 10 to 14 year olds has the lowest likelihood of being enrolled in a private school, with 13 (100.0% in the age bracket) attending a public institution.
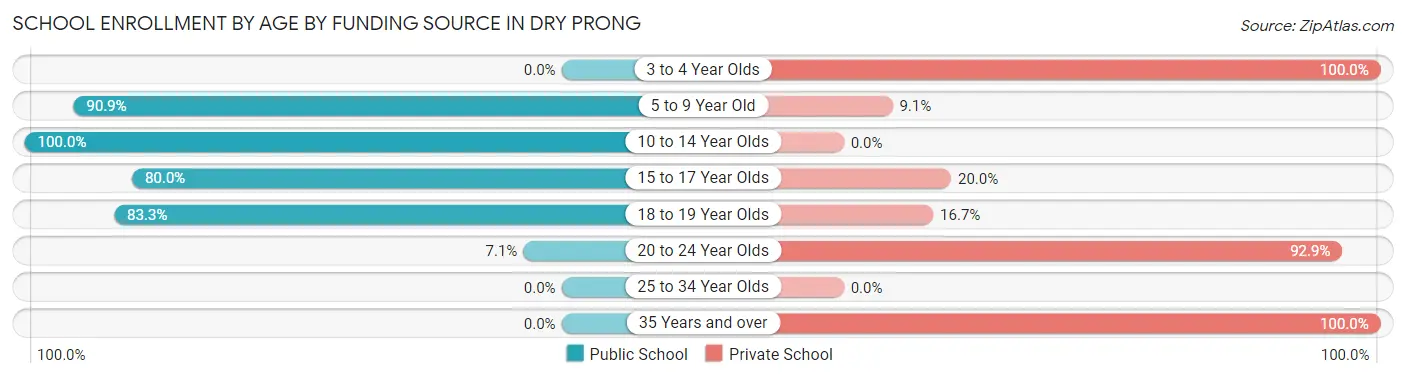
| Age Bracket | Public School | Private School |
| 3 to 4 Year Olds | 0 (0.0%) | 6 (100.0%) |
| 5 to 9 Year Old | 20 (90.9%) | 2 (9.1%) |
| 10 to 14 Year Olds | 13 (100.0%) | 0 (0.0%) |
| 15 to 17 Year Olds | 12 (80.0%) | 3 (20.0%) |
| 18 to 19 Year Olds | 10 (83.3%) | 2 (16.7%) |
| 20 to 24 Year Olds | 1 (7.1%) | 13 (92.9%) |
| 25 to 34 Year Olds | 0 (0.0%) | 0 (0.0%) |
| 35 Years and over | 0 (0.0%) | 1 (100.0%) |
| Total | 56 (67.5%) | 27 (32.5%) |
Educational Attainment by Field of Study in Dry Prong
Education (21 | 28.8%), social sciences (12 | 16.4%), liberal arts & history (9 | 12.3%), science & technology (7 | 9.6%), and bio, nature & agricultural (6 | 8.2%) are the most common fields of study among 73 individuals in Dry Prong who have obtained a bachelor's degree or higher.
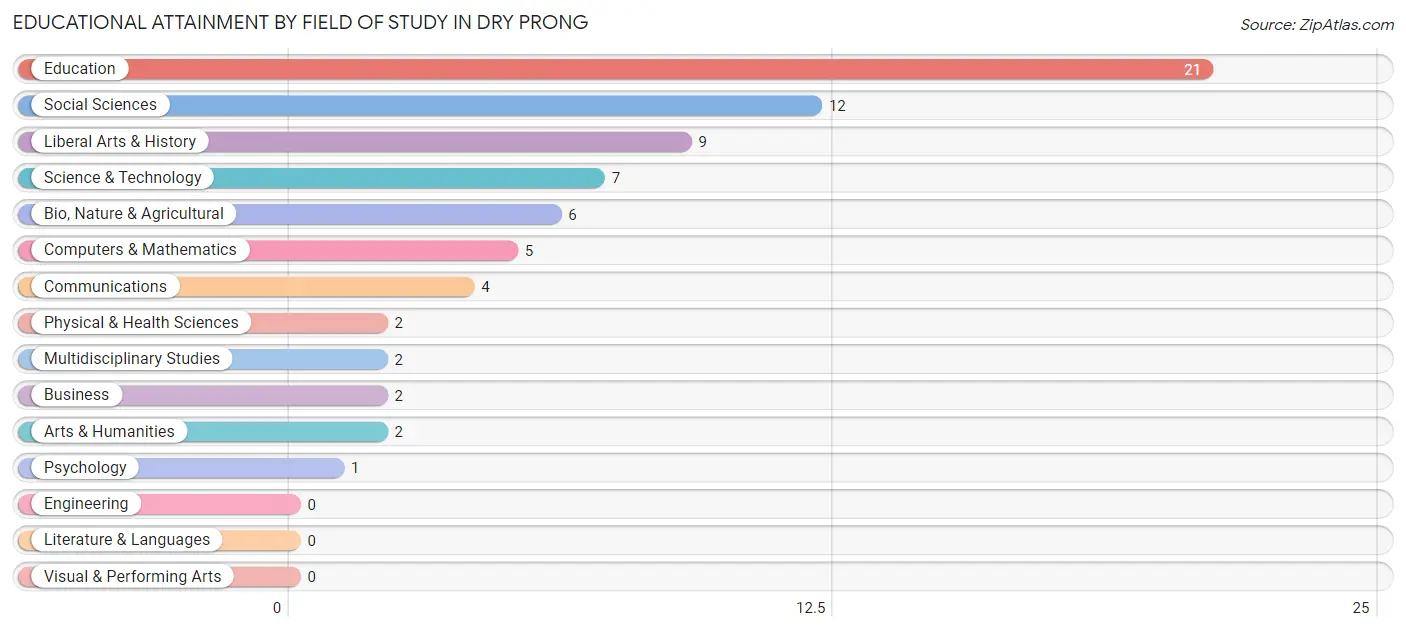
| Field of Study | # Graduates | % Graduates |
| Computers & Mathematics | 5 | 6.9% |
| Bio, Nature & Agricultural | 6 | 8.2% |
| Physical & Health Sciences | 2 | 2.7% |
| Psychology | 1 | 1.4% |
| Social Sciences | 12 | 16.4% |
| Engineering | 0 | 0.0% |
| Multidisciplinary Studies | 2 | 2.7% |
| Science & Technology | 7 | 9.6% |
| Business | 2 | 2.7% |
| Education | 21 | 28.8% |
| Literature & Languages | 0 | 0.0% |
| Liberal Arts & History | 9 | 12.3% |
| Visual & Performing Arts | 0 | 0.0% |
| Communications | 4 | 5.5% |
| Arts & Humanities | 2 | 2.7% |
| Total | 73 | 100.0% |
Transportation & Commute in Dry Prong
Vehicle Availability by Sex in Dry Prong
The most prevalent vehicle ownership categories in Dry Prong are males with 3 vehicles (40, accounting for 38.5%) and females with 3 vehicles (26, making up 37.0%).
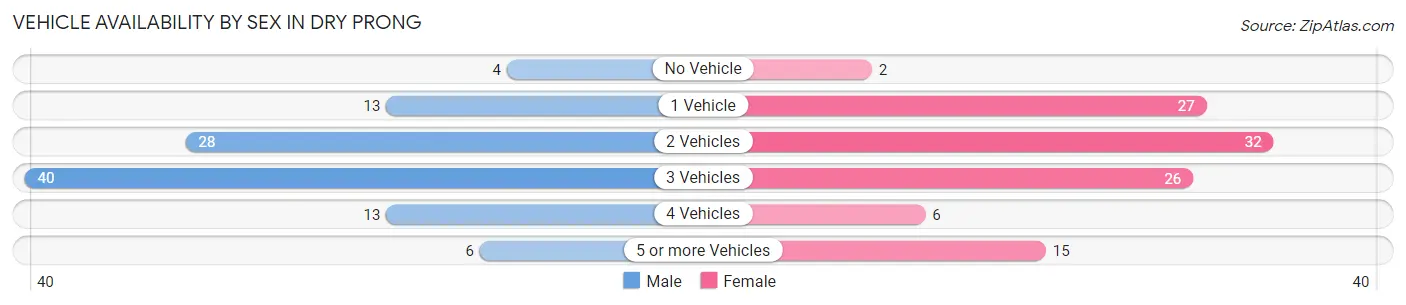
| Vehicles Available | Male | Female |
| No Vehicle | 4 (3.8%) | 2 (1.8%) |
| 1 Vehicle | 13 (12.5%) | 27 (25.0%) |
| 2 Vehicles | 28 (26.9%) | 32 (29.6%) |
| 3 Vehicles | 40 (38.5%) | 26 (24.1%) |
| 4 Vehicles | 13 (12.5%) | 6 (5.6%) |
| 5 or more Vehicles | 6 (5.8%) | 15 (13.9%) |
| Total | 104 (100.0%) | 108 (100.0%) |
Commute Time in Dry Prong
The most frequently occuring commute durations in Dry Prong are 20 to 24 minutes (58 commuters, 28.4%), 30 to 34 minutes (48 commuters, 23.5%), and 15 to 19 minutes (29 commuters, 14.2%).
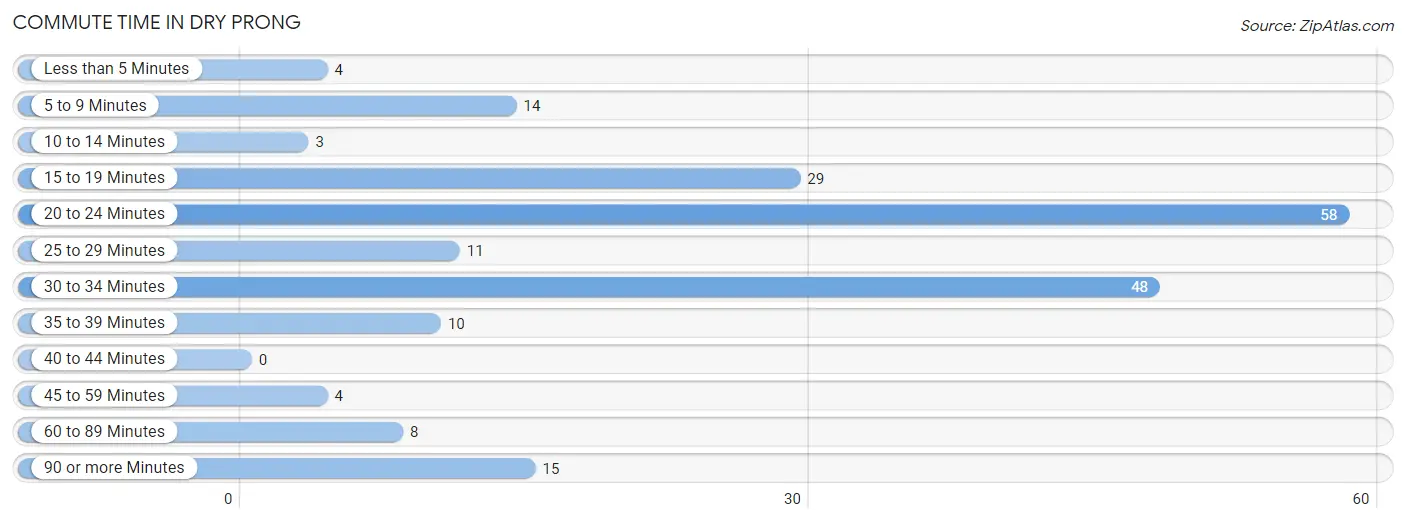
| Commute Time | # Commuters | % Commuters |
| Less than 5 Minutes | 4 | 2.0% |
| 5 to 9 Minutes | 14 | 6.9% |
| 10 to 14 Minutes | 3 | 1.5% |
| 15 to 19 Minutes | 29 | 14.2% |
| 20 to 24 Minutes | 58 | 28.4% |
| 25 to 29 Minutes | 11 | 5.4% |
| 30 to 34 Minutes | 48 | 23.5% |
| 35 to 39 Minutes | 10 | 4.9% |
| 40 to 44 Minutes | 0 | 0.0% |
| 45 to 59 Minutes | 4 | 2.0% |
| 60 to 89 Minutes | 8 | 3.9% |
| 90 or more Minutes | 15 | 7.3% |
Commute Time by Sex in Dry Prong
The most common commute times in Dry Prong are 15 to 19 minutes (23 commuters, 22.8%) for males and 20 to 24 minutes (43 commuters, 41.7%) for females.
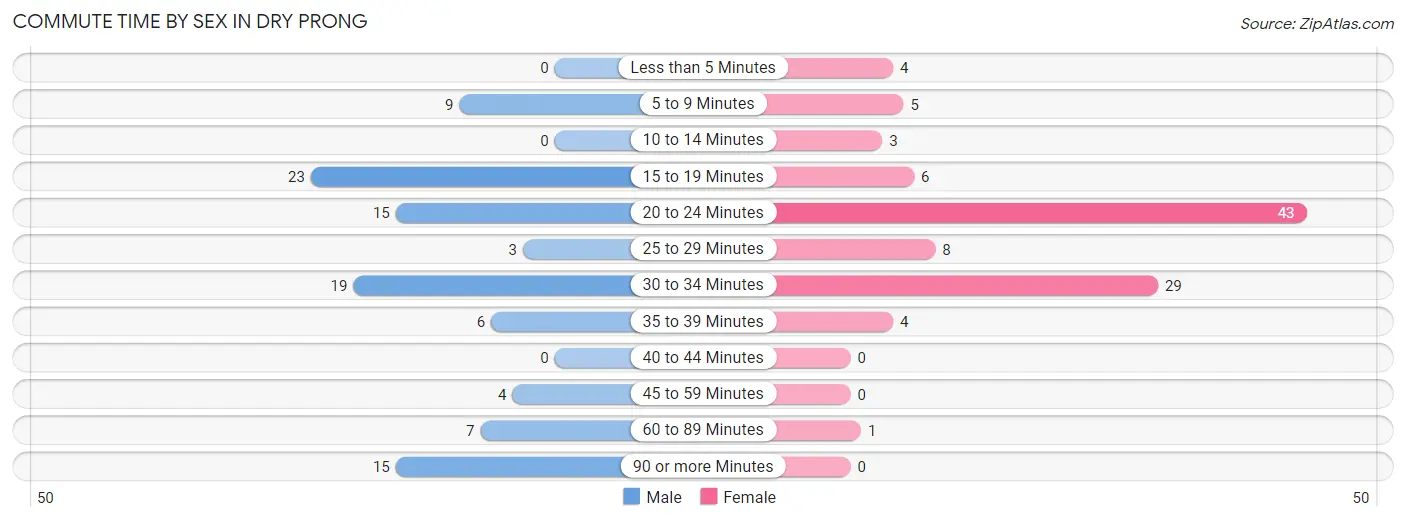
| Commute Time | Male | Female |
| Less than 5 Minutes | 0 (0.0%) | 4 (3.9%) |
| 5 to 9 Minutes | 9 (8.9%) | 5 (4.9%) |
| 10 to 14 Minutes | 0 (0.0%) | 3 (2.9%) |
| 15 to 19 Minutes | 23 (22.8%) | 6 (5.8%) |
| 20 to 24 Minutes | 15 (14.8%) | 43 (41.7%) |
| 25 to 29 Minutes | 3 (3.0%) | 8 (7.8%) |
| 30 to 34 Minutes | 19 (18.8%) | 29 (28.2%) |
| 35 to 39 Minutes | 6 (5.9%) | 4 (3.9%) |
| 40 to 44 Minutes | 0 (0.0%) | 0 (0.0%) |
| 45 to 59 Minutes | 4 (4.0%) | 0 (0.0%) |
| 60 to 89 Minutes | 7 (6.9%) | 1 (1.0%) |
| 90 or more Minutes | 15 (14.8%) | 0 (0.0%) |
Time of Departure to Work by Sex in Dry Prong
The most frequent times of departure to work in Dry Prong are 5:30 AM to 5:59 AM (20, 19.8%) for males and 7:30 AM to 7:59 AM (27, 26.2%) for females.
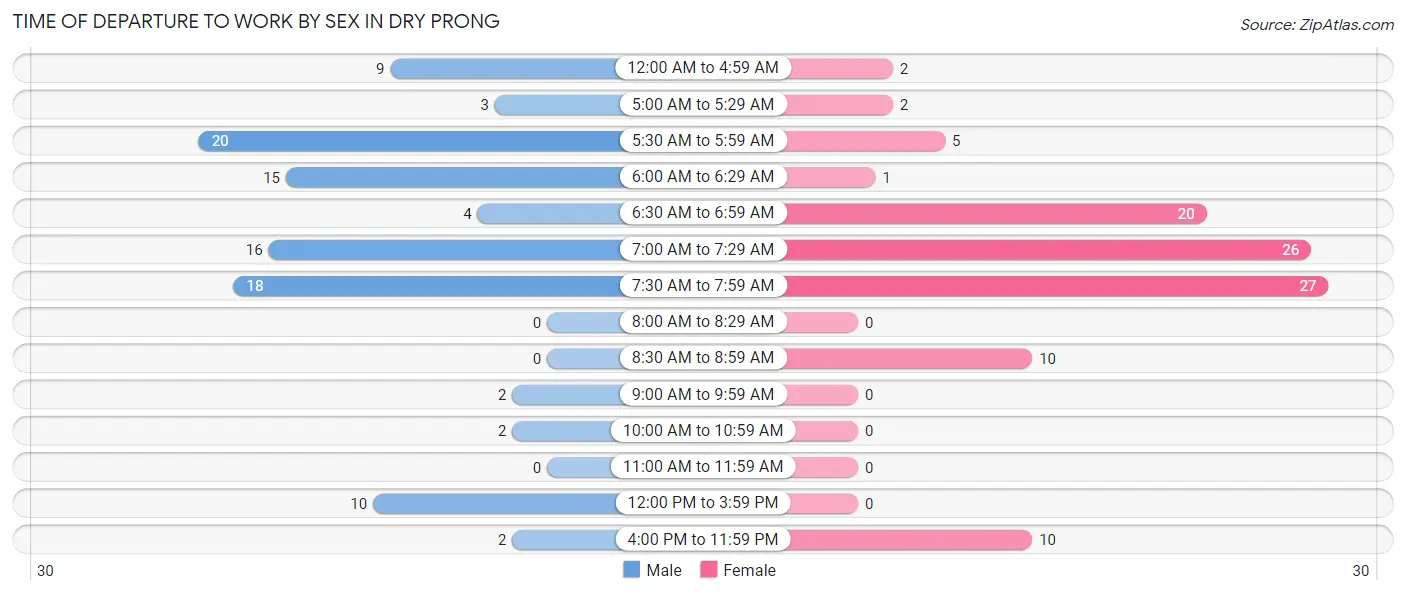
| Time of Departure | Male | Female |
| 12:00 AM to 4:59 AM | 9 (8.9%) | 2 (1.9%) |
| 5:00 AM to 5:29 AM | 3 (3.0%) | 2 (1.9%) |
| 5:30 AM to 5:59 AM | 20 (19.8%) | 5 (4.9%) |
| 6:00 AM to 6:29 AM | 15 (14.8%) | 1 (1.0%) |
| 6:30 AM to 6:59 AM | 4 (4.0%) | 20 (19.4%) |
| 7:00 AM to 7:29 AM | 16 (15.8%) | 26 (25.2%) |
| 7:30 AM to 7:59 AM | 18 (17.8%) | 27 (26.2%) |
| 8:00 AM to 8:29 AM | 0 (0.0%) | 0 (0.0%) |
| 8:30 AM to 8:59 AM | 0 (0.0%) | 10 (9.7%) |
| 9:00 AM to 9:59 AM | 2 (2.0%) | 0 (0.0%) |
| 10:00 AM to 10:59 AM | 2 (2.0%) | 0 (0.0%) |
| 11:00 AM to 11:59 AM | 0 (0.0%) | 0 (0.0%) |
| 12:00 PM to 3:59 PM | 10 (9.9%) | 0 (0.0%) |
| 4:00 PM to 11:59 PM | 2 (2.0%) | 10 (9.7%) |
| Total | 101 (100.0%) | 103 (100.0%) |
Housing Occupancy in Dry Prong
Occupancy by Ownership in Dry Prong
Of the total 158 dwellings in Dry Prong, owner-occupied units account for 141 (89.2%), while renter-occupied units make up 17 (10.8%).
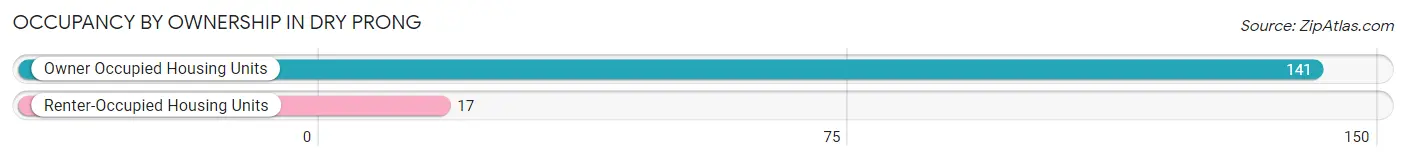
| Occupancy | # Housing Units | % Housing Units |
| Owner Occupied Housing Units | 141 | 89.2% |
| Renter-Occupied Housing Units | 17 | 10.8% |
| Total Occupied Housing Units | 158 | 100.0% |
Occupancy by Household Size in Dry Prong
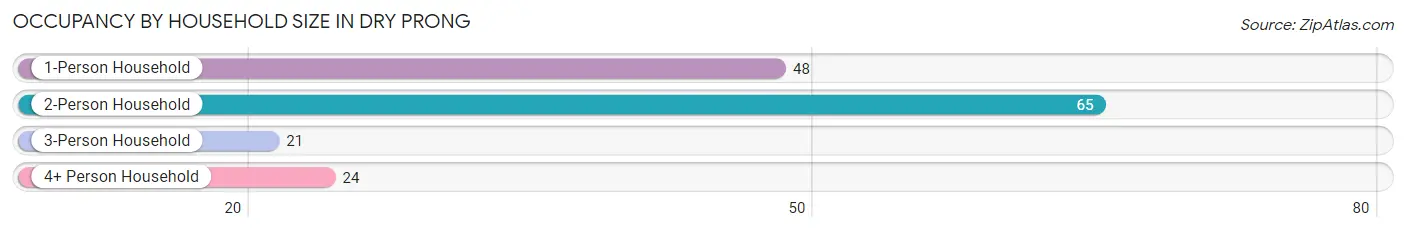
| Household Size | # Housing Units | % Housing Units |
| 1-Person Household | 48 | 30.4% |
| 2-Person Household | 65 | 41.1% |
| 3-Person Household | 21 | 13.3% |
| 4+ Person Household | 24 | 15.2% |
| Total Housing Units | 158 | 100.0% |
Occupancy by Ownership by Household Size in Dry Prong
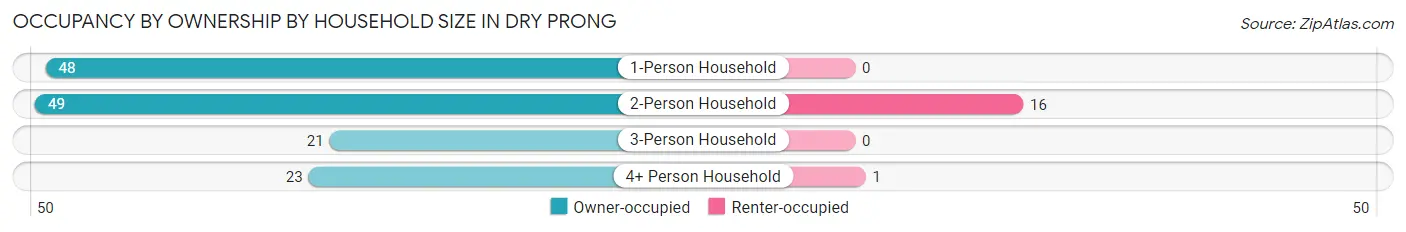
| Household Size | Owner-occupied | Renter-occupied |
| 1-Person Household | 48 (100.0%) | 0 (0.0%) |
| 2-Person Household | 49 (75.4%) | 16 (24.6%) |
| 3-Person Household | 21 (100.0%) | 0 (0.0%) |
| 4+ Person Household | 23 (95.8%) | 1 (4.2%) |
| Total Housing Units | 141 (89.2%) | 17 (10.8%) |
Occupancy by Educational Attainment in Dry Prong
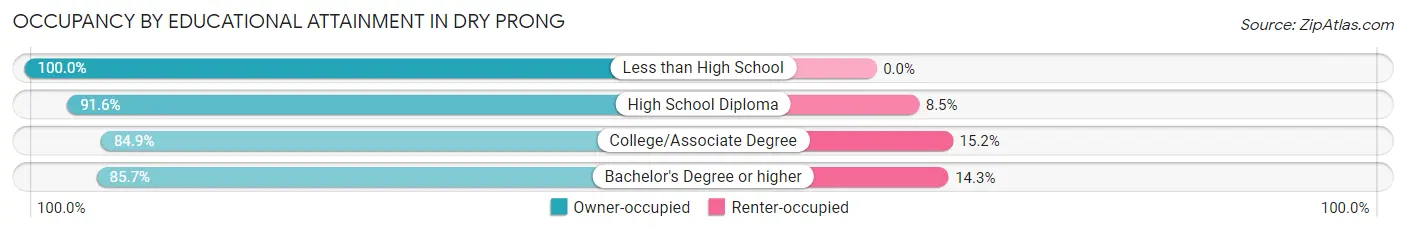
| Household Size | Owner-occupied | Renter-occupied |
| Less than High School | 12 (100.0%) | 0 (0.0%) |
| High School Diploma | 65 (91.5%) | 6 (8.5%) |
| College/Associate Degree | 28 (84.9%) | 5 (15.1%) |
| Bachelor's Degree or higher | 36 (85.7%) | 6 (14.3%) |
Occupancy by Age of Householder in Dry Prong
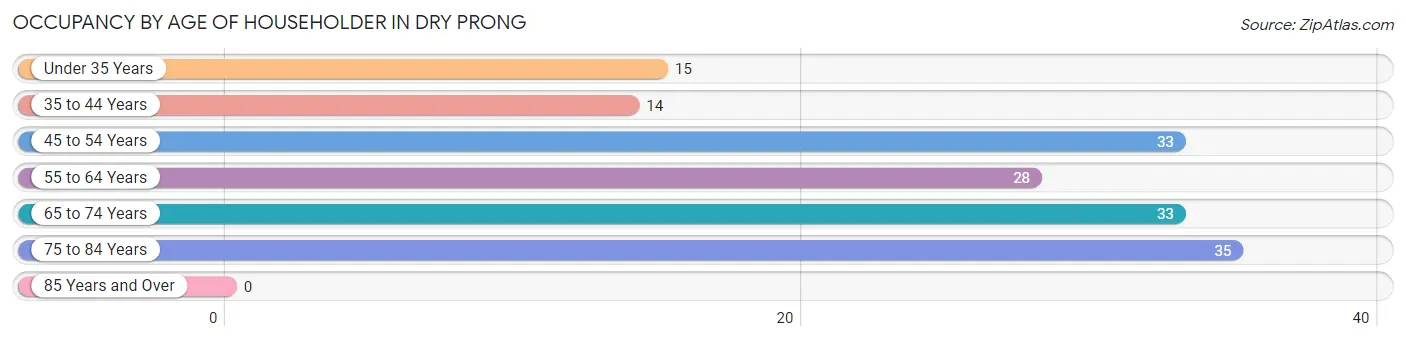
| Age Bracket | # Households | % Households |
| Under 35 Years | 15 | 9.5% |
| 35 to 44 Years | 14 | 8.9% |
| 45 to 54 Years | 33 | 20.9% |
| 55 to 64 Years | 28 | 17.7% |
| 65 to 74 Years | 33 | 20.9% |
| 75 to 84 Years | 35 | 22.2% |
| 85 Years and Over | 0 | 0.0% |
| Total | 158 | 100.0% |
Housing Finances in Dry Prong
Median Income by Occupancy in Dry Prong
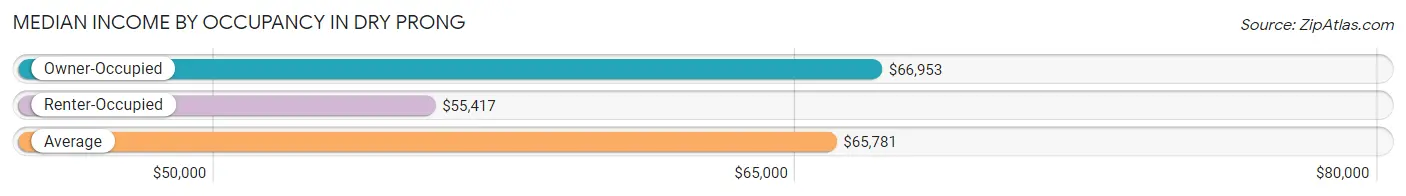
| Occupancy Type | # Households | Median Income |
| Owner-Occupied | 141 (89.2%) | $66,953 |
| Renter-Occupied | 17 (10.8%) | $55,417 |
| Average | 158 (100.0%) | $65,781 |
Occupancy by Householder Income Bracket in Dry Prong
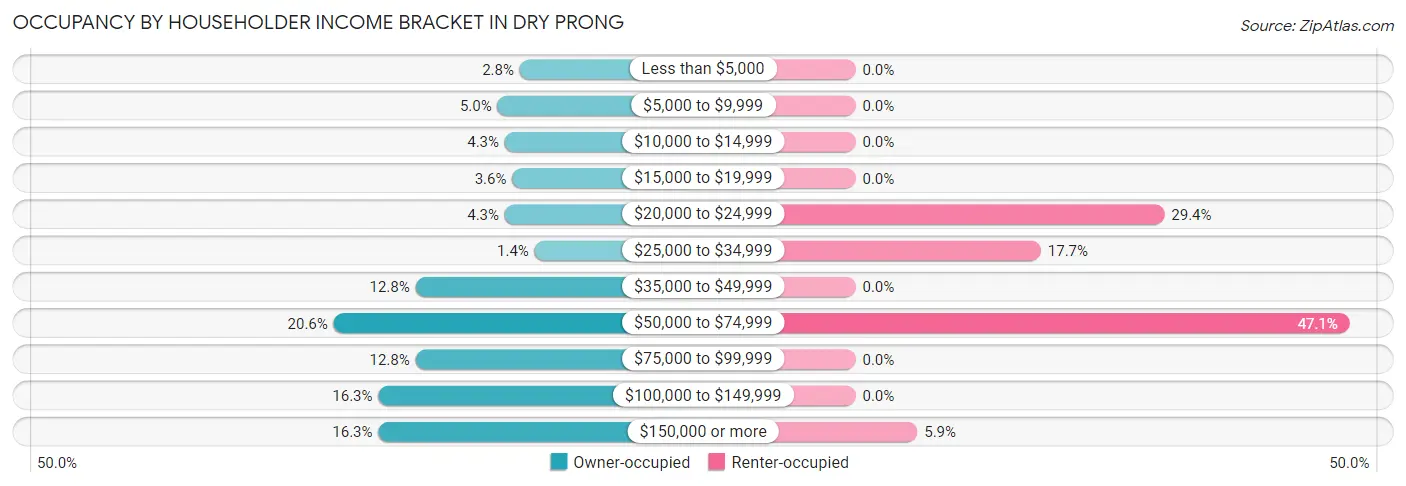
| Income Bracket | Owner-occupied | Renter-occupied |
| Less than $5,000 | 4 (2.8%) | 0 (0.0%) |
| $5,000 to $9,999 | 7 (5.0%) | 0 (0.0%) |
| $10,000 to $14,999 | 6 (4.3%) | 0 (0.0%) |
| $15,000 to $19,999 | 5 (3.5%) | 0 (0.0%) |
| $20,000 to $24,999 | 6 (4.3%) | 5 (29.4%) |
| $25,000 to $34,999 | 2 (1.4%) | 3 (17.6%) |
| $35,000 to $49,999 | 18 (12.8%) | 0 (0.0%) |
| $50,000 to $74,999 | 29 (20.6%) | 8 (47.1%) |
| $75,000 to $99,999 | 18 (12.8%) | 0 (0.0%) |
| $100,000 to $149,999 | 23 (16.3%) | 0 (0.0%) |
| $150,000 or more | 23 (16.3%) | 1 (5.9%) |
| Total | 141 (100.0%) | 17 (100.0%) |
Monthly Housing Cost Tiers in Dry Prong
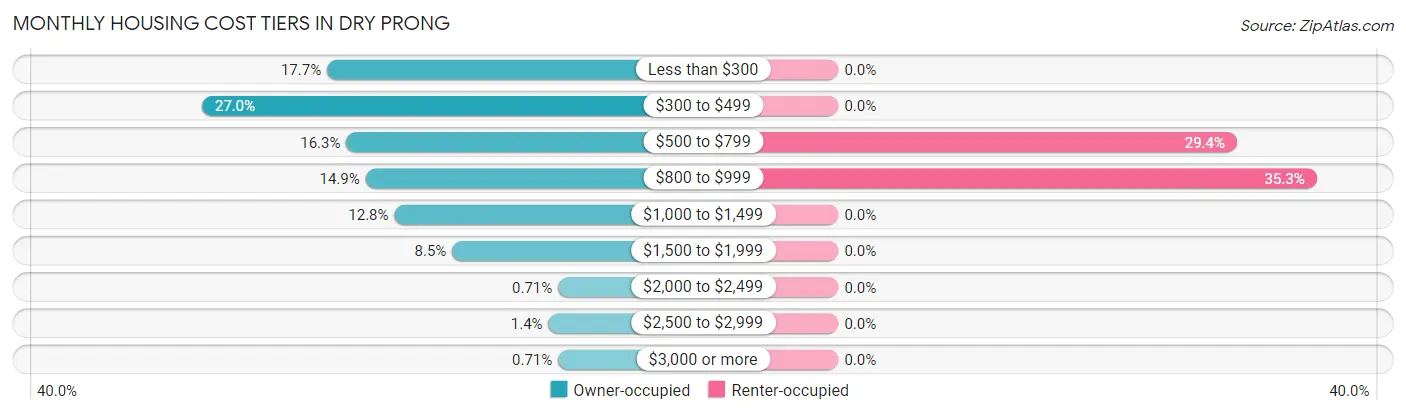
| Monthly Cost | Owner-occupied | Renter-occupied |
| Less than $300 | 25 (17.7%) | 0 (0.0%) |
| $300 to $499 | 38 (27.0%) | 0 (0.0%) |
| $500 to $799 | 23 (16.3%) | 5 (29.4%) |
| $800 to $999 | 21 (14.9%) | 6 (35.3%) |
| $1,000 to $1,499 | 18 (12.8%) | 0 (0.0%) |
| $1,500 to $1,999 | 12 (8.5%) | 0 (0.0%) |
| $2,000 to $2,499 | 1 (0.7%) | 0 (0.0%) |
| $2,500 to $2,999 | 2 (1.4%) | 0 (0.0%) |
| $3,000 or more | 1 (0.7%) | 0 (0.0%) |
| Total | 141 (100.0%) | 17 (100.0%) |
Physical Housing Characteristics in Dry Prong
Housing Structures in Dry Prong
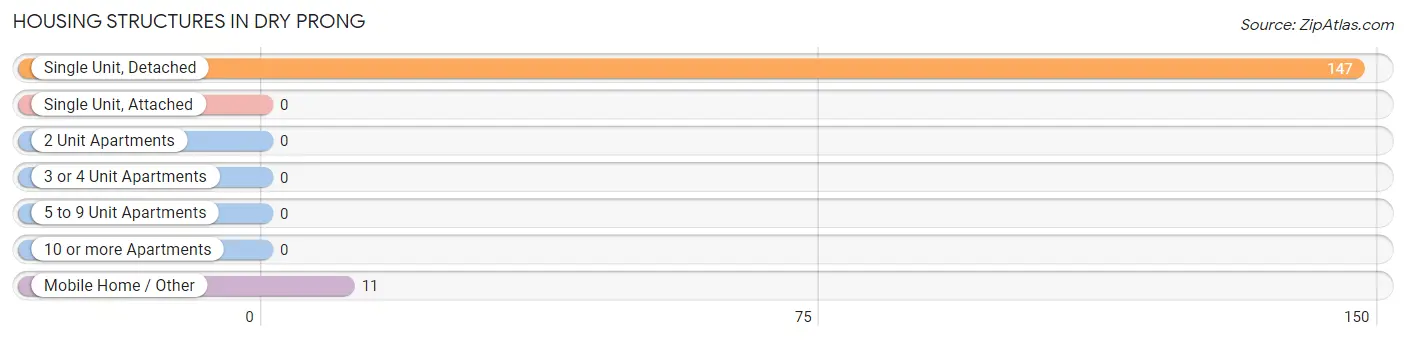
| Structure Type | # Housing Units | % Housing Units |
| Single Unit, Detached | 147 | 93.0% |
| Single Unit, Attached | 0 | 0.0% |
| 2 Unit Apartments | 0 | 0.0% |
| 3 or 4 Unit Apartments | 0 | 0.0% |
| 5 to 9 Unit Apartments | 0 | 0.0% |
| 10 or more Apartments | 0 | 0.0% |
| Mobile Home / Other | 11 | 7.0% |
| Total | 158 | 100.0% |
Housing Structures by Occupancy in Dry Prong
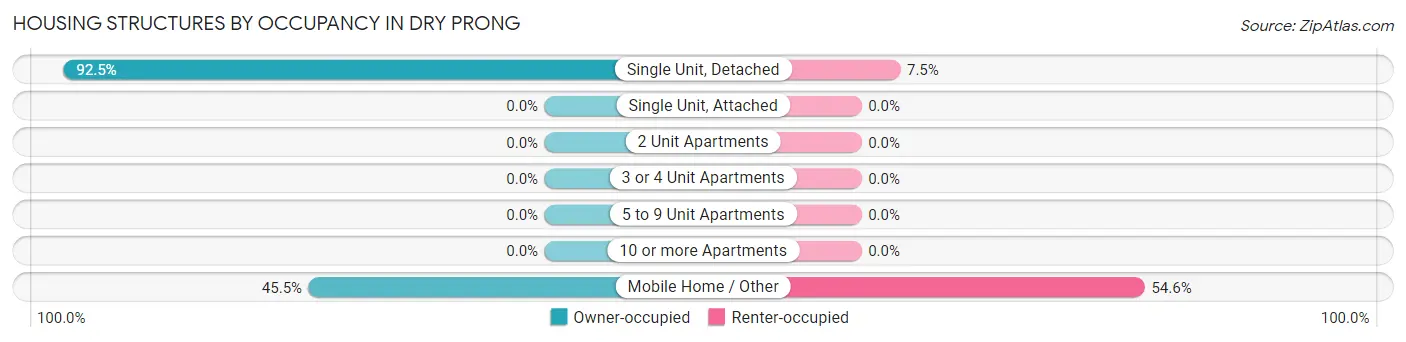
| Structure Type | Owner-occupied | Renter-occupied |
| Single Unit, Detached | 136 (92.5%) | 11 (7.5%) |
| Single Unit, Attached | 0 (0.0%) | 0 (0.0%) |
| 2 Unit Apartments | 0 (0.0%) | 0 (0.0%) |
| 3 or 4 Unit Apartments | 0 (0.0%) | 0 (0.0%) |
| 5 to 9 Unit Apartments | 0 (0.0%) | 0 (0.0%) |
| 10 or more Apartments | 0 (0.0%) | 0 (0.0%) |
| Mobile Home / Other | 5 (45.5%) | 6 (54.5%) |
| Total | 141 (89.2%) | 17 (10.8%) |
Housing Structures by Number of Rooms in Dry Prong
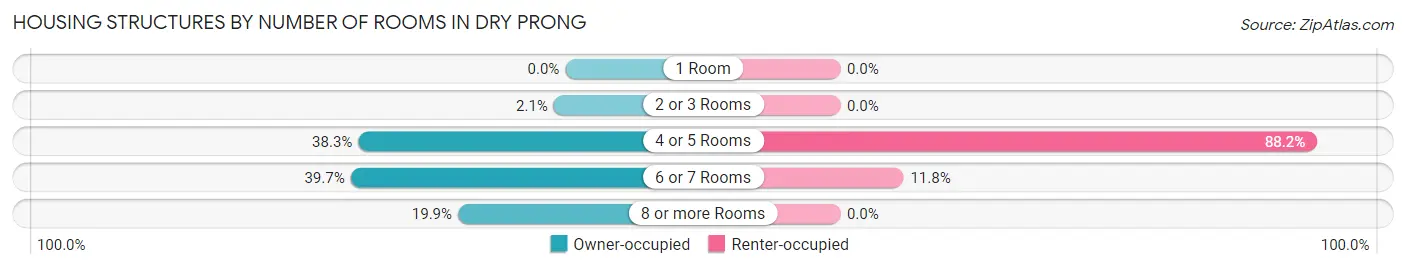
| Number of Rooms | Owner-occupied | Renter-occupied |
| 1 Room | 0 (0.0%) | 0 (0.0%) |
| 2 or 3 Rooms | 3 (2.1%) | 0 (0.0%) |
| 4 or 5 Rooms | 54 (38.3%) | 15 (88.2%) |
| 6 or 7 Rooms | 56 (39.7%) | 2 (11.8%) |
| 8 or more Rooms | 28 (19.9%) | 0 (0.0%) |
| Total | 141 (100.0%) | 17 (100.0%) |
Housing Structure by Heating Type in Dry Prong
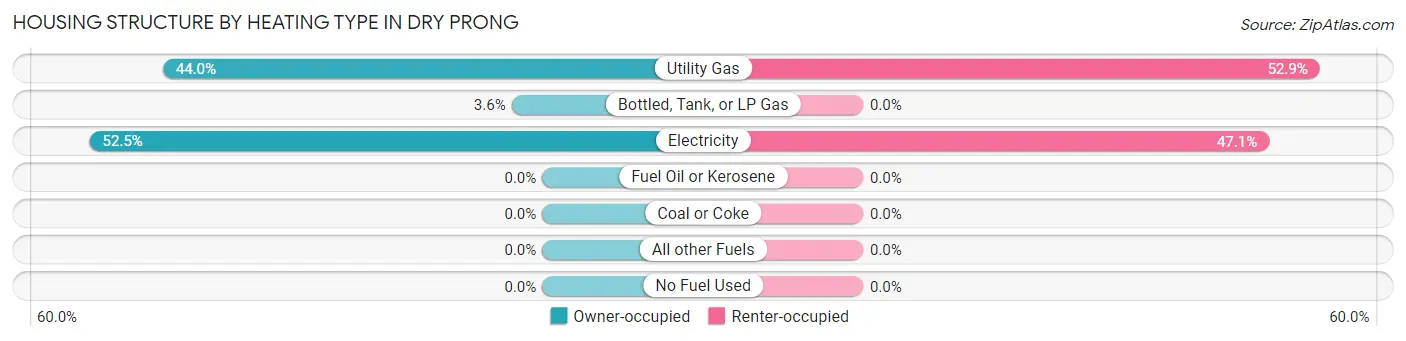
| Heating Type | Owner-occupied | Renter-occupied |
| Utility Gas | 62 (44.0%) | 9 (52.9%) |
| Bottled, Tank, or LP Gas | 5 (3.5%) | 0 (0.0%) |
| Electricity | 74 (52.5%) | 8 (47.1%) |
| Fuel Oil or Kerosene | 0 (0.0%) | 0 (0.0%) |
| Coal or Coke | 0 (0.0%) | 0 (0.0%) |
| All other Fuels | 0 (0.0%) | 0 (0.0%) |
| No Fuel Used | 0 (0.0%) | 0 (0.0%) |
| Total | 141 (100.0%) | 17 (100.0%) |
Household Vehicle Usage in Dry Prong
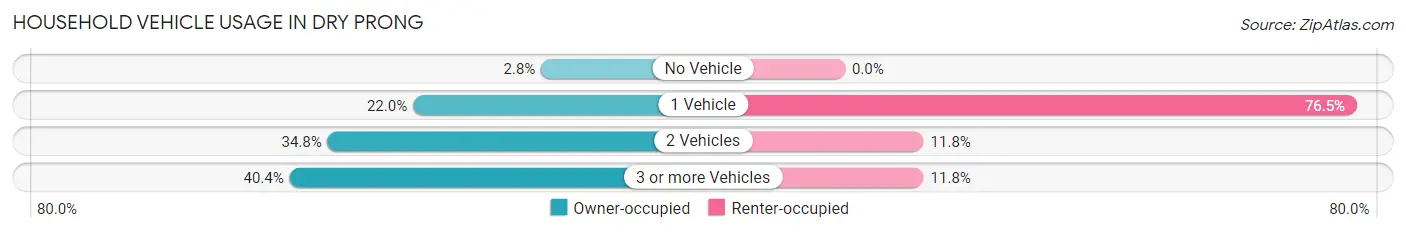
| Vehicles per Household | Owner-occupied | Renter-occupied |
| No Vehicle | 4 (2.8%) | 0 (0.0%) |
| 1 Vehicle | 31 (22.0%) | 13 (76.5%) |
| 2 Vehicles | 49 (34.7%) | 2 (11.8%) |
| 3 or more Vehicles | 57 (40.4%) | 2 (11.8%) |
| Total | 141 (100.0%) | 17 (100.0%) |
Real Estate & Mortgages in Dry Prong
Real Estate and Mortgage Overview in Dry Prong
| Characteristic | Without Mortgage | With Mortgage |
| Housing Units | 70 | 71 |
| Median Property Value | $214,300 | $166,300 |
| Median Household Income | $57,500 | $20 |
| Monthly Housing Costs | $381 | $1 |
| Real Estate Taxes | - | - |
Property Value by Mortgage Status in Dry Prong
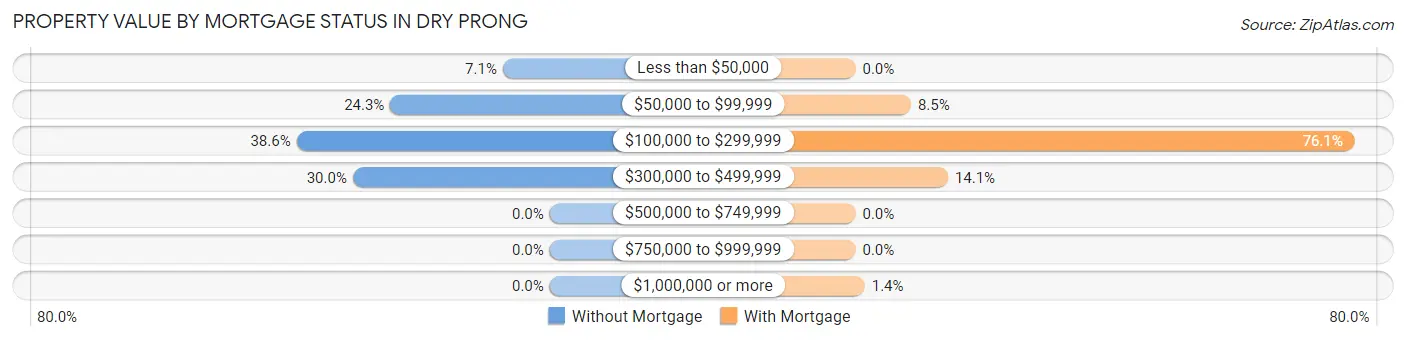
| Property Value | Without Mortgage | With Mortgage |
| Less than $50,000 | 5 (7.1%) | 0 (0.0%) |
| $50,000 to $99,999 | 17 (24.3%) | 6 (8.5%) |
| $100,000 to $299,999 | 27 (38.6%) | 54 (76.1%) |
| $300,000 to $499,999 | 21 (30.0%) | 10 (14.1%) |
| $500,000 to $749,999 | 0 (0.0%) | 0 (0.0%) |
| $750,000 to $999,999 | 0 (0.0%) | 0 (0.0%) |
| $1,000,000 or more | 0 (0.0%) | 1 (1.4%) |
| Total | 70 (100.0%) | 71 (100.0%) |
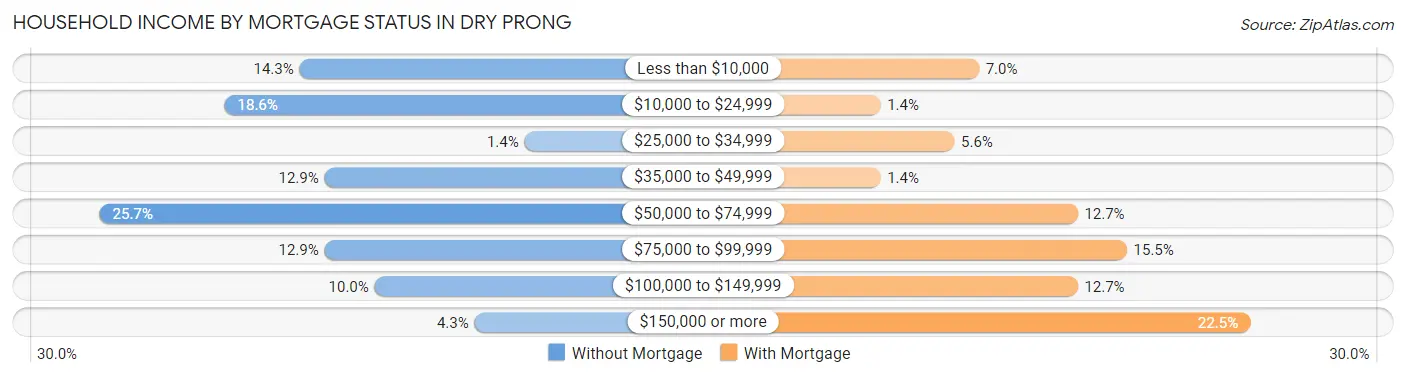
Household Income by Mortgage Status in Dry Prong
| Household Income | Without Mortgage | With Mortgage |
| Less than $10,000 | 10 (14.3%) | 5 (7.0%) |
| $10,000 to $24,999 | 13 (18.6%) | 1 (1.4%) |
| $25,000 to $34,999 | 1 (1.4%) | 4 (5.6%) |
| $35,000 to $49,999 | 9 (12.9%) | 1 (1.4%) |
| $50,000 to $74,999 | 18 (25.7%) | 9 (12.7%) |
| $75,000 to $99,999 | 9 (12.9%) | 11 (15.5%) |
| $100,000 to $149,999 | 7 (10.0%) | 9 (12.7%) |
| $150,000 or more | 3 (4.3%) | 16 (22.5%) |
| Total | 70 (100.0%) | 71 (100.0%) |
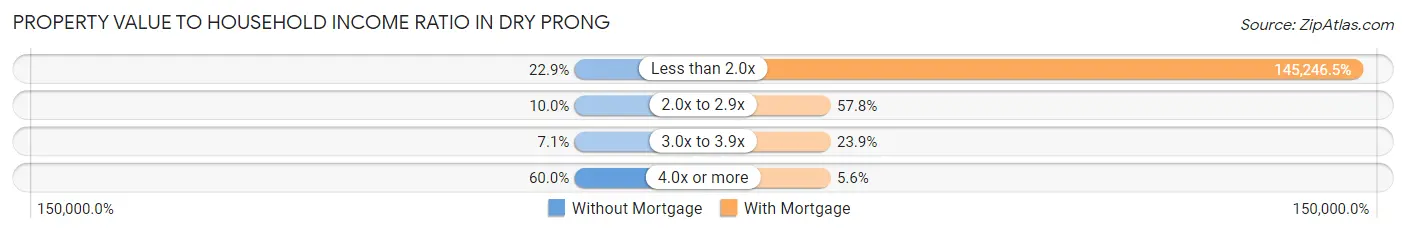
Property Value to Household Income Ratio in Dry Prong
| Value-to-Income Ratio | Without Mortgage | With Mortgage |
| Less than 2.0x | 16 (22.9%) | 103,125 (145,246.5%) |
| 2.0x to 2.9x | 7 (10.0%) | 41 (57.8%) |
| 3.0x to 3.9x | 5 (7.1%) | 17 (23.9%) |
| 4.0x or more | 42 (60.0%) | 4 (5.6%) |
| Total | 70 (100.0%) | 71 (100.0%) |
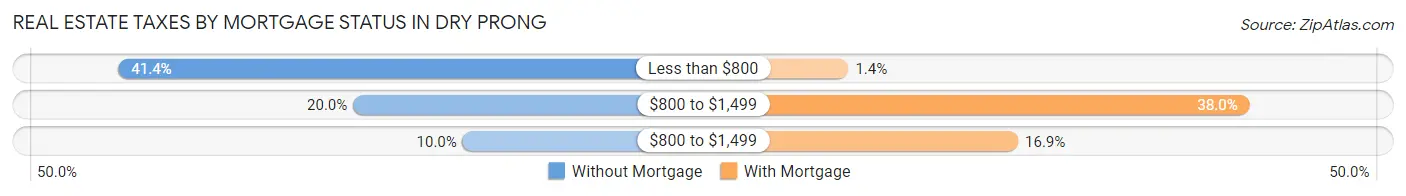
Real Estate Taxes by Mortgage Status in Dry Prong
| Property Taxes | Without Mortgage | With Mortgage |
| Less than $800 | 29 (41.4%) | 1 (1.4%) |
| $800 to $1,499 | 14 (20.0%) | 27 (38.0%) |
| $800 to $1,499 | 7 (10.0%) | 12 (16.9%) |
| Total | 70 (100.0%) | 71 (100.0%) |
Health & Disability in Dry Prong
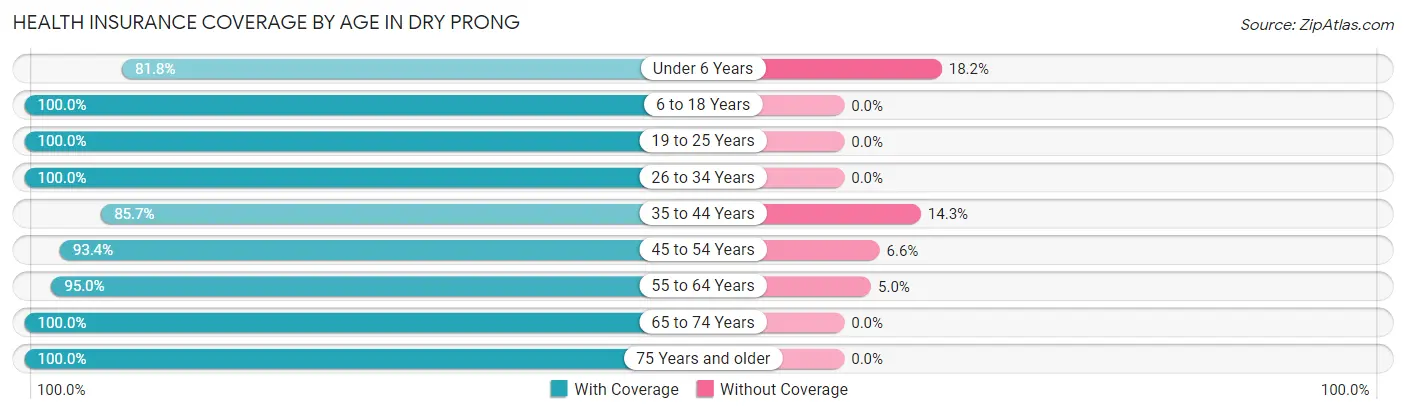
Health Insurance Coverage by Age in Dry Prong
| Age Bracket | With Coverage | Without Coverage |
| Under 6 Years | 9 (81.8%) | 2 (18.2%) |
| 6 to 18 Years | 56 (100.0%) | 0 (0.0%) |
| 19 to 25 Years | 62 (100.0%) | 0 (0.0%) |
| 26 to 34 Years | 26 (100.0%) | 0 (0.0%) |
| 35 to 44 Years | 30 (85.7%) | 5 (14.3%) |
| 45 to 54 Years | 71 (93.4%) | 5 (6.6%) |
| 55 to 64 Years | 57 (95.0%) | 3 (5.0%) |
| 65 to 74 Years | 58 (100.0%) | 0 (0.0%) |
| 75 Years and older | 44 (100.0%) | 0 (0.0%) |
| Total | 413 (96.5%) | 15 (3.5%) |
Health Insurance Coverage by Citizenship Status in Dry Prong
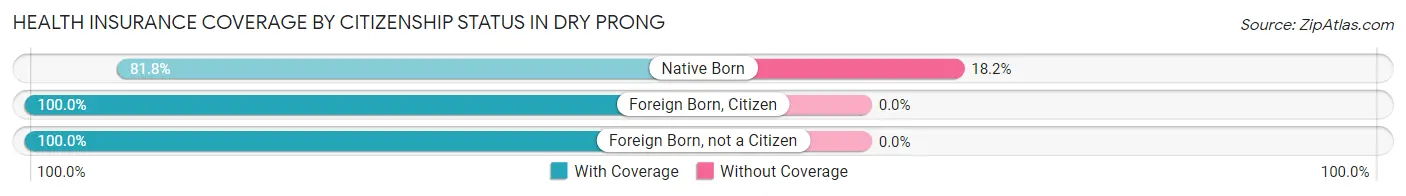
| Citizenship Status | With Coverage | Without Coverage |
| Native Born | 9 (81.8%) | 2 (18.2%) |
| Foreign Born, Citizen | 56 (100.0%) | 0 (0.0%) |
| Foreign Born, not a Citizen | 62 (100.0%) | 0 (0.0%) |
Health Insurance Coverage by Household Income in Dry Prong
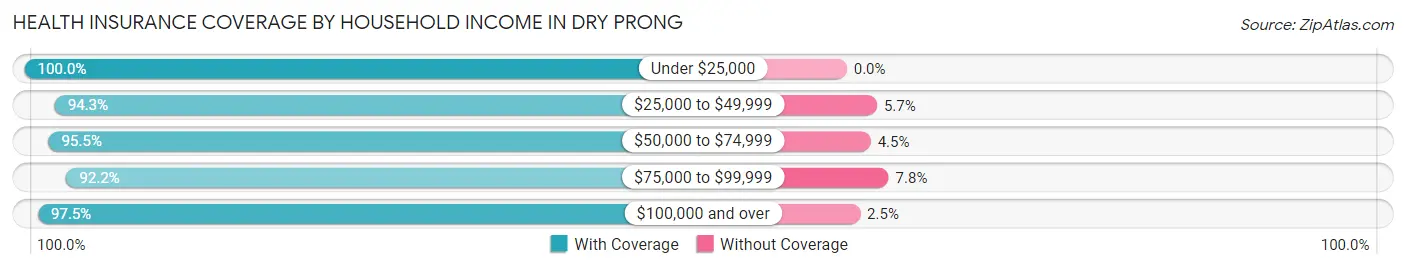
| Household Income | With Coverage | Without Coverage |
| Under $25,000 | 57 (100.0%) | 0 (0.0%) |
| $25,000 to $49,999 | 50 (94.3%) | 3 (5.7%) |
| $50,000 to $74,999 | 64 (95.5%) | 3 (4.5%) |
| $75,000 to $99,999 | 47 (92.2%) | 4 (7.8%) |
| $100,000 and over | 195 (97.5%) | 5 (2.5%) |
Public vs Private Health Insurance Coverage by Age in Dry Prong
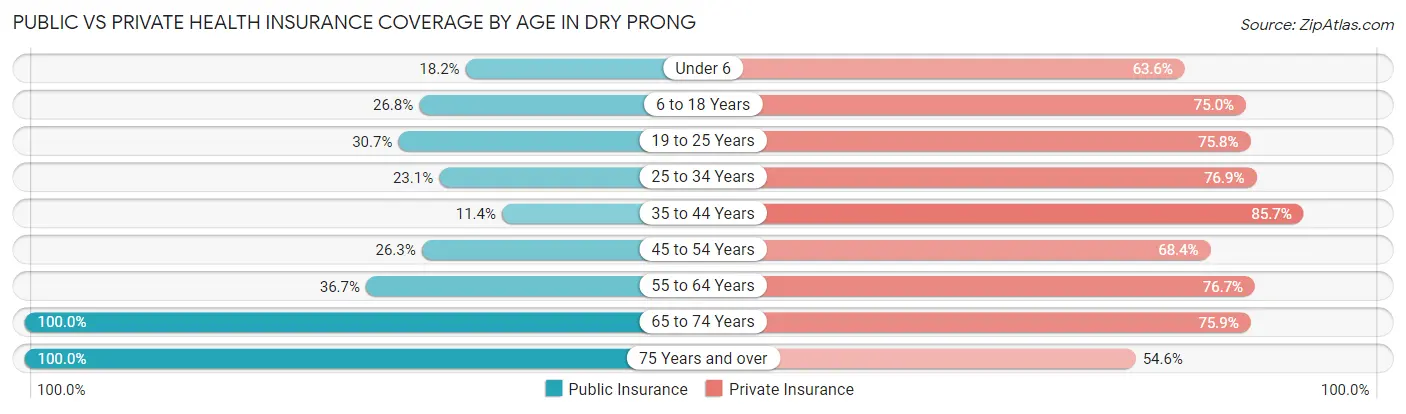
| Age Bracket | Public Insurance | Private Insurance |
| Under 6 | 2 (18.2%) | 7 (63.6%) |
| 6 to 18 Years | 15 (26.8%) | 42 (75.0%) |
| 19 to 25 Years | 19 (30.6%) | 47 (75.8%) |
| 25 to 34 Years | 6 (23.1%) | 20 (76.9%) |
| 35 to 44 Years | 4 (11.4%) | 30 (85.7%) |
| 45 to 54 Years | 20 (26.3%) | 52 (68.4%) |
| 55 to 64 Years | 22 (36.7%) | 46 (76.7%) |
| 65 to 74 Years | 58 (100.0%) | 44 (75.9%) |
| 75 Years and over | 44 (100.0%) | 24 (54.5%) |
| Total | 190 (44.4%) | 312 (72.9%) |
Disability Status by Sex by Age in Dry Prong
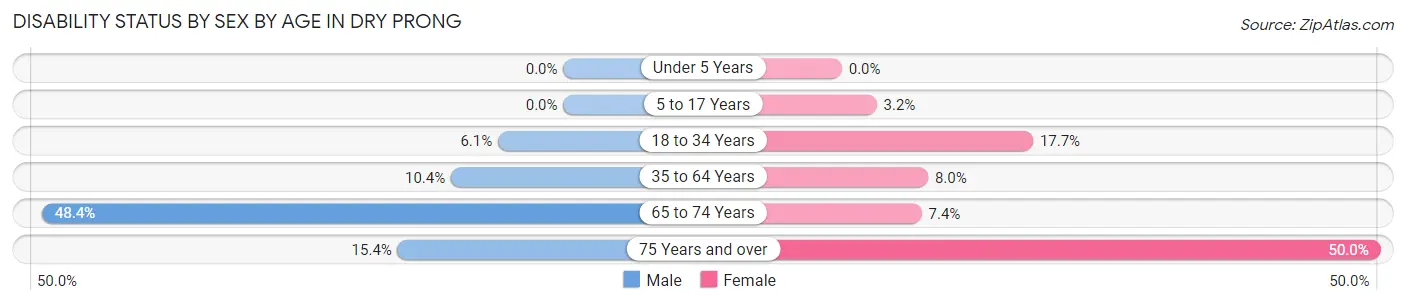
| Age Bracket | Male | Female |
| Under 5 Years | 0 (0.0%) | 0 (0.0%) |
| 5 to 17 Years | 0 (0.0%) | 1 (3.2%) |
| 18 to 34 Years | 2 (6.1%) | 11 (17.7%) |
| 35 to 64 Years | 10 (10.4%) | 6 (8.0%) |
| 65 to 74 Years | 15 (48.4%) | 2 (7.4%) |
| 75 Years and over | 4 (15.4%) | 9 (50.0%) |
Disability Class by Sex by Age in Dry Prong
Disability Class: Hearing Difficulty
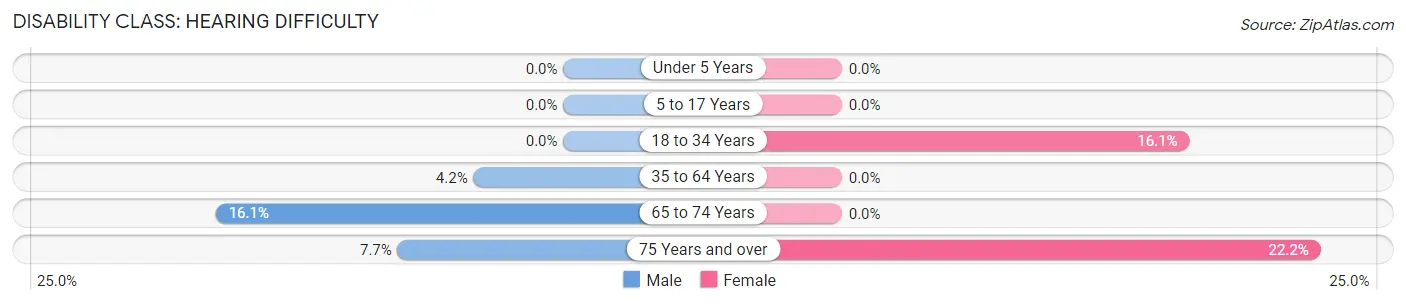
| Age Bracket | Male | Female |
| Under 5 Years | 0 (0.0%) | 0 (0.0%) |
| 5 to 17 Years | 0 (0.0%) | 0 (0.0%) |
| 18 to 34 Years | 0 (0.0%) | 10 (16.1%) |
| 35 to 64 Years | 4 (4.2%) | 0 (0.0%) |
| 65 to 74 Years | 5 (16.1%) | 0 (0.0%) |
| 75 Years and over | 2 (7.7%) | 4 (22.2%) |
Disability Class: Vision Difficulty
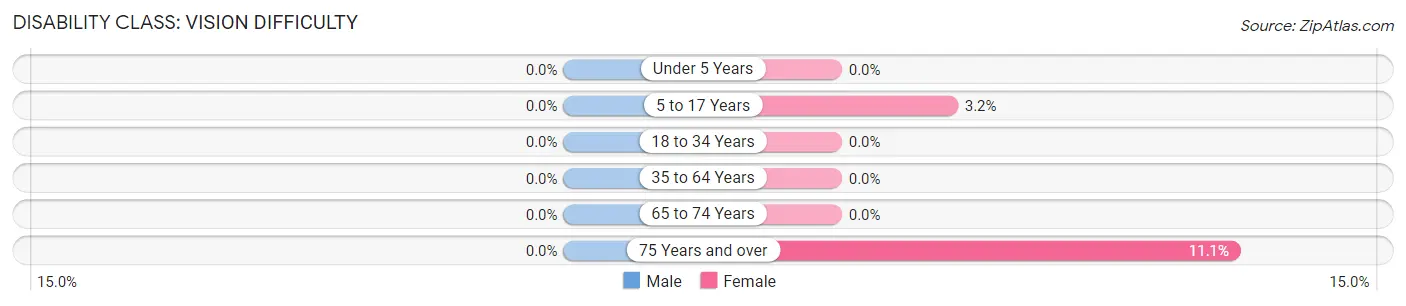
| Age Bracket | Male | Female |
| Under 5 Years | 0 (0.0%) | 0 (0.0%) |
| 5 to 17 Years | 0 (0.0%) | 1 (3.2%) |
| 18 to 34 Years | 0 (0.0%) | 0 (0.0%) |
| 35 to 64 Years | 0 (0.0%) | 0 (0.0%) |
| 65 to 74 Years | 0 (0.0%) | 0 (0.0%) |
| 75 Years and over | 0 (0.0%) | 2 (11.1%) |
Disability Class: Cognitive Difficulty
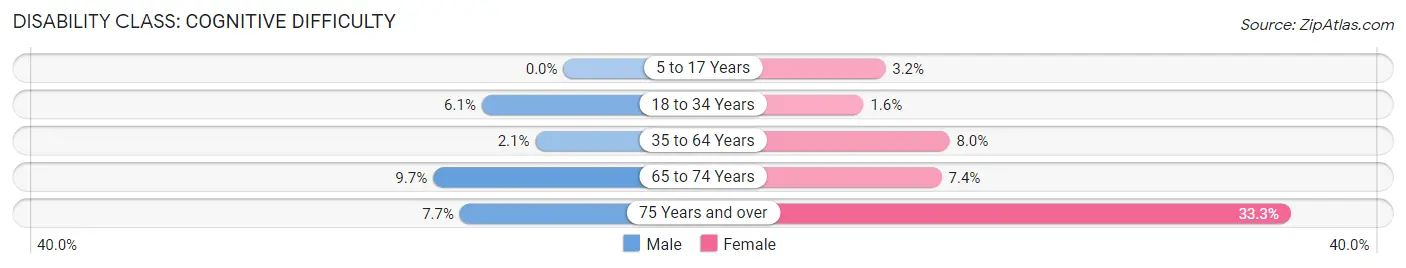
| Age Bracket | Male | Female |
| 5 to 17 Years | 0 (0.0%) | 1 (3.2%) |
| 18 to 34 Years | 2 (6.1%) | 1 (1.6%) |
| 35 to 64 Years | 2 (2.1%) | 6 (8.0%) |
| 65 to 74 Years | 3 (9.7%) | 2 (7.4%) |
| 75 Years and over | 2 (7.7%) | 6 (33.3%) |
Disability Class: Ambulatory Difficulty
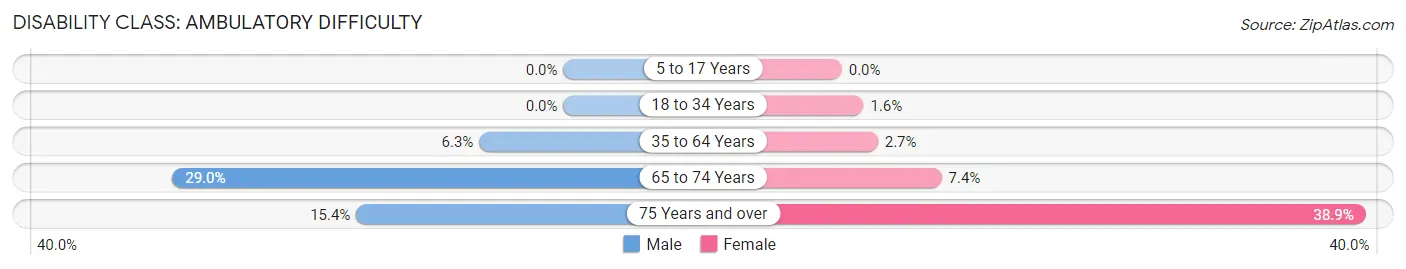
| Age Bracket | Male | Female |
| 5 to 17 Years | 0 (0.0%) | 0 (0.0%) |
| 18 to 34 Years | 0 (0.0%) | 1 (1.6%) |
| 35 to 64 Years | 6 (6.2%) | 2 (2.7%) |
| 65 to 74 Years | 9 (29.0%) | 2 (7.4%) |
| 75 Years and over | 4 (15.4%) | 7 (38.9%) |
Disability Class: Self-Care Difficulty
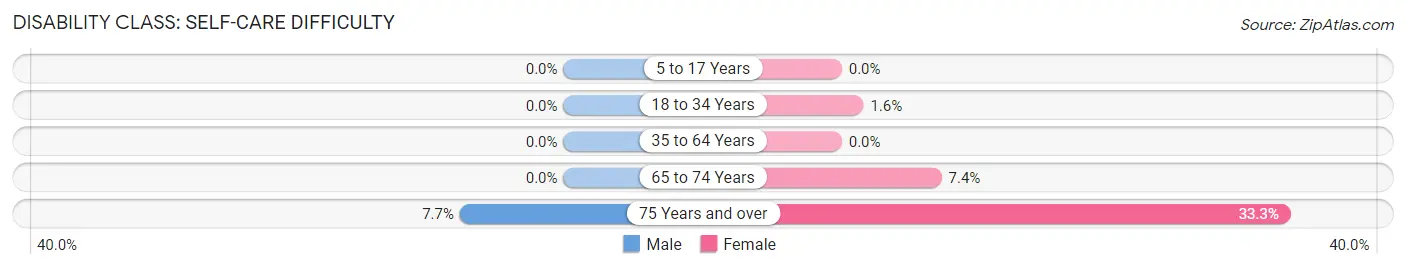
| Age Bracket | Male | Female |
| 5 to 17 Years | 0 (0.0%) | 0 (0.0%) |
| 18 to 34 Years | 0 (0.0%) | 1 (1.6%) |
| 35 to 64 Years | 0 (0.0%) | 0 (0.0%) |
| 65 to 74 Years | 0 (0.0%) | 2 (7.4%) |
| 75 Years and over | 2 (7.7%) | 6 (33.3%) |
Technology Access in Dry Prong
Computing Device Access in Dry Prong
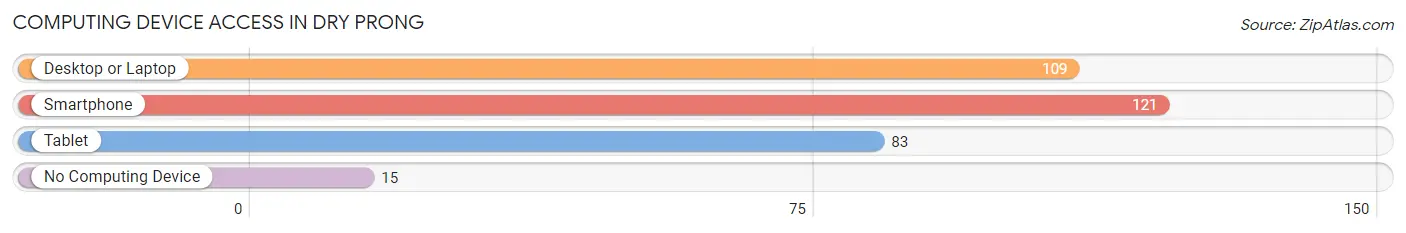
| Device Type | # Households | % Households |
| Desktop or Laptop | 109 | 69.0% |
| Smartphone | 121 | 76.6% |
| Tablet | 83 | 52.5% |
| No Computing Device | 15 | 9.5% |
| Total | 158 | 100.0% |
Internet Access in Dry Prong
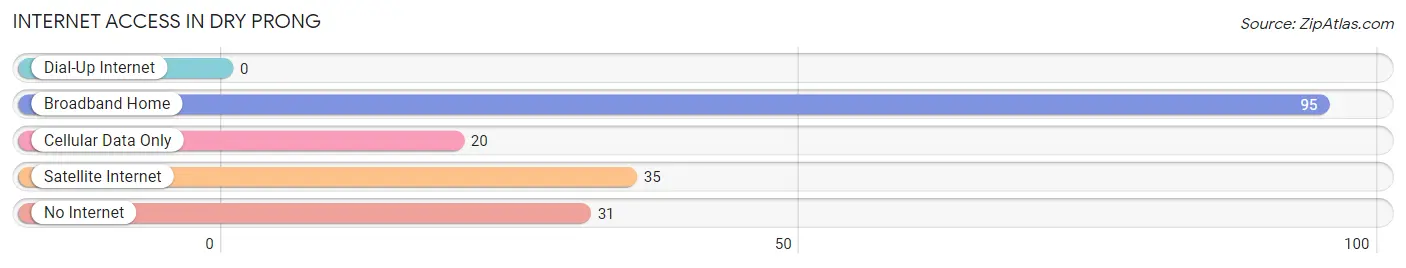
| Internet Type | # Households | % Households |
| Dial-Up Internet | 0 | 0.0% |
| Broadband Home | 95 | 60.1% |
| Cellular Data Only | 20 | 12.7% |
| Satellite Internet | 35 | 22.2% |
| No Internet | 31 | 19.6% |
| Total | 158 | 100.0% |
Dry Prong Summary
Dry Prong is a small town located in Grant Parish, Louisiana. It is situated in the northern part of the state, about 30 miles south of Alexandria. The town has a population of 1,845 people, according to the 2010 census.
Geography
Dry Prong is located in the northern part of Grant Parish, Louisiana. It is situated in the Kisatchie National Forest, which is the largest national forest in the state. The town is located on the banks of the Red River, which is a major tributary of the Mississippi River. The town is surrounded by rolling hills and forests, and is home to a variety of wildlife.
The climate in Dry Prong is humid subtropical, with hot summers and mild winters. The average annual temperature is around 70 degrees Fahrenheit. The town receives an average of 48 inches of rain per year, and the average snowfall is around 2 inches.
Economy
Dry Prong’s economy is largely based on agriculture and forestry. The town is home to several farms, which produce a variety of crops, including corn, soybeans, cotton, and wheat. The town is also home to several lumber mills, which produce lumber for the local market.
The town is also home to several small businesses, including restaurants, convenience stores, and gas stations. The town is also home to a few manufacturing plants, which produce a variety of products, including furniture, clothing, and electronics.
Demographics
As of the 2010 census, the population of Dry Prong was 1,845 people. The racial makeup of the town was 95.3% White, 0.7% African American, 0.3% Native American, 0.2% Asian, 0.1% Pacific Islander, and 3.4% from other races. The median household income was $30,938, and the median family income was $37,813.
The town is home to a variety of religious denominations, including Baptist, Methodist, Catholic, and Presbyterian. The town is also home to a variety of cultural events, including the annual Dry Prong Festival, which is held in the summer.
Conclusion
Dry Prong is a small town located in Grant Parish, Louisiana. It is situated in the northern part of the state, about 30 miles south of Alexandria. The town has a population of 1,845 people, according to the 2010 census. The town’s economy is largely based on agriculture and forestry, and it is home to several small businesses. The town is also home to a variety of religious denominations, and it is home to a variety of cultural events, including the annual Dry Prong Festival.
Common Questions
What is Per Capita Income in Dry Prong?
Per Capita income in Dry Prong is $33,754.
What is the Median Family Income in Dry Prong?
Median Family Income in Dry Prong is $86,875.
What is the Median Household income in Dry Prong?
Median Household Income in Dry Prong is $65,781.
What is Income or Wage Gap in Dry Prong?
Income or Wage Gap in Dry Prong is 44.5%.
Women in Dry Prong earn 55.5 cents for every dollar earned by a man.
What is Inequality or Gini Index in Dry Prong?
Inequality or Gini Index in Dry Prong is 0.42.
What is the Total Population of Dry Prong?
Total Population of Dry Prong is 428.
What is the Total Male Population of Dry Prong?
Total Male Population of Dry Prong is 209.
What is the Total Female Population of Dry Prong?
Total Female Population of Dry Prong is 219.
What is the Ratio of Males per 100 Females in Dry Prong?
There are 95.43 Males per 100 Females in Dry Prong.
What is the Ratio of Females per 100 Males in Dry Prong?
There are 104.78 Females per 100 Males in Dry Prong.
What is the Median Population Age in Dry Prong?
Median Population Age in Dry Prong is 49.0 Years.
What is the Average Family Size in Dry Prong
Average Family Size in Dry Prong is 3.5 People.
What is the Average Household Size in Dry Prong
Average Household Size in Dry Prong is 2.7 People.
How Large is the Labor Force in Dry Prong?
There are 218 People in the Labor Forcein in Dry Prong.
What is the Percentage of People in the Labor Force in Dry Prong?
57.8% of People are in the Labor Force in Dry Prong.