Downsville, LA Map & Demographics
Downsville Map
Downsville Overview
$44,753
PER CAPITA INCOME
$130,313
AVG FAMILY INCOME
$128,750
AVG HOUSEHOLD INCOME
68.0%
WAGE / INCOME GAP [ % ]
32.0¢/ $1
WAGE / INCOME GAP [ $ ]
0.33
INEQUALITY / GINI INDEX
116
TOTAL POPULATION
47
MALE POPULATION
69
FEMALE POPULATION
68.12
MALES / 100 FEMALES
146.81
FEMALES / 100 MALES
45.7
MEDIAN AGE
3.1
AVG FAMILY SIZE
2.8
AVG HOUSEHOLD SIZE
66
LABOR FORCE [ PEOPLE ]
70.2%
PERCENT IN LABOR FORCE
1.5%
UNEMPLOYMENT RATE
Downsville Zip Codes
Downsville Area Codes
Income in Downsville
Income Overview in Downsville
Per Capita Income in Downsville is $44,753, while median incomes of families and households are $130,313 and $128,750 respectively.
| Characteristic | Number | Measure |
| Per Capita Income | 116 | $44,753 |
| Median Family Income | 36 | $130,313 |
| Mean Family Income | 36 | $116,992 |
| Median Household Income | 42 | $128,750 |
| Mean Household Income | 42 | $116,943 |
| Income Deficit | 36 | $0 |
| Wage / Income Gap (%) | 116 | 68.00% |
| Wage / Income Gap ($) | 116 | 32.00¢ per $1 |
| Gini / Inequality Index | 116 | 0.33 |
Earnings by Sex in Downsville
Average Earnings in Downsville are $58,750, $115,625 for men and $37,000 for women, a difference of 68.0%.
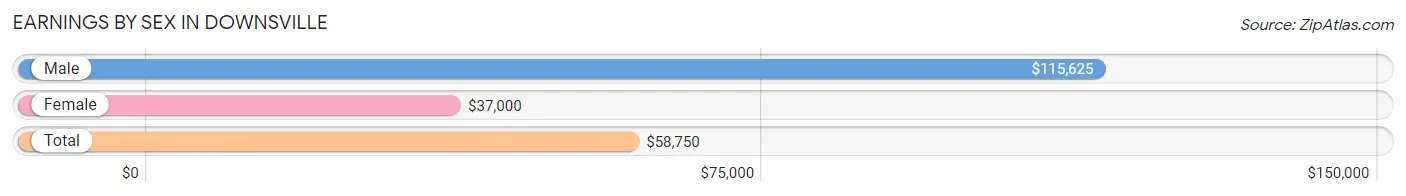
| Sex | Number | Average Earnings |
| Male | 34 (51.5%) | $115,625 |
| Female | 32 (48.5%) | $37,000 |
| Total | 66 (100.0%) | $58,750 |
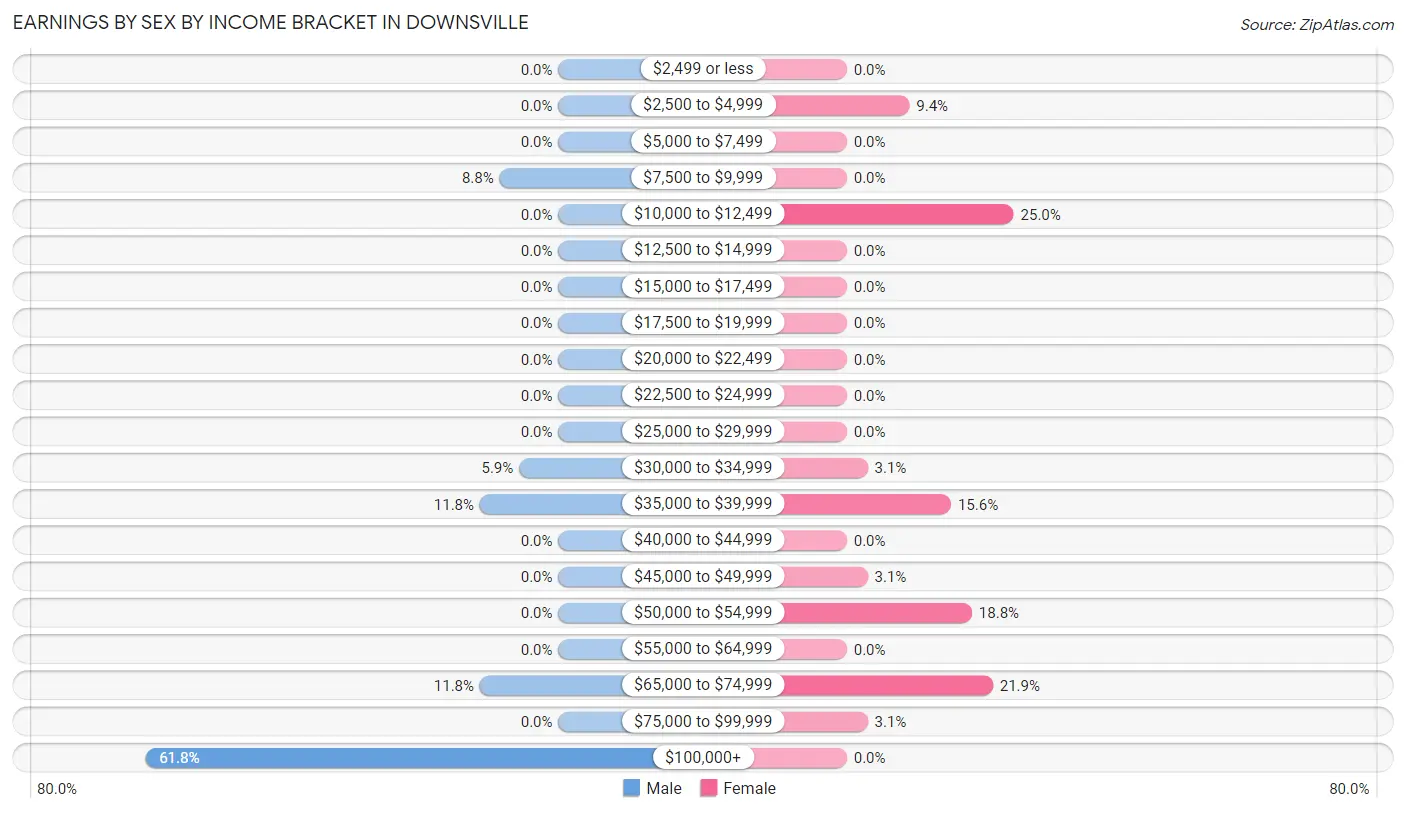
Earnings by Sex by Income Bracket in Downsville
The most common earnings brackets in Downsville are $100,000+ for men (21 | 61.8%) and $10,000 to $12,499 for women (8 | 25.0%).
| Income | Male | Female |
| $2,499 or less | 0 (0.0%) | 0 (0.0%) |
| $2,500 to $4,999 | 0 (0.0%) | 3 (9.4%) |
| $5,000 to $7,499 | 0 (0.0%) | 0 (0.0%) |
| $7,500 to $9,999 | 3 (8.8%) | 0 (0.0%) |
| $10,000 to $12,499 | 0 (0.0%) | 8 (25.0%) |
| $12,500 to $14,999 | 0 (0.0%) | 0 (0.0%) |
| $15,000 to $17,499 | 0 (0.0%) | 0 (0.0%) |
| $17,500 to $19,999 | 0 (0.0%) | 0 (0.0%) |
| $20,000 to $22,499 | 0 (0.0%) | 0 (0.0%) |
| $22,500 to $24,999 | 0 (0.0%) | 0 (0.0%) |
| $25,000 to $29,999 | 0 (0.0%) | 0 (0.0%) |
| $30,000 to $34,999 | 2 (5.9%) | 1 (3.1%) |
| $35,000 to $39,999 | 4 (11.8%) | 5 (15.6%) |
| $40,000 to $44,999 | 0 (0.0%) | 0 (0.0%) |
| $45,000 to $49,999 | 0 (0.0%) | 1 (3.1%) |
| $50,000 to $54,999 | 0 (0.0%) | 6 (18.8%) |
| $55,000 to $64,999 | 0 (0.0%) | 0 (0.0%) |
| $65,000 to $74,999 | 4 (11.8%) | 7 (21.9%) |
| $75,000 to $99,999 | 0 (0.0%) | 1 (3.1%) |
| $100,000+ | 21 (61.8%) | 0 (0.0%) |
| Total | 34 (100.0%) | 32 (100.0%) |
Earnings by Sex by Educational Attainment in Downsville
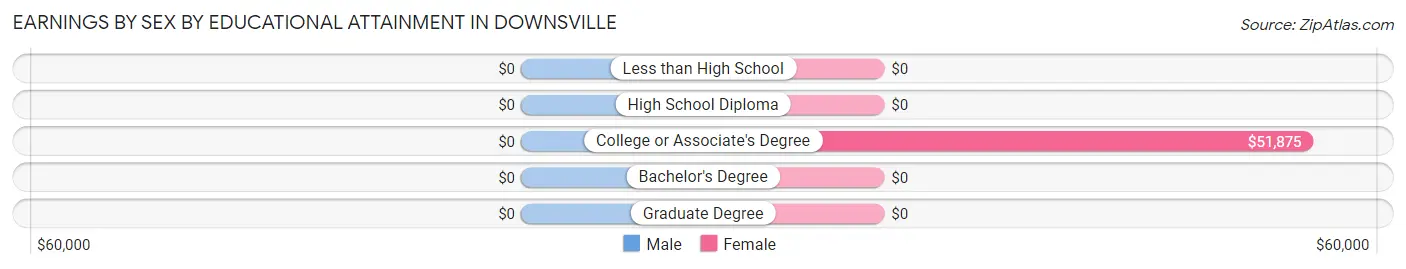
| Educational Attainment | Male Income | Female Income |
| Less than High School | - | - |
| High School Diploma | - | - |
| College or Associate's Degree | - | - |
| Bachelor's Degree | - | - |
| Graduate Degree | - | - |
| Total | $115,938 | $46,250 |
Family Income in Downsville
Family Income Brackets in Downsville
According to the Downsville family income data, there are 14 families falling into the $100,000 to $149,999 income range, which is the most common income bracket and makes up 38.9% of all families.
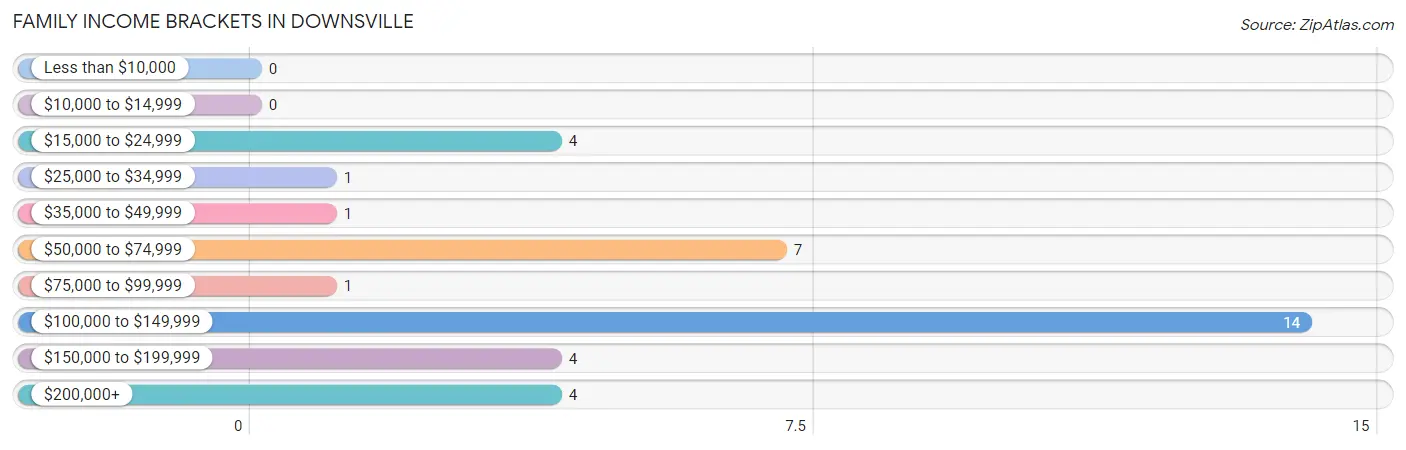
| Income Bracket | # Families | % Families |
| Less than $10,000 | 0 | 0.0% |
| $10,000 to $14,999 | 0 | 0.0% |
| $15,000 to $24,999 | 4 | 11.1% |
| $25,000 to $34,999 | 1 | 2.8% |
| $35,000 to $49,999 | 1 | 2.8% |
| $50,000 to $74,999 | 7 | 19.4% |
| $75,000 to $99,999 | 1 | 2.8% |
| $100,000 to $149,999 | 14 | 38.9% |
| $150,000 to $199,999 | 4 | 11.1% |
| $200,000+ | 4 | 11.1% |
Family Income by Famaliy Size in Downsville
2-person families (18 | 50.0%) account for the highest median family income in Downsville with $130,938 per family, while 2-person families (18 | 50.0%) have the highest median income of $65,469 per family member.
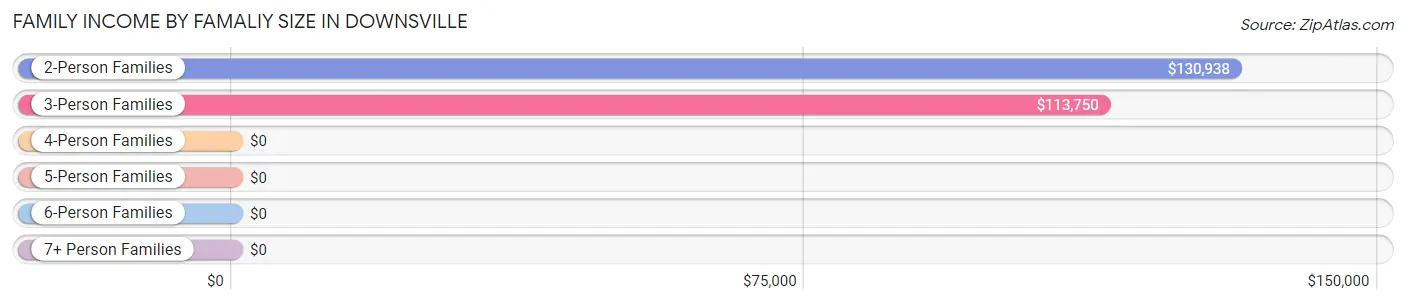
| Income Bracket | # Families | Median Income |
| 2-Person Families | 18 (50.0%) | $130,938 |
| 3-Person Families | 9 (25.0%) | $113,750 |
| 4-Person Families | 8 (22.2%) | $0 |
| 5-Person Families | 1 (2.8%) | $0 |
| 6-Person Families | 0 (0.0%) | $0 |
| 7+ Person Families | 0 (0.0%) | $0 |
| Total | 36 (100.0%) | $130,313 |
Family Income by Number of Earners in Downsville
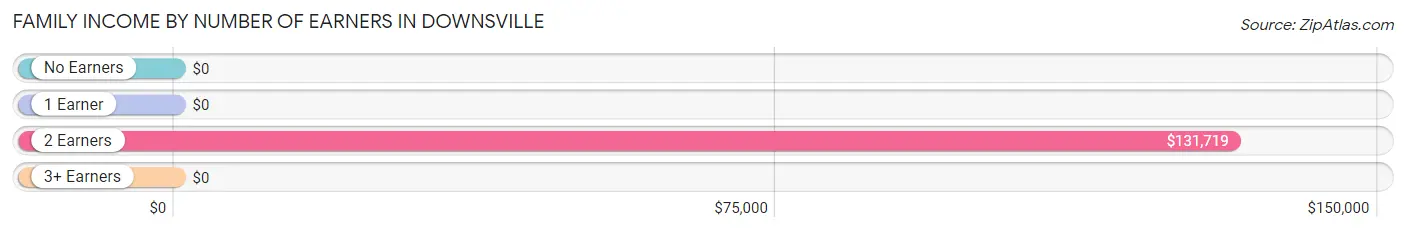
| Number of Earners | # Families | Median Income |
| No Earners | 4 (11.1%) | $0 |
| 1 Earner | 8 (22.2%) | $0 |
| 2 Earners | 21 (58.3%) | $131,719 |
| 3+ Earners | 3 (8.3%) | $0 |
| Total | 36 (100.0%) | $130,313 |
Household Income in Downsville
Household Income Brackets in Downsville
With 15 households falling in the category, the $100,000 to $149,999 income range is the most frequent in Downsville, accounting for 35.7% of all households.
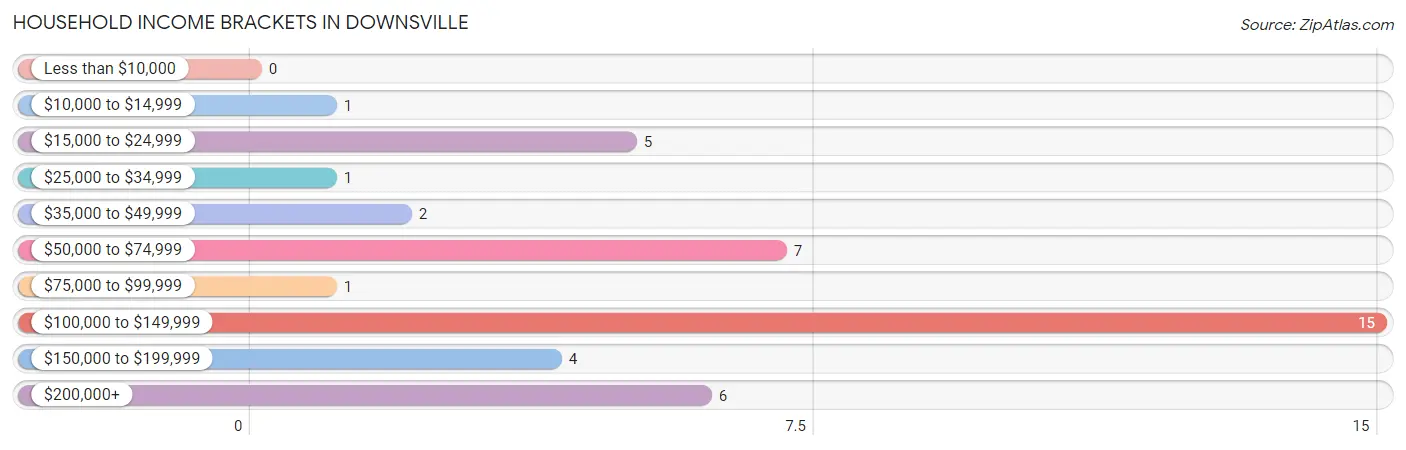
| Income Bracket | # Households | % Households |
| Less than $10,000 | 0 | 0.0% |
| $10,000 to $14,999 | 1 | 2.4% |
| $15,000 to $24,999 | 5 | 11.9% |
| $25,000 to $34,999 | 1 | 2.4% |
| $35,000 to $49,999 | 2 | 4.8% |
| $50,000 to $74,999 | 7 | 16.7% |
| $75,000 to $99,999 | 1 | 2.4% |
| $100,000 to $149,999 | 15 | 35.7% |
| $150,000 to $199,999 | 4 | 9.5% |
| $200,000+ | 6 | 14.3% |
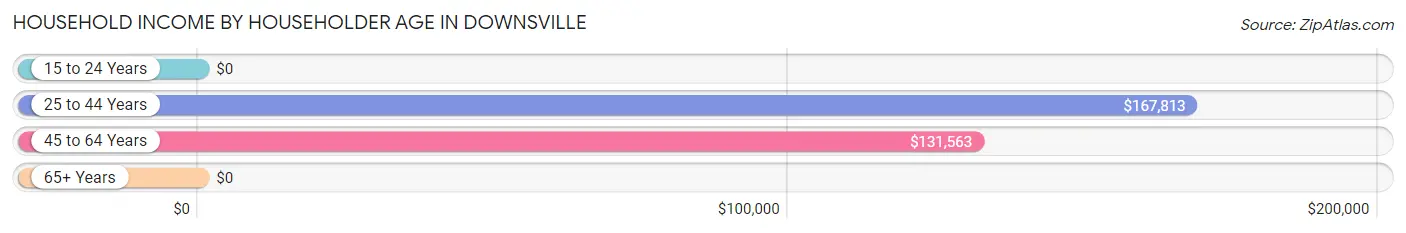
Household Income by Householder Age in Downsville
The median household income in Downsville is $128,750, with the highest median household income of $167,813 found in the 25 to 44 years age bracket for the primary householder. A total of 7 households (16.7%) fall into this category. Meanwhile, the 15 to 24 years age bracket for the primary householder has the lowest median household income of $0, with 5 households (11.9%) in this group.
| Income Bracket | # Households | Median Income |
| 15 to 24 Years | 5 (11.9%) | $0 |
| 25 to 44 Years | 7 (16.7%) | $167,813 |
| 45 to 64 Years | 20 (47.6%) | $131,563 |
| 65+ Years | 10 (23.8%) | $0 |
| Total | 42 (100.0%) | $128,750 |
Poverty in Downsville
Income Below Poverty by Sex and Age in Downsville
With 17.0% poverty level for males and 18.8% for females among the residents of Downsville, under 5 year old males and under 5 year old females are the most vulnerable to poverty, with 4 males (100.0%) and 3 females (75.0%) in their respective age groups living below the poverty level.
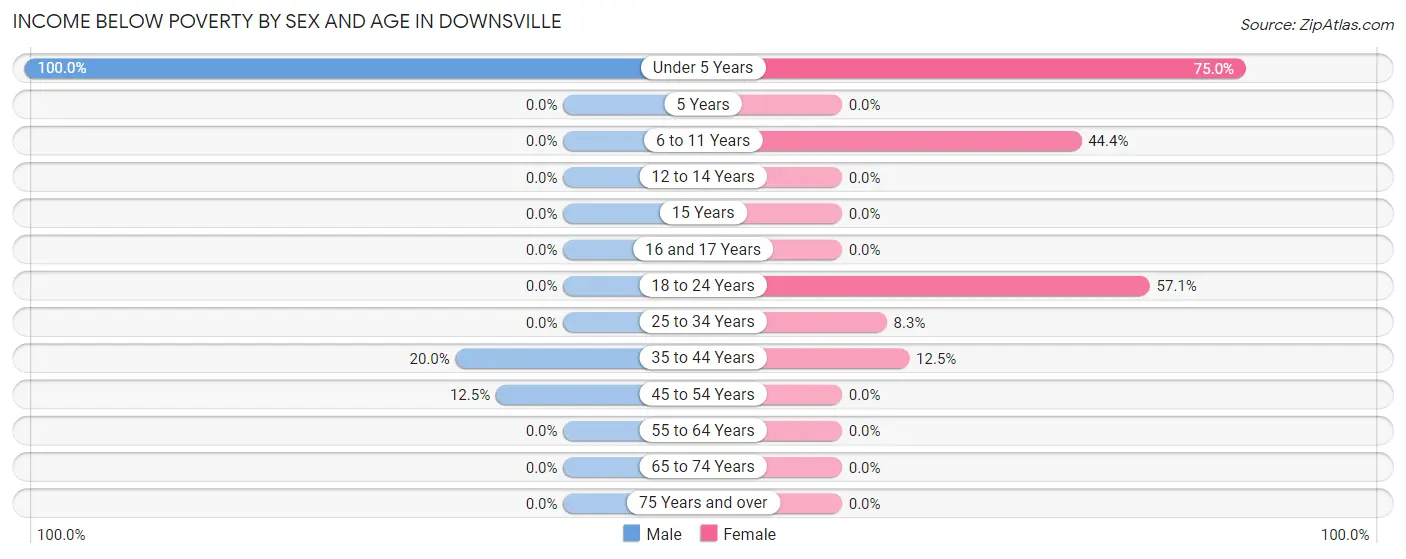
| Age Bracket | Male | Female |
| Under 5 Years | 4 (100.0%) | 3 (75.0%) |
| 5 Years | 0 (0.0%) | 0 (0.0%) |
| 6 to 11 Years | 0 (0.0%) | 4 (44.4%) |
| 12 to 14 Years | 0 (0.0%) | 0 (0.0%) |
| 15 Years | 0 (0.0%) | 0 (0.0%) |
| 16 and 17 Years | 0 (0.0%) | 0 (0.0%) |
| 18 to 24 Years | 0 (0.0%) | 4 (57.1%) |
| 25 to 34 Years | 0 (0.0%) | 1 (8.3%) |
| 35 to 44 Years | 1 (20.0%) | 1 (12.5%) |
| 45 to 54 Years | 3 (12.5%) | 0 (0.0%) |
| 55 to 64 Years | 0 (0.0%) | 0 (0.0%) |
| 65 to 74 Years | 0 (0.0%) | 0 (0.0%) |
| 75 Years and over | 0 (0.0%) | 0 (0.0%) |
| Total | 8 (17.0%) | 13 (18.8%) |
Income Above Poverty by Sex and Age in Downsville
According to the poverty statistics in Downsville, males aged 12 to 14 years and females aged 12 to 14 years are the age groups that are most secure financially, with 100.0% of males and 100.0% of females in these age groups living above the poverty line.
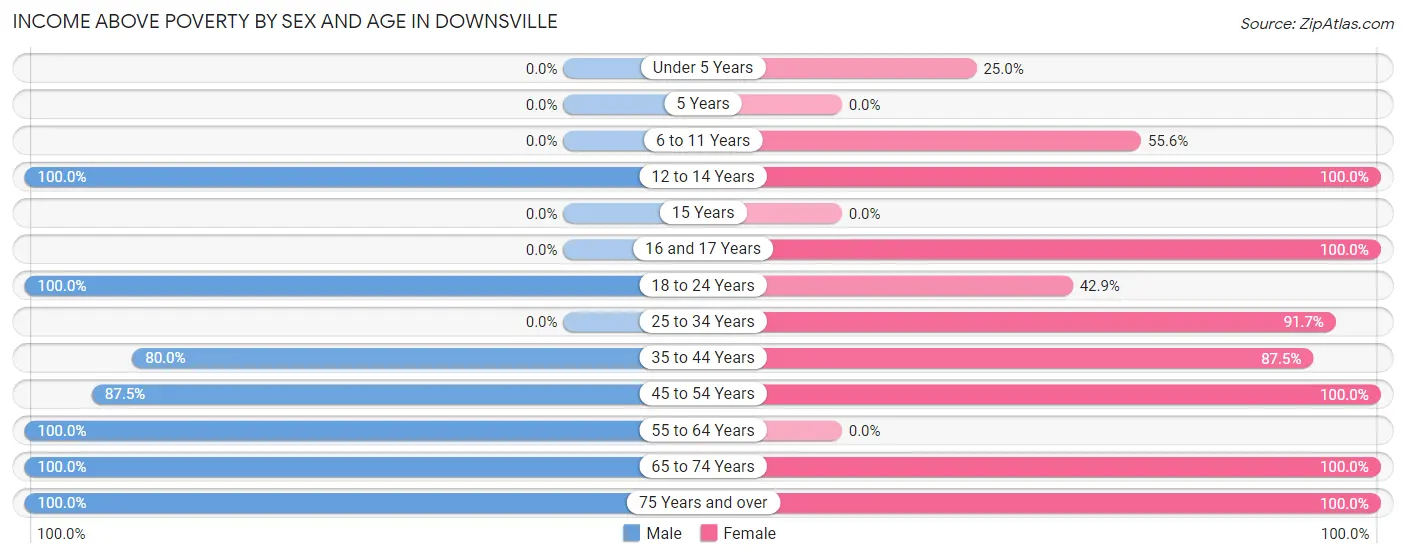
| Age Bracket | Male | Female |
| Under 5 Years | 0 (0.0%) | 1 (25.0%) |
| 5 Years | 0 (0.0%) | 0 (0.0%) |
| 6 to 11 Years | 0 (0.0%) | 5 (55.6%) |
| 12 to 14 Years | 4 (100.0%) | 1 (100.0%) |
| 15 Years | 0 (0.0%) | 0 (0.0%) |
| 16 and 17 Years | 0 (0.0%) | 1 (100.0%) |
| 18 to 24 Years | 1 (100.0%) | 3 (42.9%) |
| 25 to 34 Years | 0 (0.0%) | 11 (91.7%) |
| 35 to 44 Years | 4 (80.0%) | 7 (87.5%) |
| 45 to 54 Years | 21 (87.5%) | 21 (100.0%) |
| 55 to 64 Years | 3 (100.0%) | 0 (0.0%) |
| 65 to 74 Years | 3 (100.0%) | 2 (100.0%) |
| 75 Years and over | 3 (100.0%) | 4 (100.0%) |
| Total | 39 (83.0%) | 56 (81.2%) |
Income Below Poverty Among Married-Couple Families in Downsville
The poverty statistics for married-couple families in Downsville show that 14.7% or 5 of the total 34 families live below the poverty line. Families with 3 or 4 children have the highest poverty rate of 100.0%, comprising of 1 families. On the other hand, families with no children have the lowest poverty rate of 0.0%, which includes 0 families.
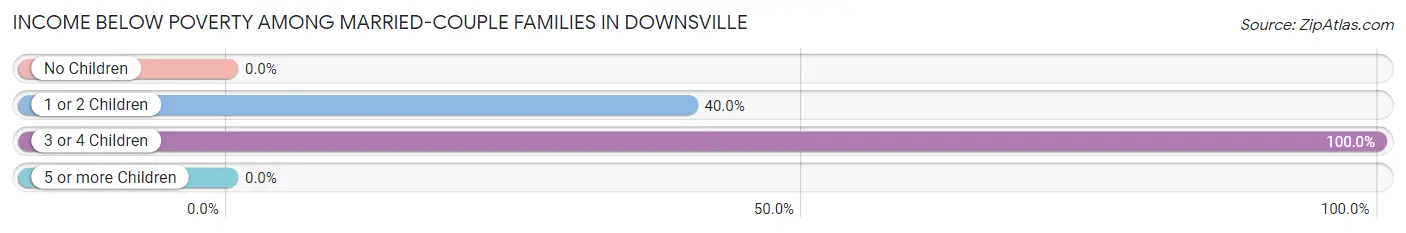
| Children | Above Poverty | Below Poverty |
| No Children | 23 (100.0%) | 0 (0.0%) |
| 1 or 2 Children | 6 (60.0%) | 4 (40.0%) |
| 3 or 4 Children | 0 (0.0%) | 1 (100.0%) |
| 5 or more Children | 0 (0.0%) | 0 (0.0%) |
| Total | 29 (85.3%) | 5 (14.7%) |
Income Below Poverty Among Single-Parent Households in Downsville
| Children | Single Father | Single Mother |
| No Children | 0 (0.0%) | 0 (0.0%) |
| 1 or 2 Children | 0 (0.0%) | 0 (0.0%) |
| 3 or 4 Children | 0 (0.0%) | 0 (0.0%) |
| 5 or more Children | 0 (0.0%) | 0 (0.0%) |
| Total | 0 (0.0%) | 0 (0.0%) |
Income Below Poverty Among Married-Couple vs Single-Parent Households in Downsville
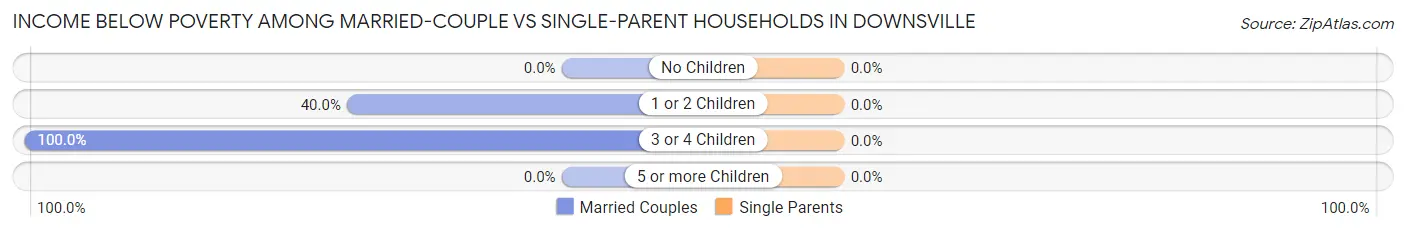
| Children | Married-Couple Families | Single-Parent Households |
| No Children | 0 (0.0%) | 0 (0.0%) |
| 1 or 2 Children | 4 (40.0%) | 0 (0.0%) |
| 3 or 4 Children | 1 (100.0%) | 0 (0.0%) |
| 5 or more Children | 0 (0.0%) | 0 (0.0%) |
| Total | 5 (14.7%) | 0 (0.0%) |
Race in Downsville
The most populous races in Downsville are White / Caucasian (91 | 78.4%), Two or more Races (19 | 16.4%), and Hispanic or Latino (7 | 6.0%).
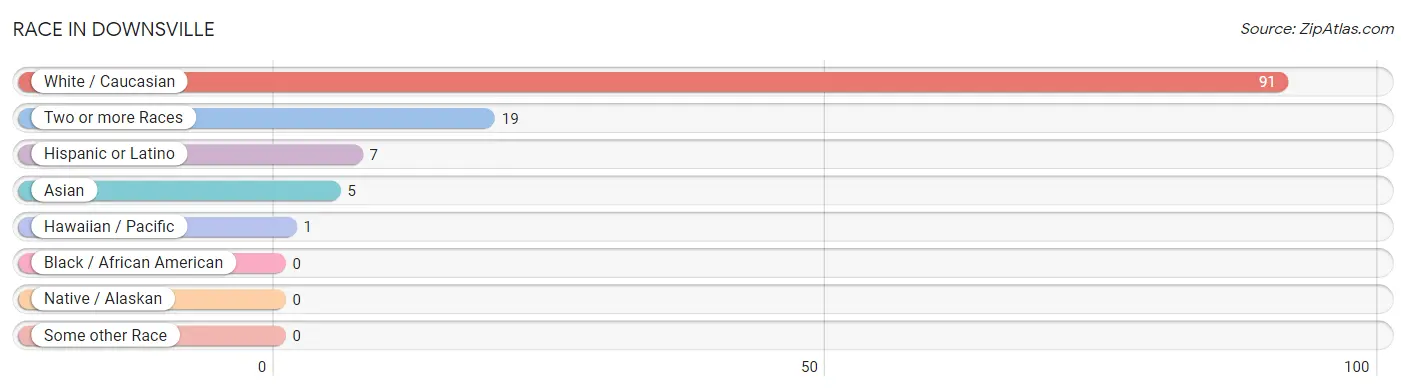
| Race | # Population | % Population |
| Asian | 5 | 4.3% |
| Black / African American | 0 | 0.0% |
| Hawaiian / Pacific | 1 | 0.9% |
| Hispanic or Latino | 7 | 6.0% |
| Native / Alaskan | 0 | 0.0% |
| White / Caucasian | 91 | 78.4% |
| Two or more Races | 19 | 16.4% |
| Some other Race | 0 | 0.0% |
| Total | 116 | 100.0% |
Ancestry in Downsville
The most populous ancestries reported in Downsville are English (46 | 39.7%), Irish (14 | 12.1%), British (10 | 8.6%), Indian (Asian) (10 | 8.6%), and American (9 | 7.8%), together accounting for 76.7% of all Downsville residents.
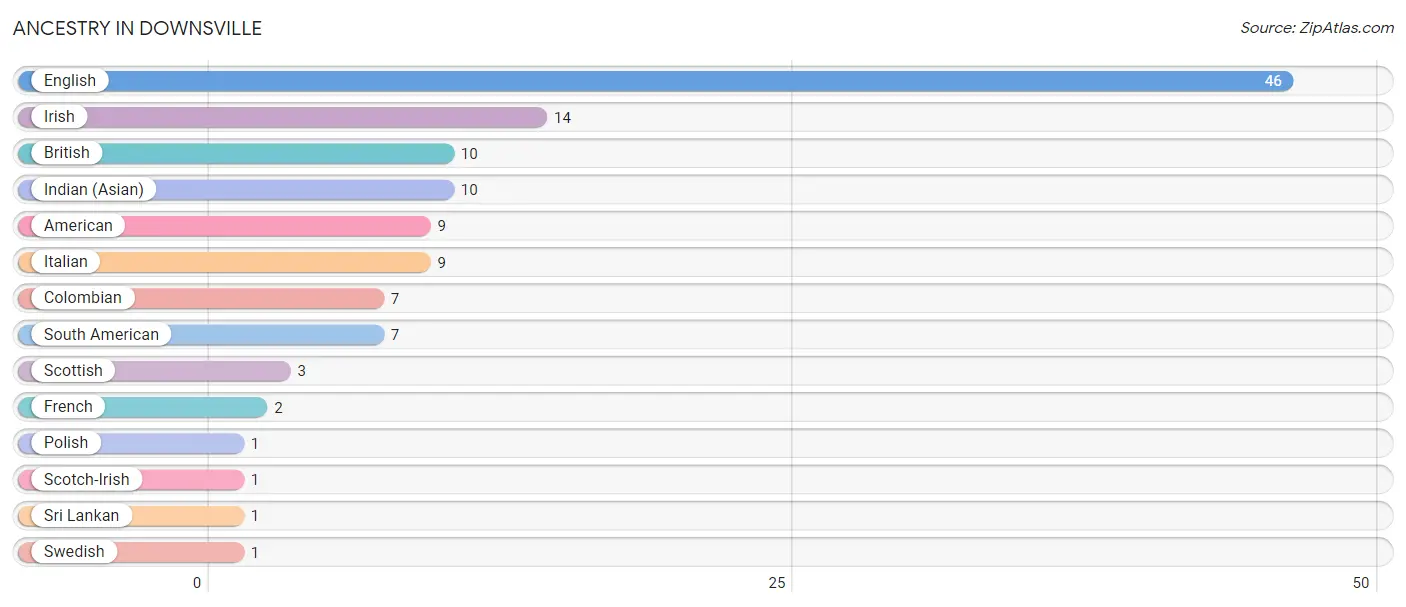
| Ancestry | # Population | % Population |
| American | 9 | 7.8% |
| British | 10 | 8.6% |
| Colombian | 7 | 6.0% |
| English | 46 | 39.7% |
| French | 2 | 1.7% |
| Indian (Asian) | 10 | 8.6% |
| Irish | 14 | 12.1% |
| Italian | 9 | 7.8% |
| Polish | 1 | 0.9% |
| Scotch-Irish | 1 | 0.9% |
| Scottish | 3 | 2.6% |
| South American | 7 | 6.0% |
| Sri Lankan | 1 | 0.9% |
| Swedish | 1 | 0.9% | View All 14 Rows |
Immigrants in Downsville
The most numerous immigrant groups reported in Downsville came from Latin America (7 | 6.0%), Asia (5 | 4.3%), Caribbean (4 | 3.5%), China (4 | 3.5%), and Dominican Republic (4 | 3.5%), together accounting for 20.7% of all Downsville residents.
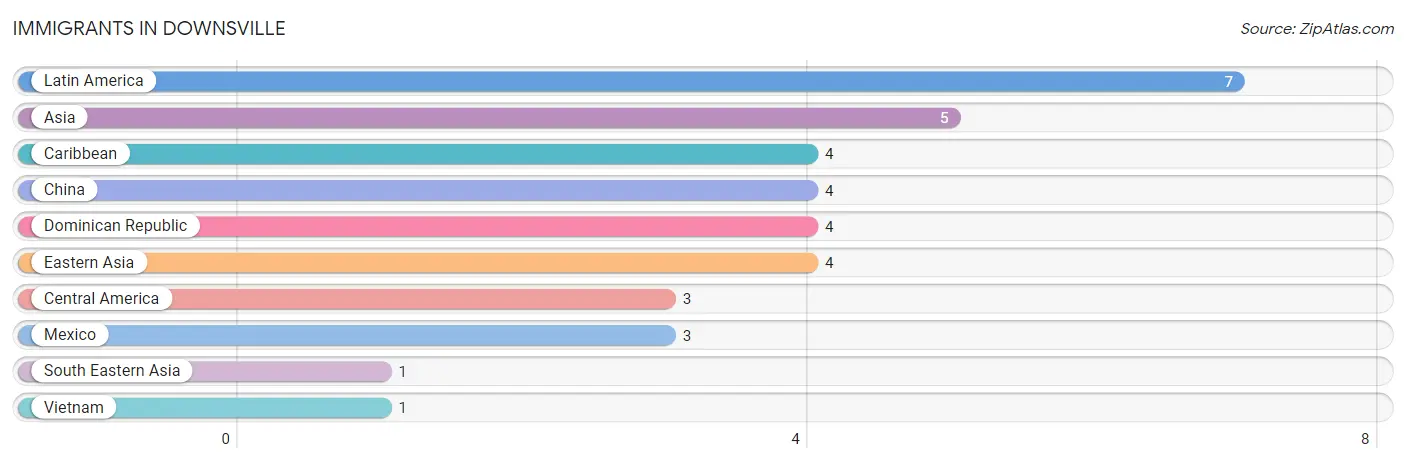
| Immigration Origin | # Population | % Population |
| Asia | 5 | 4.3% |
| Caribbean | 4 | 3.5% |
| Central America | 3 | 2.6% |
| China | 4 | 3.5% |
| Dominican Republic | 4 | 3.5% |
| Eastern Asia | 4 | 3.5% |
| Latin America | 7 | 6.0% |
| Mexico | 3 | 2.6% |
| South Eastern Asia | 1 | 0.9% |
| Vietnam | 1 | 0.9% | View All 10 Rows |
Sex and Age in Downsville
Sex and Age in Downsville
The most populous age groups in Downsville are 45 to 49 Years (14 | 29.8%) for men and 45 to 49 Years (15 | 21.7%) for women.
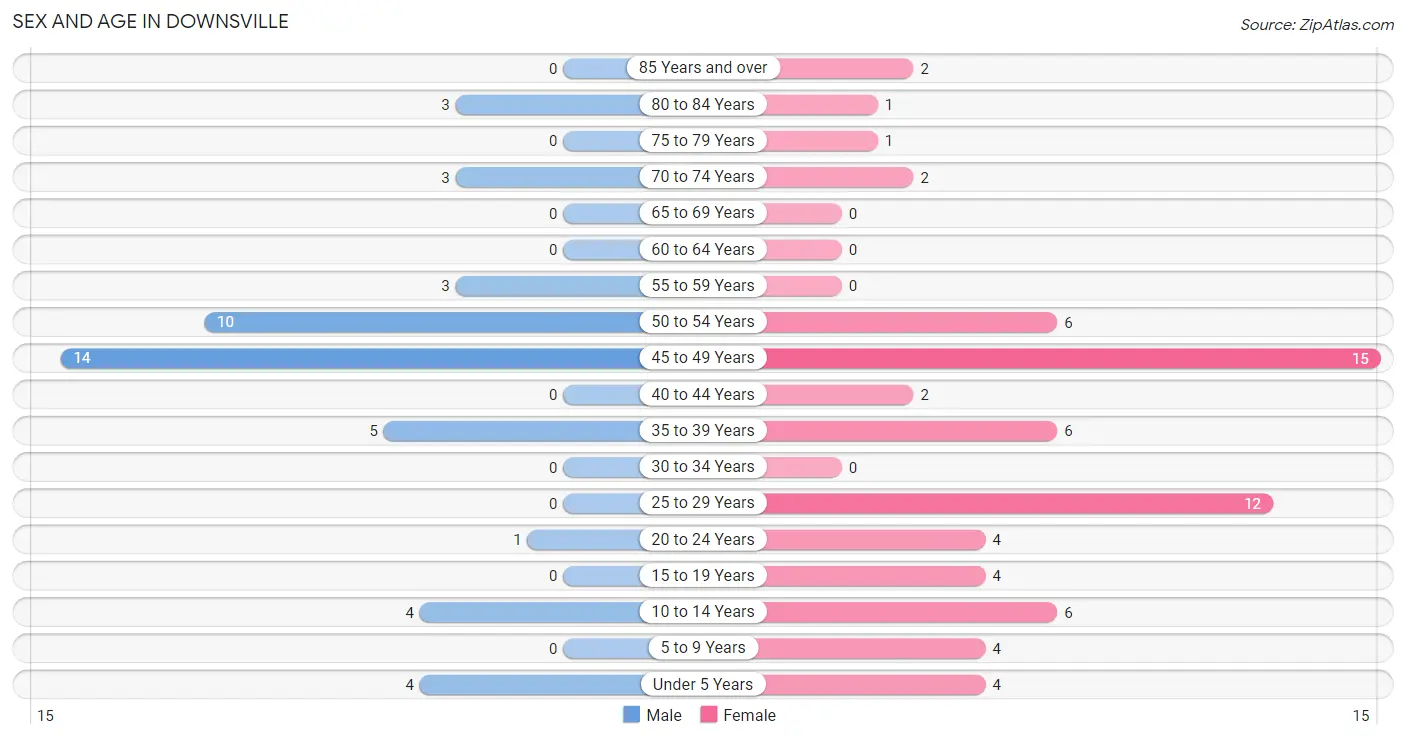
| Age Bracket | Male | Female |
| Under 5 Years | 4 (8.5%) | 4 (5.8%) |
| 5 to 9 Years | 0 (0.0%) | 4 (5.8%) |
| 10 to 14 Years | 4 (8.5%) | 6 (8.7%) |
| 15 to 19 Years | 0 (0.0%) | 4 (5.8%) |
| 20 to 24 Years | 1 (2.1%) | 4 (5.8%) |
| 25 to 29 Years | 0 (0.0%) | 12 (17.4%) |
| 30 to 34 Years | 0 (0.0%) | 0 (0.0%) |
| 35 to 39 Years | 5 (10.6%) | 6 (8.7%) |
| 40 to 44 Years | 0 (0.0%) | 2 (2.9%) |
| 45 to 49 Years | 14 (29.8%) | 15 (21.7%) |
| 50 to 54 Years | 10 (21.3%) | 6 (8.7%) |
| 55 to 59 Years | 3 (6.4%) | 0 (0.0%) |
| 60 to 64 Years | 0 (0.0%) | 0 (0.0%) |
| 65 to 69 Years | 0 (0.0%) | 0 (0.0%) |
| 70 to 74 Years | 3 (6.4%) | 2 (2.9%) |
| 75 to 79 Years | 0 (0.0%) | 1 (1.5%) |
| 80 to 84 Years | 3 (6.4%) | 1 (1.5%) |
| 85 Years and over | 0 (0.0%) | 2 (2.9%) |
| Total | 47 (100.0%) | 69 (100.0%) |
Families and Households in Downsville
Median Family Size in Downsville
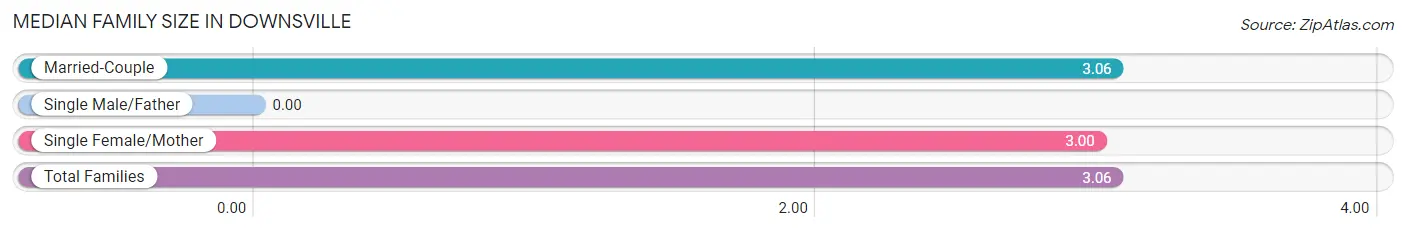
| Family Type | # Families | Family Size |
| Married-Couple | 34 (94.4%) | 3.06 |
| Single Male/Father | 0 (0.0%) | - |
| Single Female/Mother | 2 (5.6%) | 3.00 |
| Total Families | 36 (100.0%) | 3.06 |
Median Household Size in Downsville
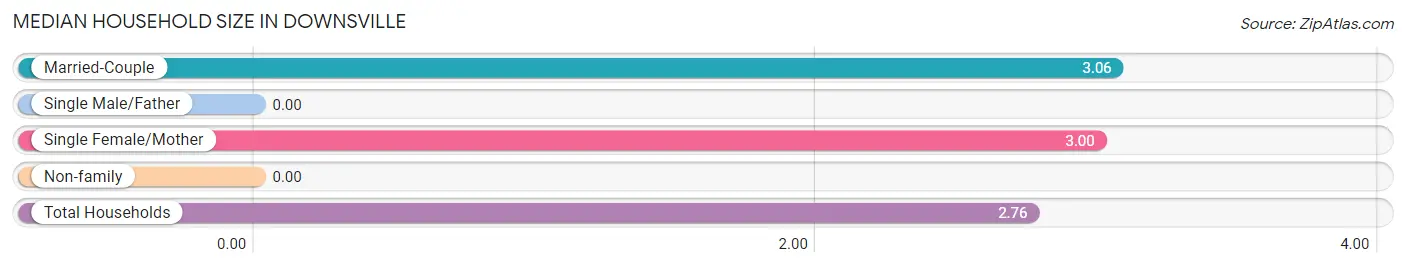
| Household Type | # Households | Household Size |
| Married-Couple | 34 (80.9%) | 3.06 |
| Single Male/Father | 0 (0.0%) | - |
| Single Female/Mother | 2 (4.8%) | 3.00 |
| Non-family | 6 (14.3%) | - |
| Total Households | 42 (100.0%) | 2.76 |
Household Size by Marriage Status in Downsville
Out of a total of 42 households in Downsville, 36 (85.7%) are family households, while 6 (14.3%) are nonfamily households. The most numerous type of family households are 2-person households, comprising 18, and the most common type of nonfamily households are 1-person households, comprising 6.
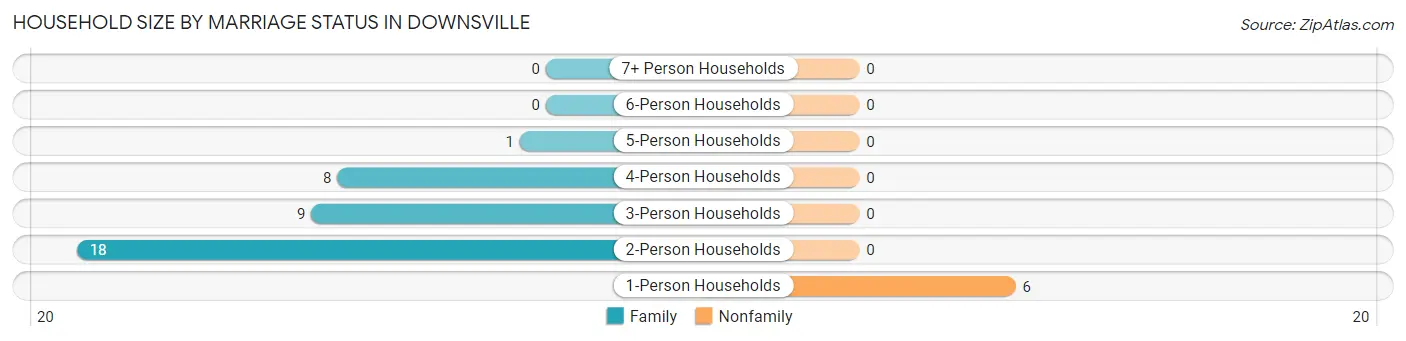
| Household Size | Family Households | Nonfamily Households |
| 1-Person Households | - | 6 (14.3%) |
| 2-Person Households | 18 (42.9%) | 0 (0.0%) |
| 3-Person Households | 9 (21.4%) | 0 (0.0%) |
| 4-Person Households | 8 (19.1%) | 0 (0.0%) |
| 5-Person Households | 1 (2.4%) | 0 (0.0%) |
| 6-Person Households | 0 (0.0%) | 0 (0.0%) |
| 7+ Person Households | 0 (0.0%) | 0 (0.0%) |
| Total | 36 (85.7%) | 6 (14.3%) |
Female Fertility in Downsville
Fertility by Age in Downsville
Average fertility rate in Downsville is 91.0 births per 1,000 women. Women in the age bracket of 20 to 34 years have the highest fertility rate with 250.0 births per 1,000 women. Women in the age bracket of 20 to 34 years acount for 100.0% of all women with births.
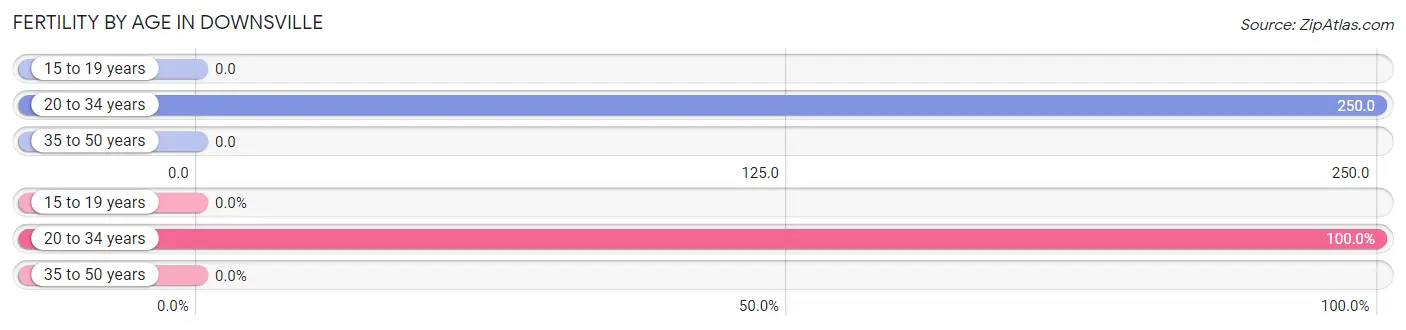
| Age Bracket | Women with Births | Births / 1,000 Women |
| 15 to 19 years | 0 (0.0%) | 0.0 |
| 20 to 34 years | 4 (100.0%) | 250.0 |
| 35 to 50 years | 0 (0.0%) | 0.0 |
| Total | 4 (100.0%) | 91.0 |
Fertility by Age by Marriage Status in Downsville
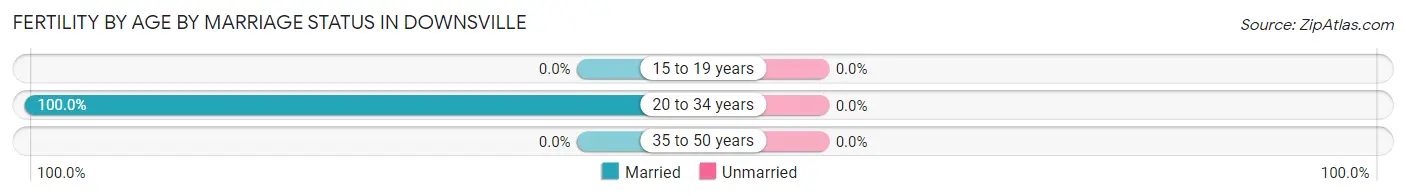
| Age Bracket | Married | Unmarried |
| 15 to 19 years | 0 (0.0%) | 0 (0.0%) |
| 20 to 34 years | 4 (100.0%) | 0 (0.0%) |
| 35 to 50 years | 0 (0.0%) | 0 (0.0%) |
| Total | 4 (100.0%) | 0 (0.0%) |
Fertility by Education in Downsville
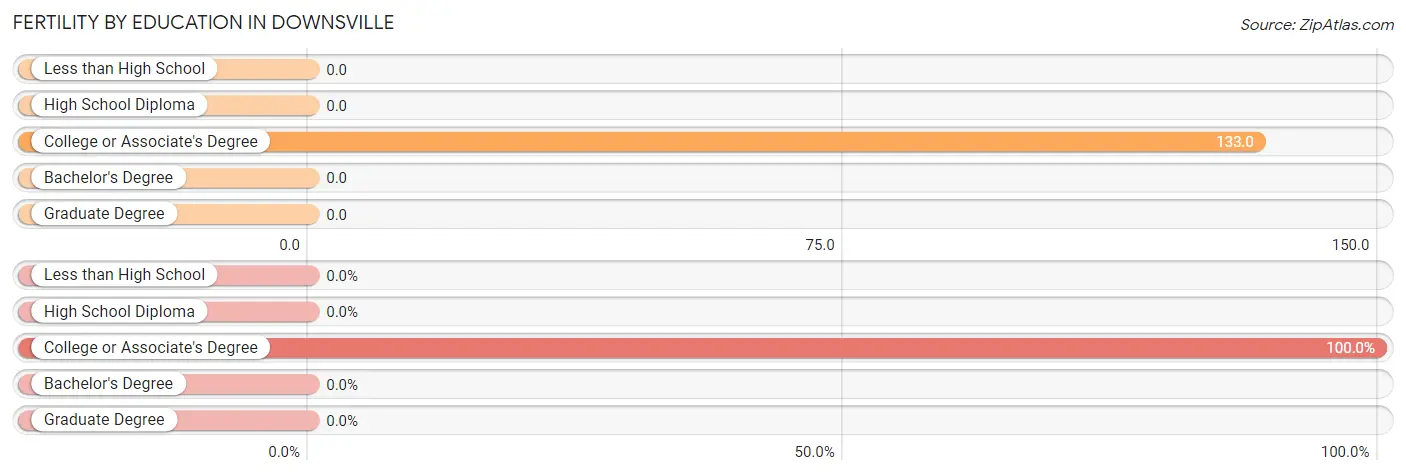
| Educational Attainment | Women with Births | Births / 1,000 Women |
| Less than High School | 0 (0.0%) | 0.0 |
| High School Diploma | 0 (0.0%) | 0.0 |
| College or Associate's Degree | 4 (100.0%) | 133.0 |
| Bachelor's Degree | 0 (0.0%) | 0.0 |
| Graduate Degree | 0 (0.0%) | 0.0 |
| Total | 4 (100.0%) | 91.0 |
Fertility by Education by Marriage Status in Downsville
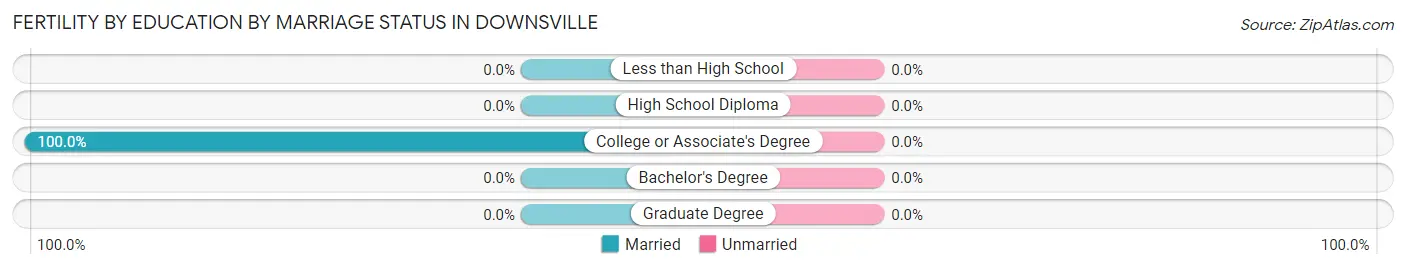
| Educational Attainment | Married | Unmarried |
| Less than High School | 0 (0.0%) | 0 (0.0%) |
| High School Diploma | 0 (0.0%) | 0 (0.0%) |
| College or Associate's Degree | 4 (100.0%) | 0 (0.0%) |
| Bachelor's Degree | 0 (0.0%) | 0 (0.0%) |
| Graduate Degree | 0 (0.0%) | 0 (0.0%) |
| Total | 4 (100.0%) | 0 (0.0%) |
Employment Characteristics in Downsville
Employment by Class of Employer in Downsville
Among the 65 employed individuals in Downsville, private company employees (40 | 61.5%), self-employed (not incorporated) (18 | 27.7%), and local government employees (5 | 7.7%) make up the most common classes of employment.
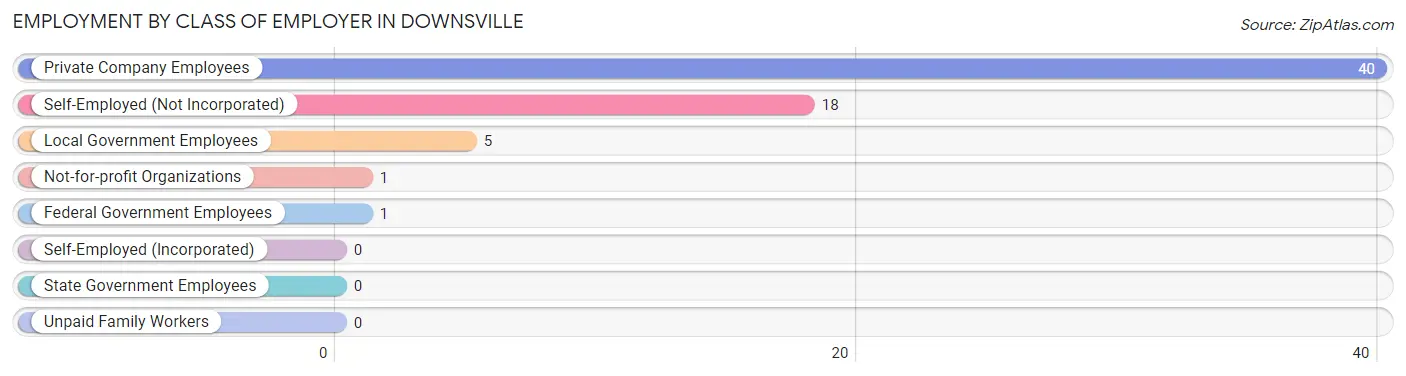
| Employer Class | # Employees | % Employees |
| Private Company Employees | 40 | 61.5% |
| Self-Employed (Incorporated) | 0 | 0.0% |
| Self-Employed (Not Incorporated) | 18 | 27.7% |
| Not-for-profit Organizations | 1 | 1.5% |
| Local Government Employees | 5 | 7.7% |
| State Government Employees | 0 | 0.0% |
| Federal Government Employees | 1 | 1.5% |
| Unpaid Family Workers | 0 | 0.0% |
| Total | 65 | 100.0% |
Employment Status by Age in Downsville
According to the labor force statistics for Downsville, out of the total population over 16 years of age (94), 70.2% or 66 individuals are in the labor force, with 1.5% or 1 of them unemployed. The age group with the highest labor force participation rate is 55 to 59 years, with 100.0% or 3 individuals in the labor force. Within the labor force, the 65 to 74 years age range has the highest percentage of unemployed individuals, with 33.3% or 1 of them being unemployed.
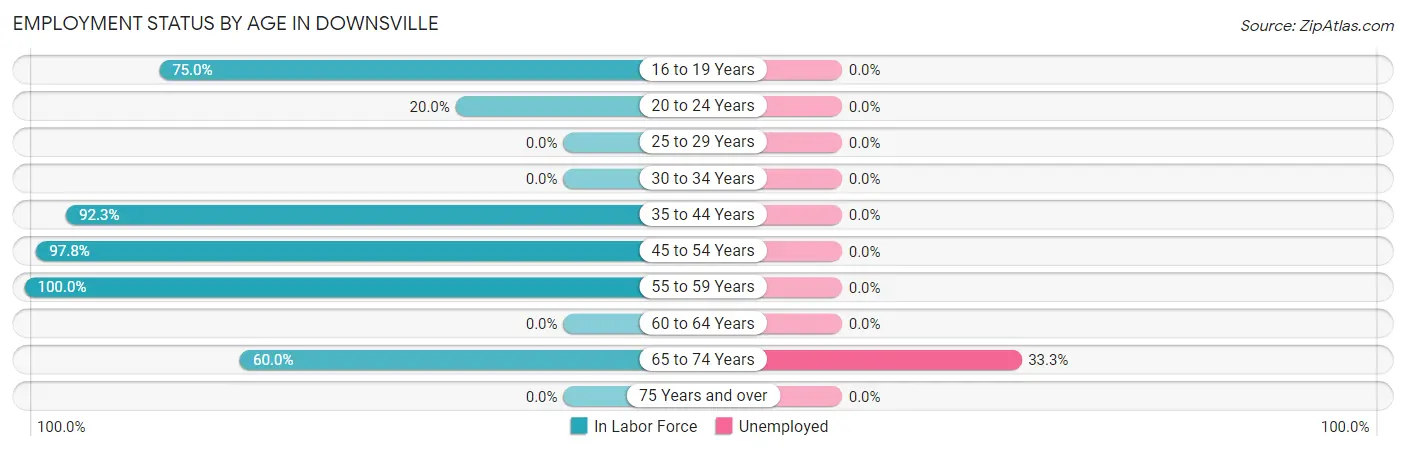
| Age Bracket | In Labor Force | Unemployed |
| 16 to 19 Years | 3 (75.0%) | 0 (0.0%) |
| 20 to 24 Years | 1 (20.0%) | 0 (0.0%) |
| 25 to 29 Years | 0 (0.0%) | 0 (0.0%) |
| 30 to 34 Years | 0 (0.0%) | 0 (0.0%) |
| 35 to 44 Years | 12 (92.3%) | 0 (0.0%) |
| 45 to 54 Years | 44 (97.8%) | 0 (0.0%) |
| 55 to 59 Years | 3 (100.0%) | 0 (0.0%) |
| 60 to 64 Years | 0 (0.0%) | 0 (0.0%) |
| 65 to 74 Years | 3 (60.0%) | 1 (33.3%) |
| 75 Years and over | 0 (0.0%) | 0 (0.0%) |
| Total | 66 (70.2%) | 1 (1.5%) |
Employment Status by Educational Attainment in Downsville
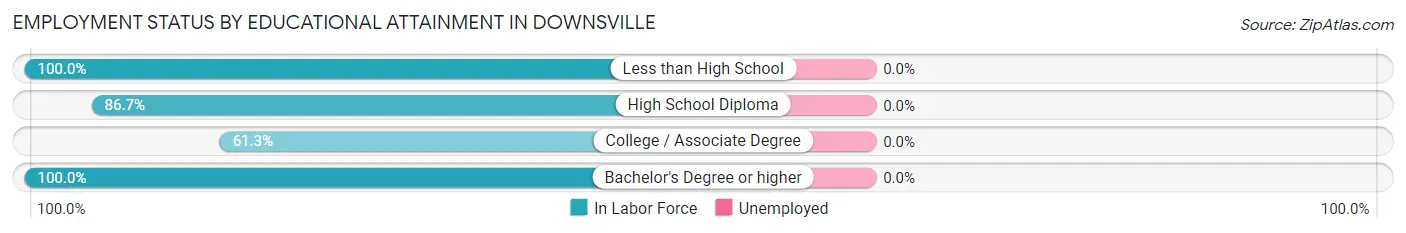
| Educational Attainment | In Labor Force | Unemployed |
| Less than High School | 7 (100.0%) | 0 (0.0%) |
| High School Diploma | 13 (86.7%) | 0 (0.0%) |
| College / Associate Degree | 19 (61.3%) | 0 (0.0%) |
| Bachelor's Degree or higher | 20 (100.0%) | 0 (0.0%) |
| Total | 59 (80.8%) | 0 (0.0%) |
Employment Occupations by Sex in Downsville
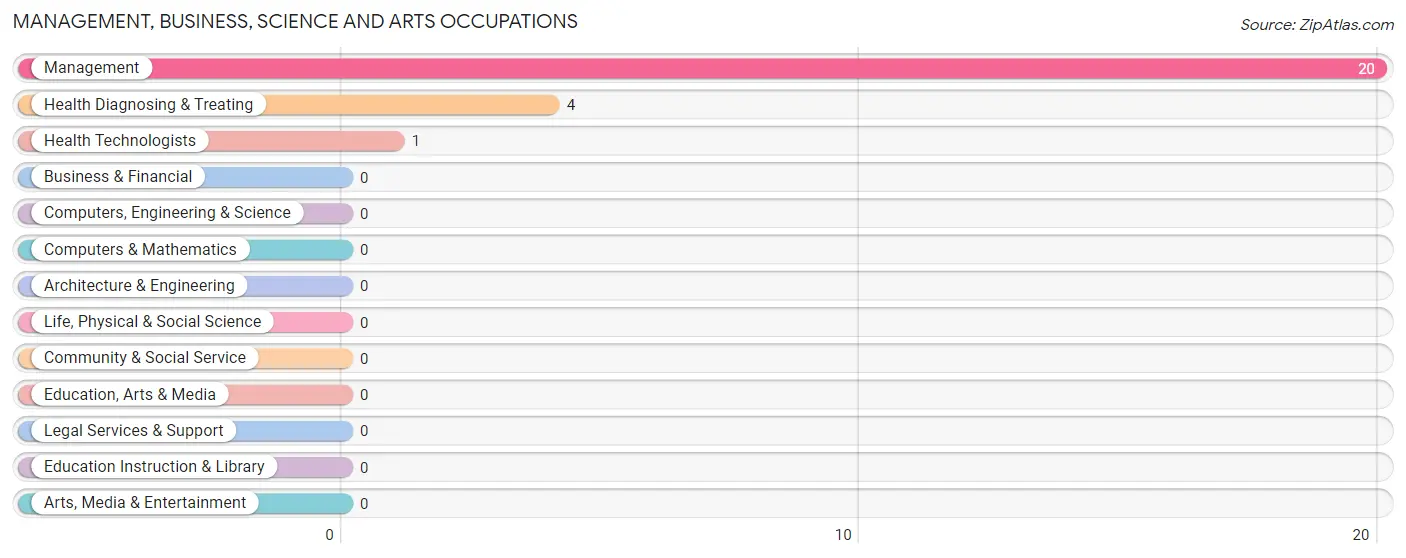
Management, Business, Science and Arts Occupations
The most common Management, Business, Science and Arts occupations in Downsville are Management (20 | 30.8%), Health Diagnosing & Treating (4 | 6.1%), and Health Technologists (1 | 1.5%).
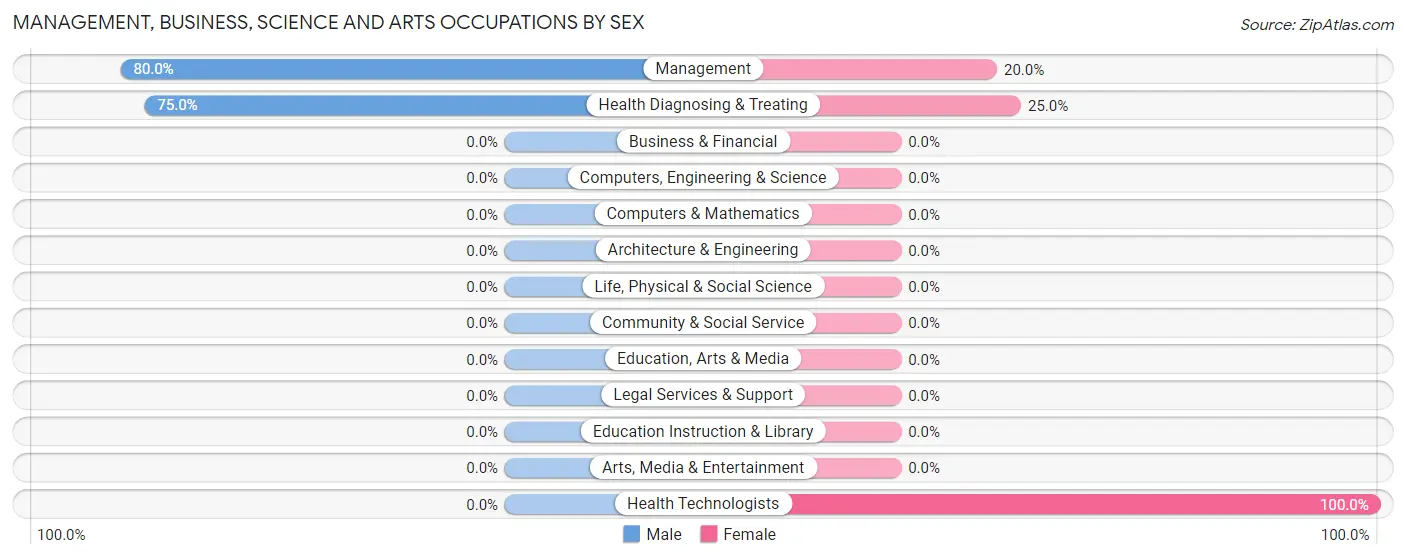
Management, Business, Science and Arts Occupations by Sex
Within the Management, Business, Science and Arts occupations in Downsville, the most male-oriented occupations are Management (80.0%), and Health Diagnosing & Treating (75.0%), while the most female-oriented occupations are Health Technologists (100.0%), Health Diagnosing & Treating (25.0%), and Management (20.0%).
| Occupation | Male | Female |
| Management | 16 (80.0%) | 4 (20.0%) |
| Business & Financial | 0 (0.0%) | 0 (0.0%) |
| Computers, Engineering & Science | 0 (0.0%) | 0 (0.0%) |
| Computers & Mathematics | 0 (0.0%) | 0 (0.0%) |
| Architecture & Engineering | 0 (0.0%) | 0 (0.0%) |
| Life, Physical & Social Science | 0 (0.0%) | 0 (0.0%) |
| Community & Social Service | 0 (0.0%) | 0 (0.0%) |
| Education, Arts & Media | 0 (0.0%) | 0 (0.0%) |
| Legal Services & Support | 0 (0.0%) | 0 (0.0%) |
| Education Instruction & Library | 0 (0.0%) | 0 (0.0%) |
| Arts, Media & Entertainment | 0 (0.0%) | 0 (0.0%) |
| Health Diagnosing & Treating | 3 (75.0%) | 1 (25.0%) |
| Health Technologists | 0 (0.0%) | 1 (100.0%) |
| Total (Category) | 19 (79.2%) | 5 (20.8%) |
| Total (Overall) | 34 (52.3%) | 31 (47.7%) |
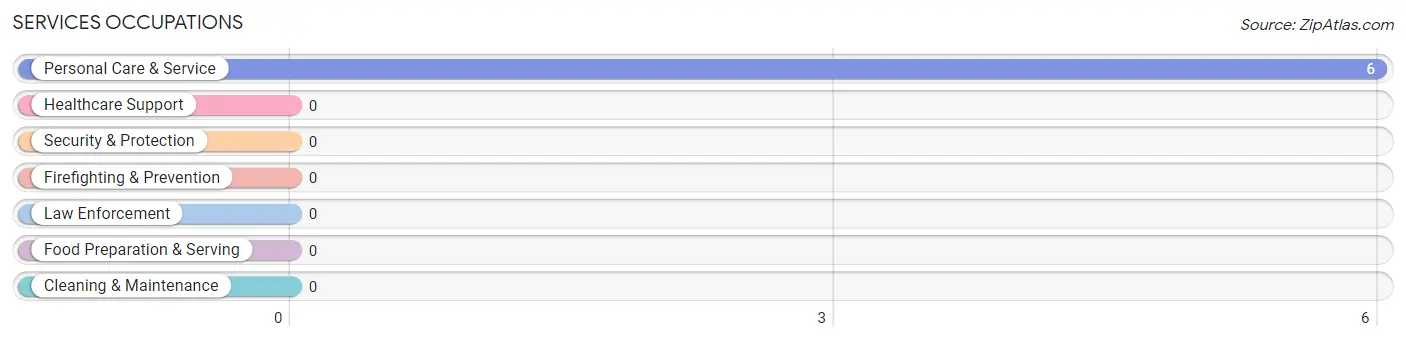
Services Occupations
The most common Services occupations in Downsville are , and Personal Care & Service (6 | 9.2%).
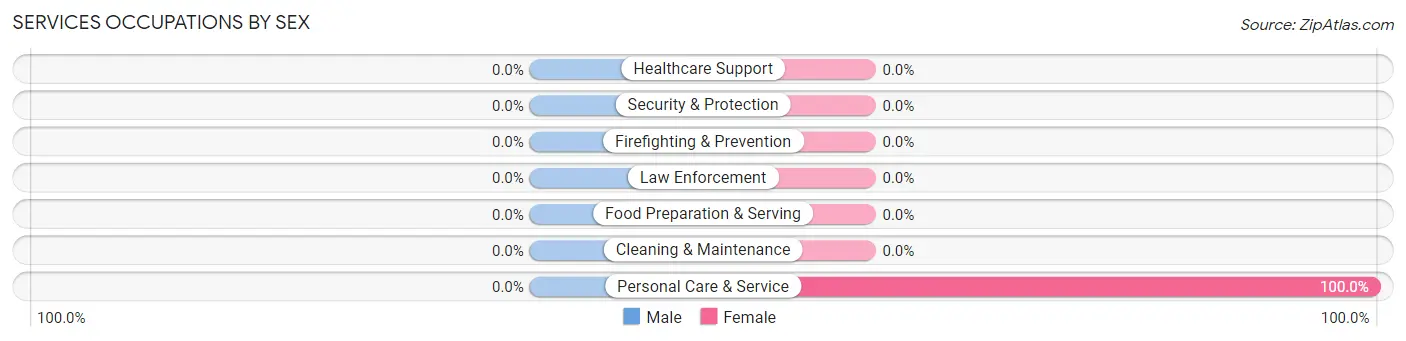
Services Occupations by Sex
| Occupation | Male | Female |
| Healthcare Support | 0 (0.0%) | 0 (0.0%) |
| Security & Protection | 0 (0.0%) | 0 (0.0%) |
| Firefighting & Prevention | 0 (0.0%) | 0 (0.0%) |
| Law Enforcement | 0 (0.0%) | 0 (0.0%) |
| Food Preparation & Serving | 0 (0.0%) | 0 (0.0%) |
| Cleaning & Maintenance | 0 (0.0%) | 0 (0.0%) |
| Personal Care & Service | 0 (0.0%) | 6 (100.0%) |
| Total (Category) | 0 (0.0%) | 6 (100.0%) |
| Total (Overall) | 34 (52.3%) | 31 (47.7%) |
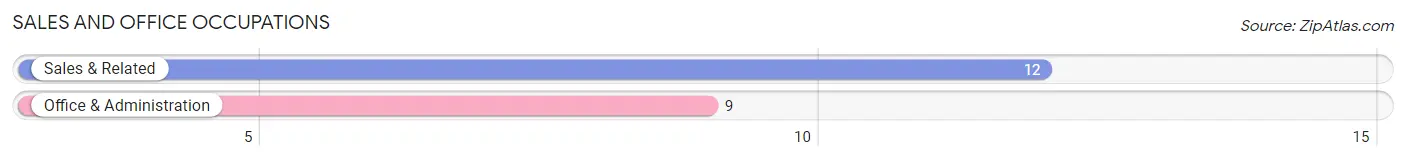
Sales and Office Occupations
The most common Sales and Office occupations in Downsville are Sales & Related (12 | 18.5%), and Office & Administration (9 | 13.9%).
Sales and Office Occupations by Sex
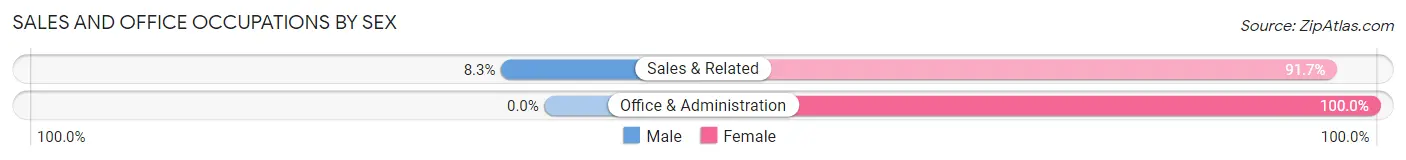
| Occupation | Male | Female |
| Sales & Related | 1 (8.3%) | 11 (91.7%) |
| Office & Administration | 0 (0.0%) | 9 (100.0%) |
| Total (Category) | 1 (4.8%) | 20 (95.2%) |
| Total (Overall) | 34 (52.3%) | 31 (47.7%) |
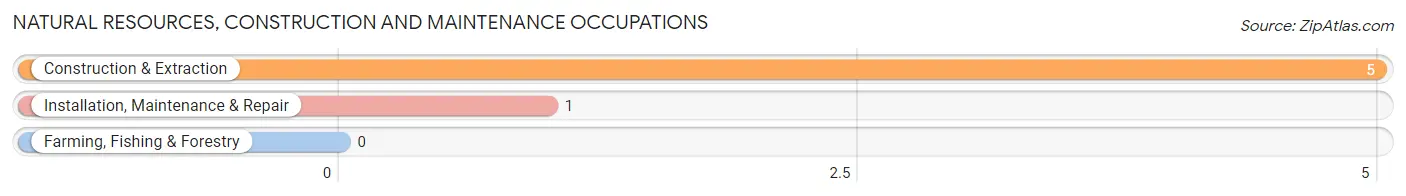
Natural Resources, Construction and Maintenance Occupations
The most common Natural Resources, Construction and Maintenance occupations in Downsville are Construction & Extraction (5 | 7.7%), and Installation, Maintenance & Repair (1 | 1.5%).
Natural Resources, Construction and Maintenance Occupations by Sex
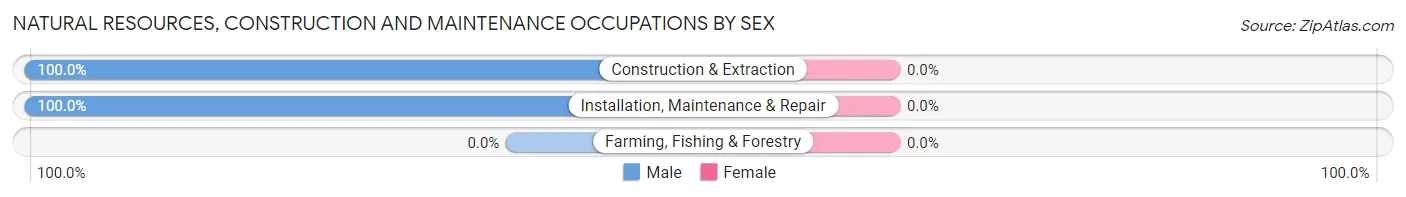
| Occupation | Male | Female |
| Farming, Fishing & Forestry | 0 (0.0%) | 0 (0.0%) |
| Construction & Extraction | 5 (100.0%) | 0 (0.0%) |
| Installation, Maintenance & Repair | 1 (100.0%) | 0 (0.0%) |
| Total (Category) | 6 (100.0%) | 0 (0.0%) |
| Total (Overall) | 34 (52.3%) | 31 (47.7%) |
Production, Transportation and Moving Occupations
The most common Production, Transportation and Moving occupations in Downsville are Production (4 | 6.1%), and Material Moving (4 | 6.1%).
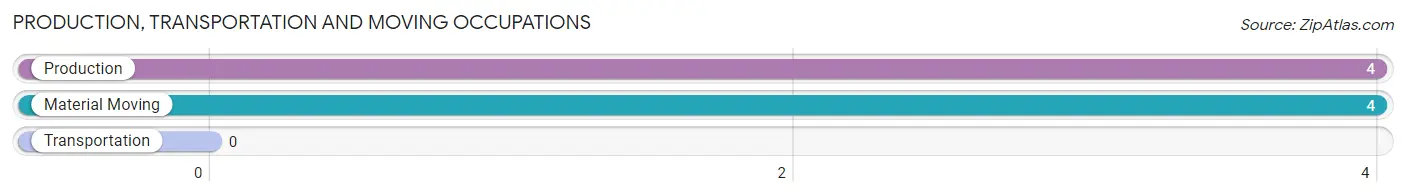
Production, Transportation and Moving Occupations by Sex
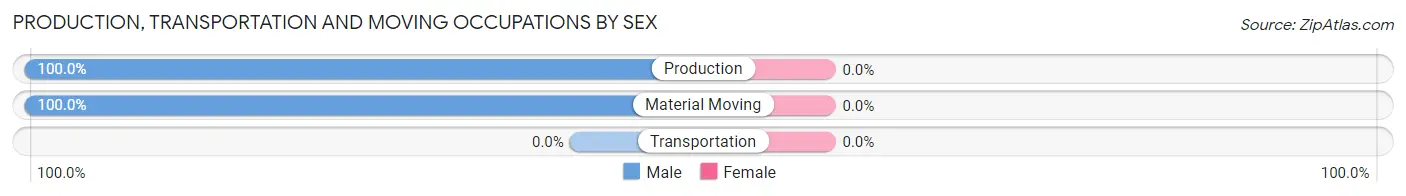
| Occupation | Male | Female |
| Production | 4 (100.0%) | 0 (0.0%) |
| Transportation | 0 (0.0%) | 0 (0.0%) |
| Material Moving | 4 (100.0%) | 0 (0.0%) |
| Total (Category) | 8 (100.0%) | 0 (0.0%) |
| Total (Overall) | 34 (52.3%) | 31 (47.7%) |
Employment Industries by Sex in Downsville
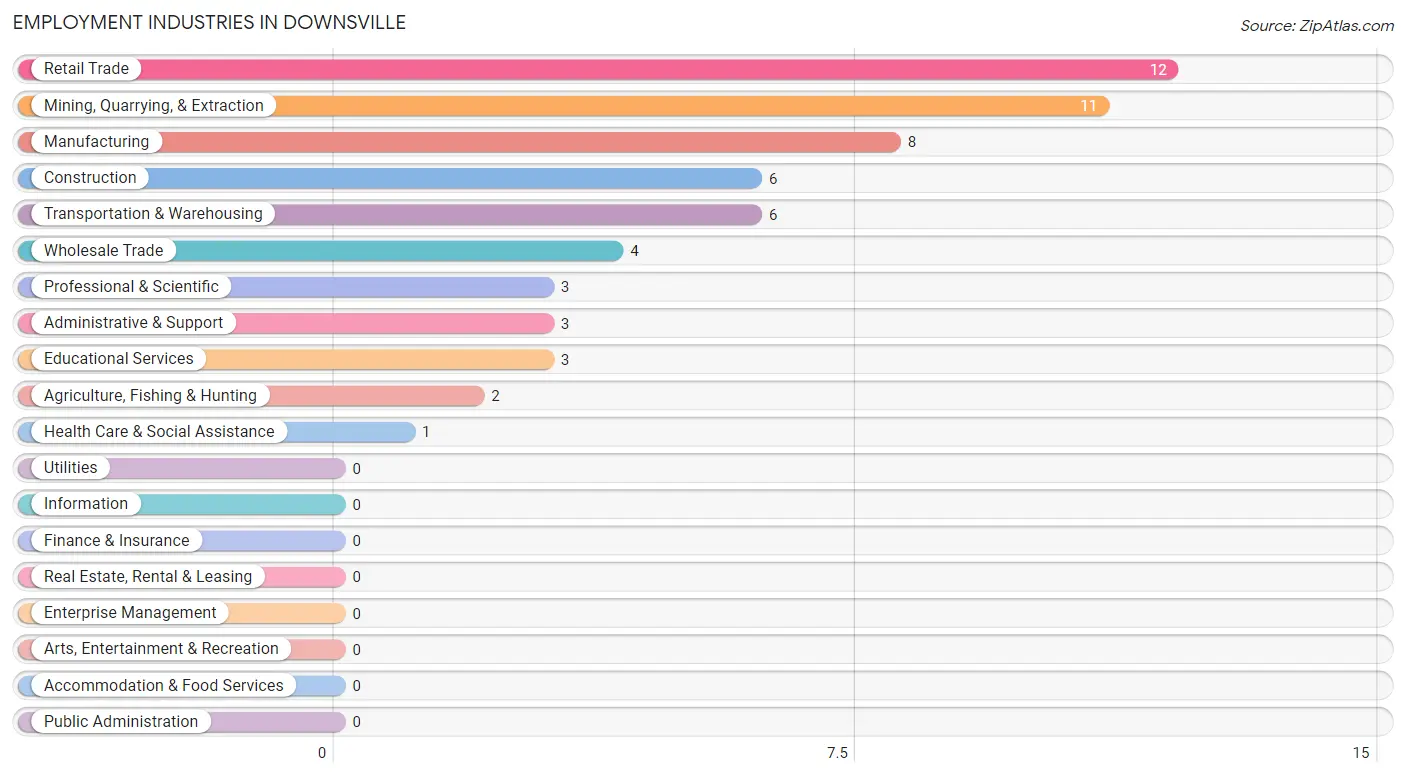
Employment Industries in Downsville
The major employment industries in Downsville include Retail Trade (12 | 18.5%), Mining, Quarrying, & Extraction (11 | 16.9%), Manufacturing (8 | 12.3%), Construction (6 | 9.2%), and Transportation & Warehousing (6 | 9.2%).
Employment Industries by Sex in Downsville
The Downsville industries that see more men than women are Agriculture, Fishing & Hunting (100.0%), Construction (100.0%), and Manufacturing (100.0%), whereas the industries that tend to have a higher number of women are Transportation & Warehousing (100.0%), Educational Services (100.0%), and Health Care & Social Assistance (100.0%).
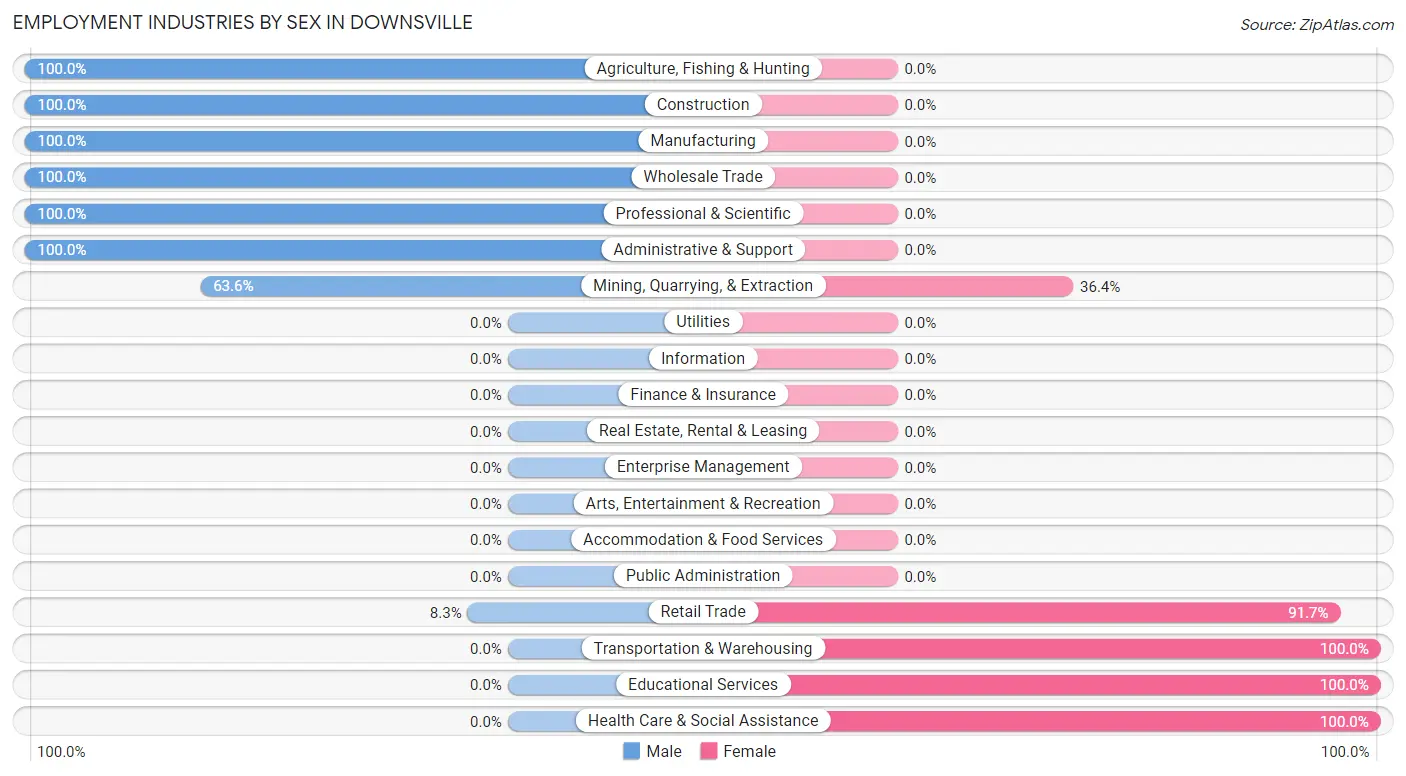
| Industry | Male | Female |
| Agriculture, Fishing & Hunting | 2 (100.0%) | 0 (0.0%) |
| Mining, Quarrying, & Extraction | 7 (63.6%) | 4 (36.4%) |
| Construction | 6 (100.0%) | 0 (0.0%) |
| Manufacturing | 8 (100.0%) | 0 (0.0%) |
| Wholesale Trade | 4 (100.0%) | 0 (0.0%) |
| Retail Trade | 1 (8.3%) | 11 (91.7%) |
| Transportation & Warehousing | 0 (0.0%) | 6 (100.0%) |
| Utilities | 0 (0.0%) | 0 (0.0%) |
| Information | 0 (0.0%) | 0 (0.0%) |
| Finance & Insurance | 0 (0.0%) | 0 (0.0%) |
| Real Estate, Rental & Leasing | 0 (0.0%) | 0 (0.0%) |
| Professional & Scientific | 3 (100.0%) | 0 (0.0%) |
| Enterprise Management | 0 (0.0%) | 0 (0.0%) |
| Administrative & Support | 3 (100.0%) | 0 (0.0%) |
| Educational Services | 0 (0.0%) | 3 (100.0%) |
| Health Care & Social Assistance | 0 (0.0%) | 1 (100.0%) |
| Arts, Entertainment & Recreation | 0 (0.0%) | 0 (0.0%) |
| Accommodation & Food Services | 0 (0.0%) | 0 (0.0%) |
| Public Administration | 0 (0.0%) | 0 (0.0%) |
| Total | 34 (52.3%) | 31 (47.7%) |
Education in Downsville
School Enrollment in Downsville
The most common levels of schooling among the 18 students in Downsville are elementary school (9 | 50.0%), middle school (4 | 22.2%), and college / undergraduate (3 | 16.7%).
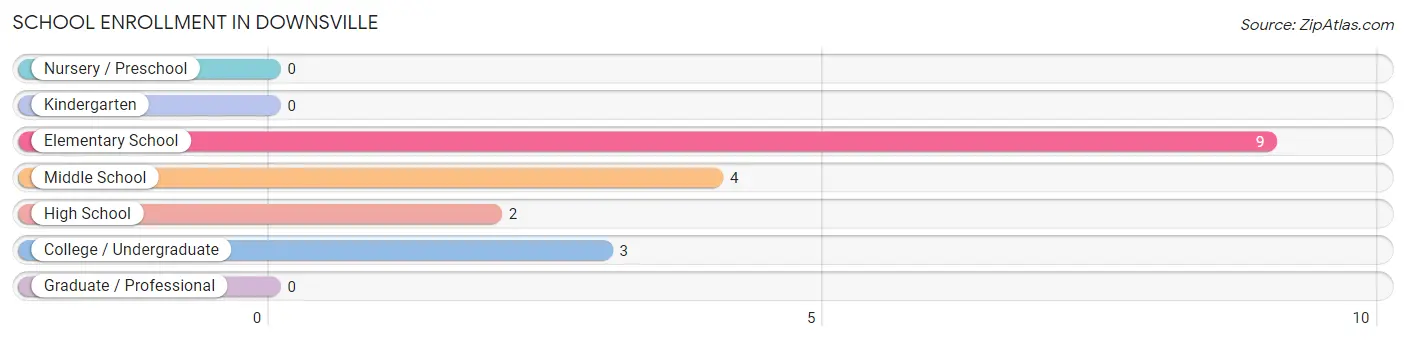
| School Level | # Students | % Students |
| Nursery / Preschool | 0 | 0.0% |
| Kindergarten | 0 | 0.0% |
| Elementary School | 9 | 50.0% |
| Middle School | 4 | 22.2% |
| High School | 2 | 11.1% |
| College / Undergraduate | 3 | 16.7% |
| Graduate / Professional | 0 | 0.0% |
| Total | 18 | 100.0% |
School Enrollment by Age by Funding Source in Downsville
Out of a total of 18 students who are enrolled in schools in Downsville, 5 (27.8%) attend a private institution, while the remaining 13 (72.2%) are enrolled in public schools. The age group of 5 to 9 year old has the highest likelihood of being enrolled in private schools, with 4 (100.0% in the age bracket) enrolled. Conversely, the age group of 10 to 14 year olds has the lowest likelihood of being enrolled in a private school, with 10 (100.0% in the age bracket) attending a public institution.
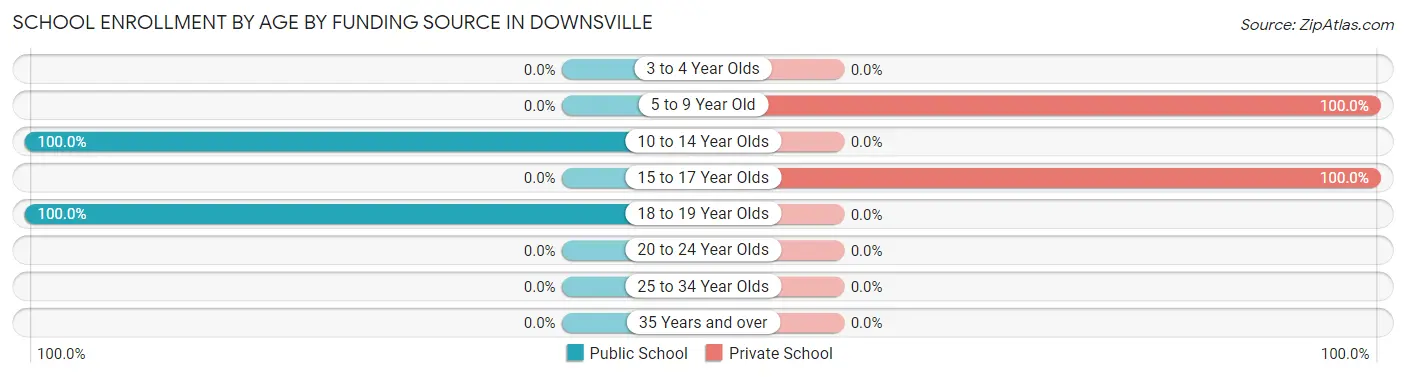
| Age Bracket | Public School | Private School |
| 3 to 4 Year Olds | 0 (0.0%) | 0 (0.0%) |
| 5 to 9 Year Old | 0 (0.0%) | 4 (100.0%) |
| 10 to 14 Year Olds | 10 (100.0%) | 0 (0.0%) |
| 15 to 17 Year Olds | 0 (0.0%) | 1 (100.0%) |
| 18 to 19 Year Olds | 3 (100.0%) | 0 (0.0%) |
| 20 to 24 Year Olds | 0 (0.0%) | 0 (0.0%) |
| 25 to 34 Year Olds | 0 (0.0%) | 0 (0.0%) |
| 35 Years and over | 0 (0.0%) | 0 (0.0%) |
| Total | 13 (72.2%) | 5 (27.8%) |
Educational Attainment by Field of Study in Downsville
Arts & humanities (9 | 34.6%), business (8 | 30.8%), liberal arts & history (7 | 26.9%), science & technology (1 | 3.8%), and education (1 | 3.8%) are the most common fields of study among 26 individuals in Downsville who have obtained a bachelor's degree or higher.
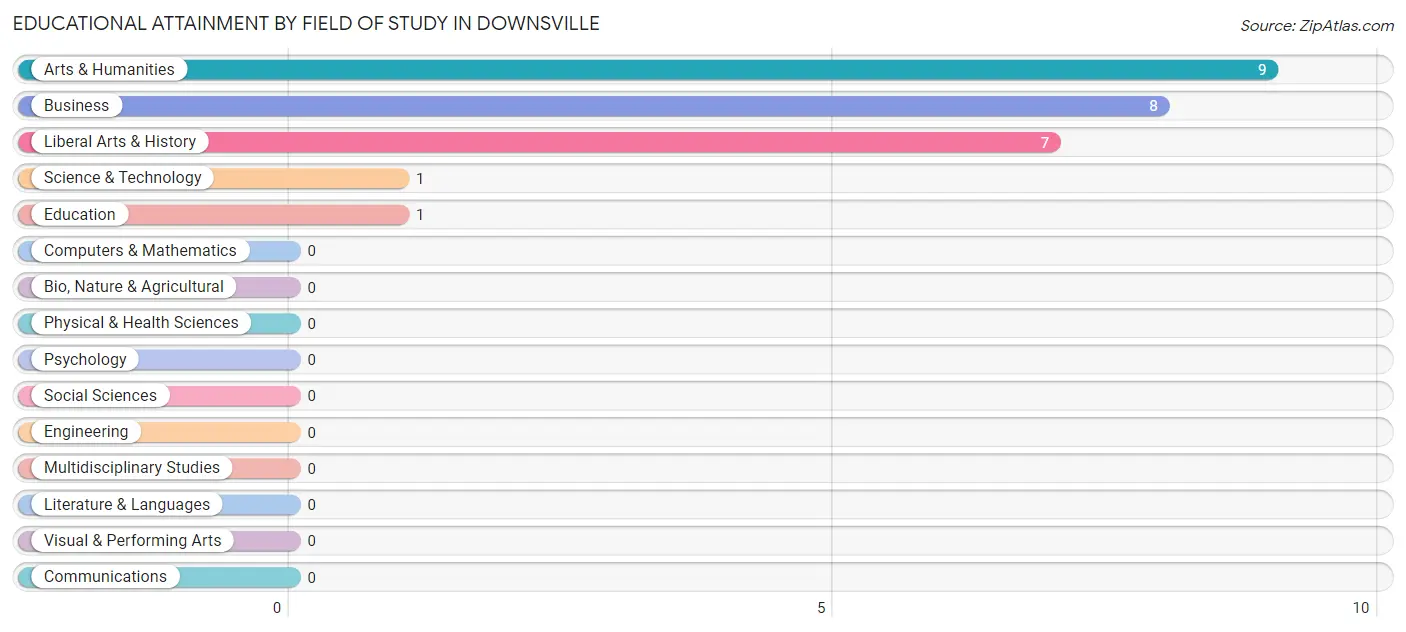
| Field of Study | # Graduates | % Graduates |
| Computers & Mathematics | 0 | 0.0% |
| Bio, Nature & Agricultural | 0 | 0.0% |
| Physical & Health Sciences | 0 | 0.0% |
| Psychology | 0 | 0.0% |
| Social Sciences | 0 | 0.0% |
| Engineering | 0 | 0.0% |
| Multidisciplinary Studies | 0 | 0.0% |
| Science & Technology | 1 | 3.8% |
| Business | 8 | 30.8% |
| Education | 1 | 3.8% |
| Literature & Languages | 0 | 0.0% |
| Liberal Arts & History | 7 | 26.9% |
| Visual & Performing Arts | 0 | 0.0% |
| Communications | 0 | 0.0% |
| Arts & Humanities | 9 | 34.6% |
| Total | 26 | 100.0% |
Transportation & Commute in Downsville
Vehicle Availability by Sex in Downsville
The most prevalent vehicle ownership categories in Downsville are males with 2 vehicles (18, accounting for 52.9%) and females with 2 vehicles (14, making up 58.1%).
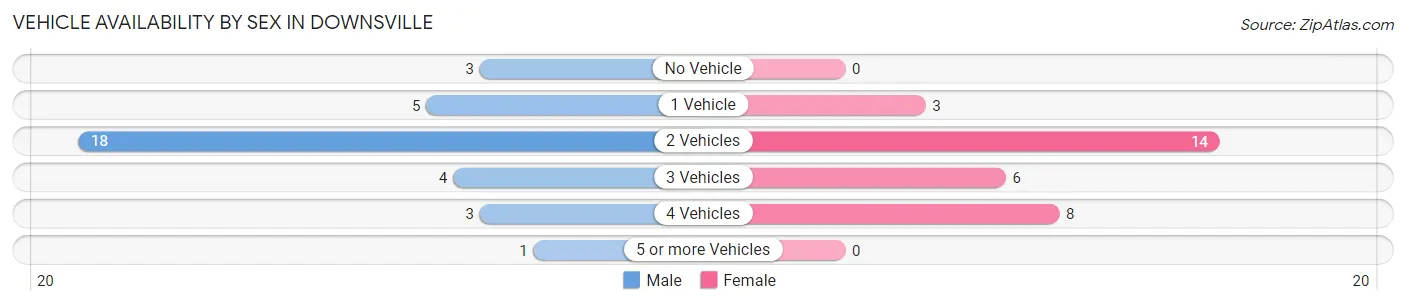
| Vehicles Available | Male | Female |
| No Vehicle | 3 (8.8%) | 0 (0.0%) |
| 1 Vehicle | 5 (14.7%) | 3 (9.7%) |
| 2 Vehicles | 18 (52.9%) | 14 (45.2%) |
| 3 Vehicles | 4 (11.8%) | 6 (19.4%) |
| 4 Vehicles | 3 (8.8%) | 8 (25.8%) |
| 5 or more Vehicles | 1 (2.9%) | 0 (0.0%) |
| Total | 34 (100.0%) | 31 (100.0%) |
Commute Time in Downsville
The most frequently occuring commute durations in Downsville are 5 to 9 minutes (14 commuters, 25.5%), 15 to 19 minutes (8 commuters, 14.5%), and 30 to 34 minutes (8 commuters, 14.5%).
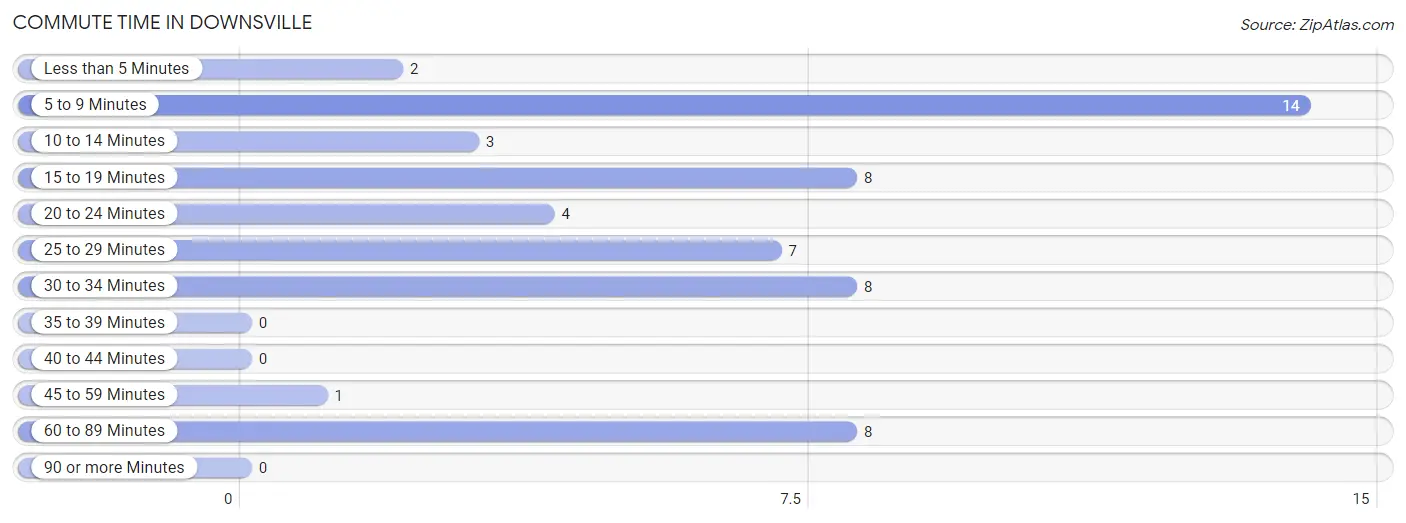
| Commute Time | # Commuters | % Commuters |
| Less than 5 Minutes | 2 | 3.6% |
| 5 to 9 Minutes | 14 | 25.5% |
| 10 to 14 Minutes | 3 | 5.4% |
| 15 to 19 Minutes | 8 | 14.5% |
| 20 to 24 Minutes | 4 | 7.3% |
| 25 to 29 Minutes | 7 | 12.7% |
| 30 to 34 Minutes | 8 | 14.5% |
| 35 to 39 Minutes | 0 | 0.0% |
| 40 to 44 Minutes | 0 | 0.0% |
| 45 to 59 Minutes | 1 | 1.8% |
| 60 to 89 Minutes | 8 | 14.5% |
| 90 or more Minutes | 0 | 0.0% |
Commute Time by Sex in Downsville
The most common commute times in Downsville are 30 to 34 minutes (8 commuters, 28.6%) for males and 5 to 9 minutes (13 commuters, 48.1%) for females.
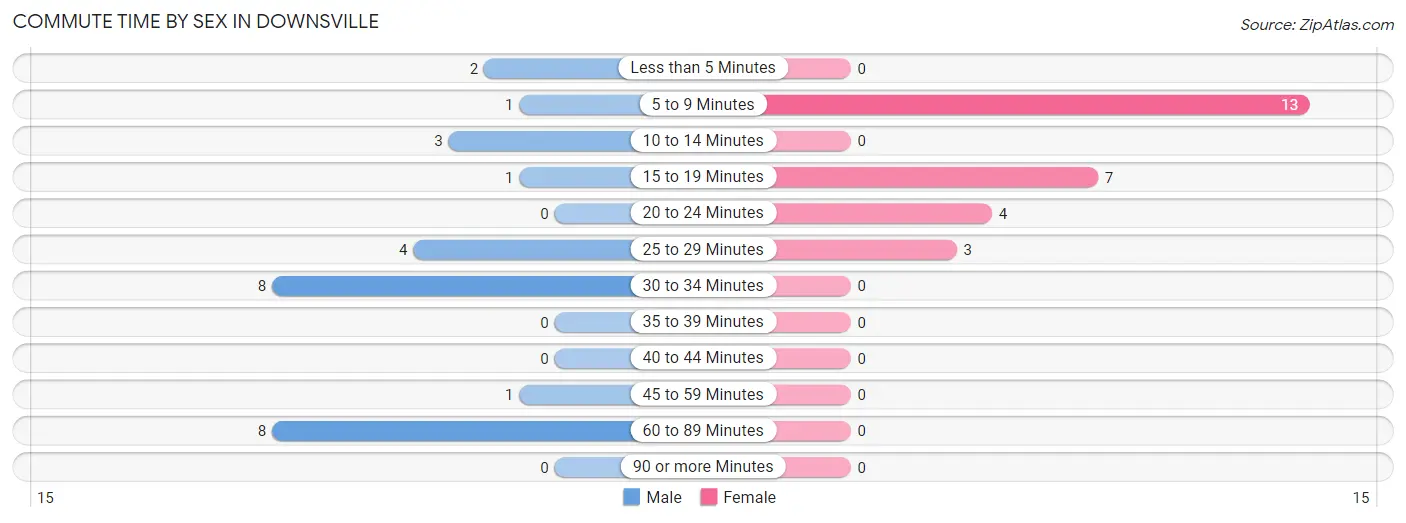
| Commute Time | Male | Female |
| Less than 5 Minutes | 2 (7.1%) | 0 (0.0%) |
| 5 to 9 Minutes | 1 (3.6%) | 13 (48.1%) |
| 10 to 14 Minutes | 3 (10.7%) | 0 (0.0%) |
| 15 to 19 Minutes | 1 (3.6%) | 7 (25.9%) |
| 20 to 24 Minutes | 0 (0.0%) | 4 (14.8%) |
| 25 to 29 Minutes | 4 (14.3%) | 3 (11.1%) |
| 30 to 34 Minutes | 8 (28.6%) | 0 (0.0%) |
| 35 to 39 Minutes | 0 (0.0%) | 0 (0.0%) |
| 40 to 44 Minutes | 0 (0.0%) | 0 (0.0%) |
| 45 to 59 Minutes | 1 (3.6%) | 0 (0.0%) |
| 60 to 89 Minutes | 8 (28.6%) | 0 (0.0%) |
| 90 or more Minutes | 0 (0.0%) | 0 (0.0%) |
Time of Departure to Work by Sex in Downsville
The most frequent times of departure to work in Downsville are 6:00 AM to 6:29 AM (12, 42.9%) for males and 7:00 AM to 7:29 AM (17, 63.0%) for females.
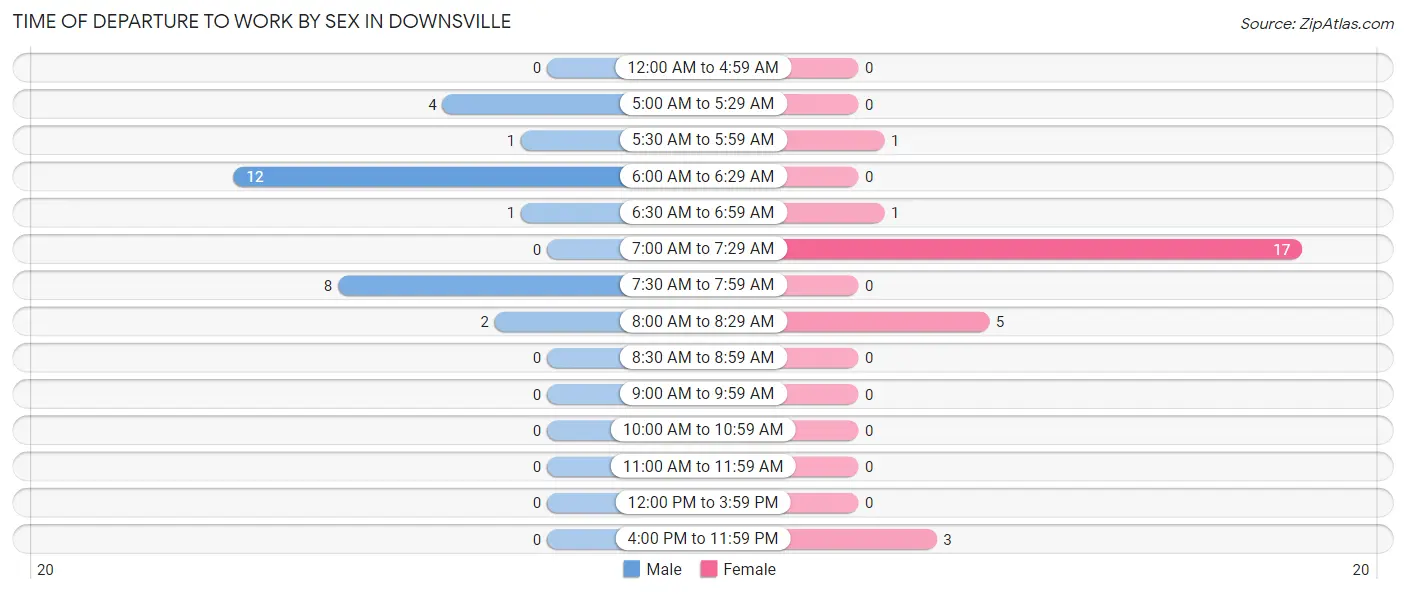
| Time of Departure | Male | Female |
| 12:00 AM to 4:59 AM | 0 (0.0%) | 0 (0.0%) |
| 5:00 AM to 5:29 AM | 4 (14.3%) | 0 (0.0%) |
| 5:30 AM to 5:59 AM | 1 (3.6%) | 1 (3.7%) |
| 6:00 AM to 6:29 AM | 12 (42.9%) | 0 (0.0%) |
| 6:30 AM to 6:59 AM | 1 (3.6%) | 1 (3.7%) |
| 7:00 AM to 7:29 AM | 0 (0.0%) | 17 (63.0%) |
| 7:30 AM to 7:59 AM | 8 (28.6%) | 0 (0.0%) |
| 8:00 AM to 8:29 AM | 2 (7.1%) | 5 (18.5%) |
| 8:30 AM to 8:59 AM | 0 (0.0%) | 0 (0.0%) |
| 9:00 AM to 9:59 AM | 0 (0.0%) | 0 (0.0%) |
| 10:00 AM to 10:59 AM | 0 (0.0%) | 0 (0.0%) |
| 11:00 AM to 11:59 AM | 0 (0.0%) | 0 (0.0%) |
| 12:00 PM to 3:59 PM | 0 (0.0%) | 0 (0.0%) |
| 4:00 PM to 11:59 PM | 0 (0.0%) | 3 (11.1%) |
| Total | 28 (100.0%) | 27 (100.0%) |
Housing Occupancy in Downsville
Occupancy by Ownership in Downsville
Of the total 42 dwellings in Downsville, owner-occupied units account for 31 (73.8%), while renter-occupied units make up 11 (26.2%).
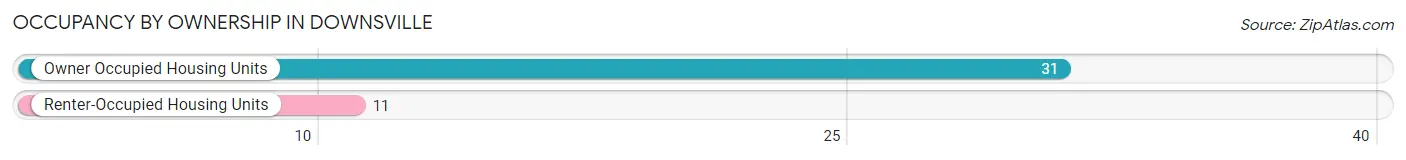
| Occupancy | # Housing Units | % Housing Units |
| Owner Occupied Housing Units | 31 | 73.8% |
| Renter-Occupied Housing Units | 11 | 26.2% |
| Total Occupied Housing Units | 42 | 100.0% |
Occupancy by Household Size in Downsville
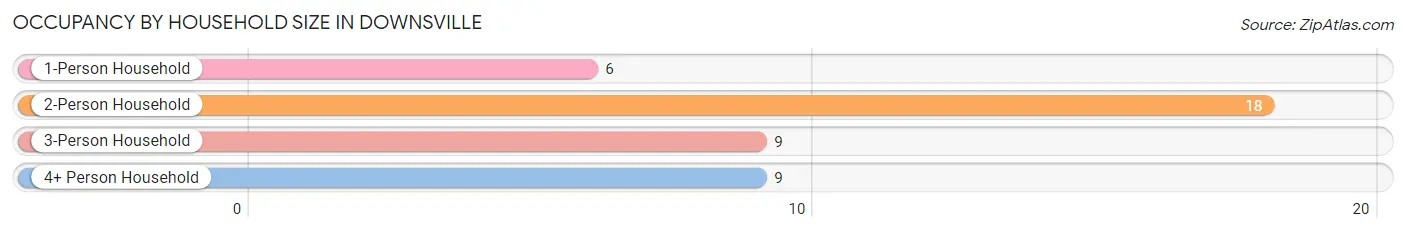
| Household Size | # Housing Units | % Housing Units |
| 1-Person Household | 6 | 14.3% |
| 2-Person Household | 18 | 42.9% |
| 3-Person Household | 9 | 21.4% |
| 4+ Person Household | 9 | 21.4% |
| Total Housing Units | 42 | 100.0% |
Occupancy by Ownership by Household Size in Downsville
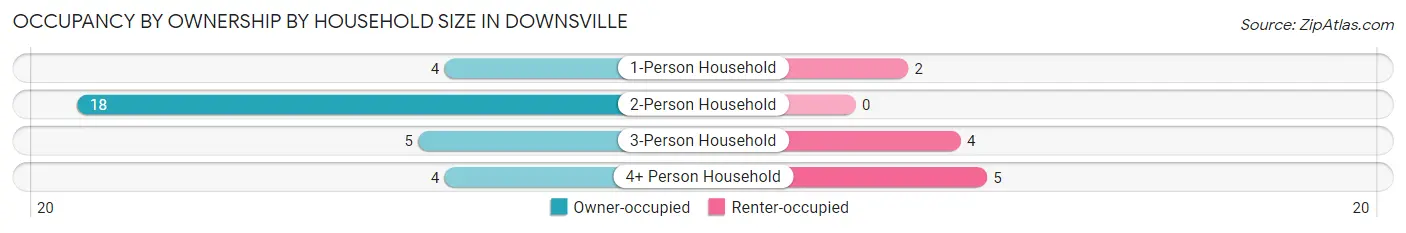
| Household Size | Owner-occupied | Renter-occupied |
| 1-Person Household | 4 (66.7%) | 2 (33.3%) |
| 2-Person Household | 18 (100.0%) | 0 (0.0%) |
| 3-Person Household | 5 (55.6%) | 4 (44.4%) |
| 4+ Person Household | 4 (44.4%) | 5 (55.6%) |
| Total Housing Units | 31 (73.8%) | 11 (26.2%) |
Occupancy by Educational Attainment in Downsville
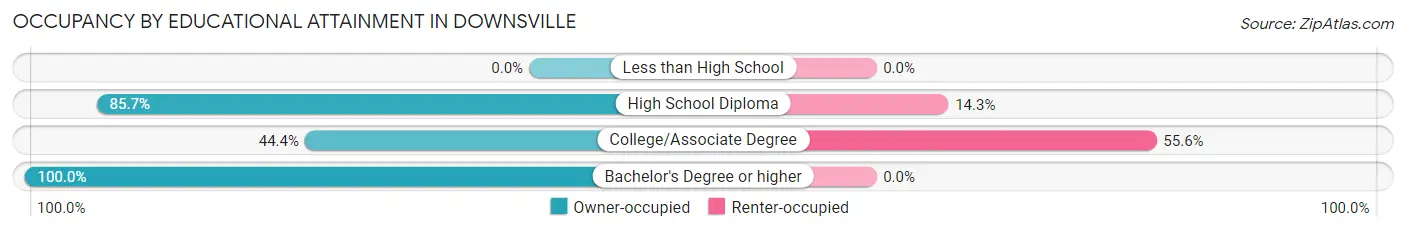
| Household Size | Owner-occupied | Renter-occupied |
| Less than High School | 0 (0.0%) | 0 (0.0%) |
| High School Diploma | 6 (85.7%) | 1 (14.3%) |
| College/Associate Degree | 8 (44.4%) | 10 (55.6%) |
| Bachelor's Degree or higher | 17 (100.0%) | 0 (0.0%) |
Occupancy by Age of Householder in Downsville
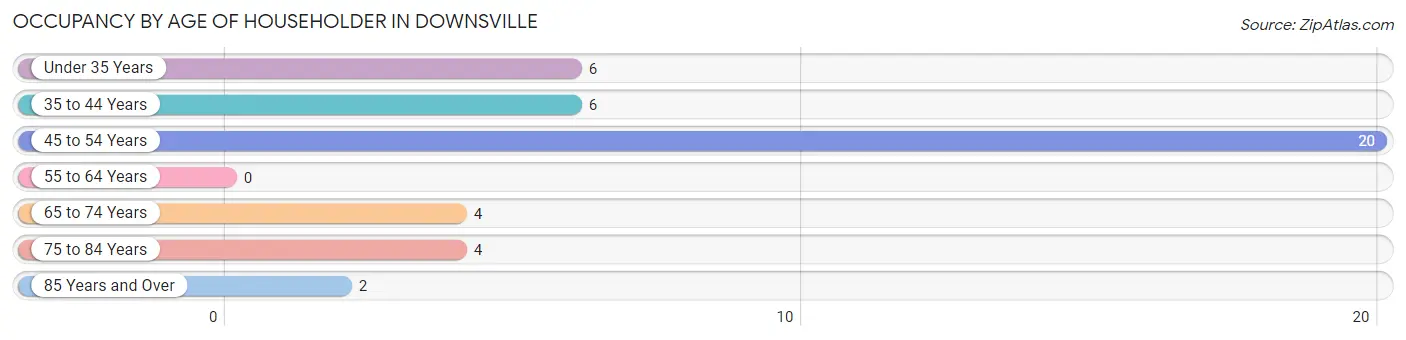
| Age Bracket | # Households | % Households |
| Under 35 Years | 6 | 14.3% |
| 35 to 44 Years | 6 | 14.3% |
| 45 to 54 Years | 20 | 47.6% |
| 55 to 64 Years | 0 | 0.0% |
| 65 to 74 Years | 4 | 9.5% |
| 75 to 84 Years | 4 | 9.5% |
| 85 Years and Over | 2 | 4.8% |
| Total | 42 | 100.0% |
Housing Finances in Downsville
Median Income by Occupancy in Downsville
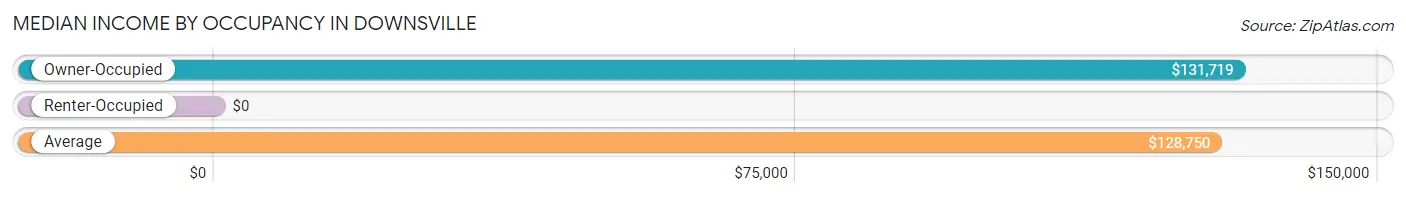
| Occupancy Type | # Households | Median Income |
| Owner-Occupied | 31 (73.8%) | $131,719 |
| Renter-Occupied | 11 (26.2%) | $0 |
| Average | 42 (100.0%) | $128,750 |
Occupancy by Householder Income Bracket in Downsville
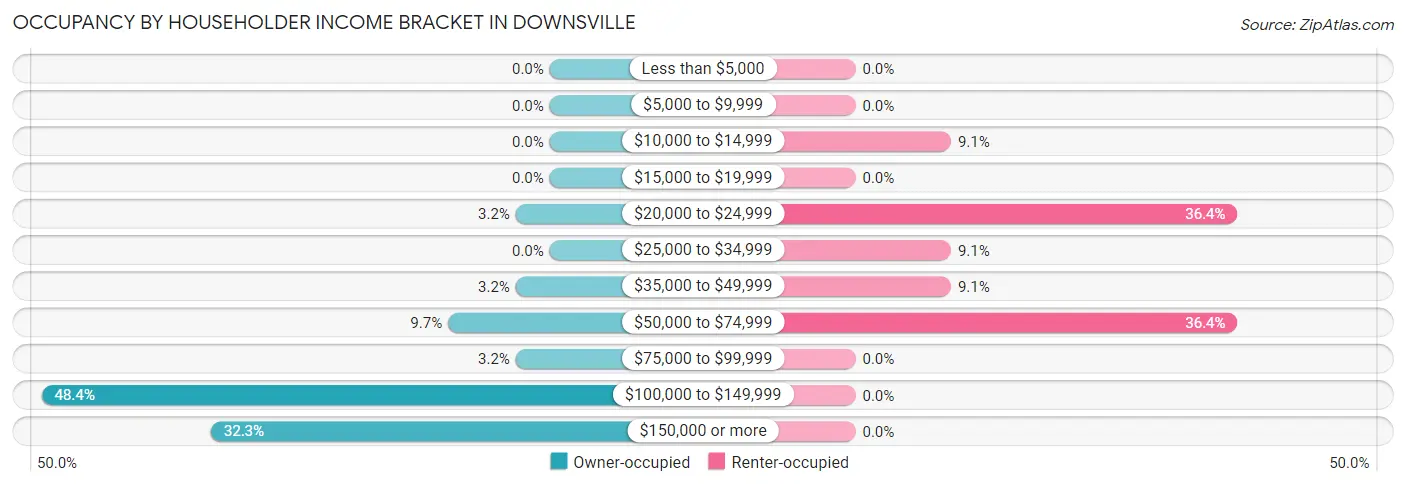
| Income Bracket | Owner-occupied | Renter-occupied |
| Less than $5,000 | 0 (0.0%) | 0 (0.0%) |
| $5,000 to $9,999 | 0 (0.0%) | 0 (0.0%) |
| $10,000 to $14,999 | 0 (0.0%) | 1 (9.1%) |
| $15,000 to $19,999 | 0 (0.0%) | 0 (0.0%) |
| $20,000 to $24,999 | 1 (3.2%) | 4 (36.4%) |
| $25,000 to $34,999 | 0 (0.0%) | 1 (9.1%) |
| $35,000 to $49,999 | 1 (3.2%) | 1 (9.1%) |
| $50,000 to $74,999 | 3 (9.7%) | 4 (36.4%) |
| $75,000 to $99,999 | 1 (3.2%) | 0 (0.0%) |
| $100,000 to $149,999 | 15 (48.4%) | 0 (0.0%) |
| $150,000 or more | 10 (32.3%) | 0 (0.0%) |
| Total | 31 (100.0%) | 11 (100.0%) |
Monthly Housing Cost Tiers in Downsville
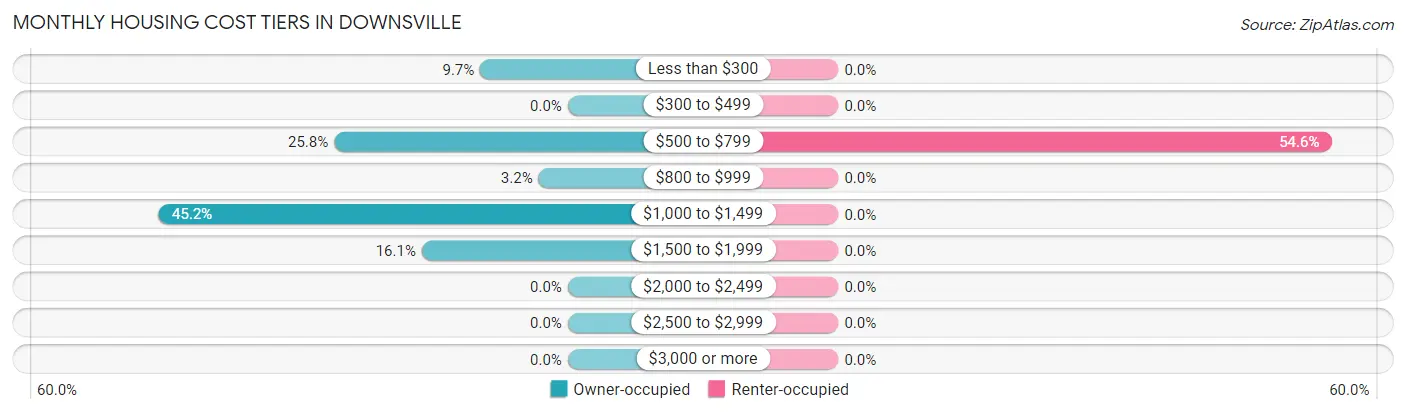
| Monthly Cost | Owner-occupied | Renter-occupied |
| Less than $300 | 3 (9.7%) | 0 (0.0%) |
| $300 to $499 | 0 (0.0%) | 0 (0.0%) |
| $500 to $799 | 8 (25.8%) | 6 (54.5%) |
| $800 to $999 | 1 (3.2%) | 0 (0.0%) |
| $1,000 to $1,499 | 14 (45.2%) | 0 (0.0%) |
| $1,500 to $1,999 | 5 (16.1%) | 0 (0.0%) |
| $2,000 to $2,499 | 0 (0.0%) | 0 (0.0%) |
| $2,500 to $2,999 | 0 (0.0%) | 0 (0.0%) |
| $3,000 or more | 0 (0.0%) | 0 (0.0%) |
| Total | 31 (100.0%) | 11 (100.0%) |
Physical Housing Characteristics in Downsville
Housing Structures in Downsville
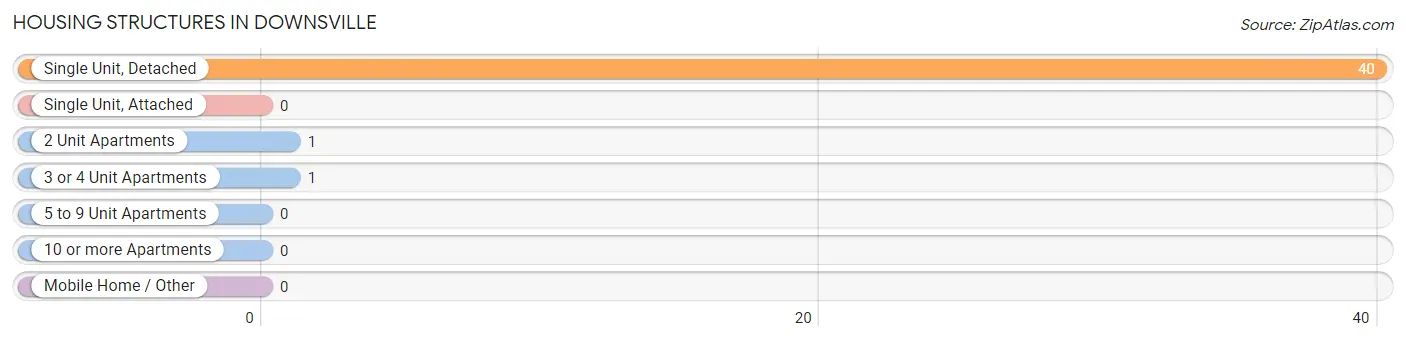
| Structure Type | # Housing Units | % Housing Units |
| Single Unit, Detached | 40 | 95.2% |
| Single Unit, Attached | 0 | 0.0% |
| 2 Unit Apartments | 1 | 2.4% |
| 3 or 4 Unit Apartments | 1 | 2.4% |
| 5 to 9 Unit Apartments | 0 | 0.0% |
| 10 or more Apartments | 0 | 0.0% |
| Mobile Home / Other | 0 | 0.0% |
| Total | 42 | 100.0% |
Housing Structures by Occupancy in Downsville
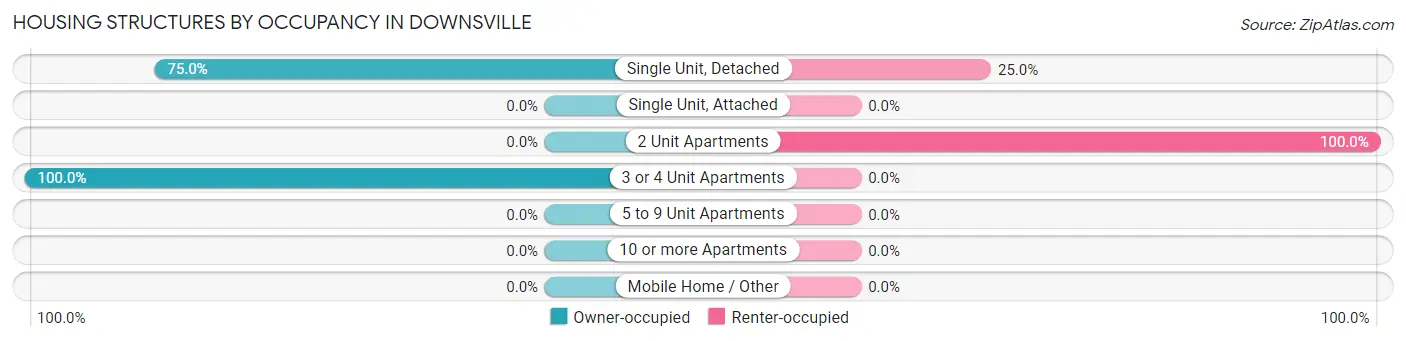
| Structure Type | Owner-occupied | Renter-occupied |
| Single Unit, Detached | 30 (75.0%) | 10 (25.0%) |
| Single Unit, Attached | 0 (0.0%) | 0 (0.0%) |
| 2 Unit Apartments | 0 (0.0%) | 1 (100.0%) |
| 3 or 4 Unit Apartments | 1 (100.0%) | 0 (0.0%) |
| 5 to 9 Unit Apartments | 0 (0.0%) | 0 (0.0%) |
| 10 or more Apartments | 0 (0.0%) | 0 (0.0%) |
| Mobile Home / Other | 0 (0.0%) | 0 (0.0%) |
| Total | 31 (73.8%) | 11 (26.2%) |
Housing Structures by Number of Rooms in Downsville
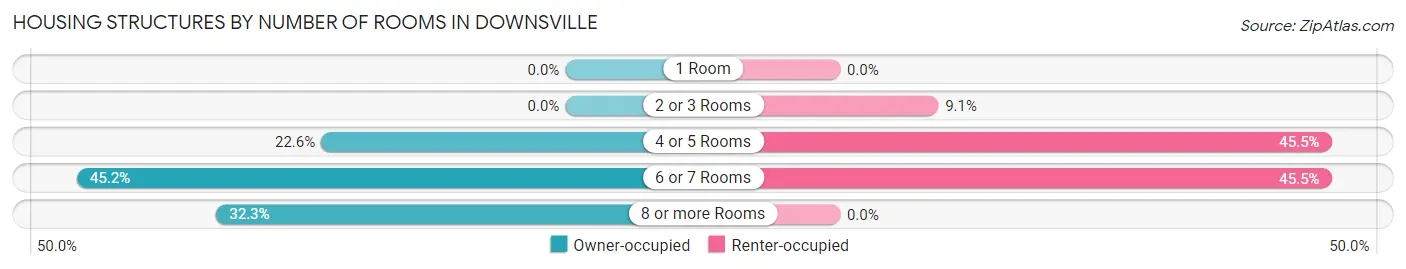
| Number of Rooms | Owner-occupied | Renter-occupied |
| 1 Room | 0 (0.0%) | 0 (0.0%) |
| 2 or 3 Rooms | 0 (0.0%) | 1 (9.1%) |
| 4 or 5 Rooms | 7 (22.6%) | 5 (45.5%) |
| 6 or 7 Rooms | 14 (45.2%) | 5 (45.5%) |
| 8 or more Rooms | 10 (32.3%) | 0 (0.0%) |
| Total | 31 (100.0%) | 11 (100.0%) |
Housing Structure by Heating Type in Downsville
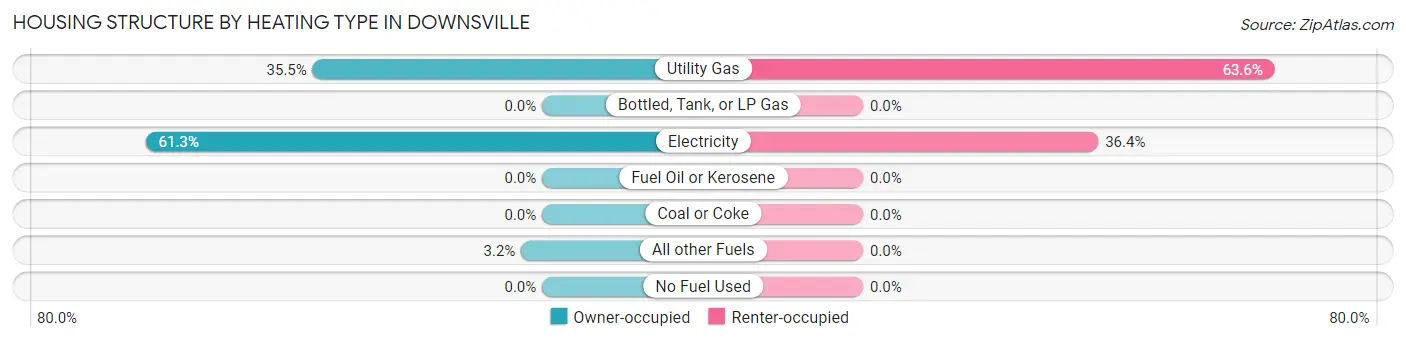
| Heating Type | Owner-occupied | Renter-occupied |
| Utility Gas | 11 (35.5%) | 7 (63.6%) |
| Bottled, Tank, or LP Gas | 0 (0.0%) | 0 (0.0%) |
| Electricity | 19 (61.3%) | 4 (36.4%) |
| Fuel Oil or Kerosene | 0 (0.0%) | 0 (0.0%) |
| Coal or Coke | 0 (0.0%) | 0 (0.0%) |
| All other Fuels | 1 (3.2%) | 0 (0.0%) |
| No Fuel Used | 0 (0.0%) | 0 (0.0%) |
| Total | 31 (100.0%) | 11 (100.0%) |
Household Vehicle Usage in Downsville
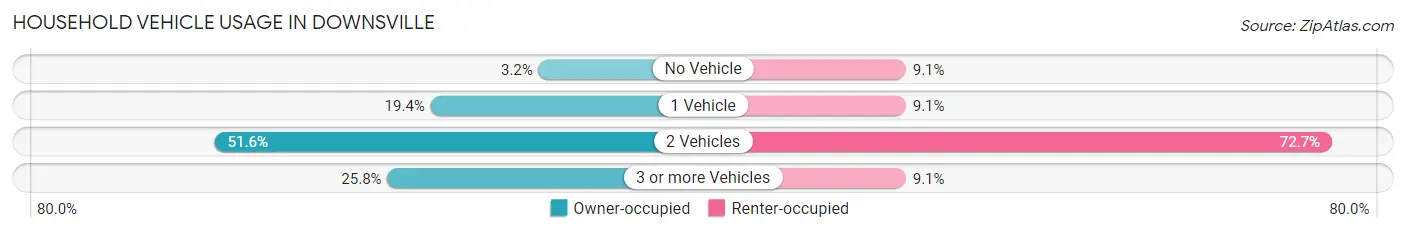
| Vehicles per Household | Owner-occupied | Renter-occupied |
| No Vehicle | 1 (3.2%) | 1 (9.1%) |
| 1 Vehicle | 6 (19.4%) | 1 (9.1%) |
| 2 Vehicles | 16 (51.6%) | 8 (72.7%) |
| 3 or more Vehicles | 8 (25.8%) | 1 (9.1%) |
| Total | 31 (100.0%) | 11 (100.0%) |
Real Estate & Mortgages in Downsville
Real Estate and Mortgage Overview in Downsville
| Characteristic | Without Mortgage | With Mortgage |
| Housing Units | 12 | 19 |
| Median Property Value | - | - |
| Median Household Income | - | - |
| Monthly Housing Costs | $538 | $0 |
| Real Estate Taxes | - | - |
Property Value by Mortgage Status in Downsville
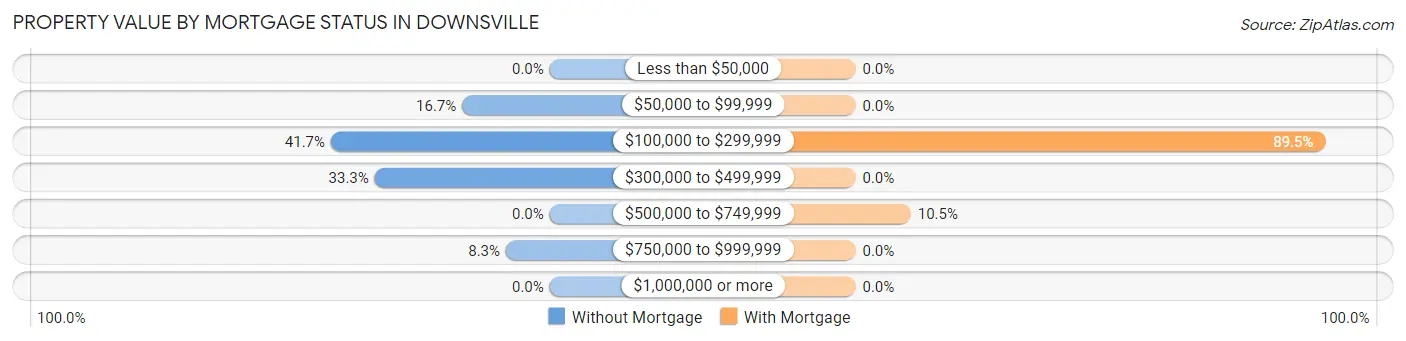
| Property Value | Without Mortgage | With Mortgage |
| Less than $50,000 | 0 (0.0%) | 0 (0.0%) |
| $50,000 to $99,999 | 2 (16.7%) | 0 (0.0%) |
| $100,000 to $299,999 | 5 (41.7%) | 17 (89.5%) |
| $300,000 to $499,999 | 4 (33.3%) | 0 (0.0%) |
| $500,000 to $749,999 | 0 (0.0%) | 2 (10.5%) |
| $750,000 to $999,999 | 1 (8.3%) | 0 (0.0%) |
| $1,000,000 or more | 0 (0.0%) | 0 (0.0%) |
| Total | 12 (100.0%) | 19 (100.0%) |
Household Income by Mortgage Status in Downsville
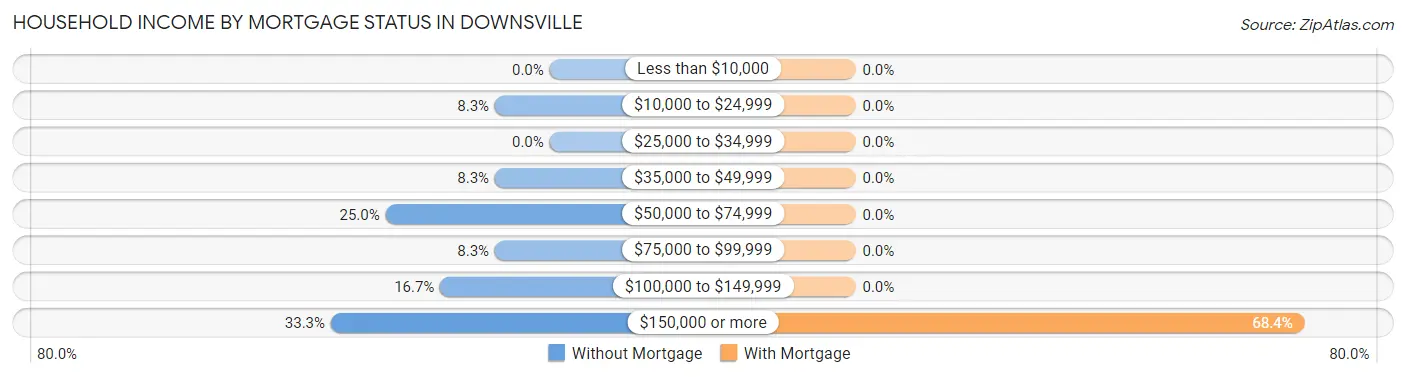
| Household Income | Without Mortgage | With Mortgage |
| Less than $10,000 | 0 (0.0%) | 0 (0.0%) |
| $10,000 to $24,999 | 1 (8.3%) | 0 (0.0%) |
| $25,000 to $34,999 | 0 (0.0%) | 0 (0.0%) |
| $35,000 to $49,999 | 1 (8.3%) | 0 (0.0%) |
| $50,000 to $74,999 | 3 (25.0%) | 0 (0.0%) |
| $75,000 to $99,999 | 1 (8.3%) | 0 (0.0%) |
| $100,000 to $149,999 | 2 (16.7%) | 0 (0.0%) |
| $150,000 or more | 4 (33.3%) | 13 (68.4%) |
| Total | 12 (100.0%) | 19 (100.0%) |
Property Value to Household Income Ratio in Downsville
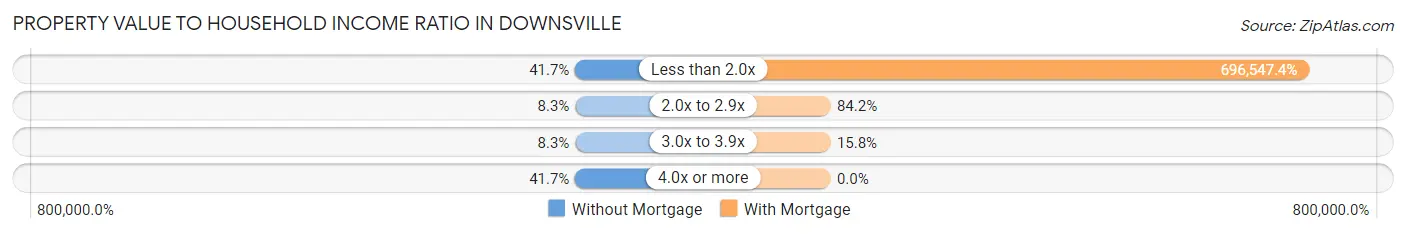
| Value-to-Income Ratio | Without Mortgage | With Mortgage |
| Less than 2.0x | 5 (41.7%) | 132,344 (696,547.4%) |
| 2.0x to 2.9x | 1 (8.3%) | 16 (84.2%) |
| 3.0x to 3.9x | 1 (8.3%) | 3 (15.8%) |
| 4.0x or more | 5 (41.7%) | 0 (0.0%) |
| Total | 12 (100.0%) | 19 (100.0%) |
Real Estate Taxes by Mortgage Status in Downsville
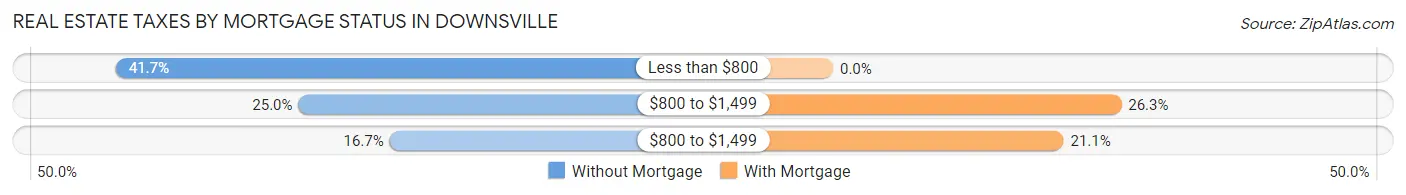
| Property Taxes | Without Mortgage | With Mortgage |
| Less than $800 | 5 (41.7%) | 0 (0.0%) |
| $800 to $1,499 | 3 (25.0%) | 5 (26.3%) |
| $800 to $1,499 | 2 (16.7%) | 4 (21.0%) |
| Total | 12 (100.0%) | 19 (100.0%) |
Health & Disability in Downsville
Health Insurance Coverage by Age in Downsville
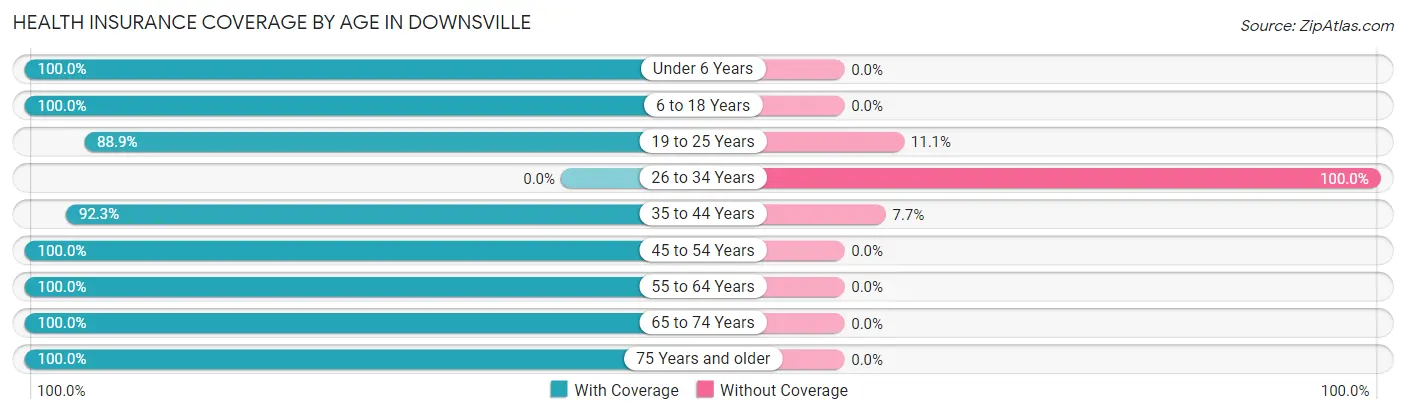
| Age Bracket | With Coverage | Without Coverage |
| Under 6 Years | 8 (100.0%) | 0 (0.0%) |
| 6 to 18 Years | 15 (100.0%) | 0 (0.0%) |
| 19 to 25 Years | 8 (88.9%) | 1 (11.1%) |
| 26 to 34 Years | 0 (0.0%) | 11 (100.0%) |
| 35 to 44 Years | 12 (92.3%) | 1 (7.7%) |
| 45 to 54 Years | 45 (100.0%) | 0 (0.0%) |
| 55 to 64 Years | 3 (100.0%) | 0 (0.0%) |
| 65 to 74 Years | 5 (100.0%) | 0 (0.0%) |
| 75 Years and older | 7 (100.0%) | 0 (0.0%) |
| Total | 103 (88.8%) | 13 (11.2%) |
Health Insurance Coverage by Citizenship Status in Downsville
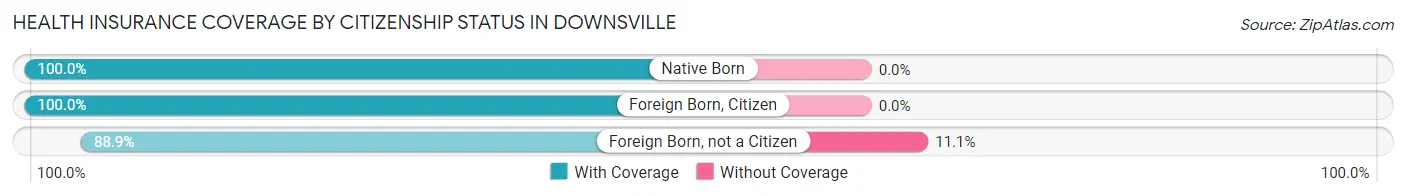
| Citizenship Status | With Coverage | Without Coverage |
| Native Born | 8 (100.0%) | 0 (0.0%) |
| Foreign Born, Citizen | 15 (100.0%) | 0 (0.0%) |
| Foreign Born, not a Citizen | 8 (88.9%) | 1 (11.1%) |
Health Insurance Coverage by Household Income in Downsville
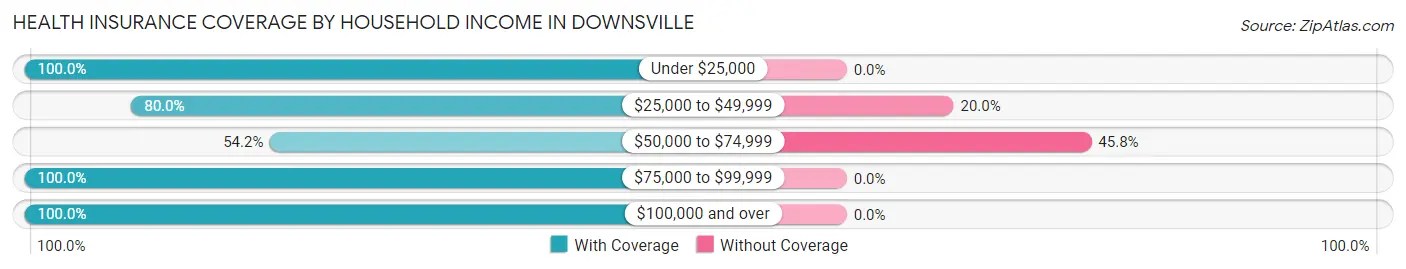
| Household Income | With Coverage | Without Coverage |
| Under $25,000 | 15 (100.0%) | 0 (0.0%) |
| $25,000 to $49,999 | 8 (80.0%) | 2 (20.0%) |
| $50,000 to $74,999 | 13 (54.2%) | 11 (45.8%) |
| $75,000 to $99,999 | 2 (100.0%) | 0 (0.0%) |
| $100,000 and over | 65 (100.0%) | 0 (0.0%) |
Public vs Private Health Insurance Coverage by Age in Downsville
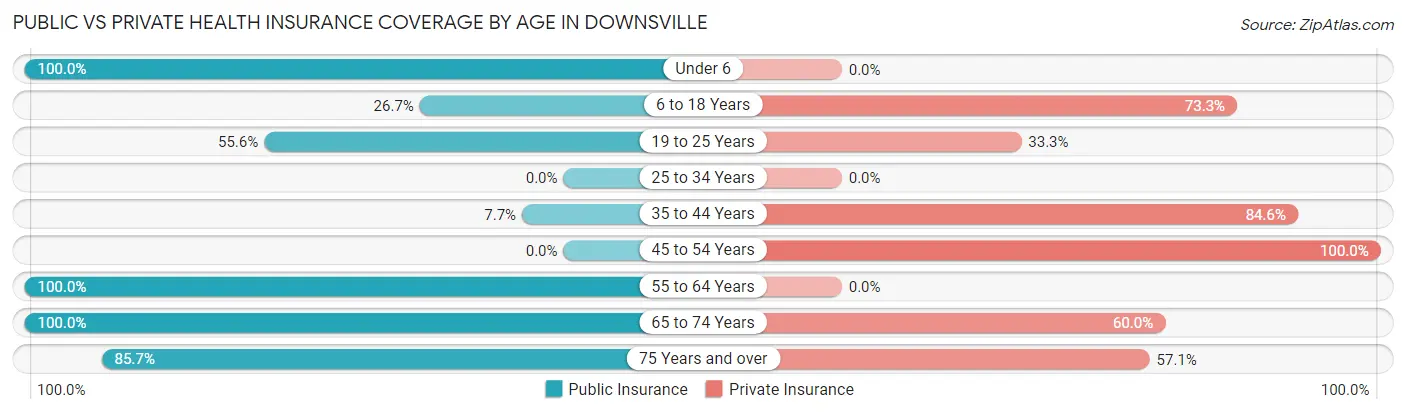
| Age Bracket | Public Insurance | Private Insurance |
| Under 6 | 8 (100.0%) | 0 (0.0%) |
| 6 to 18 Years | 4 (26.7%) | 11 (73.3%) |
| 19 to 25 Years | 5 (55.6%) | 3 (33.3%) |
| 25 to 34 Years | 0 (0.0%) | 0 (0.0%) |
| 35 to 44 Years | 1 (7.7%) | 11 (84.6%) |
| 45 to 54 Years | 0 (0.0%) | 45 (100.0%) |
| 55 to 64 Years | 3 (100.0%) | 0 (0.0%) |
| 65 to 74 Years | 5 (100.0%) | 3 (60.0%) |
| 75 Years and over | 6 (85.7%) | 4 (57.1%) |
| Total | 32 (27.6%) | 77 (66.4%) |
Disability Status by Sex by Age in Downsville
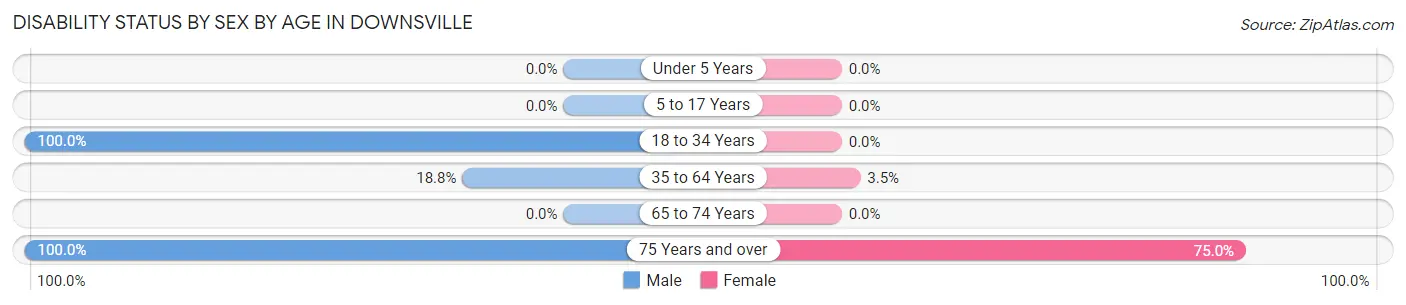
| Age Bracket | Male | Female |
| Under 5 Years | 0 (0.0%) | 0 (0.0%) |
| 5 to 17 Years | 0 (0.0%) | 0 (0.0%) |
| 18 to 34 Years | 1 (100.0%) | 0 (0.0%) |
| 35 to 64 Years | 6 (18.8%) | 1 (3.5%) |
| 65 to 74 Years | 0 (0.0%) | 0 (0.0%) |
| 75 Years and over | 3 (100.0%) | 3 (75.0%) |
Disability Class by Sex by Age in Downsville
Disability Class: Hearing Difficulty
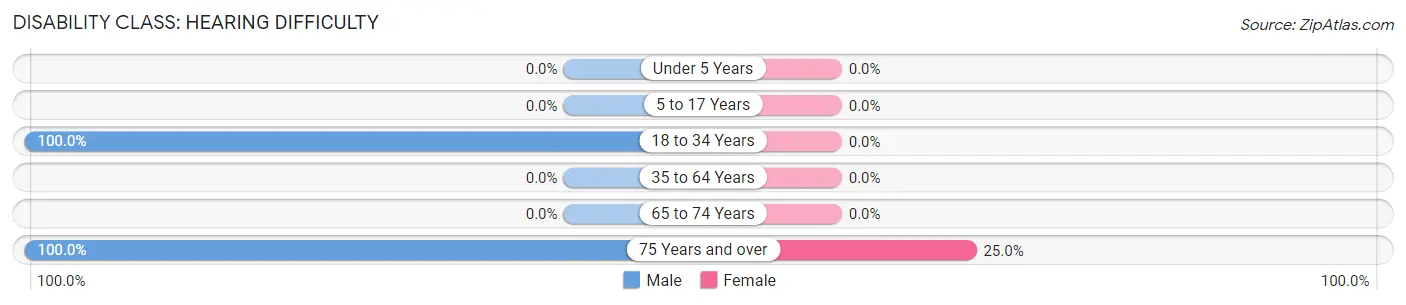
| Age Bracket | Male | Female |
| Under 5 Years | 0 (0.0%) | 0 (0.0%) |
| 5 to 17 Years | 0 (0.0%) | 0 (0.0%) |
| 18 to 34 Years | 1 (100.0%) | 0 (0.0%) |
| 35 to 64 Years | 0 (0.0%) | 0 (0.0%) |
| 65 to 74 Years | 0 (0.0%) | 0 (0.0%) |
| 75 Years and over | 3 (100.0%) | 1 (25.0%) |
Disability Class: Vision Difficulty
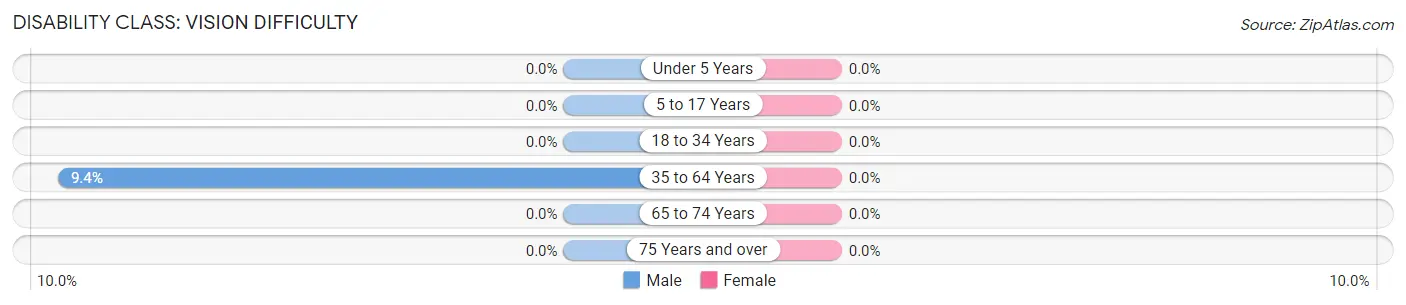
| Age Bracket | Male | Female |
| Under 5 Years | 0 (0.0%) | 0 (0.0%) |
| 5 to 17 Years | 0 (0.0%) | 0 (0.0%) |
| 18 to 34 Years | 0 (0.0%) | 0 (0.0%) |
| 35 to 64 Years | 3 (9.4%) | 0 (0.0%) |
| 65 to 74 Years | 0 (0.0%) | 0 (0.0%) |
| 75 Years and over | 0 (0.0%) | 0 (0.0%) |
Disability Class: Cognitive Difficulty
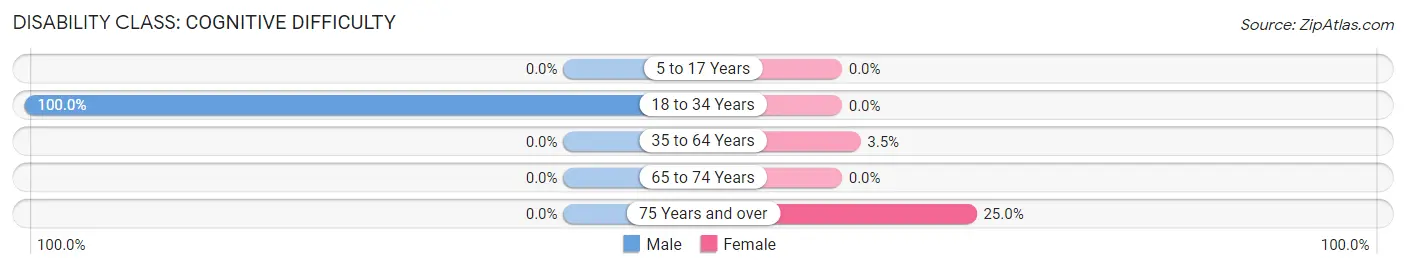
| Age Bracket | Male | Female |
| 5 to 17 Years | 0 (0.0%) | 0 (0.0%) |
| 18 to 34 Years | 1 (100.0%) | 0 (0.0%) |
| 35 to 64 Years | 0 (0.0%) | 1 (3.5%) |
| 65 to 74 Years | 0 (0.0%) | 0 (0.0%) |
| 75 Years and over | 0 (0.0%) | 1 (25.0%) |
Disability Class: Ambulatory Difficulty
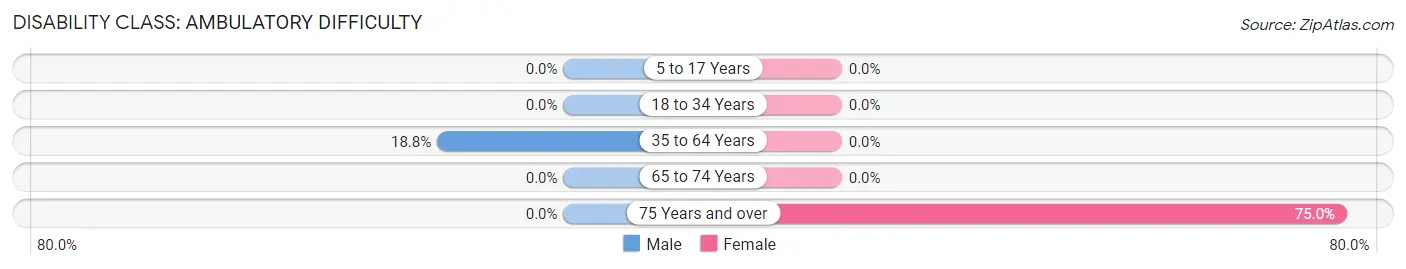
| Age Bracket | Male | Female |
| 5 to 17 Years | 0 (0.0%) | 0 (0.0%) |
| 18 to 34 Years | 0 (0.0%) | 0 (0.0%) |
| 35 to 64 Years | 6 (18.8%) | 0 (0.0%) |
| 65 to 74 Years | 0 (0.0%) | 0 (0.0%) |
| 75 Years and over | 0 (0.0%) | 3 (75.0%) |
Disability Class: Self-Care Difficulty
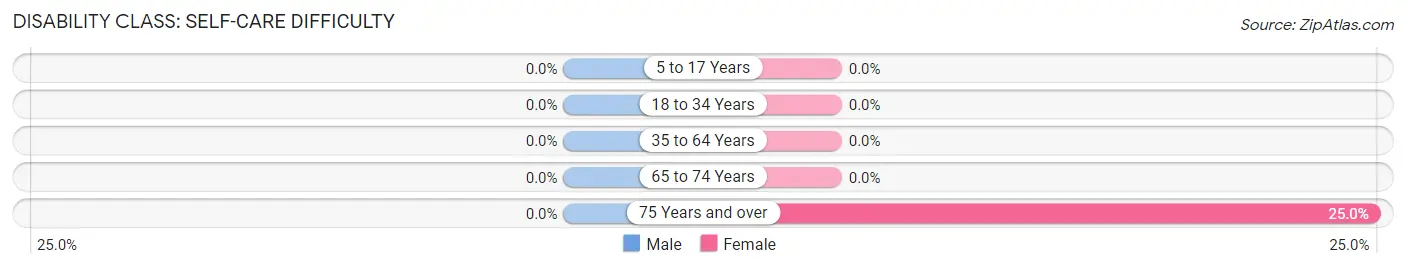
| Age Bracket | Male | Female |
| 5 to 17 Years | 0 (0.0%) | 0 (0.0%) |
| 18 to 34 Years | 0 (0.0%) | 0 (0.0%) |
| 35 to 64 Years | 0 (0.0%) | 0 (0.0%) |
| 65 to 74 Years | 0 (0.0%) | 0 (0.0%) |
| 75 Years and over | 0 (0.0%) | 1 (25.0%) |
Technology Access in Downsville
Computing Device Access in Downsville
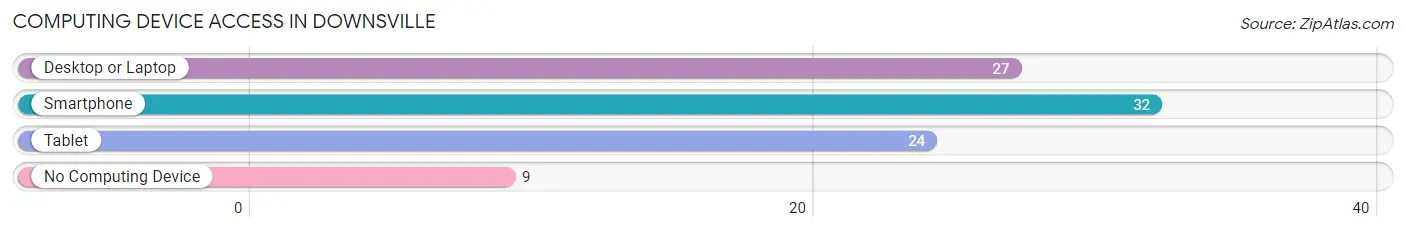
| Device Type | # Households | % Households |
| Desktop or Laptop | 27 | 64.3% |
| Smartphone | 32 | 76.2% |
| Tablet | 24 | 57.1% |
| No Computing Device | 9 | 21.4% |
| Total | 42 | 100.0% |
Internet Access in Downsville
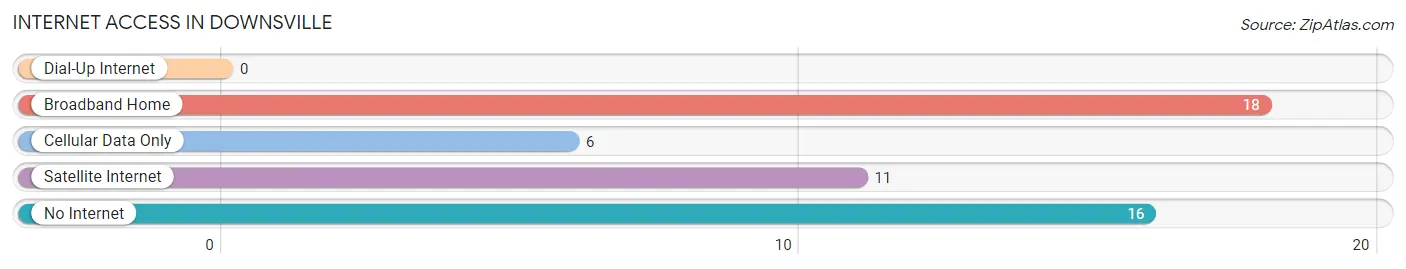
| Internet Type | # Households | % Households |
| Dial-Up Internet | 0 | 0.0% |
| Broadband Home | 18 | 42.9% |
| Cellular Data Only | 6 | 14.3% |
| Satellite Internet | 11 | 26.2% |
| No Internet | 16 | 38.1% |
| Total | 42 | 100.0% |
Downsville Summary
Downsville is a small unincorporated community located in Union Parish, Louisiana. It is situated on the banks of the Ouachita River, approximately 10 miles south of Farmerville. The population of Downsville was estimated to be around 500 in 2020.
History
Downsville was founded in 1845 by William Downs, a former slave who had purchased his freedom. He purchased the land from the local Choctaw Indians and established a small trading post. The town was originally known as Downsville, but was later changed to Downsville-on-the-Ouachita.
The town grew slowly over the years, but it was not until the late 19th century that it began to experience significant growth. The arrival of the railroad in 1887 brought new opportunities for the town, and it soon became a hub for the timber and agricultural industries.
In the early 20th century, the town experienced a period of decline as the timber and agricultural industries moved away. However, the town was revitalized in the 1950s when the Ouachita River was dammed to create Lake D’Arbonne. The lake brought new opportunities for fishing, boating, and other recreational activities, and the town experienced a resurgence in population.
Geography
Downsville is located in Union Parish, Louisiana, approximately 10 miles south of Farmerville. The town is situated on the banks of the Ouachita River, and is surrounded by rolling hills and forests. The climate in Downsville is humid subtropical, with hot summers and mild winters.
Economy
Downsville’s economy is largely based on agriculture and timber. The town is home to several farms, and the surrounding area is known for its timber production. The town is also home to several small businesses, including a grocery store, a hardware store, and a few restaurants.
The town is also home to several recreational activities, including fishing, boating, and camping. The nearby Lake D’Arbonne is a popular destination for fishing and boating, and the town is home to several campgrounds.
Demographics
As of the 2020 census, the population of Downsville was estimated to be around 500. The town is predominantly white, with a small African American population. The median household income in Downsville is $35,000, and the median home value is $90,000. The town has a low unemployment rate, and the poverty rate is below the national average.
Common Questions
What is Per Capita Income in Downsville?
Per Capita income in Downsville is $44,753.
What is the Median Family Income in Downsville?
Median Family Income in Downsville is $130,313.
What is the Median Household income in Downsville?
Median Household Income in Downsville is $128,750.
What is Income or Wage Gap in Downsville?
Income or Wage Gap in Downsville is 68.0%.
Women in Downsville earn 32.0 cents for every dollar earned by a man.
What is Inequality or Gini Index in Downsville?
Inequality or Gini Index in Downsville is 0.33.
What is the Total Population of Downsville?
Total Population of Downsville is 116.
What is the Total Male Population of Downsville?
Total Male Population of Downsville is 47.
What is the Total Female Population of Downsville?
Total Female Population of Downsville is 69.
What is the Ratio of Males per 100 Females in Downsville?
There are 68.12 Males per 100 Females in Downsville.
What is the Ratio of Females per 100 Males in Downsville?
There are 146.81 Females per 100 Males in Downsville.
What is the Median Population Age in Downsville?
Median Population Age in Downsville is 45.7 Years.
What is the Average Family Size in Downsville
Average Family Size in Downsville is 3.1 People.
What is the Average Household Size in Downsville
Average Household Size in Downsville is 2.8 People.
How Large is the Labor Force in Downsville?
There are 66 People in the Labor Forcein in Downsville.
What is the Percentage of People in the Labor Force in Downsville?
70.2% of People are in the Labor Force in Downsville.
What is the Unemployment Rate in Downsville?
Unemployment Rate in Downsville is 1.5%.