Delhi, LA Map & Demographics
Delhi Map
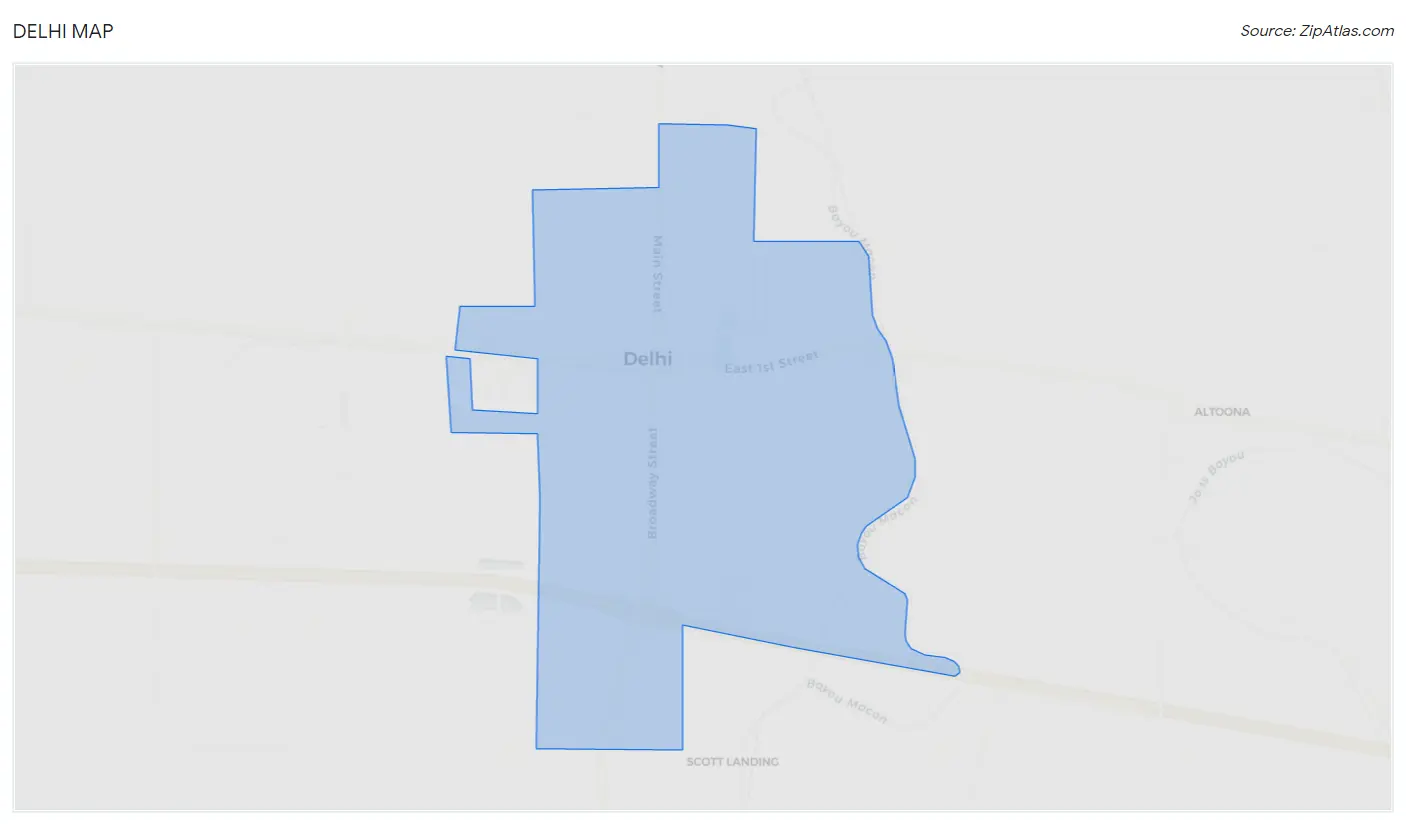
Delhi Overview
$23,368
PER CAPITA INCOME
$51,362
AVG FAMILY INCOME
$43,348
AVG HOUSEHOLD INCOME
14.8%
WAGE / INCOME GAP [ % ]
85.2¢/ $1
WAGE / INCOME GAP [ $ ]
0.51
INEQUALITY / GINI INDEX
2,630
TOTAL POPULATION
1,379
MALE POPULATION
1,251
FEMALE POPULATION
110.23
MALES / 100 FEMALES
90.72
FEMALES / 100 MALES
41.7
MEDIAN AGE
3.2
AVG FAMILY SIZE
2.5
AVG HOUSEHOLD SIZE
1,036
LABOR FORCE [ PEOPLE ]
48.8%
PERCENT IN LABOR FORCE
10.0%
UNEMPLOYMENT RATE
Delhi Zip Codes
Delhi Area Codes
Income in Delhi
Income Overview in Delhi
Per Capita Income in Delhi is $23,368, while median incomes of families and households are $51,362 and $43,348 respectively.
| Characteristic | Number | Measure |
| Per Capita Income | 2,630 | $23,368 |
| Median Family Income | 635 | $51,362 |
| Mean Family Income | 635 | $71,277 |
| Median Household Income | 1,007 | $43,348 |
| Mean Household Income | 1,007 | $59,288 |
| Income Deficit | 635 | $0 |
| Wage / Income Gap (%) | 2,630 | 14.85% |
| Wage / Income Gap ($) | 2,630 | 85.15¢ per $1 |
| Gini / Inequality Index | 2,630 | 0.51 |
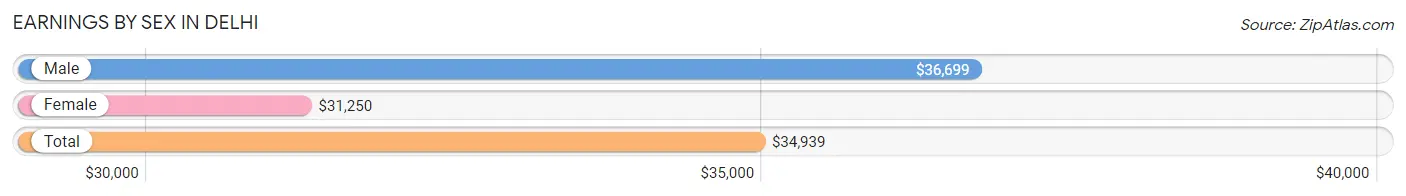
Earnings by Sex in Delhi
Average Earnings in Delhi are $34,939, $36,699 for men and $31,250 for women, a difference of 14.8%.
| Sex | Number | Average Earnings |
| Male | 573 (56.0%) | $36,699 |
| Female | 450 (44.0%) | $31,250 |
| Total | 1,023 (100.0%) | $34,939 |
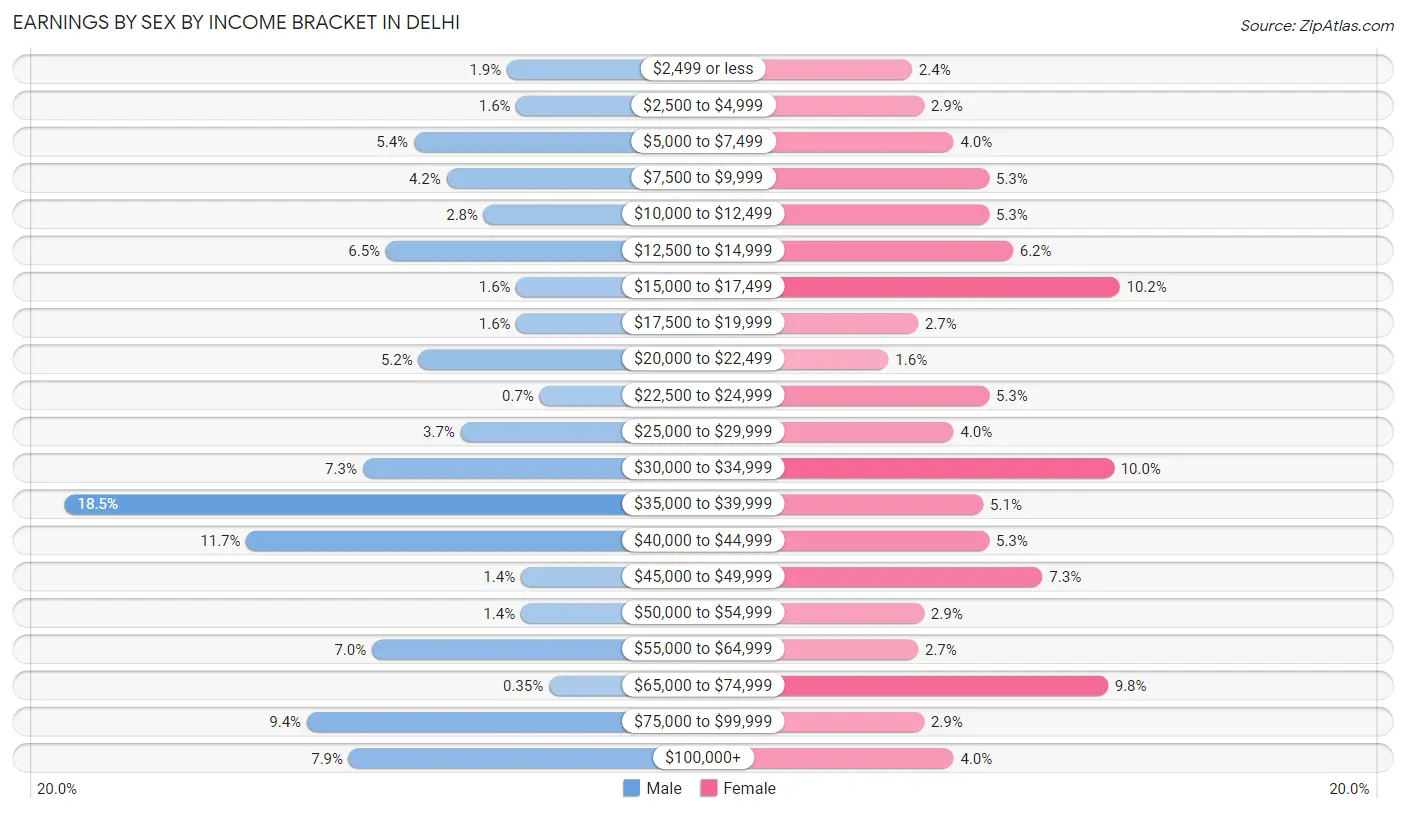
Earnings by Sex by Income Bracket in Delhi
The most common earnings brackets in Delhi are $35,000 to $39,999 for men (106 | 18.5%) and $15,000 to $17,499 for women (46 | 10.2%).
| Income | Male | Female |
| $2,499 or less | 11 (1.9%) | 11 (2.4%) |
| $2,500 to $4,999 | 9 (1.6%) | 13 (2.9%) |
| $5,000 to $7,499 | 31 (5.4%) | 18 (4.0%) |
| $7,500 to $9,999 | 24 (4.2%) | 24 (5.3%) |
| $10,000 to $12,499 | 16 (2.8%) | 24 (5.3%) |
| $12,500 to $14,999 | 37 (6.5%) | 28 (6.2%) |
| $15,000 to $17,499 | 9 (1.6%) | 46 (10.2%) |
| $17,500 to $19,999 | 9 (1.6%) | 12 (2.7%) |
| $20,000 to $22,499 | 30 (5.2%) | 7 (1.6%) |
| $22,500 to $24,999 | 4 (0.7%) | 24 (5.3%) |
| $25,000 to $29,999 | 21 (3.7%) | 18 (4.0%) |
| $30,000 to $34,999 | 42 (7.3%) | 45 (10.0%) |
| $35,000 to $39,999 | 106 (18.5%) | 23 (5.1%) |
| $40,000 to $44,999 | 67 (11.7%) | 24 (5.3%) |
| $45,000 to $49,999 | 8 (1.4%) | 33 (7.3%) |
| $50,000 to $54,999 | 8 (1.4%) | 13 (2.9%) |
| $55,000 to $64,999 | 40 (7.0%) | 12 (2.7%) |
| $65,000 to $74,999 | 2 (0.4%) | 44 (9.8%) |
| $75,000 to $99,999 | 54 (9.4%) | 13 (2.9%) |
| $100,000+ | 45 (7.9%) | 18 (4.0%) |
| Total | 573 (100.0%) | 450 (100.0%) |
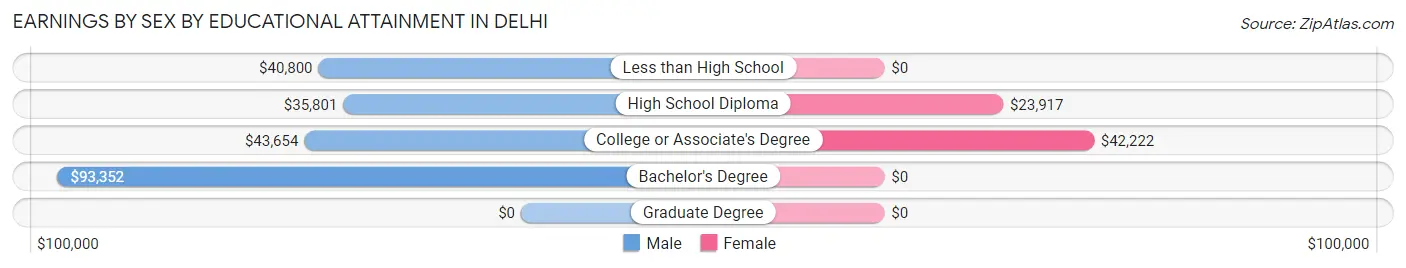
Earnings by Sex by Educational Attainment in Delhi
Average earnings in Delhi are $36,816 for men and $32,917 for women, a difference of 10.6%. Men with an educational attainment of bachelor's degree enjoy the highest average annual earnings of $93,352, while those with high school diploma education earn the least with $35,801. Women with an educational attainment of college or associate's degree earn the most with the average annual earnings of $42,222, while those with high school diploma education have the smallest earnings of $23,917.
| Educational Attainment | Male Income | Female Income |
| Less than High School | $40,800 | $0 |
| High School Diploma | $35,801 | $23,917 |
| College or Associate's Degree | $43,654 | $42,222 |
| Bachelor's Degree | $93,352 | $0 |
| Graduate Degree | - | - |
| Total | $36,816 | $32,917 |
Family Income in Delhi
Family Income Brackets in Delhi
According to the Delhi family income data, there are 149 families falling into the $50,000 to $74,999 income range, which is the most common income bracket and makes up 23.5% of all families. Conversely, the $150,000 to $199,999 income bracket is the least frequent group with only 7 families (1.1%) belonging to this category.
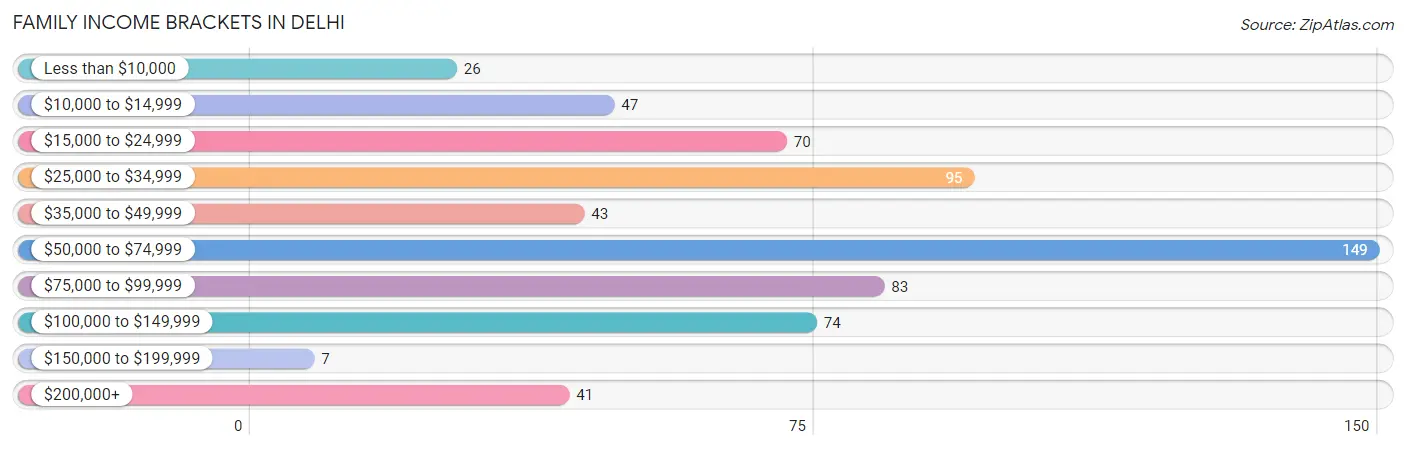
| Income Bracket | # Families | % Families |
| Less than $10,000 | 26 | 4.1% |
| $10,000 to $14,999 | 47 | 7.4% |
| $15,000 to $24,999 | 70 | 11.0% |
| $25,000 to $34,999 | 95 | 15.0% |
| $35,000 to $49,999 | 43 | 6.8% |
| $50,000 to $74,999 | 149 | 23.5% |
| $75,000 to $99,999 | 83 | 13.1% |
| $100,000 to $149,999 | 74 | 11.7% |
| $150,000 to $199,999 | 7 | 1.1% |
| $200,000+ | 41 | 6.5% |
Family Income by Famaliy Size in Delhi
4-person families (97 | 15.3%) account for the highest median family income in Delhi with $82,292 per family, while 2-person families (313 | 49.3%) have the highest median income of $26,648 per family member.
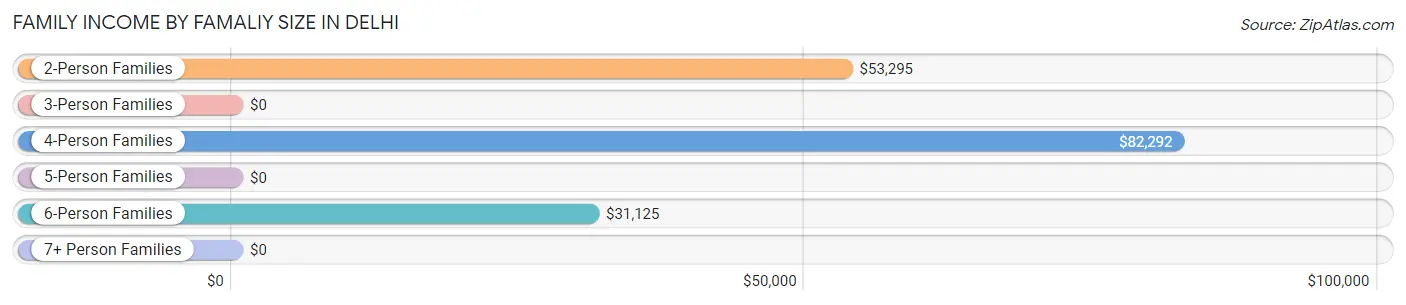
| Income Bracket | # Families | Median Income |
| 2-Person Families | 313 (49.3%) | $53,295 |
| 3-Person Families | 111 (17.5%) | $0 |
| 4-Person Families | 97 (15.3%) | $82,292 |
| 5-Person Families | 60 (9.5%) | $0 |
| 6-Person Families | 54 (8.5%) | $31,125 |
| 7+ Person Families | 0 (0.0%) | $0 |
| Total | 635 (100.0%) | $51,362 |
Family Income by Number of Earners in Delhi
The median family income in Delhi is $51,362, with families comprising 3+ earners (35) having the highest median family income of $89,479, while families with no earners (100) have the lowest median family income of $29,500, accounting for 5.5% and 15.8% of families, respectively.
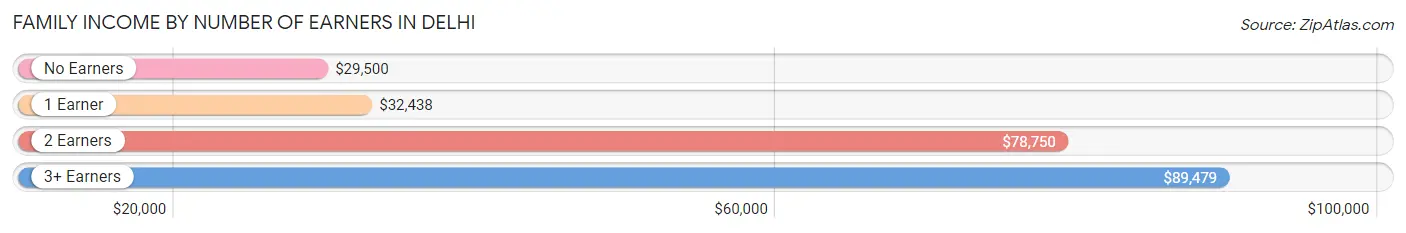
| Number of Earners | # Families | Median Income |
| No Earners | 100 (15.8%) | $29,500 |
| 1 Earner | 329 (51.8%) | $32,438 |
| 2 Earners | 171 (26.9%) | $78,750 |
| 3+ Earners | 35 (5.5%) | $89,479 |
| Total | 635 (100.0%) | $51,362 |
Household Income in Delhi
Household Income Brackets in Delhi
With 198 households falling in the category, the $50,000 to $74,999 income range is the most frequent in Delhi, accounting for 19.7% of all households. In contrast, only 11 households (1.1%) fall into the $150,000 to $199,999 income bracket, making it the least populous group.
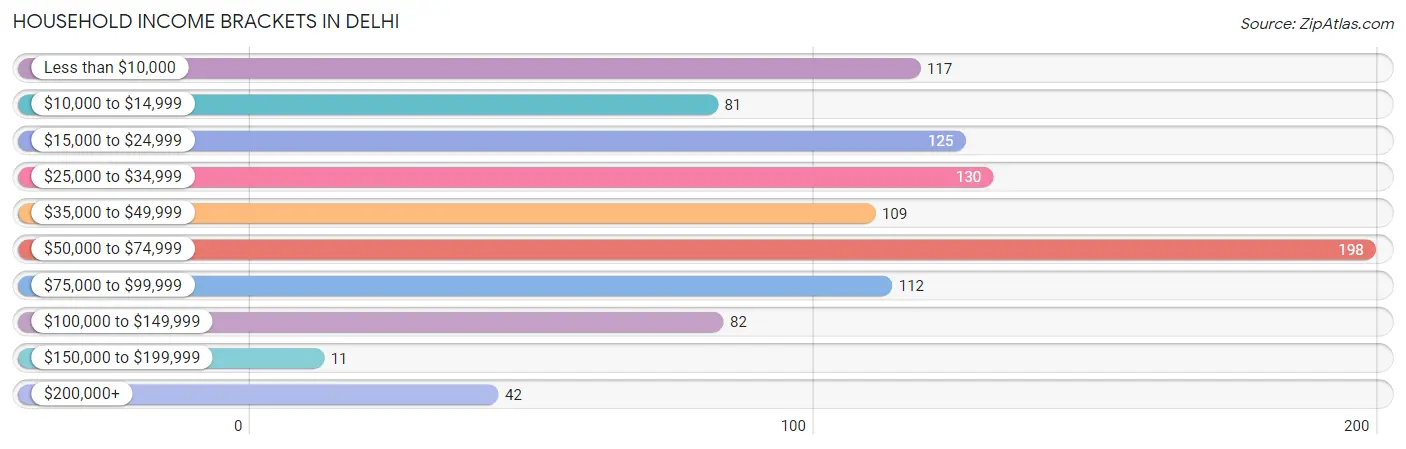
| Income Bracket | # Households | % Households |
| Less than $10,000 | 117 | 11.6% |
| $10,000 to $14,999 | 81 | 8.0% |
| $15,000 to $24,999 | 125 | 12.4% |
| $25,000 to $34,999 | 130 | 12.9% |
| $35,000 to $49,999 | 109 | 10.8% |
| $50,000 to $74,999 | 198 | 19.7% |
| $75,000 to $99,999 | 112 | 11.1% |
| $100,000 to $149,999 | 82 | 8.1% |
| $150,000 to $199,999 | 11 | 1.1% |
| $200,000+ | 42 | 4.2% |
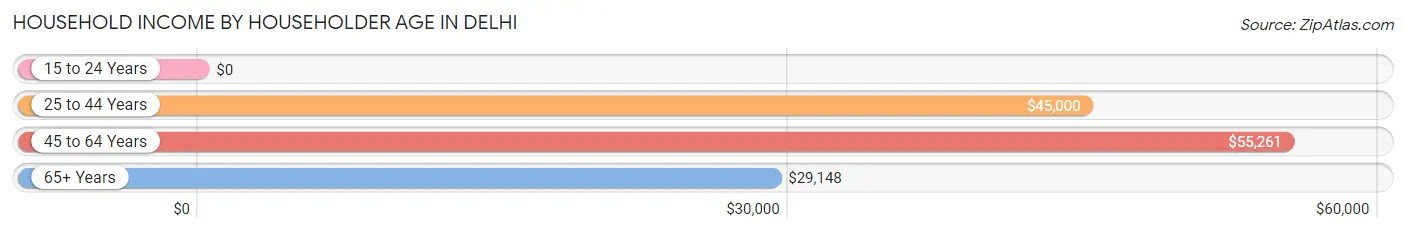
Household Income by Householder Age in Delhi
The median household income in Delhi is $43,348, with the highest median household income of $55,261 found in the 45 to 64 years age bracket for the primary householder. A total of 386 households (38.3%) fall into this category. Meanwhile, the 15 to 24 years age bracket for the primary householder has the lowest median household income of $0, with 29 households (2.9%) in this group.
| Income Bracket | # Households | Median Income |
| 15 to 24 Years | 29 (2.9%) | $0 |
| 25 to 44 Years | 320 (31.8%) | $45,000 |
| 45 to 64 Years | 386 (38.3%) | $55,261 |
| 65+ Years | 272 (27.0%) | $29,148 |
| Total | 1,007 (100.0%) | $43,348 |
Poverty in Delhi
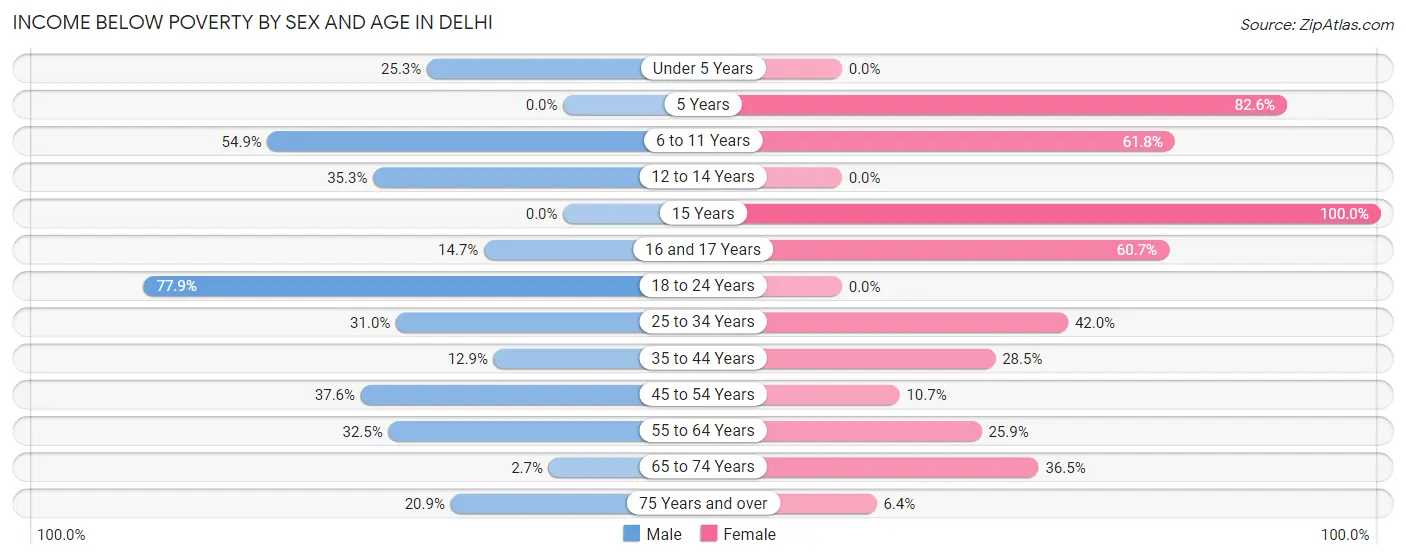
Income Below Poverty by Sex and Age in Delhi
With 33.3% poverty level for males and 28.6% for females among the residents of Delhi, 18 to 24 year old males and 15 year old females are the most vulnerable to poverty, with 127 males (77.9%) and 17 females (100.0%) in their respective age groups living below the poverty level.
| Age Bracket | Male | Female |
| Under 5 Years | 22 (25.3%) | 0 (0.0%) |
| 5 Years | 0 (0.0%) | 19 (82.6%) |
| 6 to 11 Years | 73 (54.9%) | 55 (61.8%) |
| 12 to 14 Years | 18 (35.3%) | 0 (0.0%) |
| 15 Years | 0 (0.0%) | 17 (100.0%) |
| 16 and 17 Years | 5 (14.7%) | 17 (60.7%) |
| 18 to 24 Years | 127 (77.9%) | 0 (0.0%) |
| 25 to 34 Years | 36 (31.0%) | 68 (42.0%) |
| 35 to 44 Years | 31 (12.9%) | 45 (28.5%) |
| 45 to 54 Years | 62 (37.6%) | 15 (10.7%) |
| 55 to 64 Years | 61 (32.5%) | 63 (25.9%) |
| 65 to 74 Years | 2 (2.7%) | 46 (36.5%) |
| 75 Years and over | 14 (20.9%) | 9 (6.4%) |
| Total | 451 (33.3%) | 354 (28.6%) |
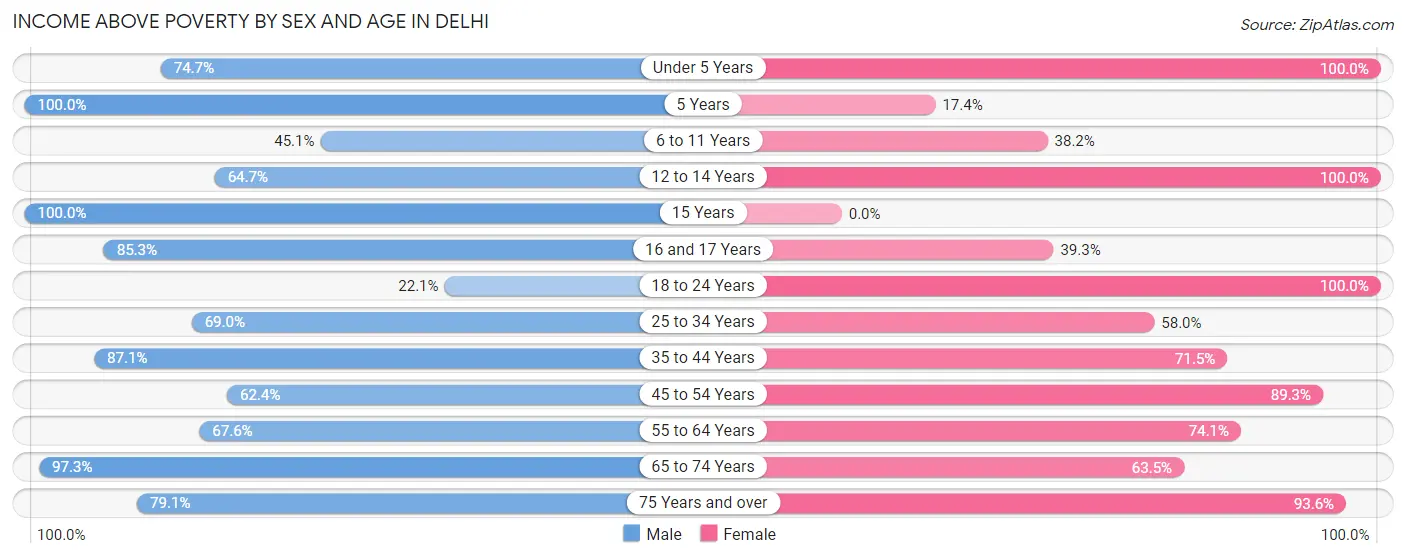
Income Above Poverty by Sex and Age in Delhi
According to the poverty statistics in Delhi, males aged 5 years and females aged under 5 years are the age groups that are most secure financially, with 100.0% of males and 100.0% of females in these age groups living above the poverty line.
| Age Bracket | Male | Female |
| Under 5 Years | 65 (74.7%) | 13 (100.0%) |
| 5 Years | 5 (100.0%) | 4 (17.4%) |
| 6 to 11 Years | 60 (45.1%) | 34 (38.2%) |
| 12 to 14 Years | 33 (64.7%) | 54 (100.0%) |
| 15 Years | 30 (100.0%) | 0 (0.0%) |
| 16 and 17 Years | 29 (85.3%) | 11 (39.3%) |
| 18 to 24 Years | 36 (22.1%) | 44 (100.0%) |
| 25 to 34 Years | 80 (69.0%) | 94 (58.0%) |
| 35 to 44 Years | 209 (87.1%) | 113 (71.5%) |
| 45 to 54 Years | 103 (62.4%) | 125 (89.3%) |
| 55 to 64 Years | 127 (67.5%) | 180 (74.1%) |
| 65 to 74 Years | 72 (97.3%) | 80 (63.5%) |
| 75 Years and over | 53 (79.1%) | 131 (93.6%) |
| Total | 902 (66.7%) | 883 (71.4%) |
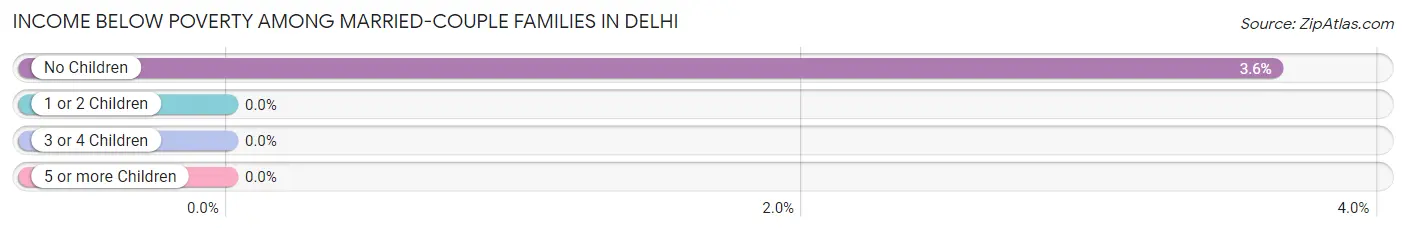
Income Below Poverty Among Married-Couple Families in Delhi
The poverty statistics for married-couple families in Delhi show that 2.6% or 9 of the total 352 families live below the poverty line. Families with no children have the highest poverty rate of 3.6%, comprising of 9 families. On the other hand, families with 1 or 2 children have the lowest poverty rate of 0.0%, which includes 0 families.
| Children | Above Poverty | Below Poverty |
| No Children | 238 (96.4%) | 9 (3.6%) |
| 1 or 2 Children | 105 (100.0%) | 0 (0.0%) |
| 3 or 4 Children | 0 (0.0%) | 0 (0.0%) |
| 5 or more Children | 0 (0.0%) | 0 (0.0%) |
| Total | 343 (97.4%) | 9 (2.6%) |
Income Below Poverty Among Single-Parent Households in Delhi
According to the poverty data in Delhi, 49.5% or 49 single-father households and 53.8% or 99 single-mother households are living below the poverty line. Among single-father households, those with no children have the highest poverty rate, with 29 households (72.5%) experiencing poverty. Likewise, among single-mother households, those with 1 or 2 children have the highest poverty rate, with 46 households (63.9%) falling below the poverty line.
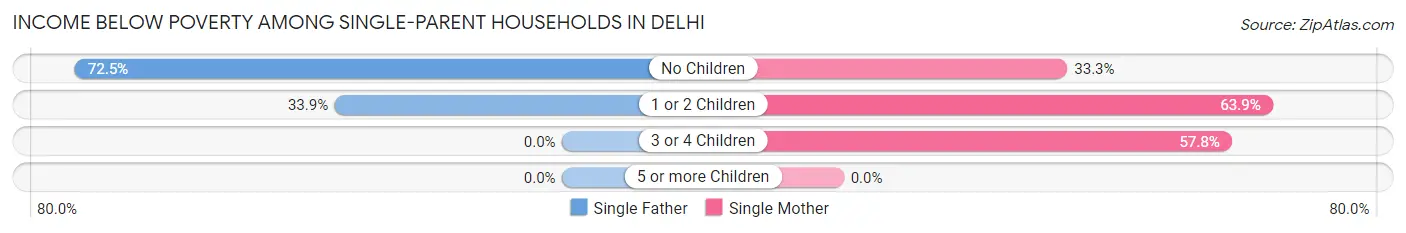
| Children | Single Father | Single Mother |
| No Children | 29 (72.5%) | 16 (33.3%) |
| 1 or 2 Children | 20 (33.9%) | 46 (63.9%) |
| 3 or 4 Children | 0 (0.0%) | 37 (57.8%) |
| 5 or more Children | 0 (0.0%) | 0 (0.0%) |
| Total | 49 (49.5%) | 99 (53.8%) |
Income Below Poverty Among Married-Couple vs Single-Parent Households in Delhi
The poverty data for Delhi shows that 9 of the married-couple family households (2.6%) and 148 of the single-parent households (52.3%) are living below the poverty level. Within the married-couple family households, those with no children have the highest poverty rate, with 9 households (3.6%) falling below the poverty line. Among the single-parent households, those with 3 or 4 children have the highest poverty rate, with 37 household (57.8%) living below poverty.
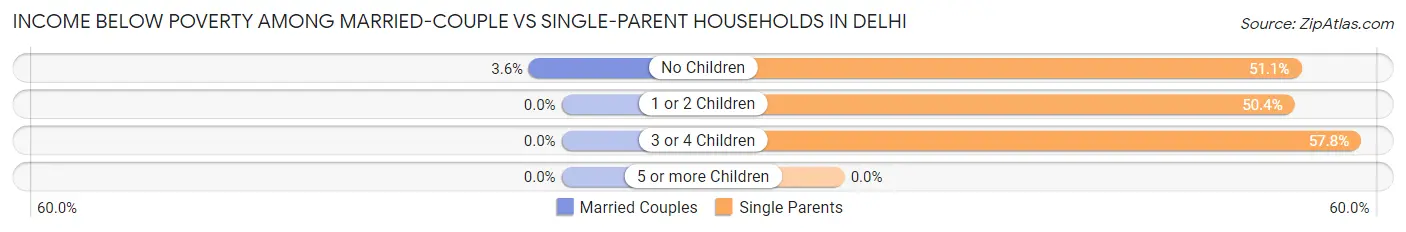
| Children | Married-Couple Families | Single-Parent Households |
| No Children | 9 (3.6%) | 45 (51.1%) |
| 1 or 2 Children | 0 (0.0%) | 66 (50.4%) |
| 3 or 4 Children | 0 (0.0%) | 37 (57.8%) |
| 5 or more Children | 0 (0.0%) | 0 (0.0%) |
| Total | 9 (2.6%) | 148 (52.3%) |
Race in Delhi
The most populous races in Delhi are Black / African American (1,454 | 55.3%), White / Caucasian (1,085 | 41.2%), and Two or more Races (71 | 2.7%).
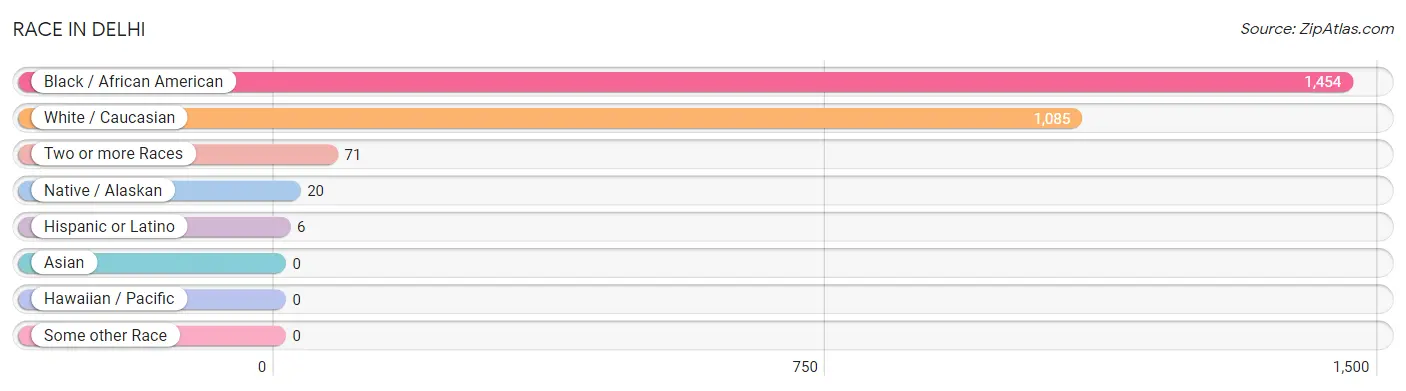
| Race | # Population | % Population |
| Asian | 0 | 0.0% |
| Black / African American | 1,454 | 55.3% |
| Hawaiian / Pacific | 0 | 0.0% |
| Hispanic or Latino | 6 | 0.2% |
| Native / Alaskan | 20 | 0.8% |
| White / Caucasian | 1,085 | 41.2% |
| Two or more Races | 71 | 2.7% |
| Some other Race | 0 | 0.0% |
| Total | 2,630 | 100.0% |
Ancestry in Delhi
The most populous ancestries reported in Delhi are Irish (267 | 10.2%), American (261 | 9.9%), Arab (87 | 3.3%), English (63 | 2.4%), and German (51 | 1.9%), together accounting for 27.7% of all Delhi residents.
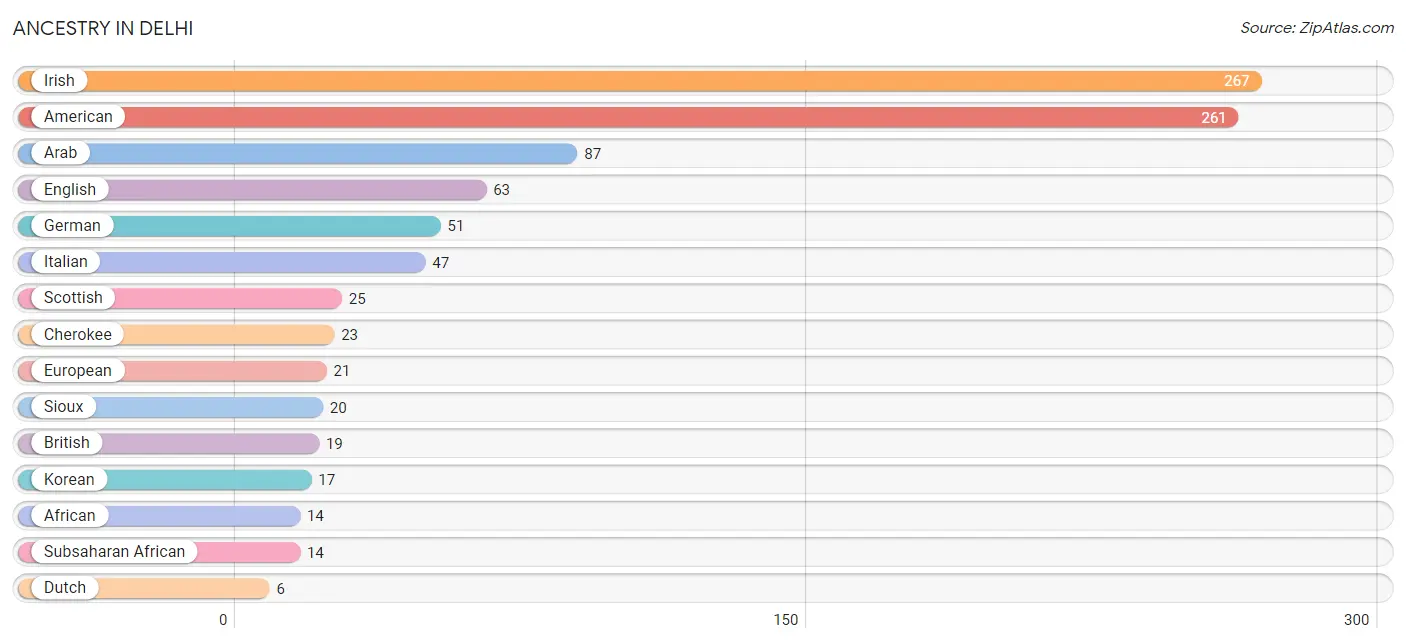
| Ancestry | # Population | % Population |
| African | 14 | 0.5% |
| American | 261 | 9.9% |
| Arab | 87 | 3.3% |
| British | 19 | 0.7% |
| Central American | 5 | 0.2% |
| Cherokee | 23 | 0.9% |
| Choctaw | 4 | 0.2% |
| Dutch | 6 | 0.2% |
| English | 63 | 2.4% |
| European | 21 | 0.8% |
| German | 51 | 1.9% |
| Honduran | 5 | 0.2% |
| Irish | 267 | 10.2% |
| Italian | 47 | 1.8% |
| Korean | 17 | 0.6% |
| Mexican | 1 | 0.0% |
| Polish | 5 | 0.2% |
| Scottish | 25 | 0.9% |
| Sioux | 20 | 0.8% |
| Subsaharan African | 14 | 0.5% | View All 20 Rows |
Immigrants in Delhi
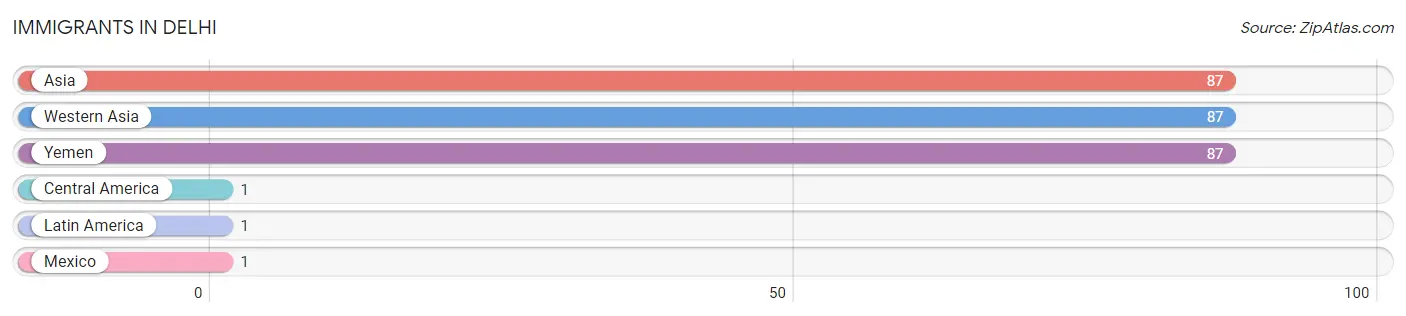
The most numerous immigrant groups reported in Delhi came from Asia (87 | 3.3%), Western Asia (87 | 3.3%), Yemen (87 | 3.3%), Central America (1 | 0.0%), and Latin America (1 | 0.0%), together accounting for 10.0% of all Delhi residents.
| Immigration Origin | # Population | % Population |
| Asia | 87 | 3.3% |
| Central America | 1 | 0.0% |
| Latin America | 1 | 0.0% |
| Mexico | 1 | 0.0% |
| Western Asia | 87 | 3.3% |
| Yemen | 87 | 3.3% | View All 6 Rows |
Sex and Age in Delhi
Sex and Age in Delhi
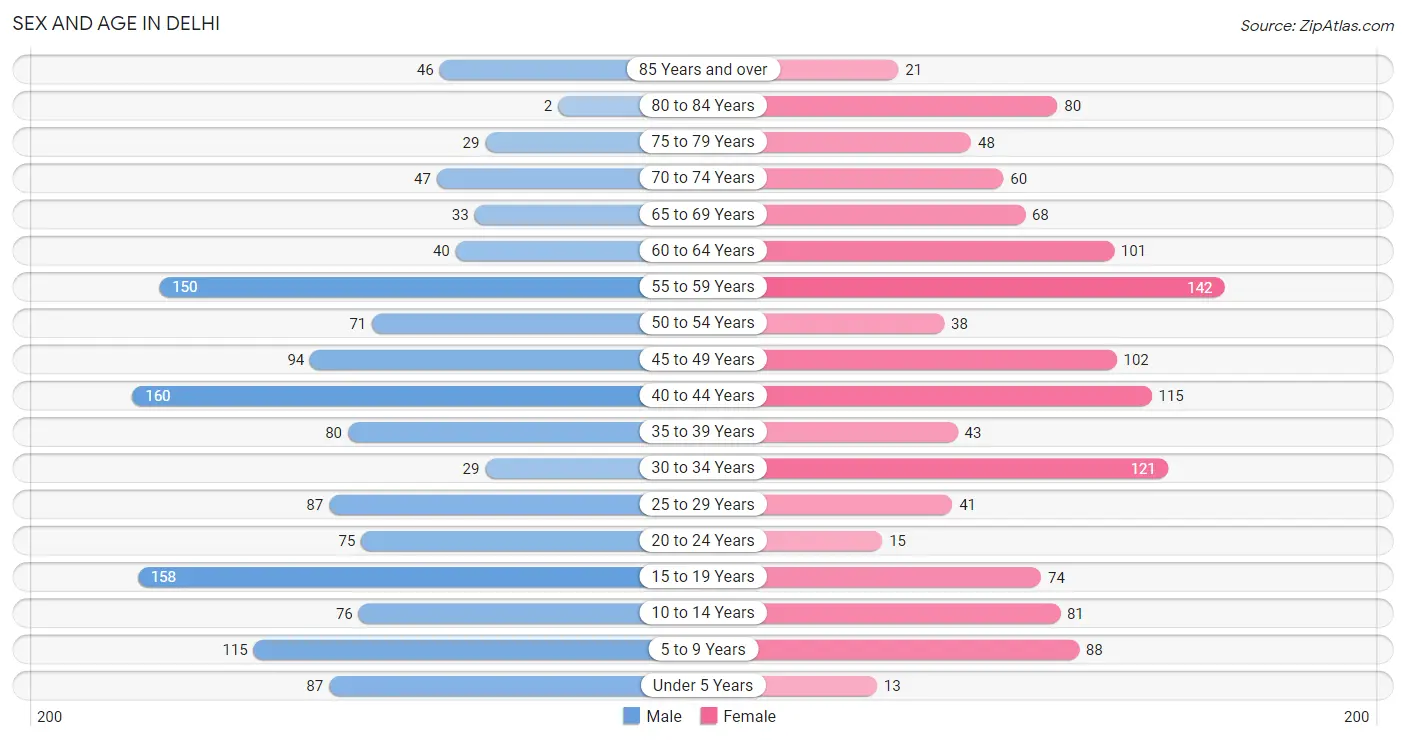
The most populous age groups in Delhi are 40 to 44 Years (160 | 11.6%) for men and 55 to 59 Years (142 | 11.4%) for women.
| Age Bracket | Male | Female |
| Under 5 Years | 87 (6.3%) | 13 (1.0%) |
| 5 to 9 Years | 115 (8.3%) | 88 (7.0%) |
| 10 to 14 Years | 76 (5.5%) | 81 (6.5%) |
| 15 to 19 Years | 158 (11.5%) | 74 (5.9%) |
| 20 to 24 Years | 75 (5.4%) | 15 (1.2%) |
| 25 to 29 Years | 87 (6.3%) | 41 (3.3%) |
| 30 to 34 Years | 29 (2.1%) | 121 (9.7%) |
| 35 to 39 Years | 80 (5.8%) | 43 (3.4%) |
| 40 to 44 Years | 160 (11.6%) | 115 (9.2%) |
| 45 to 49 Years | 94 (6.8%) | 102 (8.2%) |
| 50 to 54 Years | 71 (5.1%) | 38 (3.0%) |
| 55 to 59 Years | 150 (10.9%) | 142 (11.4%) |
| 60 to 64 Years | 40 (2.9%) | 101 (8.1%) |
| 65 to 69 Years | 33 (2.4%) | 68 (5.4%) |
| 70 to 74 Years | 47 (3.4%) | 60 (4.8%) |
| 75 to 79 Years | 29 (2.1%) | 48 (3.8%) |
| 80 to 84 Years | 2 (0.2%) | 80 (6.4%) |
| 85 Years and over | 46 (3.3%) | 21 (1.7%) |
| Total | 1,379 (100.0%) | 1,251 (100.0%) |
Families and Households in Delhi
Median Family Size in Delhi
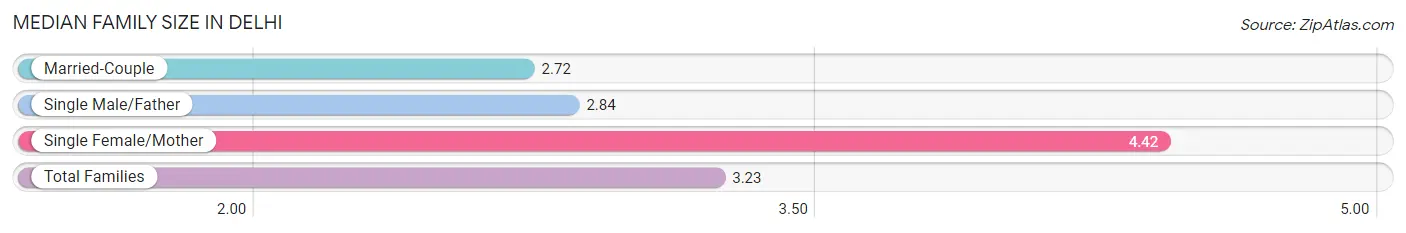
The median family size in Delhi is 3.23 persons per family, with single female/mother families (184 | 29.0%) accounting for the largest median family size of 4.42 persons per family. On the other hand, married-couple families (352 | 55.4%) represent the smallest median family size with 2.72 persons per family.
| Family Type | # Families | Family Size |
| Married-Couple | 352 (55.4%) | 2.72 |
| Single Male/Father | 99 (15.6%) | 2.84 |
| Single Female/Mother | 184 (29.0%) | 4.42 |
| Total Families | 635 (100.0%) | 3.23 |
Median Household Size in Delhi
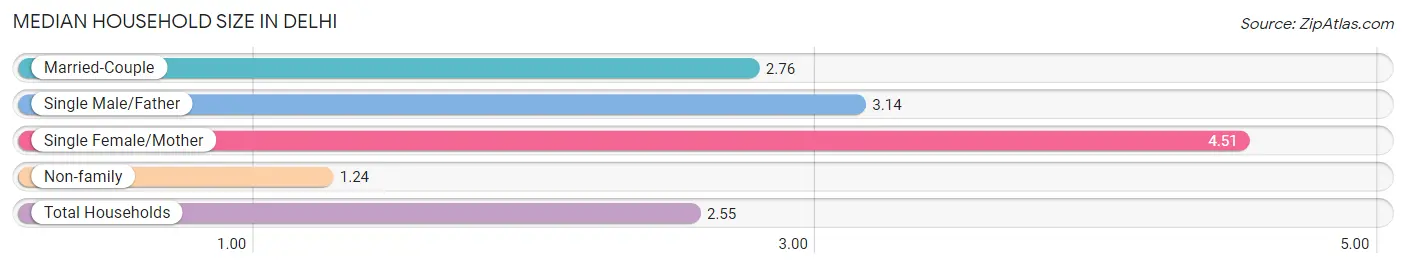
The median household size in Delhi is 2.55 persons per household, with single female/mother households (184 | 18.3%) accounting for the largest median household size of 4.51 persons per household. non-family households (372 | 36.9%) represent the smallest median household size with 1.24 persons per household.
| Household Type | # Households | Household Size |
| Married-Couple | 352 (35.0%) | 2.76 |
| Single Male/Father | 99 (9.8%) | 3.14 |
| Single Female/Mother | 184 (18.3%) | 4.51 |
| Non-family | 372 (36.9%) | 1.24 |
| Total Households | 1,007 (100.0%) | 2.55 |
Household Size by Marriage Status in Delhi
Out of a total of 1,007 households in Delhi, 635 (63.1%) are family households, while 372 (36.9%) are nonfamily households. The most numerous type of family households are 2-person households, comprising 299, and the most common type of nonfamily households are 1-person households, comprising 306.
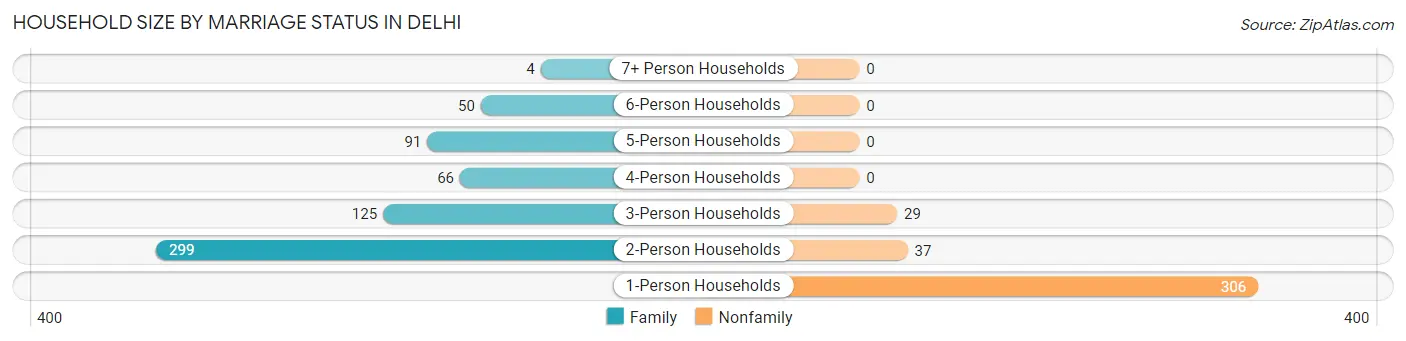
| Household Size | Family Households | Nonfamily Households |
| 1-Person Households | - | 306 (30.4%) |
| 2-Person Households | 299 (29.7%) | 37 (3.7%) |
| 3-Person Households | 125 (12.4%) | 29 (2.9%) |
| 4-Person Households | 66 (6.6%) | 0 (0.0%) |
| 5-Person Households | 91 (9.0%) | 0 (0.0%) |
| 6-Person Households | 50 (5.0%) | 0 (0.0%) |
| 7+ Person Households | 4 (0.4%) | 0 (0.0%) |
| Total | 635 (63.1%) | 372 (36.9%) |
Female Fertility in Delhi
Fertility by Age in Delhi
| Age Bracket | Women with Births | Births / 1,000 Women |
| 15 to 19 years | 0 (0.0%) | 0.0 |
| 20 to 34 years | 0 (0.0%) | 0.0 |
| 35 to 50 years | 0 (0.0%) | 0.0 |
| Total | 0 (0.0%) | 0.0 |
Fertility by Age by Marriage Status in Delhi
| Age Bracket | Married | Unmarried |
| 15 to 19 years | 0 (0.0%) | 0 (0.0%) |
| 20 to 34 years | 0 (0.0%) | 0 (0.0%) |
| 35 to 50 years | 0 (0.0%) | 0 (0.0%) |
| Total | 0 (0.0%) | 0 (0.0%) |
Fertility by Education in Delhi
| Educational Attainment | Women with Births | Births / 1,000 Women |
| Less than High School | 0 (0.0%) | 0.0 |
| High School Diploma | 0 (0.0%) | 0.0 |
| College or Associate's Degree | 0 (0.0%) | 0.0 |
| Bachelor's Degree | 0 (0.0%) | 0.0 |
| Graduate Degree | 0 (0.0%) | 0.0 |
| Total | 0 (0.0%) | 0.0 |
Fertility by Education by Marriage Status in Delhi
| Educational Attainment | Married | Unmarried |
| Less than High School | 0 (0.0%) | 0 (0.0%) |
| High School Diploma | 0 (0.0%) | 0 (0.0%) |
| College or Associate's Degree | 0 (0.0%) | 0 (0.0%) |
| Bachelor's Degree | 0 (0.0%) | 0 (0.0%) |
| Graduate Degree | 0 (0.0%) | 0 (0.0%) |
| Total | 0 (0.0%) | 0 (0.0%) |
Employment Characteristics in Delhi
Employment by Class of Employer in Delhi
Among the 924 employed individuals in Delhi, private company employees (683 | 73.9%), not-for-profit organizations (53 | 5.7%), and self-employed (incorporated) (48 | 5.2%) make up the most common classes of employment.
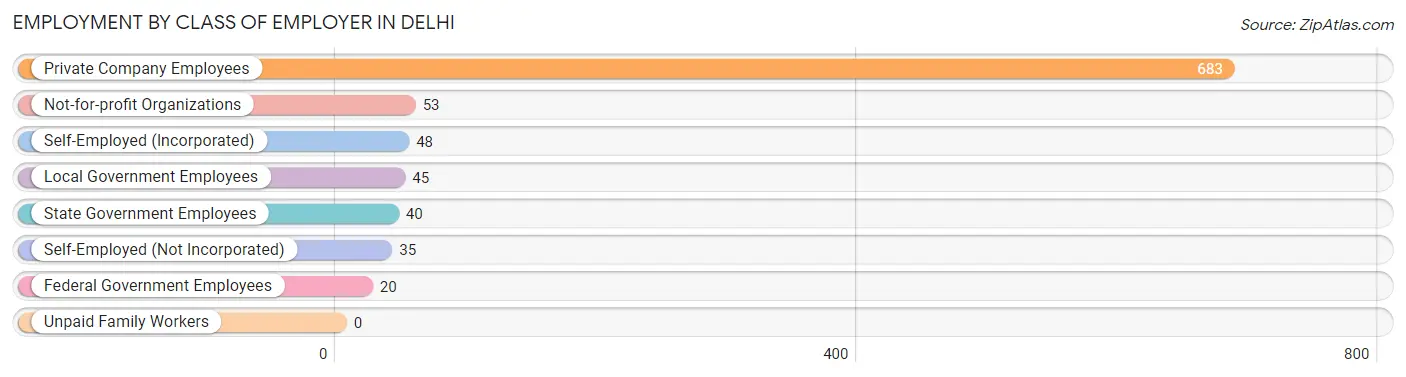
| Employer Class | # Employees | % Employees |
| Private Company Employees | 683 | 73.9% |
| Self-Employed (Incorporated) | 48 | 5.2% |
| Self-Employed (Not Incorporated) | 35 | 3.8% |
| Not-for-profit Organizations | 53 | 5.7% |
| Local Government Employees | 45 | 4.9% |
| State Government Employees | 40 | 4.3% |
| Federal Government Employees | 20 | 2.2% |
| Unpaid Family Workers | 0 | 0.0% |
| Total | 924 | 100.0% |
Employment Status by Age in Delhi
According to the labor force statistics for Delhi, out of the total population over 16 years of age (2,122), 48.8% or 1,036 individuals are in the labor force, with 10.0% or 104 of them unemployed. The age group with the highest labor force participation rate is 25 to 29 years, with 83.6% or 107 individuals in the labor force. Within the labor force, the 25 to 29 years age range has the highest percentage of unemployed individuals, with 34.6% or 37 of them being unemployed.
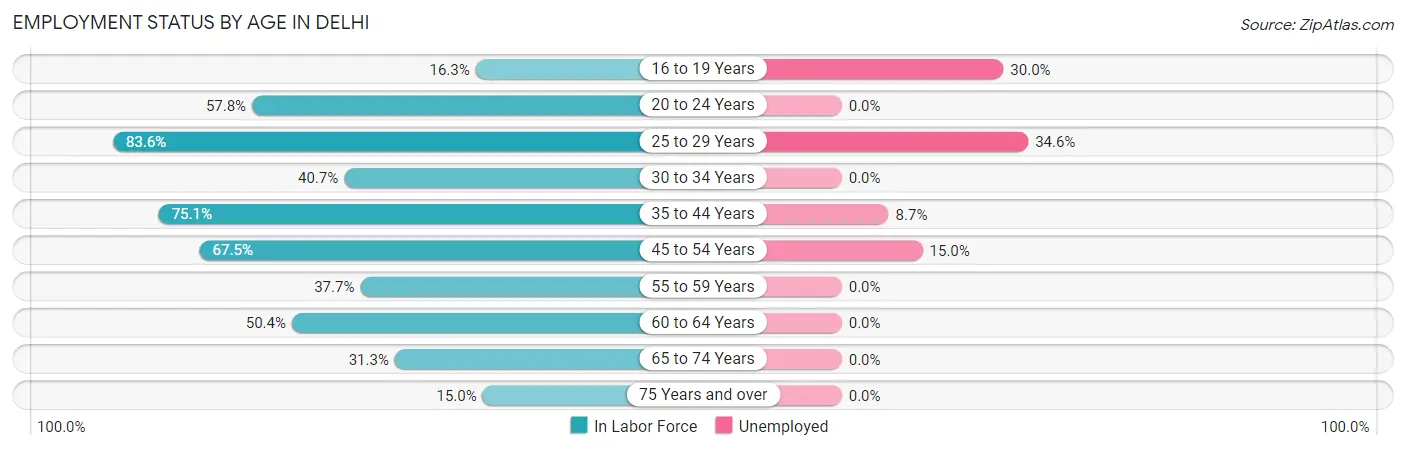
| Age Bracket | In Labor Force | Unemployed |
| 16 to 19 Years | 30 (16.3%) | 9 (30.0%) |
| 20 to 24 Years | 52 (57.8%) | 0 (0.0%) |
| 25 to 29 Years | 107 (83.6%) | 37 (34.6%) |
| 30 to 34 Years | 61 (40.7%) | 0 (0.0%) |
| 35 to 44 Years | 299 (75.1%) | 26 (8.7%) |
| 45 to 54 Years | 206 (67.5%) | 31 (15.0%) |
| 55 to 59 Years | 110 (37.7%) | 0 (0.0%) |
| 60 to 64 Years | 71 (50.4%) | 0 (0.0%) |
| 65 to 74 Years | 65 (31.3%) | 0 (0.0%) |
| 75 Years and over | 34 (15.0%) | 0 (0.0%) |
| Total | 1,036 (48.8%) | 104 (10.0%) |
Employment Status by Educational Attainment in Delhi
According to labor force statistics for Delhi, 60.4% of individuals (854) out of the total population between 25 and 64 years of age (1,414) are in the labor force, with 11.0% or 94 of them being unemployed. The group with the highest labor force participation rate are those with the educational attainment of college / associate degree, with 72.1% or 284 individuals in the labor force. Within the labor force, individuals with high school diploma education have the highest percentage of unemployment, with 17.1% or 63 of them being unemployed.
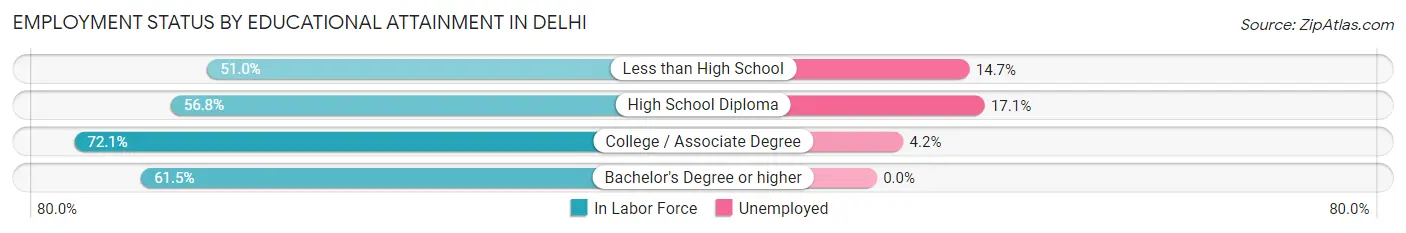
| Educational Attainment | In Labor Force | Unemployed |
| Less than High School | 129 (51.0%) | 37 (14.7%) |
| High School Diploma | 369 (56.8%) | 111 (17.1%) |
| College / Associate Degree | 284 (72.1%) | 17 (4.2%) |
| Bachelor's Degree or higher | 72 (61.5%) | 0 (0.0%) |
| Total | 854 (60.4%) | 156 (11.0%) |
Employment Occupations by Sex in Delhi
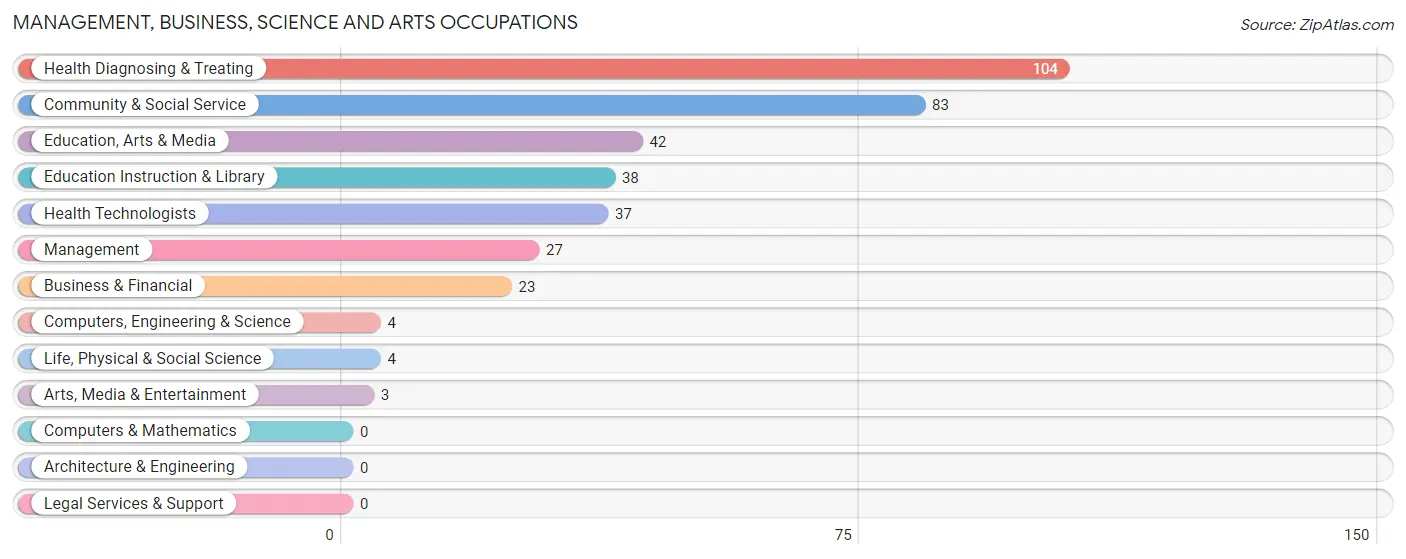
Management, Business, Science and Arts Occupations
The most common Management, Business, Science and Arts occupations in Delhi are Health Diagnosing & Treating (104 | 11.2%), Community & Social Service (83 | 8.9%), Education, Arts & Media (42 | 4.5%), Education Instruction & Library (38 | 4.1%), and Health Technologists (37 | 4.0%).
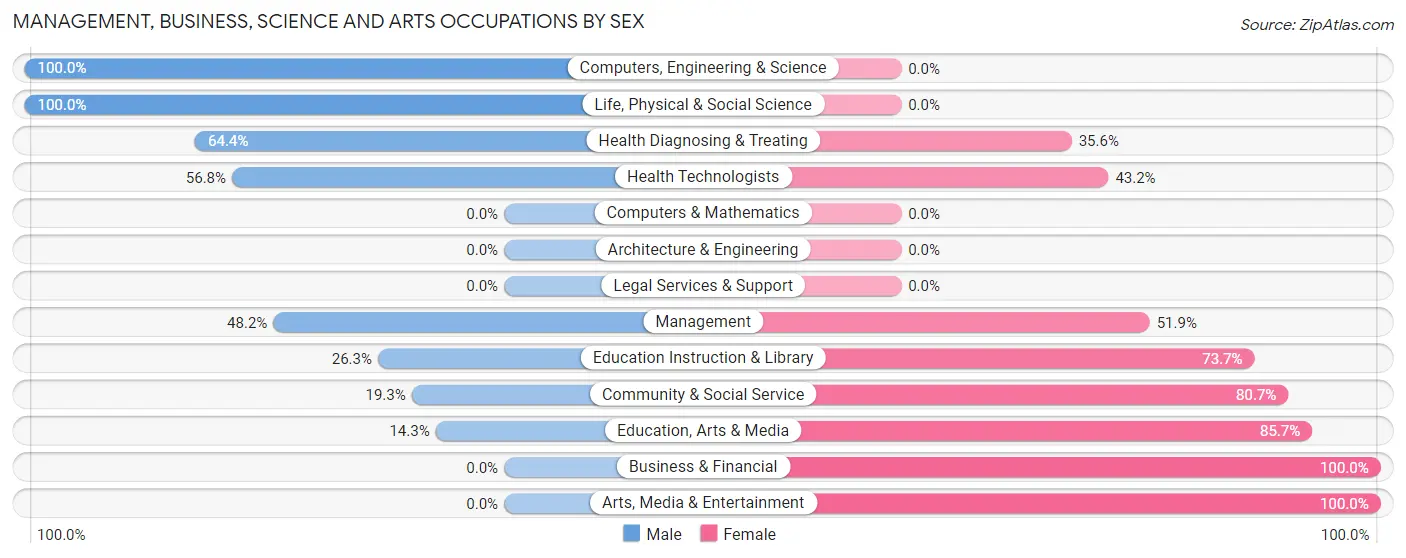
Management, Business, Science and Arts Occupations by Sex
Within the Management, Business, Science and Arts occupations in Delhi, the most male-oriented occupations are Computers, Engineering & Science (100.0%), Life, Physical & Social Science (100.0%), and Health Diagnosing & Treating (64.4%), while the most female-oriented occupations are Business & Financial (100.0%), Arts, Media & Entertainment (100.0%), and Education, Arts & Media (85.7%).
| Occupation | Male | Female |
| Management | 13 (48.1%) | 14 (51.8%) |
| Business & Financial | 0 (0.0%) | 23 (100.0%) |
| Computers, Engineering & Science | 4 (100.0%) | 0 (0.0%) |
| Computers & Mathematics | 0 (0.0%) | 0 (0.0%) |
| Architecture & Engineering | 0 (0.0%) | 0 (0.0%) |
| Life, Physical & Social Science | 4 (100.0%) | 0 (0.0%) |
| Community & Social Service | 16 (19.3%) | 67 (80.7%) |
| Education, Arts & Media | 6 (14.3%) | 36 (85.7%) |
| Legal Services & Support | 0 (0.0%) | 0 (0.0%) |
| Education Instruction & Library | 10 (26.3%) | 28 (73.7%) |
| Arts, Media & Entertainment | 0 (0.0%) | 3 (100.0%) |
| Health Diagnosing & Treating | 67 (64.4%) | 37 (35.6%) |
| Health Technologists | 21 (56.8%) | 16 (43.2%) |
| Total (Category) | 100 (41.5%) | 141 (58.5%) |
| Total (Overall) | 527 (56.6%) | 405 (43.4%) |
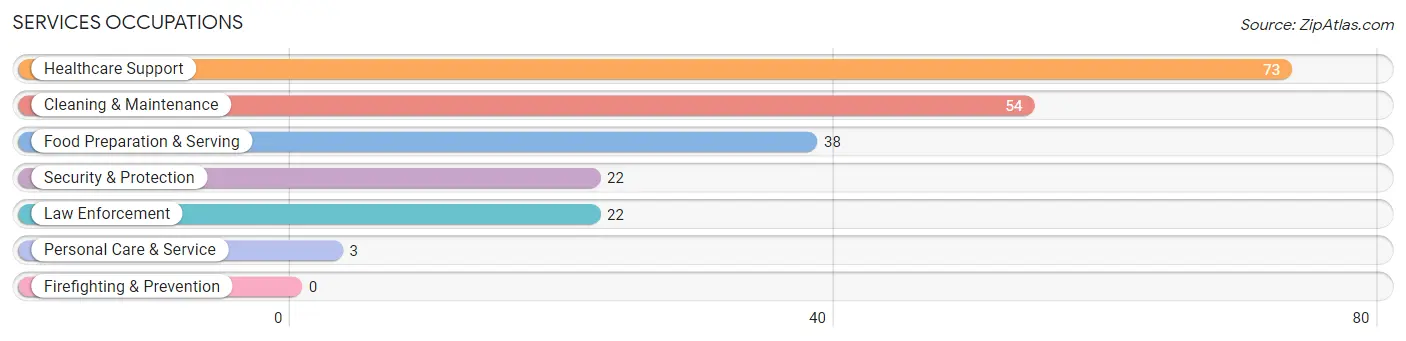
Services Occupations
The most common Services occupations in Delhi are Healthcare Support (73 | 7.8%), Cleaning & Maintenance (54 | 5.8%), Food Preparation & Serving (38 | 4.1%), Security & Protection (22 | 2.4%), and Law Enforcement (22 | 2.4%).
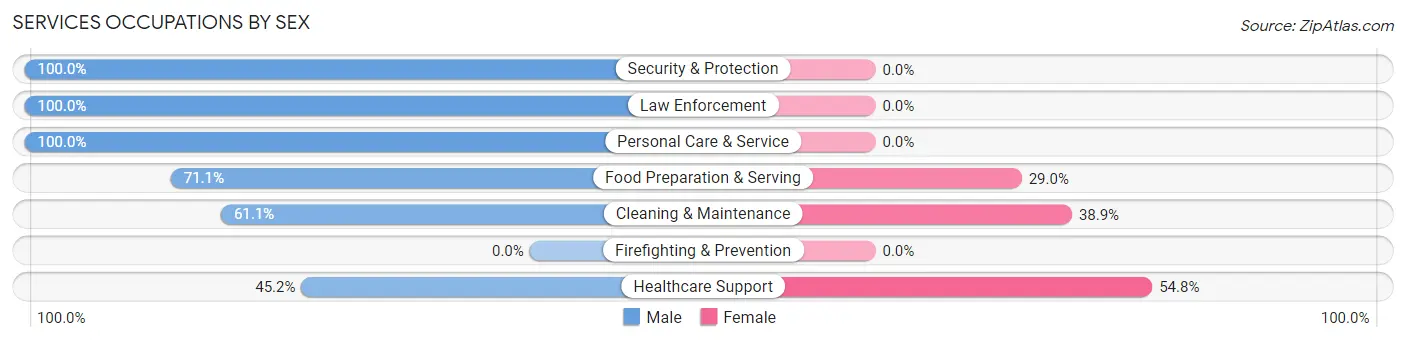
Services Occupations by Sex
Within the Services occupations in Delhi, the most male-oriented occupations are Security & Protection (100.0%), Law Enforcement (100.0%), and Personal Care & Service (100.0%), while the most female-oriented occupations are Healthcare Support (54.8%), Cleaning & Maintenance (38.9%), and Food Preparation & Serving (28.9%).
| Occupation | Male | Female |
| Healthcare Support | 33 (45.2%) | 40 (54.8%) |
| Security & Protection | 22 (100.0%) | 0 (0.0%) |
| Firefighting & Prevention | 0 (0.0%) | 0 (0.0%) |
| Law Enforcement | 22 (100.0%) | 0 (0.0%) |
| Food Preparation & Serving | 27 (71.1%) | 11 (28.9%) |
| Cleaning & Maintenance | 33 (61.1%) | 21 (38.9%) |
| Personal Care & Service | 3 (100.0%) | 0 (0.0%) |
| Total (Category) | 118 (62.1%) | 72 (37.9%) |
| Total (Overall) | 527 (56.6%) | 405 (43.4%) |
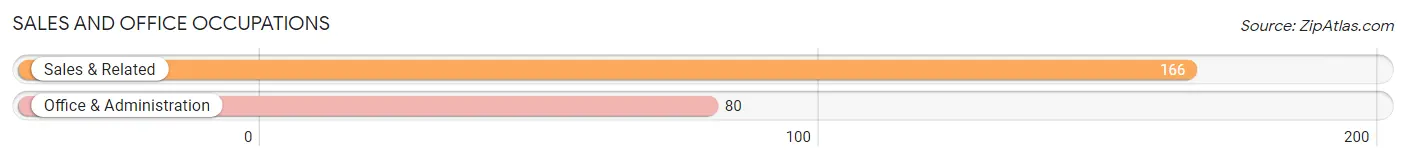
Sales and Office Occupations
The most common Sales and Office occupations in Delhi are Sales & Related (166 | 17.8%), and Office & Administration (80 | 8.6%).
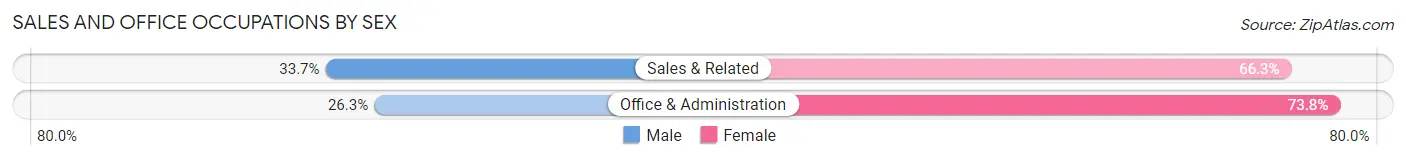
Sales and Office Occupations by Sex
| Occupation | Male | Female |
| Sales & Related | 56 (33.7%) | 110 (66.3%) |
| Office & Administration | 21 (26.3%) | 59 (73.8%) |
| Total (Category) | 77 (31.3%) | 169 (68.7%) |
| Total (Overall) | 527 (56.6%) | 405 (43.4%) |
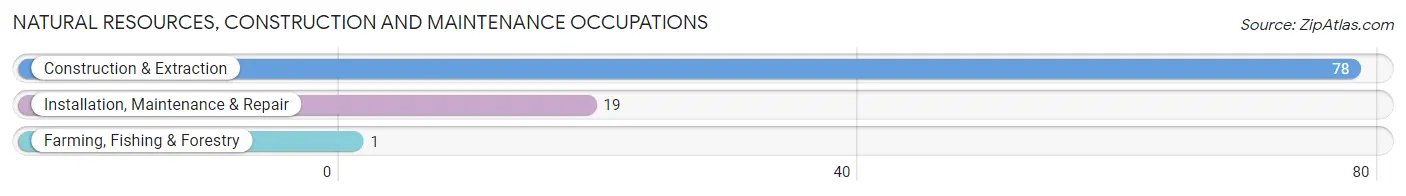
Natural Resources, Construction and Maintenance Occupations
The most common Natural Resources, Construction and Maintenance occupations in Delhi are Construction & Extraction (78 | 8.4%), Installation, Maintenance & Repair (19 | 2.0%), and Farming, Fishing & Forestry (1 | 0.1%).
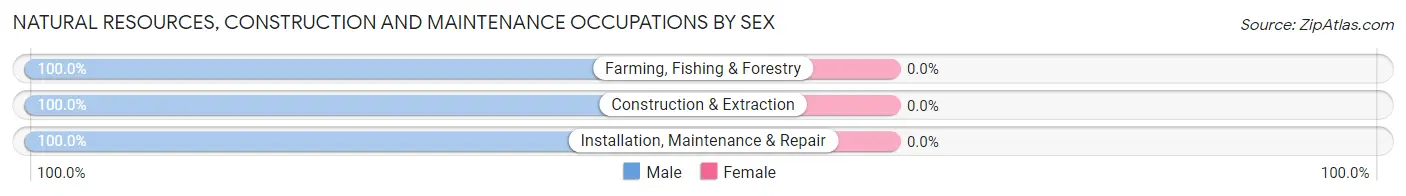
Natural Resources, Construction and Maintenance Occupations by Sex
| Occupation | Male | Female |
| Farming, Fishing & Forestry | 1 (100.0%) | 0 (0.0%) |
| Construction & Extraction | 78 (100.0%) | 0 (0.0%) |
| Installation, Maintenance & Repair | 19 (100.0%) | 0 (0.0%) |
| Total (Category) | 98 (100.0%) | 0 (0.0%) |
| Total (Overall) | 527 (56.6%) | 405 (43.4%) |
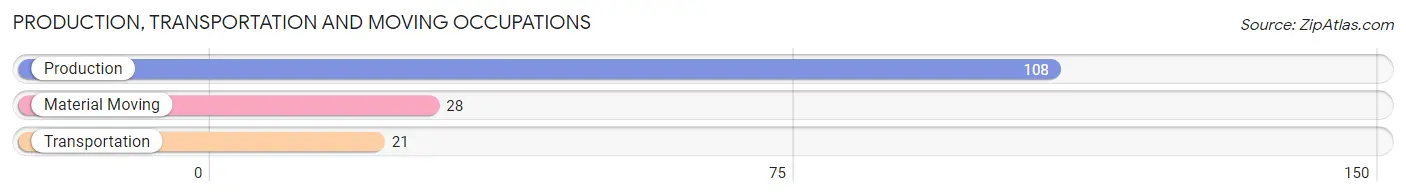
Production, Transportation and Moving Occupations
The most common Production, Transportation and Moving occupations in Delhi are Production (108 | 11.6%), Material Moving (28 | 3.0%), and Transportation (21 | 2.2%).
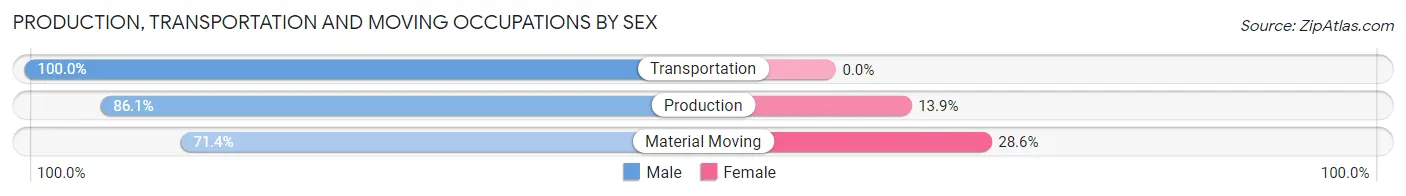
Production, Transportation and Moving Occupations by Sex
| Occupation | Male | Female |
| Production | 93 (86.1%) | 15 (13.9%) |
| Transportation | 21 (100.0%) | 0 (0.0%) |
| Material Moving | 20 (71.4%) | 8 (28.6%) |
| Total (Category) | 134 (85.4%) | 23 (14.6%) |
| Total (Overall) | 527 (56.6%) | 405 (43.4%) |
Employment Industries by Sex in Delhi
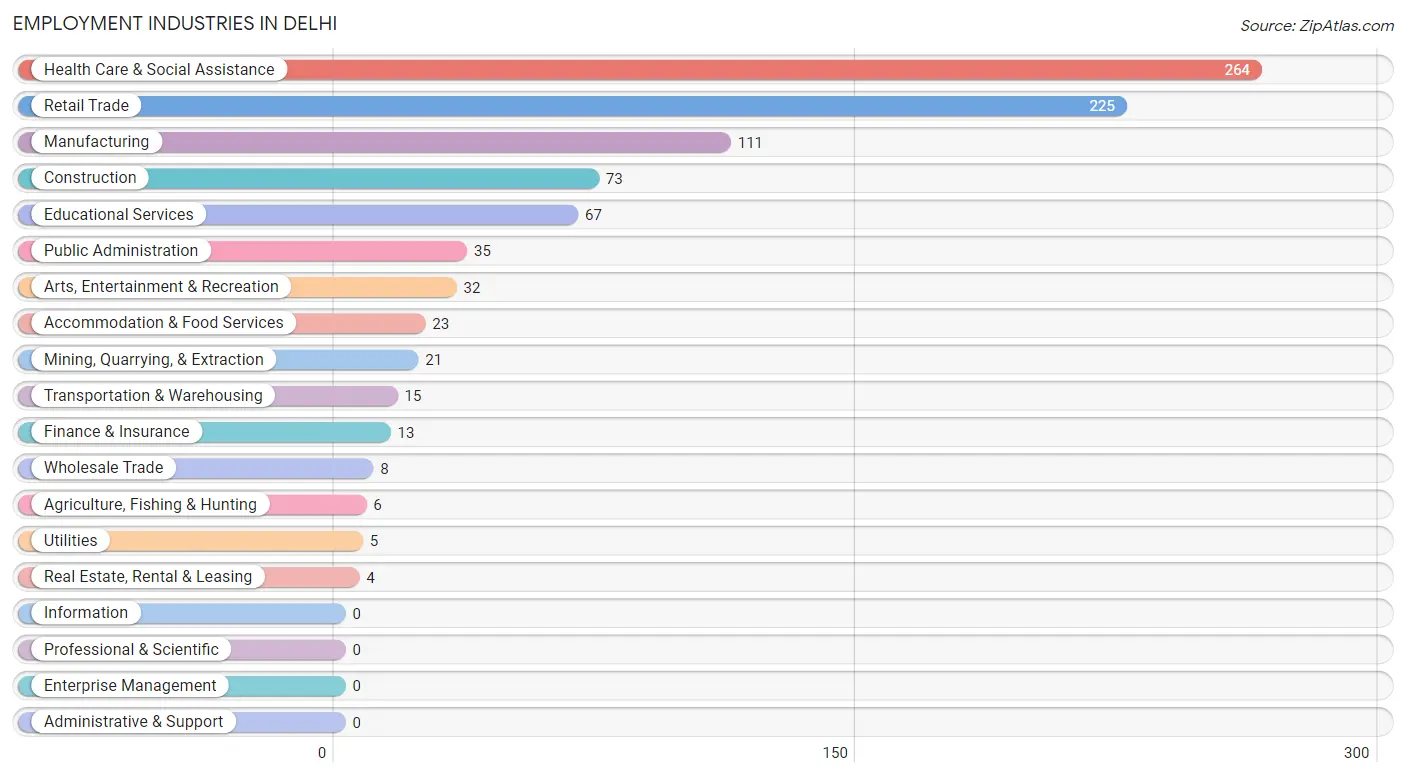
Employment Industries in Delhi
The major employment industries in Delhi include Health Care & Social Assistance (264 | 28.3%), Retail Trade (225 | 24.1%), Manufacturing (111 | 11.9%), Construction (73 | 7.8%), and Educational Services (67 | 7.2%).
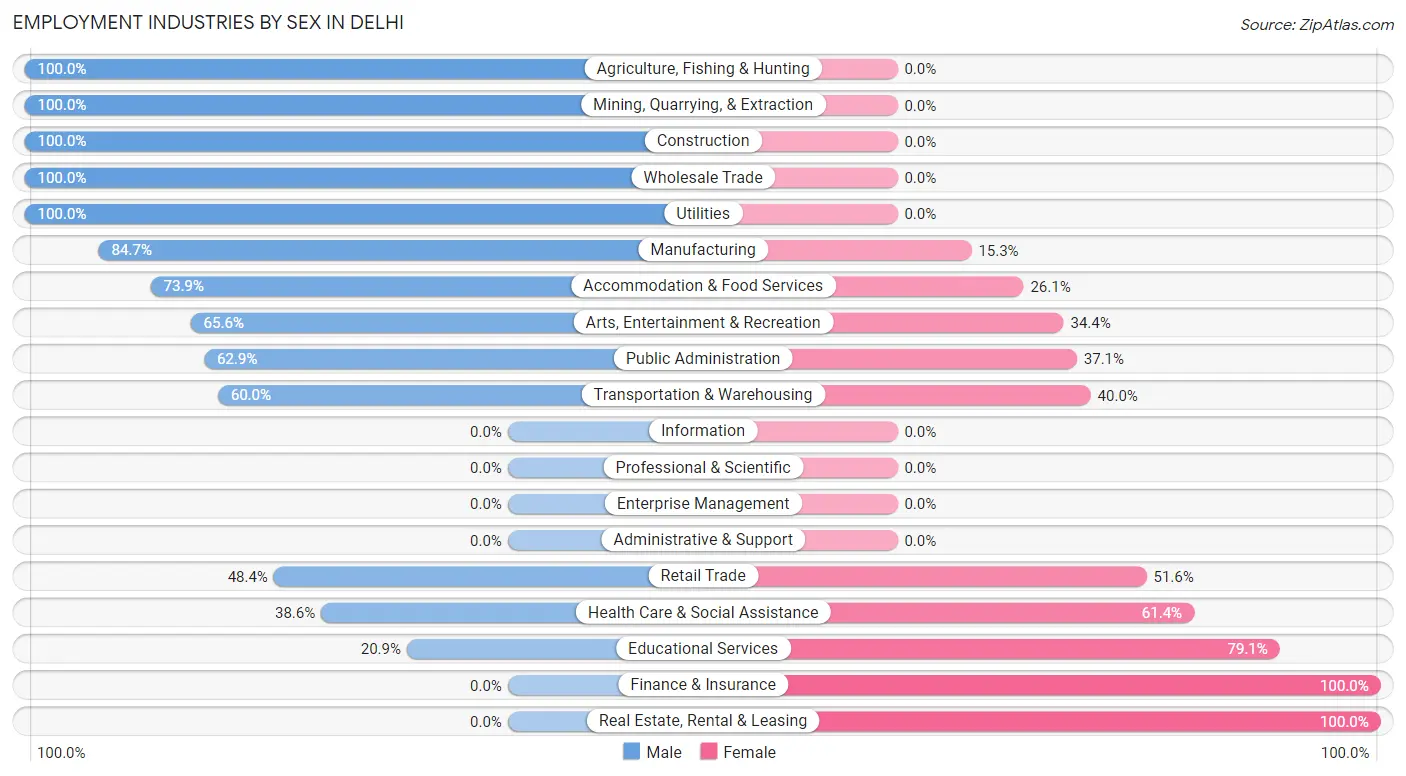
Employment Industries by Sex in Delhi
The Delhi industries that see more men than women are Agriculture, Fishing & Hunting (100.0%), Mining, Quarrying, & Extraction (100.0%), and Construction (100.0%), whereas the industries that tend to have a higher number of women are Finance & Insurance (100.0%), Real Estate, Rental & Leasing (100.0%), and Educational Services (79.1%).
| Industry | Male | Female |
| Agriculture, Fishing & Hunting | 6 (100.0%) | 0 (0.0%) |
| Mining, Quarrying, & Extraction | 21 (100.0%) | 0 (0.0%) |
| Construction | 73 (100.0%) | 0 (0.0%) |
| Manufacturing | 94 (84.7%) | 17 (15.3%) |
| Wholesale Trade | 8 (100.0%) | 0 (0.0%) |
| Retail Trade | 109 (48.4%) | 116 (51.6%) |
| Transportation & Warehousing | 9 (60.0%) | 6 (40.0%) |
| Utilities | 5 (100.0%) | 0 (0.0%) |
| Information | 0 (0.0%) | 0 (0.0%) |
| Finance & Insurance | 0 (0.0%) | 13 (100.0%) |
| Real Estate, Rental & Leasing | 0 (0.0%) | 4 (100.0%) |
| Professional & Scientific | 0 (0.0%) | 0 (0.0%) |
| Enterprise Management | 0 (0.0%) | 0 (0.0%) |
| Administrative & Support | 0 (0.0%) | 0 (0.0%) |
| Educational Services | 14 (20.9%) | 53 (79.1%) |
| Health Care & Social Assistance | 102 (38.6%) | 162 (61.4%) |
| Arts, Entertainment & Recreation | 21 (65.6%) | 11 (34.4%) |
| Accommodation & Food Services | 17 (73.9%) | 6 (26.1%) |
| Public Administration | 22 (62.9%) | 13 (37.1%) |
| Total | 527 (56.6%) | 405 (43.4%) |
Education in Delhi
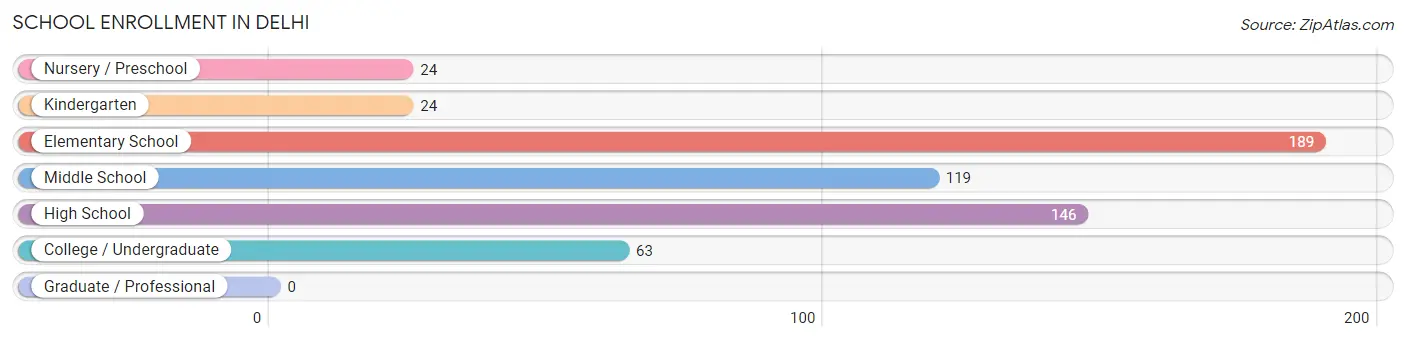
School Enrollment in Delhi
The most common levels of schooling among the 565 students in Delhi are elementary school (189 | 33.5%), high school (146 | 25.8%), and middle school (119 | 21.1%).
| School Level | # Students | % Students |
| Nursery / Preschool | 24 | 4.3% |
| Kindergarten | 24 | 4.3% |
| Elementary School | 189 | 33.5% |
| Middle School | 119 | 21.1% |
| High School | 146 | 25.8% |
| College / Undergraduate | 63 | 11.2% |
| Graduate / Professional | 0 | 0.0% |
| Total | 565 | 100.0% |
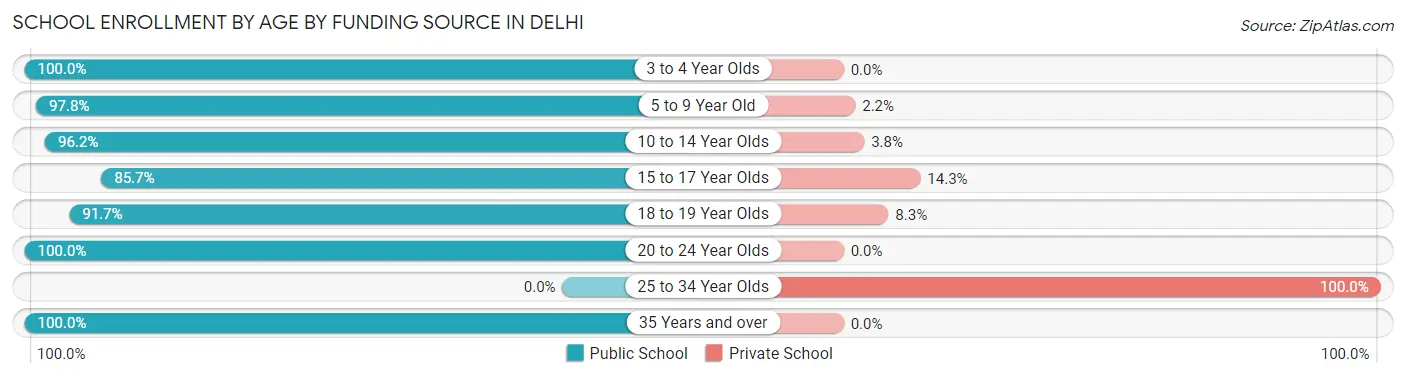
School Enrollment by Age by Funding Source in Delhi
Out of a total of 565 students who are enrolled in schools in Delhi, 38 (6.7%) attend a private institution, while the remaining 527 (93.3%) are enrolled in public schools. The age group of 25 to 34 year olds has the highest likelihood of being enrolled in private schools, with 9 (100.0% in the age bracket) enrolled. Conversely, the age group of 3 to 4 year olds has the lowest likelihood of being enrolled in a private school, with 20 (100.0% in the age bracket) attending a public institution.
| Age Bracket | Public School | Private School |
| 3 to 4 Year Olds | 20 (100.0%) | 0 (0.0%) |
| 5 to 9 Year Old | 181 (97.8%) | 4 (2.2%) |
| 10 to 14 Year Olds | 151 (96.2%) | 6 (3.8%) |
| 15 to 17 Year Olds | 96 (85.7%) | 16 (14.3%) |
| 18 to 19 Year Olds | 33 (91.7%) | 3 (8.3%) |
| 20 to 24 Year Olds | 34 (100.0%) | 0 (0.0%) |
| 25 to 34 Year Olds | 0 (0.0%) | 9 (100.0%) |
| 35 Years and over | 12 (100.0%) | 0 (0.0%) |
| Total | 527 (93.3%) | 38 (6.7%) |
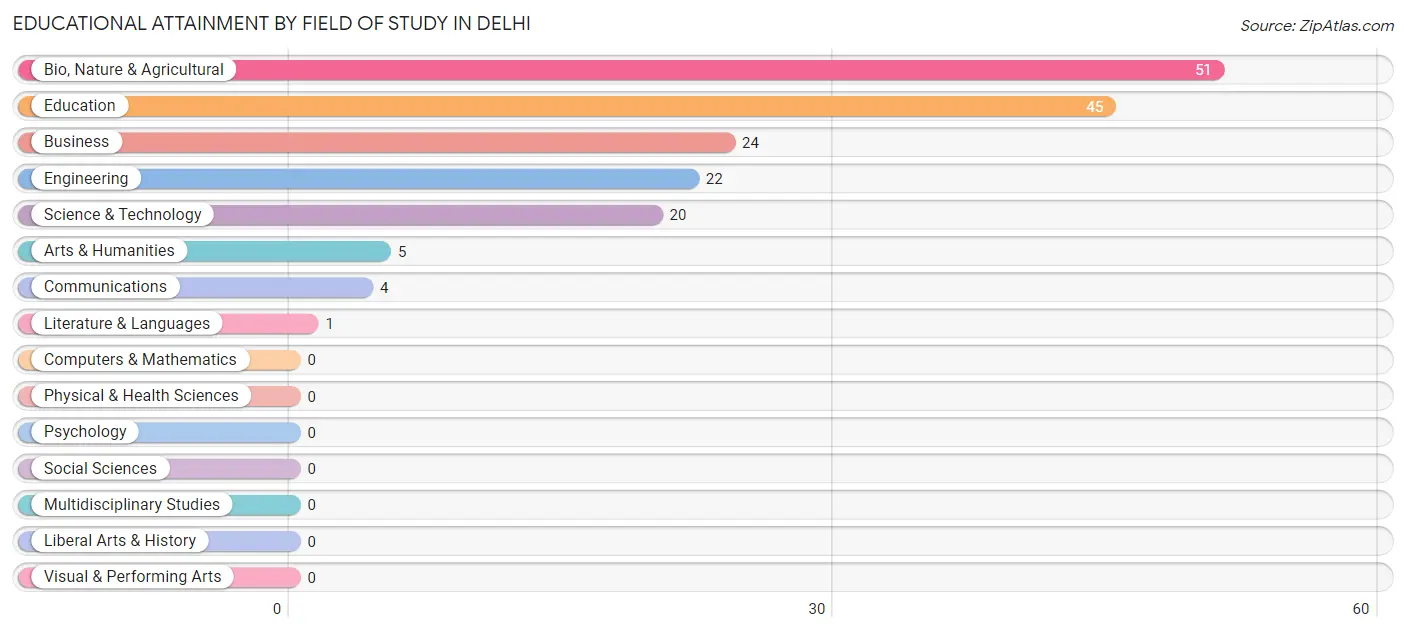
Educational Attainment by Field of Study in Delhi
Bio, nature & agricultural (51 | 29.6%), education (45 | 26.2%), business (24 | 14.0%), engineering (22 | 12.8%), and science & technology (20 | 11.6%) are the most common fields of study among 172 individuals in Delhi who have obtained a bachelor's degree or higher.
| Field of Study | # Graduates | % Graduates |
| Computers & Mathematics | 0 | 0.0% |
| Bio, Nature & Agricultural | 51 | 29.6% |
| Physical & Health Sciences | 0 | 0.0% |
| Psychology | 0 | 0.0% |
| Social Sciences | 0 | 0.0% |
| Engineering | 22 | 12.8% |
| Multidisciplinary Studies | 0 | 0.0% |
| Science & Technology | 20 | 11.6% |
| Business | 24 | 14.0% |
| Education | 45 | 26.2% |
| Literature & Languages | 1 | 0.6% |
| Liberal Arts & History | 0 | 0.0% |
| Visual & Performing Arts | 0 | 0.0% |
| Communications | 4 | 2.3% |
| Arts & Humanities | 5 | 2.9% |
| Total | 172 | 100.0% |
Transportation & Commute in Delhi
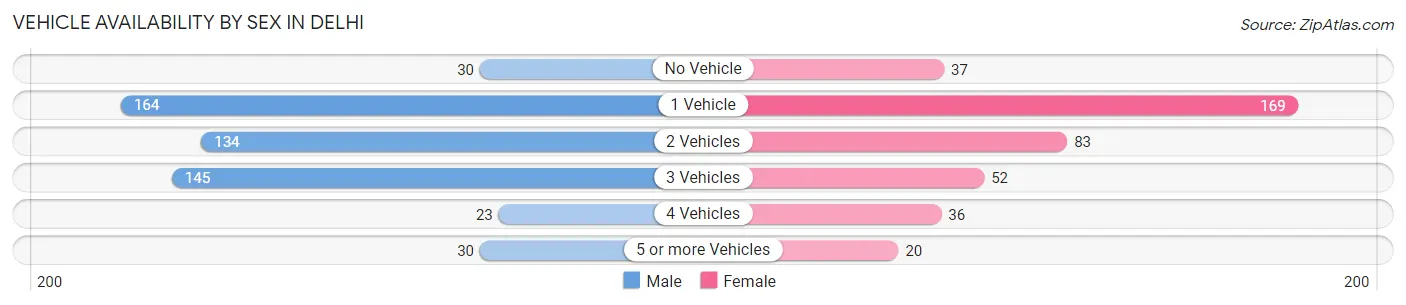
Vehicle Availability by Sex in Delhi
The most prevalent vehicle ownership categories in Delhi are males with 1 vehicle (164, accounting for 31.2%) and females with 1 vehicle (169, making up 41.3%).
| Vehicles Available | Male | Female |
| No Vehicle | 30 (5.7%) | 37 (9.3%) |
| 1 Vehicle | 164 (31.2%) | 169 (42.6%) |
| 2 Vehicles | 134 (25.5%) | 83 (20.9%) |
| 3 Vehicles | 145 (27.6%) | 52 (13.1%) |
| 4 Vehicles | 23 (4.4%) | 36 (9.1%) |
| 5 or more Vehicles | 30 (5.7%) | 20 (5.0%) |
| Total | 526 (100.0%) | 397 (100.0%) |
Commute Time in Delhi
The most frequently occuring commute durations in Delhi are 5 to 9 minutes (269 commuters, 29.6%), 10 to 14 minutes (160 commuters, 17.6%), and 15 to 19 minutes (156 commuters, 17.1%).
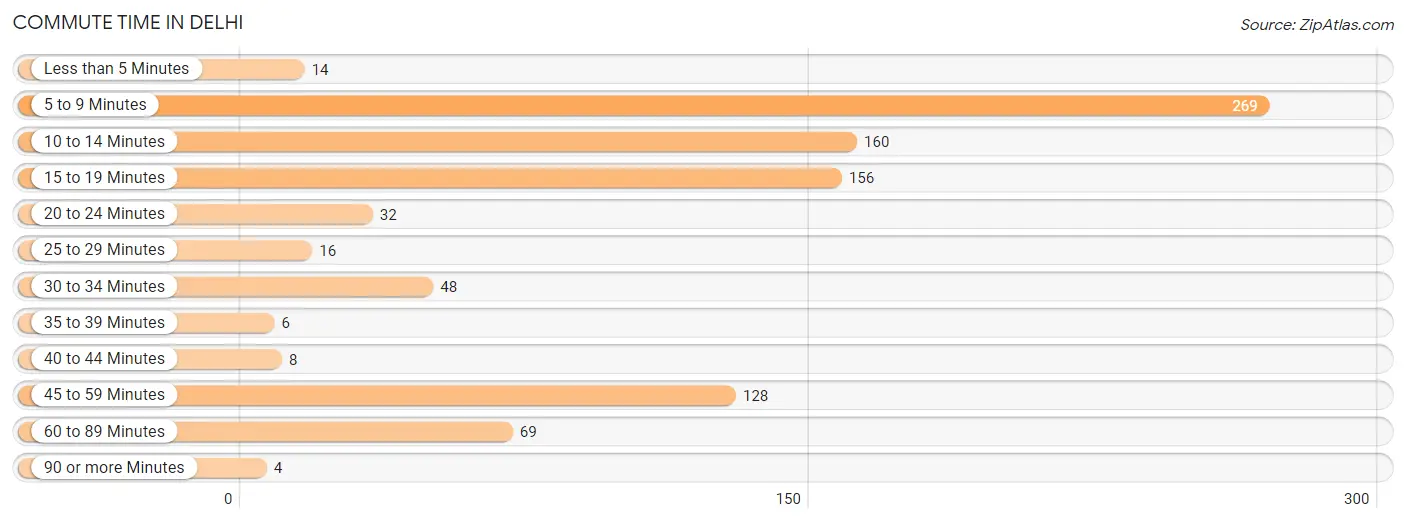
| Commute Time | # Commuters | % Commuters |
| Less than 5 Minutes | 14 | 1.5% |
| 5 to 9 Minutes | 269 | 29.6% |
| 10 to 14 Minutes | 160 | 17.6% |
| 15 to 19 Minutes | 156 | 17.1% |
| 20 to 24 Minutes | 32 | 3.5% |
| 25 to 29 Minutes | 16 | 1.8% |
| 30 to 34 Minutes | 48 | 5.3% |
| 35 to 39 Minutes | 6 | 0.7% |
| 40 to 44 Minutes | 8 | 0.9% |
| 45 to 59 Minutes | 128 | 14.1% |
| 60 to 89 Minutes | 69 | 7.6% |
| 90 or more Minutes | 4 | 0.4% |
Commute Time by Sex in Delhi
The most common commute times in Delhi are 45 to 59 minutes (118 commuters, 22.7%) for males and 5 to 9 minutes (159 commuters, 40.8%) for females.
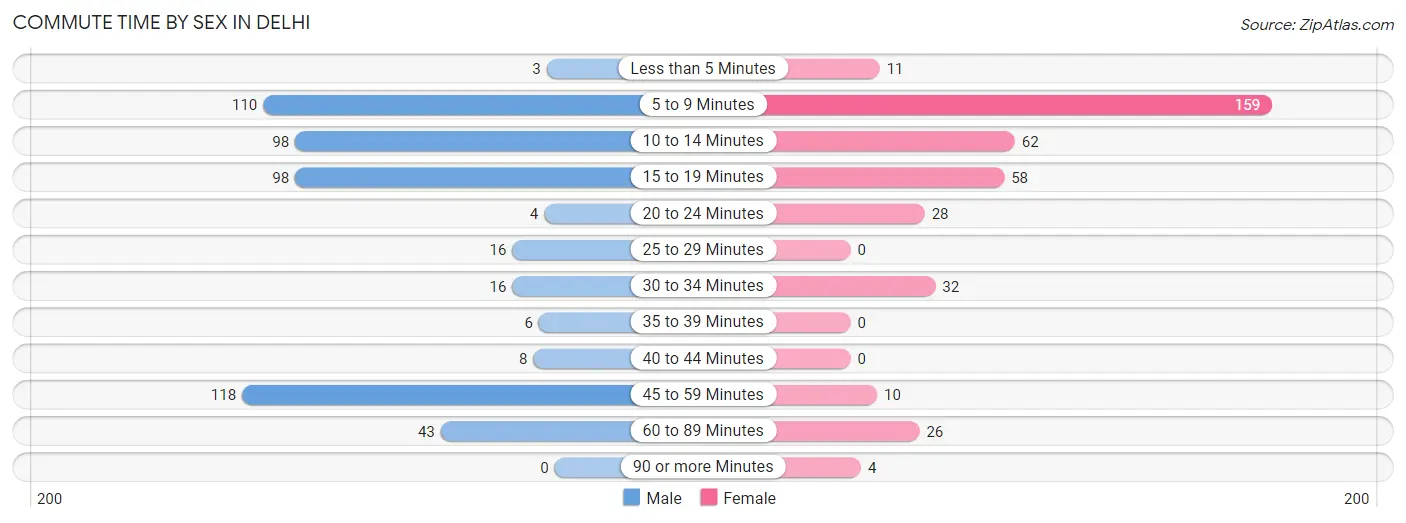
| Commute Time | Male | Female |
| Less than 5 Minutes | 3 (0.6%) | 11 (2.8%) |
| 5 to 9 Minutes | 110 (21.1%) | 159 (40.8%) |
| 10 to 14 Minutes | 98 (18.9%) | 62 (15.9%) |
| 15 to 19 Minutes | 98 (18.9%) | 58 (14.9%) |
| 20 to 24 Minutes | 4 (0.8%) | 28 (7.2%) |
| 25 to 29 Minutes | 16 (3.1%) | 0 (0.0%) |
| 30 to 34 Minutes | 16 (3.1%) | 32 (8.2%) |
| 35 to 39 Minutes | 6 (1.1%) | 0 (0.0%) |
| 40 to 44 Minutes | 8 (1.5%) | 0 (0.0%) |
| 45 to 59 Minutes | 118 (22.7%) | 10 (2.6%) |
| 60 to 89 Minutes | 43 (8.3%) | 26 (6.7%) |
| 90 or more Minutes | 0 (0.0%) | 4 (1.0%) |
Time of Departure to Work by Sex in Delhi
The most frequent times of departure to work in Delhi are 12:00 AM to 4:59 AM (105, 20.2%) for males and 5:00 AM to 5:29 AM (71, 18.2%) for females.
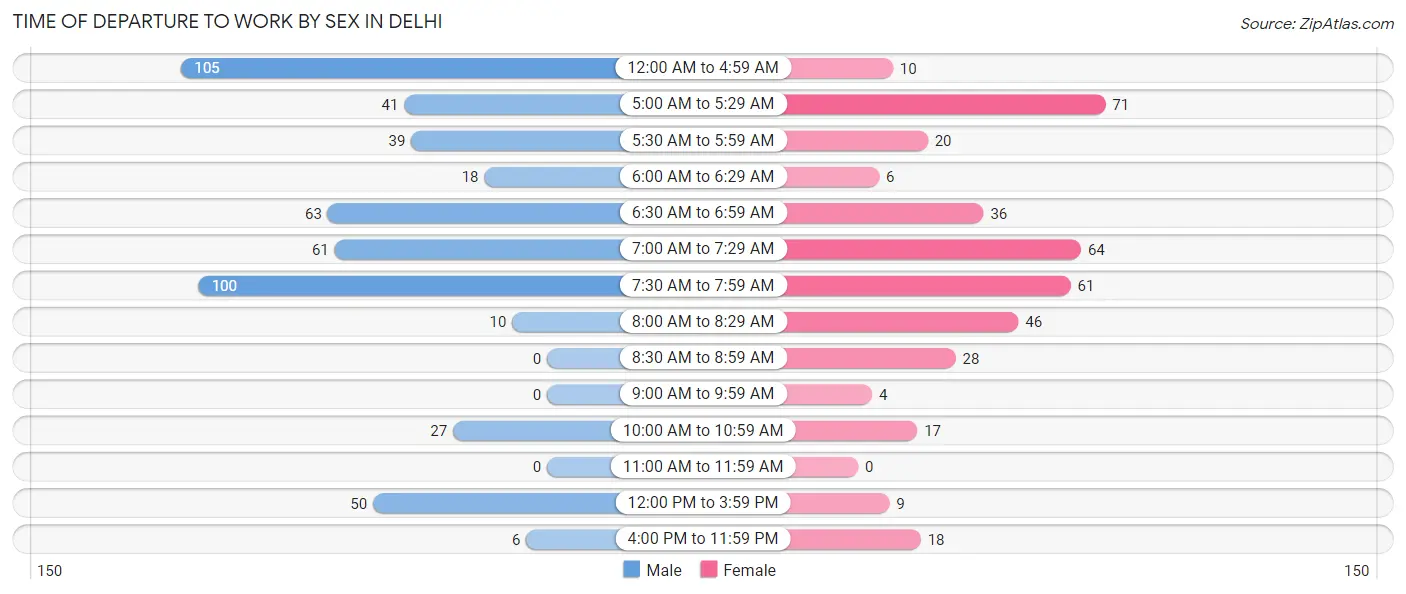
| Time of Departure | Male | Female |
| 12:00 AM to 4:59 AM | 105 (20.2%) | 10 (2.6%) |
| 5:00 AM to 5:29 AM | 41 (7.9%) | 71 (18.2%) |
| 5:30 AM to 5:59 AM | 39 (7.5%) | 20 (5.1%) |
| 6:00 AM to 6:29 AM | 18 (3.5%) | 6 (1.5%) |
| 6:30 AM to 6:59 AM | 63 (12.1%) | 36 (9.2%) |
| 7:00 AM to 7:29 AM | 61 (11.7%) | 64 (16.4%) |
| 7:30 AM to 7:59 AM | 100 (19.2%) | 61 (15.6%) |
| 8:00 AM to 8:29 AM | 10 (1.9%) | 46 (11.8%) |
| 8:30 AM to 8:59 AM | 0 (0.0%) | 28 (7.2%) |
| 9:00 AM to 9:59 AM | 0 (0.0%) | 4 (1.0%) |
| 10:00 AM to 10:59 AM | 27 (5.2%) | 17 (4.4%) |
| 11:00 AM to 11:59 AM | 0 (0.0%) | 0 (0.0%) |
| 12:00 PM to 3:59 PM | 50 (9.6%) | 9 (2.3%) |
| 4:00 PM to 11:59 PM | 6 (1.1%) | 18 (4.6%) |
| Total | 520 (100.0%) | 390 (100.0%) |
Housing Occupancy in Delhi
Occupancy by Ownership in Delhi
Of the total 1,007 dwellings in Delhi, owner-occupied units account for 528 (52.4%), while renter-occupied units make up 479 (47.6%).
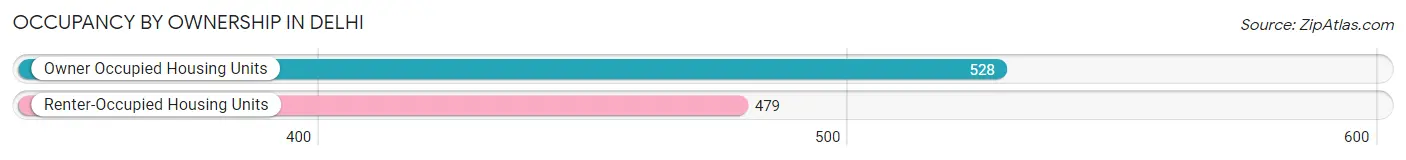
| Occupancy | # Housing Units | % Housing Units |
| Owner Occupied Housing Units | 528 | 52.4% |
| Renter-Occupied Housing Units | 479 | 47.6% |
| Total Occupied Housing Units | 1,007 | 100.0% |
Occupancy by Household Size in Delhi
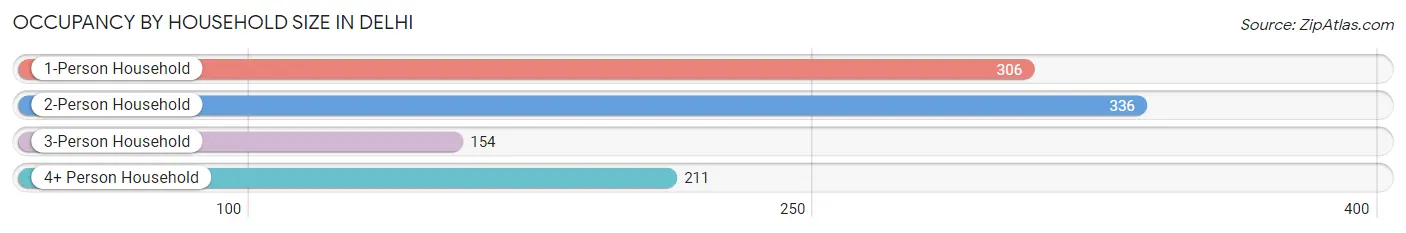
| Household Size | # Housing Units | % Housing Units |
| 1-Person Household | 306 | 30.4% |
| 2-Person Household | 336 | 33.4% |
| 3-Person Household | 154 | 15.3% |
| 4+ Person Household | 211 | 20.9% |
| Total Housing Units | 1,007 | 100.0% |
Occupancy by Ownership by Household Size in Delhi
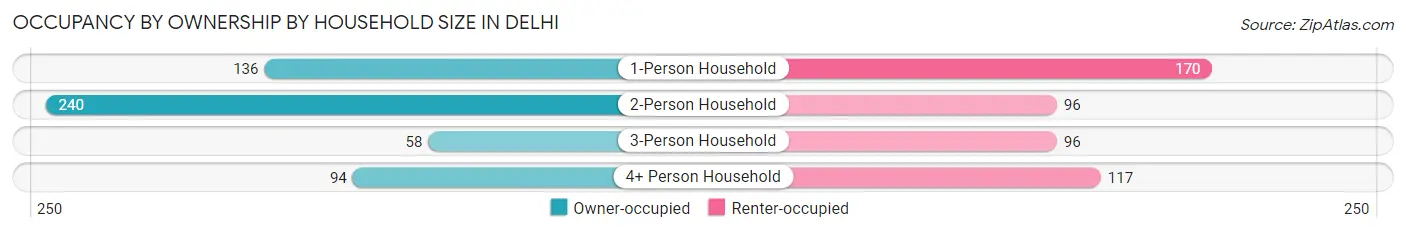
| Household Size | Owner-occupied | Renter-occupied |
| 1-Person Household | 136 (44.4%) | 170 (55.6%) |
| 2-Person Household | 240 (71.4%) | 96 (28.6%) |
| 3-Person Household | 58 (37.7%) | 96 (62.3%) |
| 4+ Person Household | 94 (44.6%) | 117 (55.4%) |
| Total Housing Units | 528 (52.4%) | 479 (47.6%) |
Occupancy by Educational Attainment in Delhi
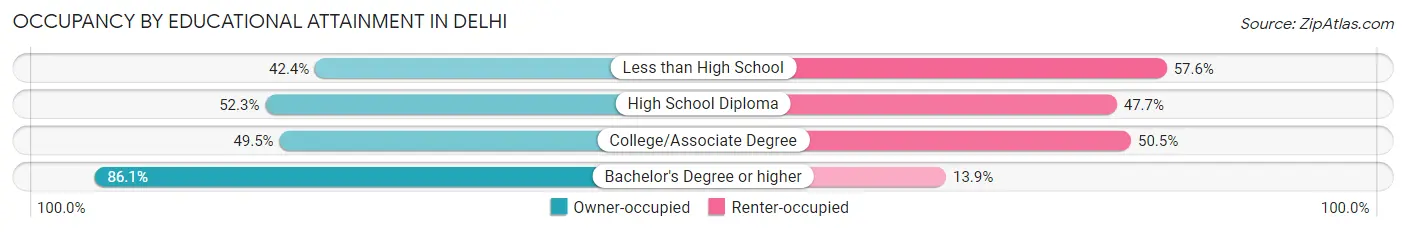
| Household Size | Owner-occupied | Renter-occupied |
| Less than High School | 106 (42.4%) | 144 (57.6%) |
| High School Diploma | 194 (52.3%) | 177 (47.7%) |
| College/Associate Degree | 141 (49.5%) | 144 (50.5%) |
| Bachelor's Degree or higher | 87 (86.1%) | 14 (13.9%) |
Occupancy by Age of Householder in Delhi
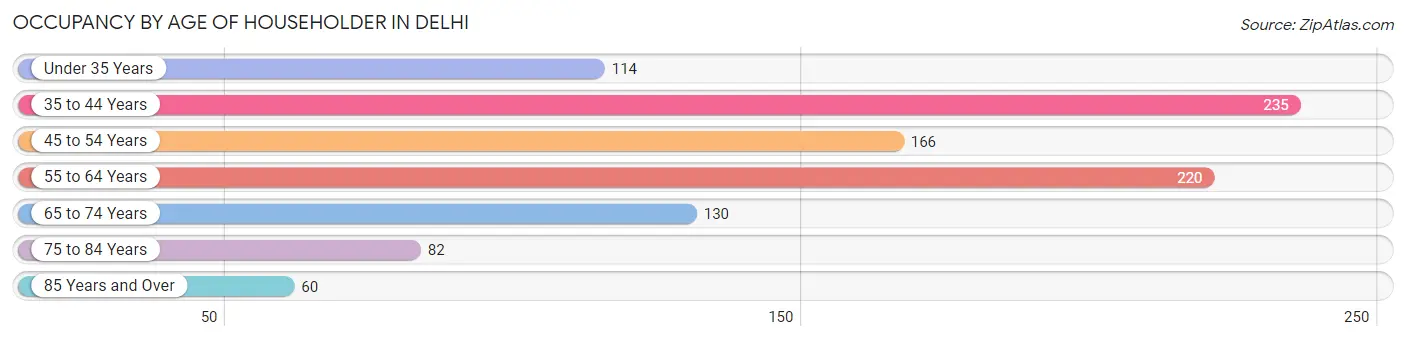
| Age Bracket | # Households | % Households |
| Under 35 Years | 114 | 11.3% |
| 35 to 44 Years | 235 | 23.3% |
| 45 to 54 Years | 166 | 16.5% |
| 55 to 64 Years | 220 | 21.8% |
| 65 to 74 Years | 130 | 12.9% |
| 75 to 84 Years | 82 | 8.1% |
| 85 Years and Over | 60 | 6.0% |
| Total | 1,007 | 100.0% |
Housing Finances in Delhi
Median Income by Occupancy in Delhi
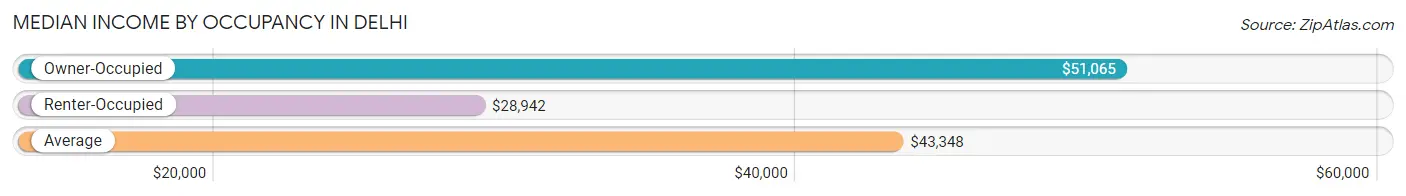
| Occupancy Type | # Households | Median Income |
| Owner-Occupied | 528 (52.4%) | $51,065 |
| Renter-Occupied | 479 (47.6%) | $28,942 |
| Average | 1,007 (100.0%) | $43,348 |
Occupancy by Householder Income Bracket in Delhi
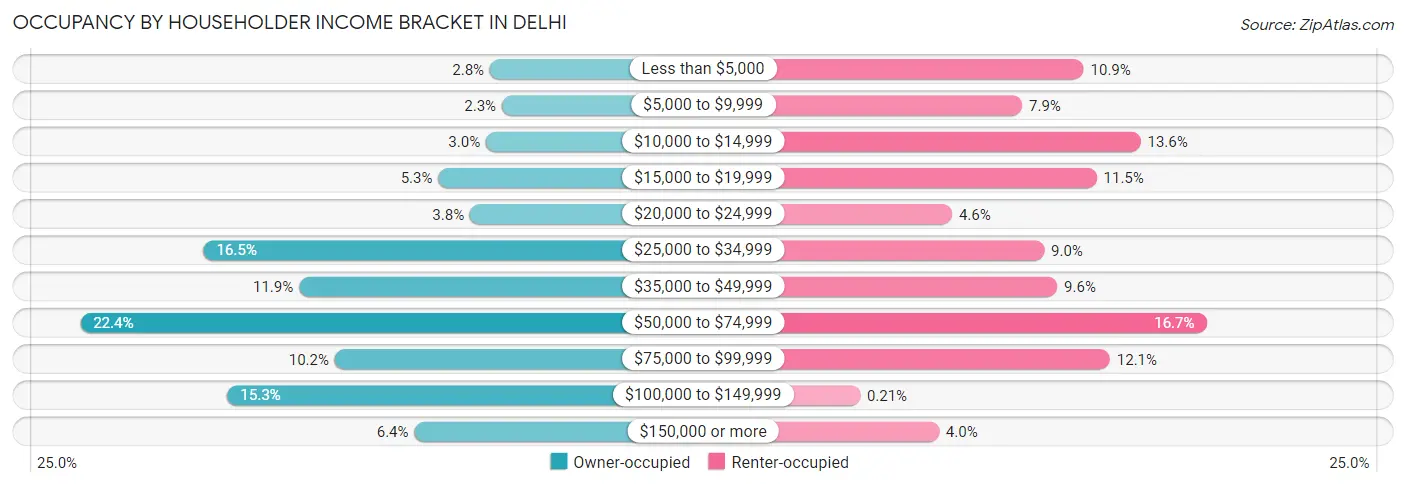
| Income Bracket | Owner-occupied | Renter-occupied |
| Less than $5,000 | 15 (2.8%) | 52 (10.9%) |
| $5,000 to $9,999 | 12 (2.3%) | 38 (7.9%) |
| $10,000 to $14,999 | 16 (3.0%) | 65 (13.6%) |
| $15,000 to $19,999 | 28 (5.3%) | 55 (11.5%) |
| $20,000 to $24,999 | 20 (3.8%) | 22 (4.6%) |
| $25,000 to $34,999 | 87 (16.5%) | 43 (9.0%) |
| $35,000 to $49,999 | 63 (11.9%) | 46 (9.6%) |
| $50,000 to $74,999 | 118 (22.4%) | 80 (16.7%) |
| $75,000 to $99,999 | 54 (10.2%) | 58 (12.1%) |
| $100,000 to $149,999 | 81 (15.3%) | 1 (0.2%) |
| $150,000 or more | 34 (6.4%) | 19 (4.0%) |
| Total | 528 (100.0%) | 479 (100.0%) |
Monthly Housing Cost Tiers in Delhi
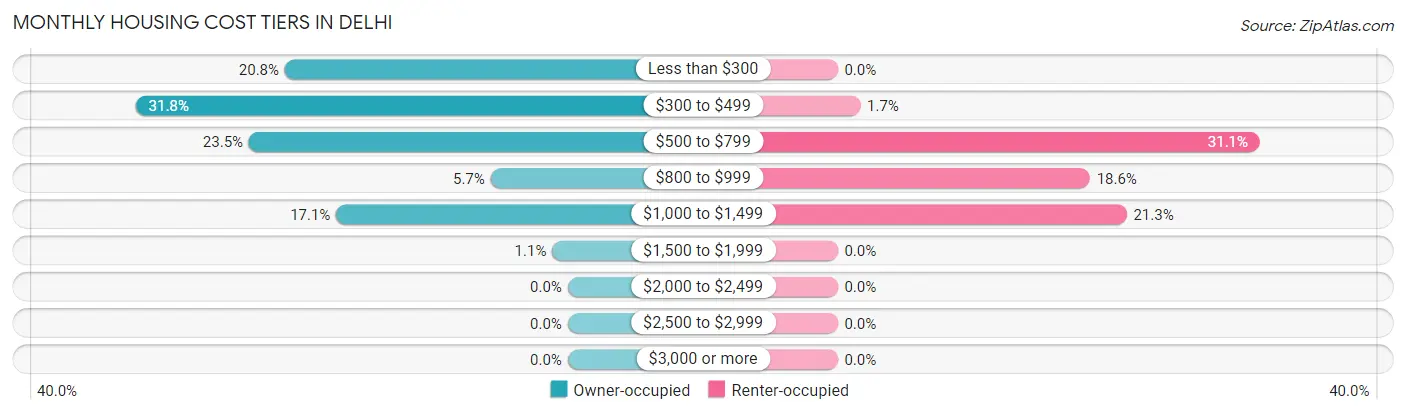
| Monthly Cost | Owner-occupied | Renter-occupied |
| Less than $300 | 110 (20.8%) | 0 (0.0%) |
| $300 to $499 | 168 (31.8%) | 8 (1.7%) |
| $500 to $799 | 124 (23.5%) | 149 (31.1%) |
| $800 to $999 | 30 (5.7%) | 89 (18.6%) |
| $1,000 to $1,499 | 90 (17.1%) | 102 (21.3%) |
| $1,500 to $1,999 | 6 (1.1%) | 0 (0.0%) |
| $2,000 to $2,499 | 0 (0.0%) | 0 (0.0%) |
| $2,500 to $2,999 | 0 (0.0%) | 0 (0.0%) |
| $3,000 or more | 0 (0.0%) | 0 (0.0%) |
| Total | 528 (100.0%) | 479 (100.0%) |
Physical Housing Characteristics in Delhi
Housing Structures in Delhi
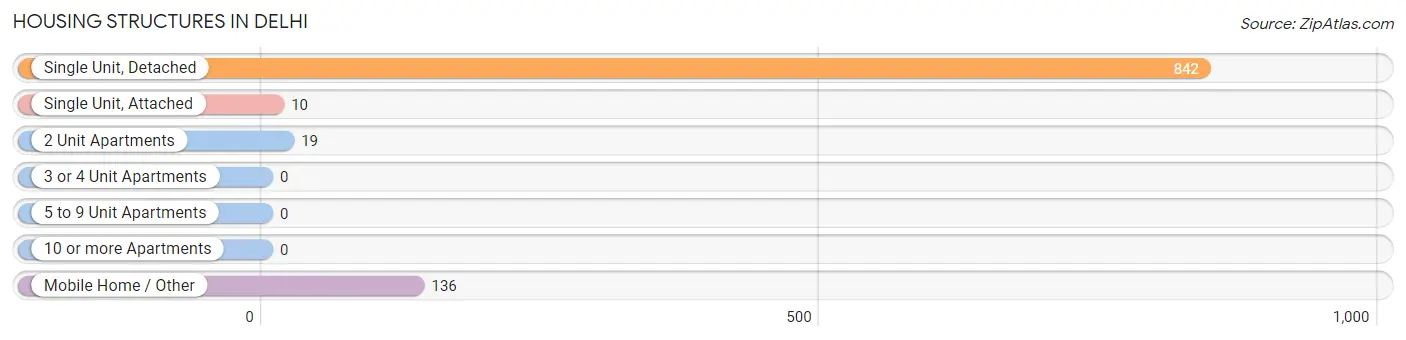
| Structure Type | # Housing Units | % Housing Units |
| Single Unit, Detached | 842 | 83.6% |
| Single Unit, Attached | 10 | 1.0% |
| 2 Unit Apartments | 19 | 1.9% |
| 3 or 4 Unit Apartments | 0 | 0.0% |
| 5 to 9 Unit Apartments | 0 | 0.0% |
| 10 or more Apartments | 0 | 0.0% |
| Mobile Home / Other | 136 | 13.5% |
| Total | 1,007 | 100.0% |
Housing Structures by Occupancy in Delhi
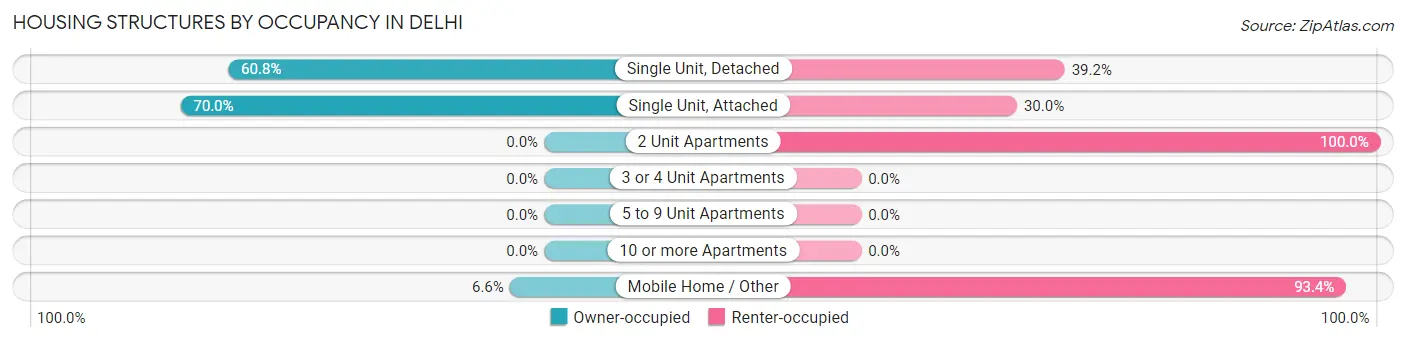
| Structure Type | Owner-occupied | Renter-occupied |
| Single Unit, Detached | 512 (60.8%) | 330 (39.2%) |
| Single Unit, Attached | 7 (70.0%) | 3 (30.0%) |
| 2 Unit Apartments | 0 (0.0%) | 19 (100.0%) |
| 3 or 4 Unit Apartments | 0 (0.0%) | 0 (0.0%) |
| 5 to 9 Unit Apartments | 0 (0.0%) | 0 (0.0%) |
| 10 or more Apartments | 0 (0.0%) | 0 (0.0%) |
| Mobile Home / Other | 9 (6.6%) | 127 (93.4%) |
| Total | 528 (52.4%) | 479 (47.6%) |
Housing Structures by Number of Rooms in Delhi
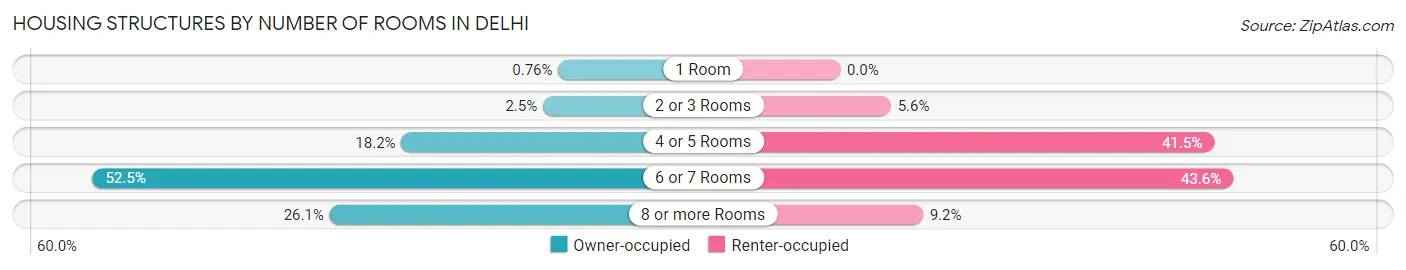
| Number of Rooms | Owner-occupied | Renter-occupied |
| 1 Room | 4 (0.8%) | 0 (0.0%) |
| 2 or 3 Rooms | 13 (2.5%) | 27 (5.6%) |
| 4 or 5 Rooms | 96 (18.2%) | 199 (41.5%) |
| 6 or 7 Rooms | 277 (52.5%) | 209 (43.6%) |
| 8 or more Rooms | 138 (26.1%) | 44 (9.2%) |
| Total | 528 (100.0%) | 479 (100.0%) |
Housing Structure by Heating Type in Delhi
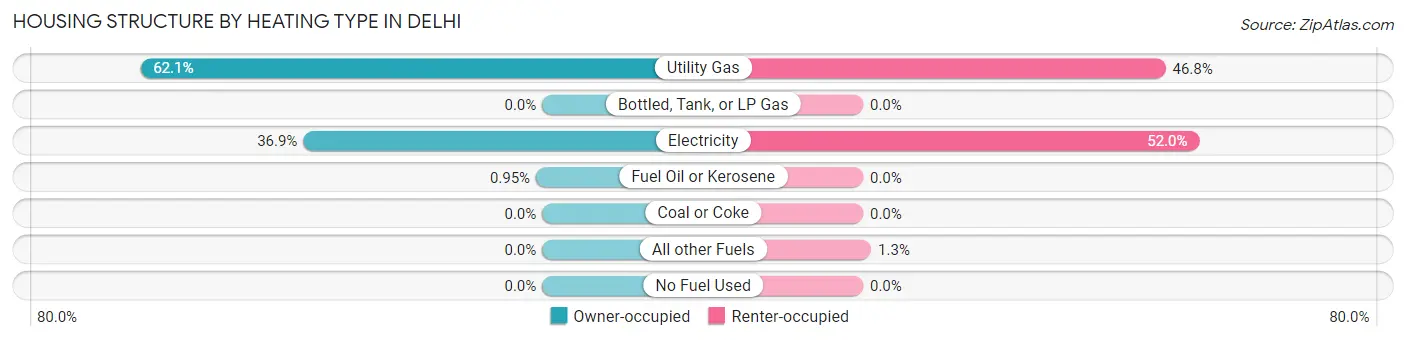
| Heating Type | Owner-occupied | Renter-occupied |
| Utility Gas | 328 (62.1%) | 224 (46.8%) |
| Bottled, Tank, or LP Gas | 0 (0.0%) | 0 (0.0%) |
| Electricity | 195 (36.9%) | 249 (52.0%) |
| Fuel Oil or Kerosene | 5 (0.9%) | 0 (0.0%) |
| Coal or Coke | 0 (0.0%) | 0 (0.0%) |
| All other Fuels | 0 (0.0%) | 6 (1.3%) |
| No Fuel Used | 0 (0.0%) | 0 (0.0%) |
| Total | 528 (100.0%) | 479 (100.0%) |
Household Vehicle Usage in Delhi
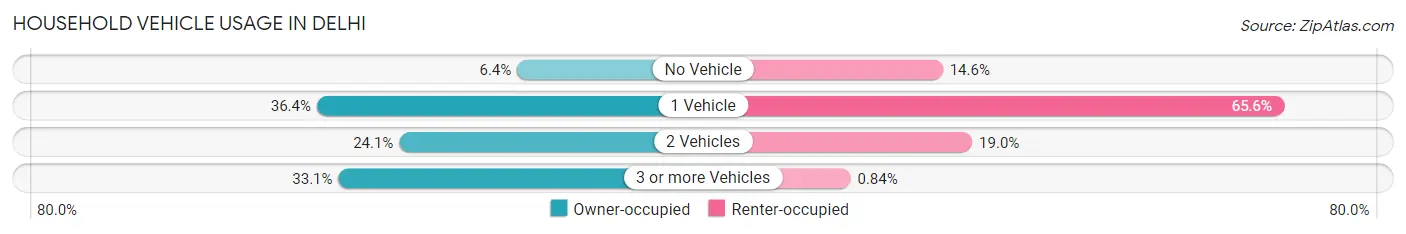
| Vehicles per Household | Owner-occupied | Renter-occupied |
| No Vehicle | 34 (6.4%) | 70 (14.6%) |
| 1 Vehicle | 192 (36.4%) | 314 (65.5%) |
| 2 Vehicles | 127 (24.0%) | 91 (19.0%) |
| 3 or more Vehicles | 175 (33.1%) | 4 (0.8%) |
| Total | 528 (100.0%) | 479 (100.0%) |
Real Estate & Mortgages in Delhi
Real Estate and Mortgage Overview in Delhi
| Characteristic | Without Mortgage | With Mortgage |
| Housing Units | 361 | 167 |
| Median Property Value | $89,000 | $0 |
| Median Household Income | $43,917 | $23 |
| Monthly Housing Costs | $383 | $0 |
| Real Estate Taxes | $354 | $79 |
Property Value by Mortgage Status in Delhi
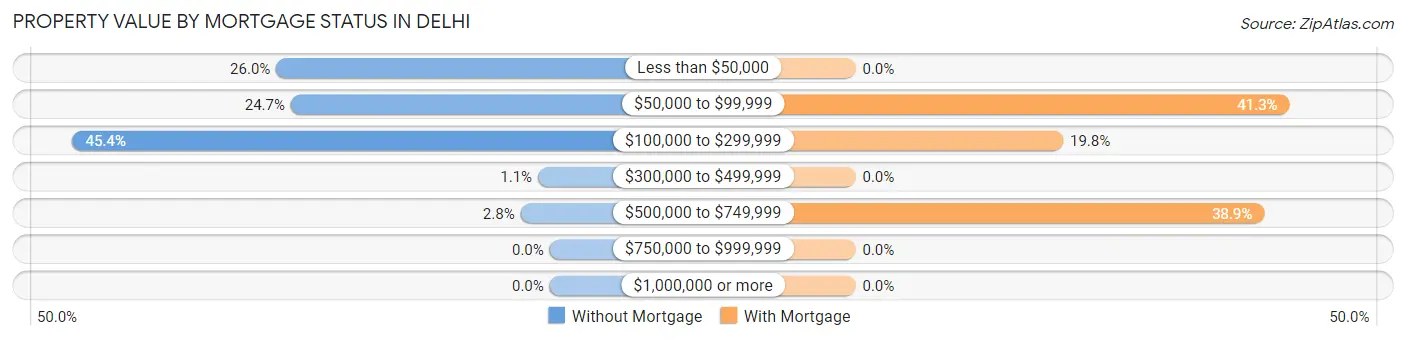
| Property Value | Without Mortgage | With Mortgage |
| Less than $50,000 | 94 (26.0%) | 0 (0.0%) |
| $50,000 to $99,999 | 89 (24.6%) | 69 (41.3%) |
| $100,000 to $299,999 | 164 (45.4%) | 33 (19.8%) |
| $300,000 to $499,999 | 4 (1.1%) | 0 (0.0%) |
| $500,000 to $749,999 | 10 (2.8%) | 65 (38.9%) |
| $750,000 to $999,999 | 0 (0.0%) | 0 (0.0%) |
| $1,000,000 or more | 0 (0.0%) | 0 (0.0%) |
| Total | 361 (100.0%) | 167 (100.0%) |
Household Income by Mortgage Status in Delhi
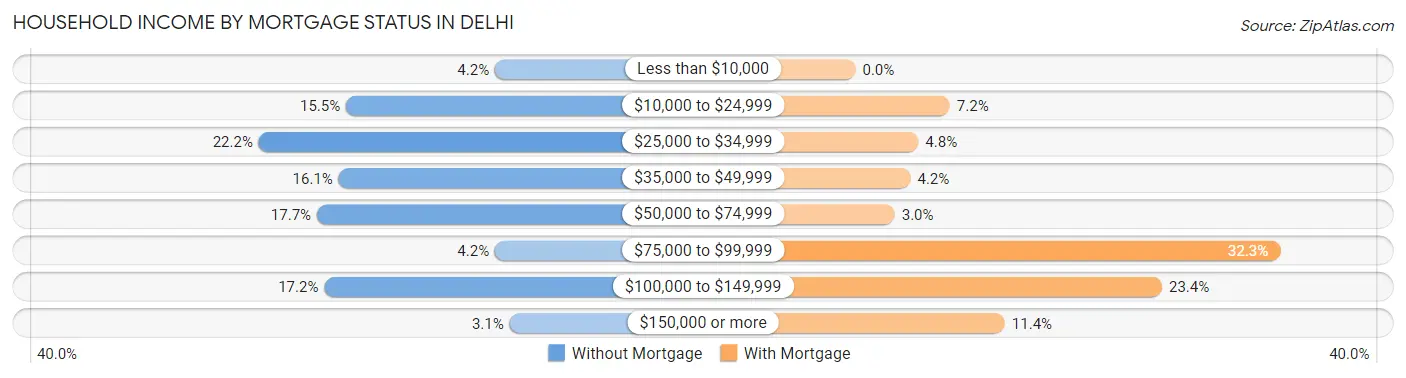
| Household Income | Without Mortgage | With Mortgage |
| Less than $10,000 | 15 (4.2%) | 0 (0.0%) |
| $10,000 to $24,999 | 56 (15.5%) | 12 (7.2%) |
| $25,000 to $34,999 | 80 (22.2%) | 8 (4.8%) |
| $35,000 to $49,999 | 58 (16.1%) | 7 (4.2%) |
| $50,000 to $74,999 | 64 (17.7%) | 5 (3.0%) |
| $75,000 to $99,999 | 15 (4.2%) | 54 (32.3%) |
| $100,000 to $149,999 | 62 (17.2%) | 39 (23.4%) |
| $150,000 or more | 11 (3.0%) | 19 (11.4%) |
| Total | 361 (100.0%) | 167 (100.0%) |
Property Value to Household Income Ratio in Delhi
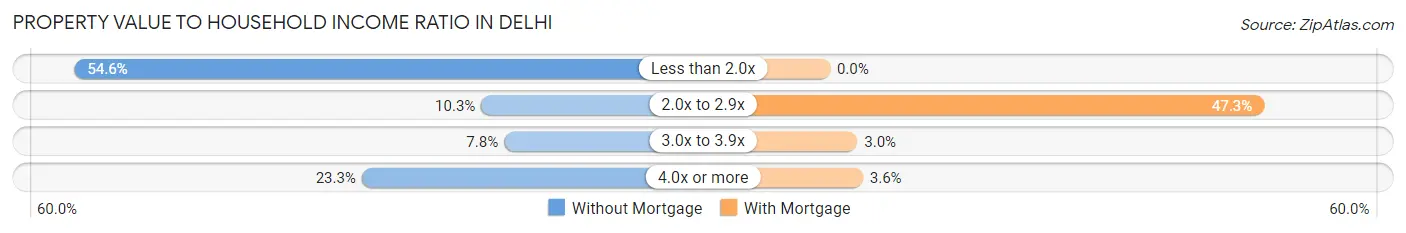
| Value-to-Income Ratio | Without Mortgage | With Mortgage |
| Less than 2.0x | 197 (54.6%) | 0 (0.0%) |
| 2.0x to 2.9x | 37 (10.2%) | 79 (47.3%) |
| 3.0x to 3.9x | 28 (7.8%) | 5 (3.0%) |
| 4.0x or more | 84 (23.3%) | 6 (3.6%) |
| Total | 361 (100.0%) | 167 (100.0%) |
Real Estate Taxes by Mortgage Status in Delhi
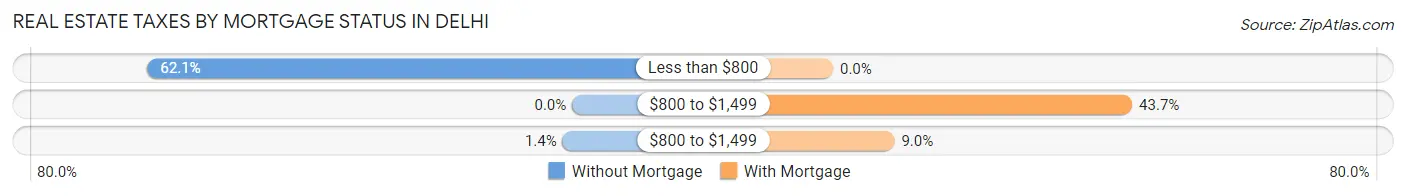
| Property Taxes | Without Mortgage | With Mortgage |
| Less than $800 | 224 (62.1%) | 0 (0.0%) |
| $800 to $1,499 | 0 (0.0%) | 73 (43.7%) |
| $800 to $1,499 | 5 (1.4%) | 15 (9.0%) |
| Total | 361 (100.0%) | 167 (100.0%) |
Health & Disability in Delhi
Health Insurance Coverage by Age in Delhi
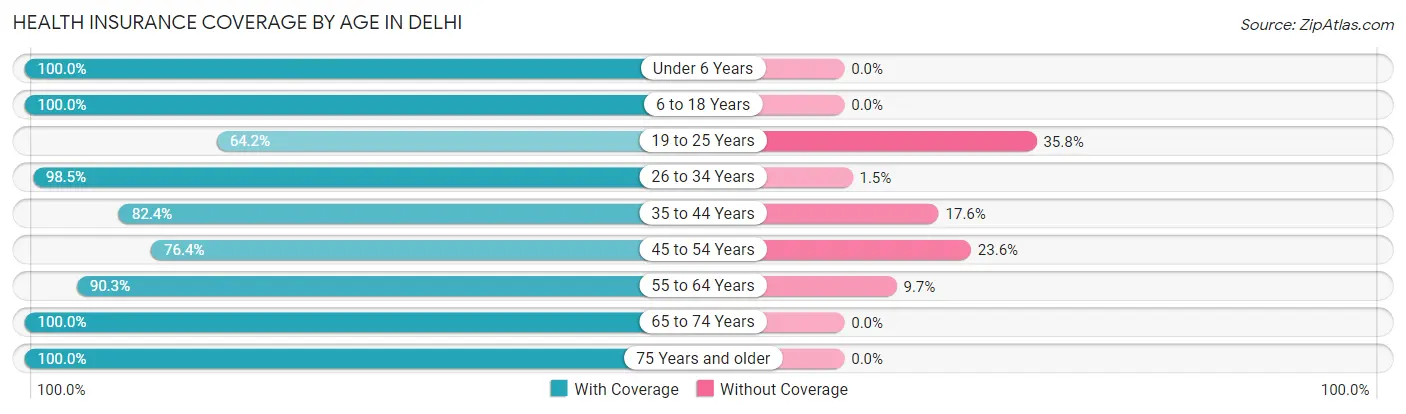
| Age Bracket | With Coverage | Without Coverage |
| Under 6 Years | 128 (100.0%) | 0 (0.0%) |
| 6 to 18 Years | 489 (100.0%) | 0 (0.0%) |
| 19 to 25 Years | 111 (64.2%) | 62 (35.8%) |
| 26 to 34 Years | 255 (98.5%) | 4 (1.5%) |
| 35 to 44 Years | 328 (82.4%) | 70 (17.6%) |
| 45 to 54 Years | 233 (76.4%) | 72 (23.6%) |
| 55 to 64 Years | 389 (90.3%) | 42 (9.7%) |
| 65 to 74 Years | 200 (100.0%) | 0 (0.0%) |
| 75 Years and older | 207 (100.0%) | 0 (0.0%) |
| Total | 2,340 (90.3%) | 250 (9.7%) |
Health Insurance Coverage by Citizenship Status in Delhi
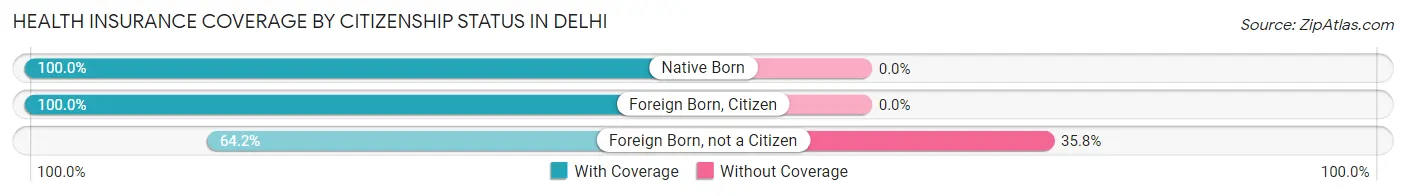
| Citizenship Status | With Coverage | Without Coverage |
| Native Born | 128 (100.0%) | 0 (0.0%) |
| Foreign Born, Citizen | 489 (100.0%) | 0 (0.0%) |
| Foreign Born, not a Citizen | 111 (64.2%) | 62 (35.8%) |
Health Insurance Coverage by Household Income in Delhi
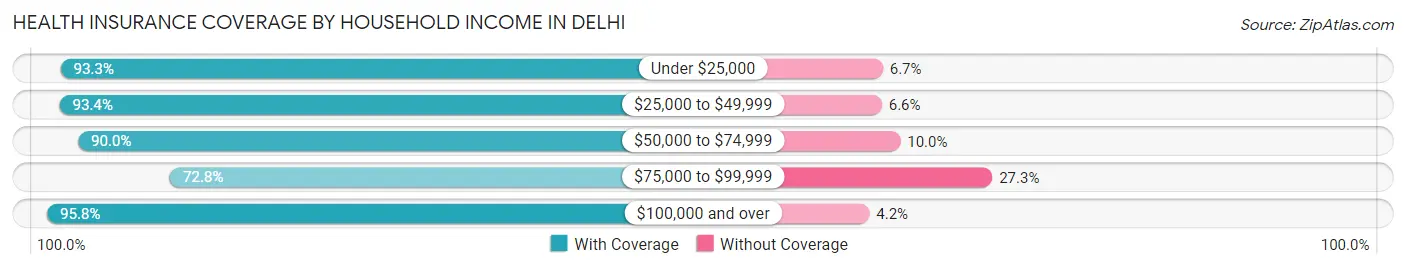
| Household Income | With Coverage | Without Coverage |
| Under $25,000 | 609 (93.3%) | 44 (6.7%) |
| $25,000 to $49,999 | 541 (93.4%) | 38 (6.6%) |
| $50,000 to $74,999 | 521 (90.0%) | 58 (10.0%) |
| $75,000 to $99,999 | 243 (72.8%) | 91 (27.3%) |
| $100,000 and over | 408 (95.8%) | 18 (4.2%) |
Public vs Private Health Insurance Coverage by Age in Delhi
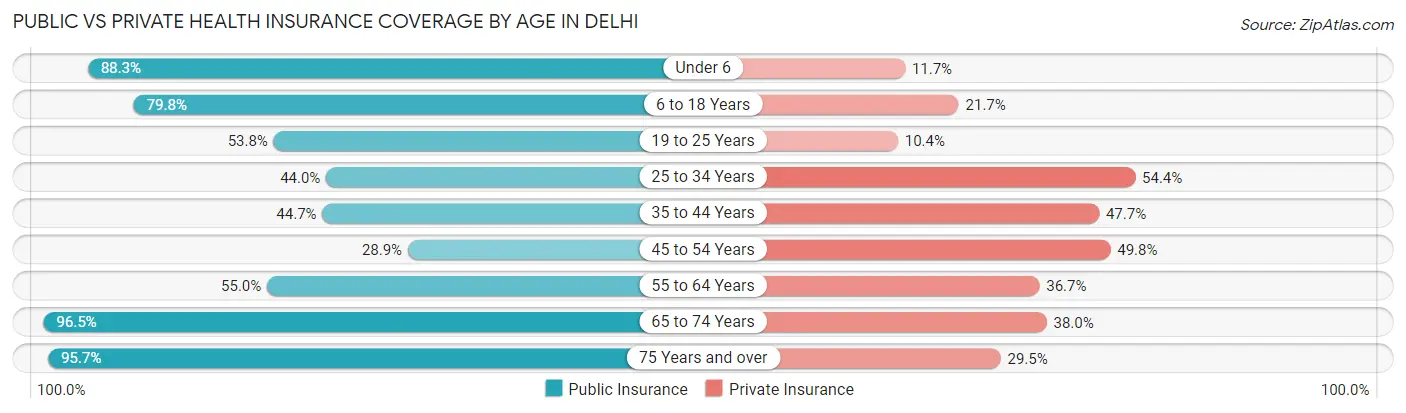
| Age Bracket | Public Insurance | Private Insurance |
| Under 6 | 113 (88.3%) | 15 (11.7%) |
| 6 to 18 Years | 390 (79.7%) | 106 (21.7%) |
| 19 to 25 Years | 93 (53.8%) | 18 (10.4%) |
| 25 to 34 Years | 114 (44.0%) | 141 (54.4%) |
| 35 to 44 Years | 178 (44.7%) | 190 (47.7%) |
| 45 to 54 Years | 88 (28.8%) | 152 (49.8%) |
| 55 to 64 Years | 237 (55.0%) | 158 (36.7%) |
| 65 to 74 Years | 193 (96.5%) | 76 (38.0%) |
| 75 Years and over | 198 (95.7%) | 61 (29.5%) |
| Total | 1,604 (61.9%) | 917 (35.4%) |
Disability Status by Sex by Age in Delhi
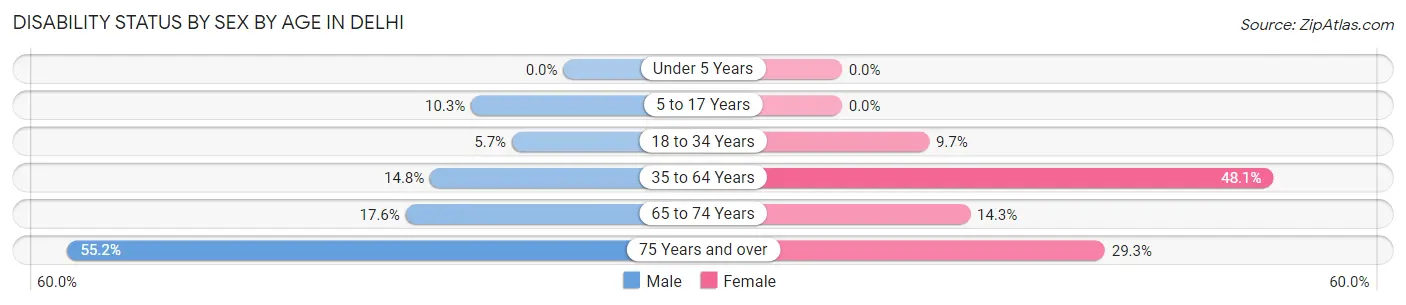
| Age Bracket | Male | Female |
| Under 5 Years | 0 (0.0%) | 0 (0.0%) |
| 5 to 17 Years | 26 (10.3%) | 0 (0.0%) |
| 18 to 34 Years | 16 (5.7%) | 20 (9.7%) |
| 35 to 64 Years | 88 (14.8%) | 260 (48.1%) |
| 65 to 74 Years | 13 (17.6%) | 18 (14.3%) |
| 75 Years and over | 37 (55.2%) | 41 (29.3%) |
Disability Class by Sex by Age in Delhi
Disability Class: Hearing Difficulty
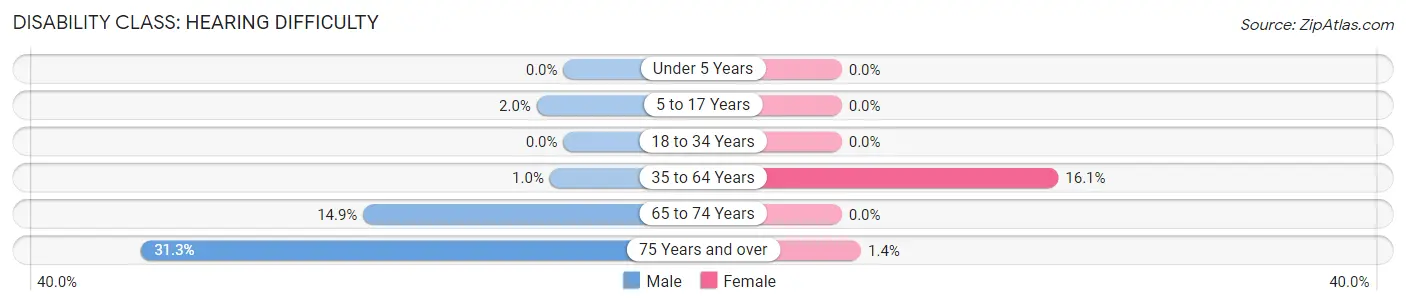
| Age Bracket | Male | Female |
| Under 5 Years | 0 (0.0%) | 0 (0.0%) |
| 5 to 17 Years | 5 (2.0%) | 0 (0.0%) |
| 18 to 34 Years | 0 (0.0%) | 0 (0.0%) |
| 35 to 64 Years | 6 (1.0%) | 87 (16.1%) |
| 65 to 74 Years | 11 (14.9%) | 0 (0.0%) |
| 75 Years and over | 21 (31.3%) | 2 (1.4%) |
Disability Class: Vision Difficulty
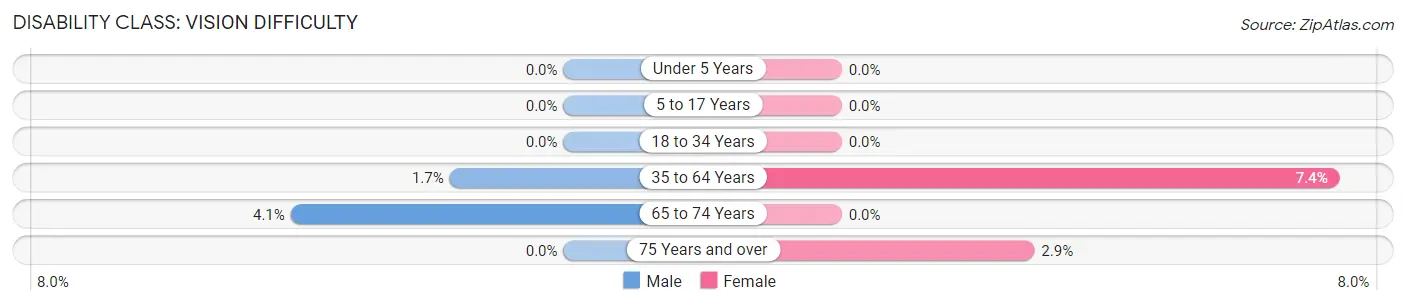
| Age Bracket | Male | Female |
| Under 5 Years | 0 (0.0%) | 0 (0.0%) |
| 5 to 17 Years | 0 (0.0%) | 0 (0.0%) |
| 18 to 34 Years | 0 (0.0%) | 0 (0.0%) |
| 35 to 64 Years | 10 (1.7%) | 40 (7.4%) |
| 65 to 74 Years | 3 (4.1%) | 0 (0.0%) |
| 75 Years and over | 0 (0.0%) | 4 (2.9%) |
Disability Class: Cognitive Difficulty
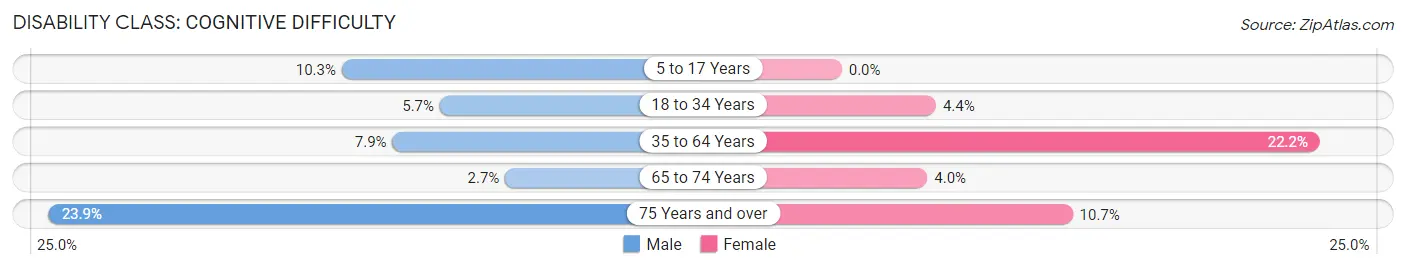
| Age Bracket | Male | Female |
| 5 to 17 Years | 26 (10.3%) | 0 (0.0%) |
| 18 to 34 Years | 16 (5.7%) | 9 (4.4%) |
| 35 to 64 Years | 47 (7.9%) | 120 (22.2%) |
| 65 to 74 Years | 2 (2.7%) | 5 (4.0%) |
| 75 Years and over | 16 (23.9%) | 15 (10.7%) |
Disability Class: Ambulatory Difficulty

| Age Bracket | Male | Female |
| 5 to 17 Years | 0 (0.0%) | 0 (0.0%) |
| 18 to 34 Years | 0 (0.0%) | 11 (5.3%) |
| 35 to 64 Years | 73 (12.3%) | 178 (32.9%) |
| 65 to 74 Years | 5 (6.8%) | 18 (14.3%) |
| 75 Years and over | 26 (38.8%) | 24 (17.1%) |
Disability Class: Self-Care Difficulty
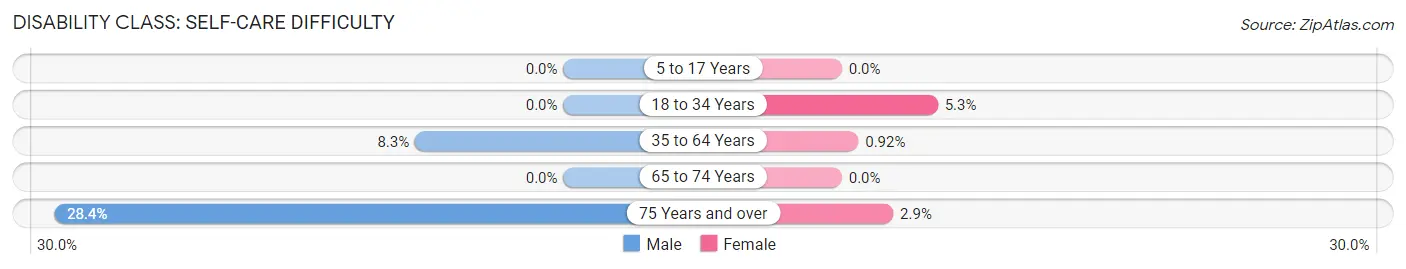
| Age Bracket | Male | Female |
| 5 to 17 Years | 0 (0.0%) | 0 (0.0%) |
| 18 to 34 Years | 0 (0.0%) | 11 (5.3%) |
| 35 to 64 Years | 49 (8.3%) | 5 (0.9%) |
| 65 to 74 Years | 0 (0.0%) | 0 (0.0%) |
| 75 Years and over | 19 (28.4%) | 4 (2.9%) |
Technology Access in Delhi
Computing Device Access in Delhi
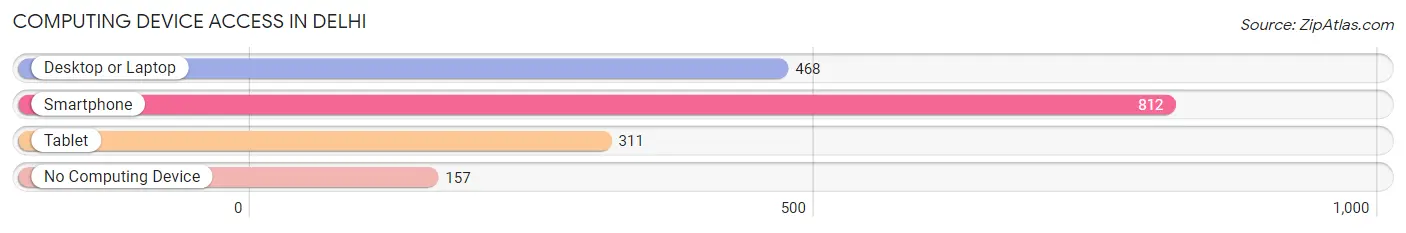
| Device Type | # Households | % Households |
| Desktop or Laptop | 468 | 46.5% |
| Smartphone | 812 | 80.6% |
| Tablet | 311 | 30.9% |
| No Computing Device | 157 | 15.6% |
| Total | 1,007 | 100.0% |
Internet Access in Delhi
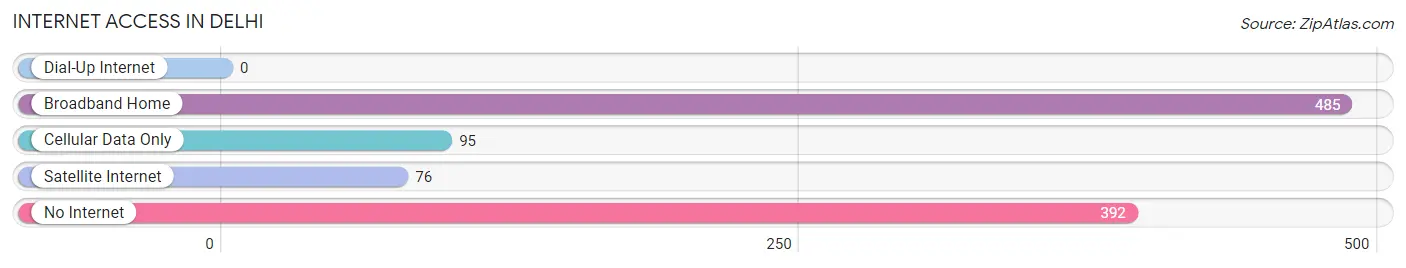
| Internet Type | # Households | % Households |
| Dial-Up Internet | 0 | 0.0% |
| Broadband Home | 485 | 48.2% |
| Cellular Data Only | 95 | 9.4% |
| Satellite Internet | 76 | 7.5% |
| No Internet | 392 | 38.9% |
| Total | 1,007 | 100.0% |
Delhi Summary
Delhi is the capital of India and is located in the northern part of the country. It is the second most populous city in India after Mumbai, with a population of over 16 million people. Delhi is a major cultural, political, and commercial center of India, and is home to a number of important monuments, including the Red Fort, India Gate, and the Qutub Minar.
Geography
Delhi is located in the northern part of India, in the state of Delhi. It is situated on the banks of the Yamuna River, and is surrounded by the states of Uttar Pradesh, Haryana, and Rajasthan. The city covers an area of 1,484 square kilometers, and is divided into nine districts. The climate of Delhi is tropical, with hot summers and mild winters.
Economy
Delhi is one of the most important economic centers in India. It is home to a number of major industries, including textiles, chemicals, electronics, and automobile manufacturing. The city is also a major center for banking and finance, and is home to the headquarters of several major Indian banks. The service sector is also an important part of the economy, with a number of IT companies, hotels, and other businesses located in the city.
Demographics
As of the 2011 census, Delhi had a population of 16.3 million people. The majority of the population is Hindu, with Muslims making up a significant minority. Other religious groups include Sikhs, Jains, and Christians. The city is also home to a large number of migrants from other parts of India, as well as from other countries.
Delhi is a major cultural center, and is home to a number of important monuments and sites. The city is also home to a number of universities and colleges, as well as a number of museums and art galleries. The city is also home to a number of important festivals, including the Republic Day Parade and the Diwali Festival.
Common Questions
What is Per Capita Income in Delhi?
Per Capita income in Delhi is $23,368.
What is the Median Family Income in Delhi?
Median Family Income in Delhi is $51,362.
What is the Median Household income in Delhi?
Median Household Income in Delhi is $43,348.
What is Income or Wage Gap in Delhi?
Income or Wage Gap in Delhi is 14.8%.
Women in Delhi earn 85.2 cents for every dollar earned by a man.
What is Inequality or Gini Index in Delhi?
Inequality or Gini Index in Delhi is 0.51.
What is the Total Population of Delhi?
Total Population of Delhi is 2,630.
What is the Total Male Population of Delhi?
Total Male Population of Delhi is 1,379.
What is the Total Female Population of Delhi?
Total Female Population of Delhi is 1,251.
What is the Ratio of Males per 100 Females in Delhi?
There are 110.23 Males per 100 Females in Delhi.
What is the Ratio of Females per 100 Males in Delhi?
There are 90.72 Females per 100 Males in Delhi.
What is the Median Population Age in Delhi?
Median Population Age in Delhi is 41.7 Years.
What is the Average Family Size in Delhi
Average Family Size in Delhi is 3.2 People.
What is the Average Household Size in Delhi
Average Household Size in Delhi is 2.5 People.
How Large is the Labor Force in Delhi?
There are 1,036 People in the Labor Forcein in Delhi.
What is the Percentage of People in the Labor Force in Delhi?
48.8% of People are in the Labor Force in Delhi.
What is the Unemployment Rate in Delhi?
Unemployment Rate in Delhi is 10.0%.