Cottonport, LA Map & Demographics
Cottonport Map
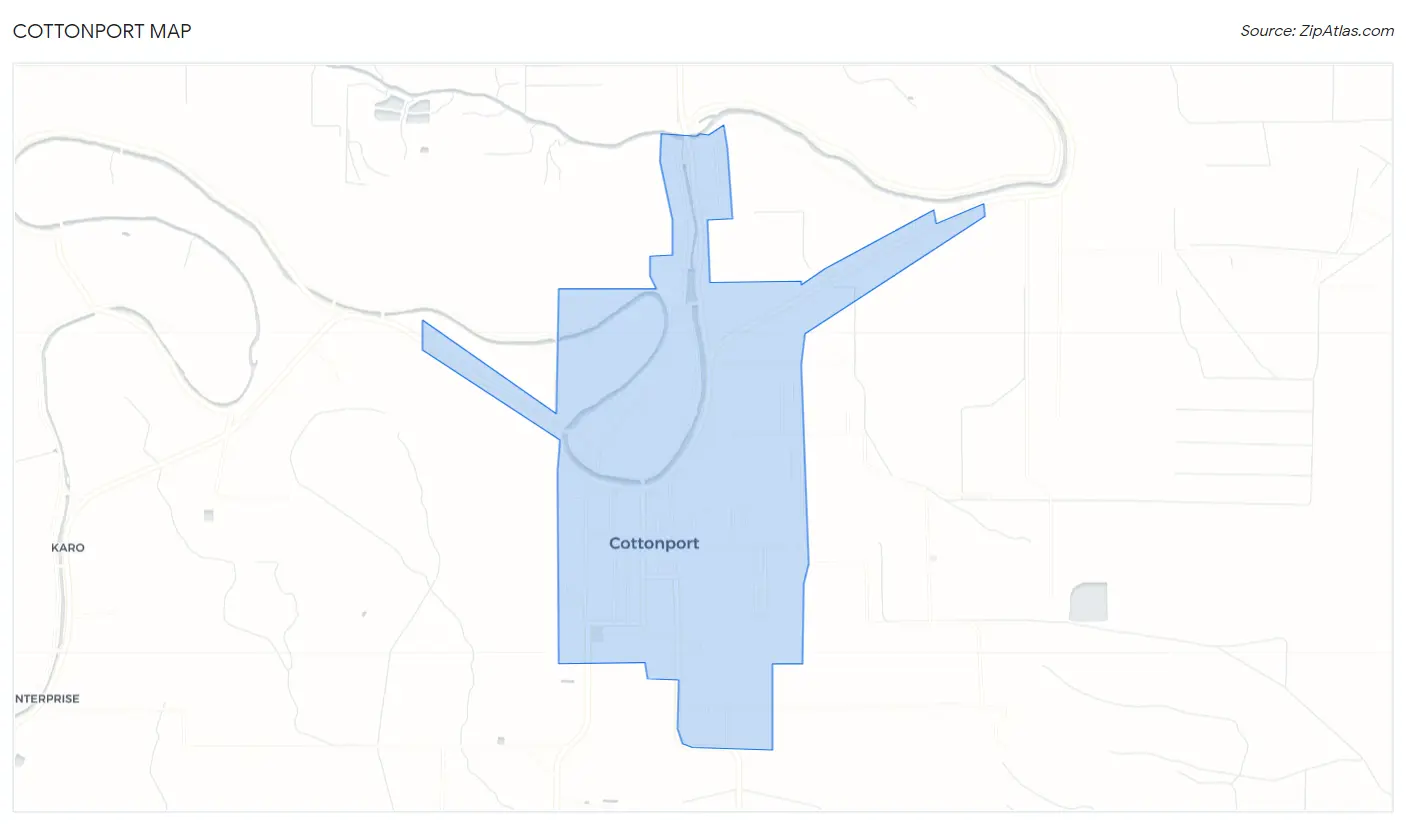
Cottonport Overview
$16,658
PER CAPITA INCOME
$32,141
AVG FAMILY INCOME
$31,676
AVG HOUSEHOLD INCOME
63.2%
WAGE / INCOME GAP [ % ]
36.8¢/ $1
WAGE / INCOME GAP [ $ ]
0.43
INEQUALITY / GINI INDEX
1,734
TOTAL POPULATION
496
MALE POPULATION
1,238
FEMALE POPULATION
40.06
MALES / 100 FEMALES
249.60
FEMALES / 100 MALES
24.6
MEDIAN AGE
3.3
AVG FAMILY SIZE
2.8
AVG HOUSEHOLD SIZE
664
LABOR FORCE [ PEOPLE ]
55.9%
PERCENT IN LABOR FORCE
3.3%
UNEMPLOYMENT RATE
Cottonport Zip Codes
Cottonport Area Codes
Income in Cottonport
Income Overview in Cottonport
Per Capita Income in Cottonport is $16,658, while median incomes of families and households are $32,141 and $31,676 respectively.
| Characteristic | Number | Measure |
| Per Capita Income | 1,734 | $16,658 |
| Median Family Income | 459 | $32,141 |
| Mean Family Income | 459 | $50,112 |
| Median Household Income | 610 | $31,676 |
| Mean Household Income | 610 | $44,892 |
| Income Deficit | 459 | $0 |
| Wage / Income Gap (%) | 1,734 | 63.19% |
| Wage / Income Gap ($) | 1,734 | 36.81¢ per $1 |
| Gini / Inequality Index | 1,734 | 0.43 |
Earnings by Sex in Cottonport
Average Earnings in Cottonport are $25,689, $65,083 for men and $23,958 for women, a difference of 63.2%.
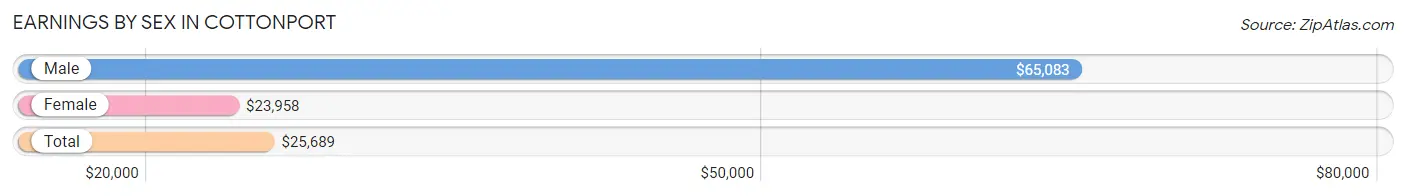
| Sex | Number | Average Earnings |
| Male | 160 (23.3%) | $65,083 |
| Female | 527 (76.7%) | $23,958 |
| Total | 687 (100.0%) | $25,689 |
Earnings by Sex by Income Bracket in Cottonport
The most common earnings brackets in Cottonport are $65,000 to $74,999 for men (38 | 23.7%) and $30,000 to $34,999 for women (127 | 24.1%).
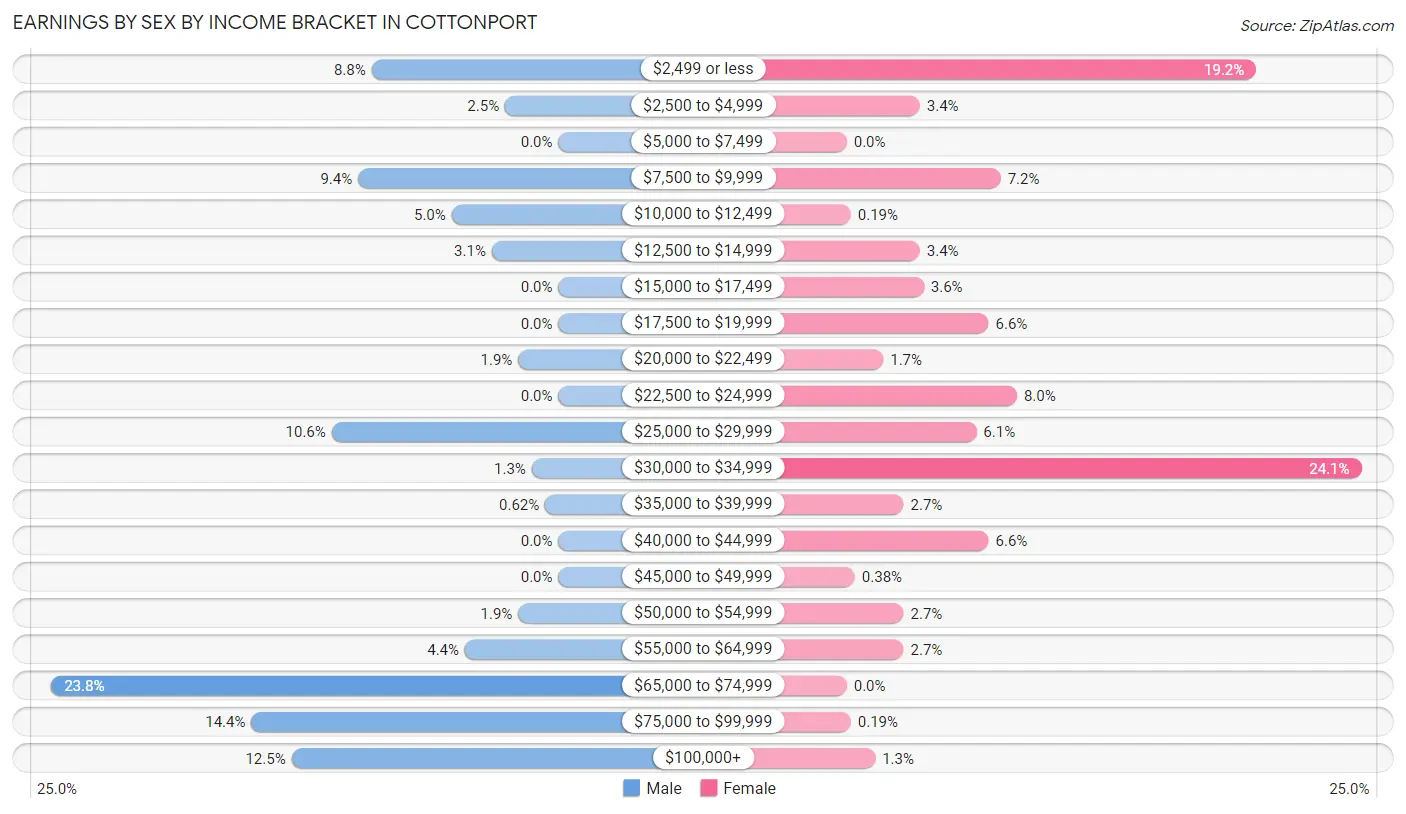
| Income | Male | Female |
| $2,499 or less | 14 (8.7%) | 101 (19.2%) |
| $2,500 to $4,999 | 4 (2.5%) | 18 (3.4%) |
| $5,000 to $7,499 | 0 (0.0%) | 0 (0.0%) |
| $7,500 to $9,999 | 15 (9.4%) | 38 (7.2%) |
| $10,000 to $12,499 | 8 (5.0%) | 1 (0.2%) |
| $12,500 to $14,999 | 5 (3.1%) | 18 (3.4%) |
| $15,000 to $17,499 | 0 (0.0%) | 19 (3.6%) |
| $17,500 to $19,999 | 0 (0.0%) | 35 (6.6%) |
| $20,000 to $22,499 | 3 (1.9%) | 9 (1.7%) |
| $22,500 to $24,999 | 0 (0.0%) | 42 (8.0%) |
| $25,000 to $29,999 | 17 (10.6%) | 32 (6.1%) |
| $30,000 to $34,999 | 2 (1.3%) | 127 (24.1%) |
| $35,000 to $39,999 | 1 (0.6%) | 14 (2.7%) |
| $40,000 to $44,999 | 0 (0.0%) | 35 (6.6%) |
| $45,000 to $49,999 | 0 (0.0%) | 2 (0.4%) |
| $50,000 to $54,999 | 3 (1.9%) | 14 (2.7%) |
| $55,000 to $64,999 | 7 (4.4%) | 14 (2.7%) |
| $65,000 to $74,999 | 38 (23.7%) | 0 (0.0%) |
| $75,000 to $99,999 | 23 (14.4%) | 1 (0.2%) |
| $100,000+ | 20 (12.5%) | 7 (1.3%) |
| Total | 160 (100.0%) | 527 (100.0%) |
Earnings by Sex by Educational Attainment in Cottonport
Average earnings in Cottonport are $66,125 for men and $30,258 for women, a difference of 54.2%. Men with an educational attainment of college or associate's degree enjoy the highest average annual earnings of $95,556, while those with less than high school education earn the least with $66,542. Women with an educational attainment of high school diploma earn the most with the average annual earnings of $34,500, while those with college or associate's degree education have the smallest earnings of $23,384.
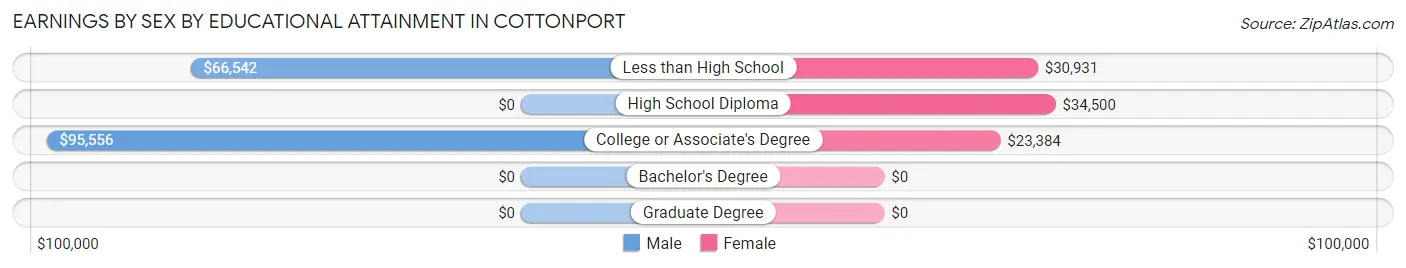
| Educational Attainment | Male Income | Female Income |
| Less than High School | $66,542 | $30,931 |
| High School Diploma | - | - |
| College or Associate's Degree | $95,556 | $23,384 |
| Bachelor's Degree | - | - |
| Graduate Degree | - | - |
| Total | $66,125 | $30,258 |
Family Income in Cottonport
Family Income Brackets in Cottonport
According to the Cottonport family income data, there are 120 families falling into the $25,000 to $34,999 income range, which is the most common income bracket and makes up 26.1% of all families.
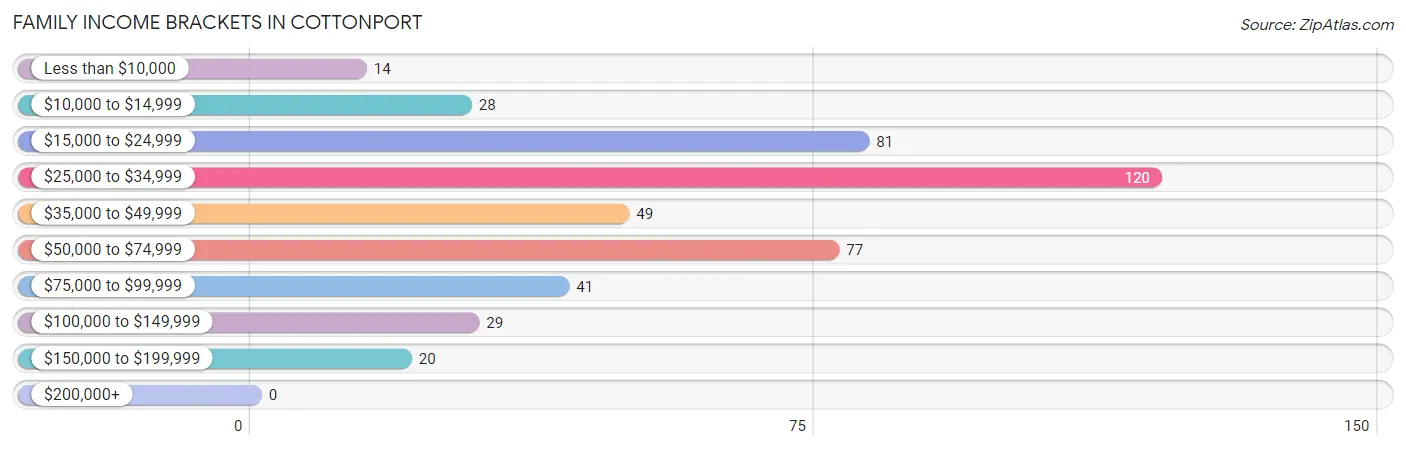
| Income Bracket | # Families | % Families |
| Less than $10,000 | 14 | 3.1% |
| $10,000 to $14,999 | 28 | 6.1% |
| $15,000 to $24,999 | 81 | 17.6% |
| $25,000 to $34,999 | 120 | 26.1% |
| $35,000 to $49,999 | 49 | 10.7% |
| $50,000 to $74,999 | 77 | 16.8% |
| $75,000 to $99,999 | 41 | 8.9% |
| $100,000 to $149,999 | 29 | 6.3% |
| $150,000 to $199,999 | 20 | 4.4% |
| $200,000+ | 0 | 0.0% |
Family Income by Famaliy Size in Cottonport
5-person families (24 | 5.2%) account for the highest median family income in Cottonport with $76,136 per family, while 2-person families (125 | 27.2%) have the highest median income of $34,188 per family member.
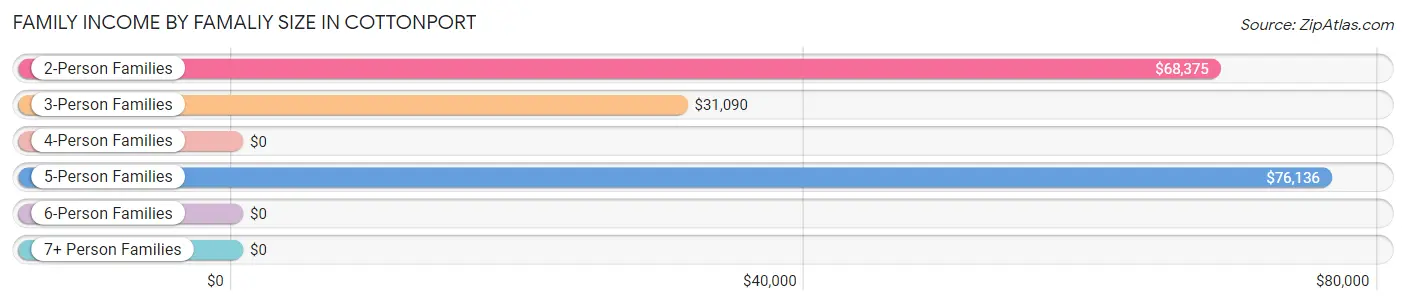
| Income Bracket | # Families | Median Income |
| 2-Person Families | 125 (27.2%) | $68,375 |
| 3-Person Families | 258 (56.2%) | $31,090 |
| 4-Person Families | 52 (11.3%) | $0 |
| 5-Person Families | 24 (5.2%) | $76,136 |
| 6-Person Families | 0 (0.0%) | $0 |
| 7+ Person Families | 0 (0.0%) | $0 |
| Total | 459 (100.0%) | $32,141 |
Family Income by Number of Earners in Cottonport
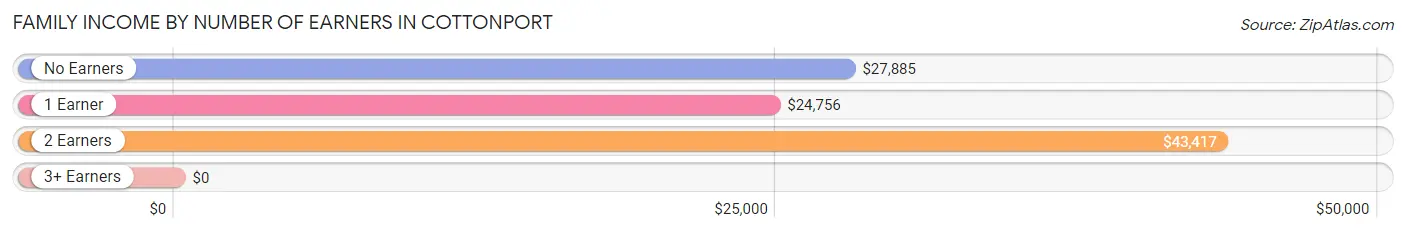
| Number of Earners | # Families | Median Income |
| No Earners | 78 (17.0%) | $27,885 |
| 1 Earner | 170 (37.0%) | $24,756 |
| 2 Earners | 210 (45.8%) | $43,417 |
| 3+ Earners | 1 (0.2%) | $0 |
| Total | 459 (100.0%) | $32,141 |
Household Income in Cottonport
Household Income Brackets in Cottonport
With 122 households falling in the category, the $25,000 to $34,999 income range is the most frequent in Cottonport, accounting for 20.0% of all households.
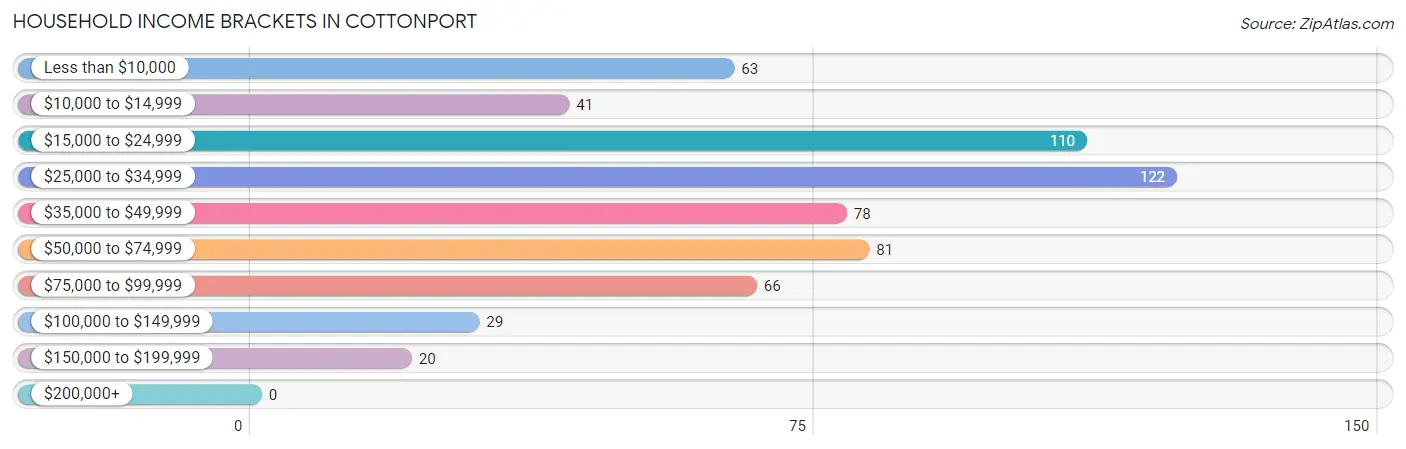
| Income Bracket | # Households | % Households |
| Less than $10,000 | 63 | 10.3% |
| $10,000 to $14,999 | 41 | 6.7% |
| $15,000 to $24,999 | 110 | 18.0% |
| $25,000 to $34,999 | 122 | 20.0% |
| $35,000 to $49,999 | 78 | 12.8% |
| $50,000 to $74,999 | 81 | 13.3% |
| $75,000 to $99,999 | 66 | 10.8% |
| $100,000 to $149,999 | 29 | 4.8% |
| $150,000 to $199,999 | 20 | 3.3% |
| $200,000+ | 0 | 0.0% |
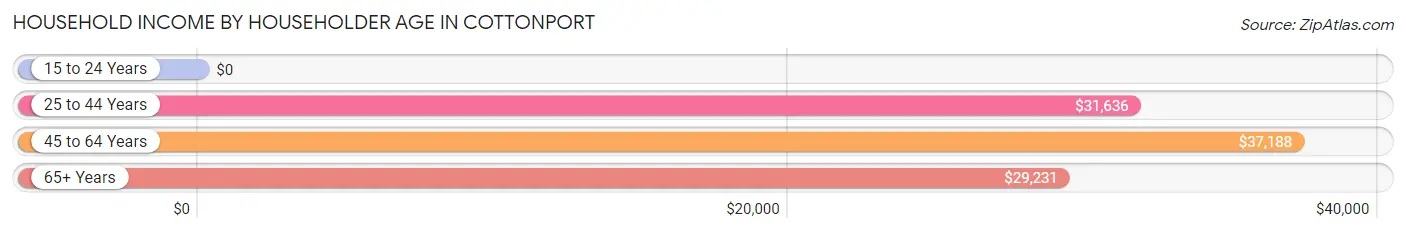
Household Income by Householder Age in Cottonport
The median household income in Cottonport is $31,676, with the highest median household income of $37,188 found in the 45 to 64 years age bracket for the primary householder. A total of 213 households (34.9%) fall into this category. Meanwhile, the 15 to 24 years age bracket for the primary householder has the lowest median household income of $0, with 10 households (1.6%) in this group.
| Income Bracket | # Households | Median Income |
| 15 to 24 Years | 10 (1.6%) | $0 |
| 25 to 44 Years | 277 (45.4%) | $31,636 |
| 45 to 64 Years | 213 (34.9%) | $37,188 |
| 65+ Years | 110 (18.0%) | $29,231 |
| Total | 610 (100.0%) | $31,676 |
Poverty in Cottonport
Income Below Poverty by Sex and Age in Cottonport
With 36.7% poverty level for males and 23.9% for females among the residents of Cottonport, 5 year old males and 15 year old females are the most vulnerable to poverty, with 9 males (100.0%) and 21 females (87.5%) in their respective age groups living below the poverty level.
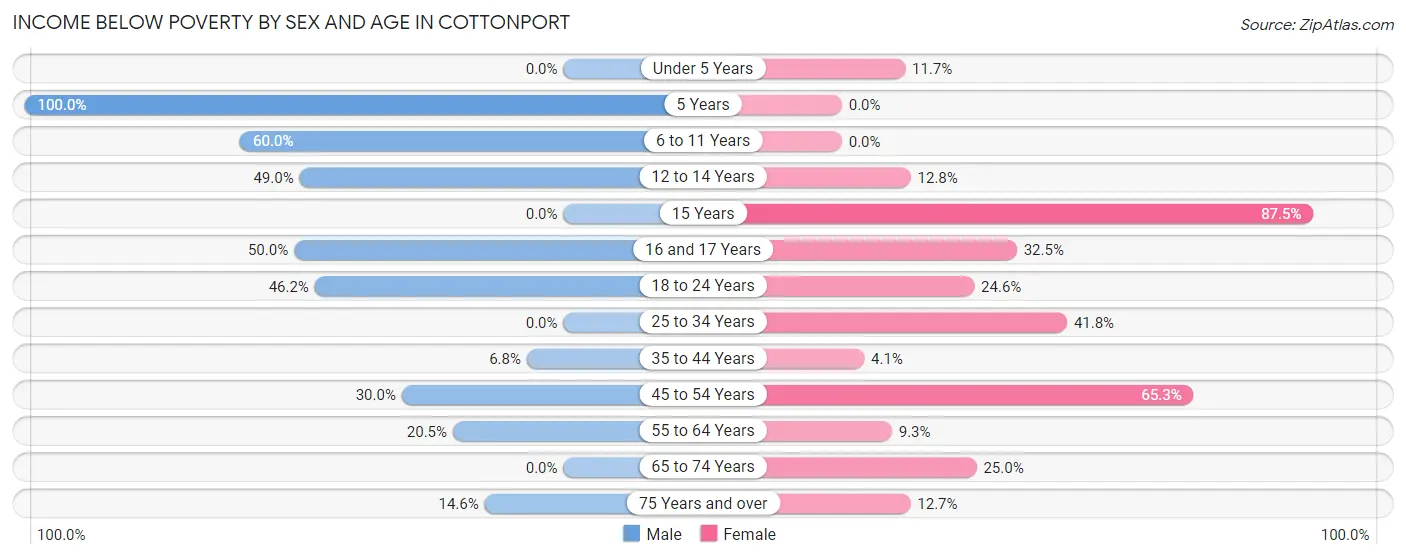
| Age Bracket | Male | Female |
| Under 5 Years | 0 (0.0%) | 29 (11.7%) |
| 5 Years | 9 (100.0%) | 0 (0.0%) |
| 6 to 11 Years | 72 (60.0%) | 0 (0.0%) |
| 12 to 14 Years | 24 (49.0%) | 6 (12.8%) |
| 15 Years | 0 (0.0%) | 21 (87.5%) |
| 16 and 17 Years | 13 (50.0%) | 25 (32.5%) |
| 18 to 24 Years | 24 (46.2%) | 43 (24.6%) |
| 25 to 34 Years | 0 (0.0%) | 56 (41.8%) |
| 35 to 44 Years | 4 (6.8%) | 7 (4.1%) |
| 45 to 54 Years | 12 (30.0%) | 79 (65.3%) |
| 55 to 64 Years | 16 (20.5%) | 9 (9.3%) |
| 65 to 74 Years | 0 (0.0%) | 12 (25.0%) |
| 75 Years and over | 6 (14.6%) | 7 (12.7%) |
| Total | 180 (36.7%) | 294 (23.9%) |
Income Above Poverty by Sex and Age in Cottonport
According to the poverty statistics in Cottonport, males aged 25 to 34 years and females aged 6 to 11 years are the age groups that are most secure financially, with 100.0% of males and 100.0% of females in these age groups living above the poverty line.
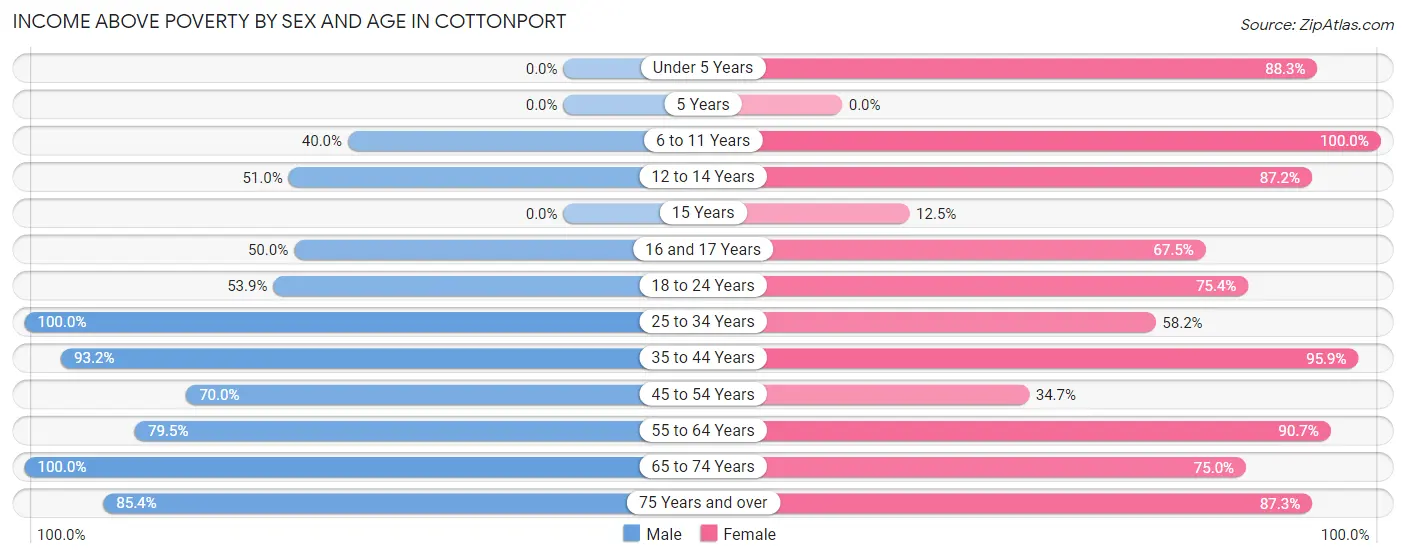
| Age Bracket | Male | Female |
| Under 5 Years | 0 (0.0%) | 218 (88.3%) |
| 5 Years | 0 (0.0%) | 0 (0.0%) |
| 6 to 11 Years | 48 (40.0%) | 34 (100.0%) |
| 12 to 14 Years | 25 (51.0%) | 41 (87.2%) |
| 15 Years | 0 (0.0%) | 3 (12.5%) |
| 16 and 17 Years | 13 (50.0%) | 52 (67.5%) |
| 18 to 24 Years | 28 (53.8%) | 132 (75.4%) |
| 25 to 34 Years | 4 (100.0%) | 78 (58.2%) |
| 35 to 44 Years | 55 (93.2%) | 162 (95.9%) |
| 45 to 54 Years | 28 (70.0%) | 42 (34.7%) |
| 55 to 64 Years | 62 (79.5%) | 88 (90.7%) |
| 65 to 74 Years | 12 (100.0%) | 36 (75.0%) |
| 75 Years and over | 35 (85.4%) | 48 (87.3%) |
| Total | 310 (63.3%) | 934 (76.1%) |
Income Below Poverty Among Married-Couple Families in Cottonport
The poverty statistics for married-couple families in Cottonport show that 1.5% or 2 of the total 136 families live below the poverty line. Families with no children have the highest poverty rate of 2.2%, comprising of 2 families. On the other hand, families with 1 or 2 children have the lowest poverty rate of 0.0%, which includes 0 families.
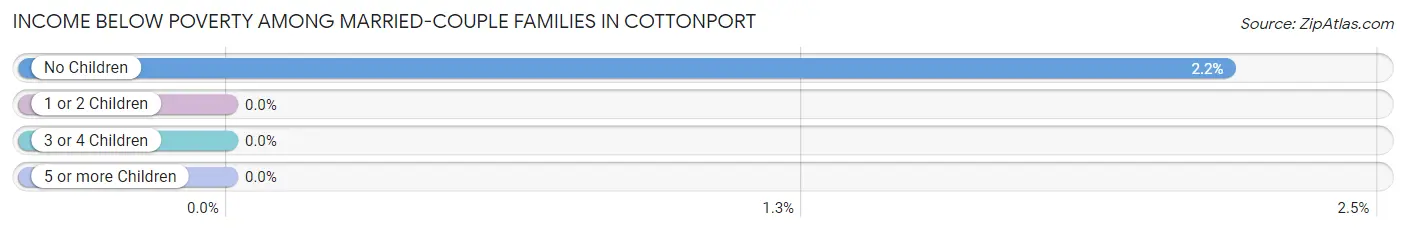
| Children | Above Poverty | Below Poverty |
| No Children | 90 (97.8%) | 2 (2.2%) |
| 1 or 2 Children | 28 (100.0%) | 0 (0.0%) |
| 3 or 4 Children | 16 (100.0%) | 0 (0.0%) |
| 5 or more Children | 0 (0.0%) | 0 (0.0%) |
| Total | 134 (98.5%) | 2 (1.5%) |
Income Below Poverty Among Single-Parent Households in Cottonport
According to the poverty data in Cottonport, 80.0% or 12 single-father households and 34.1% or 105 single-mother households are living below the poverty line. Among single-father households, those with 1 or 2 children have the highest poverty rate, with 12 households (80.0%) experiencing poverty. Likewise, among single-mother households, those with 3 or 4 children have the highest poverty rate, with 28 households (100.0%) falling below the poverty line.
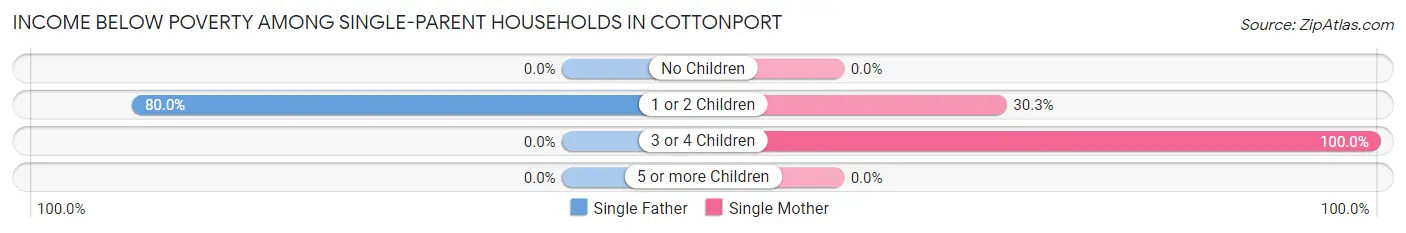
| Children | Single Father | Single Mother |
| No Children | 0 (0.0%) | 0 (0.0%) |
| 1 or 2 Children | 12 (80.0%) | 77 (30.3%) |
| 3 or 4 Children | 0 (0.0%) | 28 (100.0%) |
| 5 or more Children | 0 (0.0%) | 0 (0.0%) |
| Total | 12 (80.0%) | 105 (34.1%) |
Income Below Poverty Among Married-Couple vs Single-Parent Households in Cottonport
The poverty data for Cottonport shows that 2 of the married-couple family households (1.5%) and 117 of the single-parent households (36.2%) are living below the poverty level. Within the married-couple family households, those with no children have the highest poverty rate, with 2 households (2.2%) falling below the poverty line. Among the single-parent households, those with 3 or 4 children have the highest poverty rate, with 28 household (100.0%) living below poverty.
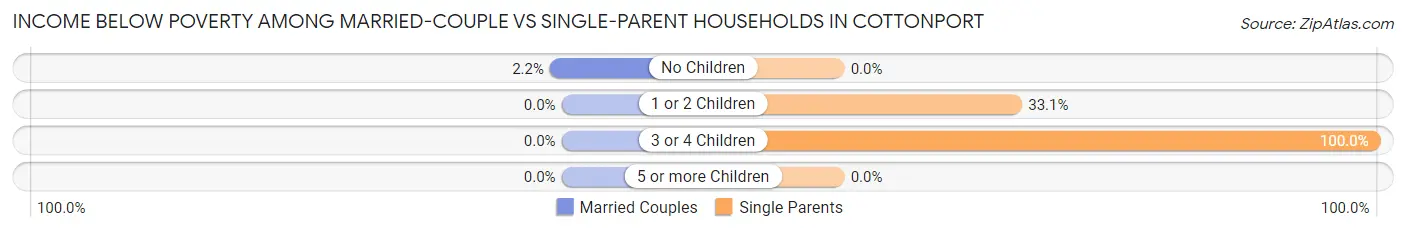
| Children | Married-Couple Families | Single-Parent Households |
| No Children | 2 (2.2%) | 0 (0.0%) |
| 1 or 2 Children | 0 (0.0%) | 89 (33.1%) |
| 3 or 4 Children | 0 (0.0%) | 28 (100.0%) |
| 5 or more Children | 0 (0.0%) | 0 (0.0%) |
| Total | 2 (1.5%) | 117 (36.2%) |
Race in Cottonport
The most populous races in Cottonport are Black / African American (959 | 55.3%), White / Caucasian (678 | 39.1%), and Hispanic or Latino (107 | 6.2%).
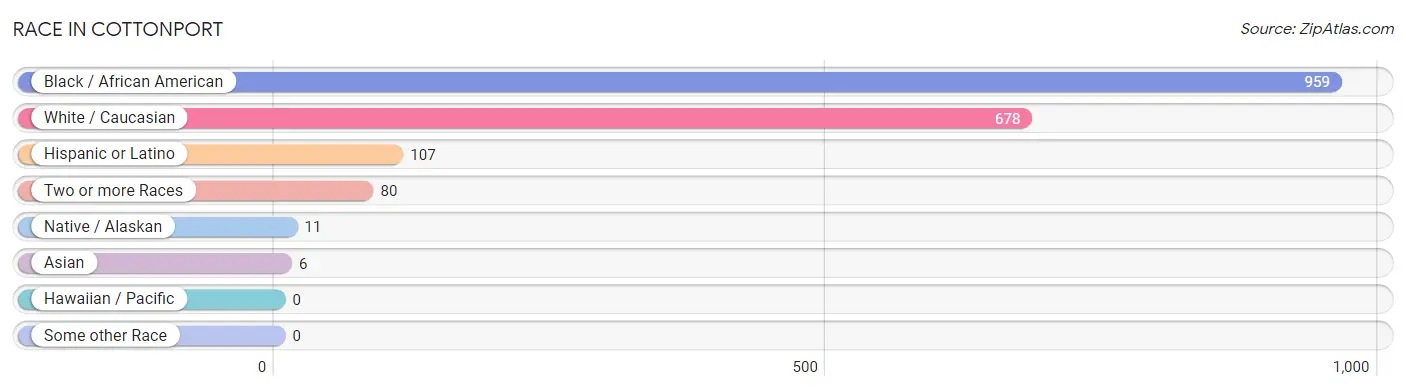
| Race | # Population | % Population |
| Asian | 6 | 0.4% |
| Black / African American | 959 | 55.3% |
| Hawaiian / Pacific | 0 | 0.0% |
| Hispanic or Latino | 107 | 6.2% |
| Native / Alaskan | 11 | 0.6% |
| White / Caucasian | 678 | 39.1% |
| Two or more Races | 80 | 4.6% |
| Some other Race | 0 | 0.0% |
| Total | 1,734 | 100.0% |
Ancestry in Cottonport
The most populous ancestries reported in Cottonport are French (222 | 12.8%), German (154 | 8.9%), Irish (133 | 7.7%), Mexican (107 | 6.2%), and American (59 | 3.4%), together accounting for 38.9% of all Cottonport residents.
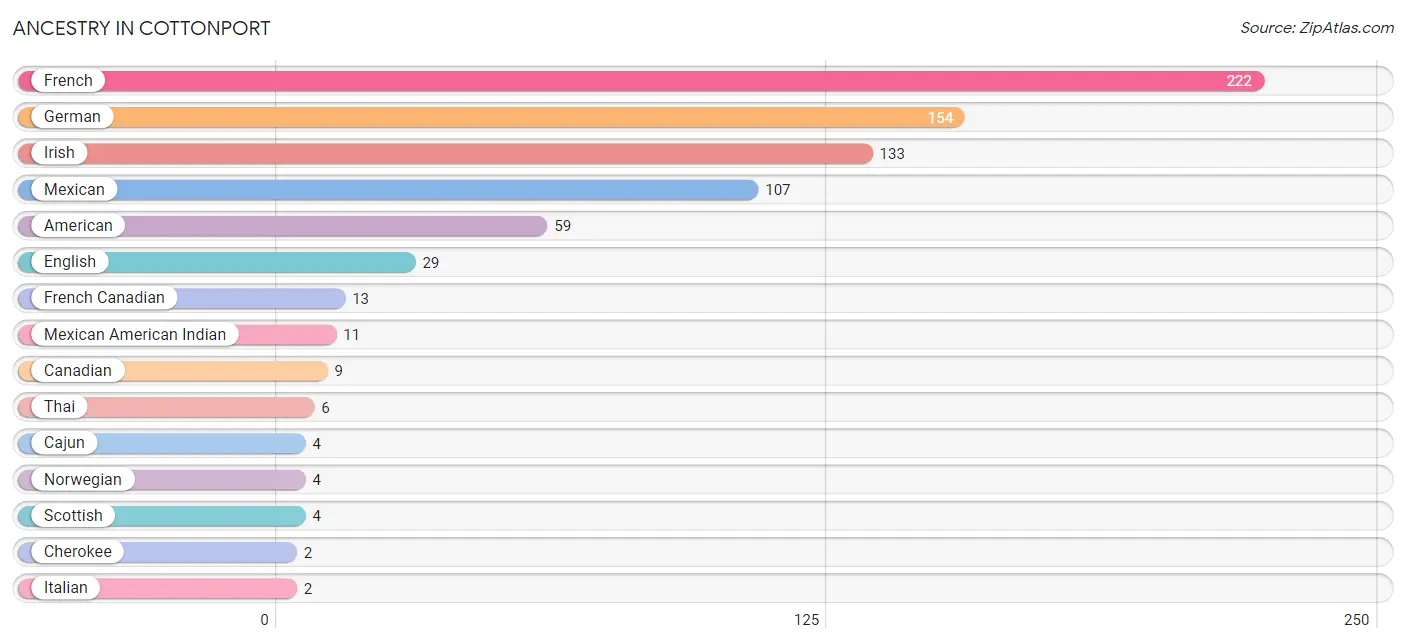
| Ancestry | # Population | % Population |
| American | 59 | 3.4% |
| Cajun | 4 | 0.2% |
| Canadian | 9 | 0.5% |
| Cherokee | 2 | 0.1% |
| English | 29 | 1.7% |
| French | 222 | 12.8% |
| French Canadian | 13 | 0.7% |
| German | 154 | 8.9% |
| Irish | 133 | 7.7% |
| Italian | 2 | 0.1% |
| Mexican | 107 | 6.2% |
| Mexican American Indian | 11 | 0.6% |
| Norwegian | 4 | 0.2% |
| Scottish | 4 | 0.2% |
| Thai | 6 | 0.4% | View All 15 Rows |
Immigrants in Cottonport
The most numerous immigrant groups reported in Cottonport came from Central America (75 | 4.3%), Latin America (75 | 4.3%), Mexico (75 | 4.3%), Asia (4 | 0.2%), and India (4 | 0.2%), together accounting for 13.4% of all Cottonport residents.
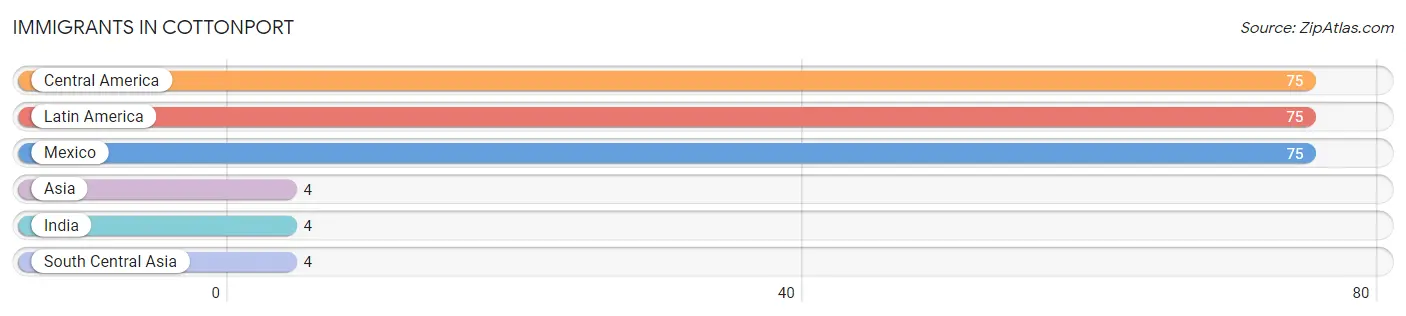
| Immigration Origin | # Population | % Population |
| Asia | 4 | 0.2% |
| Central America | 75 | 4.3% |
| India | 4 | 0.2% |
| Latin America | 75 | 4.3% |
| Mexico | 75 | 4.3% |
| South Central Asia | 4 | 0.2% | View All 6 Rows |
Sex and Age in Cottonport
Sex and Age in Cottonport
The most populous age groups in Cottonport are 5 to 9 Years (93 | 18.8%) for men and Under 5 Years (247 | 20.0%) for women.
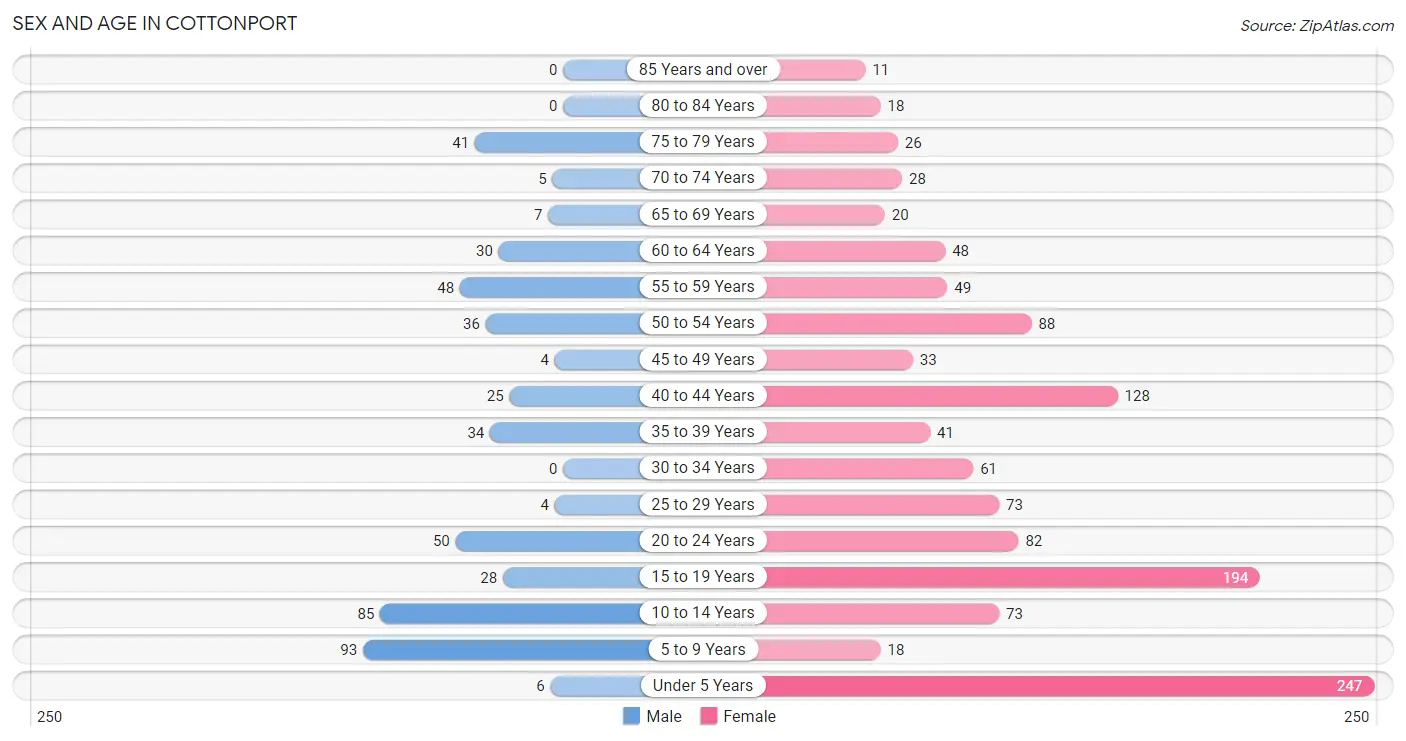
| Age Bracket | Male | Female |
| Under 5 Years | 6 (1.2%) | 247 (20.0%) |
| 5 to 9 Years | 93 (18.8%) | 18 (1.5%) |
| 10 to 14 Years | 85 (17.1%) | 73 (5.9%) |
| 15 to 19 Years | 28 (5.7%) | 194 (15.7%) |
| 20 to 24 Years | 50 (10.1%) | 82 (6.6%) |
| 25 to 29 Years | 4 (0.8%) | 73 (5.9%) |
| 30 to 34 Years | 0 (0.0%) | 61 (4.9%) |
| 35 to 39 Years | 34 (6.9%) | 41 (3.3%) |
| 40 to 44 Years | 25 (5.0%) | 128 (10.3%) |
| 45 to 49 Years | 4 (0.8%) | 33 (2.7%) |
| 50 to 54 Years | 36 (7.3%) | 88 (7.1%) |
| 55 to 59 Years | 48 (9.7%) | 49 (4.0%) |
| 60 to 64 Years | 30 (6.0%) | 48 (3.9%) |
| 65 to 69 Years | 7 (1.4%) | 20 (1.6%) |
| 70 to 74 Years | 5 (1.0%) | 28 (2.3%) |
| 75 to 79 Years | 41 (8.3%) | 26 (2.1%) |
| 80 to 84 Years | 0 (0.0%) | 18 (1.5%) |
| 85 Years and over | 0 (0.0%) | 11 (0.9%) |
| Total | 496 (100.0%) | 1,238 (100.0%) |
Families and Households in Cottonport
Median Family Size in Cottonport
The median family size in Cottonport is 3.33 persons per family, with single female/mother families (308 | 67.1%) accounting for the largest median family size of 3.36 persons per family. On the other hand, single male/father families (15 | 3.3%) represent the smallest median family size with 2.73 persons per family.
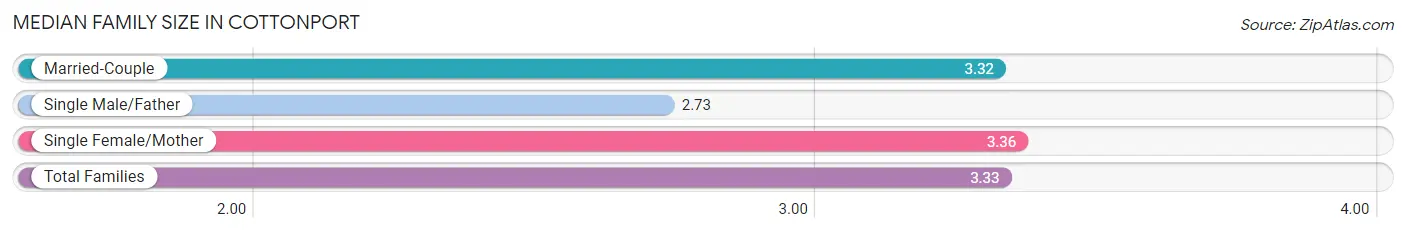
| Family Type | # Families | Family Size |
| Married-Couple | 136 (29.6%) | 3.32 |
| Single Male/Father | 15 (3.3%) | 2.73 |
| Single Female/Mother | 308 (67.1%) | 3.36 |
| Total Families | 459 (100.0%) | 3.33 |
Median Household Size in Cottonport
The median household size in Cottonport is 2.83 persons per household, with single male/father households (15 | 2.5%) accounting for the largest median household size of 3.8 persons per household. non-family households (151 | 24.7%) represent the smallest median household size with 1.01 persons per household.
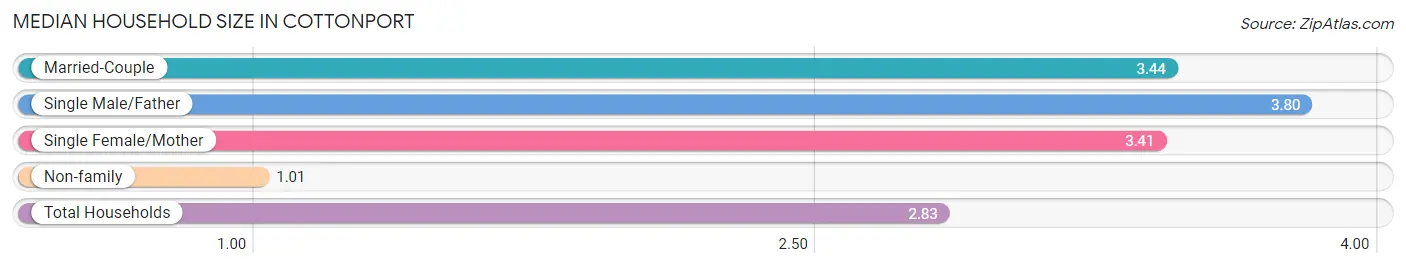
| Household Type | # Households | Household Size |
| Married-Couple | 136 (22.3%) | 3.44 |
| Single Male/Father | 15 (2.5%) | 3.80 |
| Single Female/Mother | 308 (50.5%) | 3.41 |
| Non-family | 151 (24.7%) | 1.01 |
| Total Households | 610 (100.0%) | 2.83 |
Household Size by Marriage Status in Cottonport
Out of a total of 610 households in Cottonport, 459 (75.2%) are family households, while 151 (24.7%) are nonfamily households. The most numerous type of family households are 3-person households, comprising 255, and the most common type of nonfamily households are 1-person households, comprising 149.

| Household Size | Family Households | Nonfamily Households |
| 1-Person Households | - | 149 (24.4%) |
| 2-Person Households | 106 (17.4%) | 2 (0.3%) |
| 3-Person Households | 255 (41.8%) | 0 (0.0%) |
| 4-Person Households | 74 (12.1%) | 0 (0.0%) |
| 5-Person Households | 24 (3.9%) | 0 (0.0%) |
| 6-Person Households | 0 (0.0%) | 0 (0.0%) |
| 7+ Person Households | 0 (0.0%) | 0 (0.0%) |
| Total | 459 (75.2%) | 151 (24.7%) |
Female Fertility in Cottonport
Fertility by Age in Cottonport
Average fertility rate in Cottonport is 103.0 births per 1,000 women. Women in the age bracket of 20 to 34 years have the highest fertility rate with 255.0 births per 1,000 women. Women in the age bracket of 20 to 34 years acount for 87.3% of all women with births.
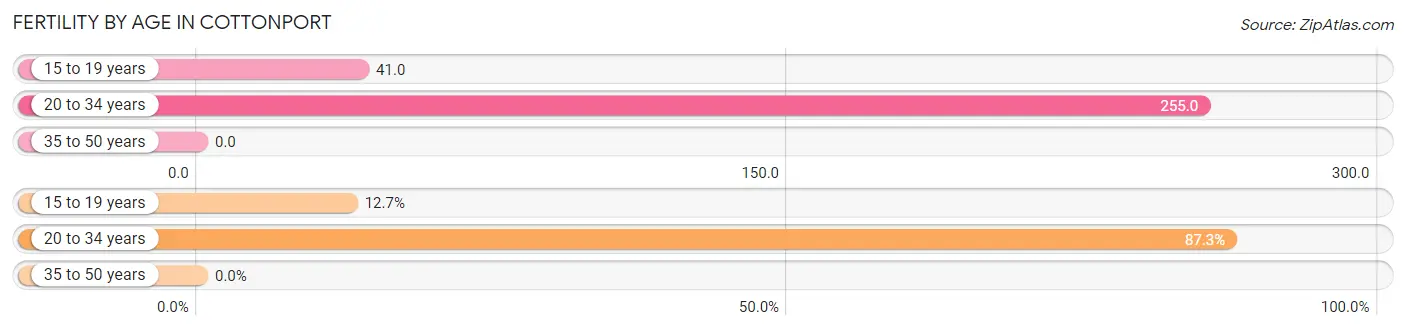
| Age Bracket | Women with Births | Births / 1,000 Women |
| 15 to 19 years | 8 (12.7%) | 41.0 |
| 20 to 34 years | 55 (87.3%) | 255.0 |
| 35 to 50 years | 0 (0.0%) | 0.0 |
| Total | 63 (100.0%) | 103.0 |
Fertility by Age by Marriage Status in Cottonport
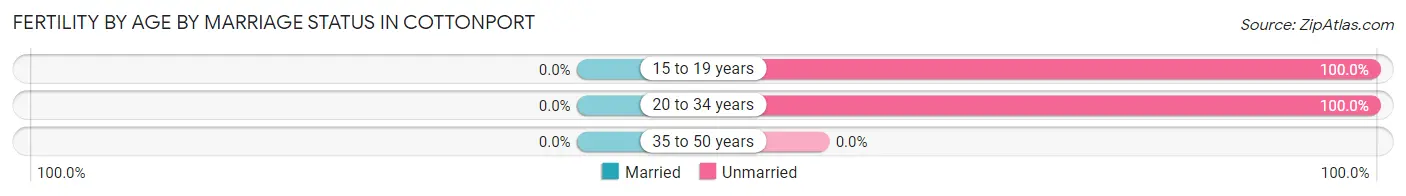
| Age Bracket | Married | Unmarried |
| 15 to 19 years | 0 (0.0%) | 8 (100.0%) |
| 20 to 34 years | 0 (0.0%) | 55 (100.0%) |
| 35 to 50 years | 0 (0.0%) | 0 (0.0%) |
| Total | 0 (0.0%) | 63 (100.0%) |
Fertility by Education in Cottonport
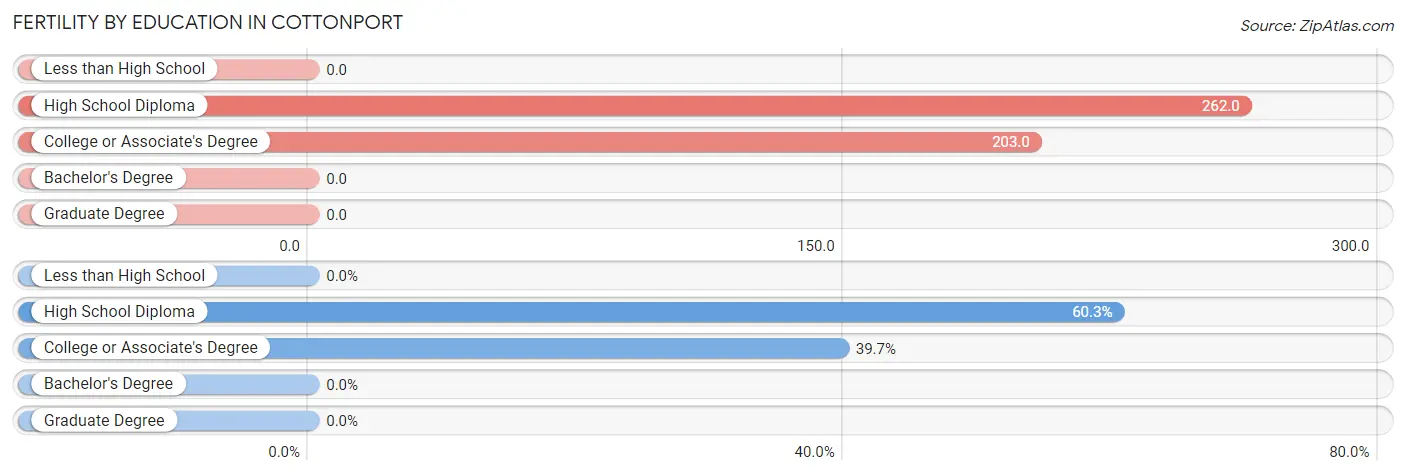
| Educational Attainment | Women with Births | Births / 1,000 Women |
| Less than High School | 0 (0.0%) | 0.0 |
| High School Diploma | 38 (60.3%) | 262.0 |
| College or Associate's Degree | 25 (39.7%) | 203.0 |
| Bachelor's Degree | 0 (0.0%) | 0.0 |
| Graduate Degree | 0 (0.0%) | 0.0 |
| Total | 63 (100.0%) | 103.0 |
Fertility by Education by Marriage Status in Cottonport
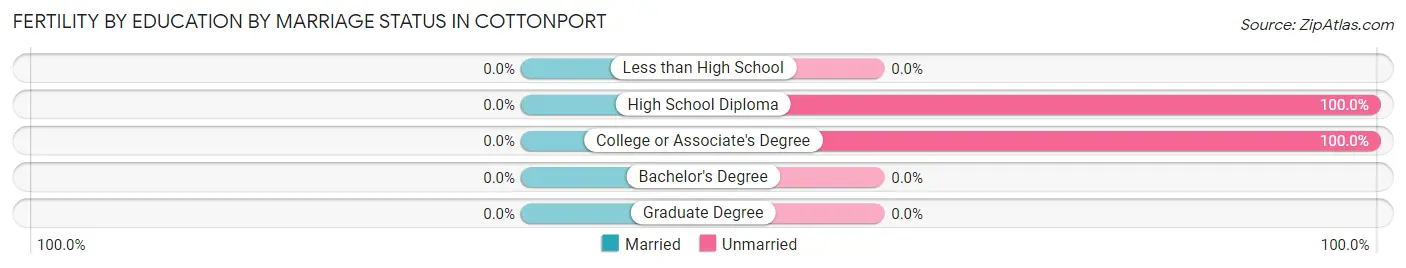
| Educational Attainment | Married | Unmarried |
| Less than High School | 0 (0.0%) | 0 (0.0%) |
| High School Diploma | 0 (0.0%) | 38 (100.0%) |
| College or Associate's Degree | 0 (0.0%) | 25 (100.0%) |
| Bachelor's Degree | 0 (0.0%) | 0 (0.0%) |
| Graduate Degree | 0 (0.0%) | 0 (0.0%) |
| Total | 0 (0.0%) | 63 (100.0%) |
Employment Characteristics in Cottonport
Employment by Class of Employer in Cottonport
Among the 624 employed individuals in Cottonport, private company employees (438 | 70.2%), state government employees (120 | 19.2%), and not-for-profit organizations (40 | 6.4%) make up the most common classes of employment.
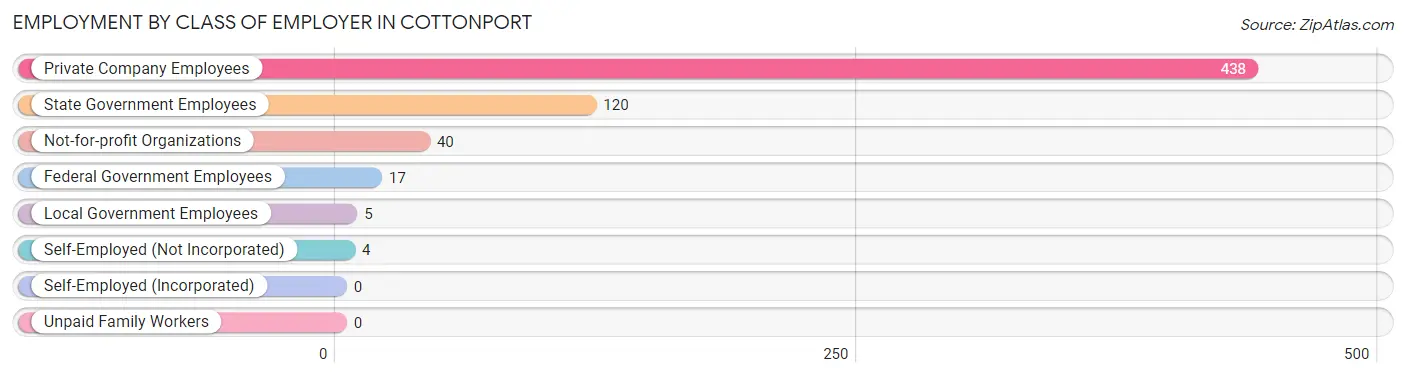
| Employer Class | # Employees | % Employees |
| Private Company Employees | 438 | 70.2% |
| Self-Employed (Incorporated) | 0 | 0.0% |
| Self-Employed (Not Incorporated) | 4 | 0.6% |
| Not-for-profit Organizations | 40 | 6.4% |
| Local Government Employees | 5 | 0.8% |
| State Government Employees | 120 | 19.2% |
| Federal Government Employees | 17 | 2.7% |
| Unpaid Family Workers | 0 | 0.0% |
| Total | 624 | 100.0% |
Employment Status by Age in Cottonport
According to the labor force statistics for Cottonport, out of the total population over 16 years of age (1,188), 55.9% or 664 individuals are in the labor force, with 3.3% or 22 of them unemployed. The age group with the highest labor force participation rate is 30 to 34 years, with 93.4% or 57 individuals in the labor force. Within the labor force, the 16 to 19 years age range has the highest percentage of unemployed individuals, with 12.9% or 12 of them being unemployed.
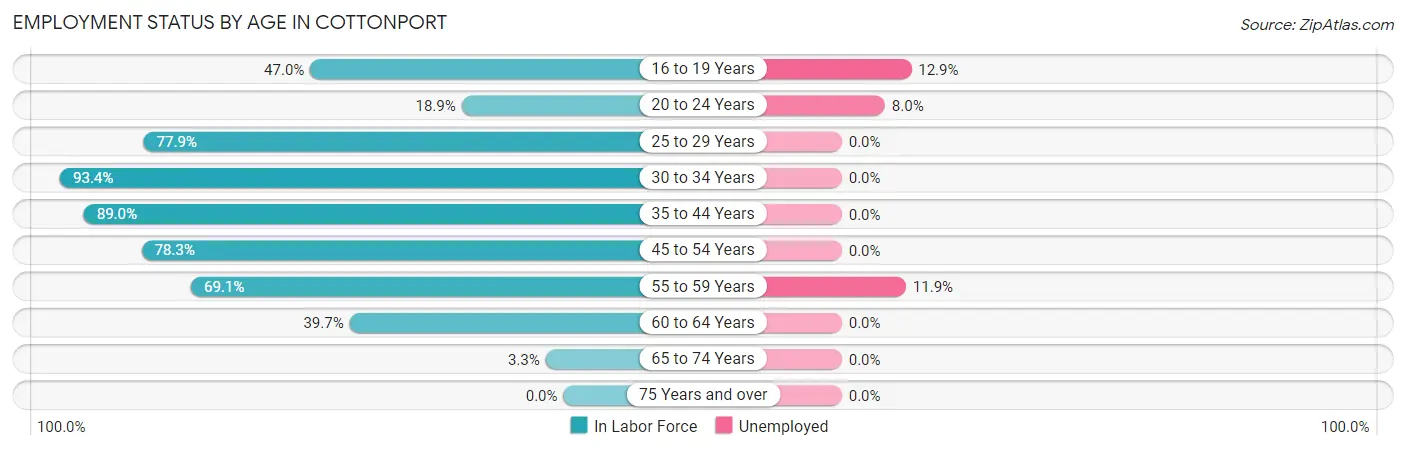
| Age Bracket | In Labor Force | Unemployed |
| 16 to 19 Years | 93 (47.0%) | 12 (12.9%) |
| 20 to 24 Years | 25 (18.9%) | 2 (8.0%) |
| 25 to 29 Years | 60 (77.9%) | 0 (0.0%) |
| 30 to 34 Years | 57 (93.4%) | 0 (0.0%) |
| 35 to 44 Years | 203 (89.0%) | 0 (0.0%) |
| 45 to 54 Years | 126 (78.3%) | 0 (0.0%) |
| 55 to 59 Years | 67 (69.1%) | 8 (11.9%) |
| 60 to 64 Years | 31 (39.7%) | 0 (0.0%) |
| 65 to 74 Years | 2 (3.3%) | 0 (0.0%) |
| 75 Years and over | 0 (0.0%) | 0 (0.0%) |
| Total | 664 (55.9%) | 22 (3.3%) |
Employment Status by Educational Attainment in Cottonport
According to labor force statistics for Cottonport, 77.5% of individuals (544) out of the total population between 25 and 64 years of age (702) are in the labor force, with 1.5% or 8 of them being unemployed. The group with the highest labor force participation rate are those with the educational attainment of bachelor's degree or higher, with 91.2% or 52 individuals in the labor force. Within the labor force, individuals with high school diploma education have the highest percentage of unemployment, with 6.0% or 8 of them being unemployed.
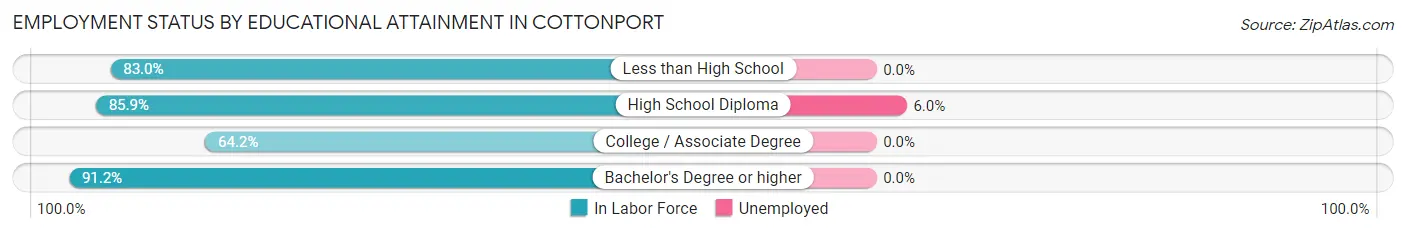
| Educational Attainment | In Labor Force | Unemployed |
| Less than High School | 195 (83.0%) | 0 (0.0%) |
| High School Diploma | 134 (85.9%) | 9 (6.0%) |
| College / Associate Degree | 163 (64.2%) | 0 (0.0%) |
| Bachelor's Degree or higher | 52 (91.2%) | 0 (0.0%) |
| Total | 544 (77.5%) | 11 (1.5%) |
Employment Occupations by Sex in Cottonport
Management, Business, Science and Arts Occupations
The most common Management, Business, Science and Arts occupations in Cottonport are Management (128 | 19.9%), Community & Social Service (59 | 9.2%), Education, Arts & Media (37 | 5.8%), Health Diagnosing & Treating (29 | 4.5%), and Education Instruction & Library (22 | 3.4%).
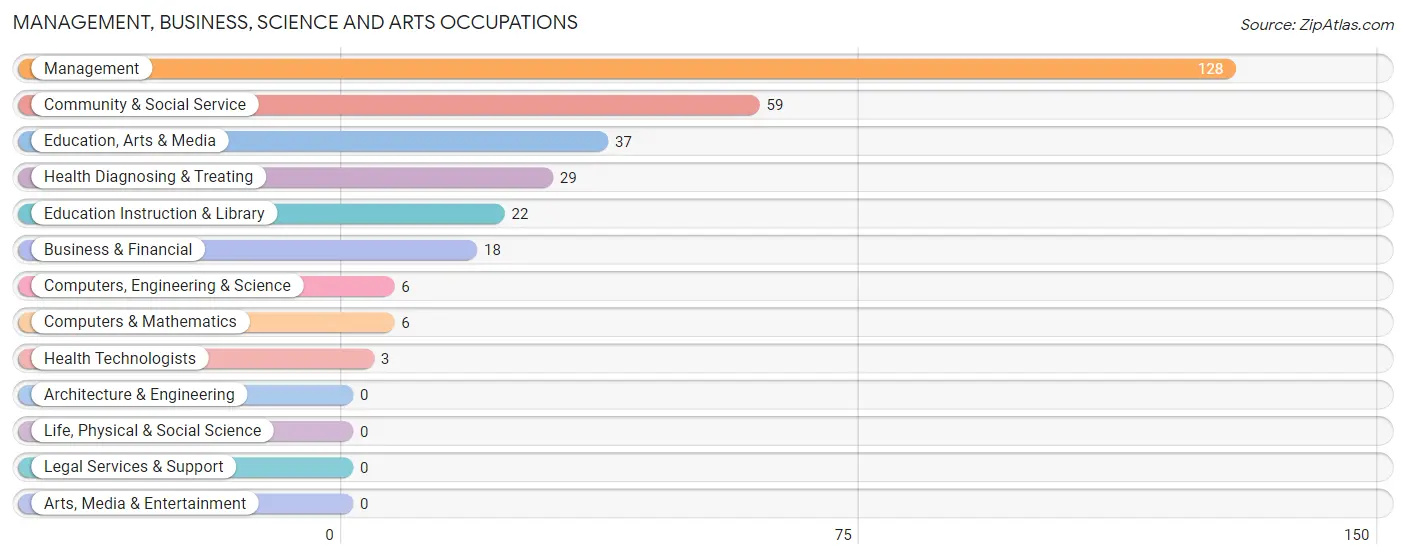
Management, Business, Science and Arts Occupations by Sex
Within the Management, Business, Science and Arts occupations in Cottonport, the most male-oriented occupations are Computers, Engineering & Science (100.0%), Computers & Mathematics (100.0%), and Health Technologists (100.0%), while the most female-oriented occupations are Management (100.0%), Community & Social Service (100.0%), and Education, Arts & Media (100.0%).
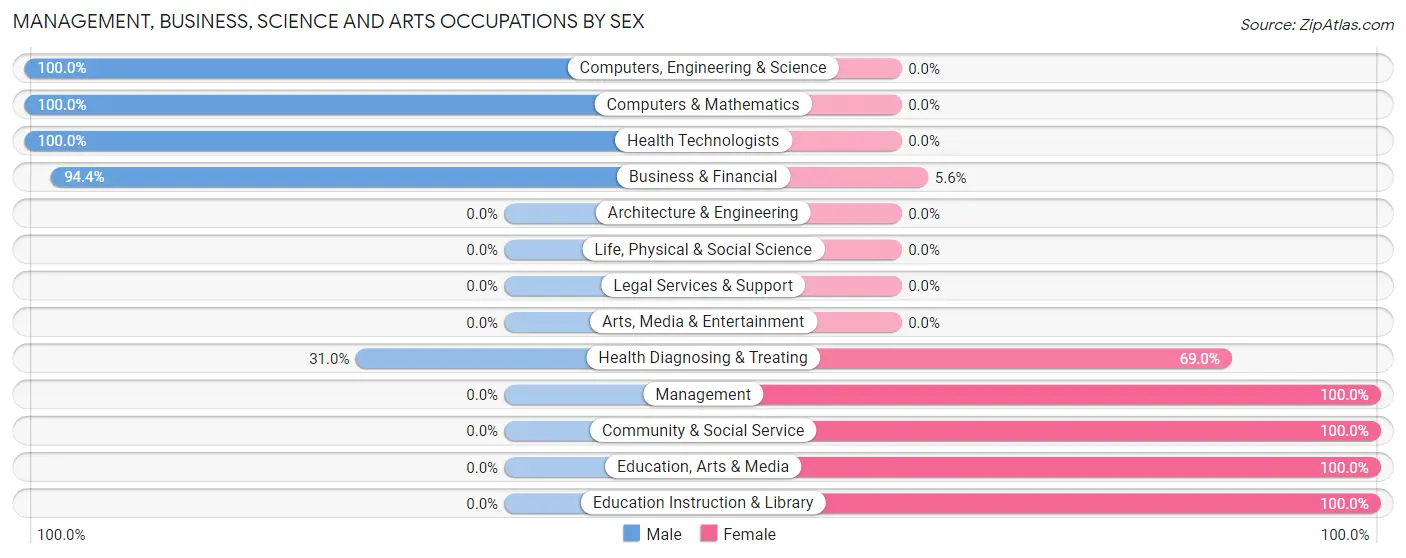
| Occupation | Male | Female |
| Management | 0 (0.0%) | 128 (100.0%) |
| Business & Financial | 17 (94.4%) | 1 (5.6%) |
| Computers, Engineering & Science | 6 (100.0%) | 0 (0.0%) |
| Computers & Mathematics | 6 (100.0%) | 0 (0.0%) |
| Architecture & Engineering | 0 (0.0%) | 0 (0.0%) |
| Life, Physical & Social Science | 0 (0.0%) | 0 (0.0%) |
| Community & Social Service | 0 (0.0%) | 59 (100.0%) |
| Education, Arts & Media | 0 (0.0%) | 37 (100.0%) |
| Legal Services & Support | 0 (0.0%) | 0 (0.0%) |
| Education Instruction & Library | 0 (0.0%) | 22 (100.0%) |
| Arts, Media & Entertainment | 0 (0.0%) | 0 (0.0%) |
| Health Diagnosing & Treating | 9 (31.0%) | 20 (69.0%) |
| Health Technologists | 3 (100.0%) | 0 (0.0%) |
| Total (Category) | 32 (13.3%) | 208 (86.7%) |
| Total (Overall) | 153 (23.8%) | 489 (76.2%) |
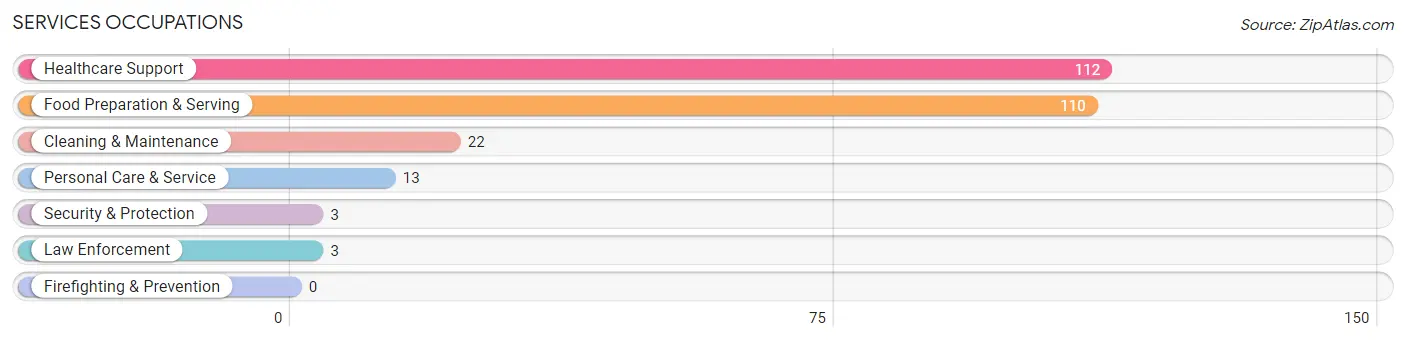
Services Occupations
The most common Services occupations in Cottonport are Healthcare Support (112 | 17.4%), Food Preparation & Serving (110 | 17.1%), Cleaning & Maintenance (22 | 3.4%), Personal Care & Service (13 | 2.0%), and Security & Protection (3 | 0.5%).
Services Occupations by Sex
Within the Services occupations in Cottonport, the most male-oriented occupations are Cleaning & Maintenance (68.2%), and Food Preparation & Serving (10.9%), while the most female-oriented occupations are Healthcare Support (100.0%), Security & Protection (100.0%), and Law Enforcement (100.0%).
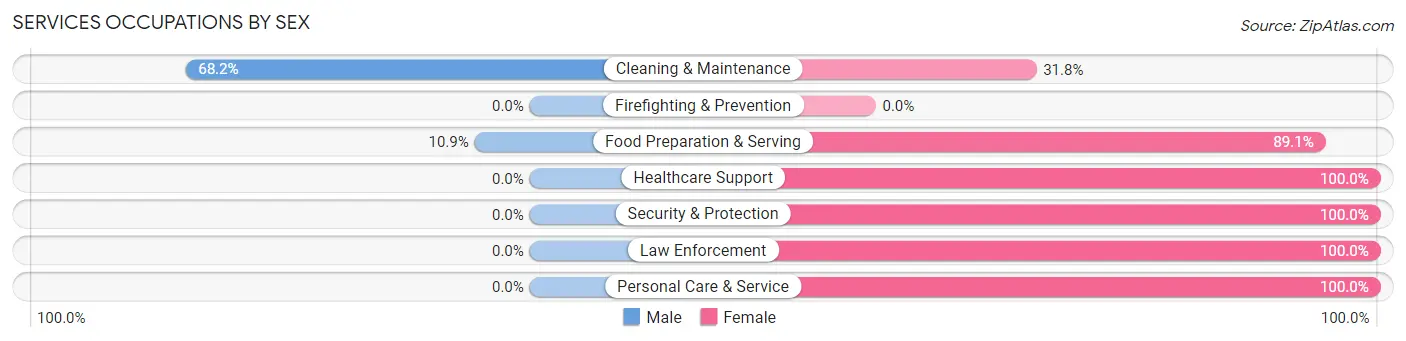
| Occupation | Male | Female |
| Healthcare Support | 0 (0.0%) | 112 (100.0%) |
| Security & Protection | 0 (0.0%) | 3 (100.0%) |
| Firefighting & Prevention | 0 (0.0%) | 0 (0.0%) |
| Law Enforcement | 0 (0.0%) | 3 (100.0%) |
| Food Preparation & Serving | 12 (10.9%) | 98 (89.1%) |
| Cleaning & Maintenance | 15 (68.2%) | 7 (31.8%) |
| Personal Care & Service | 0 (0.0%) | 13 (100.0%) |
| Total (Category) | 27 (10.4%) | 233 (89.6%) |
| Total (Overall) | 153 (23.8%) | 489 (76.2%) |
Sales and Office Occupations
The most common Sales and Office occupations in Cottonport are Office & Administration (42 | 6.5%), and Sales & Related (14 | 2.2%).
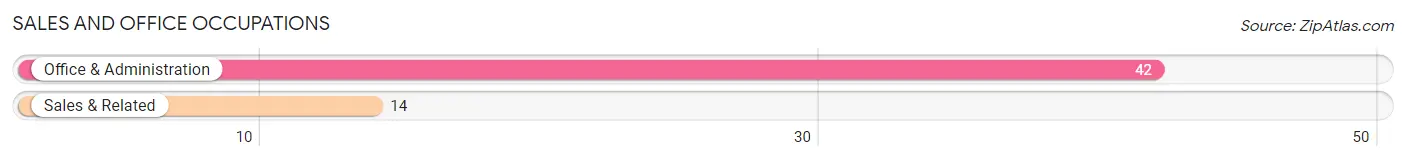
Sales and Office Occupations by Sex
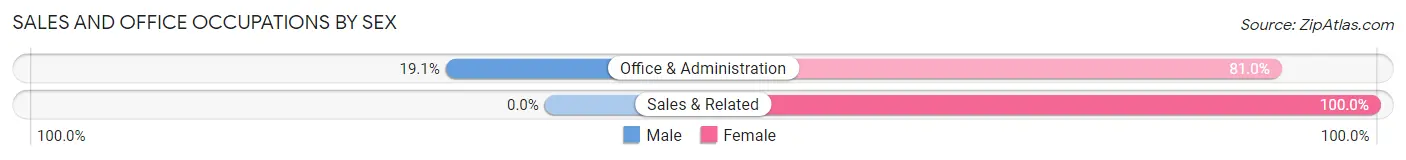
| Occupation | Male | Female |
| Sales & Related | 0 (0.0%) | 14 (100.0%) |
| Office & Administration | 8 (19.1%) | 34 (80.9%) |
| Total (Category) | 8 (14.3%) | 48 (85.7%) |
| Total (Overall) | 153 (23.8%) | 489 (76.2%) |
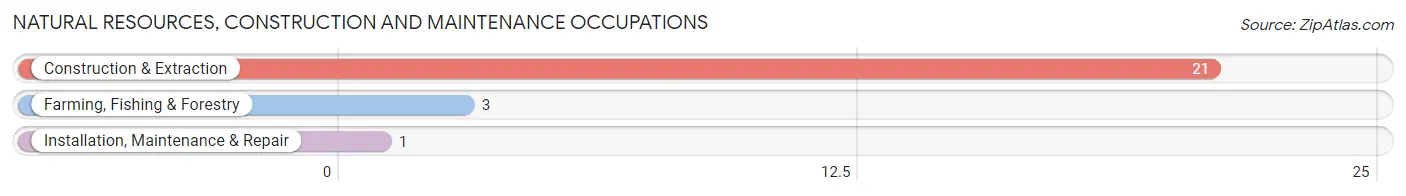
Natural Resources, Construction and Maintenance Occupations
The most common Natural Resources, Construction and Maintenance occupations in Cottonport are Construction & Extraction (21 | 3.3%), Farming, Fishing & Forestry (3 | 0.5%), and Installation, Maintenance & Repair (1 | 0.2%).
Natural Resources, Construction and Maintenance Occupations by Sex
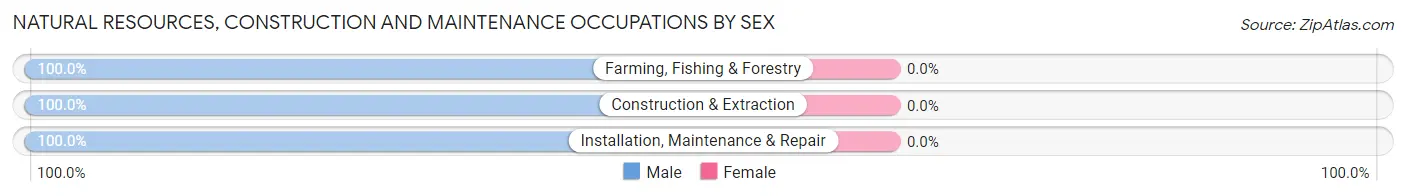
| Occupation | Male | Female |
| Farming, Fishing & Forestry | 3 (100.0%) | 0 (0.0%) |
| Construction & Extraction | 21 (100.0%) | 0 (0.0%) |
| Installation, Maintenance & Repair | 1 (100.0%) | 0 (0.0%) |
| Total (Category) | 25 (100.0%) | 0 (0.0%) |
| Total (Overall) | 153 (23.8%) | 489 (76.2%) |
Production, Transportation and Moving Occupations
The most common Production, Transportation and Moving occupations in Cottonport are Production (34 | 5.3%), Material Moving (17 | 2.6%), and Transportation (10 | 1.6%).
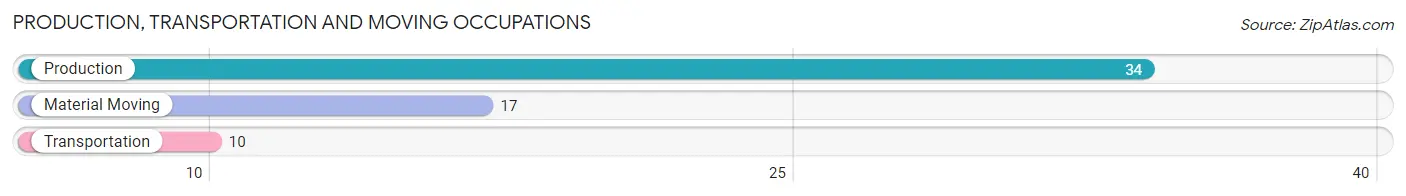
Production, Transportation and Moving Occupations by Sex
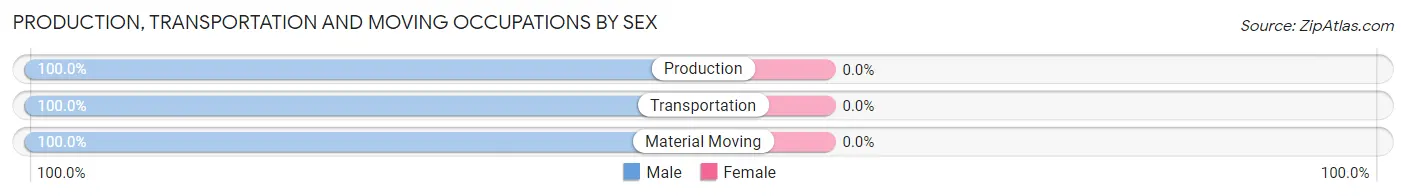
| Occupation | Male | Female |
| Production | 34 (100.0%) | 0 (0.0%) |
| Transportation | 10 (100.0%) | 0 (0.0%) |
| Material Moving | 17 (100.0%) | 0 (0.0%) |
| Total (Category) | 61 (100.0%) | 0 (0.0%) |
| Total (Overall) | 153 (23.8%) | 489 (76.2%) |
Employment Industries by Sex in Cottonport
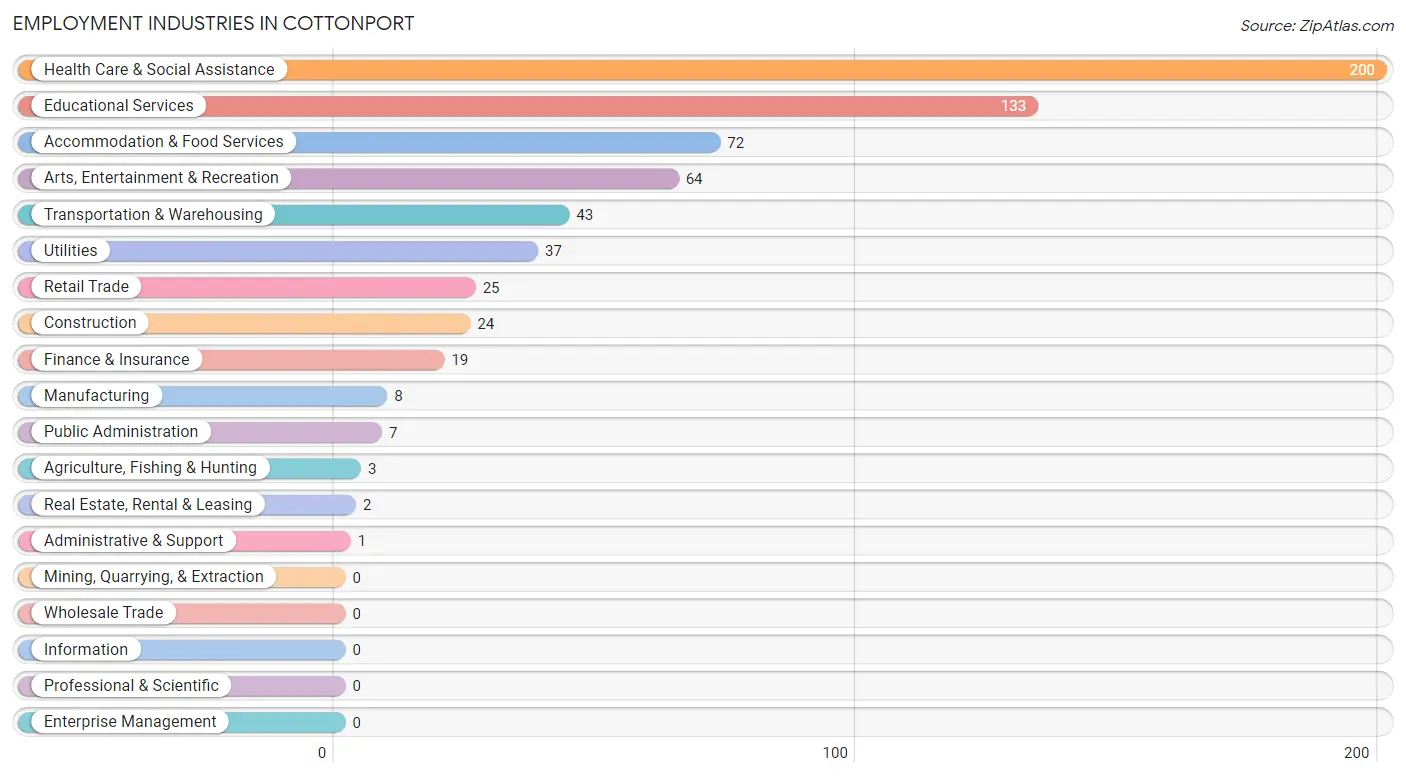
Employment Industries in Cottonport
The major employment industries in Cottonport include Health Care & Social Assistance (200 | 31.1%), Educational Services (133 | 20.7%), Accommodation & Food Services (72 | 11.2%), Arts, Entertainment & Recreation (64 | 10.0%), and Transportation & Warehousing (43 | 6.7%).
Employment Industries by Sex in Cottonport
The Cottonport industries that see more men than women are Agriculture, Fishing & Hunting (100.0%), Administrative & Support (100.0%), and Utilities (97.3%), whereas the industries that tend to have a higher number of women are Real Estate, Rental & Leasing (100.0%), Educational Services (100.0%), and Accommodation & Food Services (100.0%).
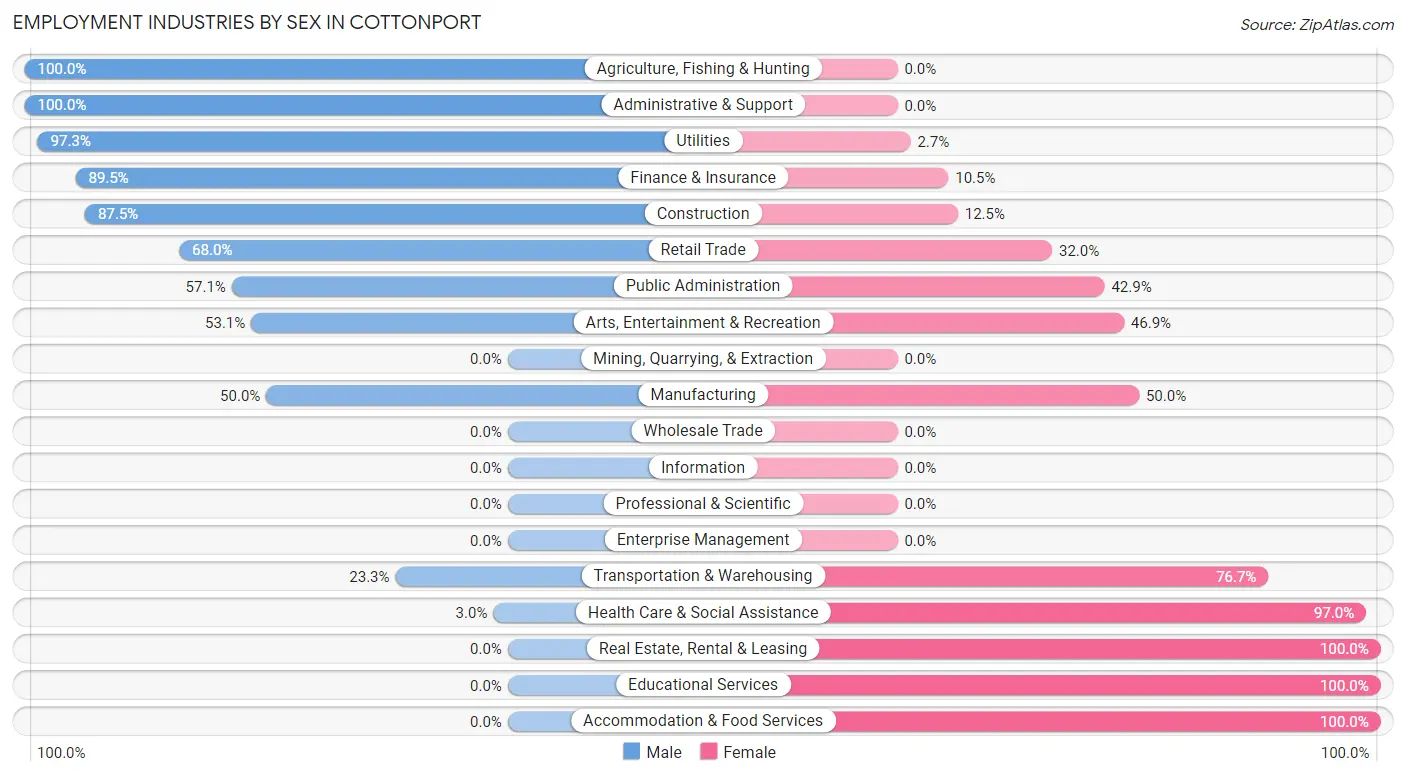
| Industry | Male | Female |
| Agriculture, Fishing & Hunting | 3 (100.0%) | 0 (0.0%) |
| Mining, Quarrying, & Extraction | 0 (0.0%) | 0 (0.0%) |
| Construction | 21 (87.5%) | 3 (12.5%) |
| Manufacturing | 4 (50.0%) | 4 (50.0%) |
| Wholesale Trade | 0 (0.0%) | 0 (0.0%) |
| Retail Trade | 17 (68.0%) | 8 (32.0%) |
| Transportation & Warehousing | 10 (23.3%) | 33 (76.7%) |
| Utilities | 36 (97.3%) | 1 (2.7%) |
| Information | 0 (0.0%) | 0 (0.0%) |
| Finance & Insurance | 17 (89.5%) | 2 (10.5%) |
| Real Estate, Rental & Leasing | 0 (0.0%) | 2 (100.0%) |
| Professional & Scientific | 0 (0.0%) | 0 (0.0%) |
| Enterprise Management | 0 (0.0%) | 0 (0.0%) |
| Administrative & Support | 1 (100.0%) | 0 (0.0%) |
| Educational Services | 0 (0.0%) | 133 (100.0%) |
| Health Care & Social Assistance | 6 (3.0%) | 194 (97.0%) |
| Arts, Entertainment & Recreation | 34 (53.1%) | 30 (46.9%) |
| Accommodation & Food Services | 0 (0.0%) | 72 (100.0%) |
| Public Administration | 4 (57.1%) | 3 (42.9%) |
| Total | 153 (23.8%) | 489 (76.2%) |
Education in Cottonport
School Enrollment in Cottonport
The most common levels of schooling among the 558 students in Cottonport are high school (303 | 54.3%), middle school (130 | 23.3%), and elementary school (84 | 15.0%).
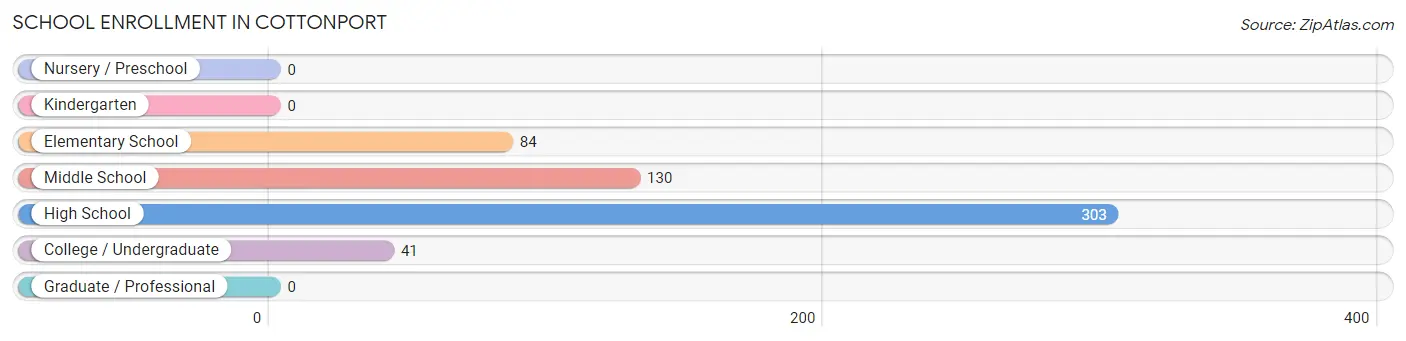
| School Level | # Students | % Students |
| Nursery / Preschool | 0 | 0.0% |
| Kindergarten | 0 | 0.0% |
| Elementary School | 84 | 15.0% |
| Middle School | 130 | 23.3% |
| High School | 303 | 54.3% |
| College / Undergraduate | 41 | 7.3% |
| Graduate / Professional | 0 | 0.0% |
| Total | 558 | 100.0% |
School Enrollment by Age by Funding Source in Cottonport
Out of a total of 558 students who are enrolled in schools in Cottonport, 14 (2.5%) attend a private institution, while the remaining 544 (97.5%) are enrolled in public schools. The age group of 10 to 14 year olds has the highest likelihood of being enrolled in private schools, with 14 (10.0% in the age bracket) enrolled. Conversely, the age group of 5 to 9 year old has the lowest likelihood of being enrolled in a private school, with 84 (100.0% in the age bracket) attending a public institution.
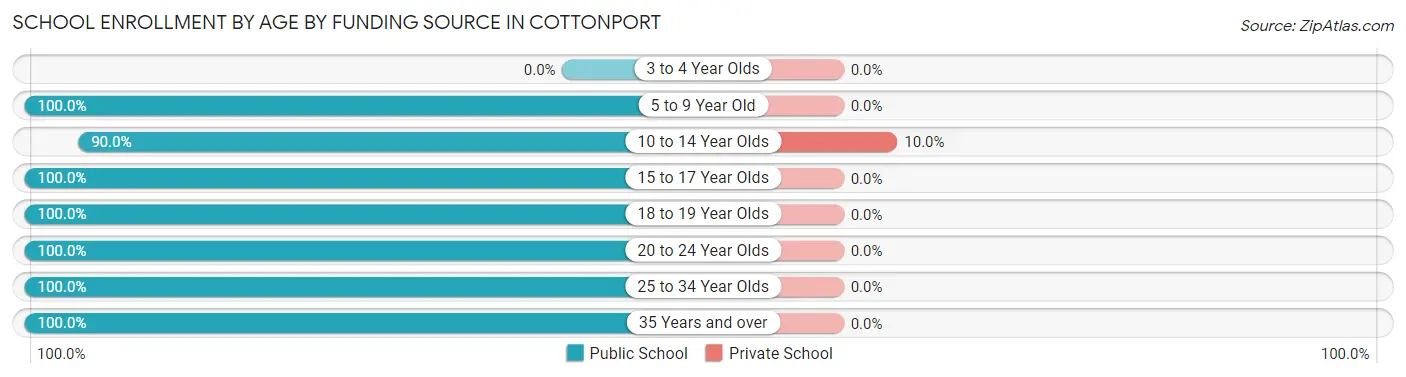
| Age Bracket | Public School | Private School |
| 3 to 4 Year Olds | 0 (0.0%) | 0 (0.0%) |
| 5 to 9 Year Old | 84 (100.0%) | 0 (0.0%) |
| 10 to 14 Year Olds | 126 (90.0%) | 14 (10.0%) |
| 15 to 17 Year Olds | 127 (100.0%) | 0 (0.0%) |
| 18 to 19 Year Olds | 80 (100.0%) | 0 (0.0%) |
| 20 to 24 Year Olds | 8 (100.0%) | 0 (0.0%) |
| 25 to 34 Year Olds | 18 (100.0%) | 0 (0.0%) |
| 35 Years and over | 101 (100.0%) | 0 (0.0%) |
| Total | 544 (97.5%) | 14 (2.5%) |
Educational Attainment by Field of Study in Cottonport
Visual & performing arts (19 | 23.5%), bio, nature & agricultural (17 | 21.0%), education (17 | 21.0%), psychology (8 | 9.9%), and literature & languages (7 | 8.6%) are the most common fields of study among 81 individuals in Cottonport who have obtained a bachelor's degree or higher.
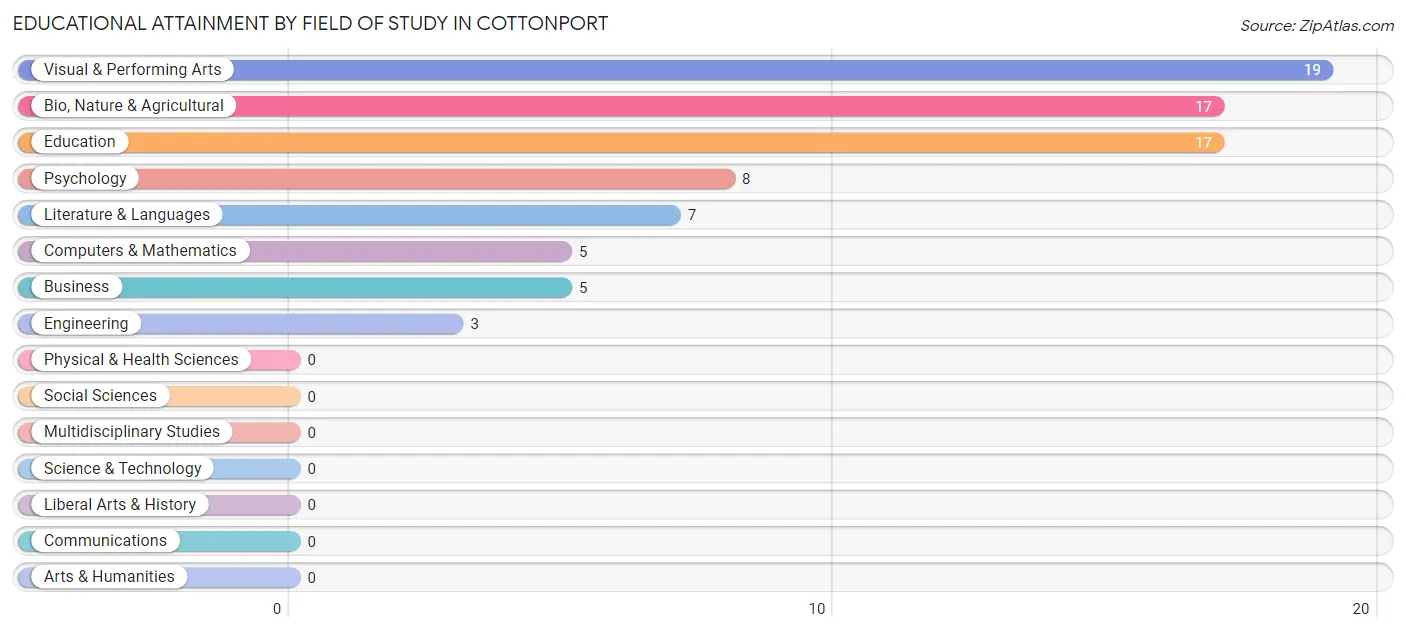
| Field of Study | # Graduates | % Graduates |
| Computers & Mathematics | 5 | 6.2% |
| Bio, Nature & Agricultural | 17 | 21.0% |
| Physical & Health Sciences | 0 | 0.0% |
| Psychology | 8 | 9.9% |
| Social Sciences | 0 | 0.0% |
| Engineering | 3 | 3.7% |
| Multidisciplinary Studies | 0 | 0.0% |
| Science & Technology | 0 | 0.0% |
| Business | 5 | 6.2% |
| Education | 17 | 21.0% |
| Literature & Languages | 7 | 8.6% |
| Liberal Arts & History | 0 | 0.0% |
| Visual & Performing Arts | 19 | 23.5% |
| Communications | 0 | 0.0% |
| Arts & Humanities | 0 | 0.0% |
| Total | 81 | 100.0% |
Transportation & Commute in Cottonport
Vehicle Availability by Sex in Cottonport
The most prevalent vehicle ownership categories in Cottonport are males with 2 vehicles (55, accounting for 36.9%) and females with 2 vehicles (104, making up 11.7%).
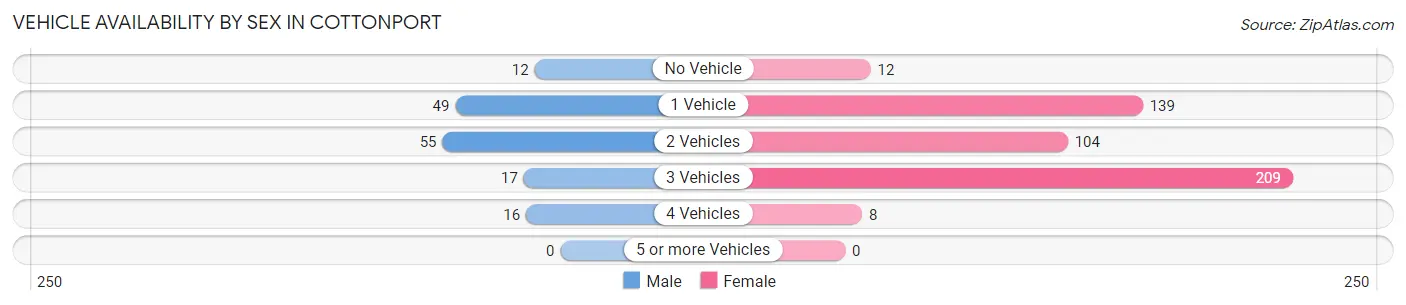
| Vehicles Available | Male | Female |
| No Vehicle | 12 (8.1%) | 12 (2.5%) |
| 1 Vehicle | 49 (32.9%) | 139 (29.4%) |
| 2 Vehicles | 55 (36.9%) | 104 (22.0%) |
| 3 Vehicles | 17 (11.4%) | 209 (44.3%) |
| 4 Vehicles | 16 (10.7%) | 8 (1.7%) |
| 5 or more Vehicles | 0 (0.0%) | 0 (0.0%) |
| Total | 149 (100.0%) | 472 (100.0%) |
Commute Time in Cottonport
The most frequently occuring commute durations in Cottonport are 5 to 9 minutes (253 commuters, 41.2%), 15 to 19 minutes (102 commuters, 16.6%), and 45 to 59 minutes (65 commuters, 10.6%).
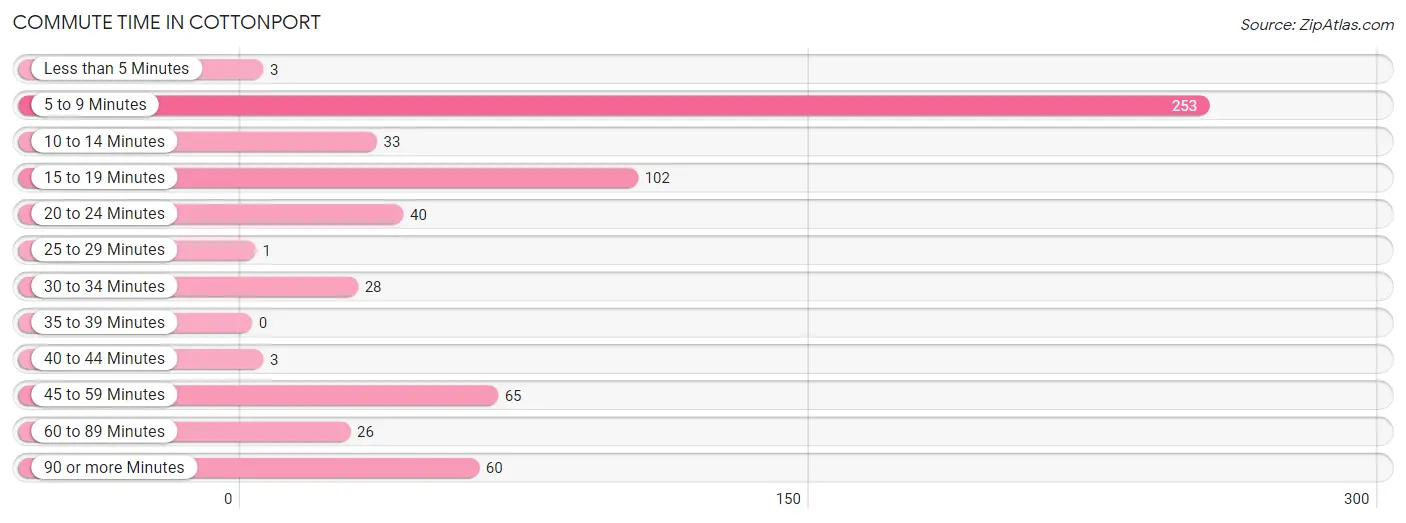
| Commute Time | # Commuters | % Commuters |
| Less than 5 Minutes | 3 | 0.5% |
| 5 to 9 Minutes | 253 | 41.2% |
| 10 to 14 Minutes | 33 | 5.4% |
| 15 to 19 Minutes | 102 | 16.6% |
| 20 to 24 Minutes | 40 | 6.5% |
| 25 to 29 Minutes | 1 | 0.2% |
| 30 to 34 Minutes | 28 | 4.6% |
| 35 to 39 Minutes | 0 | 0.0% |
| 40 to 44 Minutes | 3 | 0.5% |
| 45 to 59 Minutes | 65 | 10.6% |
| 60 to 89 Minutes | 26 | 4.2% |
| 90 or more Minutes | 60 | 9.8% |
Commute Time by Sex in Cottonport
The most common commute times in Cottonport are 90 or more minutes (55 commuters, 36.9%) for males and 5 to 9 minutes (236 commuters, 50.7%) for females.
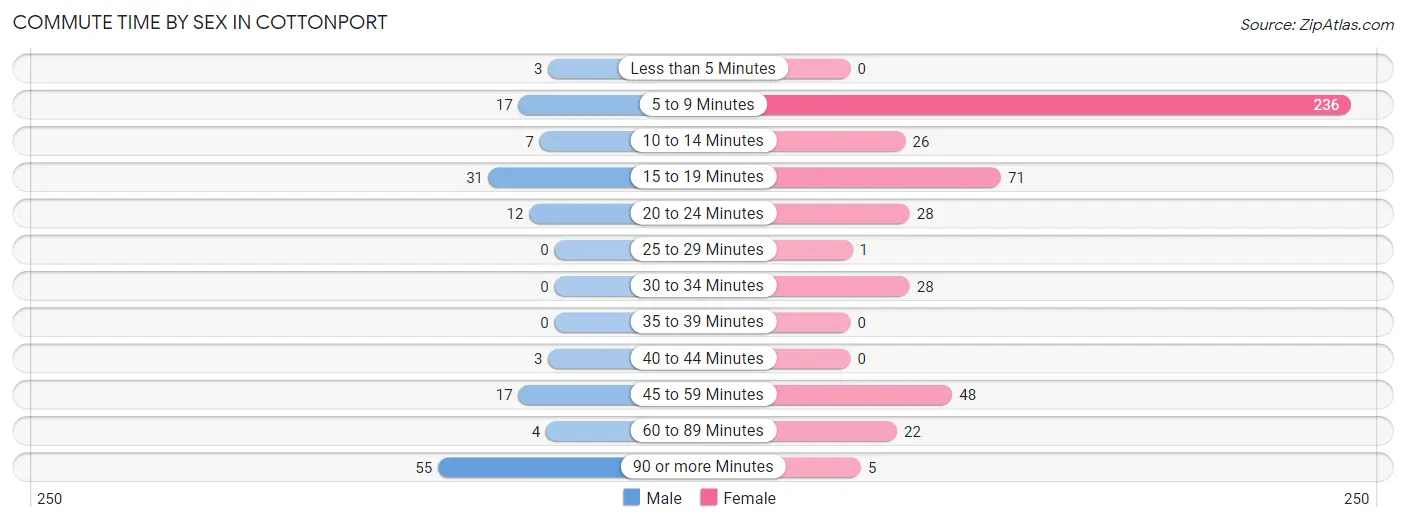
| Commute Time | Male | Female |
| Less than 5 Minutes | 3 (2.0%) | 0 (0.0%) |
| 5 to 9 Minutes | 17 (11.4%) | 236 (50.7%) |
| 10 to 14 Minutes | 7 (4.7%) | 26 (5.6%) |
| 15 to 19 Minutes | 31 (20.8%) | 71 (15.3%) |
| 20 to 24 Minutes | 12 (8.1%) | 28 (6.0%) |
| 25 to 29 Minutes | 0 (0.0%) | 1 (0.2%) |
| 30 to 34 Minutes | 0 (0.0%) | 28 (6.0%) |
| 35 to 39 Minutes | 0 (0.0%) | 0 (0.0%) |
| 40 to 44 Minutes | 3 (2.0%) | 0 (0.0%) |
| 45 to 59 Minutes | 17 (11.4%) | 48 (10.3%) |
| 60 to 89 Minutes | 4 (2.7%) | 22 (4.7%) |
| 90 or more Minutes | 55 (36.9%) | 5 (1.1%) |
Time of Departure to Work by Sex in Cottonport
The most frequent times of departure to work in Cottonport are 12:00 AM to 4:59 AM (41, 27.5%) for males and 5:00 AM to 5:29 AM (120, 25.8%) for females.
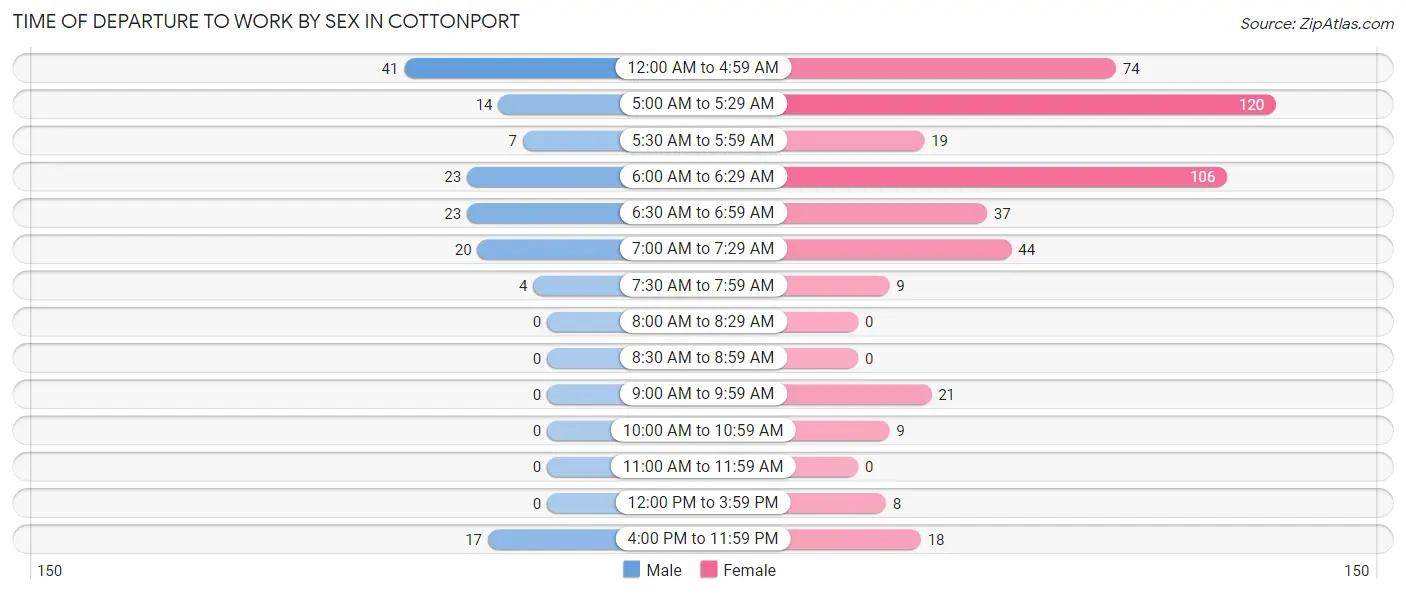
| Time of Departure | Male | Female |
| 12:00 AM to 4:59 AM | 41 (27.5%) | 74 (15.9%) |
| 5:00 AM to 5:29 AM | 14 (9.4%) | 120 (25.8%) |
| 5:30 AM to 5:59 AM | 7 (4.7%) | 19 (4.1%) |
| 6:00 AM to 6:29 AM | 23 (15.4%) | 106 (22.8%) |
| 6:30 AM to 6:59 AM | 23 (15.4%) | 37 (8.0%) |
| 7:00 AM to 7:29 AM | 20 (13.4%) | 44 (9.5%) |
| 7:30 AM to 7:59 AM | 4 (2.7%) | 9 (1.9%) |
| 8:00 AM to 8:29 AM | 0 (0.0%) | 0 (0.0%) |
| 8:30 AM to 8:59 AM | 0 (0.0%) | 0 (0.0%) |
| 9:00 AM to 9:59 AM | 0 (0.0%) | 21 (4.5%) |
| 10:00 AM to 10:59 AM | 0 (0.0%) | 9 (1.9%) |
| 11:00 AM to 11:59 AM | 0 (0.0%) | 0 (0.0%) |
| 12:00 PM to 3:59 PM | 0 (0.0%) | 8 (1.7%) |
| 4:00 PM to 11:59 PM | 17 (11.4%) | 18 (3.9%) |
| Total | 149 (100.0%) | 465 (100.0%) |
Housing Occupancy in Cottonport
Occupancy by Ownership in Cottonport
Of the total 610 dwellings in Cottonport, owner-occupied units account for 401 (65.7%), while renter-occupied units make up 209 (34.3%).
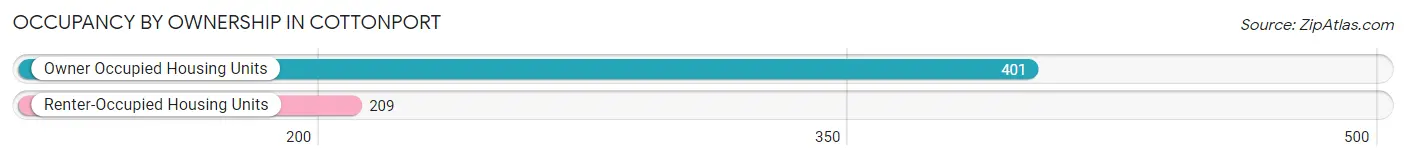
| Occupancy | # Housing Units | % Housing Units |
| Owner Occupied Housing Units | 401 | 65.7% |
| Renter-Occupied Housing Units | 209 | 34.3% |
| Total Occupied Housing Units | 610 | 100.0% |
Occupancy by Household Size in Cottonport
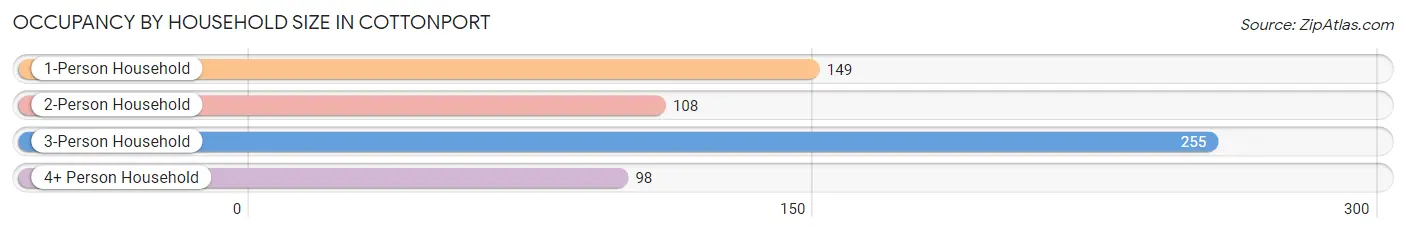
| Household Size | # Housing Units | % Housing Units |
| 1-Person Household | 149 | 24.4% |
| 2-Person Household | 108 | 17.7% |
| 3-Person Household | 255 | 41.8% |
| 4+ Person Household | 98 | 16.1% |
| Total Housing Units | 610 | 100.0% |
Occupancy by Ownership by Household Size in Cottonport
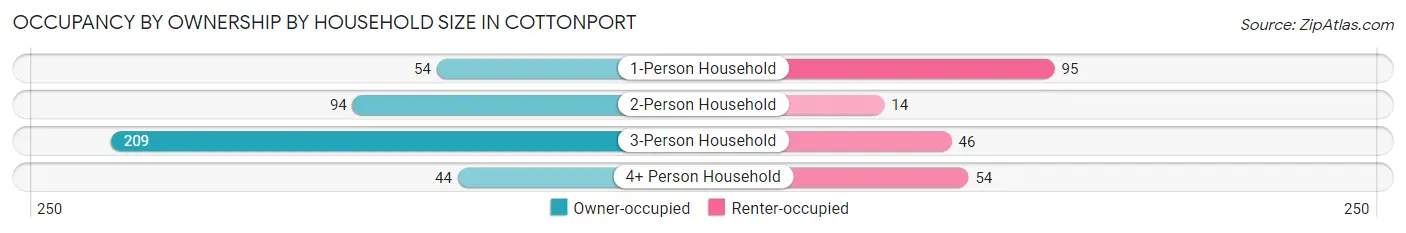
| Household Size | Owner-occupied | Renter-occupied |
| 1-Person Household | 54 (36.2%) | 95 (63.8%) |
| 2-Person Household | 94 (87.0%) | 14 (13.0%) |
| 3-Person Household | 209 (82.0%) | 46 (18.0%) |
| 4+ Person Household | 44 (44.9%) | 54 (55.1%) |
| Total Housing Units | 401 (65.7%) | 209 (34.3%) |
Occupancy by Educational Attainment in Cottonport
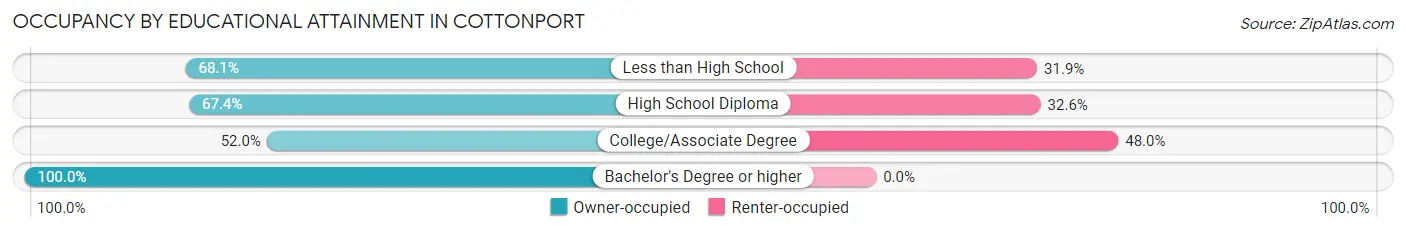
| Household Size | Owner-occupied | Renter-occupied |
| Less than High School | 145 (68.1%) | 68 (31.9%) |
| High School Diploma | 93 (67.4%) | 45 (32.6%) |
| College/Associate Degree | 104 (52.0%) | 96 (48.0%) |
| Bachelor's Degree or higher | 59 (100.0%) | 0 (0.0%) |
Occupancy by Age of Householder in Cottonport
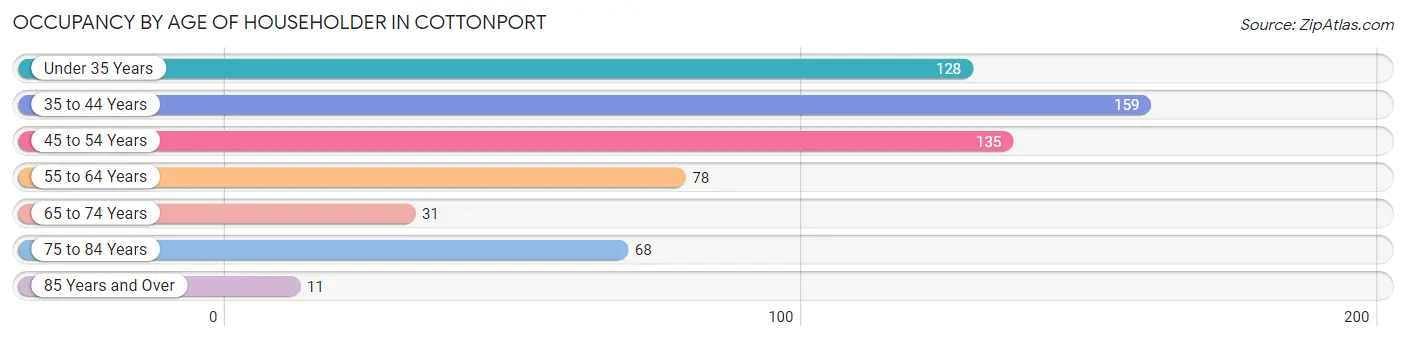
| Age Bracket | # Households | % Households |
| Under 35 Years | 128 | 21.0% |
| 35 to 44 Years | 159 | 26.1% |
| 45 to 54 Years | 135 | 22.1% |
| 55 to 64 Years | 78 | 12.8% |
| 65 to 74 Years | 31 | 5.1% |
| 75 to 84 Years | 68 | 11.2% |
| 85 Years and Over | 11 | 1.8% |
| Total | 610 | 100.0% |
Housing Finances in Cottonport
Median Income by Occupancy in Cottonport
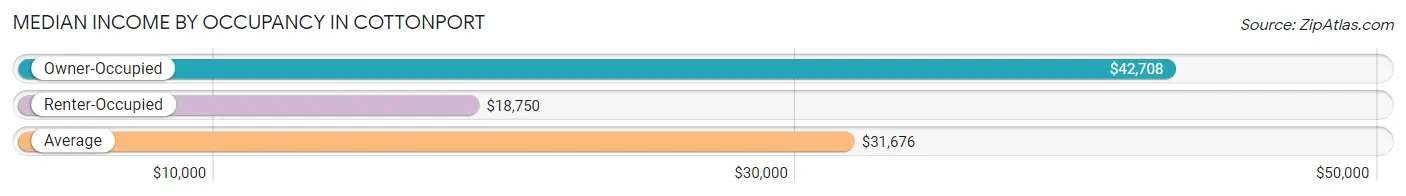
| Occupancy Type | # Households | Median Income |
| Owner-Occupied | 401 (65.7%) | $42,708 |
| Renter-Occupied | 209 (34.3%) | $18,750 |
| Average | 610 (100.0%) | $31,676 |
Occupancy by Householder Income Bracket in Cottonport
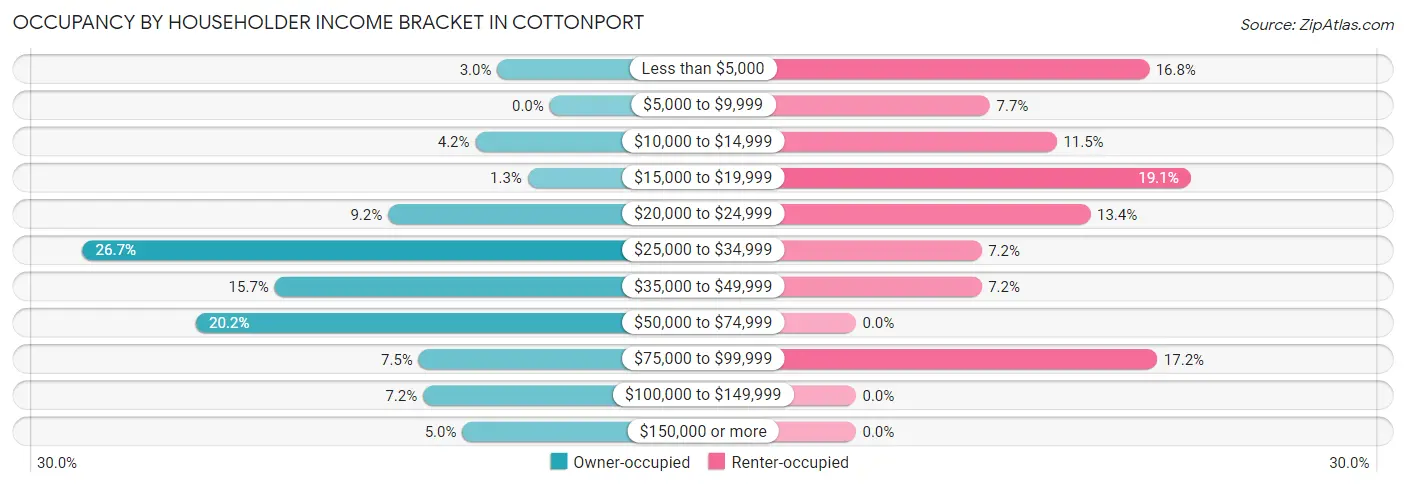
| Income Bracket | Owner-occupied | Renter-occupied |
| Less than $5,000 | 12 (3.0%) | 35 (16.8%) |
| $5,000 to $9,999 | 0 (0.0%) | 16 (7.7%) |
| $10,000 to $14,999 | 17 (4.2%) | 24 (11.5%) |
| $15,000 to $19,999 | 5 (1.3%) | 40 (19.1%) |
| $20,000 to $24,999 | 37 (9.2%) | 28 (13.4%) |
| $25,000 to $34,999 | 107 (26.7%) | 15 (7.2%) |
| $35,000 to $49,999 | 63 (15.7%) | 15 (7.2%) |
| $50,000 to $74,999 | 81 (20.2%) | 0 (0.0%) |
| $75,000 to $99,999 | 30 (7.5%) | 36 (17.2%) |
| $100,000 to $149,999 | 29 (7.2%) | 0 (0.0%) |
| $150,000 or more | 20 (5.0%) | 0 (0.0%) |
| Total | 401 (100.0%) | 209 (100.0%) |
Monthly Housing Cost Tiers in Cottonport
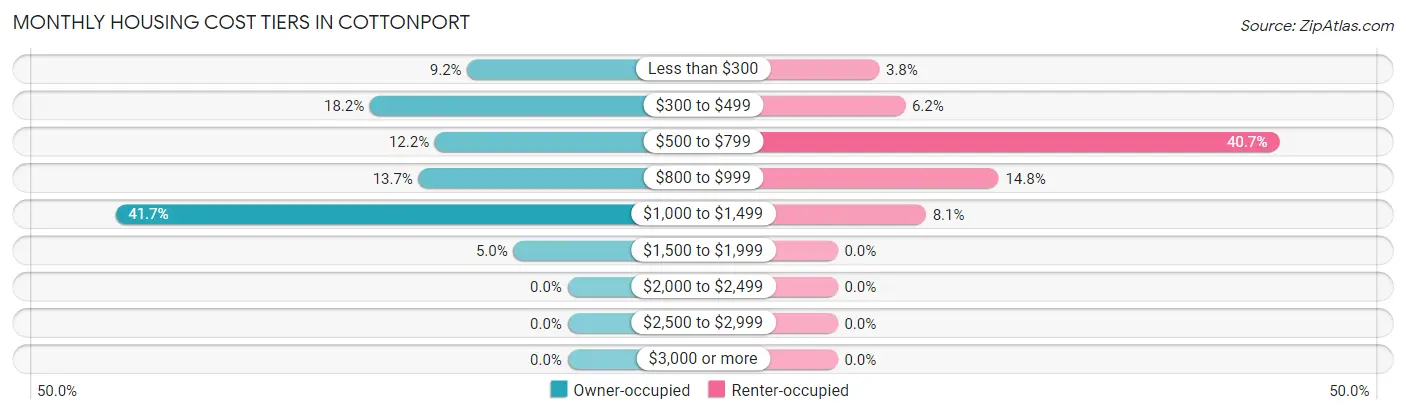
| Monthly Cost | Owner-occupied | Renter-occupied |
| Less than $300 | 37 (9.2%) | 8 (3.8%) |
| $300 to $499 | 73 (18.2%) | 13 (6.2%) |
| $500 to $799 | 49 (12.2%) | 85 (40.7%) |
| $800 to $999 | 55 (13.7%) | 31 (14.8%) |
| $1,000 to $1,499 | 167 (41.6%) | 17 (8.1%) |
| $1,500 to $1,999 | 20 (5.0%) | 0 (0.0%) |
| $2,000 to $2,499 | 0 (0.0%) | 0 (0.0%) |
| $2,500 to $2,999 | 0 (0.0%) | 0 (0.0%) |
| $3,000 or more | 0 (0.0%) | 0 (0.0%) |
| Total | 401 (100.0%) | 209 (100.0%) |
Physical Housing Characteristics in Cottonport
Housing Structures in Cottonport
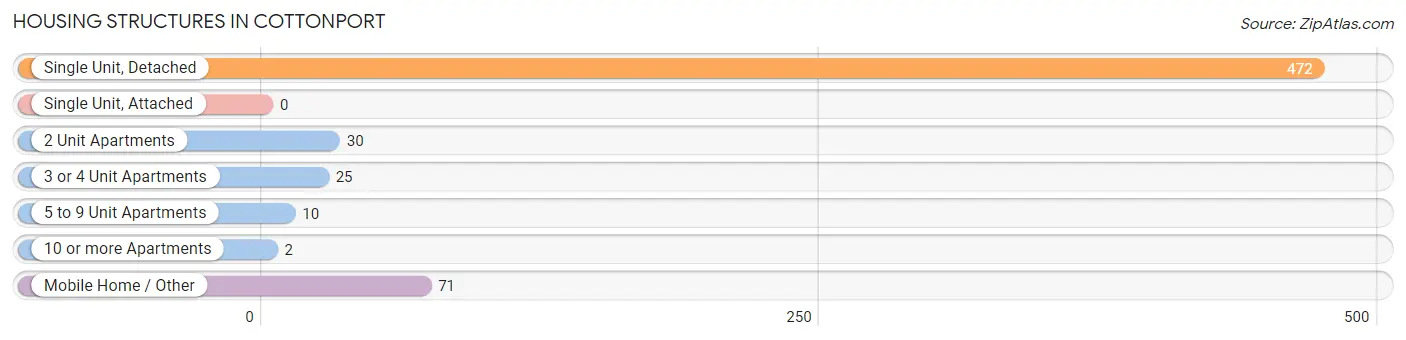
| Structure Type | # Housing Units | % Housing Units |
| Single Unit, Detached | 472 | 77.4% |
| Single Unit, Attached | 0 | 0.0% |
| 2 Unit Apartments | 30 | 4.9% |
| 3 or 4 Unit Apartments | 25 | 4.1% |
| 5 to 9 Unit Apartments | 10 | 1.6% |
| 10 or more Apartments | 2 | 0.3% |
| Mobile Home / Other | 71 | 11.6% |
| Total | 610 | 100.0% |
Housing Structures by Occupancy in Cottonport
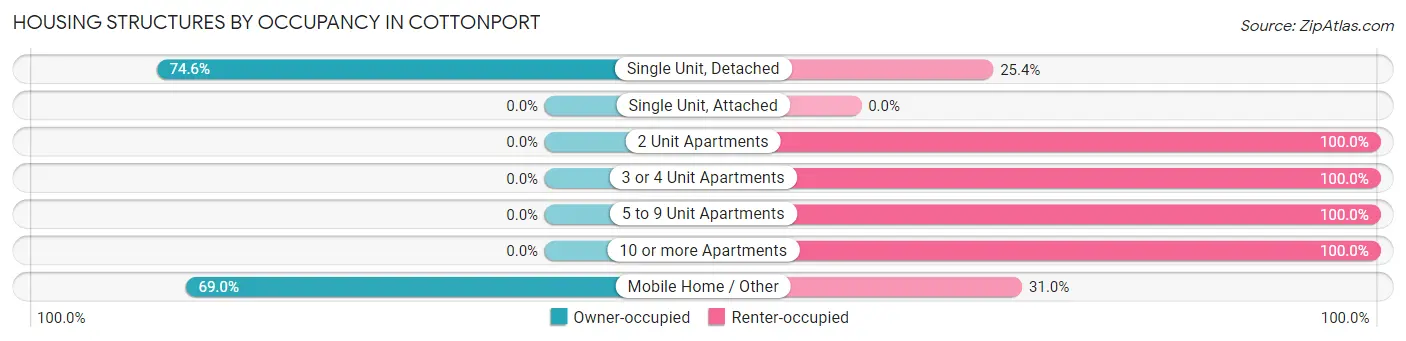
| Structure Type | Owner-occupied | Renter-occupied |
| Single Unit, Detached | 352 (74.6%) | 120 (25.4%) |
| Single Unit, Attached | 0 (0.0%) | 0 (0.0%) |
| 2 Unit Apartments | 0 (0.0%) | 30 (100.0%) |
| 3 or 4 Unit Apartments | 0 (0.0%) | 25 (100.0%) |
| 5 to 9 Unit Apartments | 0 (0.0%) | 10 (100.0%) |
| 10 or more Apartments | 0 (0.0%) | 2 (100.0%) |
| Mobile Home / Other | 49 (69.0%) | 22 (31.0%) |
| Total | 401 (65.7%) | 209 (34.3%) |
Housing Structures by Number of Rooms in Cottonport
| Number of Rooms | Owner-occupied | Renter-occupied |
| 1 Room | 0 (0.0%) | 0 (0.0%) |
| 2 or 3 Rooms | 4 (1.0%) | 42 (20.1%) |
| 4 or 5 Rooms | 280 (69.8%) | 115 (55.0%) |
| 6 or 7 Rooms | 76 (19.0%) | 33 (15.8%) |
| 8 or more Rooms | 41 (10.2%) | 19 (9.1%) |
| Total | 401 (100.0%) | 209 (100.0%) |
Housing Structure by Heating Type in Cottonport
| Heating Type | Owner-occupied | Renter-occupied |
| Utility Gas | 277 (69.1%) | 117 (56.0%) |
| Bottled, Tank, or LP Gas | 6 (1.5%) | 0 (0.0%) |
| Electricity | 115 (28.7%) | 92 (44.0%) |
| Fuel Oil or Kerosene | 0 (0.0%) | 0 (0.0%) |
| Coal or Coke | 0 (0.0%) | 0 (0.0%) |
| All other Fuels | 3 (0.7%) | 0 (0.0%) |
| No Fuel Used | 0 (0.0%) | 0 (0.0%) |
| Total | 401 (100.0%) | 209 (100.0%) |
Household Vehicle Usage in Cottonport
| Vehicles per Household | Owner-occupied | Renter-occupied |
| No Vehicle | 12 (3.0%) | 34 (16.3%) |
| 1 Vehicle | 138 (34.4%) | 101 (48.3%) |
| 2 Vehicles | 110 (27.4%) | 60 (28.7%) |
| 3 or more Vehicles | 141 (35.2%) | 14 (6.7%) |
| Total | 401 (100.0%) | 209 (100.0%) |
Real Estate & Mortgages in Cottonport
Real Estate and Mortgage Overview in Cottonport
| Characteristic | Without Mortgage | With Mortgage |
| Housing Units | 128 | 273 |
| Median Property Value | $77,800 | $85,100 |
| Median Household Income | $26,250 | $20 |
| Monthly Housing Costs | $376 | $0 |
| Real Estate Taxes | $199 | $23 |
Property Value by Mortgage Status in Cottonport
| Property Value | Without Mortgage | With Mortgage |
| Less than $50,000 | 10 (7.8%) | 13 (4.8%) |
| $50,000 to $99,999 | 73 (57.0%) | 145 (53.1%) |
| $100,000 to $299,999 | 23 (18.0%) | 115 (42.1%) |
| $300,000 to $499,999 | 22 (17.2%) | 0 (0.0%) |
| $500,000 to $749,999 | 0 (0.0%) | 0 (0.0%) |
| $750,000 to $999,999 | 0 (0.0%) | 0 (0.0%) |
| $1,000,000 or more | 0 (0.0%) | 0 (0.0%) |
| Total | 128 (100.0%) | 273 (100.0%) |
Household Income by Mortgage Status in Cottonport
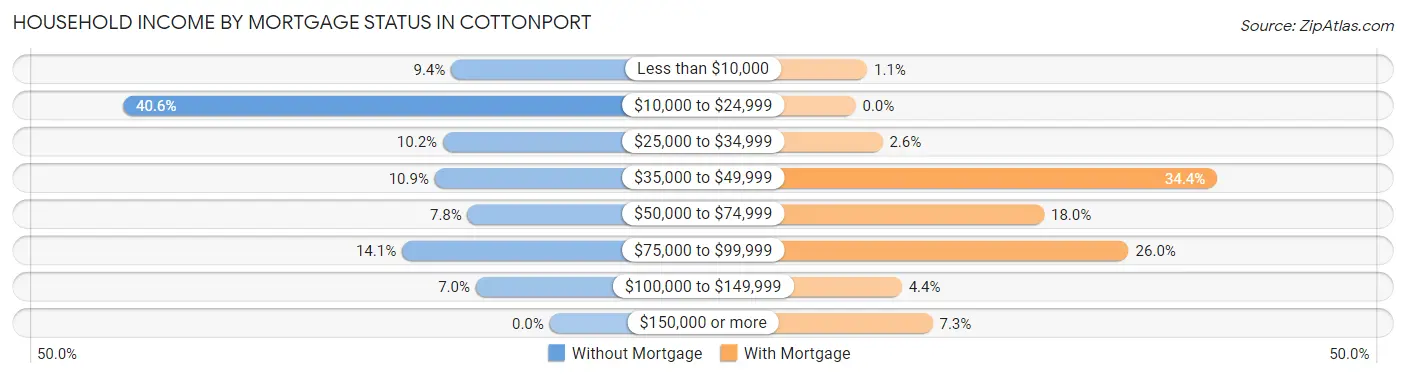
| Household Income | Without Mortgage | With Mortgage |
| Less than $10,000 | 12 (9.4%) | 3 (1.1%) |
| $10,000 to $24,999 | 52 (40.6%) | 0 (0.0%) |
| $25,000 to $34,999 | 13 (10.2%) | 7 (2.6%) |
| $35,000 to $49,999 | 14 (10.9%) | 94 (34.4%) |
| $50,000 to $74,999 | 10 (7.8%) | 49 (17.9%) |
| $75,000 to $99,999 | 18 (14.1%) | 71 (26.0%) |
| $100,000 to $149,999 | 9 (7.0%) | 12 (4.4%) |
| $150,000 or more | 0 (0.0%) | 20 (7.3%) |
| Total | 128 (100.0%) | 273 (100.0%) |
Property Value to Household Income Ratio in Cottonport
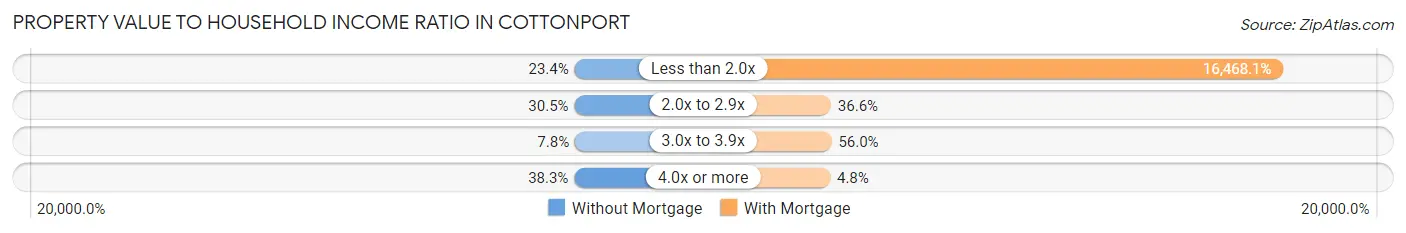
| Value-to-Income Ratio | Without Mortgage | With Mortgage |
| Less than 2.0x | 30 (23.4%) | 44,958 (16,468.1%) |
| 2.0x to 2.9x | 39 (30.5%) | 100 (36.6%) |
| 3.0x to 3.9x | 10 (7.8%) | 153 (56.0%) |
| 4.0x or more | 49 (38.3%) | 13 (4.8%) |
| Total | 128 (100.0%) | 273 (100.0%) |
Real Estate Taxes by Mortgage Status in Cottonport
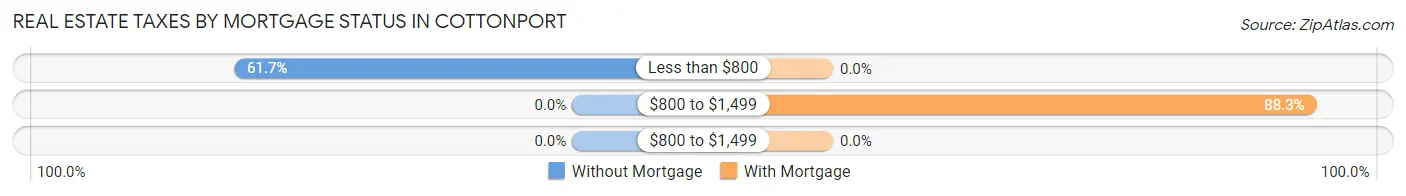
| Property Taxes | Without Mortgage | With Mortgage |
| Less than $800 | 79 (61.7%) | 0 (0.0%) |
| $800 to $1,499 | 0 (0.0%) | 241 (88.3%) |
| $800 to $1,499 | 0 (0.0%) | 0 (0.0%) |
| Total | 128 (100.0%) | 273 (100.0%) |
Health & Disability in Cottonport
Health Insurance Coverage by Age in Cottonport
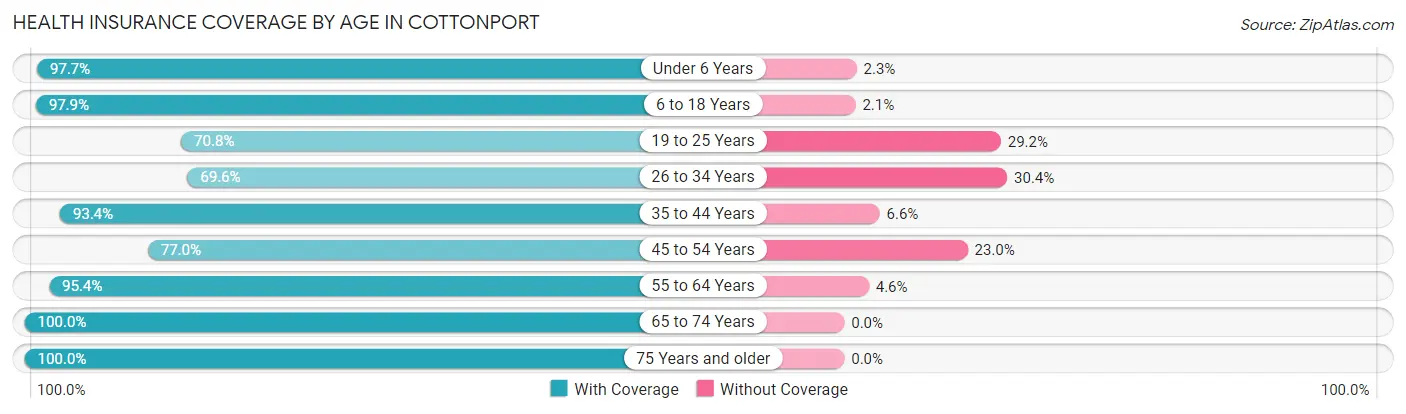
| Age Bracket | With Coverage | Without Coverage |
| Under 6 Years | 256 (97.7%) | 6 (2.3%) |
| 6 to 18 Years | 469 (97.9%) | 10 (2.1%) |
| 19 to 25 Years | 114 (70.8%) | 47 (29.2%) |
| 26 to 34 Years | 78 (69.6%) | 34 (30.4%) |
| 35 to 44 Years | 213 (93.4%) | 15 (6.6%) |
| 45 to 54 Years | 124 (77.0%) | 37 (23.0%) |
| 55 to 64 Years | 167 (95.4%) | 8 (4.6%) |
| 65 to 74 Years | 60 (100.0%) | 0 (0.0%) |
| 75 Years and older | 96 (100.0%) | 0 (0.0%) |
| Total | 1,577 (90.9%) | 157 (9.0%) |
Health Insurance Coverage by Citizenship Status in Cottonport
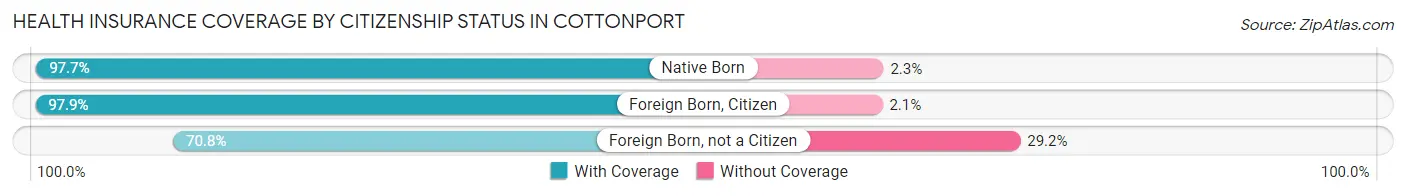
| Citizenship Status | With Coverage | Without Coverage |
| Native Born | 256 (97.7%) | 6 (2.3%) |
| Foreign Born, Citizen | 469 (97.9%) | 10 (2.1%) |
| Foreign Born, not a Citizen | 114 (70.8%) | 47 (29.2%) |
Health Insurance Coverage by Household Income in Cottonport
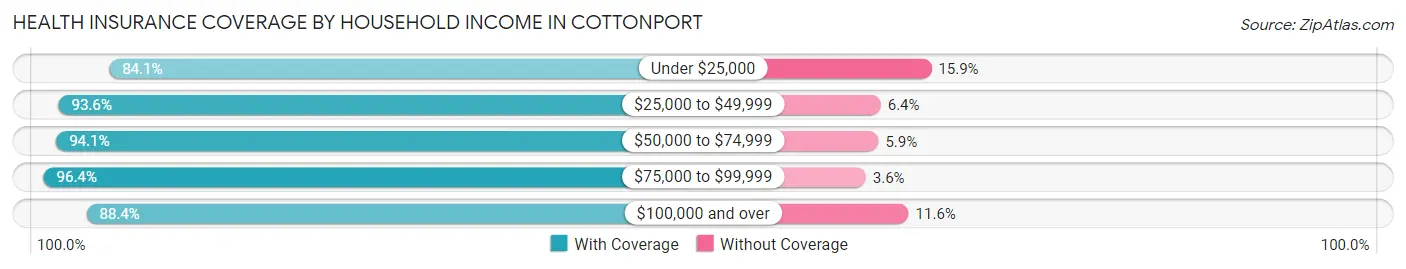
| Household Income | With Coverage | Without Coverage |
| Under $25,000 | 382 (84.1%) | 72 (15.9%) |
| $25,000 to $49,999 | 617 (93.6%) | 42 (6.4%) |
| $50,000 to $74,999 | 238 (94.1%) | 15 (5.9%) |
| $75,000 to $99,999 | 216 (96.4%) | 8 (3.6%) |
| $100,000 and over | 122 (88.4%) | 16 (11.6%) |
Public vs Private Health Insurance Coverage by Age in Cottonport
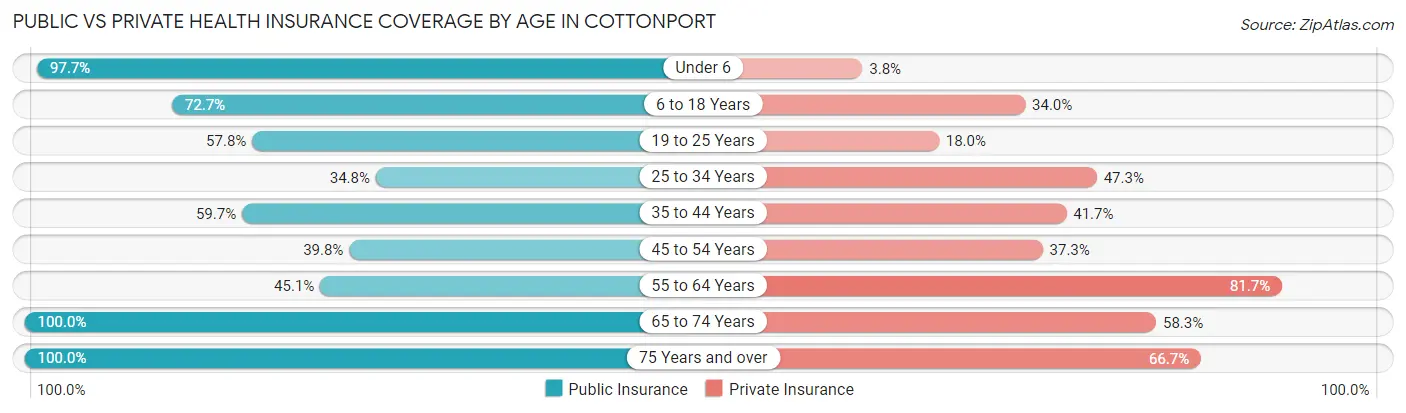
| Age Bracket | Public Insurance | Private Insurance |
| Under 6 | 256 (97.7%) | 10 (3.8%) |
| 6 to 18 Years | 348 (72.7%) | 163 (34.0%) |
| 19 to 25 Years | 93 (57.8%) | 29 (18.0%) |
| 25 to 34 Years | 39 (34.8%) | 53 (47.3%) |
| 35 to 44 Years | 136 (59.7%) | 95 (41.7%) |
| 45 to 54 Years | 64 (39.8%) | 60 (37.3%) |
| 55 to 64 Years | 79 (45.1%) | 143 (81.7%) |
| 65 to 74 Years | 60 (100.0%) | 35 (58.3%) |
| 75 Years and over | 96 (100.0%) | 64 (66.7%) |
| Total | 1,171 (67.5%) | 652 (37.6%) |
Disability Status by Sex by Age in Cottonport
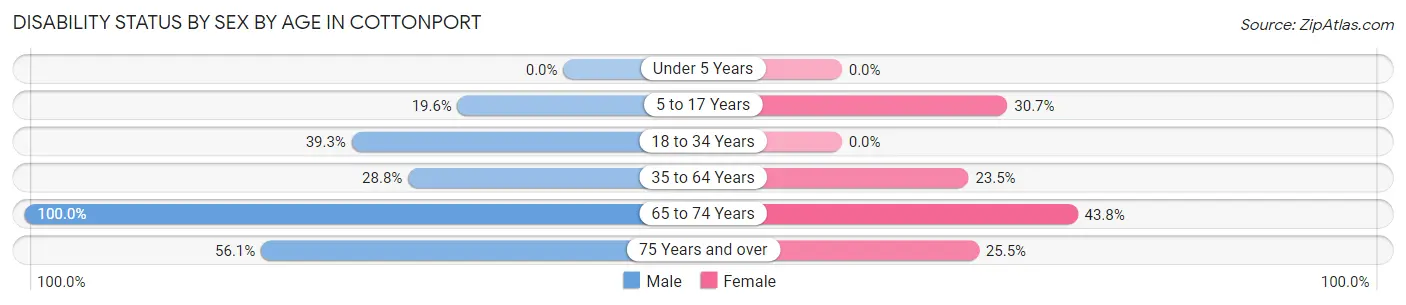
| Age Bracket | Male | Female |
| Under 5 Years | 0 (0.0%) | 0 (0.0%) |
| 5 to 17 Years | 40 (19.6%) | 59 (30.7%) |
| 18 to 34 Years | 22 (39.3%) | 0 (0.0%) |
| 35 to 64 Years | 51 (28.8%) | 91 (23.5%) |
| 65 to 74 Years | 12 (100.0%) | 21 (43.8%) |
| 75 Years and over | 23 (56.1%) | 14 (25.5%) |
Disability Class by Sex by Age in Cottonport
Disability Class: Hearing Difficulty
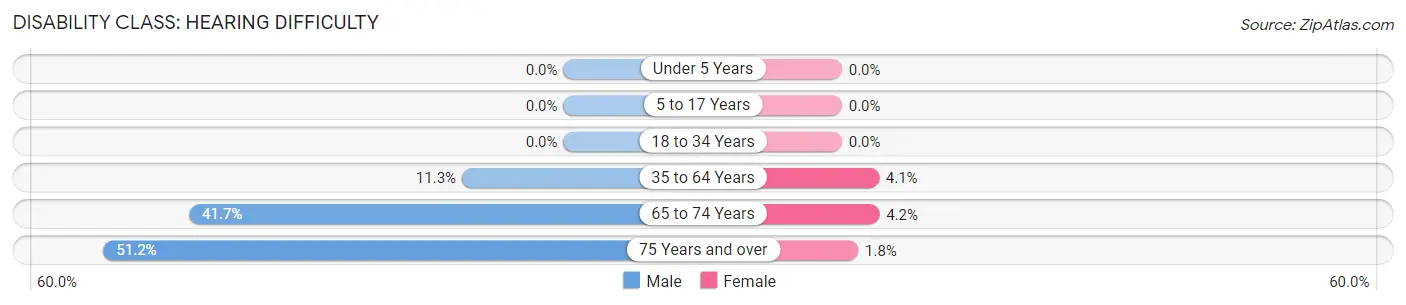
| Age Bracket | Male | Female |
| Under 5 Years | 0 (0.0%) | 0 (0.0%) |
| 5 to 17 Years | 0 (0.0%) | 0 (0.0%) |
| 18 to 34 Years | 0 (0.0%) | 0 (0.0%) |
| 35 to 64 Years | 20 (11.3%) | 16 (4.1%) |
| 65 to 74 Years | 5 (41.7%) | 2 (4.2%) |
| 75 Years and over | 21 (51.2%) | 1 (1.8%) |
Disability Class: Vision Difficulty
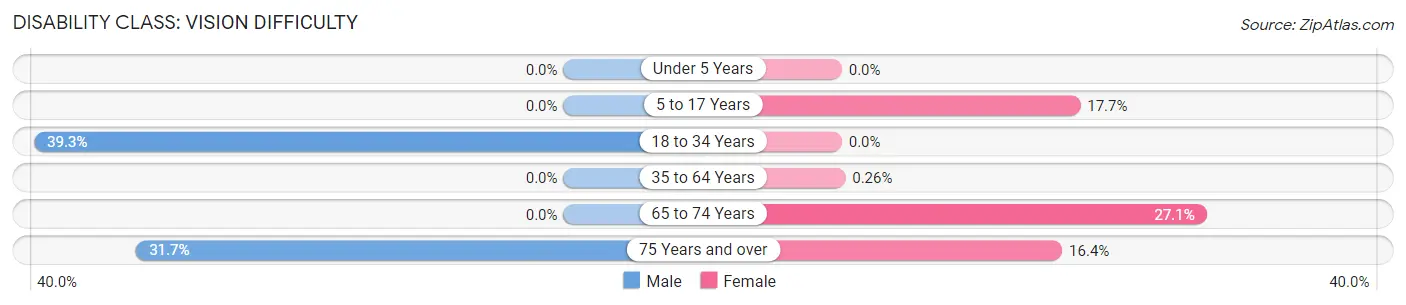
| Age Bracket | Male | Female |
| Under 5 Years | 0 (0.0%) | 0 (0.0%) |
| 5 to 17 Years | 0 (0.0%) | 34 (17.7%) |
| 18 to 34 Years | 22 (39.3%) | 0 (0.0%) |
| 35 to 64 Years | 0 (0.0%) | 1 (0.3%) |
| 65 to 74 Years | 0 (0.0%) | 13 (27.1%) |
| 75 Years and over | 13 (31.7%) | 9 (16.4%) |
Disability Class: Cognitive Difficulty
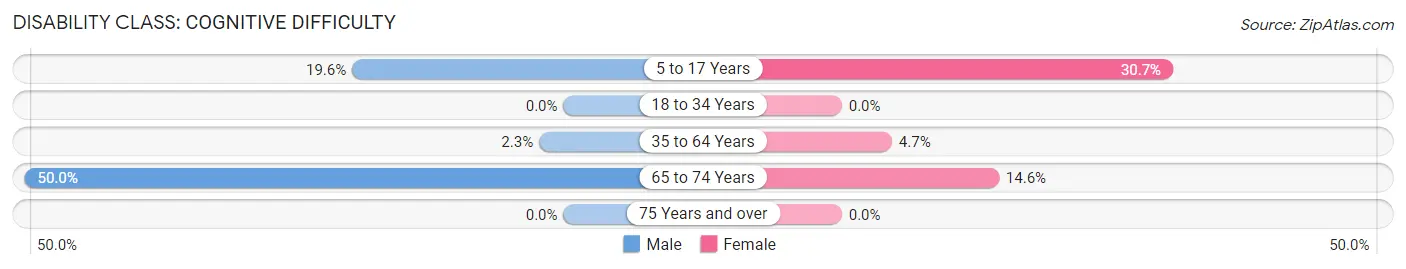
| Age Bracket | Male | Female |
| 5 to 17 Years | 40 (19.6%) | 59 (30.7%) |
| 18 to 34 Years | 0 (0.0%) | 0 (0.0%) |
| 35 to 64 Years | 4 (2.3%) | 18 (4.6%) |
| 65 to 74 Years | 6 (50.0%) | 7 (14.6%) |
| 75 Years and over | 0 (0.0%) | 0 (0.0%) |
Disability Class: Ambulatory Difficulty
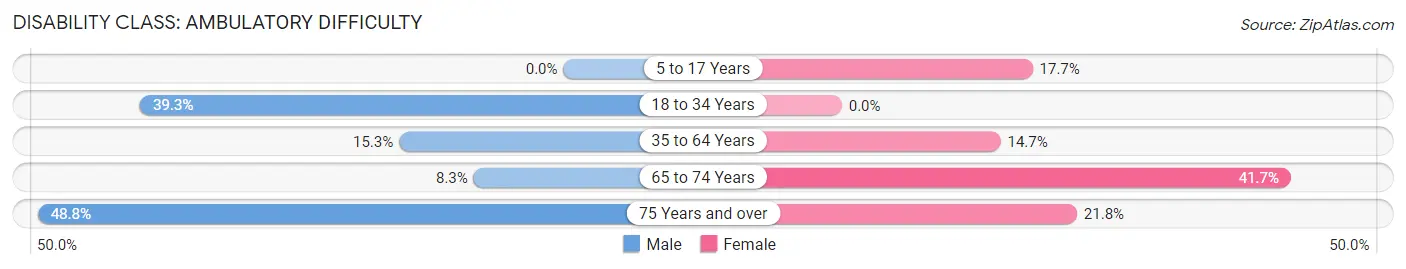
| Age Bracket | Male | Female |
| 5 to 17 Years | 0 (0.0%) | 34 (17.7%) |
| 18 to 34 Years | 22 (39.3%) | 0 (0.0%) |
| 35 to 64 Years | 27 (15.2%) | 57 (14.7%) |
| 65 to 74 Years | 1 (8.3%) | 20 (41.7%) |
| 75 Years and over | 20 (48.8%) | 12 (21.8%) |
Disability Class: Self-Care Difficulty
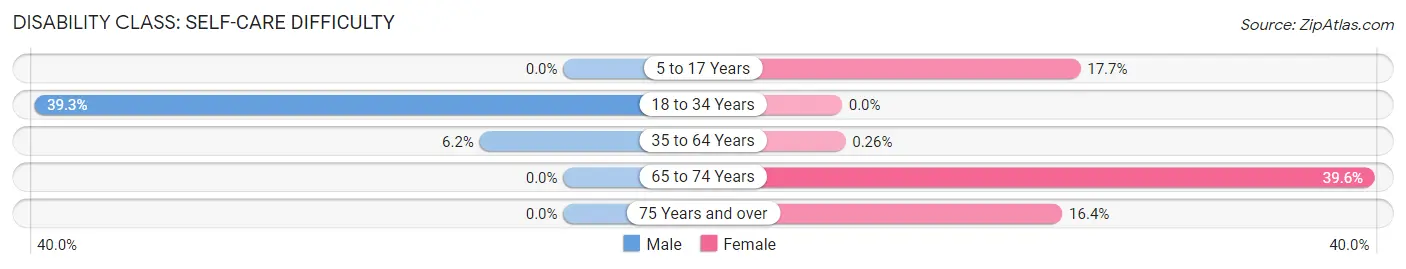
| Age Bracket | Male | Female |
| 5 to 17 Years | 0 (0.0%) | 34 (17.7%) |
| 18 to 34 Years | 22 (39.3%) | 0 (0.0%) |
| 35 to 64 Years | 11 (6.2%) | 1 (0.3%) |
| 65 to 74 Years | 0 (0.0%) | 19 (39.6%) |
| 75 Years and over | 0 (0.0%) | 9 (16.4%) |
Technology Access in Cottonport
Computing Device Access in Cottonport
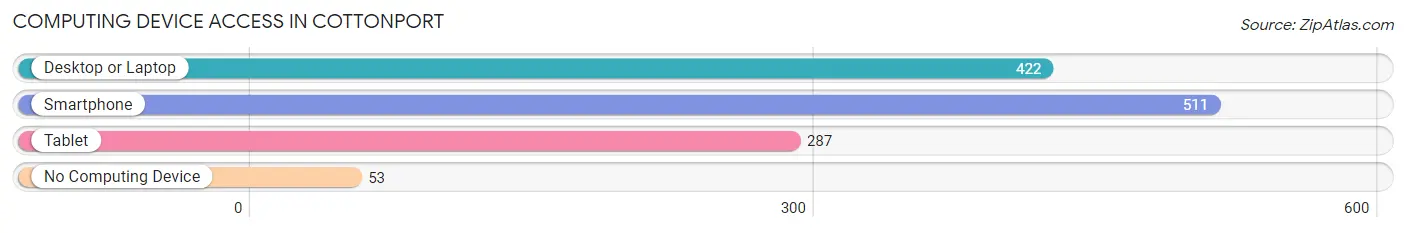
| Device Type | # Households | % Households |
| Desktop or Laptop | 422 | 69.2% |
| Smartphone | 511 | 83.8% |
| Tablet | 287 | 47.0% |
| No Computing Device | 53 | 8.7% |
| Total | 610 | 100.0% |
Internet Access in Cottonport
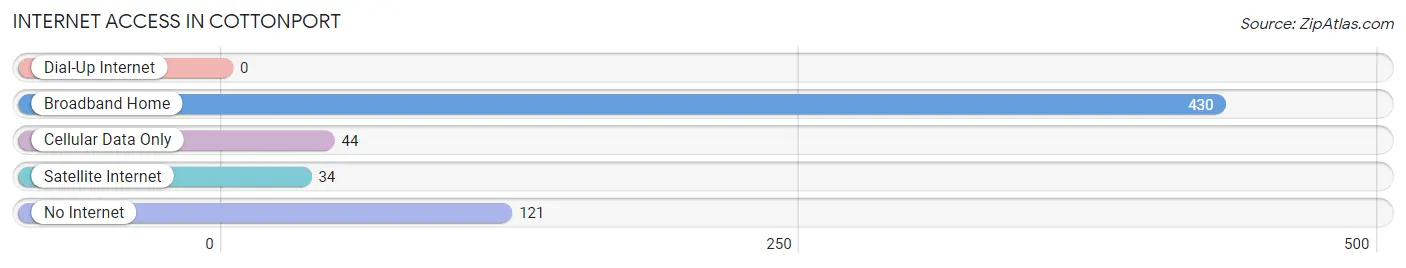
| Internet Type | # Households | % Households |
| Dial-Up Internet | 0 | 0.0% |
| Broadband Home | 430 | 70.5% |
| Cellular Data Only | 44 | 7.2% |
| Satellite Internet | 34 | 5.6% |
| No Internet | 121 | 19.8% |
| Total | 610 | 100.0% |
Cottonport Summary
Cottonport is a small town located in Avoyelles Parish, Louisiana. It is situated on the banks of the Atchafalaya River, approximately 30 miles northwest of Baton Rouge. The town was founded in 1837 and has a population of 1,845 as of the 2010 census.
History
Cottonport was founded in 1837 by a group of settlers from Kentucky and Tennessee. The town was named for the cotton plantations that were located in the area. The town was incorporated in 1845 and was the first town in Avoyelles Parish.
In the late 19th century, Cottonport was a major cotton-producing center. The town was home to several cotton mills and warehouses. The town was also home to a number of other businesses, including a sawmill, a gristmill, a blacksmith shop, and a general store.
In the early 20th century, the town began to decline as the cotton industry moved away. The town was hit hard by the Great Depression and many of the businesses closed. The town was also affected by the floods of 1927 and 1937.
Geography
Cottonport is located in Avoyelles Parish, Louisiana. It is situated on the banks of the Atchafalaya River, approximately 30 miles northwest of Baton Rouge. The town is located in the Central Louisiana region and is part of the Alexandria metropolitan area.
The town has a total area of 1.2 square miles, all of which is land. The town is located in a flat, low-lying area and is prone to flooding.
Economy
Cottonport’s economy is largely based on agriculture. The town is home to several farms that produce cotton, soybeans, corn, and other crops. The town is also home to a number of small businesses, including restaurants, convenience stores, and auto repair shops.
The town is also home to a number of manufacturing companies, including a furniture factory and a plastics factory. The town is also home to a number of service-based businesses, including a medical clinic and a nursing home.
Demographics
As of the 2010 census, the town had a population of 1,845. The racial makeup of the town was 79.3% White, 17.7% African American, 0.3% Native American, 0.2% Asian, 0.1% Pacific Islander, 0.7% from other races, and 1.9% from two or more races. Hispanic or Latino of any race were 2.2% of the population.
The median income for a household in the town was $25,938, and the median income for a family was $31,250. The per capita income for the town was $14,845. About 22.2% of families and 25.2% of the population were below the poverty line, including 33.3% of those under age 18 and 16.7% of those age 65 or over.
Common Questions
What is Per Capita Income in Cottonport?
Per Capita income in Cottonport is $16,658.
What is the Median Family Income in Cottonport?
Median Family Income in Cottonport is $32,141.
What is the Median Household income in Cottonport?
Median Household Income in Cottonport is $31,676.
What is Income or Wage Gap in Cottonport?
Income or Wage Gap in Cottonport is 63.2%.
Women in Cottonport earn 36.8 cents for every dollar earned by a man.
What is Inequality or Gini Index in Cottonport?
Inequality or Gini Index in Cottonport is 0.43.
What is the Total Population of Cottonport?
Total Population of Cottonport is 1,734.
What is the Total Male Population of Cottonport?
Total Male Population of Cottonport is 496.
What is the Total Female Population of Cottonport?
Total Female Population of Cottonport is 1,238.
What is the Ratio of Males per 100 Females in Cottonport?
There are 40.06 Males per 100 Females in Cottonport.
What is the Ratio of Females per 100 Males in Cottonport?
There are 249.60 Females per 100 Males in Cottonport.
What is the Median Population Age in Cottonport?
Median Population Age in Cottonport is 24.6 Years.
What is the Average Family Size in Cottonport
Average Family Size in Cottonport is 3.3 People.
What is the Average Household Size in Cottonport
Average Household Size in Cottonport is 2.8 People.
How Large is the Labor Force in Cottonport?
There are 664 People in the Labor Forcein in Cottonport.
What is the Percentage of People in the Labor Force in Cottonport?
55.9% of People are in the Labor Force in Cottonport.
What is the Unemployment Rate in Cottonport?
Unemployment Rate in Cottonport is 3.3%.