Convent, LA
Convent Map
Convent Overview
552
TOTAL POPULATION
312
MALE POPULATION
240
FEMALE POPULATION
130.00
MALES / 100 FEMALES
76.92
FEMALES / 100 MALES
24.2
MEDIAN AGE
3.0
AVG FAMILY SIZE
2.6
AVG HOUSEHOLD SIZE
$24,783
PER CAPITA INCOME
$48,403
AVG FAMILY INCOME
$41,042
AVG HOUSEHOLD INCOME
37.6%
WAGE / INCOME GAP [ % ]
62.4¢/ $1
WAGE / INCOME GAP [ $ ]
0.43
INEQUALITY / GINI INDEX
212
LABOR FORCE [ PEOPLE ]
57.8%
PERCENT IN LABOR FORCE
Convent Zip Codes
Convent Area Codes
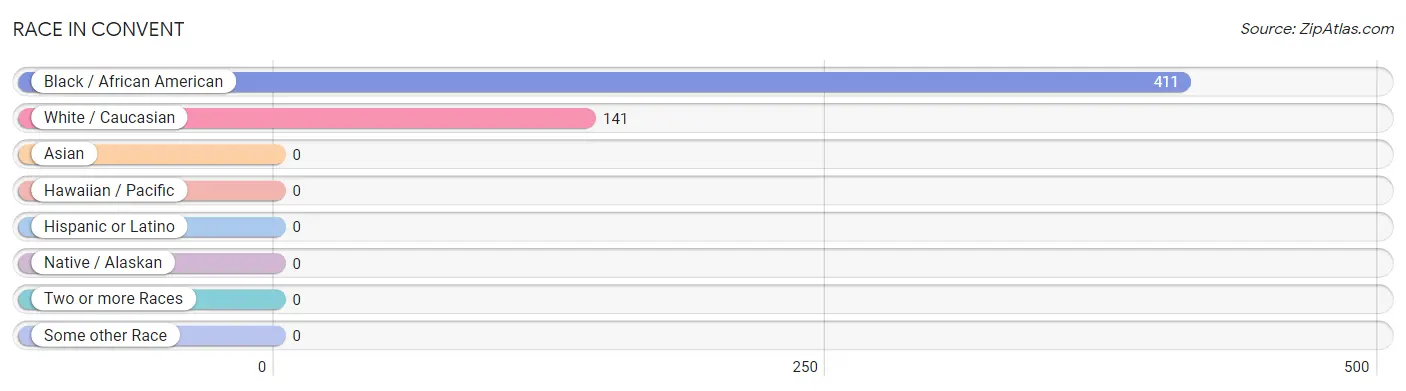
Race in Convent
The most populous races in Convent are Black / African American (411 | 74.5%), and White / Caucasian (141 | 25.5%).
| Race | # Population | % Population |
| Asian | 0 | 0.0% |
| Black / African American | 411 | 74.5% |
| Hawaiian / Pacific | 0 | 0.0% |
| Hispanic or Latino | 0 | 0.0% |
| Native / Alaskan | 0 | 0.0% |
| White / Caucasian | 141 | 25.5% |
| Two or more Races | 0 | 0.0% |
| Some other Race | 0 | 0.0% |
| Total | 552 | 100.0% |
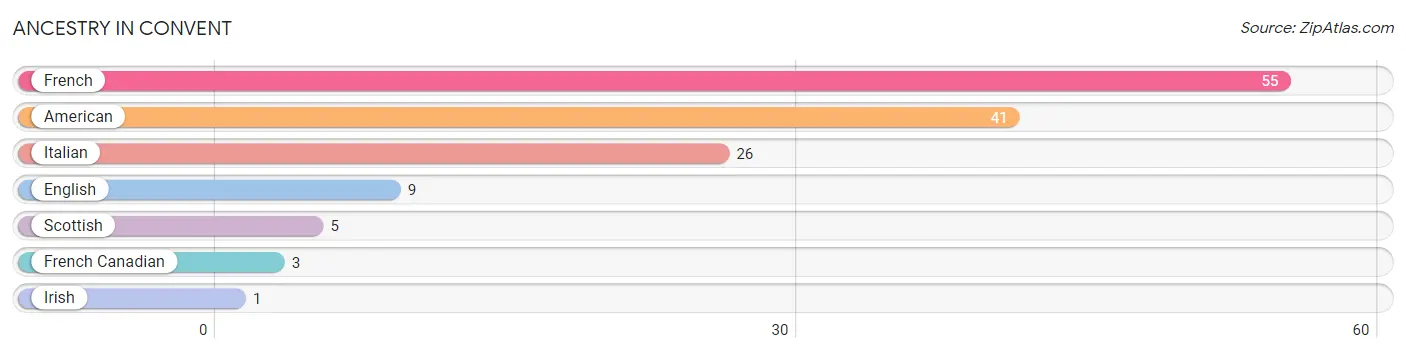
Ancestry in Convent
The most populous ancestries reported in Convent are French (55 | 10.0%), American (41 | 7.4%), Italian (26 | 4.7%), English (9 | 1.6%), and Scottish (5 | 0.9%), together accounting for 24.6% of all Convent residents.
| Ancestry | # Population | % Population |
| American | 41 | 7.4% |
| English | 9 | 1.6% |
| French | 55 | 10.0% |
| French Canadian | 3 | 0.5% |
| Irish | 1 | 0.2% |
| Italian | 26 | 4.7% |
| Scottish | 5 | 0.9% | View All 7 Rows |
Immigrants in Convent

| Immigration Origin | # Population | % Population | View All 0 Rows |
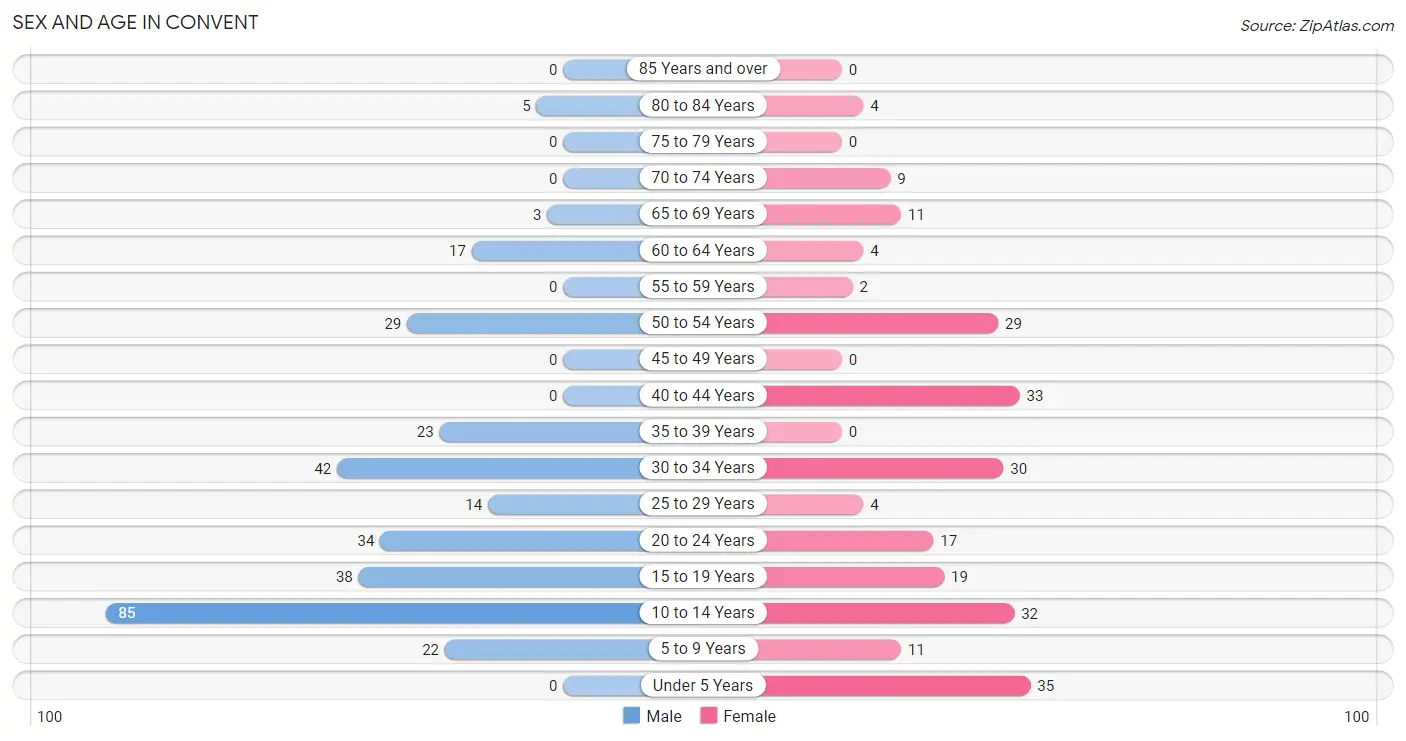
Sex and Age in Convent
Sex and Age in Convent
The most populous age groups in Convent are 10 to 14 Years (85 | 27.2%) for men and Under 5 Years (35 | 14.6%) for women.
| Age Bracket | Male | Female |
| Under 5 Years | 0 (0.0%) | 35 (14.6%) |
| 5 to 9 Years | 22 (7.0%) | 11 (4.6%) |
| 10 to 14 Years | 85 (27.2%) | 32 (13.3%) |
| 15 to 19 Years | 38 (12.2%) | 19 (7.9%) |
| 20 to 24 Years | 34 (10.9%) | 17 (7.1%) |
| 25 to 29 Years | 14 (4.5%) | 4 (1.7%) |
| 30 to 34 Years | 42 (13.5%) | 30 (12.5%) |
| 35 to 39 Years | 23 (7.4%) | 0 (0.0%) |
| 40 to 44 Years | 0 (0.0%) | 33 (13.8%) |
| 45 to 49 Years | 0 (0.0%) | 0 (0.0%) |
| 50 to 54 Years | 29 (9.3%) | 29 (12.1%) |
| 55 to 59 Years | 0 (0.0%) | 2 (0.8%) |
| 60 to 64 Years | 17 (5.4%) | 4 (1.7%) |
| 65 to 69 Years | 3 (1.0%) | 11 (4.6%) |
| 70 to 74 Years | 0 (0.0%) | 9 (3.7%) |
| 75 to 79 Years | 0 (0.0%) | 0 (0.0%) |
| 80 to 84 Years | 5 (1.6%) | 4 (1.7%) |
| 85 Years and over | 0 (0.0%) | 0 (0.0%) |
| Total | 312 (100.0%) | 240 (100.0%) |
Families and Households in Convent
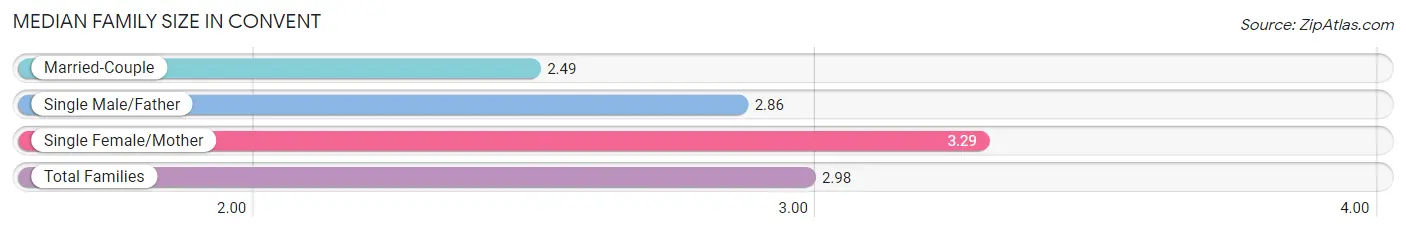
Median Family Size in Convent
The median family size in Convent is 2.98 persons per family, with single female/mother families (84 | 57.1%) accounting for the largest median family size of 3.29 persons per family. On the other hand, married-couple families (49 | 33.3%) represent the smallest median family size with 2.49 persons per family.
| Family Type | # Families | Family Size |
| Married-Couple | 49 (33.3%) | 2.49 |
| Single Male/Father | 14 (9.5%) | 2.86 |
| Single Female/Mother | 84 (57.1%) | 3.29 |
| Total Families | 147 (100.0%) | 2.98 |
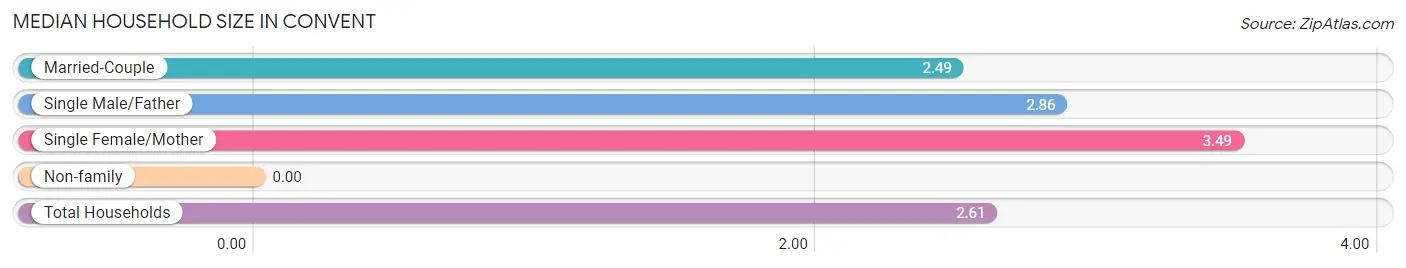
Median Household Size in Convent
| Household Type | # Households | Household Size |
| Married-Couple | 49 (25.7%) | 2.49 |
| Single Male/Father | 14 (7.3%) | 2.86 |
| Single Female/Mother | 84 (44.0%) | 3.49 |
| Non-family | 44 (23.0%) | - |
| Total Households | 191 (100.0%) | 2.61 |
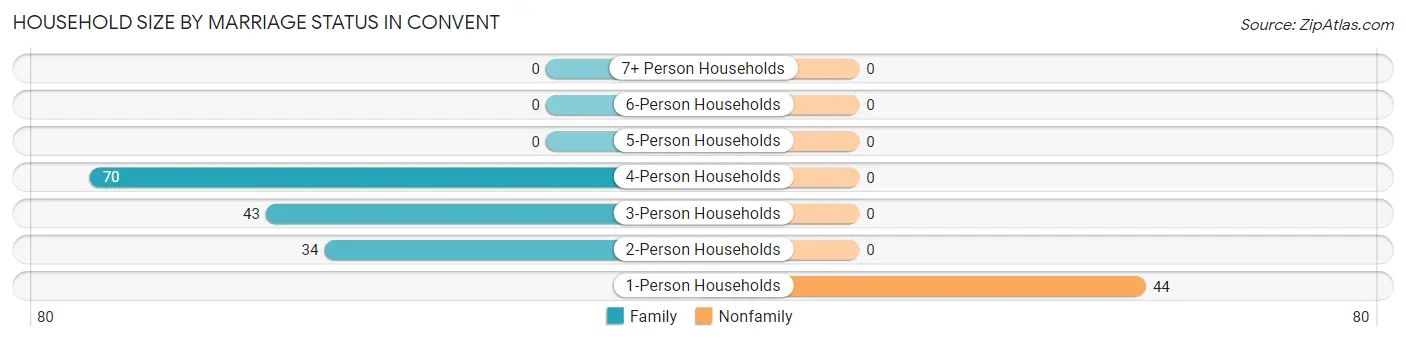
Household Size by Marriage Status in Convent
Out of a total of 191 households in Convent, 147 (77.0%) are family households, while 44 (23.0%) are nonfamily households. The most numerous type of family households are 4-person households, comprising 70, and the most common type of nonfamily households are 1-person households, comprising 44.
| Household Size | Family Households | Nonfamily Households |
| 1-Person Households | - | 44 (23.0%) |
| 2-Person Households | 34 (17.8%) | 0 (0.0%) |
| 3-Person Households | 43 (22.5%) | 0 (0.0%) |
| 4-Person Households | 70 (36.6%) | 0 (0.0%) |
| 5-Person Households | 0 (0.0%) | 0 (0.0%) |
| 6-Person Households | 0 (0.0%) | 0 (0.0%) |
| 7+ Person Households | 0 (0.0%) | 0 (0.0%) |
| Total | 147 (77.0%) | 44 (23.0%) |
Female Fertility in Convent
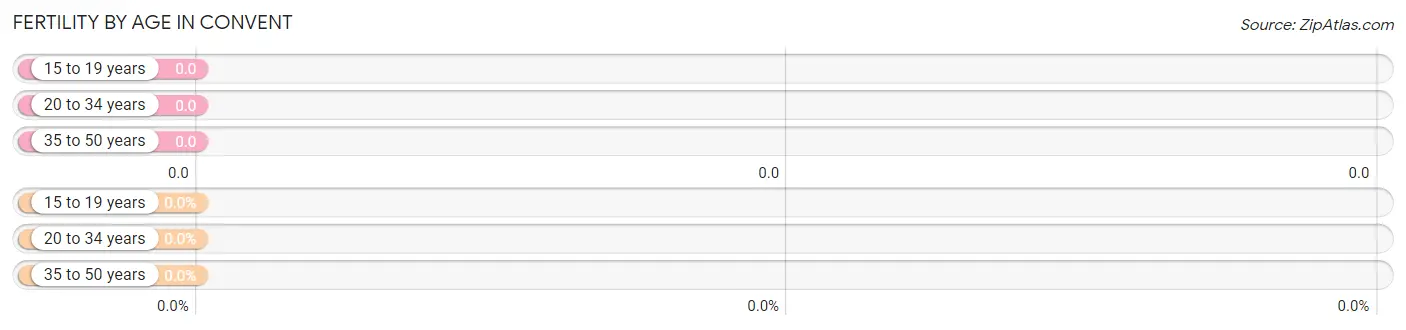
Fertility by Age in Convent
| Age Bracket | Women with Births | Births / 1,000 Women |
| 15 to 19 years | 0 (0.0%) | 0.0 |
| 20 to 34 years | 0 (0.0%) | 0.0 |
| 35 to 50 years | 0 (0.0%) | 0.0 |
| Total | 0 (0.0%) | 0.0 |
Fertility by Age by Marriage Status in Convent
| Age Bracket | Married | Unmarried |
| 15 to 19 years | 0 (0.0%) | 0 (0.0%) |
| 20 to 34 years | 0 (0.0%) | 0 (0.0%) |
| 35 to 50 years | 0 (0.0%) | 0 (0.0%) |
| Total | 0 (0.0%) | 0 (0.0%) |
Fertility by Education in Convent
| Educational Attainment | Women with Births | Births / 1,000 Women |
| Less than High School | 0 (0.0%) | 0.0 |
| High School Diploma | 0 (0.0%) | 0.0 |
| College or Associate's Degree | 0 (0.0%) | 0.0 |
| Bachelor's Degree | 0 (0.0%) | 0.0 |
| Graduate Degree | 0 (0.0%) | 0.0 |
| Total | 0 (0.0%) | 0.0 |
Fertility by Education by Marriage Status in Convent
| Educational Attainment | Married | Unmarried |
| Less than High School | 0 (0.0%) | 0 (0.0%) |
| High School Diploma | 0 (0.0%) | 0 (0.0%) |
| College or Associate's Degree | 0 (0.0%) | 0 (0.0%) |
| Bachelor's Degree | 0 (0.0%) | 0 (0.0%) |
| Graduate Degree | 0 (0.0%) | 0 (0.0%) |
| Total | 0 (0.0%) | 0 (0.0%) |
Income in Convent
Income Overview in Convent
Per Capita Income in Convent is $24,783, while median incomes of families and households are $48,403 and $41,042 respectively.
| Characteristic | Number | Measure |
| Per Capita Income | 552 | $24,783 |
| Median Family Income | 147 | $48,403 |
| Mean Family Income | 147 | $76,964 |
| Median Household Income | 191 | $41,042 |
| Mean Household Income | 191 | $66,282 |
| Income Deficit | 147 | $0 |
| Wage / Income Gap (%) | 552 | 37.57% |
| Wage / Income Gap ($) | 552 | 62.43¢ per $1 |
| Gini / Inequality Index | 552 | 0.43 |
Earnings by Sex in Convent
Average Earnings in Convent are $44,583, $54,167 for men and $33,819 for women, a difference of 37.6%.
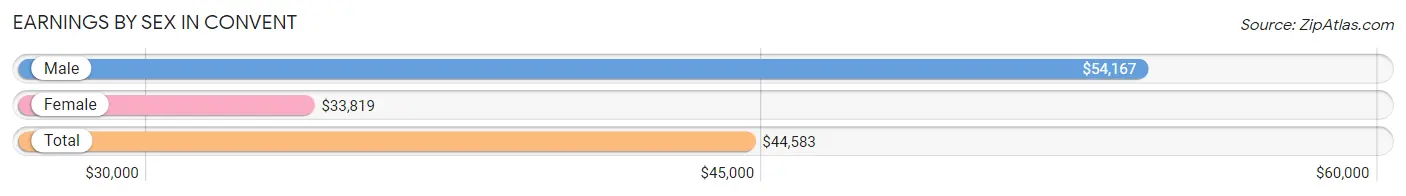
| Sex | Number | Average Earnings |
| Male | 114 (48.9%) | $54,167 |
| Female | 119 (51.1%) | $33,819 |
| Total | 233 (100.0%) | $44,583 |
Earnings by Sex by Income Bracket in Convent
The most common earnings brackets in Convent are $100,000+ for men (27 | 23.7%) and $25,000 to $29,999 for women (29 | 24.4%).
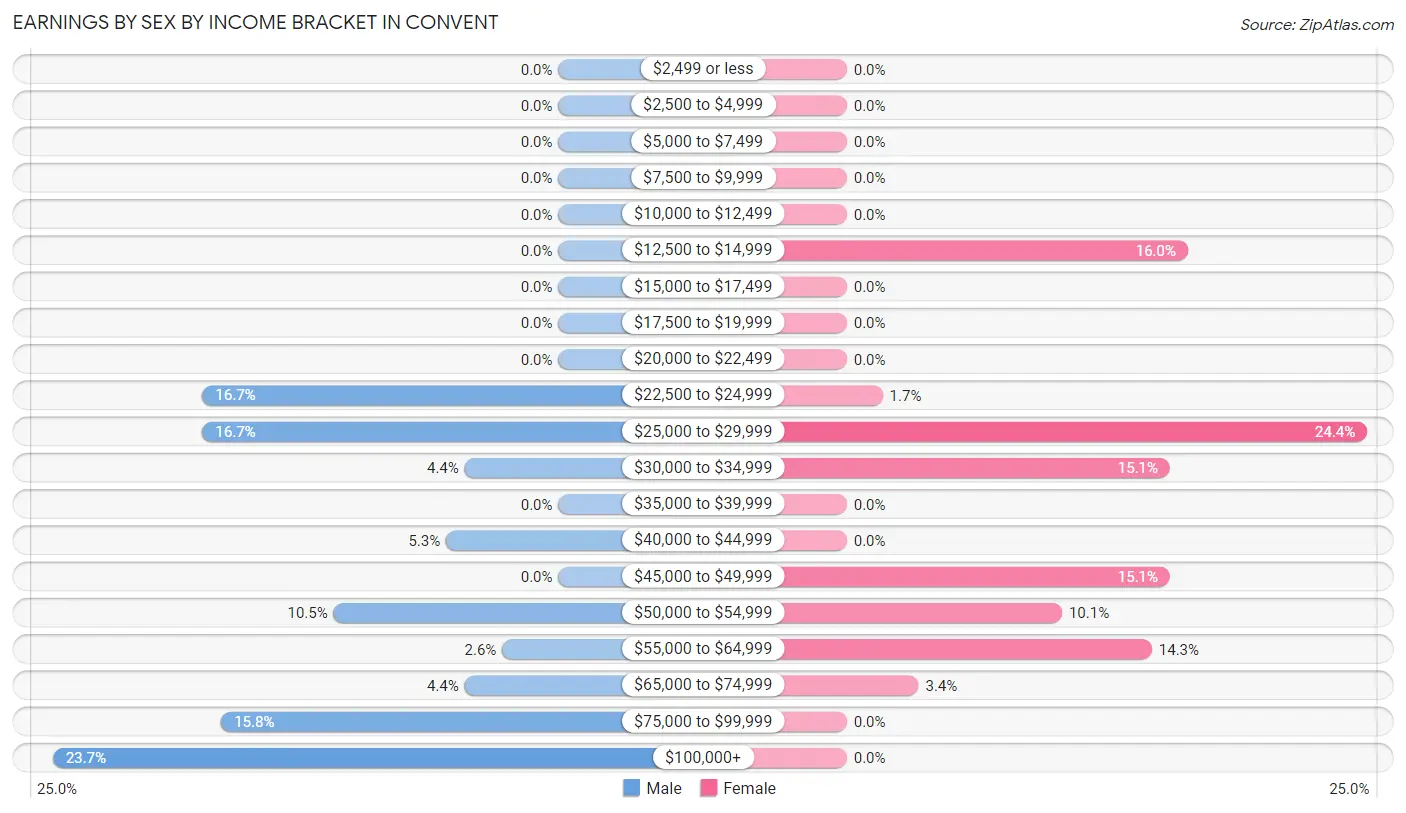
| Income | Male | Female |
| $2,499 or less | 0 (0.0%) | 0 (0.0%) |
| $2,500 to $4,999 | 0 (0.0%) | 0 (0.0%) |
| $5,000 to $7,499 | 0 (0.0%) | 0 (0.0%) |
| $7,500 to $9,999 | 0 (0.0%) | 0 (0.0%) |
| $10,000 to $12,499 | 0 (0.0%) | 0 (0.0%) |
| $12,500 to $14,999 | 0 (0.0%) | 19 (16.0%) |
| $15,000 to $17,499 | 0 (0.0%) | 0 (0.0%) |
| $17,500 to $19,999 | 0 (0.0%) | 0 (0.0%) |
| $20,000 to $22,499 | 0 (0.0%) | 0 (0.0%) |
| $22,500 to $24,999 | 19 (16.7%) | 2 (1.7%) |
| $25,000 to $29,999 | 19 (16.7%) | 29 (24.4%) |
| $30,000 to $34,999 | 5 (4.4%) | 18 (15.1%) |
| $35,000 to $39,999 | 0 (0.0%) | 0 (0.0%) |
| $40,000 to $44,999 | 6 (5.3%) | 0 (0.0%) |
| $45,000 to $49,999 | 0 (0.0%) | 18 (15.1%) |
| $50,000 to $54,999 | 12 (10.5%) | 12 (10.1%) |
| $55,000 to $64,999 | 3 (2.6%) | 17 (14.3%) |
| $65,000 to $74,999 | 5 (4.4%) | 4 (3.4%) |
| $75,000 to $99,999 | 18 (15.8%) | 0 (0.0%) |
| $100,000+ | 27 (23.7%) | 0 (0.0%) |
| Total | 114 (100.0%) | 119 (100.0%) |
Earnings by Sex by Educational Attainment in Convent
Average earnings in Convent are $52,604 for men and $32,639 for women, a difference of 38.0%. Men with an educational attainment of high school diploma enjoy the highest average annual earnings of $29,408, while those with high school diploma education earn the least with $29,408. Women with an educational attainment of college or associate's degree earn the most with the average annual earnings of $33,333, while those with college or associate's degree education have the smallest earnings of $33,333.
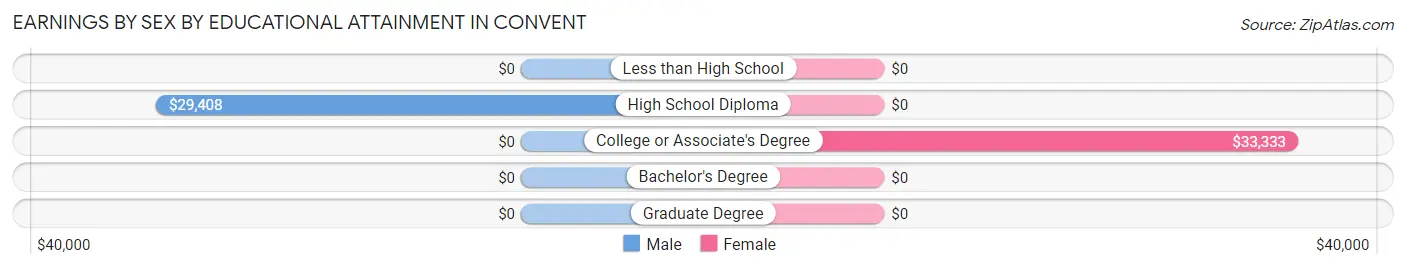
| Educational Attainment | Male Income | Female Income |
| Less than High School | - | - |
| High School Diploma | $29,408 | $0 |
| College or Associate's Degree | - | - |
| Bachelor's Degree | - | - |
| Graduate Degree | - | - |
| Total | $52,604 | $32,639 |
Family Income in Convent
Family Income Brackets in Convent
According to the Convent family income data, there are 41 families falling into the $35,000 to $49,999 income range, which is the most common income bracket and makes up 27.9% of all families.
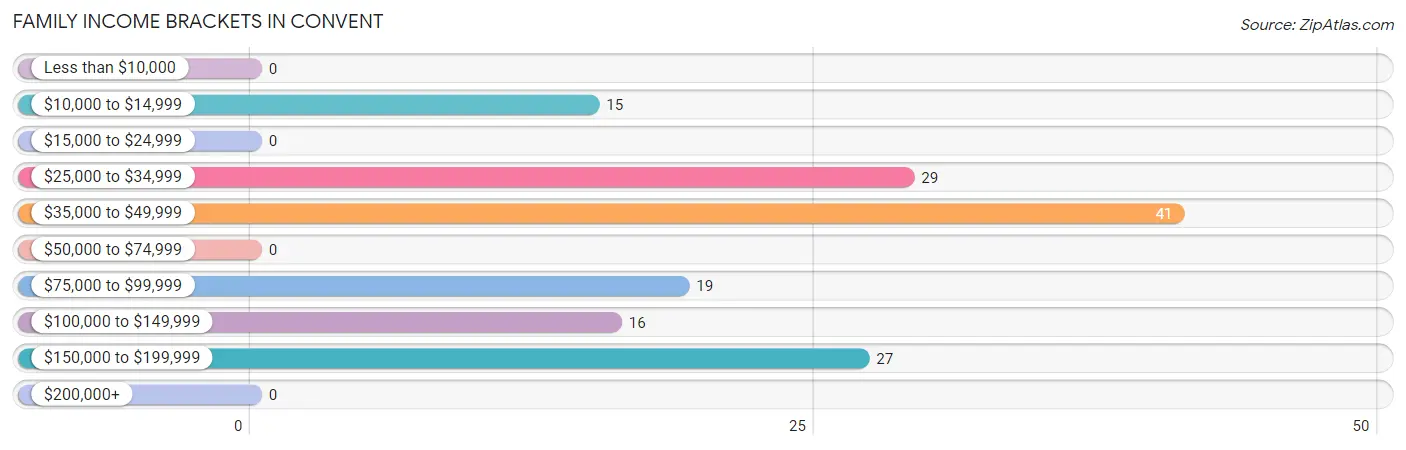
| Income Bracket | # Families | % Families |
| Less than $10,000 | 0 | 0.0% |
| $10,000 to $14,999 | 15 | 10.2% |
| $15,000 to $24,999 | 0 | 0.0% |
| $25,000 to $34,999 | 29 | 19.7% |
| $35,000 to $49,999 | 41 | 27.9% |
| $50,000 to $74,999 | 0 | 0.0% |
| $75,000 to $99,999 | 19 | 12.9% |
| $100,000 to $149,999 | 16 | 10.9% |
| $150,000 to $199,999 | 27 | 18.4% |
| $200,000+ | 0 | 0.0% |
Family Income by Famaliy Size in Convent
2-person families (34 | 23.1%) account for the highest median family income in Convent with $182,875 per family, while 2-person families (34 | 23.1%) have the highest median income of $91,438 per family member.
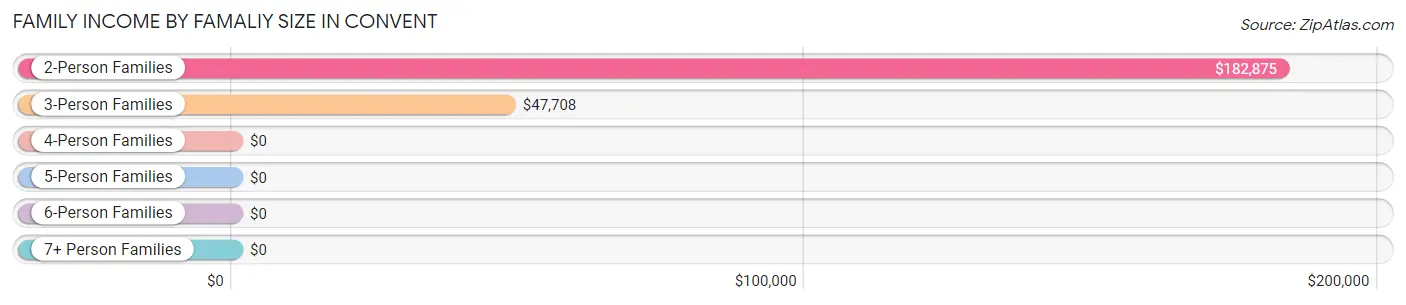
| Income Bracket | # Families | Median Income |
| 2-Person Families | 34 (23.1%) | $182,875 |
| 3-Person Families | 61 (41.5%) | $47,708 |
| 4-Person Families | 52 (35.4%) | $0 |
| 5-Person Families | 0 (0.0%) | $0 |
| 6-Person Families | 0 (0.0%) | $0 |
| 7+ Person Families | 0 (0.0%) | $0 |
| Total | 147 (100.0%) | $48,403 |
Family Income by Number of Earners in Convent
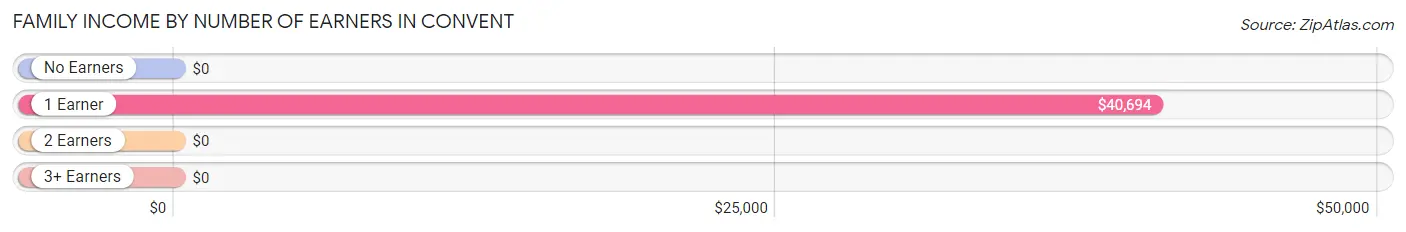
| Number of Earners | # Families | Median Income |
| No Earners | 10 (6.8%) | $0 |
| 1 Earner | 98 (66.7%) | $40,694 |
| 2 Earners | 32 (21.8%) | $0 |
| 3+ Earners | 7 (4.8%) | $0 |
| Total | 147 (100.0%) | $48,403 |
Household Income in Convent
Household Income Brackets in Convent
With 48 households falling in the category, the $25,000 to $34,999 income range is the most frequent in Convent, accounting for 25.1% of all households.
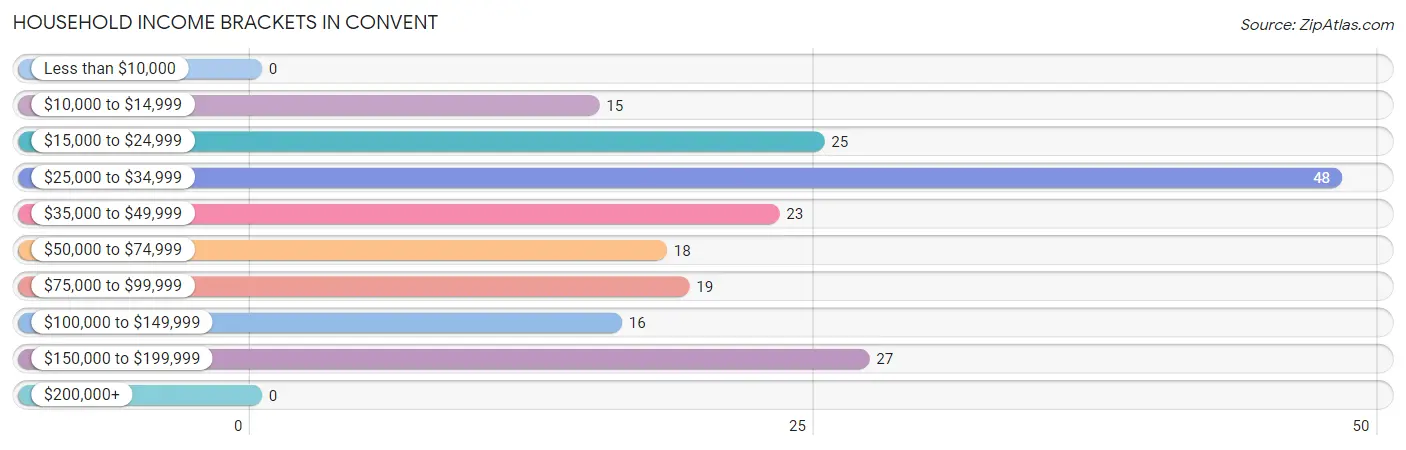
| Income Bracket | # Households | % Households |
| Less than $10,000 | 0 | 0.0% |
| $10,000 to $14,999 | 15 | 7.9% |
| $15,000 to $24,999 | 25 | 13.1% |
| $25,000 to $34,999 | 48 | 25.1% |
| $35,000 to $49,999 | 23 | 12.0% |
| $50,000 to $74,999 | 18 | 9.4% |
| $75,000 to $99,999 | 19 | 9.9% |
| $100,000 to $149,999 | 16 | 8.4% |
| $150,000 to $199,999 | 27 | 14.1% |
| $200,000+ | 0 | 0.0% |
Household Income by Householder Age in Convent
The median household income in Convent is $41,042, with the highest median household income of $29,036 found in the 45 to 64 years age bracket for the primary householder. A total of 59 households (30.9%) fall into this category. Meanwhile, the 15 to 24 years age bracket for the primary householder has the lowest median household income of $0, with 20 households (10.5%) in this group.
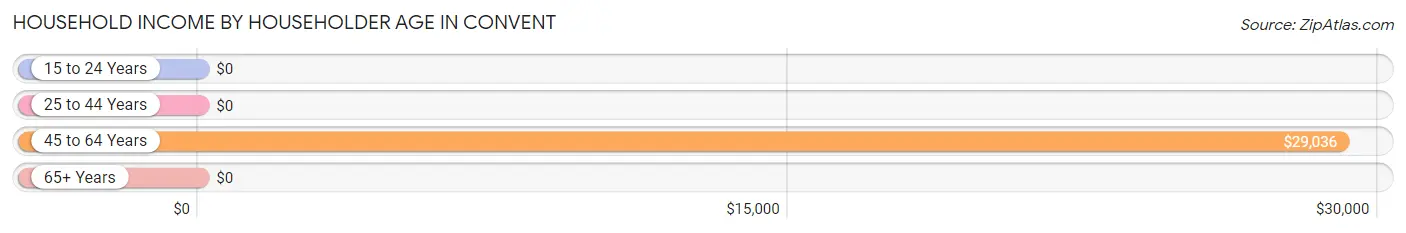
| Income Bracket | # Households | Median Income |
| 15 to 24 Years | 20 (10.5%) | $0 |
| 25 to 44 Years | 96 (50.3%) | $0 |
| 45 to 64 Years | 59 (30.9%) | $29,036 |
| 65+ Years | 16 (8.4%) | $0 |
| Total | 191 (100.0%) | $41,042 |
Poverty in Convent
Income Below Poverty by Sex and Age in Convent
With 17.4% poverty level for males and 12.7% for females among the residents of Convent, 55 to 64 year old males and 6 to 11 year old females are the most vulnerable to poverty, with 17 males (100.0%) and 15 females (57.7%) in their respective age groups living below the poverty level.
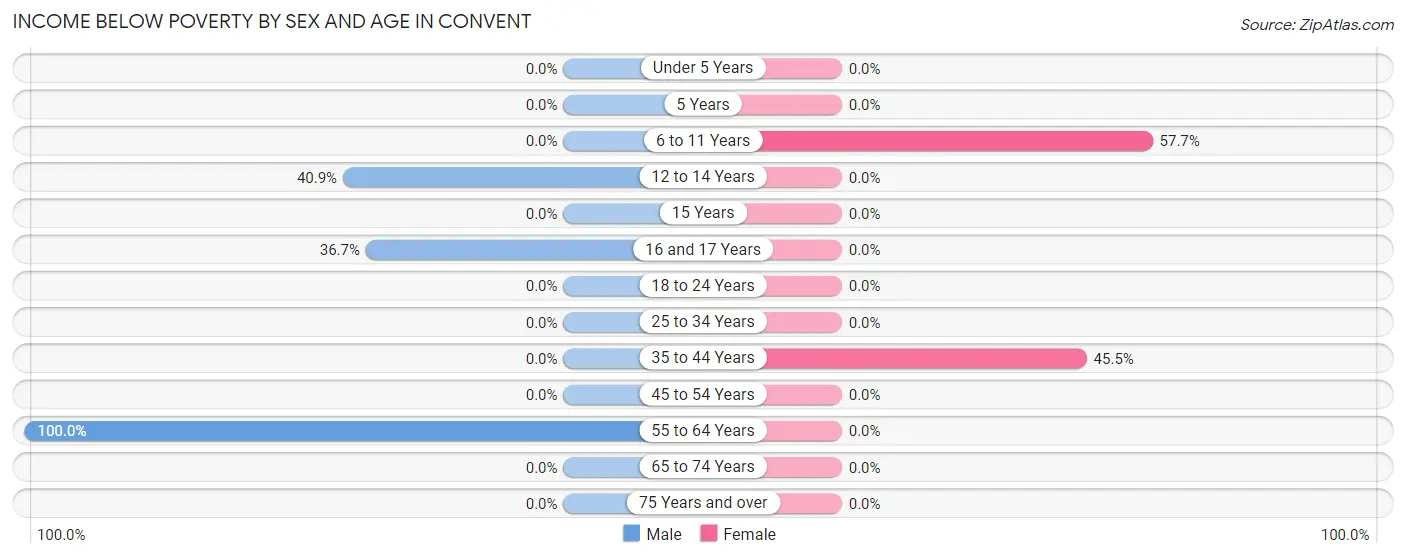
| Age Bracket | Male | Female |
| Under 5 Years | 0 (0.0%) | 0 (0.0%) |
| 5 Years | 0 (0.0%) | 0 (0.0%) |
| 6 to 11 Years | 0 (0.0%) | 15 (57.7%) |
| 12 to 14 Years | 18 (40.9%) | 0 (0.0%) |
| 15 Years | 0 (0.0%) | 0 (0.0%) |
| 16 and 17 Years | 11 (36.7%) | 0 (0.0%) |
| 18 to 24 Years | 0 (0.0%) | 0 (0.0%) |
| 25 to 34 Years | 0 (0.0%) | 0 (0.0%) |
| 35 to 44 Years | 0 (0.0%) | 15 (45.5%) |
| 45 to 54 Years | 0 (0.0%) | 0 (0.0%) |
| 55 to 64 Years | 17 (100.0%) | 0 (0.0%) |
| 65 to 74 Years | 0 (0.0%) | 0 (0.0%) |
| 75 Years and over | 0 (0.0%) | 0 (0.0%) |
| Total | 46 (17.4%) | 30 (12.7%) |
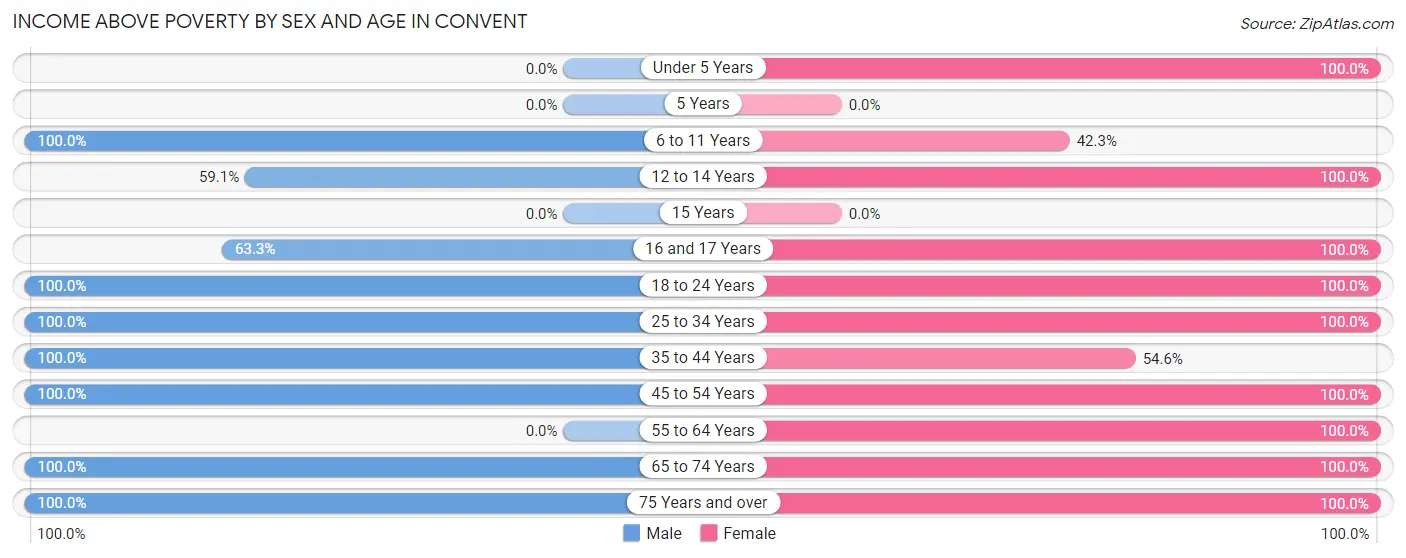
Income Above Poverty by Sex and Age in Convent
According to the poverty statistics in Convent, males aged 6 to 11 years and females aged under 5 years are the age groups that are most secure financially, with 100.0% of males and 100.0% of females in these age groups living above the poverty line.
| Age Bracket | Male | Female |
| Under 5 Years | 0 (0.0%) | 35 (100.0%) |
| 5 Years | 0 (0.0%) | 0 (0.0%) |
| 6 to 11 Years | 63 (100.0%) | 11 (42.3%) |
| 12 to 14 Years | 26 (59.1%) | 17 (100.0%) |
| 15 Years | 0 (0.0%) | 0 (0.0%) |
| 16 and 17 Years | 19 (63.3%) | 19 (100.0%) |
| 18 to 24 Years | 30 (100.0%) | 17 (100.0%) |
| 25 to 34 Years | 31 (100.0%) | 30 (100.0%) |
| 35 to 44 Years | 15 (100.0%) | 18 (54.5%) |
| 45 to 54 Years | 26 (100.0%) | 29 (100.0%) |
| 55 to 64 Years | 0 (0.0%) | 6 (100.0%) |
| 65 to 74 Years | 3 (100.0%) | 20 (100.0%) |
| 75 Years and over | 5 (100.0%) | 4 (100.0%) |
| Total | 218 (82.6%) | 206 (87.3%) |
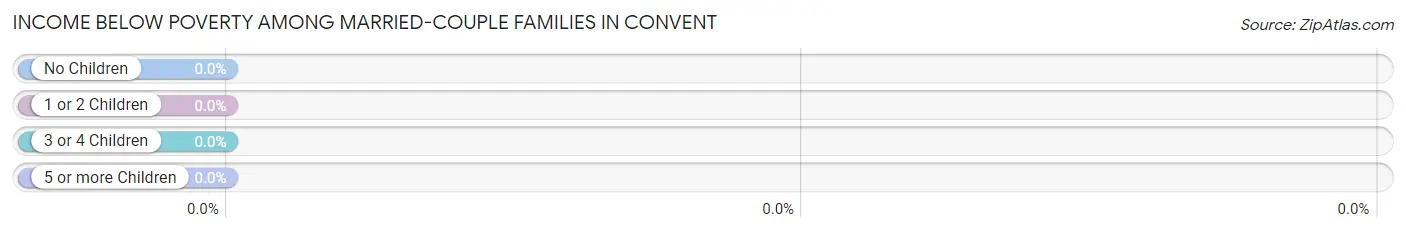
Income Below Poverty Among Married-Couple Families in Convent
| Children | Above Poverty | Below Poverty |
| No Children | 37 (100.0%) | 0 (0.0%) |
| 1 or 2 Children | 12 (100.0%) | 0 (0.0%) |
| 3 or 4 Children | 0 (0.0%) | 0 (0.0%) |
| 5 or more Children | 0 (0.0%) | 0 (0.0%) |
| Total | 49 (100.0%) | 0 (0.0%) |
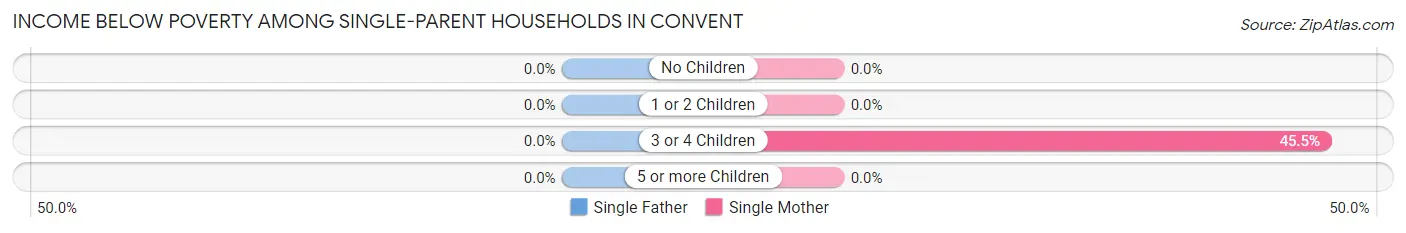
Income Below Poverty Among Single-Parent Households in Convent
| Children | Single Father | Single Mother |
| No Children | 0 (0.0%) | 0 (0.0%) |
| 1 or 2 Children | 0 (0.0%) | 0 (0.0%) |
| 3 or 4 Children | 0 (0.0%) | 15 (45.5%) |
| 5 or more Children | 0 (0.0%) | 0 (0.0%) |
| Total | 0 (0.0%) | 15 (17.9%) |
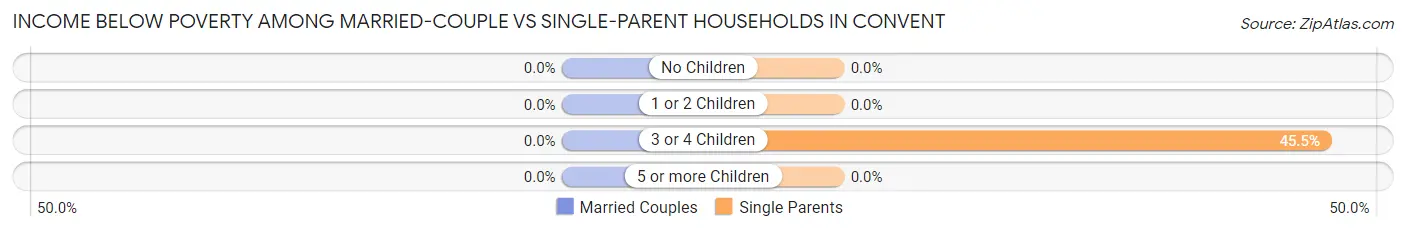
Income Below Poverty Among Married-Couple vs Single-Parent Households in Convent
| Children | Married-Couple Families | Single-Parent Households |
| No Children | 0 (0.0%) | 0 (0.0%) |
| 1 or 2 Children | 0 (0.0%) | 0 (0.0%) |
| 3 or 4 Children | 0 (0.0%) | 15 (45.5%) |
| 5 or more Children | 0 (0.0%) | 0 (0.0%) |
| Total | 0 (0.0%) | 15 (15.3%) |
Employment Characteristics in Convent
Employment by Class of Employer in Convent
Among the 212 employed individuals in Convent, private company employees (167 | 78.8%), local government employees (26 | 12.3%), and state government employees (16 | 7.5%) make up the most common classes of employment.
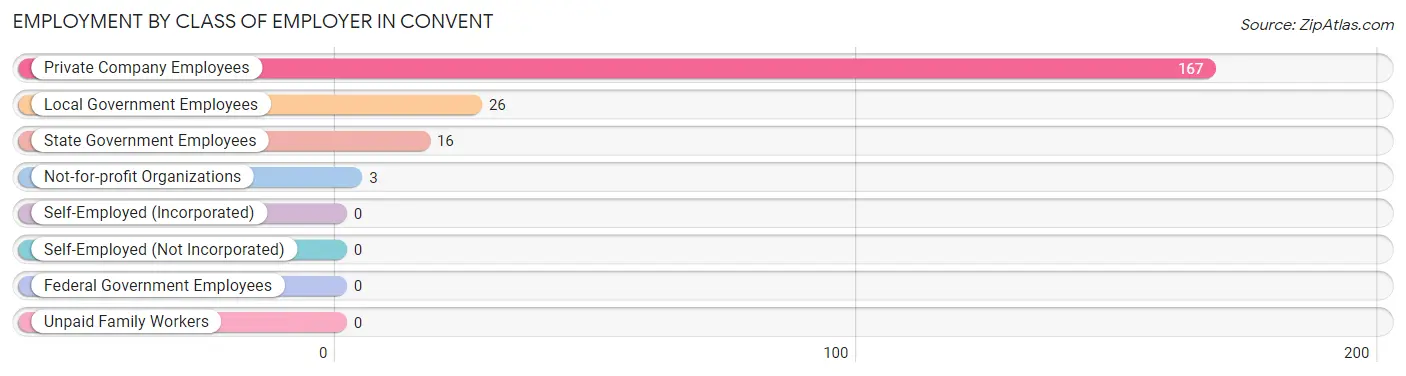
| Employer Class | # Employees | % Employees |
| Private Company Employees | 167 | 78.8% |
| Self-Employed (Incorporated) | 0 | 0.0% |
| Self-Employed (Not Incorporated) | 0 | 0.0% |
| Not-for-profit Organizations | 3 | 1.4% |
| Local Government Employees | 26 | 12.3% |
| State Government Employees | 16 | 7.5% |
| Federal Government Employees | 0 | 0.0% |
| Unpaid Family Workers | 0 | 0.0% |
| Total | 212 | 100.0% |
Employment Status by Age in Convent
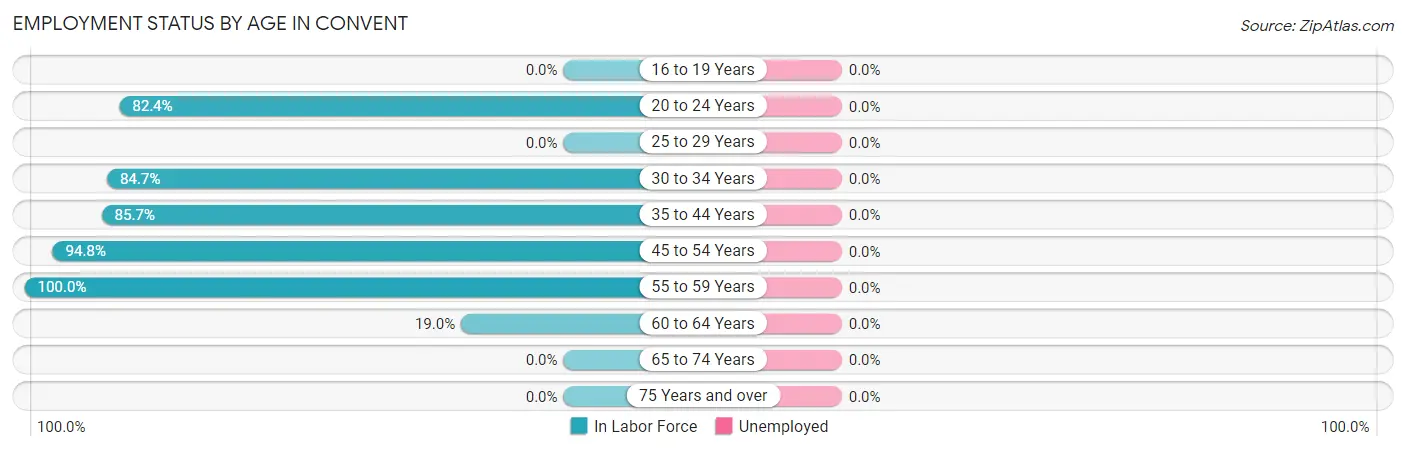
| Age Bracket | In Labor Force | Unemployed |
| 16 to 19 Years | 0 (0.0%) | 0 (0.0%) |
| 20 to 24 Years | 42 (82.4%) | 0 (0.0%) |
| 25 to 29 Years | 0 (0.0%) | 0 (0.0%) |
| 30 to 34 Years | 61 (84.7%) | 0 (0.0%) |
| 35 to 44 Years | 48 (85.7%) | 0 (0.0%) |
| 45 to 54 Years | 55 (94.8%) | 0 (0.0%) |
| 55 to 59 Years | 2 (100.0%) | 0 (0.0%) |
| 60 to 64 Years | 4 (19.0%) | 0 (0.0%) |
| 65 to 74 Years | 0 (0.0%) | 0 (0.0%) |
| 75 Years and over | 0 (0.0%) | 0 (0.0%) |
| Total | 212 (57.8%) | 0 (0.0%) |
Employment Status by Educational Attainment in Convent
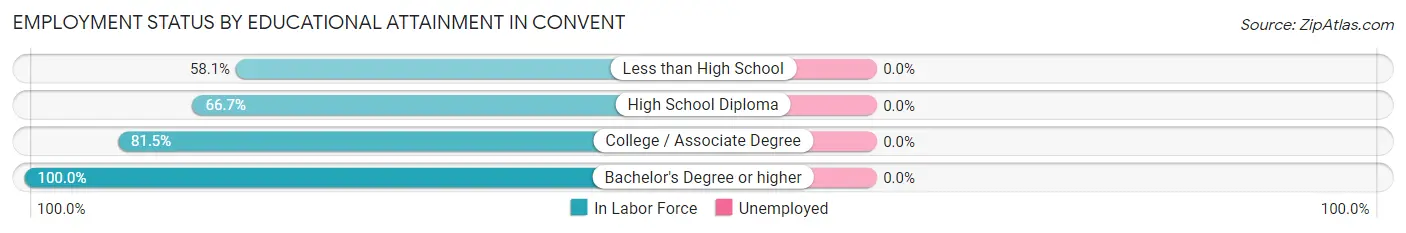
| Educational Attainment | In Labor Force | Unemployed |
| Less than High School | 18 (58.1%) | 0 (0.0%) |
| High School Diploma | 64 (66.7%) | 0 (0.0%) |
| College / Associate Degree | 53 (81.5%) | 0 (0.0%) |
| Bachelor's Degree or higher | 35 (100.0%) | 0 (0.0%) |
| Total | 170 (74.9%) | 0 (0.0%) |
Employment Occupations by Sex in Convent
Management, Business, Science and Arts Occupations
The most common Management, Business, Science and Arts occupations in Convent are Management (12 | 5.7%), Business & Financial (12 | 5.7%), Community & Social Service (12 | 5.7%), and Education Instruction & Library (12 | 5.7%).
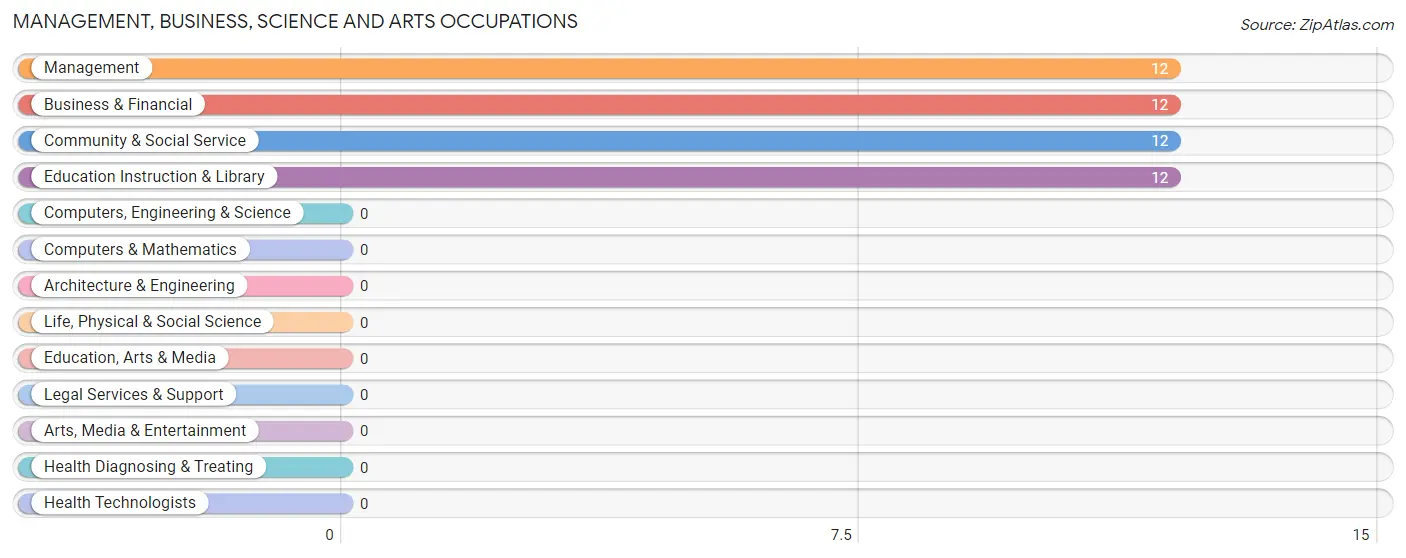
Management, Business, Science and Arts Occupations by Sex
Within the Management, Business, Science and Arts occupations in Convent, the most male-oriented occupations are Business & Financial (100.0%), and Management (66.7%), while the most female-oriented occupations are Community & Social Service (100.0%), Education Instruction & Library (100.0%), and Management (33.3%).
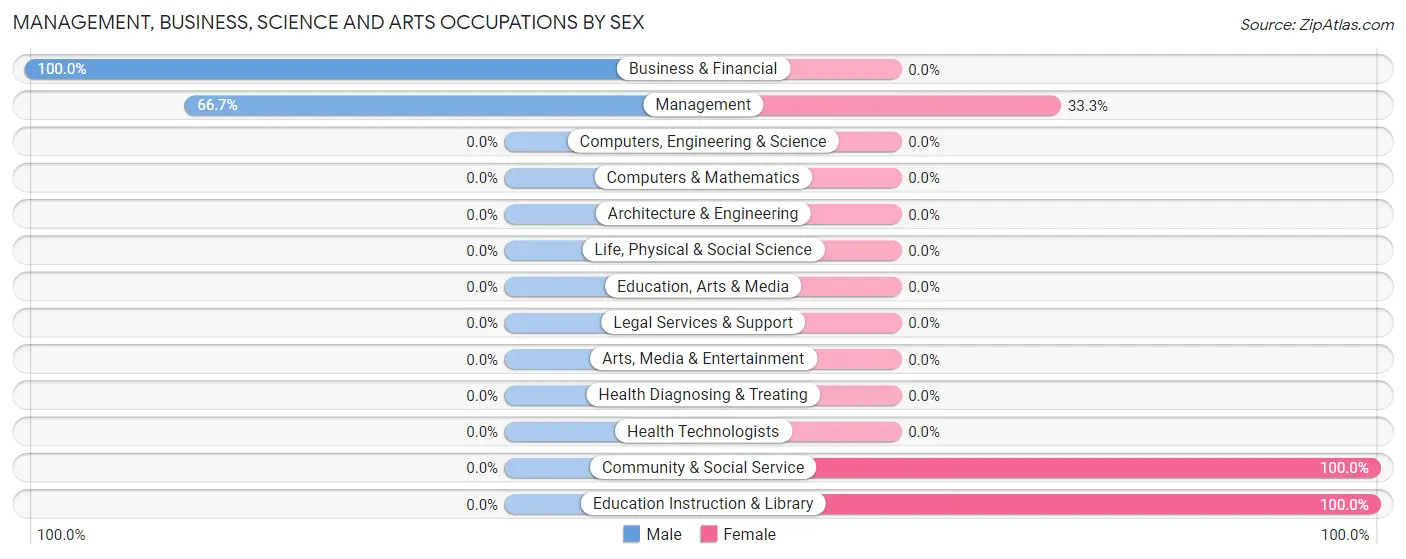
| Occupation | Male | Female |
| Management | 8 (66.7%) | 4 (33.3%) |
| Business & Financial | 12 (100.0%) | 0 (0.0%) |
| Computers, Engineering & Science | 0 (0.0%) | 0 (0.0%) |
| Computers & Mathematics | 0 (0.0%) | 0 (0.0%) |
| Architecture & Engineering | 0 (0.0%) | 0 (0.0%) |
| Life, Physical & Social Science | 0 (0.0%) | 0 (0.0%) |
| Community & Social Service | 0 (0.0%) | 12 (100.0%) |
| Education, Arts & Media | 0 (0.0%) | 0 (0.0%) |
| Legal Services & Support | 0 (0.0%) | 0 (0.0%) |
| Education Instruction & Library | 0 (0.0%) | 12 (100.0%) |
| Arts, Media & Entertainment | 0 (0.0%) | 0 (0.0%) |
| Health Diagnosing & Treating | 0 (0.0%) | 0 (0.0%) |
| Health Technologists | 0 (0.0%) | 0 (0.0%) |
| Total (Category) | 20 (55.6%) | 16 (44.4%) |
| Total (Overall) | 97 (45.8%) | 115 (54.2%) |
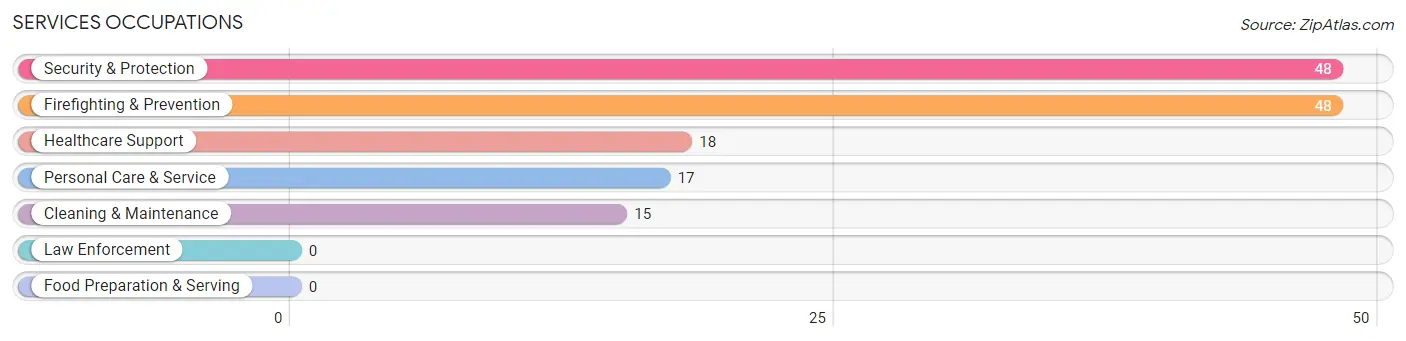
Services Occupations
The most common Services occupations in Convent are Security & Protection (48 | 22.6%), Firefighting & Prevention (48 | 22.6%), Healthcare Support (18 | 8.5%), Personal Care & Service (17 | 8.0%), and Cleaning & Maintenance (15 | 7.1%).
Services Occupations by Sex
Within the Services occupations in Convent, the most male-oriented occupations are Security & Protection (39.6%), and Firefighting & Prevention (39.6%), while the most female-oriented occupations are Healthcare Support (100.0%), Cleaning & Maintenance (100.0%), and Personal Care & Service (100.0%).
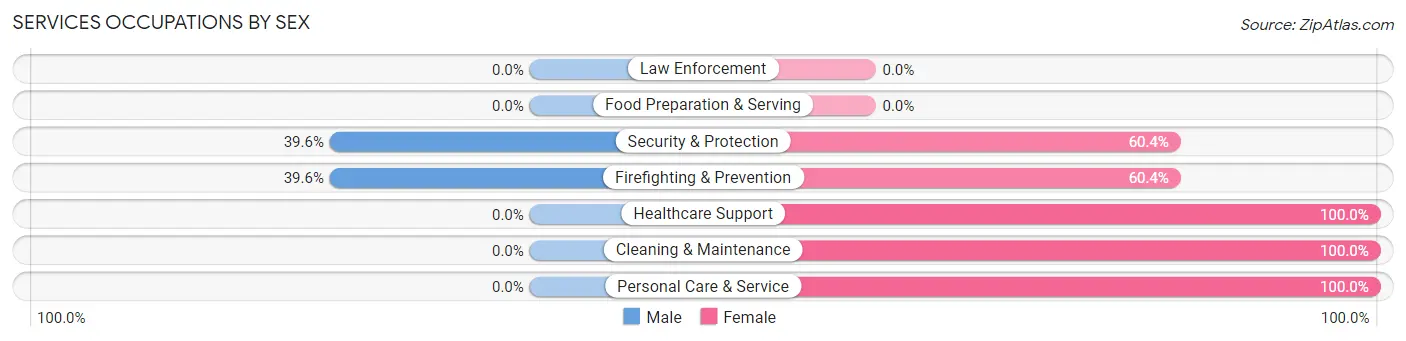
| Occupation | Male | Female |
| Healthcare Support | 0 (0.0%) | 18 (100.0%) |
| Security & Protection | 19 (39.6%) | 29 (60.4%) |
| Firefighting & Prevention | 19 (39.6%) | 29 (60.4%) |
| Law Enforcement | 0 (0.0%) | 0 (0.0%) |
| Food Preparation & Serving | 0 (0.0%) | 0 (0.0%) |
| Cleaning & Maintenance | 0 (0.0%) | 15 (100.0%) |
| Personal Care & Service | 0 (0.0%) | 17 (100.0%) |
| Total (Category) | 19 (19.4%) | 79 (80.6%) |
| Total (Overall) | 97 (45.8%) | 115 (54.2%) |
Sales and Office Occupations
The most common Sales and Office occupations in Convent are Office & Administration (40 | 18.9%), and Sales & Related (18 | 8.5%).
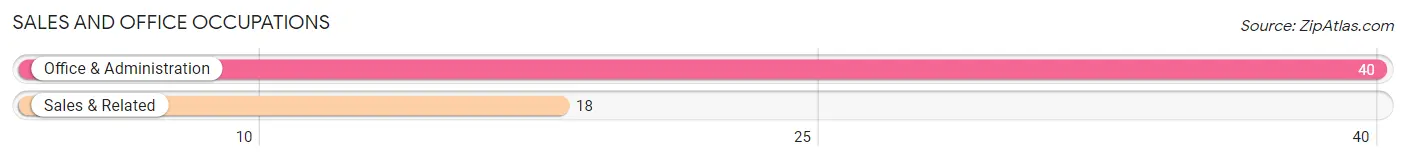
Sales and Office Occupations by Sex
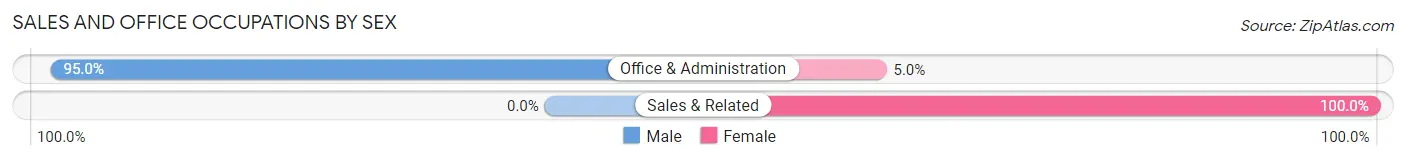
| Occupation | Male | Female |
| Sales & Related | 0 (0.0%) | 18 (100.0%) |
| Office & Administration | 38 (95.0%) | 2 (5.0%) |
| Total (Category) | 38 (65.5%) | 20 (34.5%) |
| Total (Overall) | 97 (45.8%) | 115 (54.2%) |
Natural Resources, Construction and Maintenance Occupations
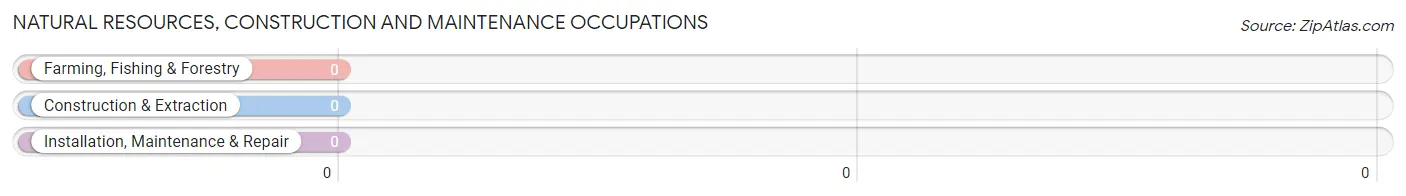
Natural Resources, Construction and Maintenance Occupations by Sex
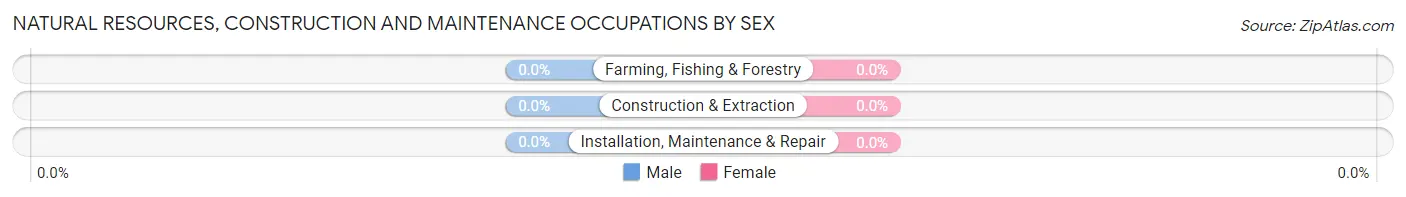
| Occupation | Male | Female |
| Farming, Fishing & Forestry | 0 (0.0%) | 0 (0.0%) |
| Construction & Extraction | 0 (0.0%) | 0 (0.0%) |
| Installation, Maintenance & Repair | 0 (0.0%) | 0 (0.0%) |
| Total (Category) | 0 (0.0%) | 0 (0.0%) |
| Total (Overall) | 97 (45.8%) | 115 (54.2%) |
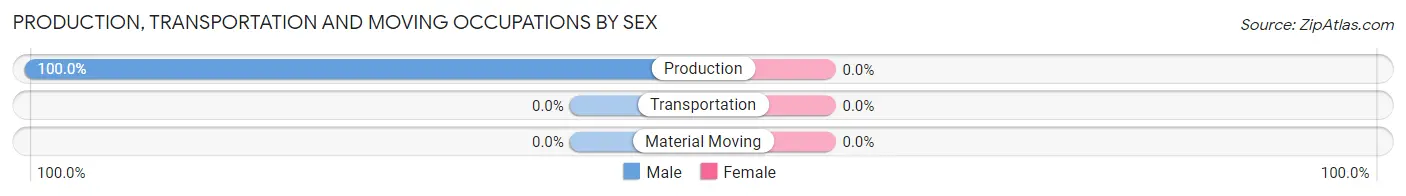
Production, Transportation and Moving Occupations
The most common Production, Transportation and Moving occupations in Convent are , and Production (20 | 9.4%).
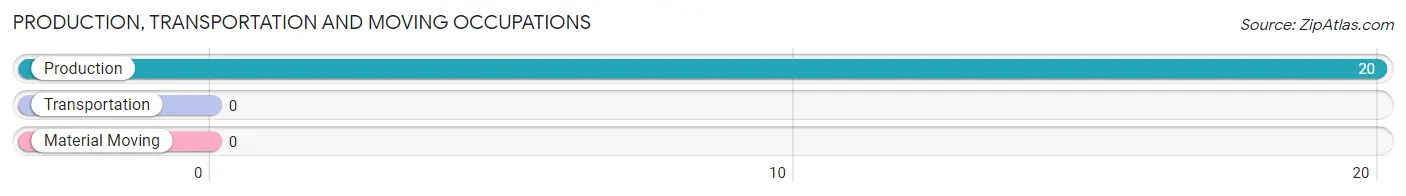
Production, Transportation and Moving Occupations by Sex
| Occupation | Male | Female |
| Production | 20 (100.0%) | 0 (0.0%) |
| Transportation | 0 (0.0%) | 0 (0.0%) |
| Material Moving | 0 (0.0%) | 0 (0.0%) |
| Total (Category) | 20 (100.0%) | 0 (0.0%) |
| Total (Overall) | 97 (45.8%) | 115 (54.2%) |
Employment Industries by Sex in Convent
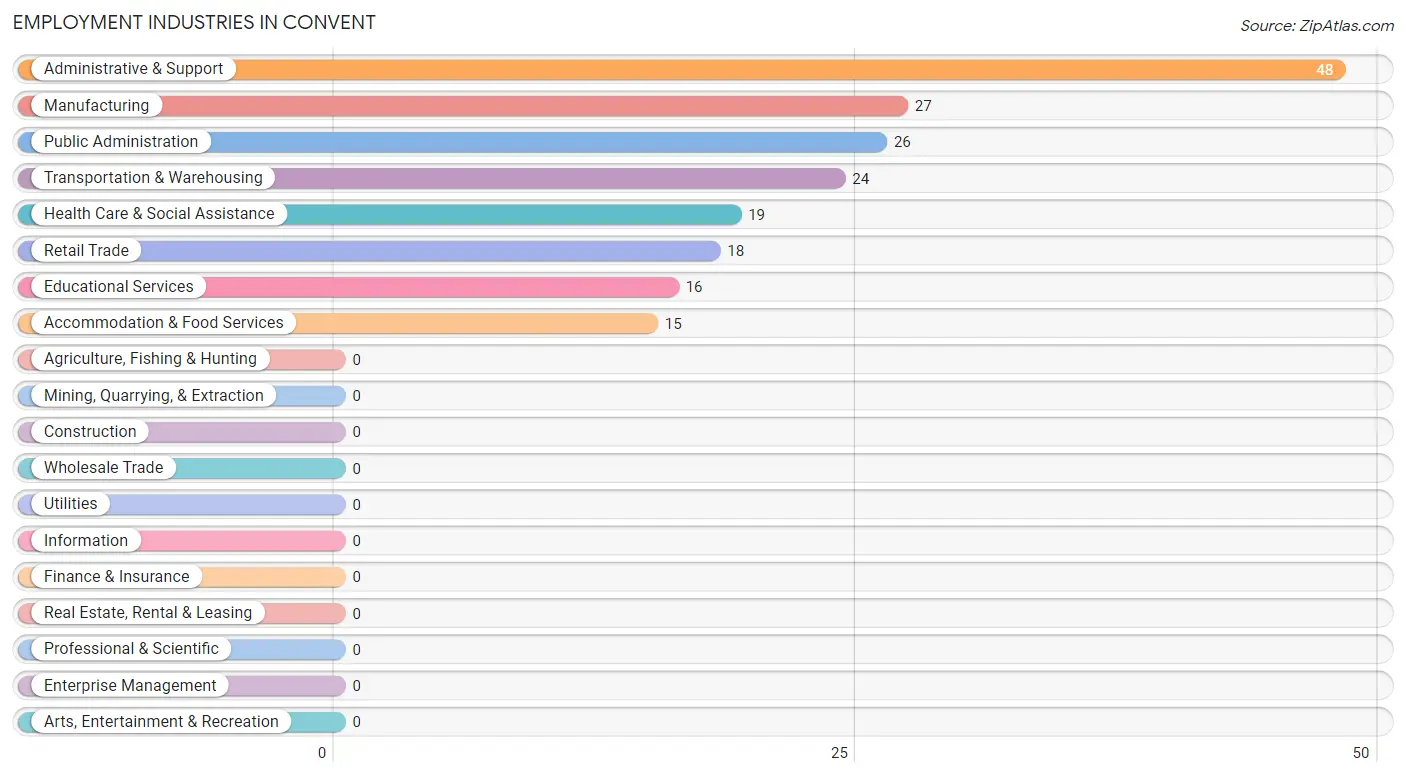
Employment Industries in Convent
The major employment industries in Convent include Administrative & Support (48 | 22.6%), Manufacturing (27 | 12.7%), Public Administration (26 | 12.3%), Transportation & Warehousing (24 | 11.3%), and Health Care & Social Assistance (19 | 9.0%).
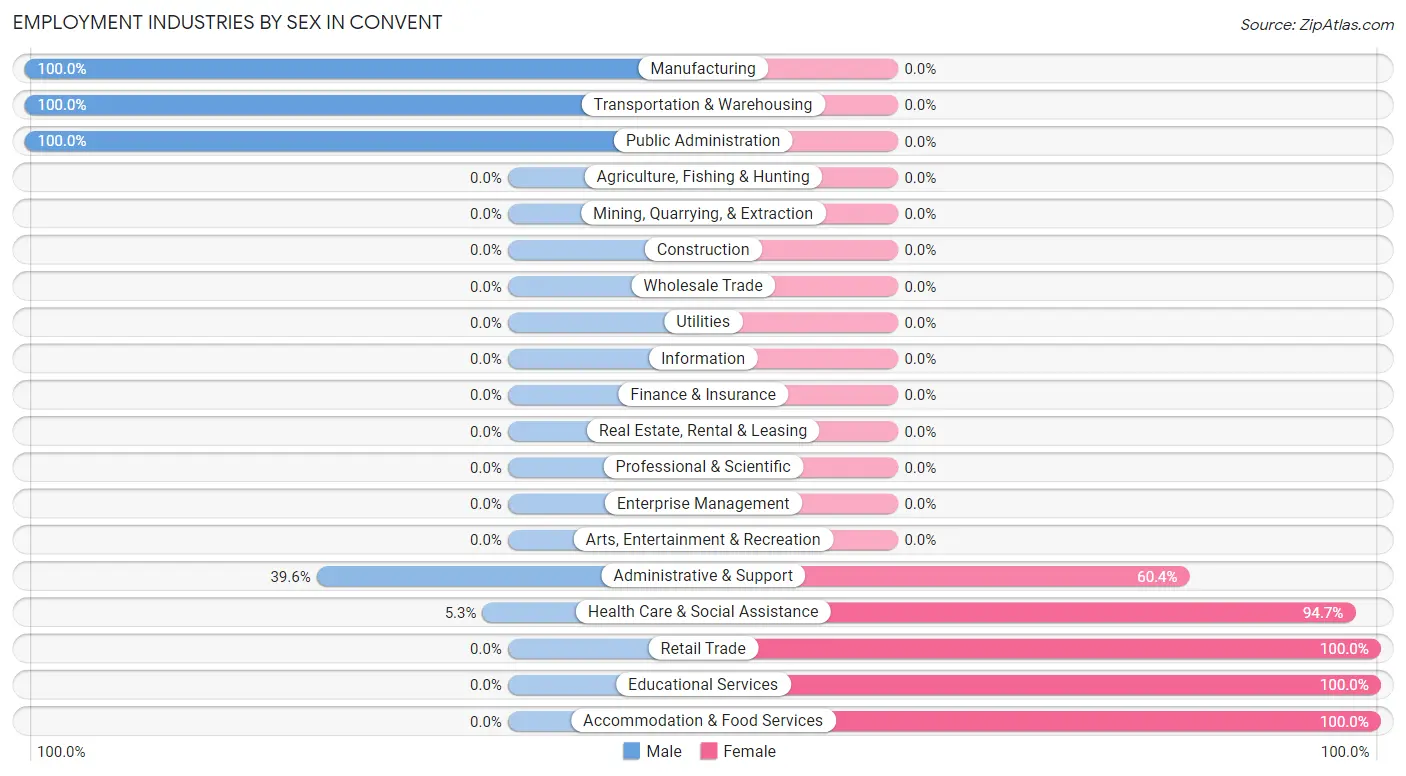
Employment Industries by Sex in Convent
The Convent industries that see more men than women are Manufacturing (100.0%), Transportation & Warehousing (100.0%), and Public Administration (100.0%), whereas the industries that tend to have a higher number of women are Retail Trade (100.0%), Educational Services (100.0%), and Accommodation & Food Services (100.0%).
| Industry | Male | Female |
| Agriculture, Fishing & Hunting | 0 (0.0%) | 0 (0.0%) |
| Mining, Quarrying, & Extraction | 0 (0.0%) | 0 (0.0%) |
| Construction | 0 (0.0%) | 0 (0.0%) |
| Manufacturing | 27 (100.0%) | 0 (0.0%) |
| Wholesale Trade | 0 (0.0%) | 0 (0.0%) |
| Retail Trade | 0 (0.0%) | 18 (100.0%) |
| Transportation & Warehousing | 24 (100.0%) | 0 (0.0%) |
| Utilities | 0 (0.0%) | 0 (0.0%) |
| Information | 0 (0.0%) | 0 (0.0%) |
| Finance & Insurance | 0 (0.0%) | 0 (0.0%) |
| Real Estate, Rental & Leasing | 0 (0.0%) | 0 (0.0%) |
| Professional & Scientific | 0 (0.0%) | 0 (0.0%) |
| Enterprise Management | 0 (0.0%) | 0 (0.0%) |
| Administrative & Support | 19 (39.6%) | 29 (60.4%) |
| Educational Services | 0 (0.0%) | 16 (100.0%) |
| Health Care & Social Assistance | 1 (5.3%) | 18 (94.7%) |
| Arts, Entertainment & Recreation | 0 (0.0%) | 0 (0.0%) |
| Accommodation & Food Services | 0 (0.0%) | 15 (100.0%) |
| Public Administration | 26 (100.0%) | 0 (0.0%) |
| Total | 97 (45.8%) | 115 (54.2%) |
Education in Convent
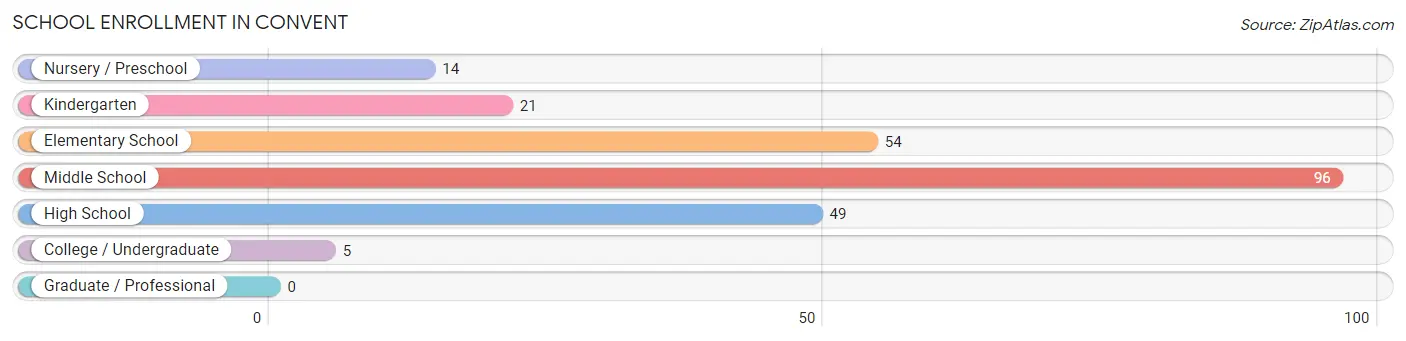
School Enrollment in Convent
The most common levels of schooling among the 239 students in Convent are middle school (96 | 40.2%), elementary school (54 | 22.6%), and high school (49 | 20.5%).
| School Level | # Students | % Students |
| Nursery / Preschool | 14 | 5.9% |
| Kindergarten | 21 | 8.8% |
| Elementary School | 54 | 22.6% |
| Middle School | 96 | 40.2% |
| High School | 49 | 20.5% |
| College / Undergraduate | 5 | 2.1% |
| Graduate / Professional | 0 | 0.0% |
| Total | 239 | 100.0% |
School Enrollment by Age by Funding Source in Convent
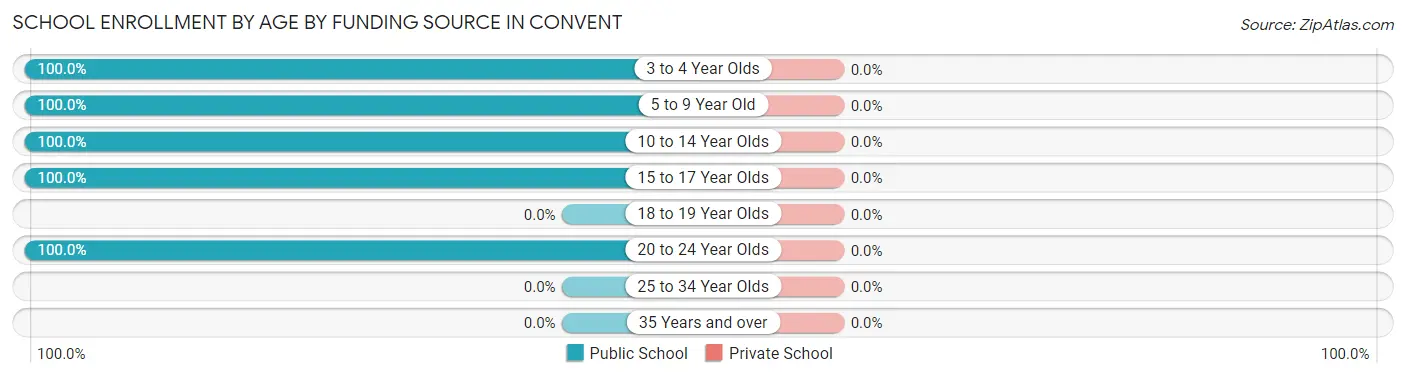
| Age Bracket | Public School | Private School |
| 3 to 4 Year Olds | 35 (100.0%) | 0 (0.0%) |
| 5 to 9 Year Old | 33 (100.0%) | 0 (0.0%) |
| 10 to 14 Year Olds | 117 (100.0%) | 0 (0.0%) |
| 15 to 17 Year Olds | 49 (100.0%) | 0 (0.0%) |
| 18 to 19 Year Olds | 0 (0.0%) | 0 (0.0%) |
| 20 to 24 Year Olds | 5 (100.0%) | 0 (0.0%) |
| 25 to 34 Year Olds | 0 (0.0%) | 0 (0.0%) |
| 35 Years and over | 0 (0.0%) | 0 (0.0%) |
| Total | 239 (100.0%) | 0 (0.0%) |
Educational Attainment by Field of Study in Convent
Education (21 | 42.9%), business (19 | 38.8%), and liberal arts & history (9 | 18.4%) are the most common fields of study among 49 individuals in Convent who have obtained a bachelor's degree or higher.
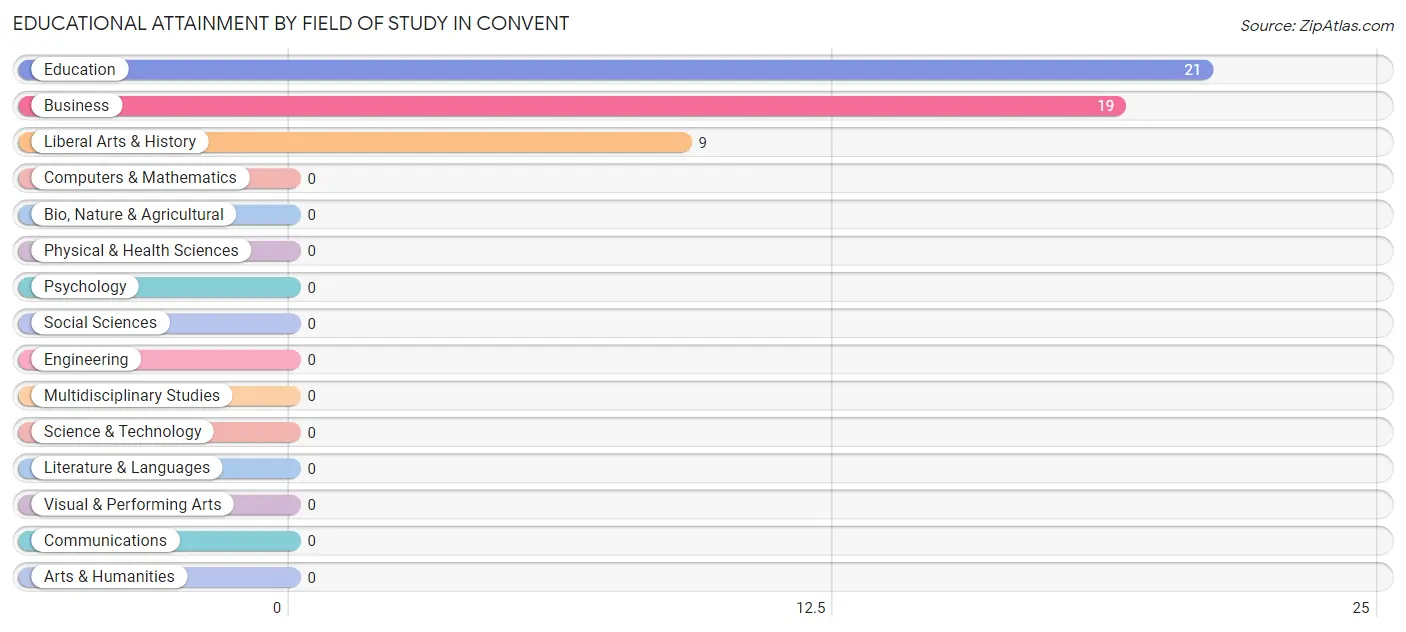
| Field of Study | # Graduates | % Graduates |
| Computers & Mathematics | 0 | 0.0% |
| Bio, Nature & Agricultural | 0 | 0.0% |
| Physical & Health Sciences | 0 | 0.0% |
| Psychology | 0 | 0.0% |
| Social Sciences | 0 | 0.0% |
| Engineering | 0 | 0.0% |
| Multidisciplinary Studies | 0 | 0.0% |
| Science & Technology | 0 | 0.0% |
| Business | 19 | 38.8% |
| Education | 21 | 42.9% |
| Literature & Languages | 0 | 0.0% |
| Liberal Arts & History | 9 | 18.4% |
| Visual & Performing Arts | 0 | 0.0% |
| Communications | 0 | 0.0% |
| Arts & Humanities | 0 | 0.0% |
| Total | 49 | 100.0% |
Transportation & Commute in Convent
Vehicle Availability by Sex in Convent
The most prevalent vehicle ownership categories in Convent are males with 1 vehicle (33, accounting for 34.4%) and females with 1 vehicle (47, making up 28.7%).
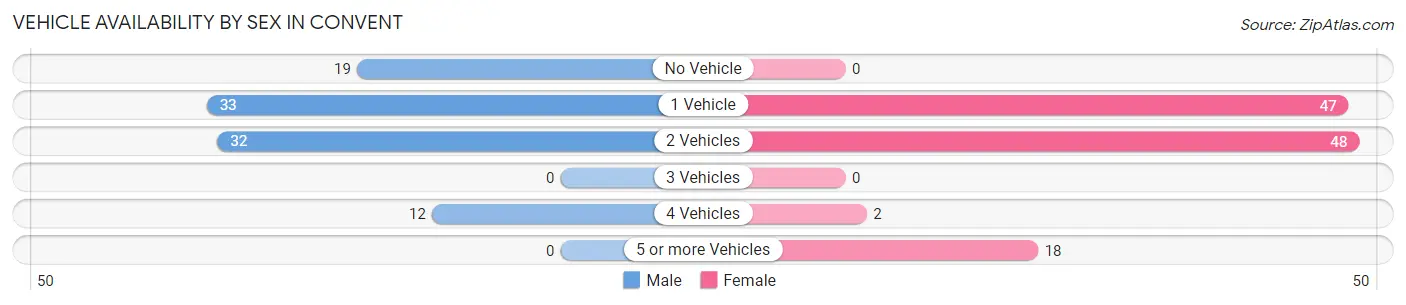
| Vehicles Available | Male | Female |
| No Vehicle | 19 (19.8%) | 0 (0.0%) |
| 1 Vehicle | 33 (34.4%) | 47 (40.9%) |
| 2 Vehicles | 32 (33.3%) | 48 (41.7%) |
| 3 Vehicles | 0 (0.0%) | 0 (0.0%) |
| 4 Vehicles | 12 (12.5%) | 2 (1.7%) |
| 5 or more Vehicles | 0 (0.0%) | 18 (15.7%) |
| Total | 96 (100.0%) | 115 (100.0%) |
Commute Time in Convent
The most frequently occuring commute durations in Convent are 10 to 14 minutes (41 commuters, 19.4%), 25 to 29 minutes (35 commuters, 16.6%), and 30 to 34 minutes (30 commuters, 14.2%).
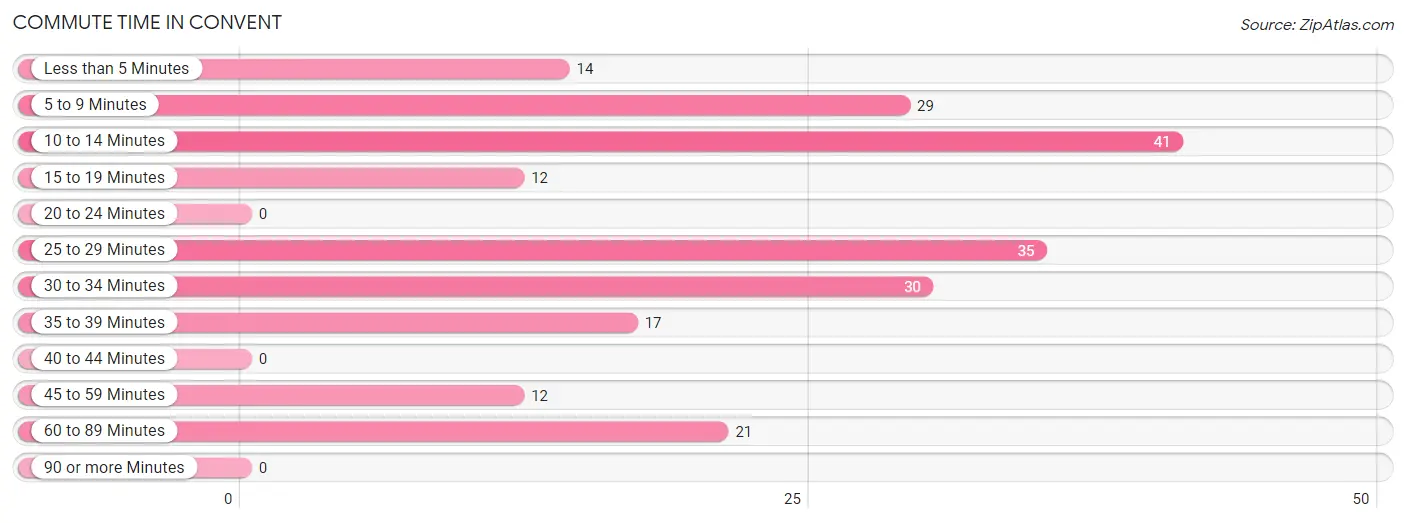
| Commute Time | # Commuters | % Commuters |
| Less than 5 Minutes | 14 | 6.6% |
| 5 to 9 Minutes | 29 | 13.7% |
| 10 to 14 Minutes | 41 | 19.4% |
| 15 to 19 Minutes | 12 | 5.7% |
| 20 to 24 Minutes | 0 | 0.0% |
| 25 to 29 Minutes | 35 | 16.6% |
| 30 to 34 Minutes | 30 | 14.2% |
| 35 to 39 Minutes | 17 | 8.1% |
| 40 to 44 Minutes | 0 | 0.0% |
| 45 to 59 Minutes | 12 | 5.7% |
| 60 to 89 Minutes | 21 | 10.0% |
| 90 or more Minutes | 0 | 0.0% |
Commute Time by Sex in Convent
The most common commute times in Convent are 25 to 29 minutes (20 commuters, 20.8%) for males and 5 to 9 minutes (29 commuters, 25.2%) for females.
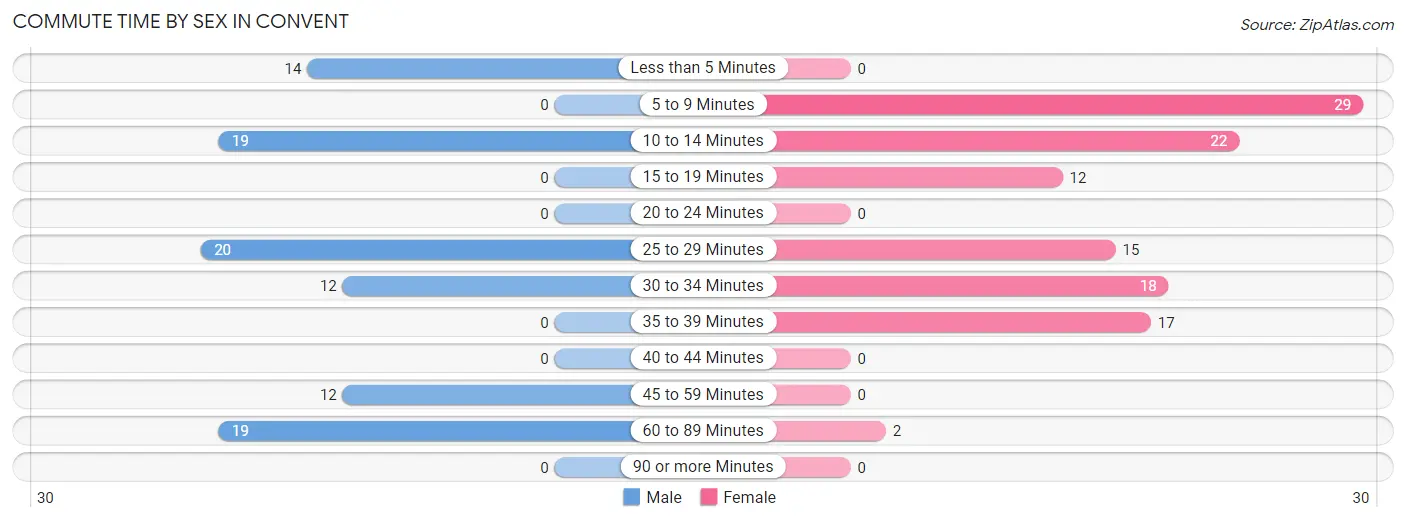
| Commute Time | Male | Female |
| Less than 5 Minutes | 14 (14.6%) | 0 (0.0%) |
| 5 to 9 Minutes | 0 (0.0%) | 29 (25.2%) |
| 10 to 14 Minutes | 19 (19.8%) | 22 (19.1%) |
| 15 to 19 Minutes | 0 (0.0%) | 12 (10.4%) |
| 20 to 24 Minutes | 0 (0.0%) | 0 (0.0%) |
| 25 to 29 Minutes | 20 (20.8%) | 15 (13.0%) |
| 30 to 34 Minutes | 12 (12.5%) | 18 (15.7%) |
| 35 to 39 Minutes | 0 (0.0%) | 17 (14.8%) |
| 40 to 44 Minutes | 0 (0.0%) | 0 (0.0%) |
| 45 to 59 Minutes | 12 (12.5%) | 0 (0.0%) |
| 60 to 89 Minutes | 19 (19.8%) | 2 (1.7%) |
| 90 or more Minutes | 0 (0.0%) | 0 (0.0%) |
Time of Departure to Work by Sex in Convent
The most frequent times of departure to work in Convent are 6:00 AM to 6:29 AM (32, 33.3%) for males and 7:00 AM to 7:29 AM (34, 29.6%) for females.
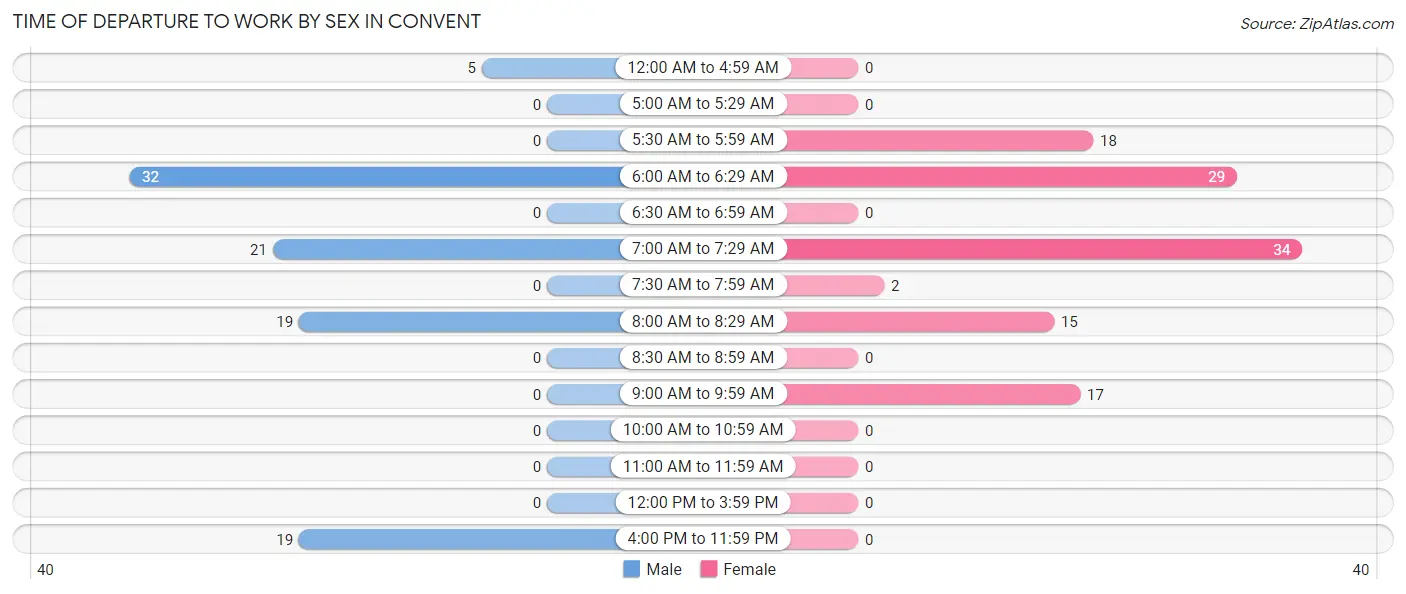
| Time of Departure | Male | Female |
| 12:00 AM to 4:59 AM | 5 (5.2%) | 0 (0.0%) |
| 5:00 AM to 5:29 AM | 0 (0.0%) | 0 (0.0%) |
| 5:30 AM to 5:59 AM | 0 (0.0%) | 18 (15.7%) |
| 6:00 AM to 6:29 AM | 32 (33.3%) | 29 (25.2%) |
| 6:30 AM to 6:59 AM | 0 (0.0%) | 0 (0.0%) |
| 7:00 AM to 7:29 AM | 21 (21.9%) | 34 (29.6%) |
| 7:30 AM to 7:59 AM | 0 (0.0%) | 2 (1.7%) |
| 8:00 AM to 8:29 AM | 19 (19.8%) | 15 (13.0%) |
| 8:30 AM to 8:59 AM | 0 (0.0%) | 0 (0.0%) |
| 9:00 AM to 9:59 AM | 0 (0.0%) | 17 (14.8%) |
| 10:00 AM to 10:59 AM | 0 (0.0%) | 0 (0.0%) |
| 11:00 AM to 11:59 AM | 0 (0.0%) | 0 (0.0%) |
| 12:00 PM to 3:59 PM | 0 (0.0%) | 0 (0.0%) |
| 4:00 PM to 11:59 PM | 19 (19.8%) | 0 (0.0%) |
| Total | 96 (100.0%) | 115 (100.0%) |
Housing Occupancy in Convent
Occupancy by Ownership in Convent
Of the total 191 dwellings in Convent, owner-occupied units account for 160 (83.8%), while renter-occupied units make up 31 (16.2%).
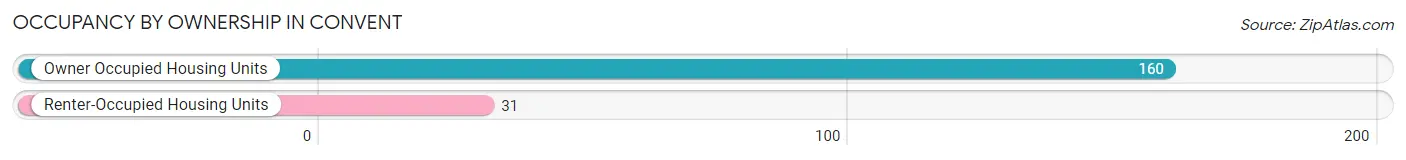
| Occupancy | # Housing Units | % Housing Units |
| Owner Occupied Housing Units | 160 | 83.8% |
| Renter-Occupied Housing Units | 31 | 16.2% |
| Total Occupied Housing Units | 191 | 100.0% |
Occupancy by Household Size in Convent
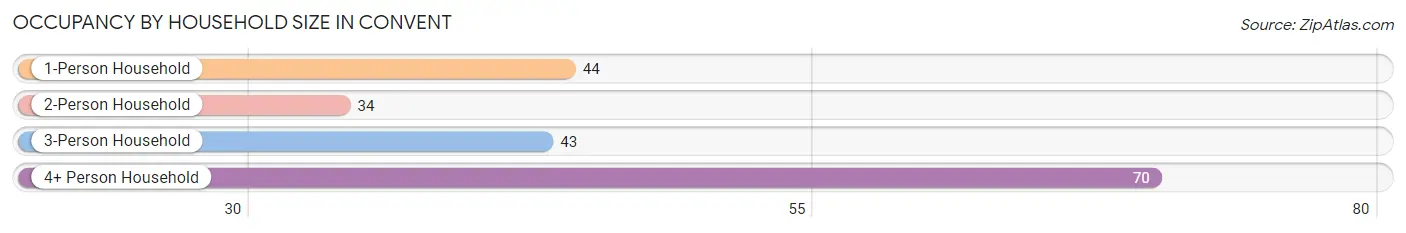
| Household Size | # Housing Units | % Housing Units |
| 1-Person Household | 44 | 23.0% |
| 2-Person Household | 34 | 17.8% |
| 3-Person Household | 43 | 22.5% |
| 4+ Person Household | 70 | 36.6% |
| Total Housing Units | 191 | 100.0% |
Occupancy by Ownership by Household Size in Convent
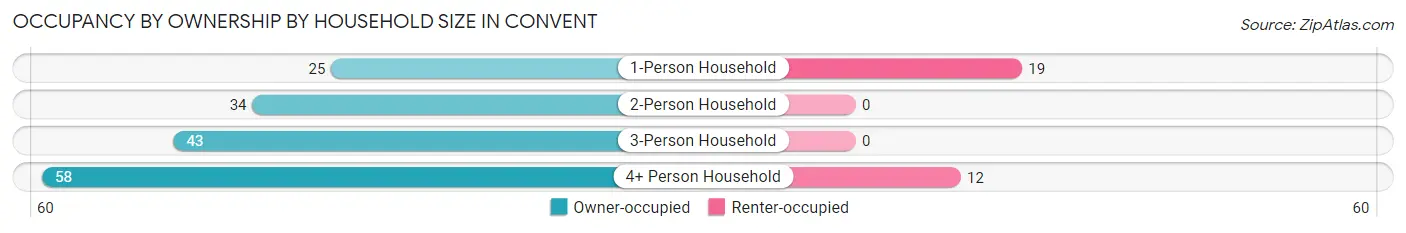
| Household Size | Owner-occupied | Renter-occupied |
| 1-Person Household | 25 (56.8%) | 19 (43.2%) |
| 2-Person Household | 34 (100.0%) | 0 (0.0%) |
| 3-Person Household | 43 (100.0%) | 0 (0.0%) |
| 4+ Person Household | 58 (82.9%) | 12 (17.1%) |
| Total Housing Units | 160 (83.8%) | 31 (16.2%) |
Occupancy by Educational Attainment in Convent
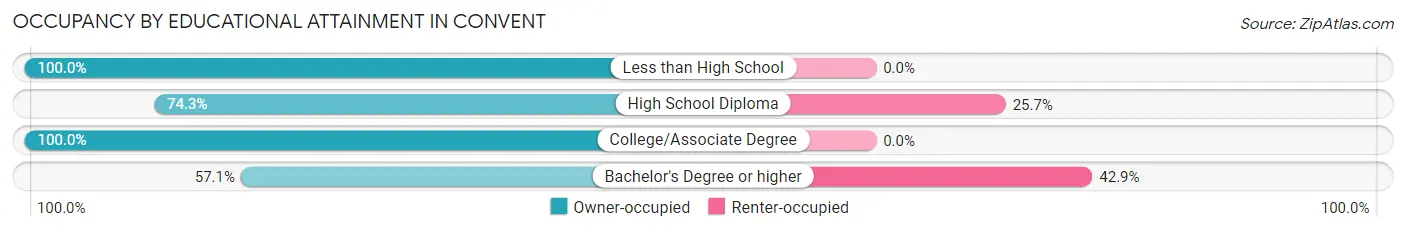
| Household Size | Owner-occupied | Renter-occupied |
| Less than High School | 18 (100.0%) | 0 (0.0%) |
| High School Diploma | 55 (74.3%) | 19 (25.7%) |
| College/Associate Degree | 71 (100.0%) | 0 (0.0%) |
| Bachelor's Degree or higher | 16 (57.1%) | 12 (42.9%) |
Occupancy by Age of Householder in Convent
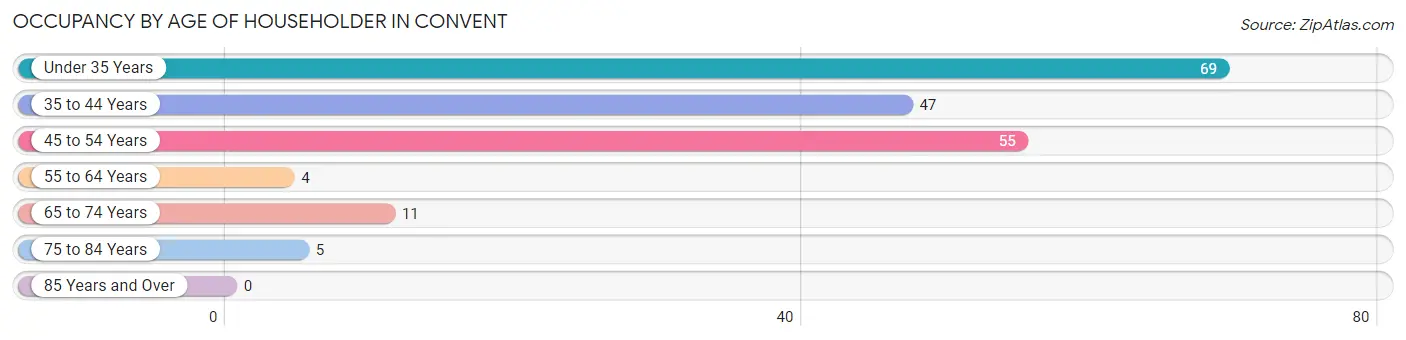
| Age Bracket | # Households | % Households |
| Under 35 Years | 69 | 36.1% |
| 35 to 44 Years | 47 | 24.6% |
| 45 to 54 Years | 55 | 28.8% |
| 55 to 64 Years | 4 | 2.1% |
| 65 to 74 Years | 11 | 5.8% |
| 75 to 84 Years | 5 | 2.6% |
| 85 Years and Over | 0 | 0.0% |
| Total | 191 | 100.0% |
Housing Finances in Convent
Median Income by Occupancy in Convent
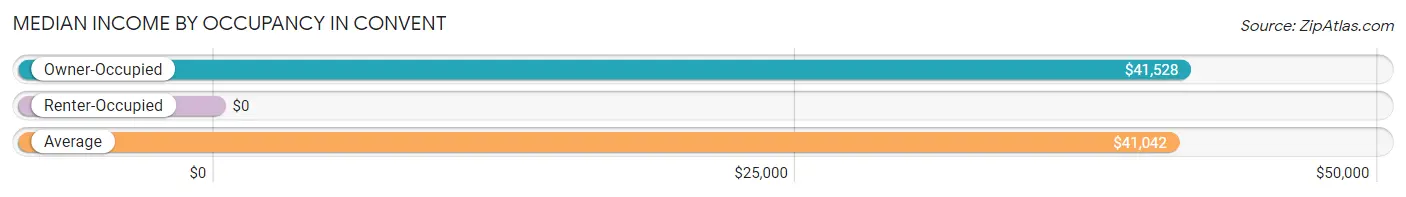
| Occupancy Type | # Households | Median Income |
| Owner-Occupied | 160 (83.8%) | $41,528 |
| Renter-Occupied | 31 (16.2%) | $0 |
| Average | 191 (100.0%) | $41,042 |
Occupancy by Householder Income Bracket in Convent
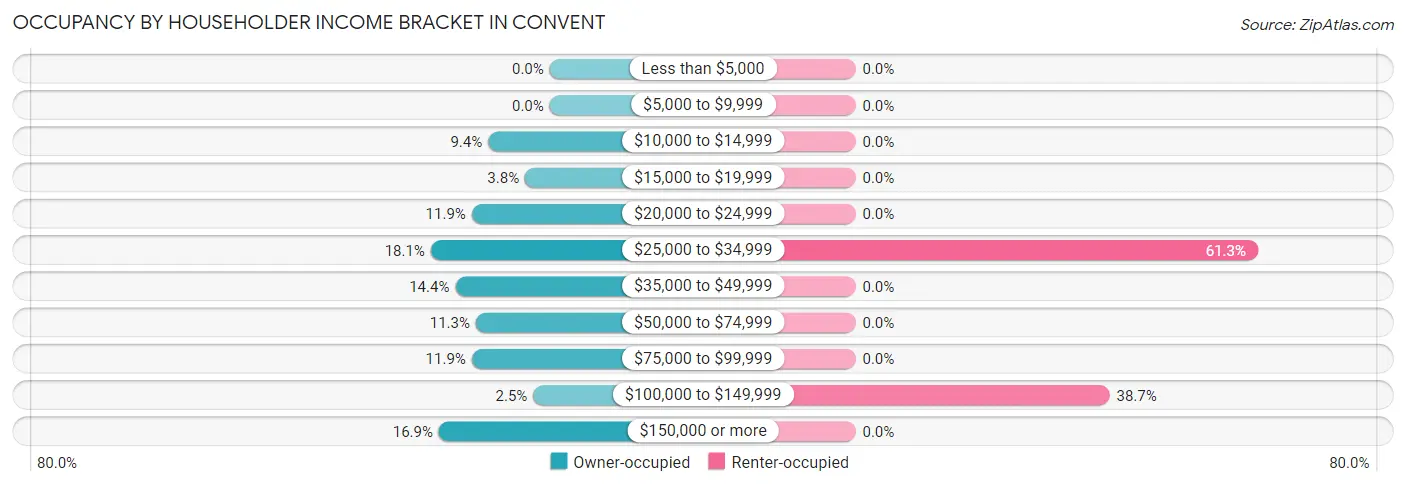
| Income Bracket | Owner-occupied | Renter-occupied |
| Less than $5,000 | 0 (0.0%) | 0 (0.0%) |
| $5,000 to $9,999 | 0 (0.0%) | 0 (0.0%) |
| $10,000 to $14,999 | 15 (9.4%) | 0 (0.0%) |
| $15,000 to $19,999 | 6 (3.7%) | 0 (0.0%) |
| $20,000 to $24,999 | 19 (11.9%) | 0 (0.0%) |
| $25,000 to $34,999 | 29 (18.1%) | 19 (61.3%) |
| $35,000 to $49,999 | 23 (14.4%) | 0 (0.0%) |
| $50,000 to $74,999 | 18 (11.3%) | 0 (0.0%) |
| $75,000 to $99,999 | 19 (11.9%) | 0 (0.0%) |
| $100,000 to $149,999 | 4 (2.5%) | 12 (38.7%) |
| $150,000 or more | 27 (16.9%) | 0 (0.0%) |
| Total | 160 (100.0%) | 31 (100.0%) |
Monthly Housing Cost Tiers in Convent
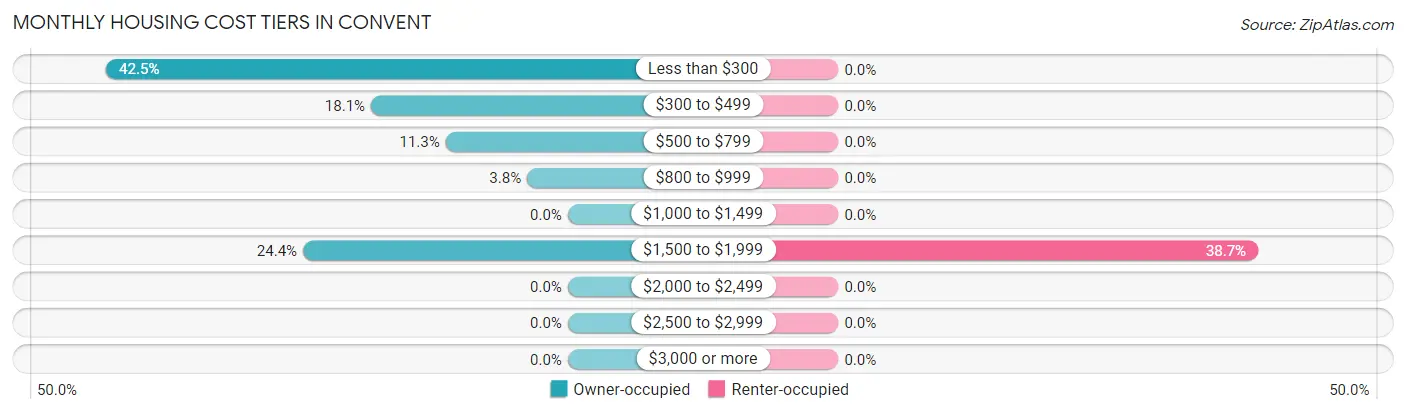
| Monthly Cost | Owner-occupied | Renter-occupied |
| Less than $300 | 68 (42.5%) | 0 (0.0%) |
| $300 to $499 | 29 (18.1%) | 0 (0.0%) |
| $500 to $799 | 18 (11.3%) | 0 (0.0%) |
| $800 to $999 | 6 (3.7%) | 0 (0.0%) |
| $1,000 to $1,499 | 0 (0.0%) | 0 (0.0%) |
| $1,500 to $1,999 | 39 (24.4%) | 12 (38.7%) |
| $2,000 to $2,499 | 0 (0.0%) | 0 (0.0%) |
| $2,500 to $2,999 | 0 (0.0%) | 0 (0.0%) |
| $3,000 or more | 0 (0.0%) | 0 (0.0%) |
| Total | 160 (100.0%) | 31 (100.0%) |
Physical Housing Characteristics in Convent
Housing Structures in Convent
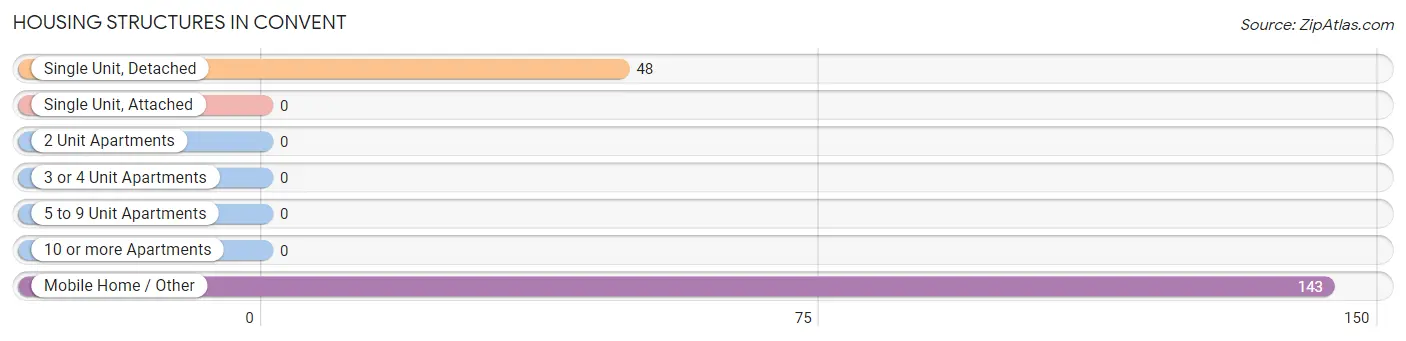
| Structure Type | # Housing Units | % Housing Units |
| Single Unit, Detached | 48 | 25.1% |
| Single Unit, Attached | 0 | 0.0% |
| 2 Unit Apartments | 0 | 0.0% |
| 3 or 4 Unit Apartments | 0 | 0.0% |
| 5 to 9 Unit Apartments | 0 | 0.0% |
| 10 or more Apartments | 0 | 0.0% |
| Mobile Home / Other | 143 | 74.9% |
| Total | 191 | 100.0% |
Housing Structures by Occupancy in Convent
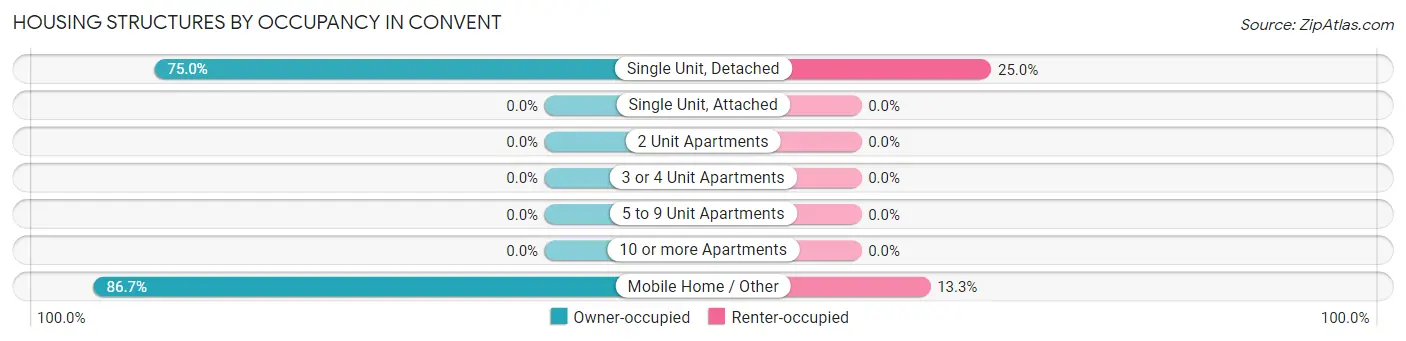
| Structure Type | Owner-occupied | Renter-occupied |
| Single Unit, Detached | 36 (75.0%) | 12 (25.0%) |
| Single Unit, Attached | 0 (0.0%) | 0 (0.0%) |
| 2 Unit Apartments | 0 (0.0%) | 0 (0.0%) |
| 3 or 4 Unit Apartments | 0 (0.0%) | 0 (0.0%) |
| 5 to 9 Unit Apartments | 0 (0.0%) | 0 (0.0%) |
| 10 or more Apartments | 0 (0.0%) | 0 (0.0%) |
| Mobile Home / Other | 124 (86.7%) | 19 (13.3%) |
| Total | 160 (83.8%) | 31 (16.2%) |
Housing Structures by Number of Rooms in Convent
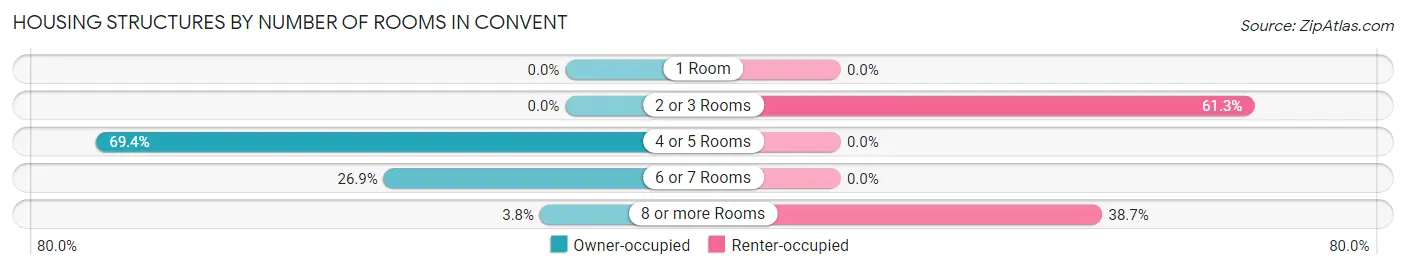
| Number of Rooms | Owner-occupied | Renter-occupied |
| 1 Room | 0 (0.0%) | 0 (0.0%) |
| 2 or 3 Rooms | 0 (0.0%) | 19 (61.3%) |
| 4 or 5 Rooms | 111 (69.4%) | 0 (0.0%) |
| 6 or 7 Rooms | 43 (26.9%) | 0 (0.0%) |
| 8 or more Rooms | 6 (3.7%) | 12 (38.7%) |
| Total | 160 (100.0%) | 31 (100.0%) |
Housing Structure by Heating Type in Convent
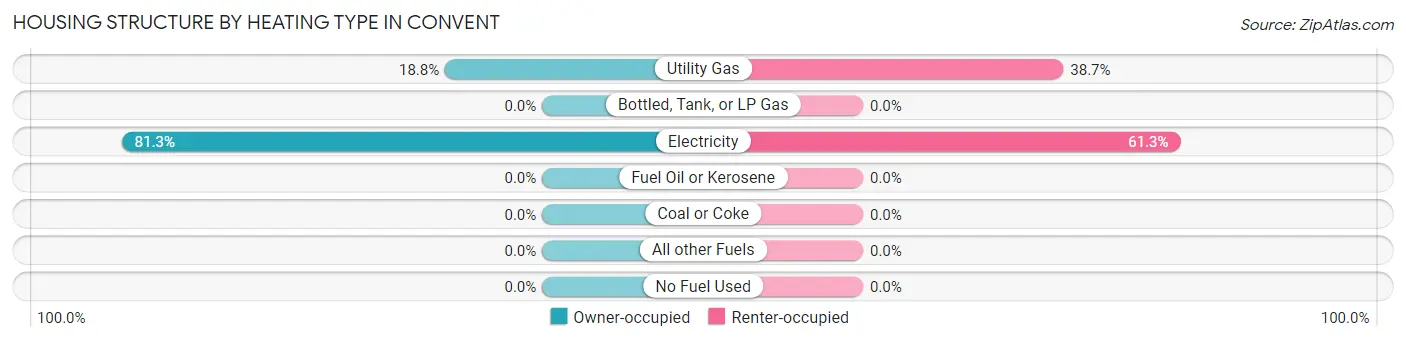
| Heating Type | Owner-occupied | Renter-occupied |
| Utility Gas | 30 (18.8%) | 12 (38.7%) |
| Bottled, Tank, or LP Gas | 0 (0.0%) | 0 (0.0%) |
| Electricity | 130 (81.2%) | 19 (61.3%) |
| Fuel Oil or Kerosene | 0 (0.0%) | 0 (0.0%) |
| Coal or Coke | 0 (0.0%) | 0 (0.0%) |
| All other Fuels | 0 (0.0%) | 0 (0.0%) |
| No Fuel Used | 0 (0.0%) | 0 (0.0%) |
| Total | 160 (100.0%) | 31 (100.0%) |
Household Vehicle Usage in Convent
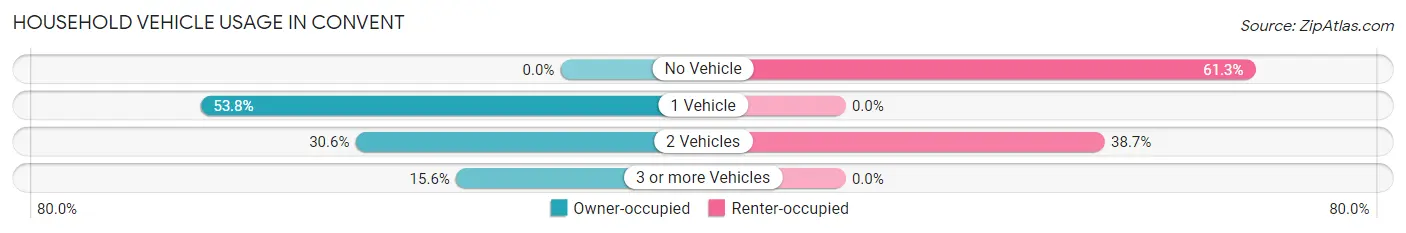
| Vehicles per Household | Owner-occupied | Renter-occupied |
| No Vehicle | 0 (0.0%) | 19 (61.3%) |
| 1 Vehicle | 86 (53.7%) | 0 (0.0%) |
| 2 Vehicles | 49 (30.6%) | 12 (38.7%) |
| 3 or more Vehicles | 25 (15.6%) | 0 (0.0%) |
| Total | 160 (100.0%) | 31 (100.0%) |
Real Estate & Mortgages in Convent
Real Estate and Mortgage Overview in Convent
| Characteristic | Without Mortgage | With Mortgage |
| Housing Units | 115 | 45 |
| Median Property Value | $25,900 | $186,800 |
| Median Household Income | $41,319 | $20 |
| Monthly Housing Costs | $263 | $0 |
| Real Estate Taxes | $199 | $6 |
Property Value by Mortgage Status in Convent
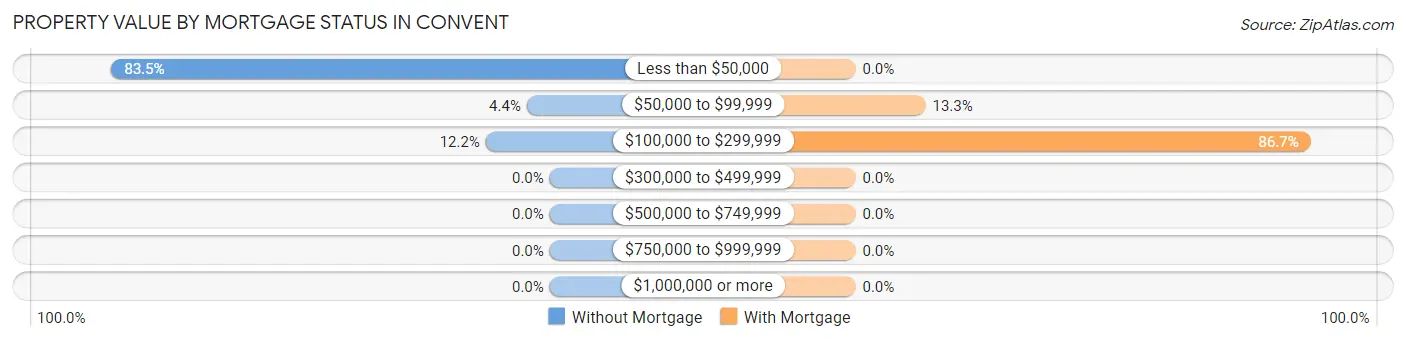
| Property Value | Without Mortgage | With Mortgage |
| Less than $50,000 | 96 (83.5%) | 0 (0.0%) |
| $50,000 to $99,999 | 5 (4.3%) | 6 (13.3%) |
| $100,000 to $299,999 | 14 (12.2%) | 39 (86.7%) |
| $300,000 to $499,999 | 0 (0.0%) | 0 (0.0%) |
| $500,000 to $749,999 | 0 (0.0%) | 0 (0.0%) |
| $750,000 to $999,999 | 0 (0.0%) | 0 (0.0%) |
| $1,000,000 or more | 0 (0.0%) | 0 (0.0%) |
| Total | 115 (100.0%) | 45 (100.0%) |
Household Income by Mortgage Status in Convent
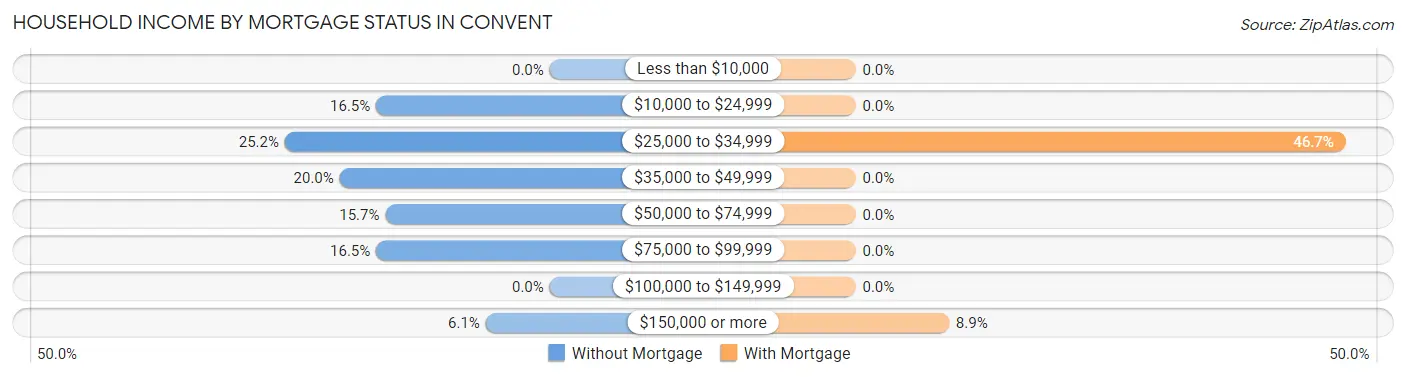
| Household Income | Without Mortgage | With Mortgage |
| Less than $10,000 | 0 (0.0%) | 0 (0.0%) |
| $10,000 to $24,999 | 19 (16.5%) | 0 (0.0%) |
| $25,000 to $34,999 | 29 (25.2%) | 21 (46.7%) |
| $35,000 to $49,999 | 23 (20.0%) | 0 (0.0%) |
| $50,000 to $74,999 | 18 (15.7%) | 0 (0.0%) |
| $75,000 to $99,999 | 19 (16.5%) | 0 (0.0%) |
| $100,000 to $149,999 | 0 (0.0%) | 0 (0.0%) |
| $150,000 or more | 7 (6.1%) | 4 (8.9%) |
| Total | 115 (100.0%) | 45 (100.0%) |
Property Value to Household Income Ratio in Convent
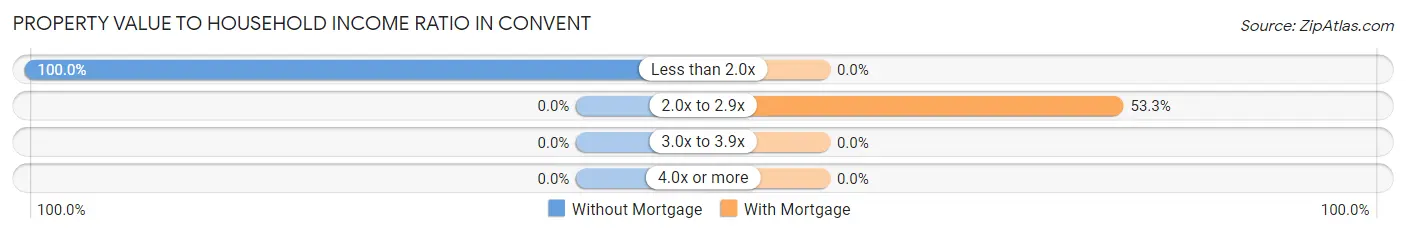
| Value-to-Income Ratio | Without Mortgage | With Mortgage |
| Less than 2.0x | 115 (100.0%) | 0 (0.0%) |
| 2.0x to 2.9x | 0 (0.0%) | 24 (53.3%) |
| 3.0x to 3.9x | 0 (0.0%) | 0 (0.0%) |
| 4.0x or more | 0 (0.0%) | 0 (0.0%) |
| Total | 115 (100.0%) | 45 (100.0%) |
Real Estate Taxes by Mortgage Status in Convent
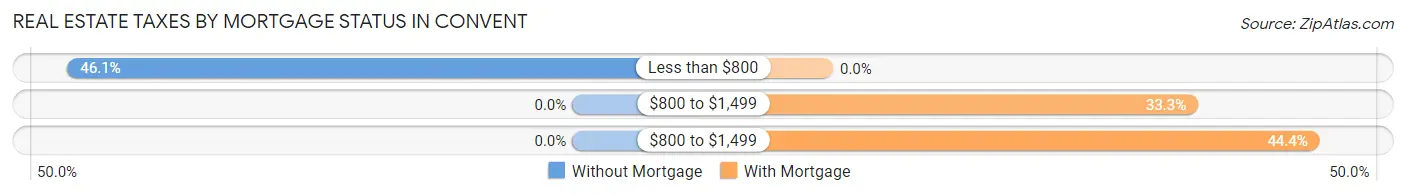
| Property Taxes | Without Mortgage | With Mortgage |
| Less than $800 | 53 (46.1%) | 0 (0.0%) |
| $800 to $1,499 | 0 (0.0%) | 15 (33.3%) |
| $800 to $1,499 | 0 (0.0%) | 20 (44.4%) |
| Total | 115 (100.0%) | 45 (100.0%) |
Health & Disability in Convent
Health Insurance Coverage by Age in Convent
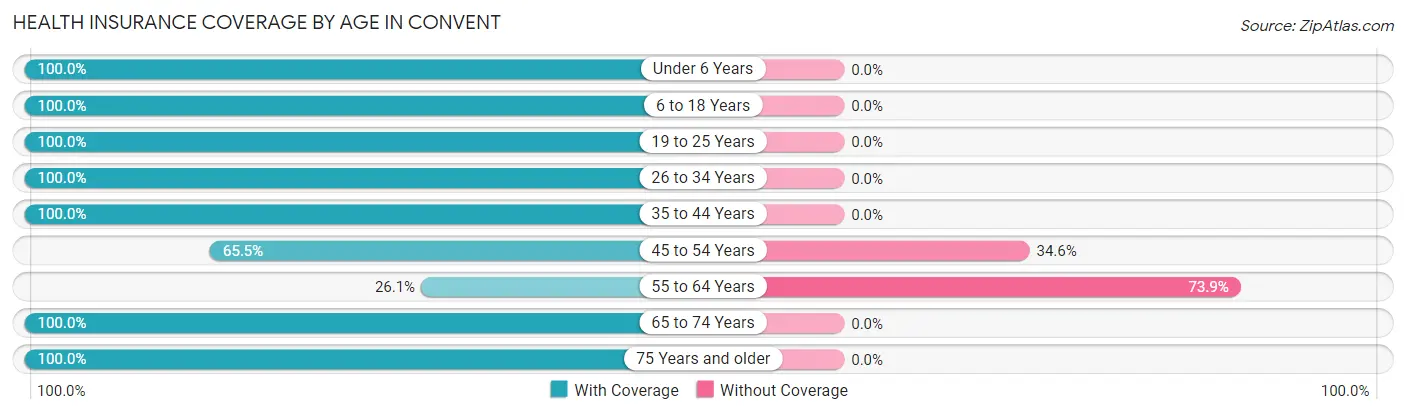
| Age Bracket | With Coverage | Without Coverage |
| Under 6 Years | 35 (100.0%) | 0 (0.0%) |
| 6 to 18 Years | 199 (100.0%) | 0 (0.0%) |
| 19 to 25 Years | 47 (100.0%) | 0 (0.0%) |
| 26 to 34 Years | 61 (100.0%) | 0 (0.0%) |
| 35 to 44 Years | 48 (100.0%) | 0 (0.0%) |
| 45 to 54 Years | 36 (65.4%) | 19 (34.5%) |
| 55 to 64 Years | 6 (26.1%) | 17 (73.9%) |
| 65 to 74 Years | 23 (100.0%) | 0 (0.0%) |
| 75 Years and older | 9 (100.0%) | 0 (0.0%) |
| Total | 464 (92.8%) | 36 (7.2%) |
Health Insurance Coverage by Citizenship Status in Convent
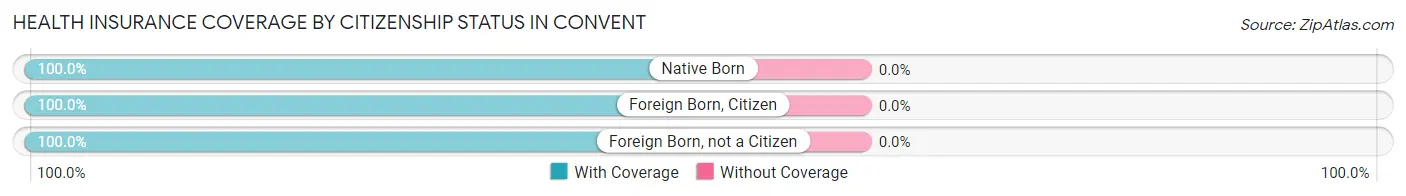
| Citizenship Status | With Coverage | Without Coverage |
| Native Born | 35 (100.0%) | 0 (0.0%) |
| Foreign Born, Citizen | 199 (100.0%) | 0 (0.0%) |
| Foreign Born, not a Citizen | 47 (100.0%) | 0 (0.0%) |
Health Insurance Coverage by Household Income in Convent
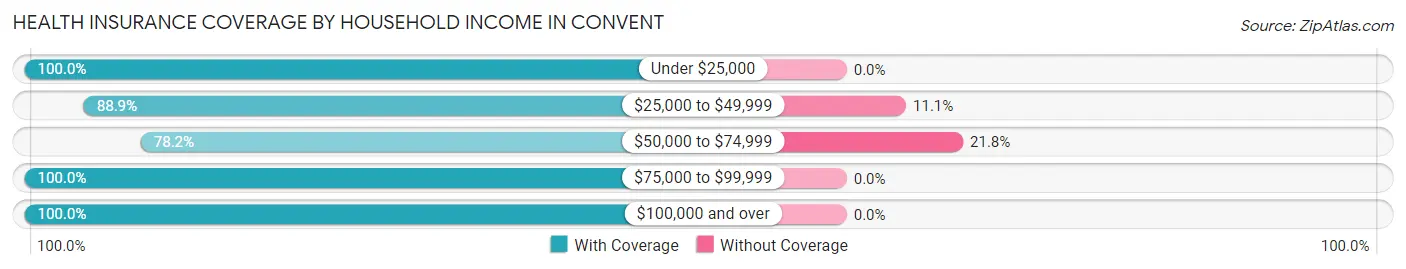
| Household Income | With Coverage | Without Coverage |
| Under $25,000 | 84 (100.0%) | 0 (0.0%) |
| $25,000 to $49,999 | 152 (88.9%) | 19 (11.1%) |
| $50,000 to $74,999 | 61 (78.2%) | 17 (21.8%) |
| $75,000 to $99,999 | 48 (100.0%) | 0 (0.0%) |
| $100,000 and over | 118 (100.0%) | 0 (0.0%) |
Public vs Private Health Insurance Coverage by Age in Convent
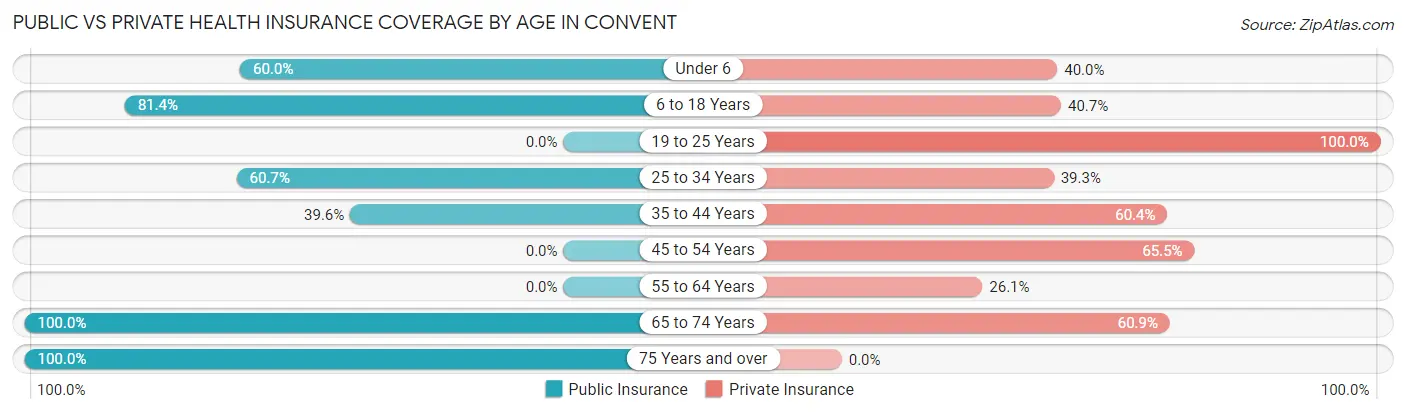
| Age Bracket | Public Insurance | Private Insurance |
| Under 6 | 21 (60.0%) | 14 (40.0%) |
| 6 to 18 Years | 162 (81.4%) | 81 (40.7%) |
| 19 to 25 Years | 0 (0.0%) | 47 (100.0%) |
| 25 to 34 Years | 37 (60.7%) | 24 (39.3%) |
| 35 to 44 Years | 19 (39.6%) | 29 (60.4%) |
| 45 to 54 Years | 0 (0.0%) | 36 (65.4%) |
| 55 to 64 Years | 0 (0.0%) | 6 (26.1%) |
| 65 to 74 Years | 23 (100.0%) | 14 (60.9%) |
| 75 Years and over | 9 (100.0%) | 0 (0.0%) |
| Total | 271 (54.2%) | 251 (50.2%) |
Disability Status by Sex by Age in Convent
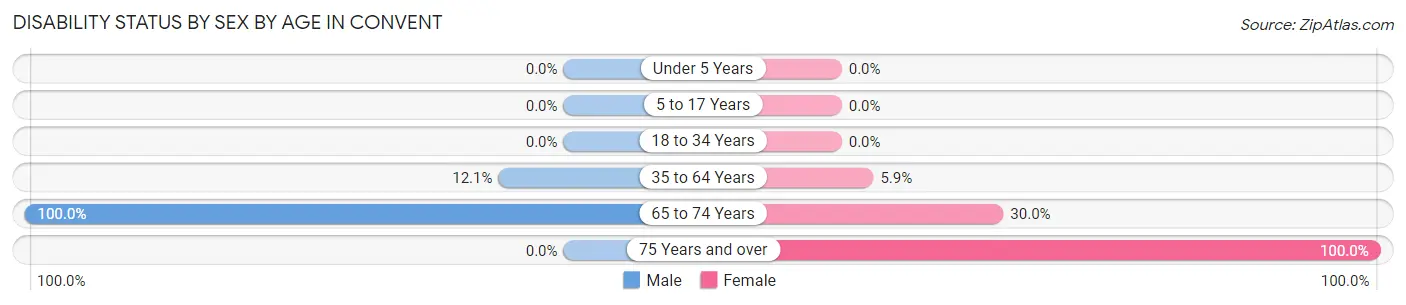
| Age Bracket | Male | Female |
| Under 5 Years | 0 (0.0%) | 0 (0.0%) |
| 5 to 17 Years | 0 (0.0%) | 0 (0.0%) |
| 18 to 34 Years | 0 (0.0%) | 0 (0.0%) |
| 35 to 64 Years | 7 (12.1%) | 4 (5.9%) |
| 65 to 74 Years | 3 (100.0%) | 6 (30.0%) |
| 75 Years and over | 0 (0.0%) | 4 (100.0%) |
Disability Class by Sex by Age in Convent
Disability Class: Hearing Difficulty
| Age Bracket | Male | Female |
| Under 5 Years | 0 (0.0%) | 0 (0.0%) |
| 5 to 17 Years | 0 (0.0%) | 0 (0.0%) |
| 18 to 34 Years | 0 (0.0%) | 0 (0.0%) |
| 35 to 64 Years | 0 (0.0%) | 0 (0.0%) |
| 65 to 74 Years | 0 (0.0%) | 0 (0.0%) |
| 75 Years and over | 0 (0.0%) | 0 (0.0%) |
Disability Class: Vision Difficulty
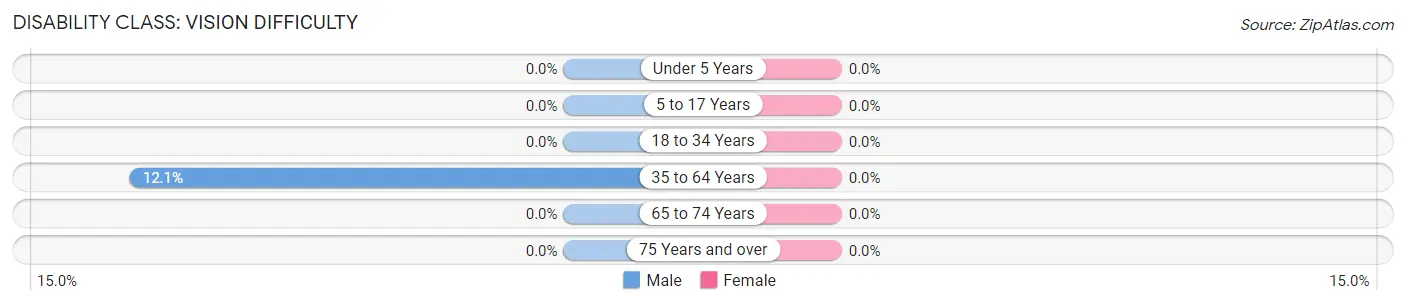
| Age Bracket | Male | Female |
| Under 5 Years | 0 (0.0%) | 0 (0.0%) |
| 5 to 17 Years | 0 (0.0%) | 0 (0.0%) |
| 18 to 34 Years | 0 (0.0%) | 0 (0.0%) |
| 35 to 64 Years | 7 (12.1%) | 0 (0.0%) |
| 65 to 74 Years | 0 (0.0%) | 0 (0.0%) |
| 75 Years and over | 0 (0.0%) | 0 (0.0%) |
Disability Class: Cognitive Difficulty
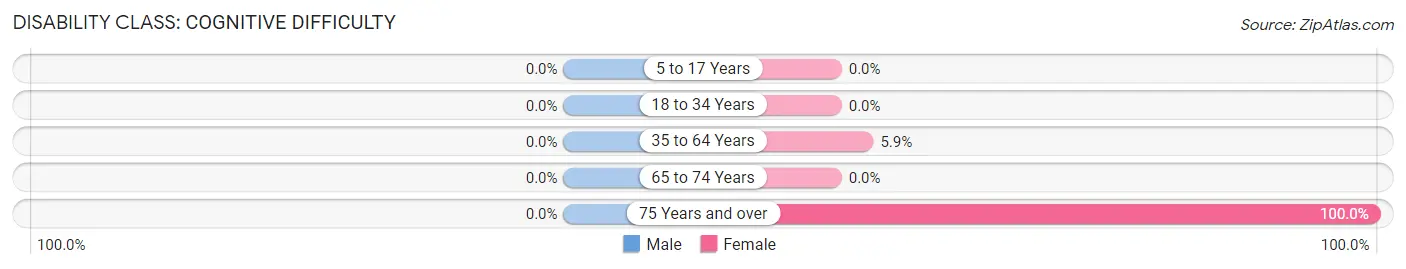
| Age Bracket | Male | Female |
| 5 to 17 Years | 0 (0.0%) | 0 (0.0%) |
| 18 to 34 Years | 0 (0.0%) | 0 (0.0%) |
| 35 to 64 Years | 0 (0.0%) | 4 (5.9%) |
| 65 to 74 Years | 0 (0.0%) | 0 (0.0%) |
| 75 Years and over | 0 (0.0%) | 4 (100.0%) |
Disability Class: Ambulatory Difficulty
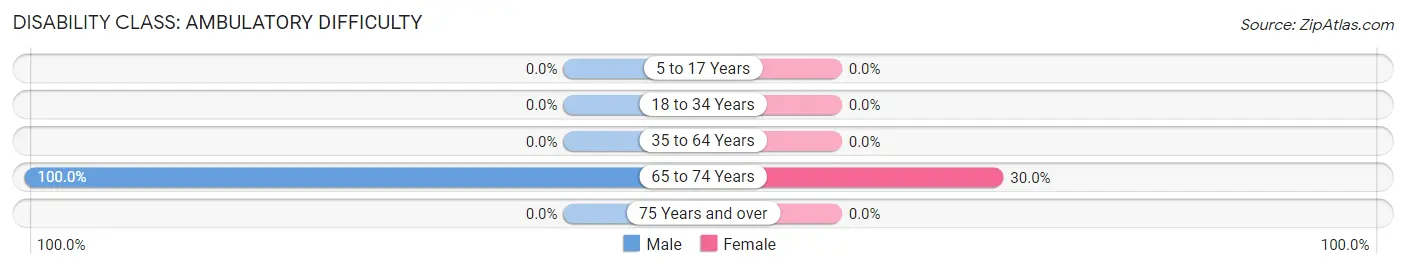
| Age Bracket | Male | Female |
| 5 to 17 Years | 0 (0.0%) | 0 (0.0%) |
| 18 to 34 Years | 0 (0.0%) | 0 (0.0%) |
| 35 to 64 Years | 0 (0.0%) | 0 (0.0%) |
| 65 to 74 Years | 3 (100.0%) | 6 (30.0%) |
| 75 Years and over | 0 (0.0%) | 0 (0.0%) |
Disability Class: Self-Care Difficulty
| Age Bracket | Male | Female |
| 5 to 17 Years | 0 (0.0%) | 0 (0.0%) |
| 18 to 34 Years | 0 (0.0%) | 0 (0.0%) |
| 35 to 64 Years | 0 (0.0%) | 0 (0.0%) |
| 65 to 74 Years | 0 (0.0%) | 0 (0.0%) |
| 75 Years and over | 0 (0.0%) | 0 (0.0%) |
Technology Access in Convent
Computing Device Access in Convent
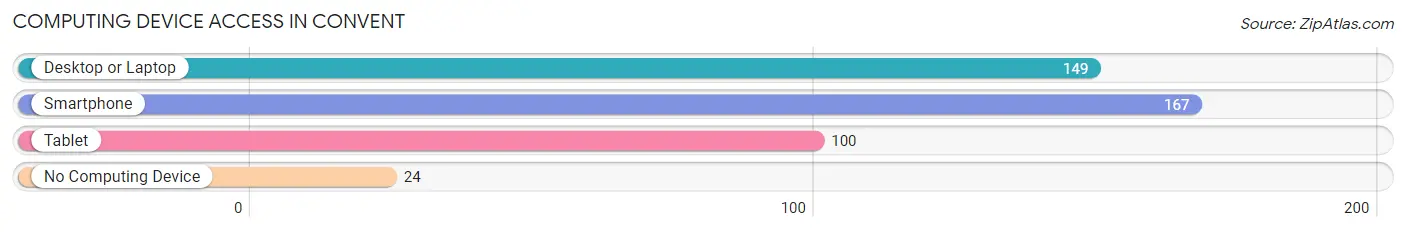
| Device Type | # Households | % Households |
| Desktop or Laptop | 149 | 78.0% |
| Smartphone | 167 | 87.4% |
| Tablet | 100 | 52.4% |
| No Computing Device | 24 | 12.6% |
| Total | 191 | 100.0% |
Internet Access in Convent
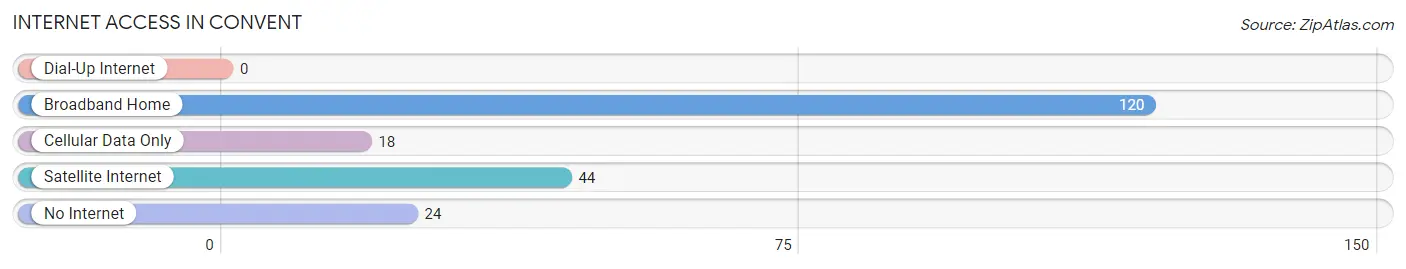
| Internet Type | # Households | % Households |
| Dial-Up Internet | 0 | 0.0% |
| Broadband Home | 120 | 62.8% |
| Cellular Data Only | 18 | 9.4% |
| Satellite Internet | 44 | 23.0% |
| No Internet | 24 | 12.6% |
| Total | 191 | 100.0% |
Convent Summary
Convent is a small town located in St. James Parish, Louisiana. It is situated on the banks of the Mississippi River, approximately 25 miles west of New Orleans. The town has a population of 1,845 people, according to the 2010 census.
Geography
Convent is located in the southeastern corner of St. James Parish, Louisiana. It is situated on the banks of the Mississippi River, approximately 25 miles west of New Orleans. The town is bordered by the towns of Gramercy, Lutcher, and Paulina. The town is located in a rural area, with the nearest major city being Baton Rouge, which is located approximately 40 miles to the north.
The town is situated on a flat plain, with the Mississippi River to the east and the Atchafalaya River to the west. The town is surrounded by agricultural land, with sugar cane being the primary crop. The town is also home to several small lakes, which provide recreational opportunities for the residents.
Economy
The economy of Convent is largely based on agriculture. The town is home to several sugar cane farms, which produce sugar cane for the local market. The town is also home to several small businesses, including a grocery store, a hardware store, and a restaurant.
The town is also home to a number of manufacturing companies, including a paper mill and a chemical plant. These companies provide employment opportunities for the residents of Convent.
Demographics
According to the 2010 census, the population of Convent was 1,845 people. The town is predominantly white, with the majority of the population being of French descent. The town also has a small African American population, as well as a small Hispanic population.
The median household income in Convent is $37,000, which is slightly lower than the national average. The town has a poverty rate of 17.3%, which is slightly higher than the national average.
History
Convent was founded in 1820 by French settlers. The town was named after the nearby Convent of the Sacred Heart, which was established in 1817. The town was originally a small farming community, with the primary crop being sugar cane.
In the late 19th century, the town began to grow as the railroad was built through the area. This allowed for the transportation of goods and people to and from the town. The town also began to attract new businesses, including a paper mill and a chemical plant.
In the early 20th century, the town began to decline as the railroad was abandoned and the businesses began to close. The town was revitalized in the late 20th century, as new businesses began to move into the area. The town is now home to several small businesses, as well as a number of manufacturing companies.
Common Questions
What is the Total Population of Convent?
Total Population of Convent is 552.
What is the Total Male Population of Convent?
Total Male Population of Convent is 312.
What is the Total Female Population of Convent?
Total Female Population of Convent is 240.
What is the Ratio of Males per 100 Females in Convent?
There are 130.00 Males per 100 Females in Convent.
What is the Ratio of Females per 100 Males in Convent?
There are 76.92 Females per 100 Males in Convent.
What is the Median Population Age in Convent?
Median Population Age in Convent is 24.2 Years.
What is the Average Family Size in Convent
Average Family Size in Convent is 3.0 People.
What is the Average Household Size in Convent
Average Household Size in Convent is 2.6 People.
What is Per Capita Income in Convent?
Per Capita income in Convent is $24,783.
What is the Median Family Income in Convent?
Median Family Income in Convent is $48,403.
What is the Median Household income in Convent?
Median Household Income in Convent is $41,042.
What is Income or Wage Gap in Convent?
Income or Wage Gap in Convent is 37.6%.
Women in Convent earn 62.4 cents for every dollar earned by a man.
What is Inequality or Gini Index in Convent?
Inequality or Gini Index in Convent is 0.43.
How Large is the Labor Force in Convent?
There are 212 People in the Labor Forcein in Convent.
What is the Percentage of People in the Labor Force in Convent?
57.8% of People are in the Labor Force in Convent.