Columbia, LA Map & Demographics
Columbia Map
Columbia Overview
$26,097
PER CAPITA INCOME
$79,625
AVG FAMILY INCOME
$53,750
AVG HOUSEHOLD INCOME
0.45
INEQUALITY / GINI INDEX
341
TOTAL POPULATION
174
MALE POPULATION
167
FEMALE POPULATION
104.19
MALES / 100 FEMALES
95.98
FEMALES / 100 MALES
33.8
MEDIAN AGE
3.2
AVG FAMILY SIZE
2.7
AVG HOUSEHOLD SIZE
124
LABOR FORCE [ PEOPLE ]
48.1%
PERCENT IN LABOR FORCE
6.5%
UNEMPLOYMENT RATE
Columbia Zip Codes
Columbia Area Codes
Income in Columbia
Income Overview in Columbia
Per Capita Income in Columbia is $26,097, while median incomes of families and households are $79,625 and $53,750 respectively.
| Characteristic | Number | Measure |
| Per Capita Income | 341 | $26,097 |
| Median Family Income | 83 | $79,625 |
| Mean Family Income | 83 | $91,292 |
| Median Household Income | 116 | $53,750 |
| Mean Household Income | 116 | $76,152 |
| Income Deficit | 83 | $0 |
| Wage / Income Gap (%) | 341 | 0.00% |
| Wage / Income Gap ($) | 341 | 100.00¢ per $1 |
| Gini / Inequality Index | 341 | 0.45 |
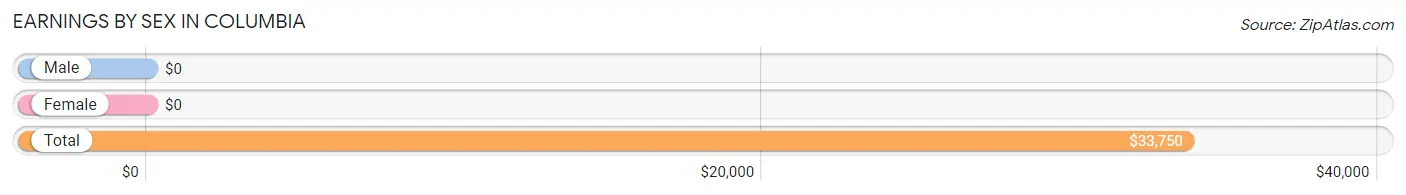
Earnings by Sex in Columbia
| Sex | Number | Average Earnings |
| Male | 59 (42.1%) | $0 |
| Female | 81 (57.9%) | $0 |
| Total | 140 (100.0%) | $33,750 |
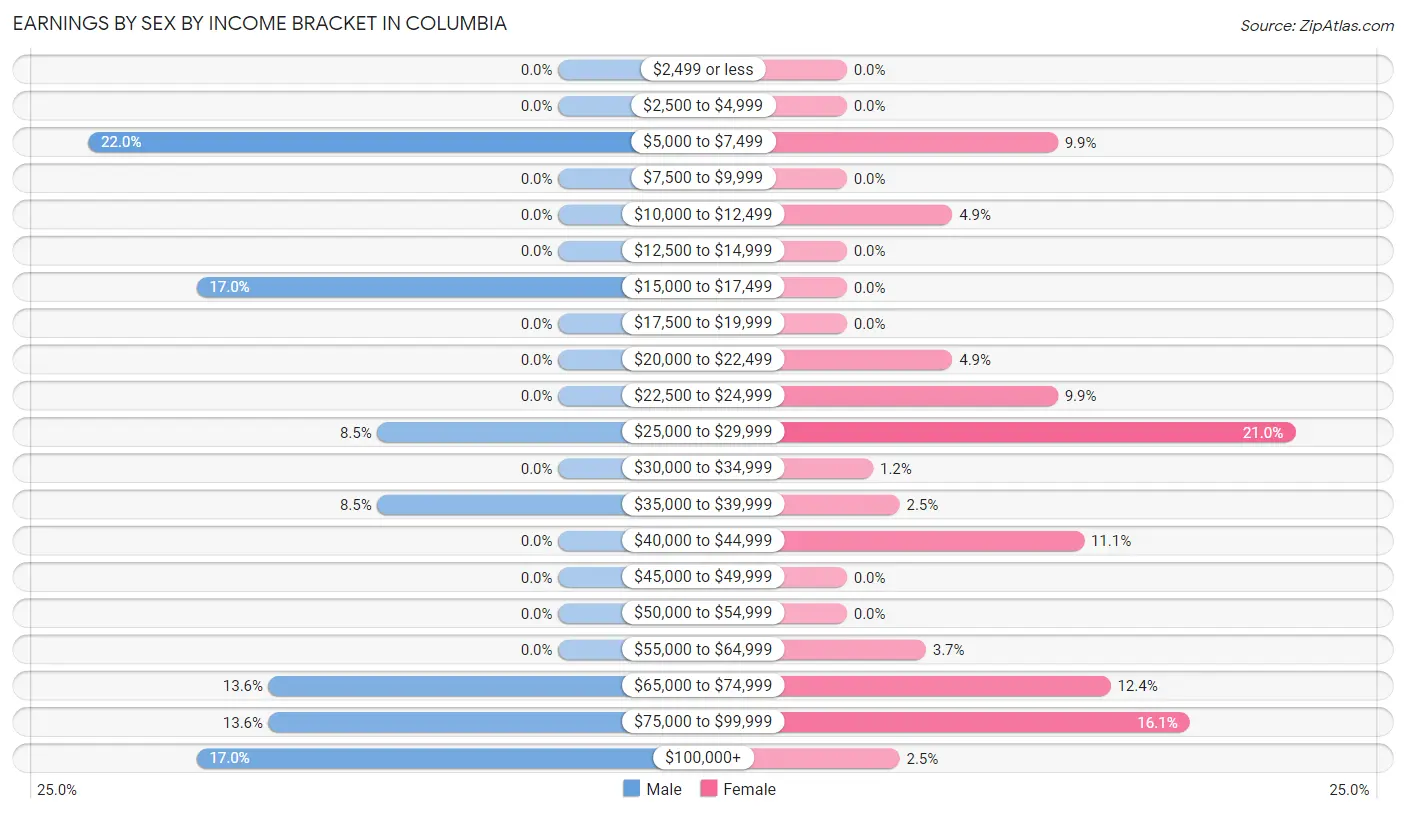
Earnings by Sex by Income Bracket in Columbia
The most common earnings brackets in Columbia are $5,000 to $7,499 for men (13 | 22.0%) and $25,000 to $29,999 for women (17 | 21.0%).
| Income | Male | Female |
| $2,499 or less | 0 (0.0%) | 0 (0.0%) |
| $2,500 to $4,999 | 0 (0.0%) | 0 (0.0%) |
| $5,000 to $7,499 | 13 (22.0%) | 8 (9.9%) |
| $7,500 to $9,999 | 0 (0.0%) | 0 (0.0%) |
| $10,000 to $12,499 | 0 (0.0%) | 4 (4.9%) |
| $12,500 to $14,999 | 0 (0.0%) | 0 (0.0%) |
| $15,000 to $17,499 | 10 (17.0%) | 0 (0.0%) |
| $17,500 to $19,999 | 0 (0.0%) | 0 (0.0%) |
| $20,000 to $22,499 | 0 (0.0%) | 4 (4.9%) |
| $22,500 to $24,999 | 0 (0.0%) | 8 (9.9%) |
| $25,000 to $29,999 | 5 (8.5%) | 17 (21.0%) |
| $30,000 to $34,999 | 0 (0.0%) | 1 (1.2%) |
| $35,000 to $39,999 | 5 (8.5%) | 2 (2.5%) |
| $40,000 to $44,999 | 0 (0.0%) | 9 (11.1%) |
| $45,000 to $49,999 | 0 (0.0%) | 0 (0.0%) |
| $50,000 to $54,999 | 0 (0.0%) | 0 (0.0%) |
| $55,000 to $64,999 | 0 (0.0%) | 3 (3.7%) |
| $65,000 to $74,999 | 8 (13.6%) | 10 (12.3%) |
| $75,000 to $99,999 | 8 (13.6%) | 13 (16.1%) |
| $100,000+ | 10 (17.0%) | 2 (2.5%) |
| Total | 59 (100.0%) | 81 (100.0%) |
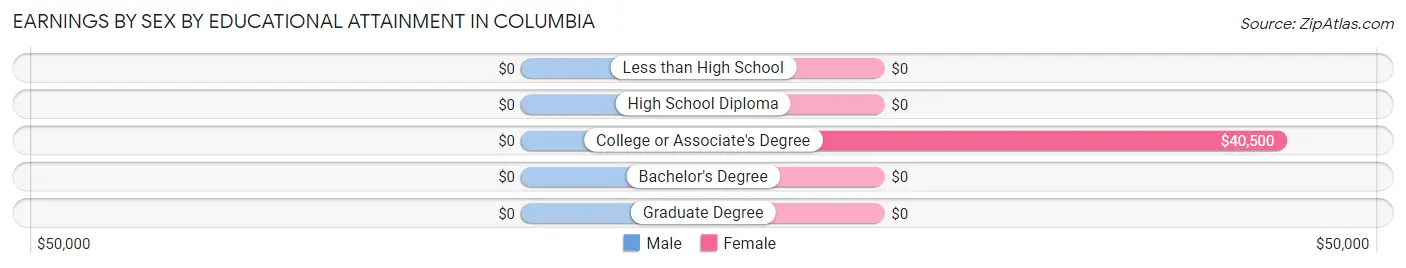
Earnings by Sex by Educational Attainment in Columbia
| Educational Attainment | Male Income | Female Income |
| Less than High School | - | - |
| High School Diploma | - | - |
| College or Associate's Degree | - | - |
| Bachelor's Degree | - | - |
| Graduate Degree | - | - |
| Total | - | - |
Family Income in Columbia
Family Income Brackets in Columbia
According to the Columbia family income data, there are 27 families falling into the $75,000 to $99,999 income range, which is the most common income bracket and makes up 32.5% of all families.
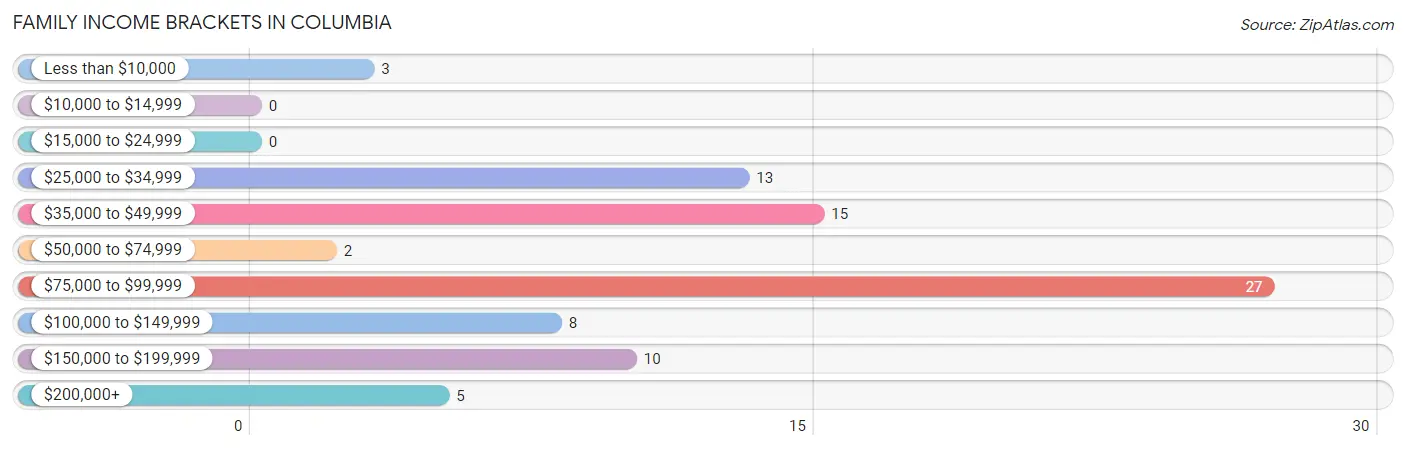
| Income Bracket | # Families | % Families |
| Less than $10,000 | 3 | 3.6% |
| $10,000 to $14,999 | 0 | 0.0% |
| $15,000 to $24,999 | 0 | 0.0% |
| $25,000 to $34,999 | 13 | 15.7% |
| $35,000 to $49,999 | 15 | 18.1% |
| $50,000 to $74,999 | 2 | 2.4% |
| $75,000 to $99,999 | 27 | 32.5% |
| $100,000 to $149,999 | 8 | 9.6% |
| $150,000 to $199,999 | 10 | 12.0% |
| $200,000+ | 5 | 6.0% |
Family Income by Famaliy Size in Columbia
2-person families (45 | 54.2%) account for the highest median family income in Columbia with $99,063 per family, while 2-person families (45 | 54.2%) have the highest median income of $49,532 per family member.
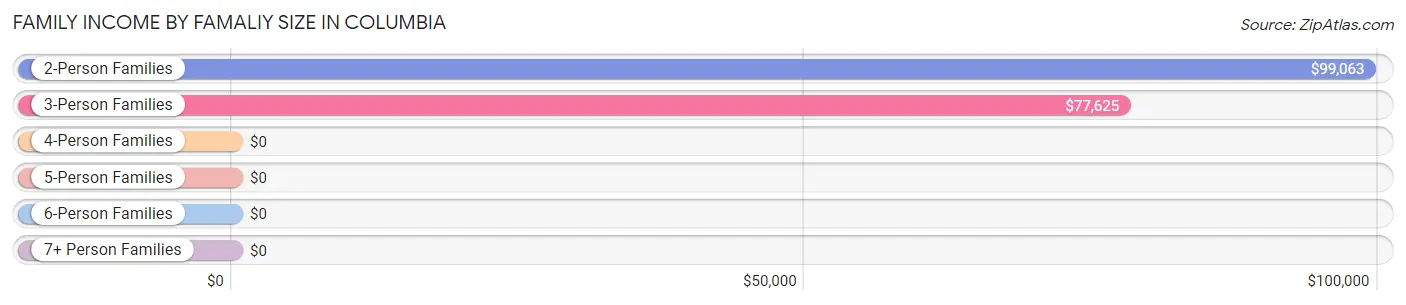
| Income Bracket | # Families | Median Income |
| 2-Person Families | 45 (54.2%) | $99,063 |
| 3-Person Families | 29 (34.9%) | $77,625 |
| 4-Person Families | 5 (6.0%) | $0 |
| 5-Person Families | 1 (1.2%) | $0 |
| 6-Person Families | 3 (3.6%) | $0 |
| 7+ Person Families | 0 (0.0%) | $0 |
| Total | 83 (100.0%) | $79,625 |
Family Income by Number of Earners in Columbia
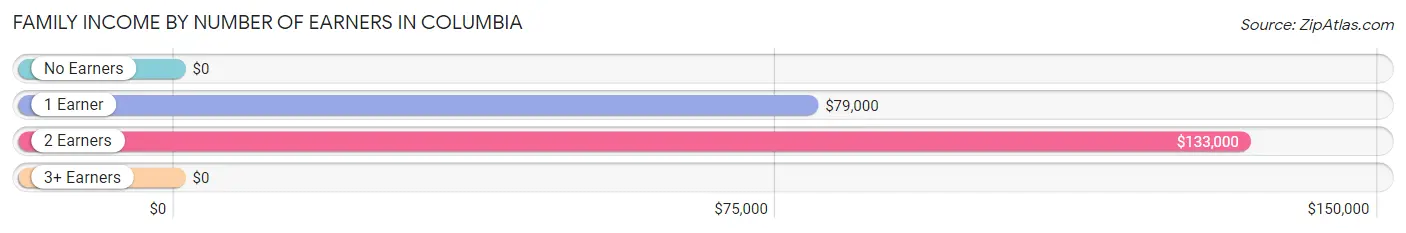
| Number of Earners | # Families | Median Income |
| No Earners | 11 (13.3%) | $0 |
| 1 Earner | 46 (55.4%) | $79,000 |
| 2 Earners | 26 (31.3%) | $133,000 |
| 3+ Earners | 0 (0.0%) | $0 |
| Total | 83 (100.0%) | $79,625 |
Household Income in Columbia
Household Income Brackets in Columbia
With 27 households falling in the category, the $75,000 to $99,999 income range is the most frequent in Columbia, accounting for 23.3% of all households. In contrast, only 1 households (0.9%) fall into the $10,000 to $14,999 income bracket, making it the least populous group.
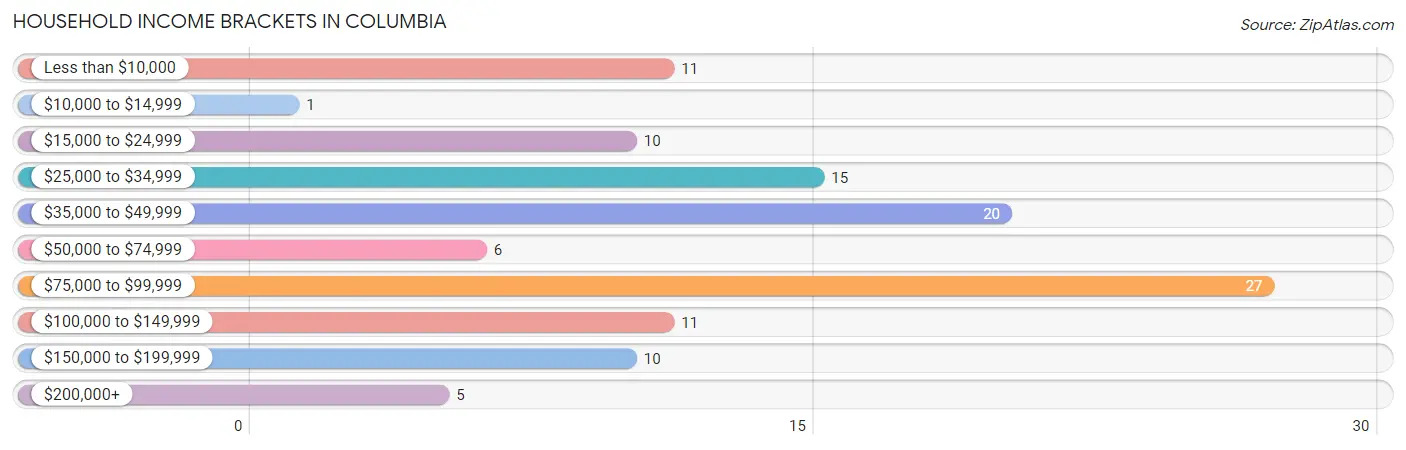
| Income Bracket | # Households | % Households |
| Less than $10,000 | 11 | 9.5% |
| $10,000 to $14,999 | 1 | 0.9% |
| $15,000 to $24,999 | 10 | 8.6% |
| $25,000 to $34,999 | 15 | 12.9% |
| $35,000 to $49,999 | 20 | 17.2% |
| $50,000 to $74,999 | 6 | 5.2% |
| $75,000 to $99,999 | 27 | 23.3% |
| $100,000 to $149,999 | 11 | 9.5% |
| $150,000 to $199,999 | 10 | 8.6% |
| $200,000+ | 5 | 4.3% |
Household Income by Householder Age in Columbia
The median household income in Columbia is $53,750, with the highest median household income of $98,295 found in the 45 to 64 years age bracket for the primary householder. A total of 35 households (30.2%) fall into this category.
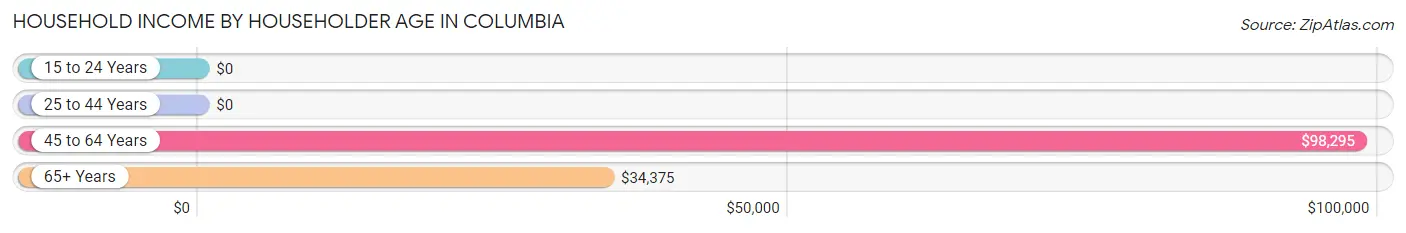
| Income Bracket | # Households | Median Income |
| 15 to 24 Years | 0 (0.0%) | $0 |
| 25 to 44 Years | 60 (51.7%) | $0 |
| 45 to 64 Years | 35 (30.2%) | $98,295 |
| 65+ Years | 21 (18.1%) | $34,375 |
| Total | 116 (100.0%) | $53,750 |
Poverty in Columbia
Income Below Poverty by Sex and Age in Columbia
With 9.8% poverty level for males and 16.8% for females among the residents of Columbia, 5 year old males and 45 to 54 year old females are the most vulnerable to poverty, with 3 males (100.0%) and 12 females (66.7%) in their respective age groups living below the poverty level.
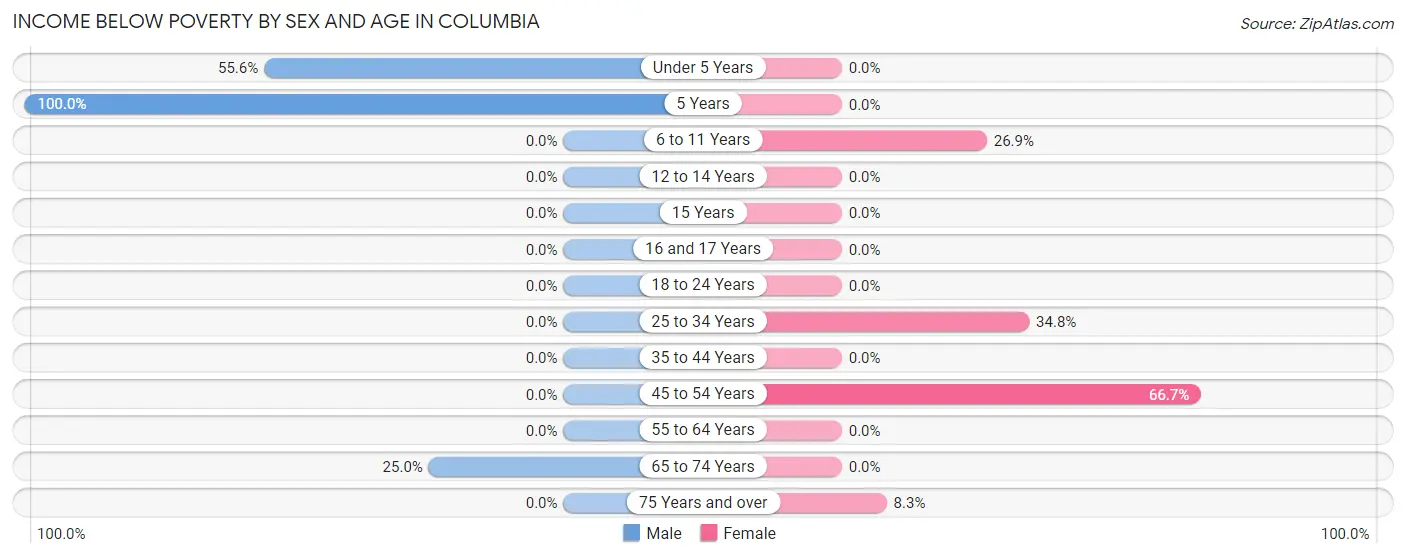
| Age Bracket | Male | Female |
| Under 5 Years | 10 (55.6%) | 0 (0.0%) |
| 5 Years | 3 (100.0%) | 0 (0.0%) |
| 6 to 11 Years | 0 (0.0%) | 7 (26.9%) |
| 12 to 14 Years | 0 (0.0%) | 0 (0.0%) |
| 15 Years | 0 (0.0%) | 0 (0.0%) |
| 16 and 17 Years | 0 (0.0%) | 0 (0.0%) |
| 18 to 24 Years | 0 (0.0%) | 0 (0.0%) |
| 25 to 34 Years | 0 (0.0%) | 8 (34.8%) |
| 35 to 44 Years | 0 (0.0%) | 0 (0.0%) |
| 45 to 54 Years | 0 (0.0%) | 12 (66.7%) |
| 55 to 64 Years | 0 (0.0%) | 0 (0.0%) |
| 65 to 74 Years | 1 (25.0%) | 0 (0.0%) |
| 75 Years and over | 0 (0.0%) | 1 (8.3%) |
| Total | 14 (9.8%) | 28 (16.8%) |
Income Above Poverty by Sex and Age in Columbia
According to the poverty statistics in Columbia, males aged 6 to 11 years and females aged under 5 years are the age groups that are most secure financially, with 100.0% of males and 100.0% of females in these age groups living above the poverty line.
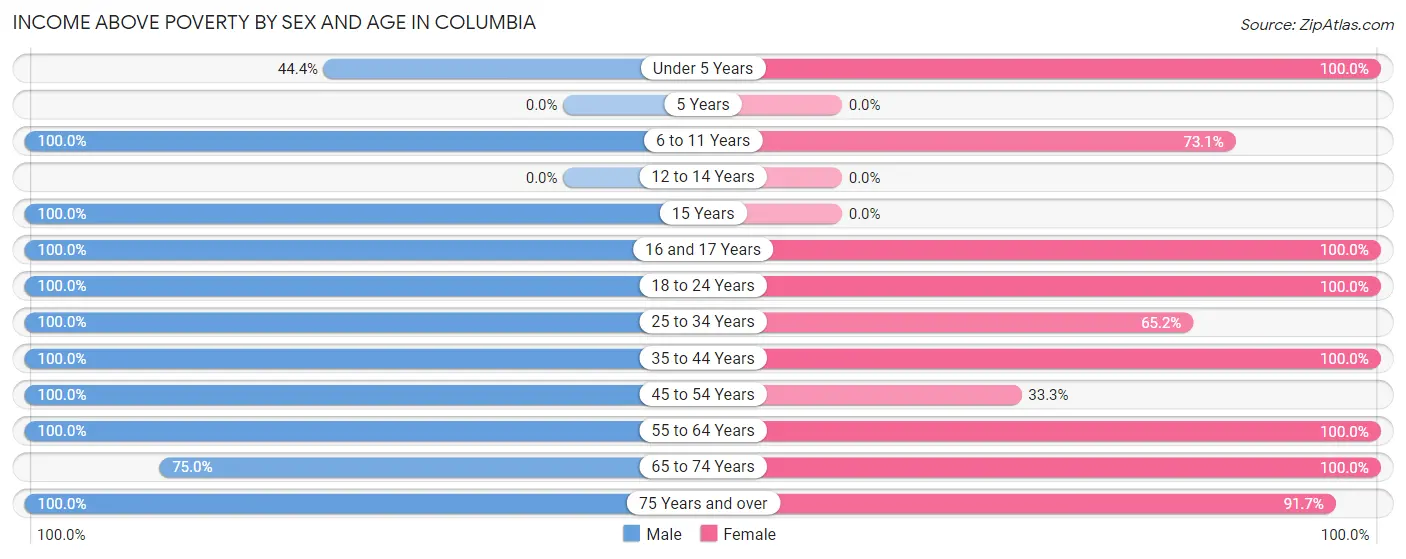
| Age Bracket | Male | Female |
| Under 5 Years | 8 (44.4%) | 11 (100.0%) |
| 5 Years | 0 (0.0%) | 0 (0.0%) |
| 6 to 11 Years | 9 (100.0%) | 19 (73.1%) |
| 12 to 14 Years | 0 (0.0%) | 0 (0.0%) |
| 15 Years | 16 (100.0%) | 0 (0.0%) |
| 16 and 17 Years | 4 (100.0%) | 9 (100.0%) |
| 18 to 24 Years | 14 (100.0%) | 3 (100.0%) |
| 25 to 34 Years | 24 (100.0%) | 15 (65.2%) |
| 35 to 44 Years | 16 (100.0%) | 47 (100.0%) |
| 45 to 54 Years | 10 (100.0%) | 6 (33.3%) |
| 55 to 64 Years | 22 (100.0%) | 10 (100.0%) |
| 65 to 74 Years | 3 (75.0%) | 8 (100.0%) |
| 75 Years and over | 3 (100.0%) | 11 (91.7%) |
| Total | 129 (90.2%) | 139 (83.2%) |
Income Below Poverty Among Married-Couple Families in Columbia
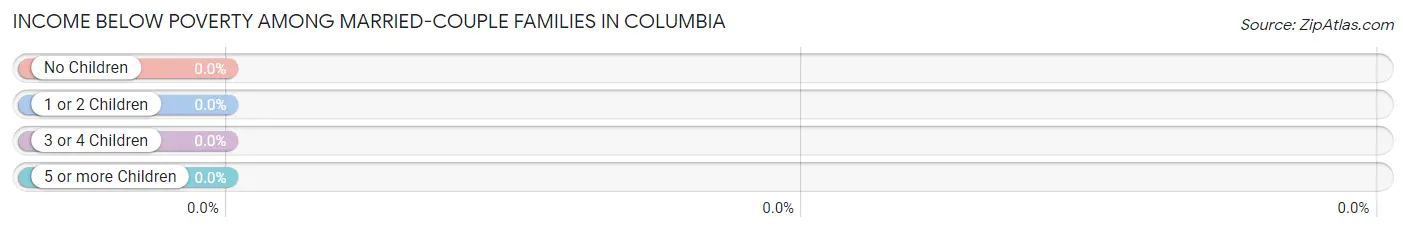
| Children | Above Poverty | Below Poverty |
| No Children | 35 (100.0%) | 0 (0.0%) |
| 1 or 2 Children | 10 (100.0%) | 0 (0.0%) |
| 3 or 4 Children | 0 (0.0%) | 0 (0.0%) |
| 5 or more Children | 0 (0.0%) | 0 (0.0%) |
| Total | 45 (100.0%) | 0 (0.0%) |
Income Below Poverty Among Single-Parent Households in Columbia
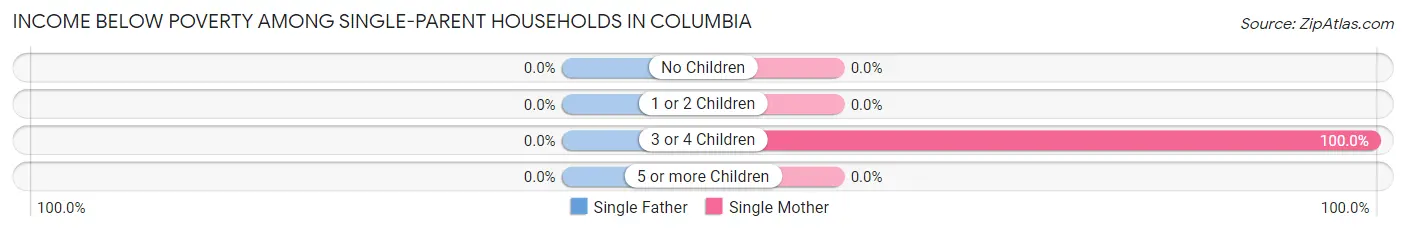
| Children | Single Father | Single Mother |
| No Children | 0 (0.0%) | 0 (0.0%) |
| 1 or 2 Children | 0 (0.0%) | 0 (0.0%) |
| 3 or 4 Children | 0 (0.0%) | 3 (100.0%) |
| 5 or more Children | 0 (0.0%) | 0 (0.0%) |
| Total | 0 (0.0%) | 3 (9.4%) |
Income Below Poverty Among Married-Couple vs Single-Parent Households in Columbia
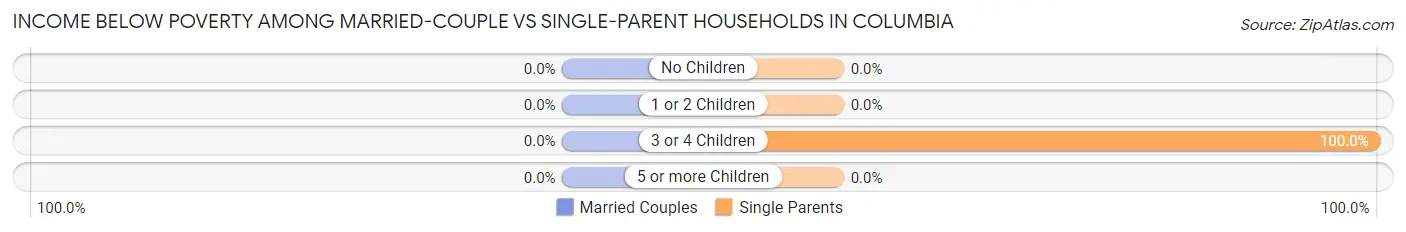
| Children | Married-Couple Families | Single-Parent Households |
| No Children | 0 (0.0%) | 0 (0.0%) |
| 1 or 2 Children | 0 (0.0%) | 0 (0.0%) |
| 3 or 4 Children | 0 (0.0%) | 3 (100.0%) |
| 5 or more Children | 0 (0.0%) | 0 (0.0%) |
| Total | 0 (0.0%) | 3 (7.9%) |
Race in Columbia
The most populous races in Columbia are White / Caucasian (230 | 67.4%), Black / African American (103 | 30.2%), and Two or more Races (4 | 1.2%).
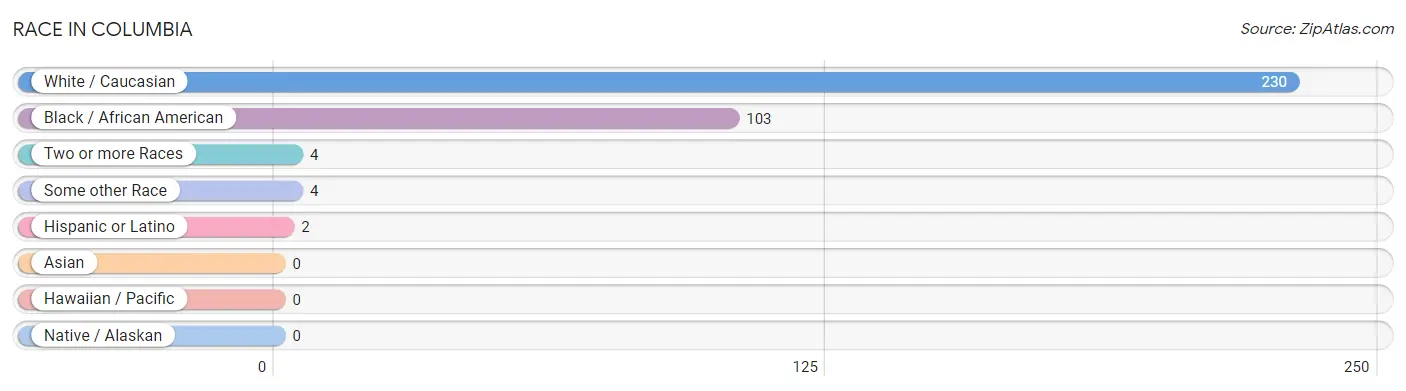
| Race | # Population | % Population |
| Asian | 0 | 0.0% |
| Black / African American | 103 | 30.2% |
| Hawaiian / Pacific | 0 | 0.0% |
| Hispanic or Latino | 2 | 0.6% |
| Native / Alaskan | 0 | 0.0% |
| White / Caucasian | 230 | 67.4% |
| Two or more Races | 4 | 1.2% |
| Some other Race | 4 | 1.2% |
| Total | 341 | 100.0% |
Ancestry in Columbia
The most populous ancestries reported in Columbia are American (42 | 12.3%), Irish (37 | 10.8%), English (33 | 9.7%), German (7 | 2.1%), and Scotch-Irish (5 | 1.5%), together accounting for 36.4% of all Columbia residents.
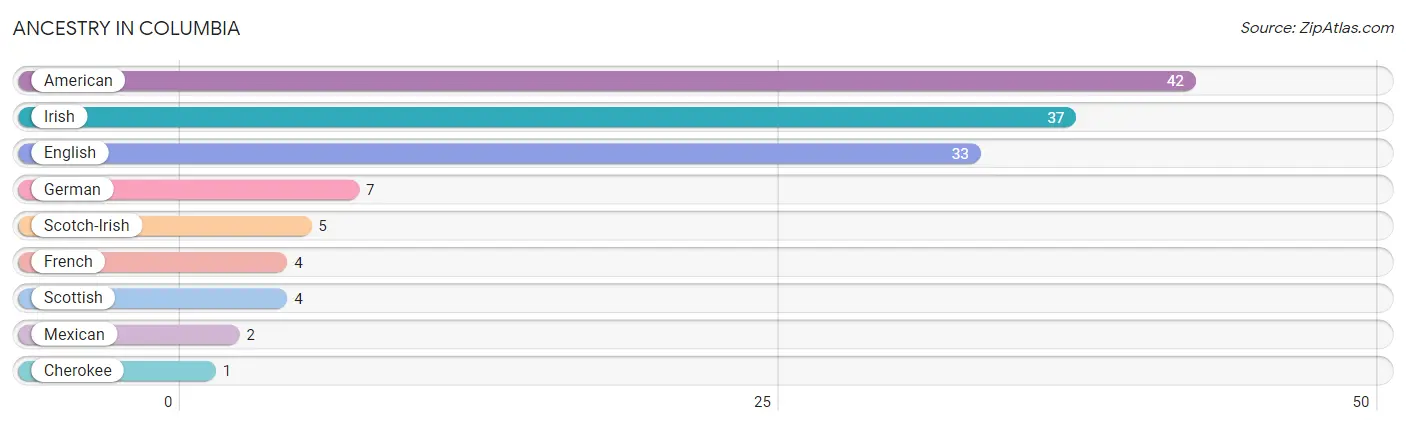
| Ancestry | # Population | % Population |
| American | 42 | 12.3% |
| Cherokee | 1 | 0.3% |
| English | 33 | 9.7% |
| French | 4 | 1.2% |
| German | 7 | 2.1% |
| Irish | 37 | 10.8% |
| Mexican | 2 | 0.6% |
| Scotch-Irish | 5 | 1.5% |
| Scottish | 4 | 1.2% | View All 9 Rows |
Immigrants in Columbia

| Immigration Origin | # Population | % Population | View All 0 Rows |
Sex and Age in Columbia
Sex and Age in Columbia
The most populous age groups in Columbia are 30 to 34 Years (30 | 17.2%) for men and 35 to 39 Years (29 | 17.4%) for women.
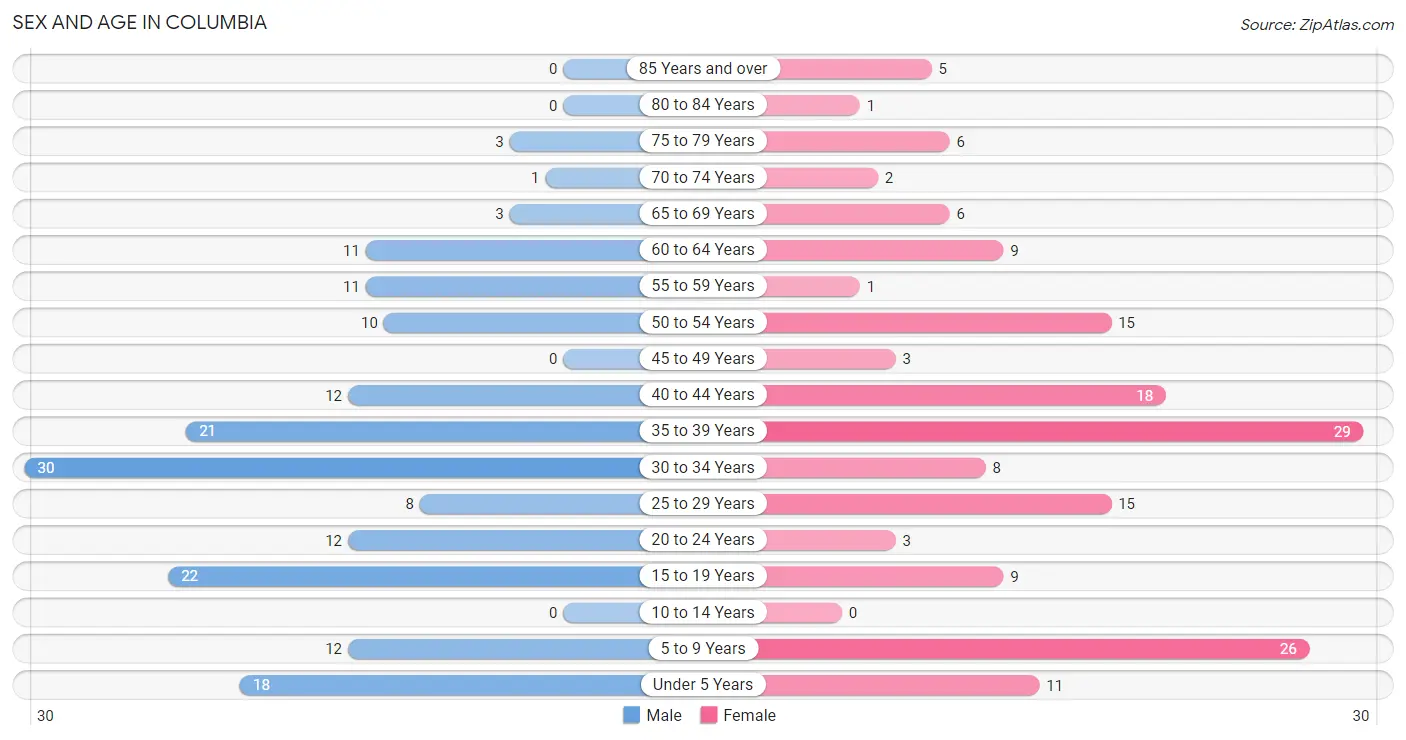
| Age Bracket | Male | Female |
| Under 5 Years | 18 (10.3%) | 11 (6.6%) |
| 5 to 9 Years | 12 (6.9%) | 26 (15.6%) |
| 10 to 14 Years | 0 (0.0%) | 0 (0.0%) |
| 15 to 19 Years | 22 (12.6%) | 9 (5.4%) |
| 20 to 24 Years | 12 (6.9%) | 3 (1.8%) |
| 25 to 29 Years | 8 (4.6%) | 15 (9.0%) |
| 30 to 34 Years | 30 (17.2%) | 8 (4.8%) |
| 35 to 39 Years | 21 (12.1%) | 29 (17.4%) |
| 40 to 44 Years | 12 (6.9%) | 18 (10.8%) |
| 45 to 49 Years | 0 (0.0%) | 3 (1.8%) |
| 50 to 54 Years | 10 (5.8%) | 15 (9.0%) |
| 55 to 59 Years | 11 (6.3%) | 1 (0.6%) |
| 60 to 64 Years | 11 (6.3%) | 9 (5.4%) |
| 65 to 69 Years | 3 (1.7%) | 6 (3.6%) |
| 70 to 74 Years | 1 (0.6%) | 2 (1.2%) |
| 75 to 79 Years | 3 (1.7%) | 6 (3.6%) |
| 80 to 84 Years | 0 (0.0%) | 1 (0.6%) |
| 85 Years and over | 0 (0.0%) | 5 (3.0%) |
| Total | 174 (100.0%) | 167 (100.0%) |
Families and Households in Columbia
Median Family Size in Columbia
The median family size in Columbia is 3.23 persons per family, with single female/mother families (32 | 38.6%) accounting for the largest median family size of 4.41 persons per family. On the other hand, single male/father families (6 | 7.2%) represent the smallest median family size with 2.00 persons per family.
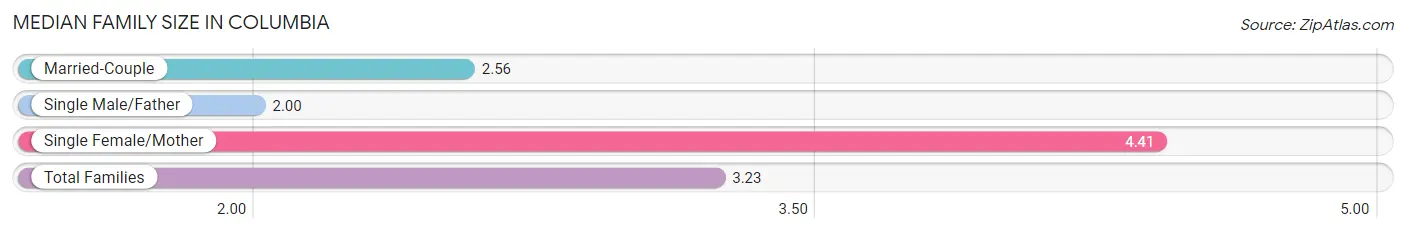
| Family Type | # Families | Family Size |
| Married-Couple | 45 (54.2%) | 2.56 |
| Single Male/Father | 6 (7.2%) | 2.00 |
| Single Female/Mother | 32 (38.6%) | 4.41 |
| Total Families | 83 (100.0%) | 3.23 |
Median Household Size in Columbia
The median household size in Columbia is 2.67 persons per household, with single female/mother households (32 | 27.6%) accounting for the largest median household size of 4.56 persons per household. non-family households (33 | 28.4%) represent the smallest median household size with 1.03 persons per household.
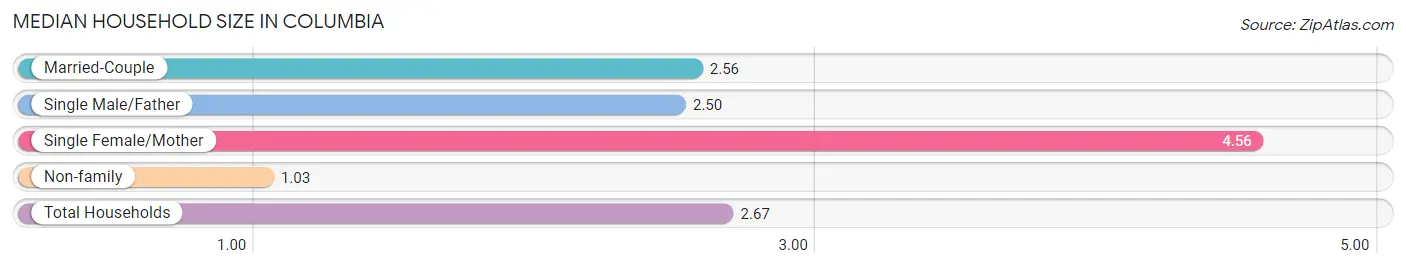
| Household Type | # Households | Household Size |
| Married-Couple | 45 (38.8%) | 2.56 |
| Single Male/Father | 6 (5.2%) | 2.50 |
| Single Female/Mother | 32 (27.6%) | 4.56 |
| Non-family | 33 (28.4%) | 1.03 |
| Total Households | 116 (100.0%) | 2.67 |
Household Size by Marriage Status in Columbia
Out of a total of 116 households in Columbia, 83 (71.6%) are family households, while 33 (28.4%) are nonfamily households. The most numerous type of family households are 2-person households, comprising 41, and the most common type of nonfamily households are 1-person households, comprising 32.
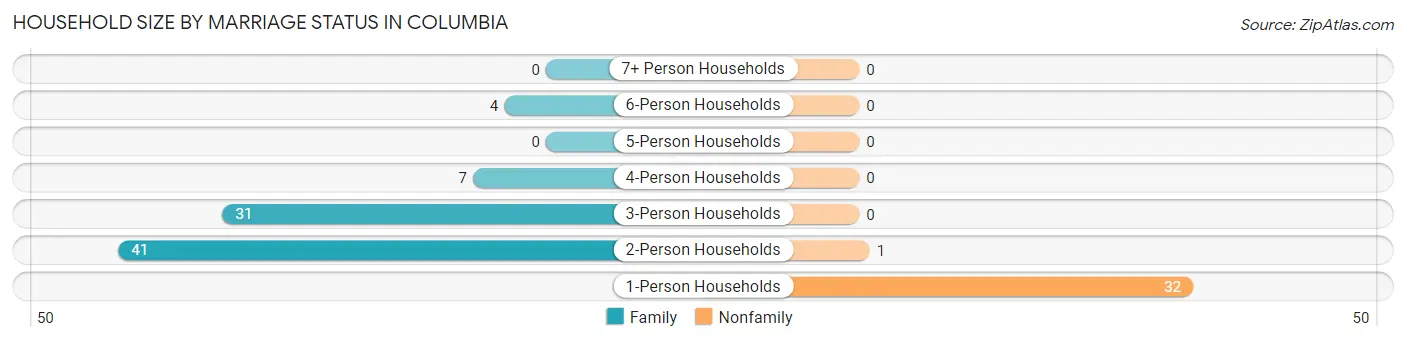
| Household Size | Family Households | Nonfamily Households |
| 1-Person Households | - | 32 (27.6%) |
| 2-Person Households | 41 (35.3%) | 1 (0.9%) |
| 3-Person Households | 31 (26.7%) | 0 (0.0%) |
| 4-Person Households | 7 (6.0%) | 0 (0.0%) |
| 5-Person Households | 0 (0.0%) | 0 (0.0%) |
| 6-Person Households | 4 (3.5%) | 0 (0.0%) |
| 7+ Person Households | 0 (0.0%) | 0 (0.0%) |
| Total | 83 (71.6%) | 33 (28.4%) |
Female Fertility in Columbia
Fertility by Age in Columbia
Average fertility rate in Columbia is 72.0 births per 1,000 women. Women in the age bracket of 20 to 34 years have the highest fertility rate with 269.0 births per 1,000 women. Women in the age bracket of 20 to 34 years acount for 100.0% of all women with births.
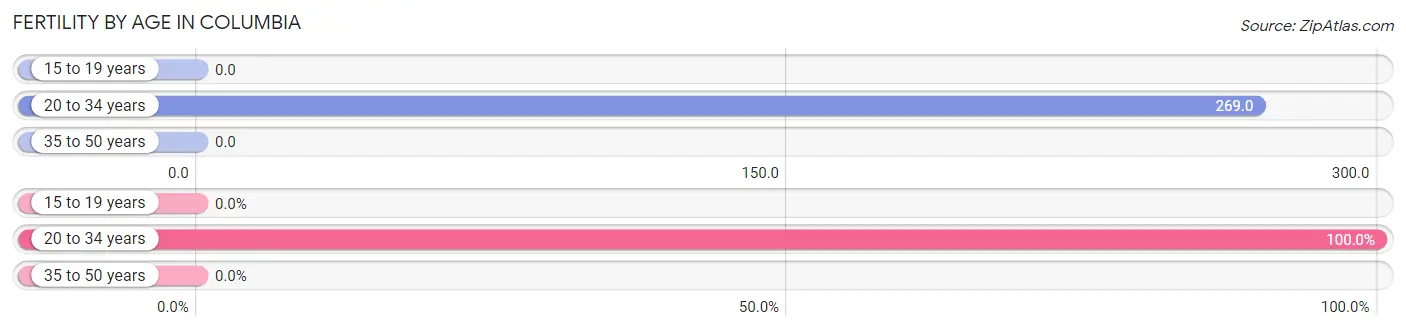
| Age Bracket | Women with Births | Births / 1,000 Women |
| 15 to 19 years | 0 (0.0%) | 0.0 |
| 20 to 34 years | 7 (100.0%) | 269.0 |
| 35 to 50 years | 0 (0.0%) | 0.0 |
| Total | 7 (100.0%) | 72.0 |
Fertility by Age by Marriage Status in Columbia
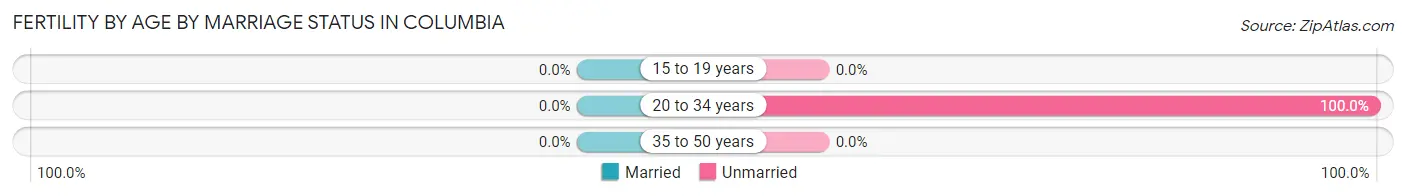
| Age Bracket | Married | Unmarried |
| 15 to 19 years | 0 (0.0%) | 0 (0.0%) |
| 20 to 34 years | 0 (0.0%) | 7 (100.0%) |
| 35 to 50 years | 0 (0.0%) | 0 (0.0%) |
| Total | 0 (0.0%) | 7 (100.0%) |
Fertility by Education in Columbia
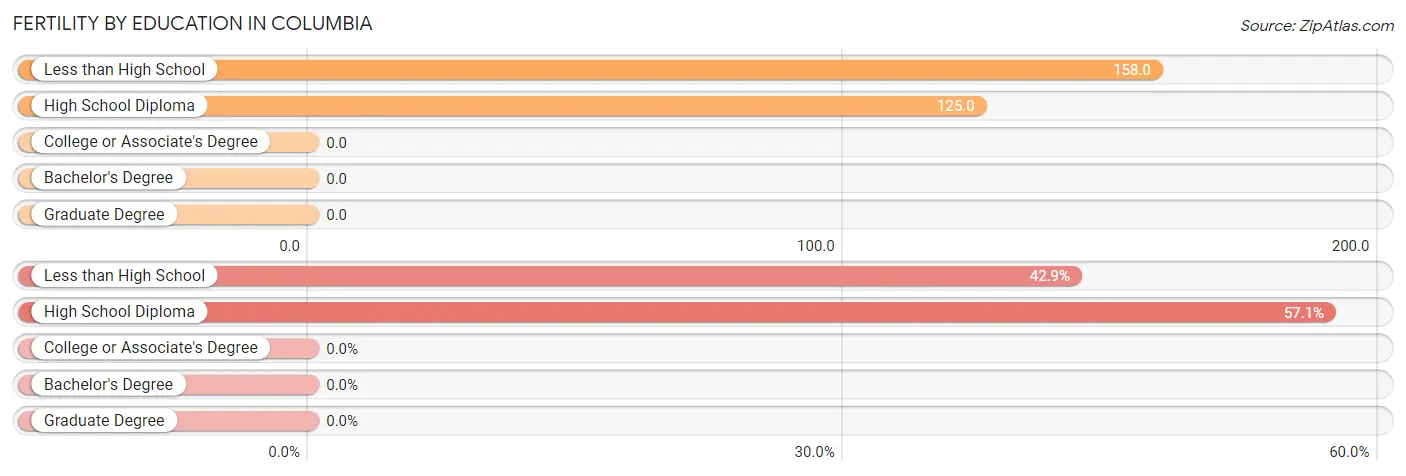
| Educational Attainment | Women with Births | Births / 1,000 Women |
| Less than High School | 3 (42.9%) | 158.0 |
| High School Diploma | 4 (57.1%) | 125.0 |
| College or Associate's Degree | 0 (0.0%) | 0.0 |
| Bachelor's Degree | 0 (0.0%) | 0.0 |
| Graduate Degree | 0 (0.0%) | 0.0 |
| Total | 7 (100.0%) | 72.0 |
Fertility by Education by Marriage Status in Columbia
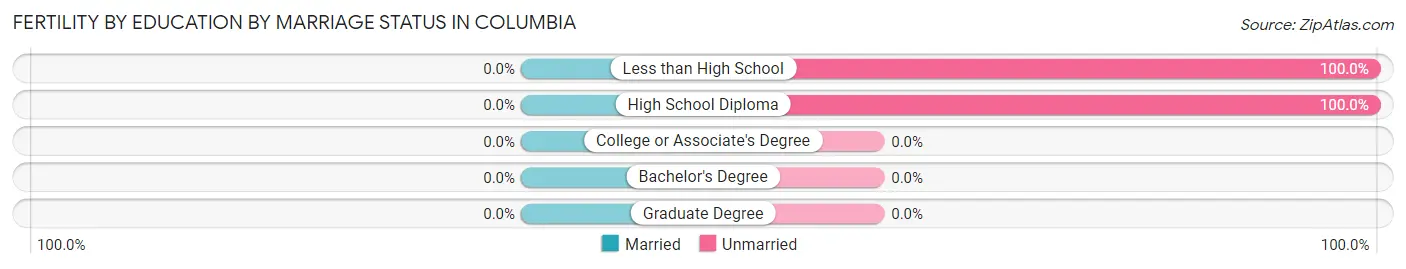
| Educational Attainment | Married | Unmarried |
| Less than High School | 0 (0.0%) | 3 (100.0%) |
| High School Diploma | 0 (0.0%) | 4 (100.0%) |
| College or Associate's Degree | 0 (0.0%) | 0 (0.0%) |
| Bachelor's Degree | 0 (0.0%) | 0 (0.0%) |
| Graduate Degree | 0 (0.0%) | 0 (0.0%) |
| Total | 0 (0.0%) | 7 (100.0%) |
Employment Characteristics in Columbia
Employment by Class of Employer in Columbia
Among the 113 employed individuals in Columbia, private company employees (73 | 64.6%), local government employees (17 | 15.0%), and self-employed (not incorporated) (9 | 8.0%) make up the most common classes of employment.
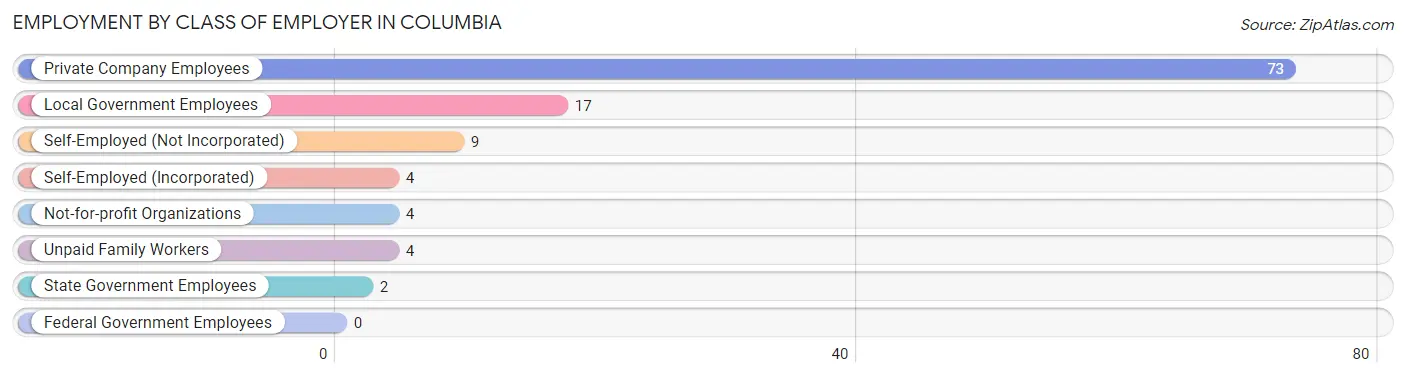
| Employer Class | # Employees | % Employees |
| Private Company Employees | 73 | 64.6% |
| Self-Employed (Incorporated) | 4 | 3.5% |
| Self-Employed (Not Incorporated) | 9 | 8.0% |
| Not-for-profit Organizations | 4 | 3.5% |
| Local Government Employees | 17 | 15.0% |
| State Government Employees | 2 | 1.8% |
| Federal Government Employees | 0 | 0.0% |
| Unpaid Family Workers | 4 | 3.5% |
| Total | 113 | 100.0% |
Employment Status by Age in Columbia
According to the labor force statistics for Columbia, out of the total population over 16 years of age (258), 48.1% or 124 individuals are in the labor force, with 6.5% or 8 of them unemployed. The age group with the highest labor force participation rate is 25 to 29 years, with 87.0% or 20 individuals in the labor force. Within the labor force, the 25 to 29 years age range has the highest percentage of unemployed individuals, with 40.0% or 8 of them being unemployed.
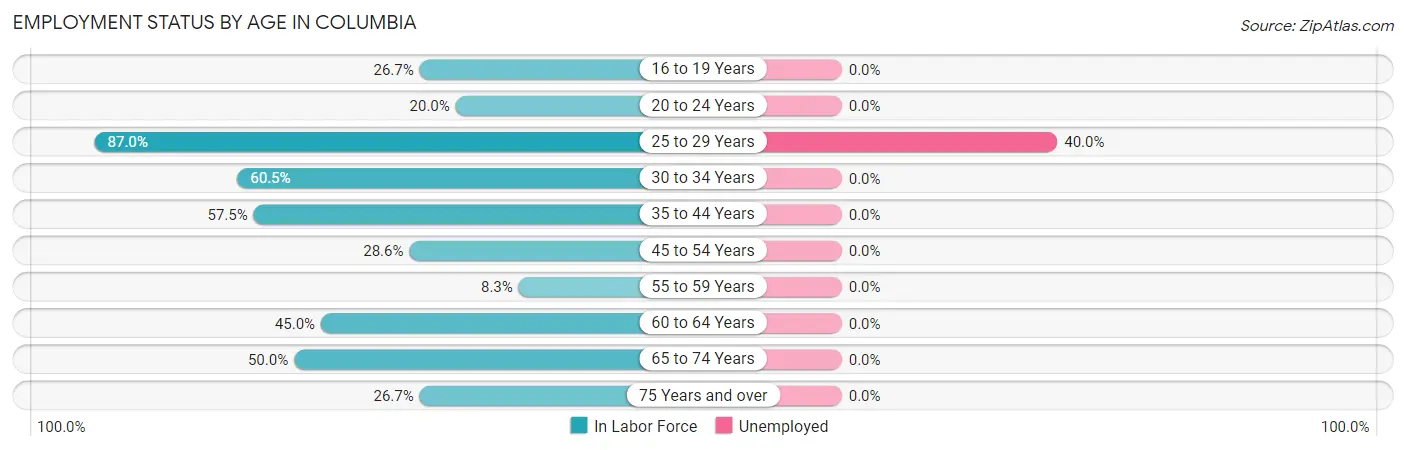
| Age Bracket | In Labor Force | Unemployed |
| 16 to 19 Years | 4 (26.7%) | 0 (0.0%) |
| 20 to 24 Years | 3 (20.0%) | 0 (0.0%) |
| 25 to 29 Years | 20 (87.0%) | 8 (40.0%) |
| 30 to 34 Years | 23 (60.5%) | 0 (0.0%) |
| 35 to 44 Years | 46 (57.5%) | 0 (0.0%) |
| 45 to 54 Years | 8 (28.6%) | 0 (0.0%) |
| 55 to 59 Years | 1 (8.3%) | 0 (0.0%) |
| 60 to 64 Years | 9 (45.0%) | 0 (0.0%) |
| 65 to 74 Years | 6 (50.0%) | 0 (0.0%) |
| 75 Years and over | 4 (26.7%) | 0 (0.0%) |
| Total | 124 (48.1%) | 8 (6.5%) |
Employment Status by Educational Attainment in Columbia
According to labor force statistics for Columbia, 53.2% of individuals (107) out of the total population between 25 and 64 years of age (201) are in the labor force, with 7.5% or 8 of them being unemployed. The group with the highest labor force participation rate are those with the educational attainment of bachelor's degree or higher, with 95.5% or 21 individuals in the labor force. Within the labor force, individuals with high school diploma education have the highest percentage of unemployment, with 18.2% or 8 of them being unemployed.
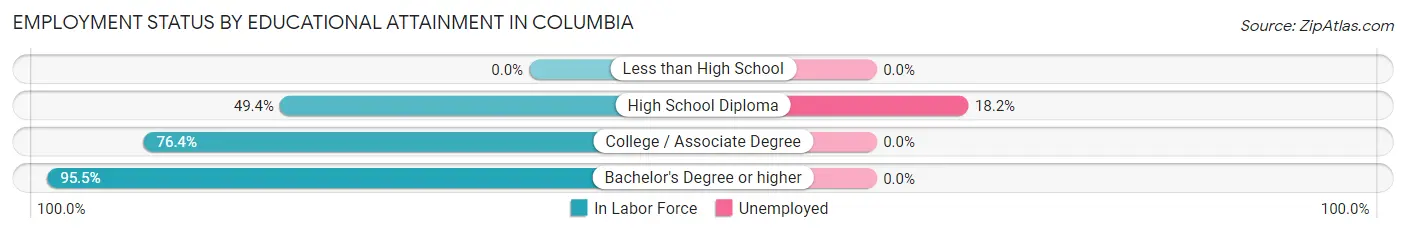
| Educational Attainment | In Labor Force | Unemployed |
| Less than High School | 0 (0.0%) | 0 (0.0%) |
| High School Diploma | 44 (49.4%) | 16 (18.2%) |
| College / Associate Degree | 42 (76.4%) | 0 (0.0%) |
| Bachelor's Degree or higher | 21 (95.5%) | 0 (0.0%) |
| Total | 107 (53.2%) | 15 (7.5%) |
Employment Occupations by Sex in Columbia
Management, Business, Science and Arts Occupations
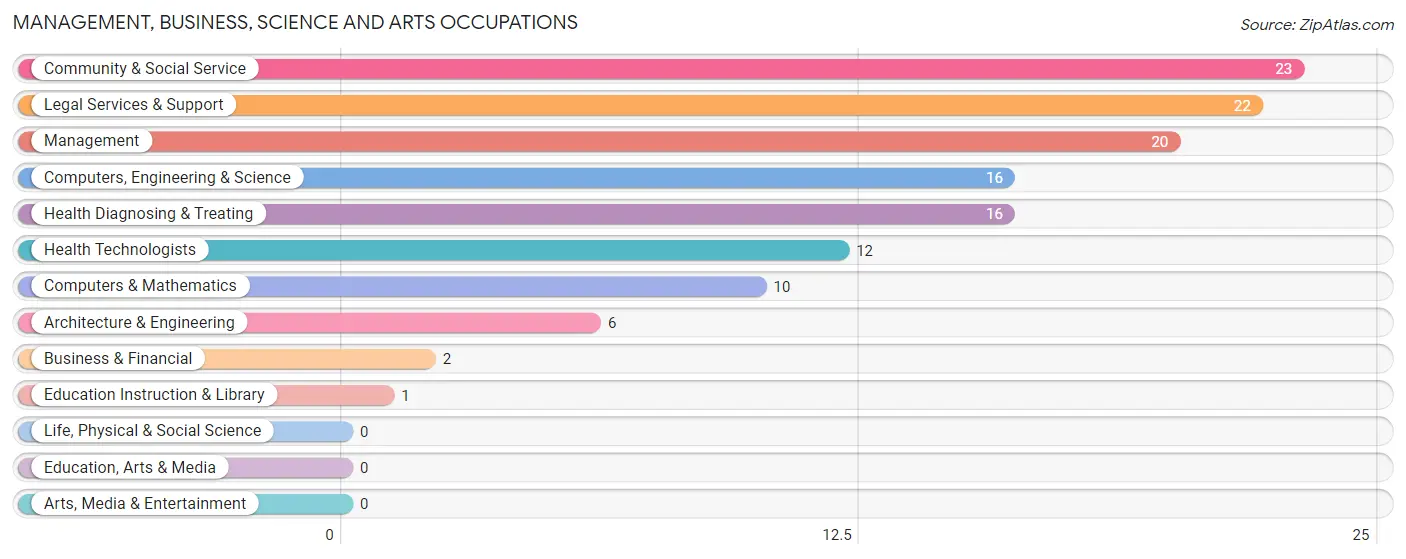
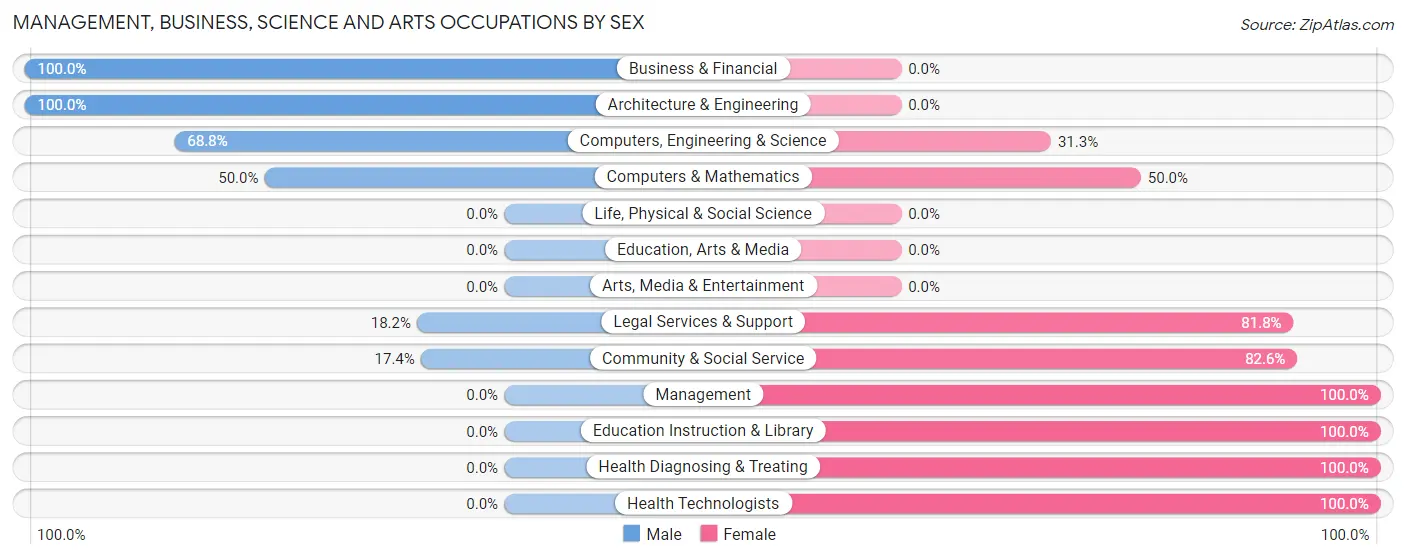
The most common Management, Business, Science and Arts occupations in Columbia are Community & Social Service (23 | 19.8%), Legal Services & Support (22 | 19.0%), Management (20 | 17.2%), Computers, Engineering & Science (16 | 13.8%), and Health Diagnosing & Treating (16 | 13.8%).
Management, Business, Science and Arts Occupations by Sex
Within the Management, Business, Science and Arts occupations in Columbia, the most male-oriented occupations are Business & Financial (100.0%), Architecture & Engineering (100.0%), and Computers, Engineering & Science (68.8%), while the most female-oriented occupations are Management (100.0%), Education Instruction & Library (100.0%), and Health Diagnosing & Treating (100.0%).
| Occupation | Male | Female |
| Management | 0 (0.0%) | 20 (100.0%) |
| Business & Financial | 2 (100.0%) | 0 (0.0%) |
| Computers, Engineering & Science | 11 (68.8%) | 5 (31.2%) |
| Computers & Mathematics | 5 (50.0%) | 5 (50.0%) |
| Architecture & Engineering | 6 (100.0%) | 0 (0.0%) |
| Life, Physical & Social Science | 0 (0.0%) | 0 (0.0%) |
| Community & Social Service | 4 (17.4%) | 19 (82.6%) |
| Education, Arts & Media | 0 (0.0%) | 0 (0.0%) |
| Legal Services & Support | 4 (18.2%) | 18 (81.8%) |
| Education Instruction & Library | 0 (0.0%) | 1 (100.0%) |
| Arts, Media & Entertainment | 0 (0.0%) | 0 (0.0%) |
| Health Diagnosing & Treating | 0 (0.0%) | 16 (100.0%) |
| Health Technologists | 0 (0.0%) | 12 (100.0%) |
| Total (Category) | 17 (22.1%) | 60 (77.9%) |
| Total (Overall) | 35 (30.2%) | 81 (69.8%) |
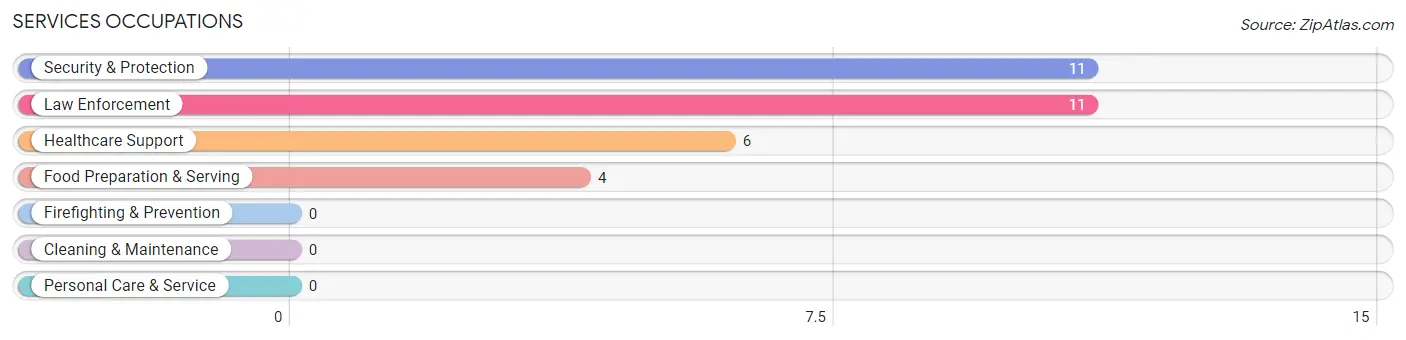
Services Occupations
The most common Services occupations in Columbia are Security & Protection (11 | 9.5%), Law Enforcement (11 | 9.5%), Healthcare Support (6 | 5.2%), and Food Preparation & Serving (4 | 3.5%).
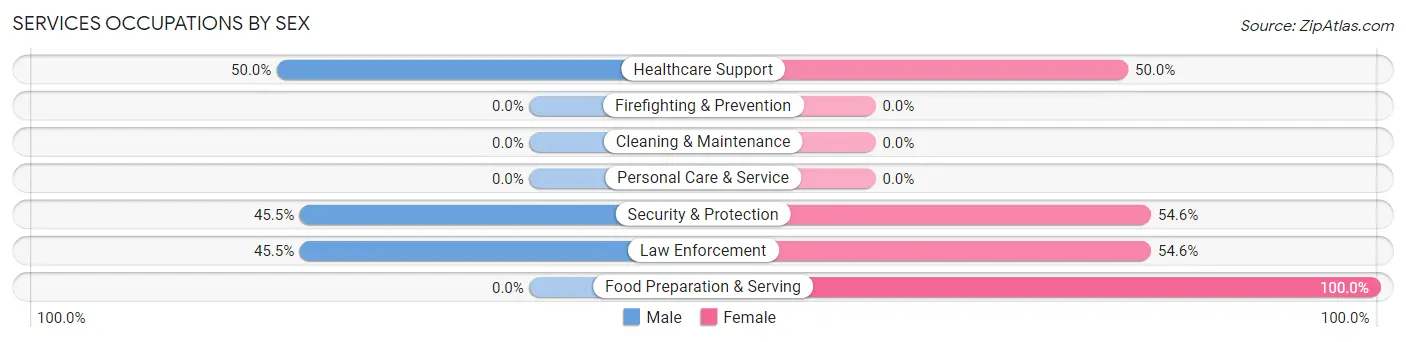
Services Occupations by Sex
Within the Services occupations in Columbia, the most male-oriented occupations are Healthcare Support (50.0%), Security & Protection (45.5%), and Law Enforcement (45.5%), while the most female-oriented occupations are Food Preparation & Serving (100.0%), Security & Protection (54.5%), and Law Enforcement (54.5%).
| Occupation | Male | Female |
| Healthcare Support | 3 (50.0%) | 3 (50.0%) |
| Security & Protection | 5 (45.5%) | 6 (54.5%) |
| Firefighting & Prevention | 0 (0.0%) | 0 (0.0%) |
| Law Enforcement | 5 (45.5%) | 6 (54.5%) |
| Food Preparation & Serving | 0 (0.0%) | 4 (100.0%) |
| Cleaning & Maintenance | 0 (0.0%) | 0 (0.0%) |
| Personal Care & Service | 0 (0.0%) | 0 (0.0%) |
| Total (Category) | 8 (38.1%) | 13 (61.9%) |
| Total (Overall) | 35 (30.2%) | 81 (69.8%) |
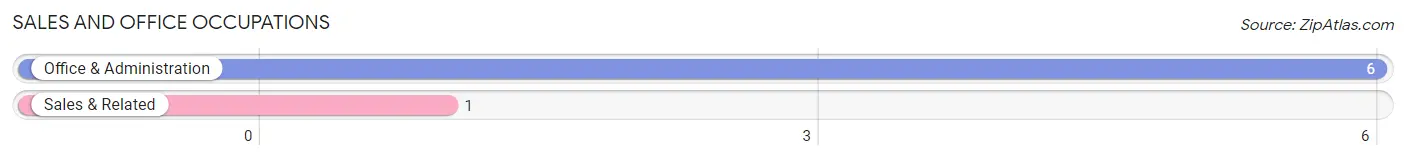
Sales and Office Occupations
The most common Sales and Office occupations in Columbia are Office & Administration (6 | 5.2%), and Sales & Related (1 | 0.9%).
Sales and Office Occupations by Sex
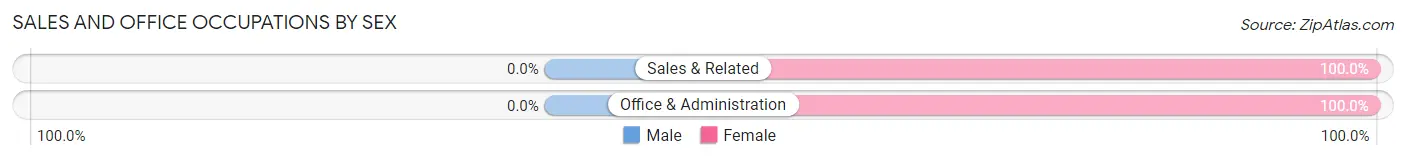
| Occupation | Male | Female |
| Sales & Related | 0 (0.0%) | 1 (100.0%) |
| Office & Administration | 0 (0.0%) | 6 (100.0%) |
| Total (Category) | 0 (0.0%) | 7 (100.0%) |
| Total (Overall) | 35 (30.2%) | 81 (69.8%) |
Natural Resources, Construction and Maintenance Occupations
Natural Resources, Construction and Maintenance Occupations by Sex
| Occupation | Male | Female |
| Farming, Fishing & Forestry | 0 (0.0%) | 0 (0.0%) |
| Construction & Extraction | 0 (0.0%) | 0 (0.0%) |
| Installation, Maintenance & Repair | 0 (0.0%) | 0 (0.0%) |
| Total (Category) | 0 (0.0%) | 0 (0.0%) |
| Total (Overall) | 35 (30.2%) | 81 (69.8%) |
Production, Transportation and Moving Occupations
The most common Production, Transportation and Moving occupations in Columbia are Transportation (7 | 6.0%), and Material Moving (4 | 3.5%).
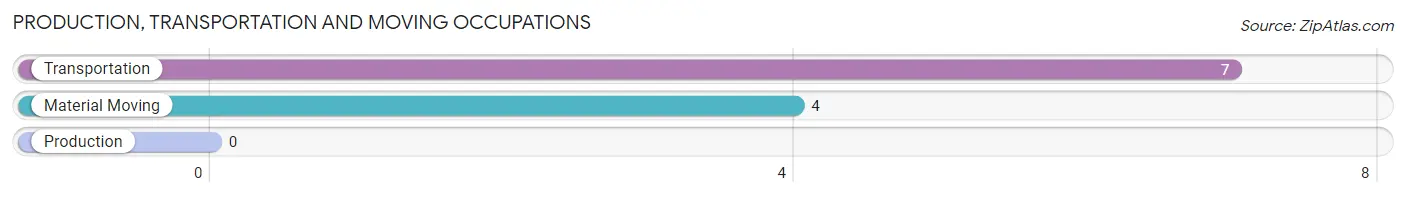
Production, Transportation and Moving Occupations by Sex
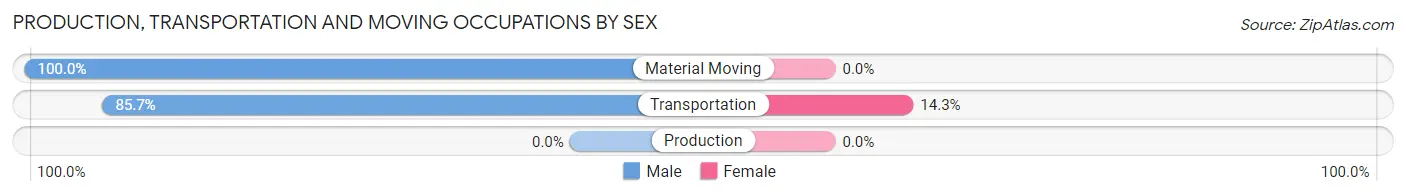
| Occupation | Male | Female |
| Production | 0 (0.0%) | 0 (0.0%) |
| Transportation | 6 (85.7%) | 1 (14.3%) |
| Material Moving | 4 (100.0%) | 0 (0.0%) |
| Total (Category) | 10 (90.9%) | 1 (9.1%) |
| Total (Overall) | 35 (30.2%) | 81 (69.8%) |
Employment Industries by Sex in Columbia
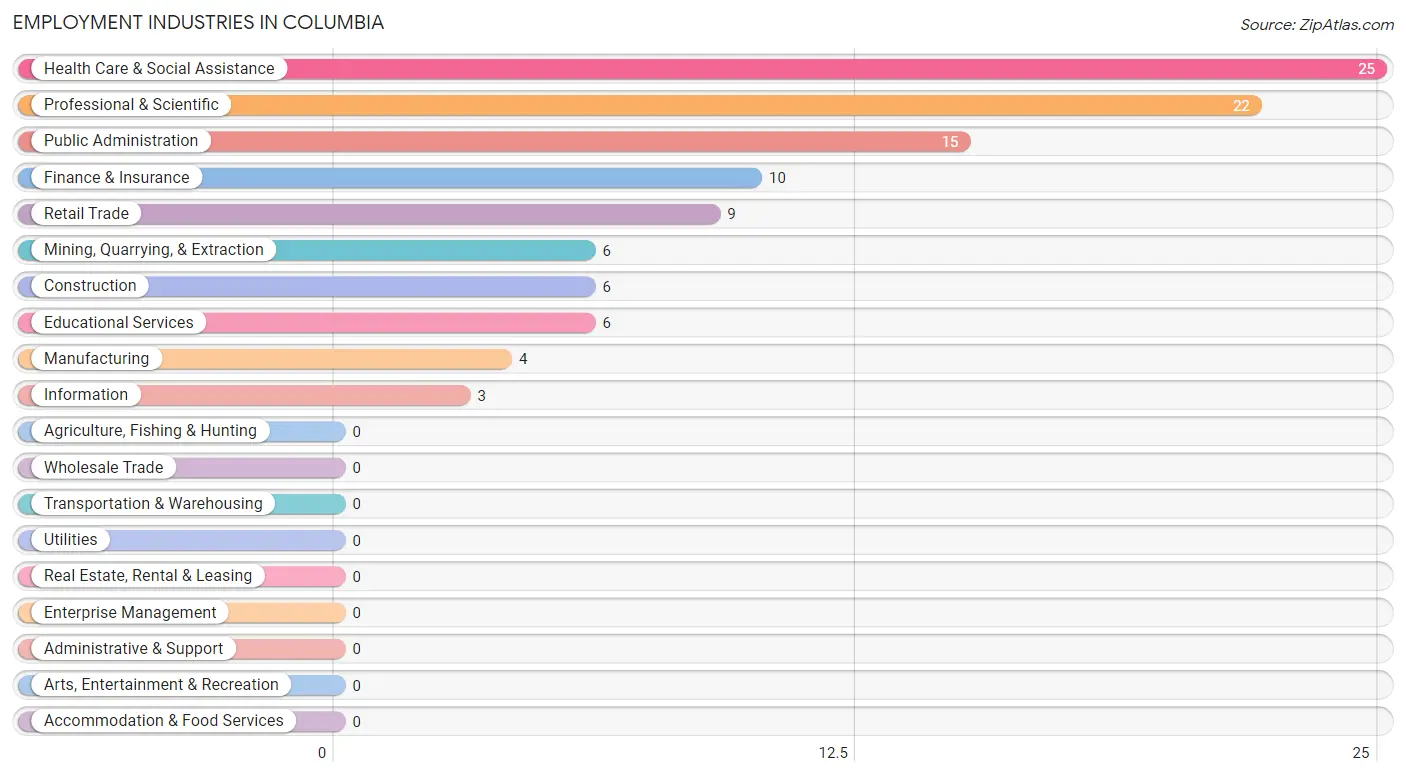
Employment Industries in Columbia
The major employment industries in Columbia include Health Care & Social Assistance (25 | 21.5%), Professional & Scientific (22 | 19.0%), Public Administration (15 | 12.9%), Finance & Insurance (10 | 8.6%), and Retail Trade (9 | 7.8%).
Employment Industries by Sex in Columbia
The Columbia industries that see more men than women are Mining, Quarrying, & Extraction (100.0%), Construction (100.0%), and Finance & Insurance (70.0%), whereas the industries that tend to have a higher number of women are Manufacturing (100.0%), Information (100.0%), and Educational Services (100.0%).
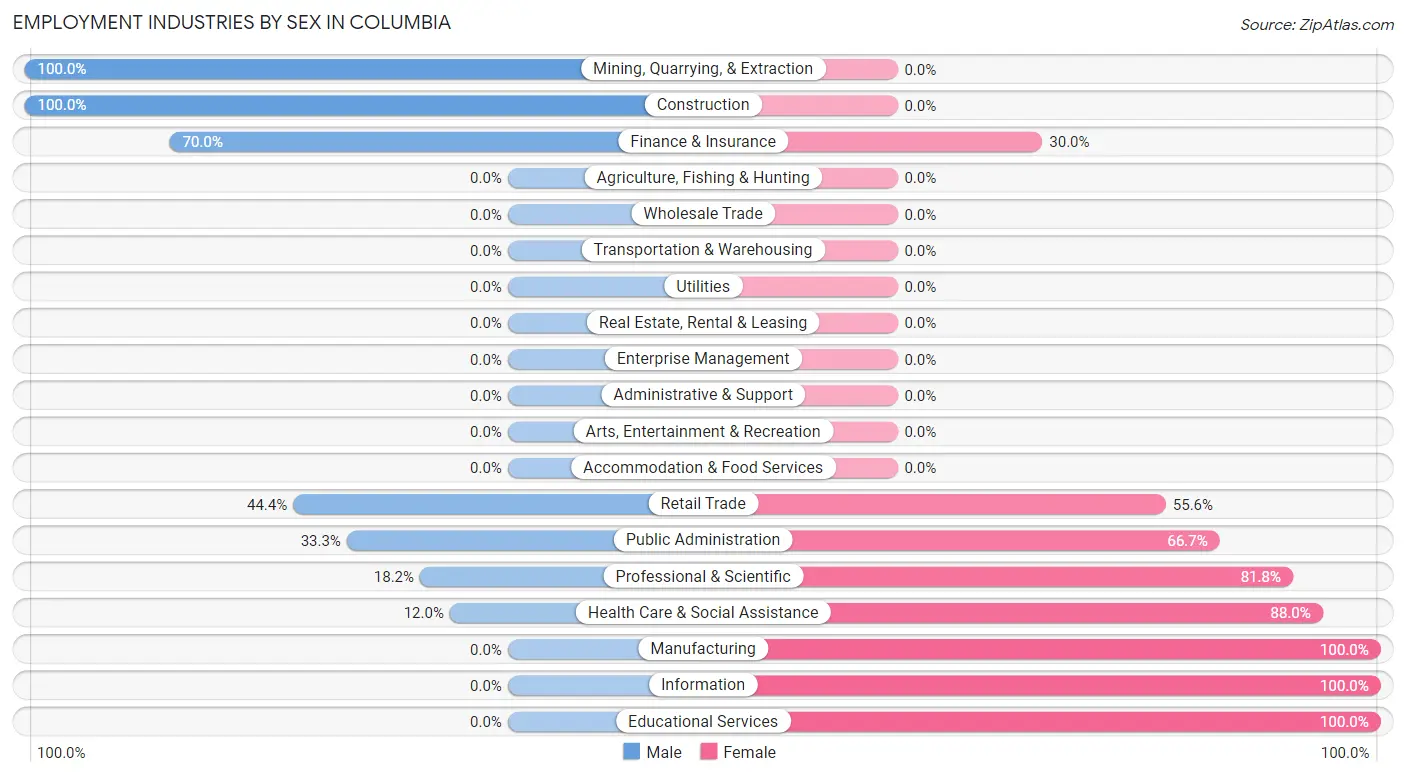
| Industry | Male | Female |
| Agriculture, Fishing & Hunting | 0 (0.0%) | 0 (0.0%) |
| Mining, Quarrying, & Extraction | 6 (100.0%) | 0 (0.0%) |
| Construction | 6 (100.0%) | 0 (0.0%) |
| Manufacturing | 0 (0.0%) | 4 (100.0%) |
| Wholesale Trade | 0 (0.0%) | 0 (0.0%) |
| Retail Trade | 4 (44.4%) | 5 (55.6%) |
| Transportation & Warehousing | 0 (0.0%) | 0 (0.0%) |
| Utilities | 0 (0.0%) | 0 (0.0%) |
| Information | 0 (0.0%) | 3 (100.0%) |
| Finance & Insurance | 7 (70.0%) | 3 (30.0%) |
| Real Estate, Rental & Leasing | 0 (0.0%) | 0 (0.0%) |
| Professional & Scientific | 4 (18.2%) | 18 (81.8%) |
| Enterprise Management | 0 (0.0%) | 0 (0.0%) |
| Administrative & Support | 0 (0.0%) | 0 (0.0%) |
| Educational Services | 0 (0.0%) | 6 (100.0%) |
| Health Care & Social Assistance | 3 (12.0%) | 22 (88.0%) |
| Arts, Entertainment & Recreation | 0 (0.0%) | 0 (0.0%) |
| Accommodation & Food Services | 0 (0.0%) | 0 (0.0%) |
| Public Administration | 5 (33.3%) | 10 (66.7%) |
| Total | 35 (30.2%) | 81 (69.8%) |
Education in Columbia
School Enrollment in Columbia
The most common levels of schooling among the 83 students in Columbia are elementary school (26 | 31.3%), high school (23 | 27.7%), and college / undergraduate (22 | 26.5%).
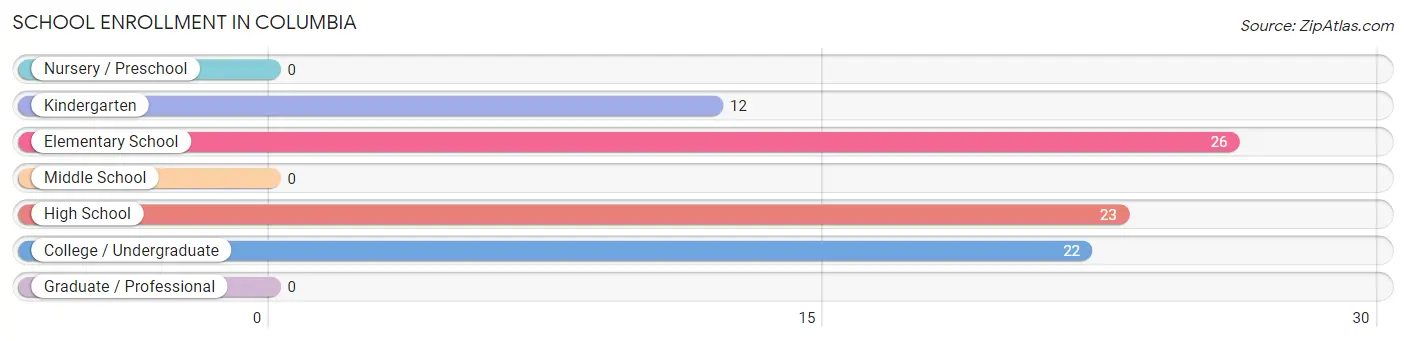
| School Level | # Students | % Students |
| Nursery / Preschool | 0 | 0.0% |
| Kindergarten | 12 | 14.5% |
| Elementary School | 26 | 31.3% |
| Middle School | 0 | 0.0% |
| High School | 23 | 27.7% |
| College / Undergraduate | 22 | 26.5% |
| Graduate / Professional | 0 | 0.0% |
| Total | 83 | 100.0% |
School Enrollment by Age by Funding Source in Columbia
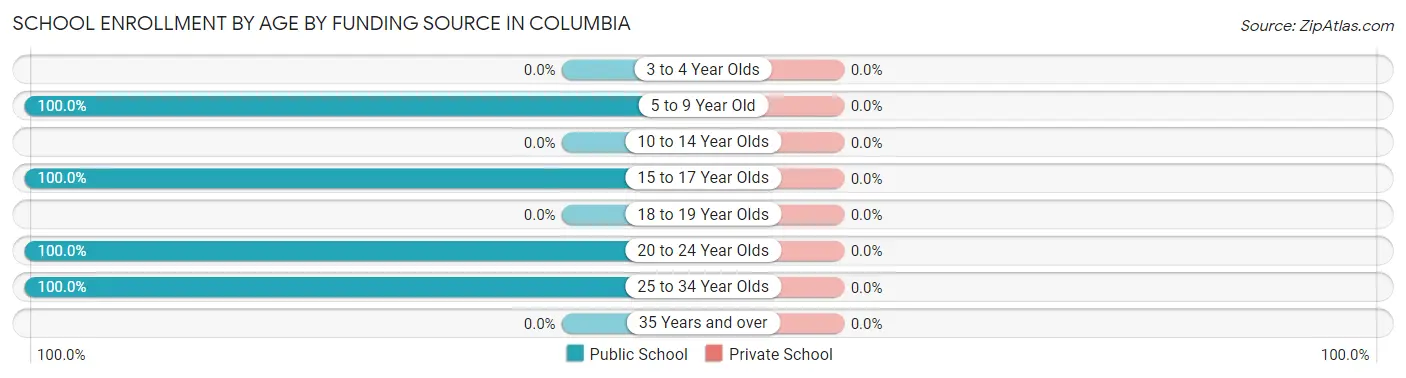
| Age Bracket | Public School | Private School |
| 3 to 4 Year Olds | 0 (0.0%) | 0 (0.0%) |
| 5 to 9 Year Old | 38 (100.0%) | 0 (0.0%) |
| 10 to 14 Year Olds | 0 (0.0%) | 0 (0.0%) |
| 15 to 17 Year Olds | 21 (100.0%) | 0 (0.0%) |
| 18 to 19 Year Olds | 0 (0.0%) | 0 (0.0%) |
| 20 to 24 Year Olds | 15 (100.0%) | 0 (0.0%) |
| 25 to 34 Year Olds | 9 (100.0%) | 0 (0.0%) |
| 35 Years and over | 0 (0.0%) | 0 (0.0%) |
| Total | 83 (100.0%) | 0 (0.0%) |
Educational Attainment by Field of Study in Columbia
Liberal arts & history (10 | 30.3%), business (6 | 18.2%), computers & mathematics (5 | 15.1%), education (5 | 15.1%), and science & technology (4 | 12.1%) are the most common fields of study among 33 individuals in Columbia who have obtained a bachelor's degree or higher.
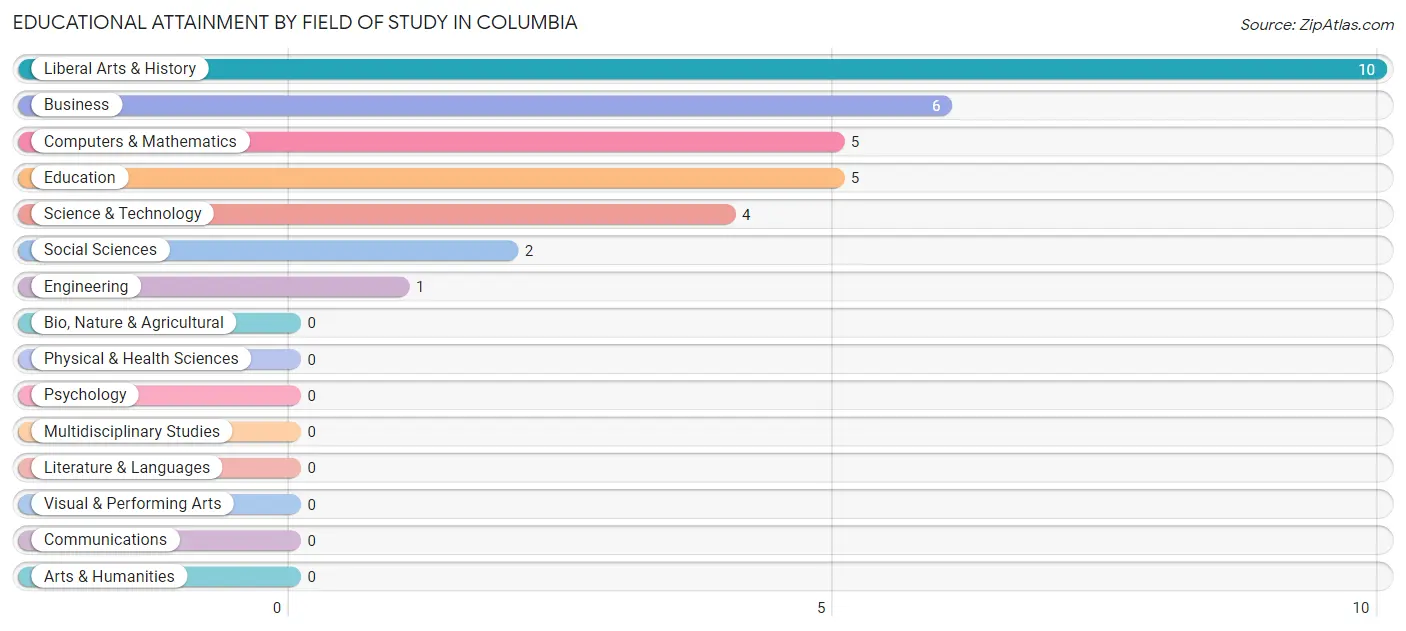
| Field of Study | # Graduates | % Graduates |
| Computers & Mathematics | 5 | 15.1% |
| Bio, Nature & Agricultural | 0 | 0.0% |
| Physical & Health Sciences | 0 | 0.0% |
| Psychology | 0 | 0.0% |
| Social Sciences | 2 | 6.1% |
| Engineering | 1 | 3.0% |
| Multidisciplinary Studies | 0 | 0.0% |
| Science & Technology | 4 | 12.1% |
| Business | 6 | 18.2% |
| Education | 5 | 15.1% |
| Literature & Languages | 0 | 0.0% |
| Liberal Arts & History | 10 | 30.3% |
| Visual & Performing Arts | 0 | 0.0% |
| Communications | 0 | 0.0% |
| Arts & Humanities | 0 | 0.0% |
| Total | 33 | 100.0% |
Transportation & Commute in Columbia
Vehicle Availability by Sex in Columbia
The most prevalent vehicle ownership categories in Columbia are males with 1 vehicle (14, accounting for 43.8%) and females with 1 vehicle (30, making up 17.3%).
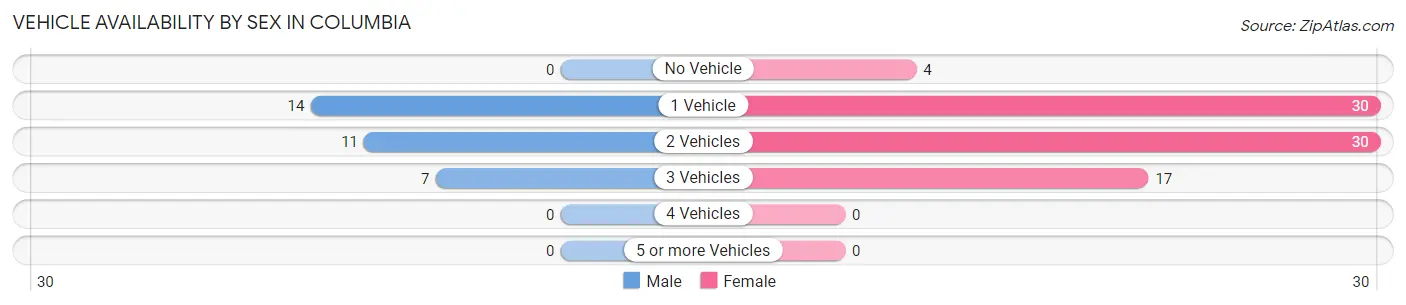
| Vehicles Available | Male | Female |
| No Vehicle | 0 (0.0%) | 4 (4.9%) |
| 1 Vehicle | 14 (43.8%) | 30 (37.0%) |
| 2 Vehicles | 11 (34.4%) | 30 (37.0%) |
| 3 Vehicles | 7 (21.9%) | 17 (21.0%) |
| 4 Vehicles | 0 (0.0%) | 0 (0.0%) |
| 5 or more Vehicles | 0 (0.0%) | 0 (0.0%) |
| Total | 32 (100.0%) | 81 (100.0%) |
Commute Time in Columbia
The most frequently occuring commute durations in Columbia are less than 5 minutes (34 commuters, 36.2%), 5 to 9 minutes (25 commuters, 26.6%), and 30 to 34 minutes (9 commuters, 9.6%).
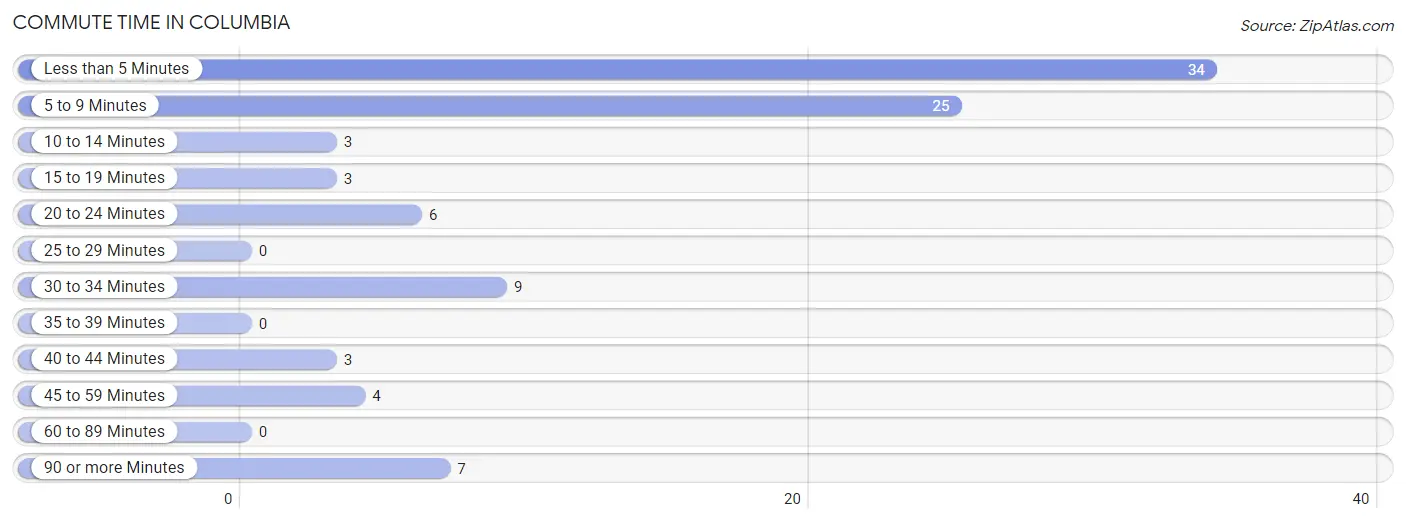
| Commute Time | # Commuters | % Commuters |
| Less than 5 Minutes | 34 | 36.2% |
| 5 to 9 Minutes | 25 | 26.6% |
| 10 to 14 Minutes | 3 | 3.2% |
| 15 to 19 Minutes | 3 | 3.2% |
| 20 to 24 Minutes | 6 | 6.4% |
| 25 to 29 Minutes | 0 | 0.0% |
| 30 to 34 Minutes | 9 | 9.6% |
| 35 to 39 Minutes | 0 | 0.0% |
| 40 to 44 Minutes | 3 | 3.2% |
| 45 to 59 Minutes | 4 | 4.3% |
| 60 to 89 Minutes | 0 | 0.0% |
| 90 or more Minutes | 7 | 7.4% |
Commute Time by Sex in Columbia
The most common commute times in Columbia are 5 to 9 minutes (9 commuters, 36.0%) for males and less than 5 minutes (30 commuters, 43.5%) for females.
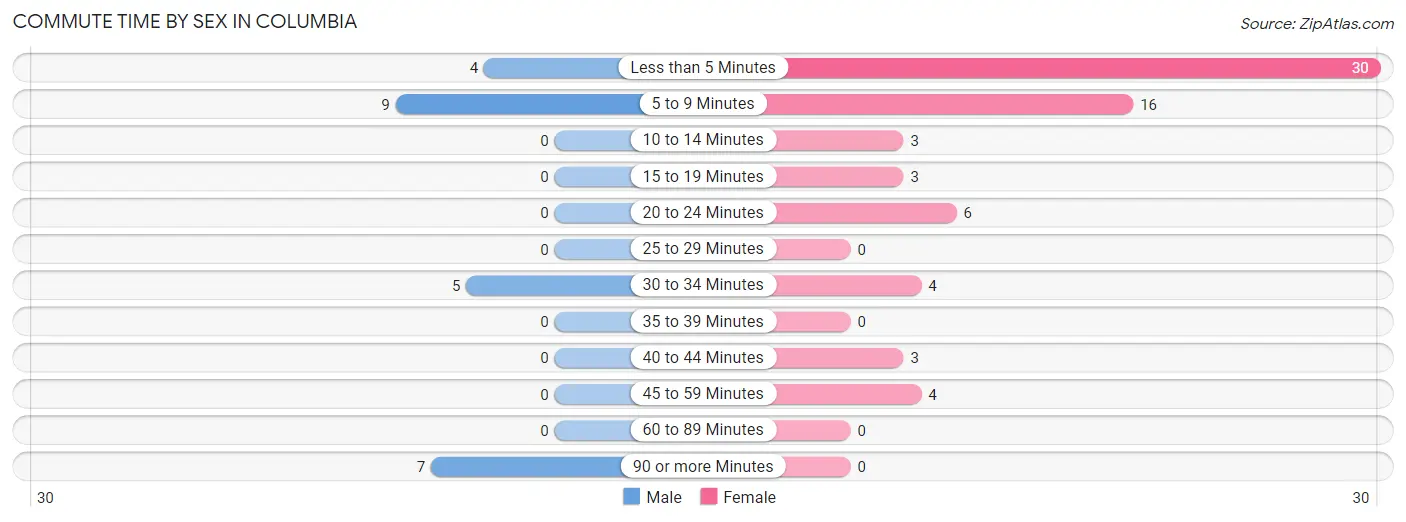
| Commute Time | Male | Female |
| Less than 5 Minutes | 4 (16.0%) | 30 (43.5%) |
| 5 to 9 Minutes | 9 (36.0%) | 16 (23.2%) |
| 10 to 14 Minutes | 0 (0.0%) | 3 (4.3%) |
| 15 to 19 Minutes | 0 (0.0%) | 3 (4.3%) |
| 20 to 24 Minutes | 0 (0.0%) | 6 (8.7%) |
| 25 to 29 Minutes | 0 (0.0%) | 0 (0.0%) |
| 30 to 34 Minutes | 5 (20.0%) | 4 (5.8%) |
| 35 to 39 Minutes | 0 (0.0%) | 0 (0.0%) |
| 40 to 44 Minutes | 0 (0.0%) | 3 (4.3%) |
| 45 to 59 Minutes | 0 (0.0%) | 4 (5.8%) |
| 60 to 89 Minutes | 0 (0.0%) | 0 (0.0%) |
| 90 or more Minutes | 7 (28.0%) | 0 (0.0%) |
Time of Departure to Work by Sex in Columbia
The most frequent times of departure to work in Columbia are 12:00 AM to 4:59 AM (5, 20.0%) for males and 8:00 AM to 8:29 AM (19, 27.5%) for females.
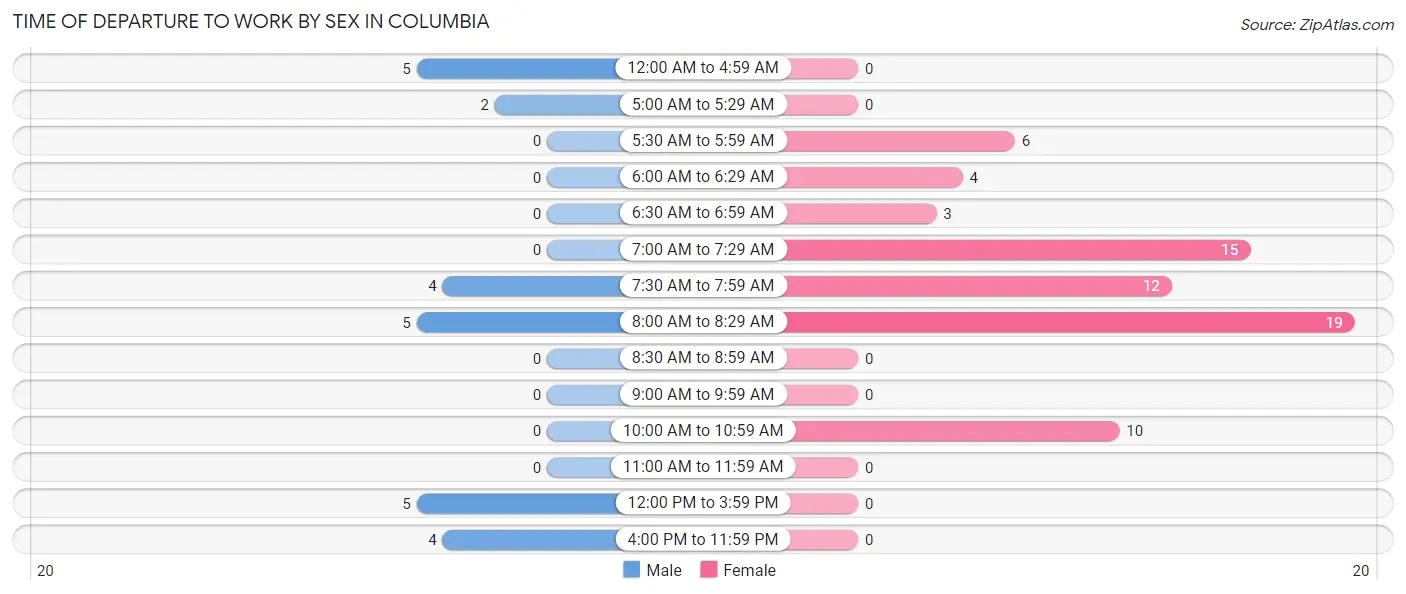
| Time of Departure | Male | Female |
| 12:00 AM to 4:59 AM | 5 (20.0%) | 0 (0.0%) |
| 5:00 AM to 5:29 AM | 2 (8.0%) | 0 (0.0%) |
| 5:30 AM to 5:59 AM | 0 (0.0%) | 6 (8.7%) |
| 6:00 AM to 6:29 AM | 0 (0.0%) | 4 (5.8%) |
| 6:30 AM to 6:59 AM | 0 (0.0%) | 3 (4.3%) |
| 7:00 AM to 7:29 AM | 0 (0.0%) | 15 (21.7%) |
| 7:30 AM to 7:59 AM | 4 (16.0%) | 12 (17.4%) |
| 8:00 AM to 8:29 AM | 5 (20.0%) | 19 (27.5%) |
| 8:30 AM to 8:59 AM | 0 (0.0%) | 0 (0.0%) |
| 9:00 AM to 9:59 AM | 0 (0.0%) | 0 (0.0%) |
| 10:00 AM to 10:59 AM | 0 (0.0%) | 10 (14.5%) |
| 11:00 AM to 11:59 AM | 0 (0.0%) | 0 (0.0%) |
| 12:00 PM to 3:59 PM | 5 (20.0%) | 0 (0.0%) |
| 4:00 PM to 11:59 PM | 4 (16.0%) | 0 (0.0%) |
| Total | 25 (100.0%) | 69 (100.0%) |
Housing Occupancy in Columbia
Occupancy by Ownership in Columbia
Of the total 116 dwellings in Columbia, owner-occupied units account for 79 (68.1%), while renter-occupied units make up 37 (31.9%).
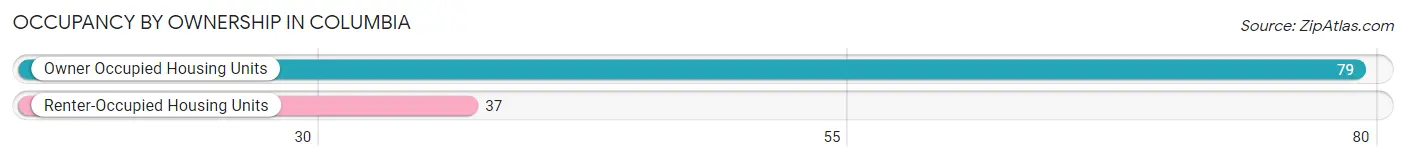
| Occupancy | # Housing Units | % Housing Units |
| Owner Occupied Housing Units | 79 | 68.1% |
| Renter-Occupied Housing Units | 37 | 31.9% |
| Total Occupied Housing Units | 116 | 100.0% |
Occupancy by Household Size in Columbia
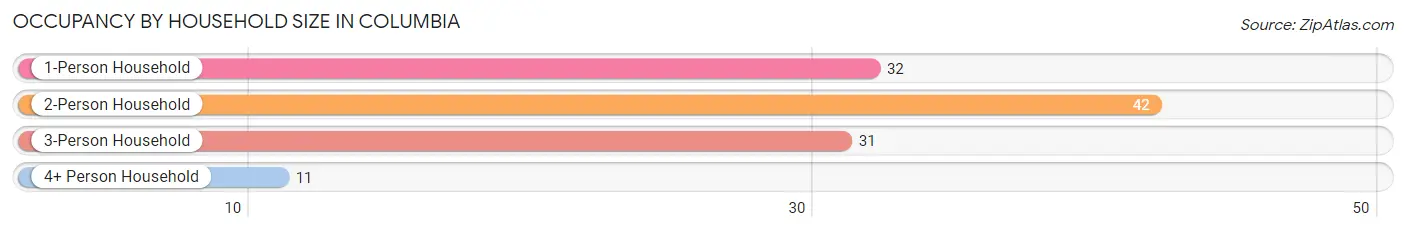
| Household Size | # Housing Units | % Housing Units |
| 1-Person Household | 32 | 27.6% |
| 2-Person Household | 42 | 36.2% |
| 3-Person Household | 31 | 26.7% |
| 4+ Person Household | 11 | 9.5% |
| Total Housing Units | 116 | 100.0% |
Occupancy by Ownership by Household Size in Columbia
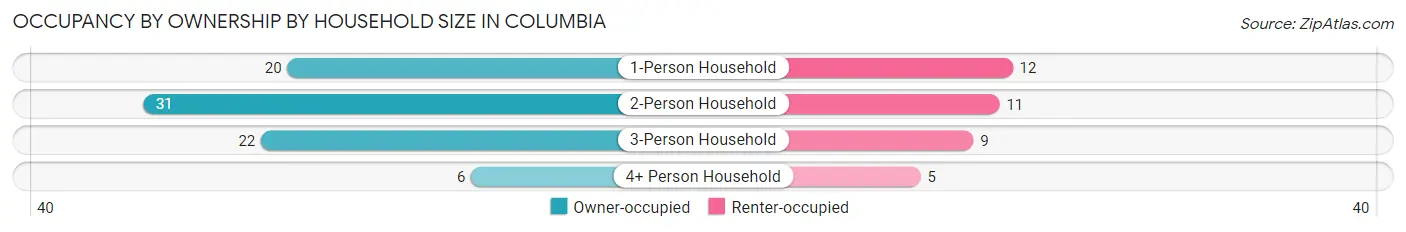
| Household Size | Owner-occupied | Renter-occupied |
| 1-Person Household | 20 (62.5%) | 12 (37.5%) |
| 2-Person Household | 31 (73.8%) | 11 (26.2%) |
| 3-Person Household | 22 (71.0%) | 9 (29.0%) |
| 4+ Person Household | 6 (54.5%) | 5 (45.5%) |
| Total Housing Units | 79 (68.1%) | 37 (31.9%) |
Occupancy by Educational Attainment in Columbia
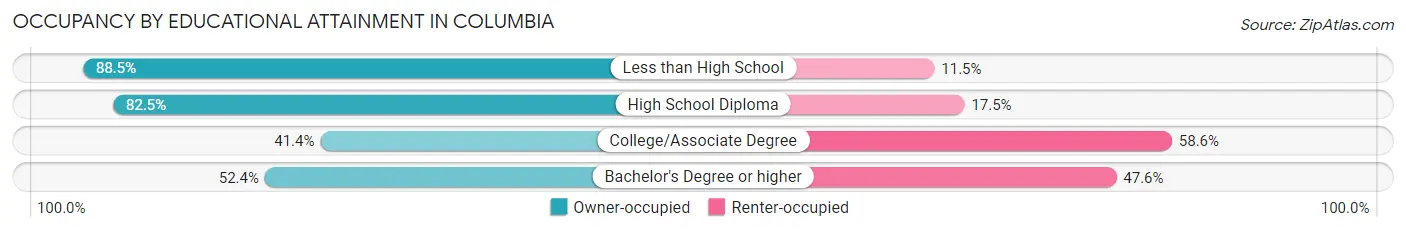
| Household Size | Owner-occupied | Renter-occupied |
| Less than High School | 23 (88.5%) | 3 (11.5%) |
| High School Diploma | 33 (82.5%) | 7 (17.5%) |
| College/Associate Degree | 12 (41.4%) | 17 (58.6%) |
| Bachelor's Degree or higher | 11 (52.4%) | 10 (47.6%) |
Occupancy by Age of Householder in Columbia
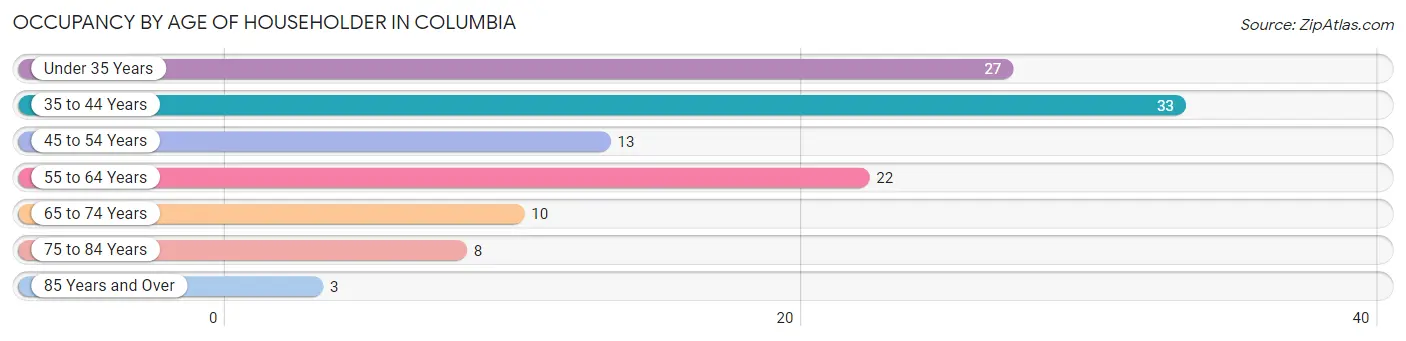
| Age Bracket | # Households | % Households |
| Under 35 Years | 27 | 23.3% |
| 35 to 44 Years | 33 | 28.4% |
| 45 to 54 Years | 13 | 11.2% |
| 55 to 64 Years | 22 | 19.0% |
| 65 to 74 Years | 10 | 8.6% |
| 75 to 84 Years | 8 | 6.9% |
| 85 Years and Over | 3 | 2.6% |
| Total | 116 | 100.0% |
Housing Finances in Columbia
Median Income by Occupancy in Columbia
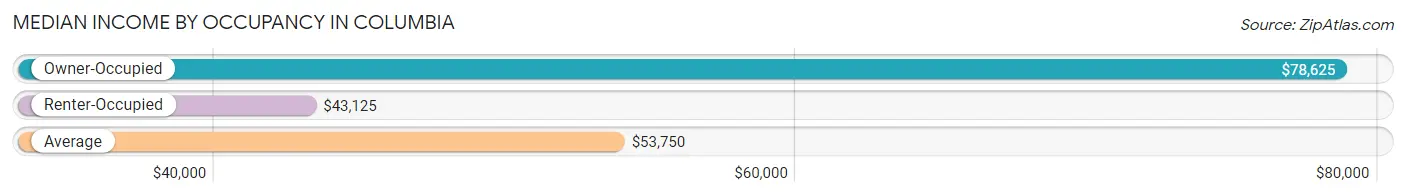
| Occupancy Type | # Households | Median Income |
| Owner-Occupied | 79 (68.1%) | $78,625 |
| Renter-Occupied | 37 (31.9%) | $43,125 |
| Average | 116 (100.0%) | $53,750 |
Occupancy by Householder Income Bracket in Columbia
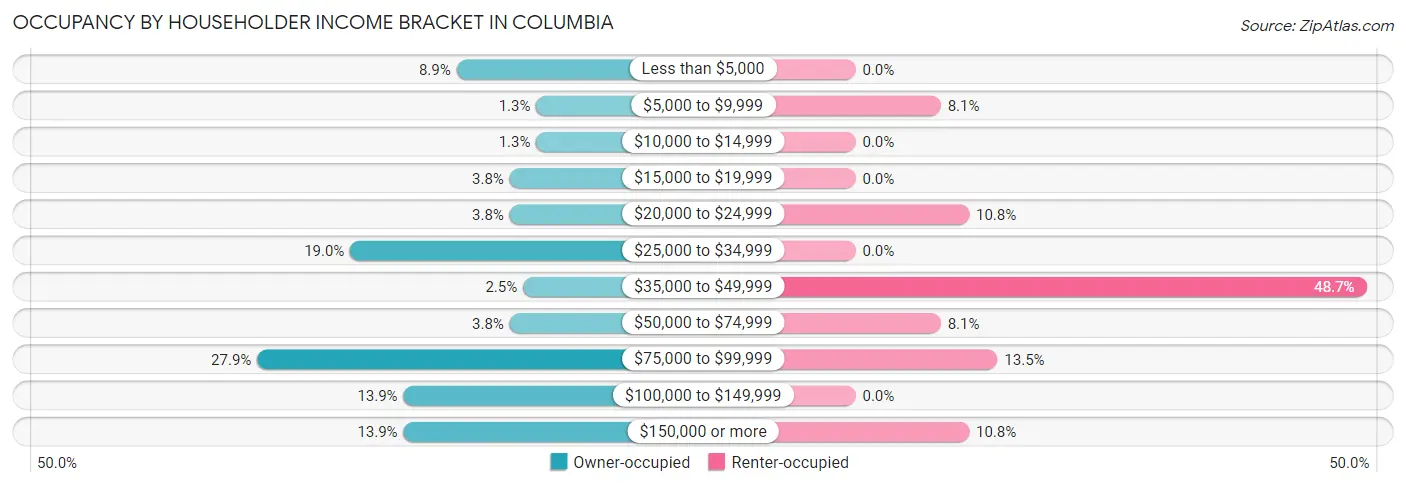
| Income Bracket | Owner-occupied | Renter-occupied |
| Less than $5,000 | 7 (8.9%) | 0 (0.0%) |
| $5,000 to $9,999 | 1 (1.3%) | 3 (8.1%) |
| $10,000 to $14,999 | 1 (1.3%) | 0 (0.0%) |
| $15,000 to $19,999 | 3 (3.8%) | 0 (0.0%) |
| $20,000 to $24,999 | 3 (3.8%) | 4 (10.8%) |
| $25,000 to $34,999 | 15 (19.0%) | 0 (0.0%) |
| $35,000 to $49,999 | 2 (2.5%) | 18 (48.6%) |
| $50,000 to $74,999 | 3 (3.8%) | 3 (8.1%) |
| $75,000 to $99,999 | 22 (27.9%) | 5 (13.5%) |
| $100,000 to $149,999 | 11 (13.9%) | 0 (0.0%) |
| $150,000 or more | 11 (13.9%) | 4 (10.8%) |
| Total | 79 (100.0%) | 37 (100.0%) |
Monthly Housing Cost Tiers in Columbia
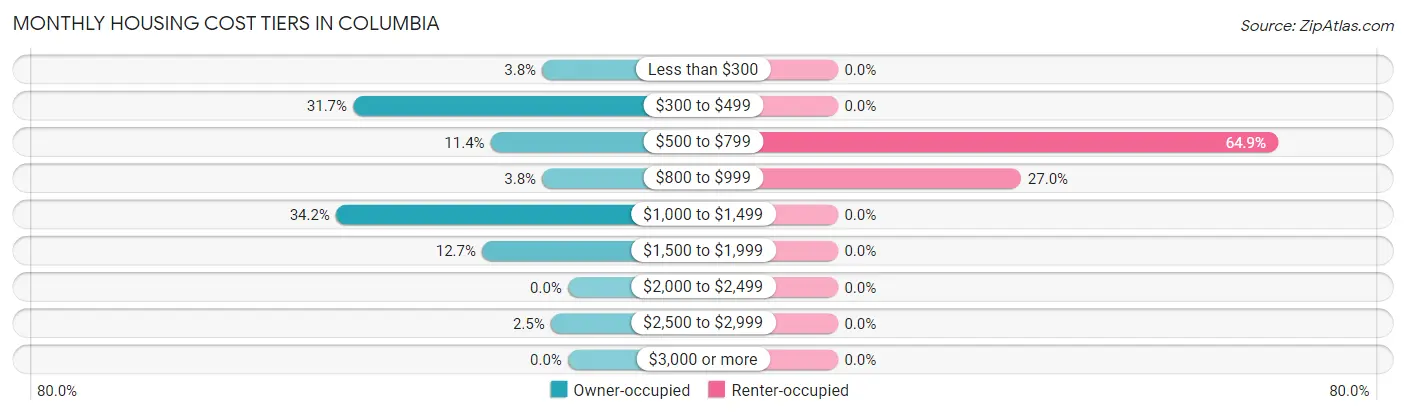
| Monthly Cost | Owner-occupied | Renter-occupied |
| Less than $300 | 3 (3.8%) | 0 (0.0%) |
| $300 to $499 | 25 (31.7%) | 0 (0.0%) |
| $500 to $799 | 9 (11.4%) | 24 (64.9%) |
| $800 to $999 | 3 (3.8%) | 10 (27.0%) |
| $1,000 to $1,499 | 27 (34.2%) | 0 (0.0%) |
| $1,500 to $1,999 | 10 (12.7%) | 0 (0.0%) |
| $2,000 to $2,499 | 0 (0.0%) | 0 (0.0%) |
| $2,500 to $2,999 | 2 (2.5%) | 0 (0.0%) |
| $3,000 or more | 0 (0.0%) | 0 (0.0%) |
| Total | 79 (100.0%) | 37 (100.0%) |
Physical Housing Characteristics in Columbia
Housing Structures in Columbia
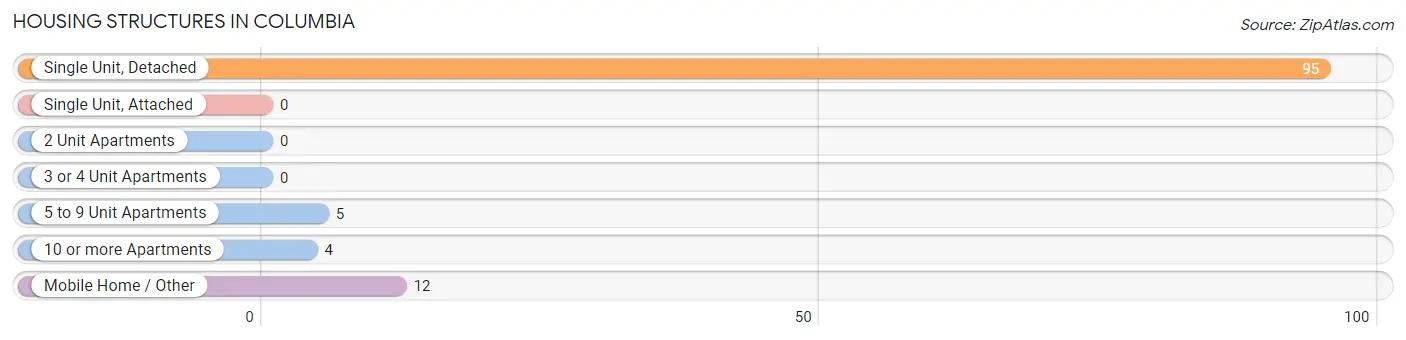
| Structure Type | # Housing Units | % Housing Units |
| Single Unit, Detached | 95 | 81.9% |
| Single Unit, Attached | 0 | 0.0% |
| 2 Unit Apartments | 0 | 0.0% |
| 3 or 4 Unit Apartments | 0 | 0.0% |
| 5 to 9 Unit Apartments | 5 | 4.3% |
| 10 or more Apartments | 4 | 3.5% |
| Mobile Home / Other | 12 | 10.3% |
| Total | 116 | 100.0% |
Housing Structures by Occupancy in Columbia
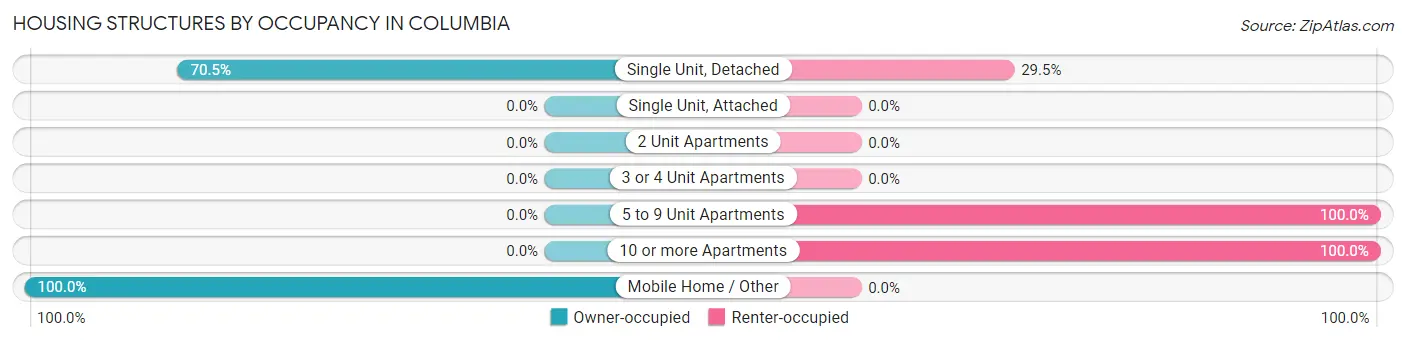
| Structure Type | Owner-occupied | Renter-occupied |
| Single Unit, Detached | 67 (70.5%) | 28 (29.5%) |
| Single Unit, Attached | 0 (0.0%) | 0 (0.0%) |
| 2 Unit Apartments | 0 (0.0%) | 0 (0.0%) |
| 3 or 4 Unit Apartments | 0 (0.0%) | 0 (0.0%) |
| 5 to 9 Unit Apartments | 0 (0.0%) | 5 (100.0%) |
| 10 or more Apartments | 0 (0.0%) | 4 (100.0%) |
| Mobile Home / Other | 12 (100.0%) | 0 (0.0%) |
| Total | 79 (68.1%) | 37 (31.9%) |
Housing Structures by Number of Rooms in Columbia
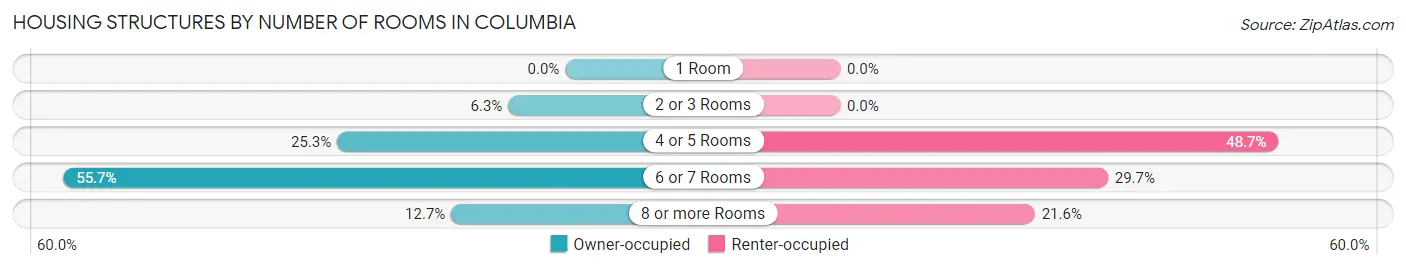
| Number of Rooms | Owner-occupied | Renter-occupied |
| 1 Room | 0 (0.0%) | 0 (0.0%) |
| 2 or 3 Rooms | 5 (6.3%) | 0 (0.0%) |
| 4 or 5 Rooms | 20 (25.3%) | 18 (48.6%) |
| 6 or 7 Rooms | 44 (55.7%) | 11 (29.7%) |
| 8 or more Rooms | 10 (12.7%) | 8 (21.6%) |
| Total | 79 (100.0%) | 37 (100.0%) |
Housing Structure by Heating Type in Columbia
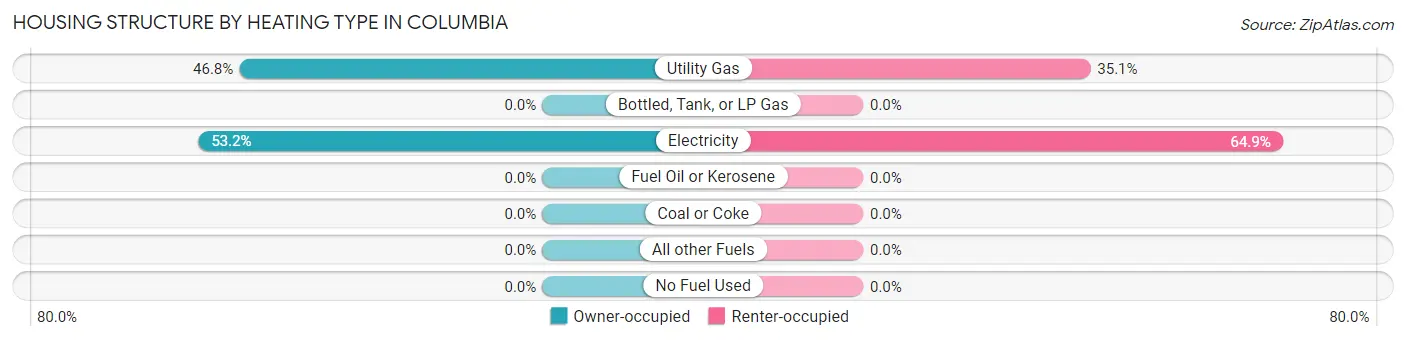
| Heating Type | Owner-occupied | Renter-occupied |
| Utility Gas | 37 (46.8%) | 13 (35.1%) |
| Bottled, Tank, or LP Gas | 0 (0.0%) | 0 (0.0%) |
| Electricity | 42 (53.2%) | 24 (64.9%) |
| Fuel Oil or Kerosene | 0 (0.0%) | 0 (0.0%) |
| Coal or Coke | 0 (0.0%) | 0 (0.0%) |
| All other Fuels | 0 (0.0%) | 0 (0.0%) |
| No Fuel Used | 0 (0.0%) | 0 (0.0%) |
| Total | 79 (100.0%) | 37 (100.0%) |
Household Vehicle Usage in Columbia
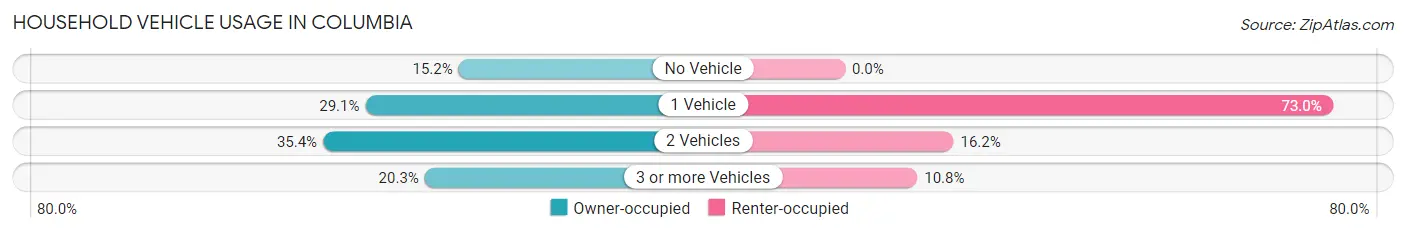
| Vehicles per Household | Owner-occupied | Renter-occupied |
| No Vehicle | 12 (15.2%) | 0 (0.0%) |
| 1 Vehicle | 23 (29.1%) | 27 (73.0%) |
| 2 Vehicles | 28 (35.4%) | 6 (16.2%) |
| 3 or more Vehicles | 16 (20.3%) | 4 (10.8%) |
| Total | 79 (100.0%) | 37 (100.0%) |
Real Estate & Mortgages in Columbia
Real Estate and Mortgage Overview in Columbia
| Characteristic | Without Mortgage | With Mortgage |
| Housing Units | 33 | 46 |
| Median Property Value | $117,000 | $145,800 |
| Median Household Income | $30,750 | $7 |
| Monthly Housing Costs | $388 | $0 |
| Real Estate Taxes | $199 | $4 |
Property Value by Mortgage Status in Columbia
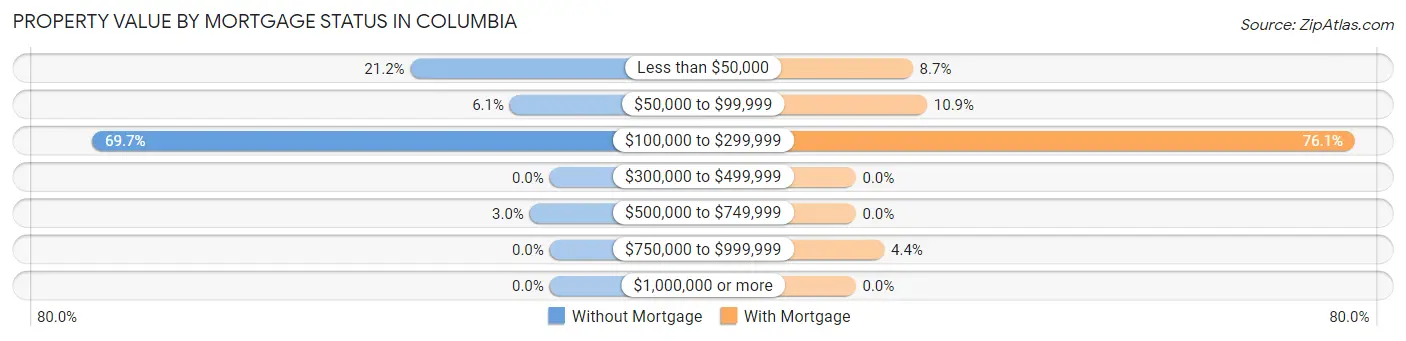
| Property Value | Without Mortgage | With Mortgage |
| Less than $50,000 | 7 (21.2%) | 4 (8.7%) |
| $50,000 to $99,999 | 2 (6.1%) | 5 (10.9%) |
| $100,000 to $299,999 | 23 (69.7%) | 35 (76.1%) |
| $300,000 to $499,999 | 0 (0.0%) | 0 (0.0%) |
| $500,000 to $749,999 | 1 (3.0%) | 0 (0.0%) |
| $750,000 to $999,999 | 0 (0.0%) | 2 (4.3%) |
| $1,000,000 or more | 0 (0.0%) | 0 (0.0%) |
| Total | 33 (100.0%) | 46 (100.0%) |
Household Income by Mortgage Status in Columbia
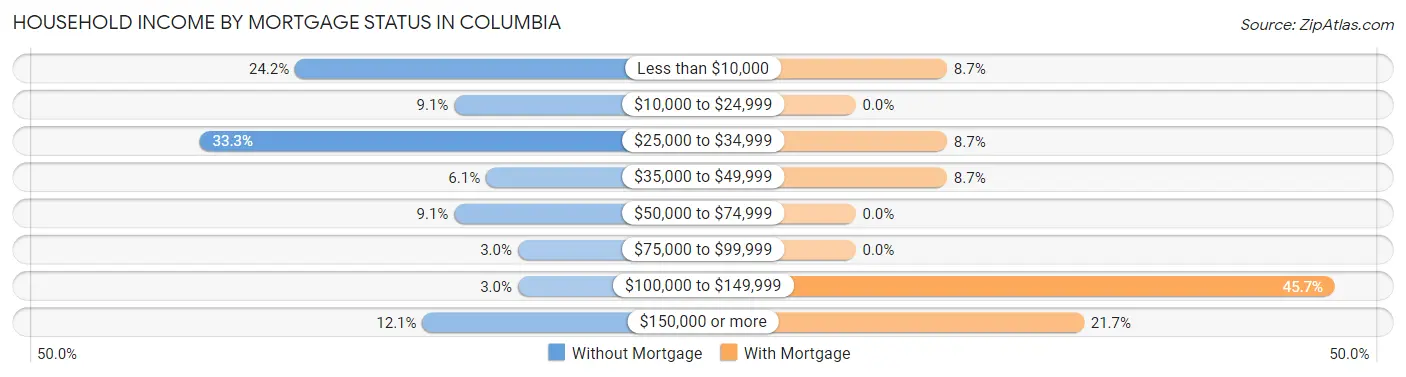
| Household Income | Without Mortgage | With Mortgage |
| Less than $10,000 | 8 (24.2%) | 4 (8.7%) |
| $10,000 to $24,999 | 3 (9.1%) | 0 (0.0%) |
| $25,000 to $34,999 | 11 (33.3%) | 4 (8.7%) |
| $35,000 to $49,999 | 2 (6.1%) | 4 (8.7%) |
| $50,000 to $74,999 | 3 (9.1%) | 0 (0.0%) |
| $75,000 to $99,999 | 1 (3.0%) | 0 (0.0%) |
| $100,000 to $149,999 | 1 (3.0%) | 21 (45.7%) |
| $150,000 or more | 4 (12.1%) | 10 (21.7%) |
| Total | 33 (100.0%) | 46 (100.0%) |
Property Value to Household Income Ratio in Columbia
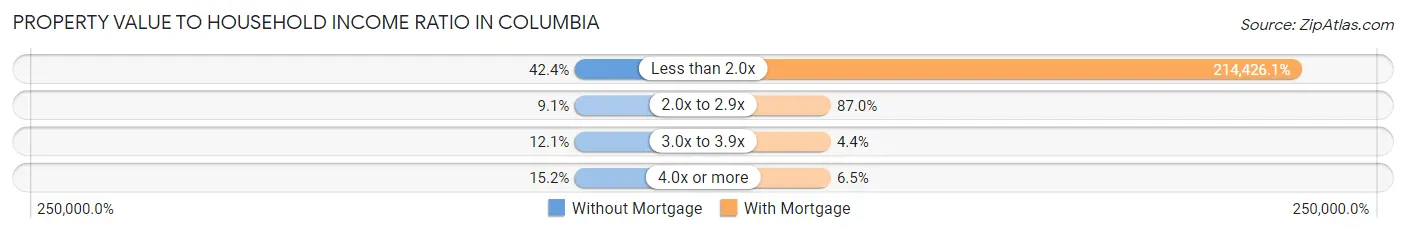
| Value-to-Income Ratio | Without Mortgage | With Mortgage |
| Less than 2.0x | 14 (42.4%) | 98,636 (214,426.1%) |
| 2.0x to 2.9x | 3 (9.1%) | 40 (87.0%) |
| 3.0x to 3.9x | 4 (12.1%) | 2 (4.3%) |
| 4.0x or more | 5 (15.1%) | 3 (6.5%) |
| Total | 33 (100.0%) | 46 (100.0%) |
Real Estate Taxes by Mortgage Status in Columbia
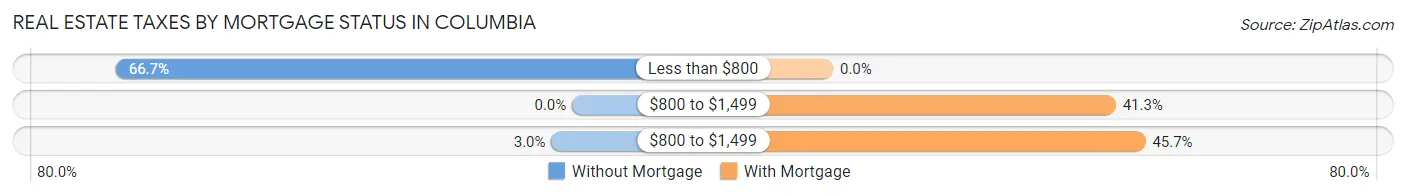
| Property Taxes | Without Mortgage | With Mortgage |
| Less than $800 | 22 (66.7%) | 0 (0.0%) |
| $800 to $1,499 | 0 (0.0%) | 19 (41.3%) |
| $800 to $1,499 | 1 (3.0%) | 21 (45.7%) |
| Total | 33 (100.0%) | 46 (100.0%) |
Health & Disability in Columbia
Health Insurance Coverage by Age in Columbia
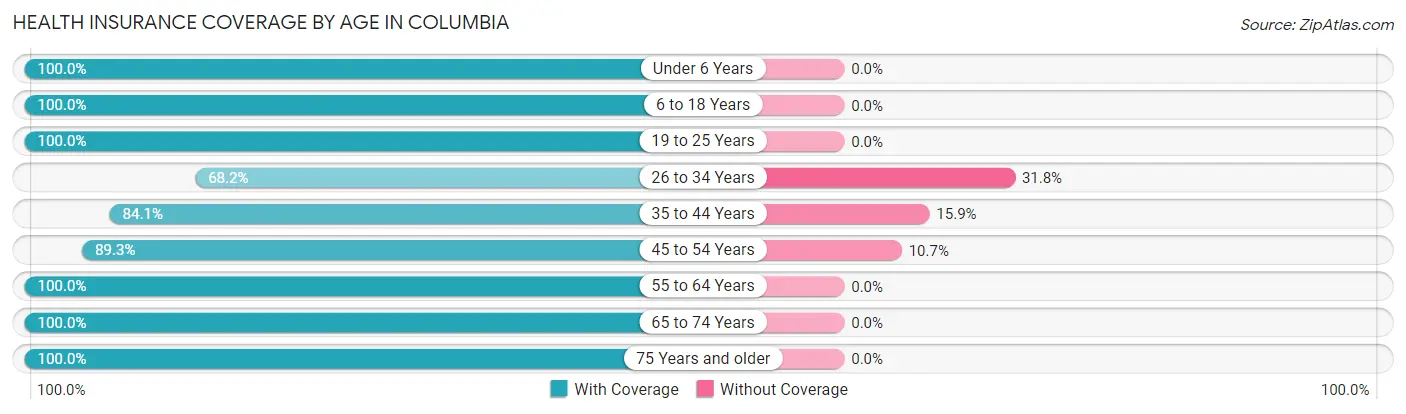
| Age Bracket | With Coverage | Without Coverage |
| Under 6 Years | 32 (100.0%) | 0 (0.0%) |
| 6 to 18 Years | 64 (100.0%) | 0 (0.0%) |
| 19 to 25 Years | 20 (100.0%) | 0 (0.0%) |
| 26 to 34 Years | 30 (68.2%) | 14 (31.8%) |
| 35 to 44 Years | 53 (84.1%) | 10 (15.9%) |
| 45 to 54 Years | 25 (89.3%) | 3 (10.7%) |
| 55 to 64 Years | 32 (100.0%) | 0 (0.0%) |
| 65 to 74 Years | 12 (100.0%) | 0 (0.0%) |
| 75 Years and older | 15 (100.0%) | 0 (0.0%) |
| Total | 283 (91.3%) | 27 (8.7%) |
Health Insurance Coverage by Citizenship Status in Columbia
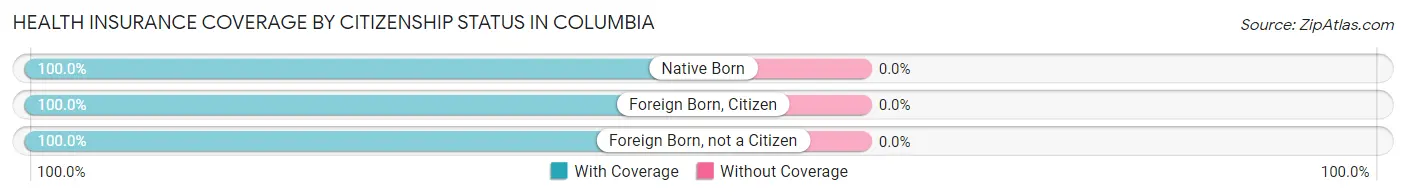
| Citizenship Status | With Coverage | Without Coverage |
| Native Born | 32 (100.0%) | 0 (0.0%) |
| Foreign Born, Citizen | 64 (100.0%) | 0 (0.0%) |
| Foreign Born, not a Citizen | 20 (100.0%) | 0 (0.0%) |
Health Insurance Coverage by Household Income in Columbia
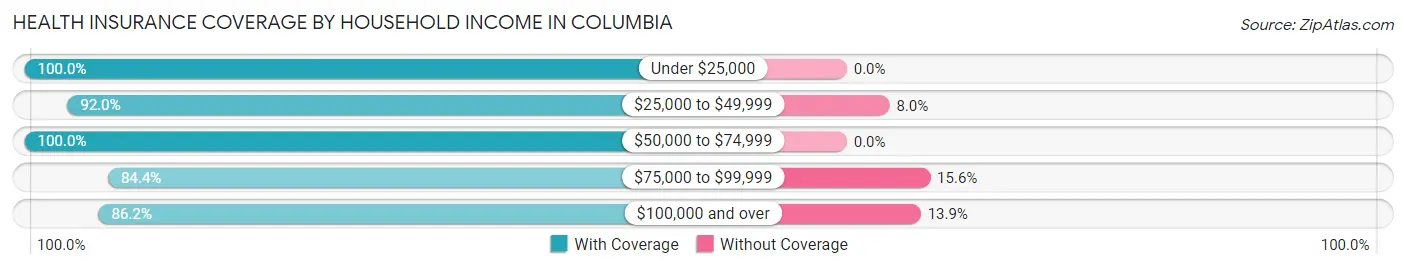
| Household Income | With Coverage | Without Coverage |
| Under $25,000 | 47 (100.0%) | 0 (0.0%) |
| $25,000 to $49,999 | 92 (92.0%) | 8 (8.0%) |
| $50,000 to $74,999 | 34 (100.0%) | 0 (0.0%) |
| $75,000 to $99,999 | 54 (84.4%) | 10 (15.6%) |
| $100,000 and over | 56 (86.2%) | 9 (13.9%) |
Public vs Private Health Insurance Coverage by Age in Columbia
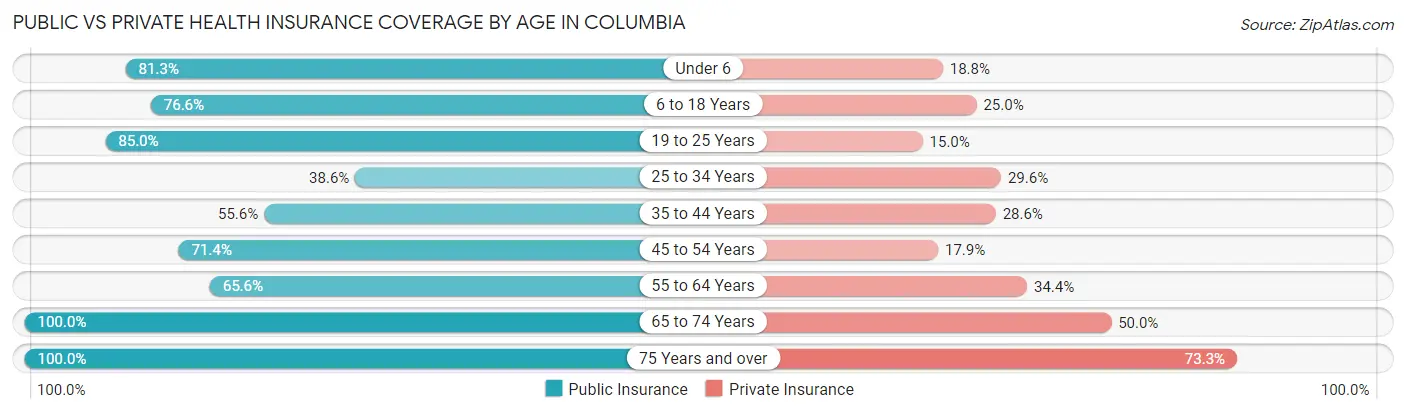
| Age Bracket | Public Insurance | Private Insurance |
| Under 6 | 26 (81.2%) | 6 (18.8%) |
| 6 to 18 Years | 49 (76.6%) | 16 (25.0%) |
| 19 to 25 Years | 17 (85.0%) | 3 (15.0%) |
| 25 to 34 Years | 17 (38.6%) | 13 (29.5%) |
| 35 to 44 Years | 35 (55.6%) | 18 (28.6%) |
| 45 to 54 Years | 20 (71.4%) | 5 (17.9%) |
| 55 to 64 Years | 21 (65.6%) | 11 (34.4%) |
| 65 to 74 Years | 12 (100.0%) | 6 (50.0%) |
| 75 Years and over | 15 (100.0%) | 11 (73.3%) |
| Total | 212 (68.4%) | 89 (28.7%) |
Disability Status by Sex by Age in Columbia
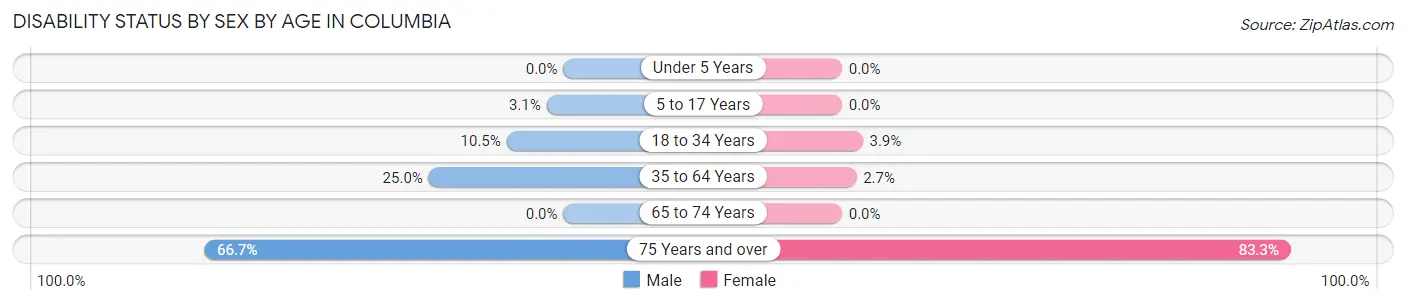
| Age Bracket | Male | Female |
| Under 5 Years | 0 (0.0%) | 0 (0.0%) |
| 5 to 17 Years | 1 (3.1%) | 0 (0.0%) |
| 18 to 34 Years | 4 (10.5%) | 1 (3.8%) |
| 35 to 64 Years | 12 (25.0%) | 2 (2.7%) |
| 65 to 74 Years | 0 (0.0%) | 0 (0.0%) |
| 75 Years and over | 2 (66.7%) | 10 (83.3%) |
Disability Class by Sex by Age in Columbia
Disability Class: Hearing Difficulty
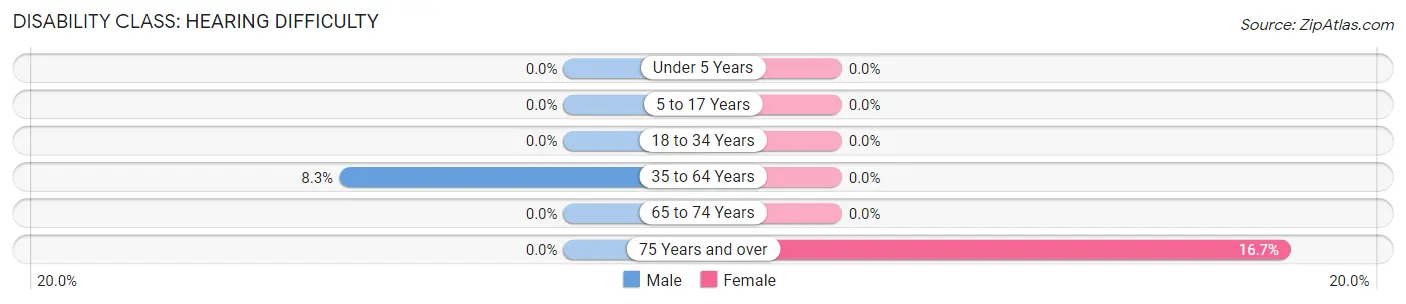
| Age Bracket | Male | Female |
| Under 5 Years | 0 (0.0%) | 0 (0.0%) |
| 5 to 17 Years | 0 (0.0%) | 0 (0.0%) |
| 18 to 34 Years | 0 (0.0%) | 0 (0.0%) |
| 35 to 64 Years | 4 (8.3%) | 0 (0.0%) |
| 65 to 74 Years | 0 (0.0%) | 0 (0.0%) |
| 75 Years and over | 0 (0.0%) | 2 (16.7%) |
Disability Class: Vision Difficulty
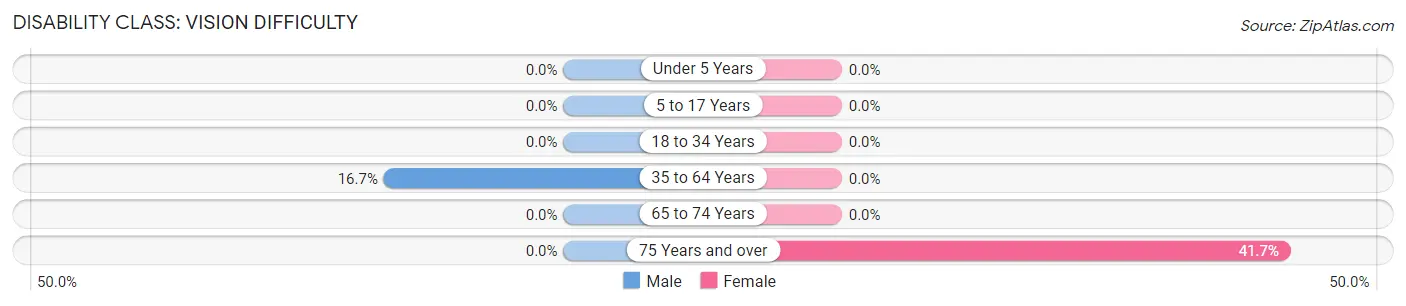
| Age Bracket | Male | Female |
| Under 5 Years | 0 (0.0%) | 0 (0.0%) |
| 5 to 17 Years | 0 (0.0%) | 0 (0.0%) |
| 18 to 34 Years | 0 (0.0%) | 0 (0.0%) |
| 35 to 64 Years | 8 (16.7%) | 0 (0.0%) |
| 65 to 74 Years | 0 (0.0%) | 0 (0.0%) |
| 75 Years and over | 0 (0.0%) | 5 (41.7%) |
Disability Class: Cognitive Difficulty
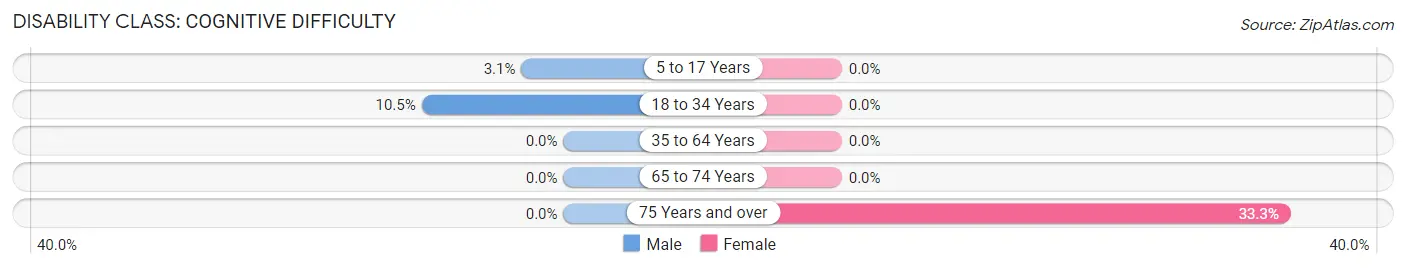
| Age Bracket | Male | Female |
| 5 to 17 Years | 1 (3.1%) | 0 (0.0%) |
| 18 to 34 Years | 4 (10.5%) | 0 (0.0%) |
| 35 to 64 Years | 0 (0.0%) | 0 (0.0%) |
| 65 to 74 Years | 0 (0.0%) | 0 (0.0%) |
| 75 Years and over | 0 (0.0%) | 4 (33.3%) |
Disability Class: Ambulatory Difficulty
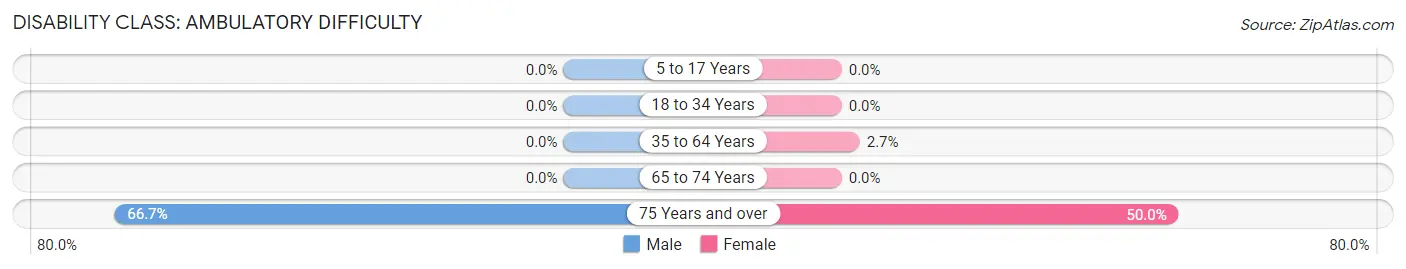
| Age Bracket | Male | Female |
| 5 to 17 Years | 0 (0.0%) | 0 (0.0%) |
| 18 to 34 Years | 0 (0.0%) | 0 (0.0%) |
| 35 to 64 Years | 0 (0.0%) | 2 (2.7%) |
| 65 to 74 Years | 0 (0.0%) | 0 (0.0%) |
| 75 Years and over | 2 (66.7%) | 6 (50.0%) |
Disability Class: Self-Care Difficulty
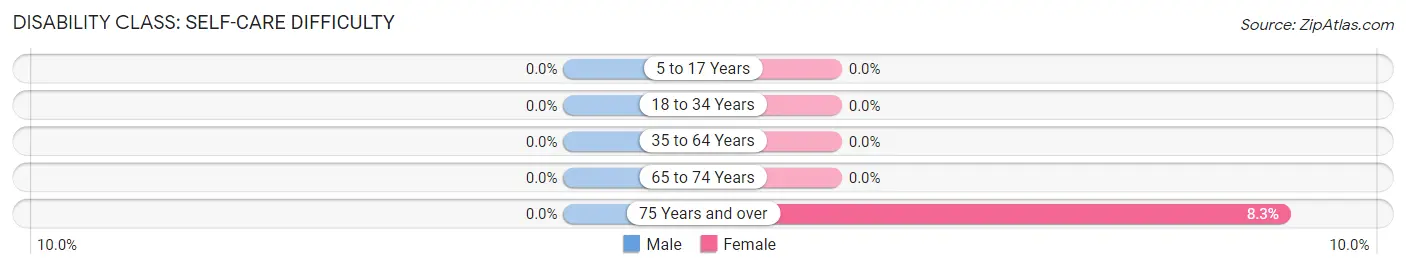
| Age Bracket | Male | Female |
| 5 to 17 Years | 0 (0.0%) | 0 (0.0%) |
| 18 to 34 Years | 0 (0.0%) | 0 (0.0%) |
| 35 to 64 Years | 0 (0.0%) | 0 (0.0%) |
| 65 to 74 Years | 0 (0.0%) | 0 (0.0%) |
| 75 Years and over | 0 (0.0%) | 1 (8.3%) |
Technology Access in Columbia
Computing Device Access in Columbia
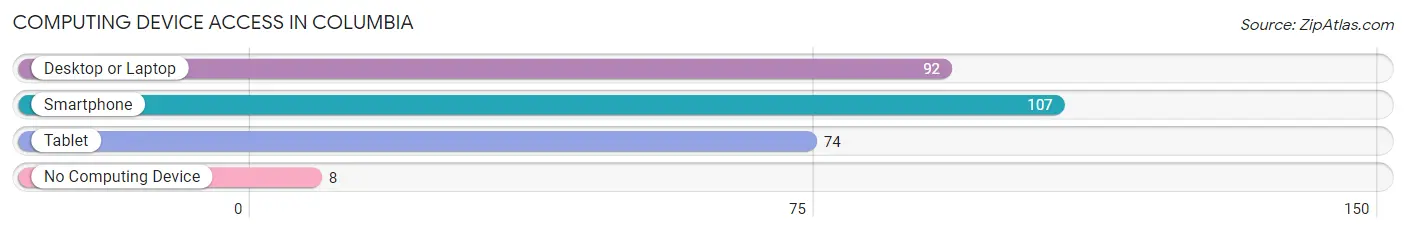
| Device Type | # Households | % Households |
| Desktop or Laptop | 92 | 79.3% |
| Smartphone | 107 | 92.2% |
| Tablet | 74 | 63.8% |
| No Computing Device | 8 | 6.9% |
| Total | 116 | 100.0% |
Internet Access in Columbia
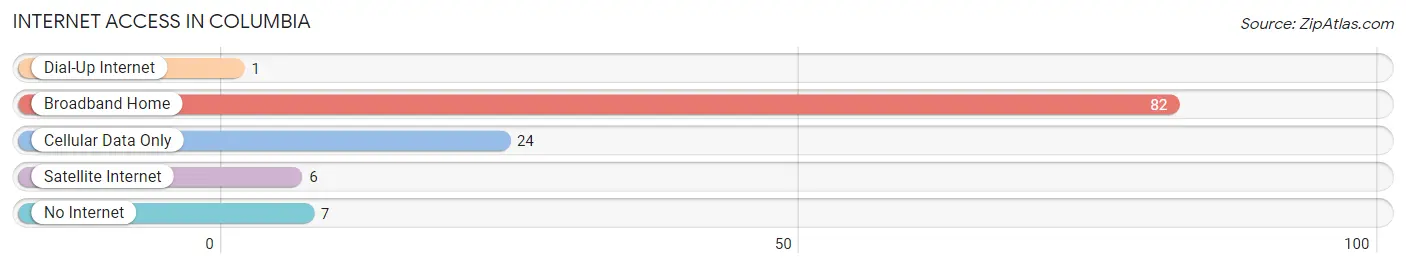
| Internet Type | # Households | % Households |
| Dial-Up Internet | 1 | 0.9% |
| Broadband Home | 82 | 70.7% |
| Cellular Data Only | 24 | 20.7% |
| Satellite Internet | 6 | 5.2% |
| No Internet | 7 | 6.0% |
| Total | 116 | 100.0% |
Columbia Summary
Columbia, Louisiana is a small town located in Caldwell Parish in the northeastern part of the state. It is situated on the banks of the Ouachita River, and is the parish seat of Caldwell Parish. The town has a population of approximately 1,500 people, and is part of the larger Monroe Metropolitan Statistical Area.
History
Columbia was founded in 1845 by a group of settlers from the nearby town of Monroe. The town was named after the Columbia River in Oregon, and was originally intended to be a trading post for the local Native American tribes. The town quickly grew, and by the late 19th century, it had become a major hub for the timber industry. The town was also home to a number of cotton plantations, and was a major stop on the Ouachita River.
In the early 20th century, Columbia began to experience a decline in population as the timber industry began to decline. The town was also hit hard by the Great Depression, and many of the local businesses closed. However, the town was able to survive, and in the 1950s, it began to experience a resurgence in population.
Geography
Columbia is located in the northeastern part of Louisiana, in Caldwell Parish. It is situated on the banks of the Ouachita River, and is approximately 30 miles from the state capital of Baton Rouge. The town is surrounded by a number of small towns and villages, including Grayson, Grayson Lake, and Grayson Landing.
The town has a total area of 1.3 square miles, all of which is land. The town is located in a humid subtropical climate zone, and experiences hot, humid summers and mild winters. The average annual temperature is around 70 degrees Fahrenheit, and the average annual precipitation is around 50 inches.
Economy
The economy of Columbia is largely based on agriculture and timber. The town is home to a number of small farms, and the surrounding area is home to a number of timber companies. The town is also home to a number of small businesses, including restaurants, retail stores, and service providers.
Demographics
As of the 2010 census, the population of Columbia was 1,500 people. The racial makeup of the town was 79.3% White, 17.3% African American, 0.7% Native American, 0.3% Asian, and 2.7% from other races. The median household income was $30,000, and the median family income was $35,000. The per capita income was $14,000.
The town is served by the Caldwell Parish School District, and is home to a number of public and private schools. The town is also home to a number of churches, including the First Baptist Church of Columbia. The town is served by the Ouachita Parish Library, and is home to a number of parks and recreational facilities.
Common Questions
What is Per Capita Income in Columbia?
Per Capita income in Columbia is $26,097.
What is the Median Family Income in Columbia?
Median Family Income in Columbia is $79,625.
What is the Median Household income in Columbia?
Median Household Income in Columbia is $53,750.
What is Inequality or Gini Index in Columbia?
Inequality or Gini Index in Columbia is 0.45.
What is the Total Population of Columbia?
Total Population of Columbia is 341.
What is the Total Male Population of Columbia?
Total Male Population of Columbia is 174.
What is the Total Female Population of Columbia?
Total Female Population of Columbia is 167.
What is the Ratio of Males per 100 Females in Columbia?
There are 104.19 Males per 100 Females in Columbia.
What is the Ratio of Females per 100 Males in Columbia?
There are 95.98 Females per 100 Males in Columbia.
What is the Median Population Age in Columbia?
Median Population Age in Columbia is 33.8 Years.
What is the Average Family Size in Columbia
Average Family Size in Columbia is 3.2 People.
What is the Average Household Size in Columbia
Average Household Size in Columbia is 2.7 People.
How Large is the Labor Force in Columbia?
There are 124 People in the Labor Forcein in Columbia.
What is the Percentage of People in the Labor Force in Columbia?
48.1% of People are in the Labor Force in Columbia.
What is the Unemployment Rate in Columbia?
Unemployment Rate in Columbia is 6.5%.