Clayton, LA Map & Demographics
Clayton Map
Clayton Overview
$23,140
PER CAPITA INCOME
$78,008
AVG FAMILY INCOME
$47,292
AVG HOUSEHOLD INCOME
61.7%
WAGE / INCOME GAP [ % ]
38.3¢/ $1
WAGE / INCOME GAP [ $ ]
0.42
INEQUALITY / GINI INDEX
317
TOTAL POPULATION
162
MALE POPULATION
155
FEMALE POPULATION
104.52
MALES / 100 FEMALES
95.68
FEMALES / 100 MALES
55.3
MEDIAN AGE
3.0
AVG FAMILY SIZE
2.3
AVG HOUSEHOLD SIZE
146
LABOR FORCE [ PEOPLE ]
59.1%
PERCENT IN LABOR FORCE
4.8%
UNEMPLOYMENT RATE
Clayton Zip Codes
Clayton Area Codes
Income in Clayton
Income Overview in Clayton
Per Capita Income in Clayton is $23,140, while median incomes of families and households are $78,008 and $47,292 respectively.
| Characteristic | Number | Measure |
| Per Capita Income | 317 | $23,140 |
| Median Family Income | 89 | $78,008 |
| Mean Family Income | 89 | $67,061 |
| Median Household Income | 139 | $47,292 |
| Mean Household Income | 139 | $50,388 |
| Income Deficit | 89 | $0 |
| Wage / Income Gap (%) | 317 | 61.75% |
| Wage / Income Gap ($) | 317 | 38.25¢ per $1 |
| Gini / Inequality Index | 317 | 0.42 |
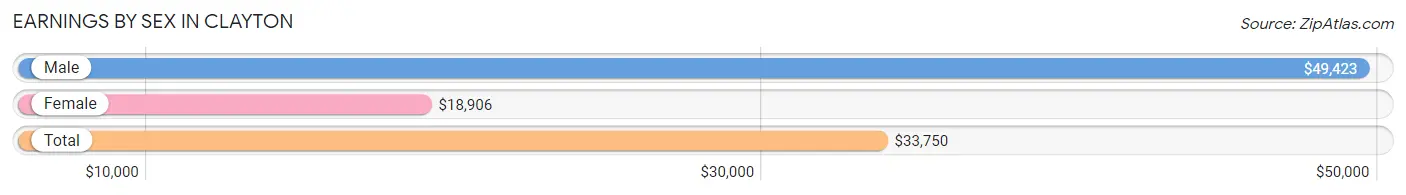
Earnings by Sex in Clayton
Average Earnings in Clayton are $33,750, $49,423 for men and $18,906 for women, a difference of 61.8%.
| Sex | Number | Average Earnings |
| Male | 66 (45.8%) | $49,423 |
| Female | 78 (54.2%) | $18,906 |
| Total | 144 (100.0%) | $33,750 |
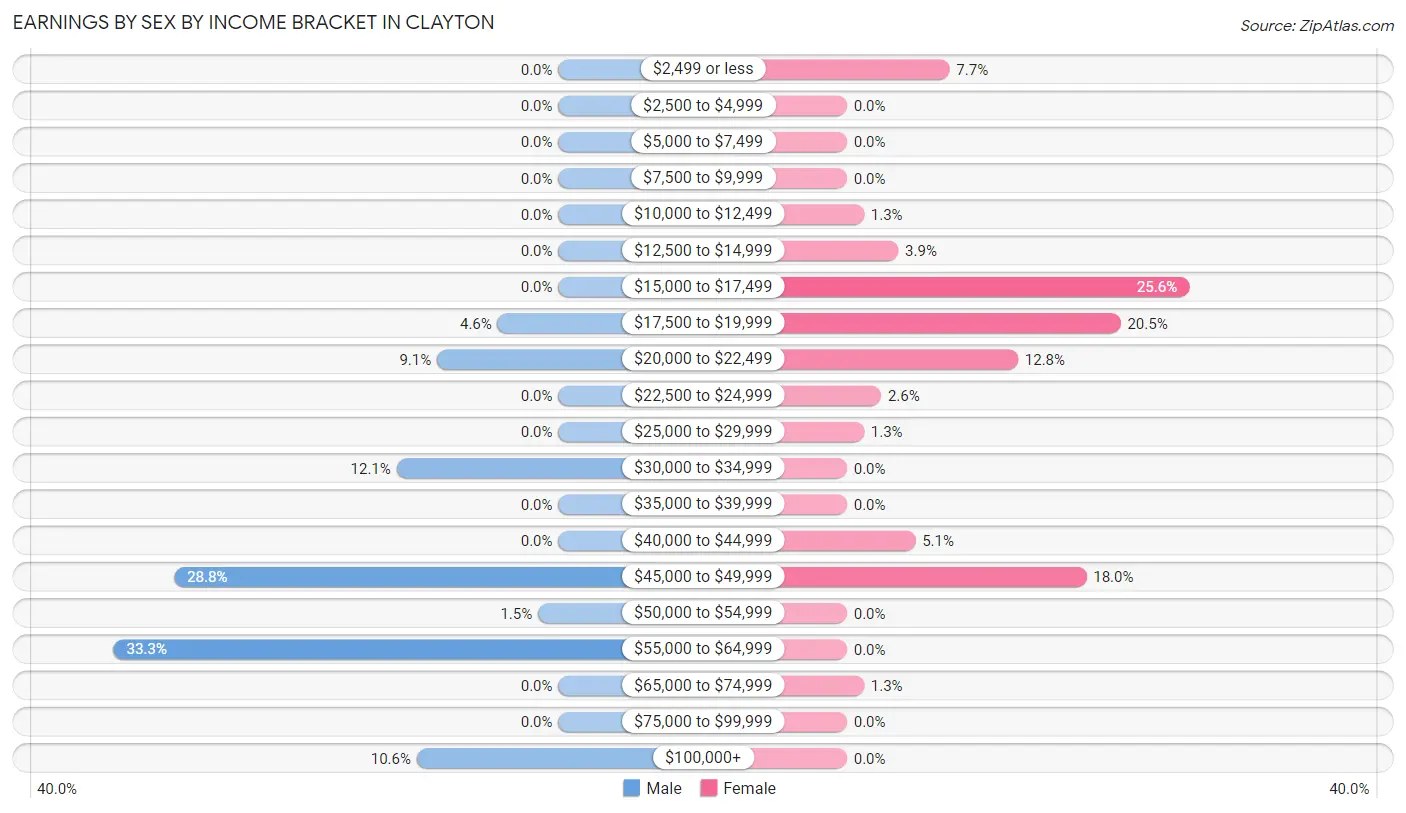
Earnings by Sex by Income Bracket in Clayton
The most common earnings brackets in Clayton are $55,000 to $64,999 for men (22 | 33.3%) and $15,000 to $17,499 for women (20 | 25.6%).
| Income | Male | Female |
| $2,499 or less | 0 (0.0%) | 6 (7.7%) |
| $2,500 to $4,999 | 0 (0.0%) | 0 (0.0%) |
| $5,000 to $7,499 | 0 (0.0%) | 0 (0.0%) |
| $7,500 to $9,999 | 0 (0.0%) | 0 (0.0%) |
| $10,000 to $12,499 | 0 (0.0%) | 1 (1.3%) |
| $12,500 to $14,999 | 0 (0.0%) | 3 (3.8%) |
| $15,000 to $17,499 | 0 (0.0%) | 20 (25.6%) |
| $17,500 to $19,999 | 3 (4.5%) | 16 (20.5%) |
| $20,000 to $22,499 | 6 (9.1%) | 10 (12.8%) |
| $22,500 to $24,999 | 0 (0.0%) | 2 (2.6%) |
| $25,000 to $29,999 | 0 (0.0%) | 1 (1.3%) |
| $30,000 to $34,999 | 8 (12.1%) | 0 (0.0%) |
| $35,000 to $39,999 | 0 (0.0%) | 0 (0.0%) |
| $40,000 to $44,999 | 0 (0.0%) | 4 (5.1%) |
| $45,000 to $49,999 | 19 (28.8%) | 14 (17.9%) |
| $50,000 to $54,999 | 1 (1.5%) | 0 (0.0%) |
| $55,000 to $64,999 | 22 (33.3%) | 0 (0.0%) |
| $65,000 to $74,999 | 0 (0.0%) | 1 (1.3%) |
| $75,000 to $99,999 | 0 (0.0%) | 0 (0.0%) |
| $100,000+ | 7 (10.6%) | 0 (0.0%) |
| Total | 66 (100.0%) | 78 (100.0%) |
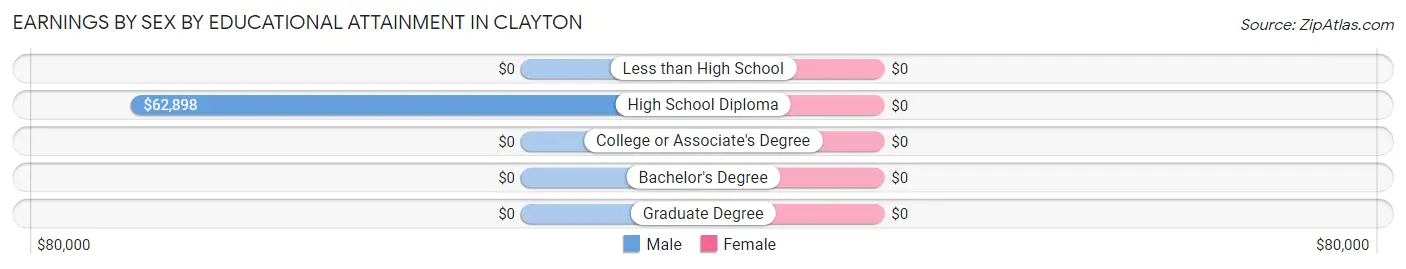
Earnings by Sex by Educational Attainment in Clayton
| Educational Attainment | Male Income | Female Income |
| Less than High School | - | - |
| High School Diploma | $62,898 | $0 |
| College or Associate's Degree | - | - |
| Bachelor's Degree | - | - |
| Graduate Degree | - | - |
| Total | $51,250 | $20,250 |
Family Income in Clayton
Family Income Brackets in Clayton
According to the Clayton family income data, there are 46 families falling into the $75,000 to $99,999 income range, which is the most common income bracket and makes up 51.7% of all families.
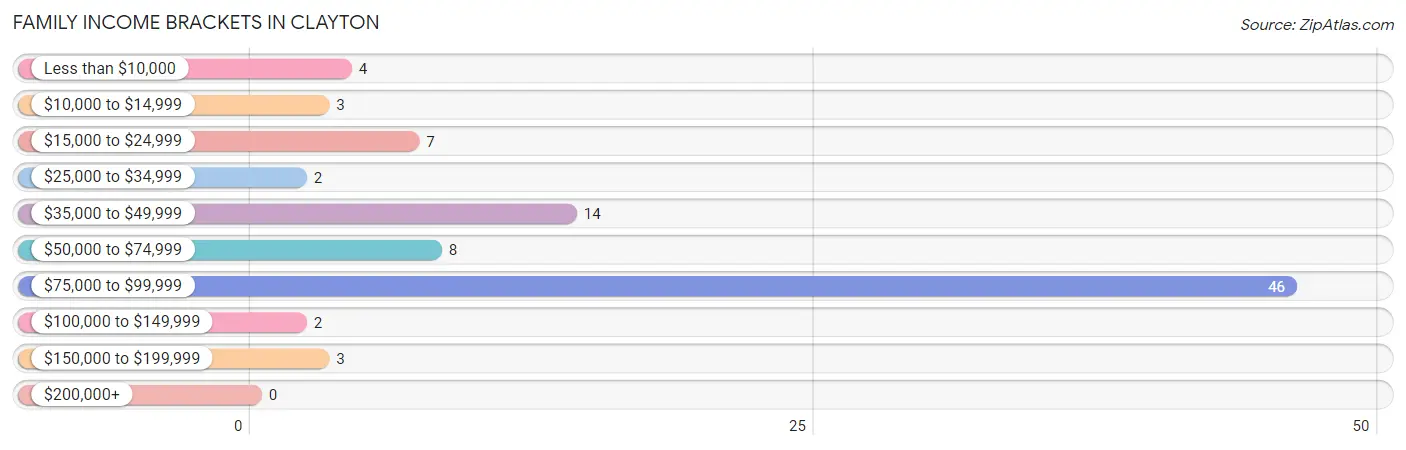
| Income Bracket | # Families | % Families |
| Less than $10,000 | 4 | 4.5% |
| $10,000 to $14,999 | 3 | 3.4% |
| $15,000 to $24,999 | 7 | 7.9% |
| $25,000 to $34,999 | 2 | 2.2% |
| $35,000 to $49,999 | 14 | 15.7% |
| $50,000 to $74,999 | 8 | 9.0% |
| $75,000 to $99,999 | 46 | 51.7% |
| $100,000 to $149,999 | 2 | 2.2% |
| $150,000 to $199,999 | 3 | 3.4% |
| $200,000+ | 0 | 0.0% |
Family Income by Famaliy Size in Clayton
2-person families (55 | 61.8%) account for the highest median family income in Clayton with $78,164 per family, while 2-person families (55 | 61.8%) have the highest median income of $39,082 per family member.
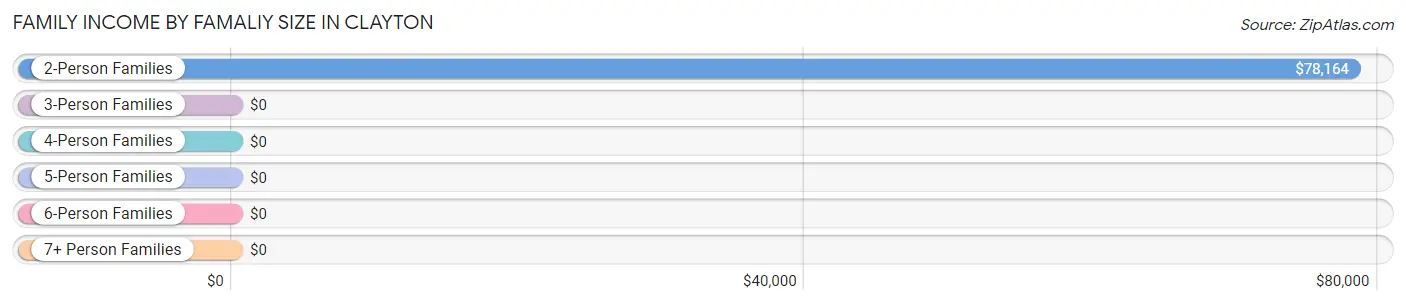
| Income Bracket | # Families | Median Income |
| 2-Person Families | 55 (61.8%) | $78,164 |
| 3-Person Families | 12 (13.5%) | $0 |
| 4-Person Families | 12 (13.5%) | $0 |
| 5-Person Families | 0 (0.0%) | $0 |
| 6-Person Families | 10 (11.2%) | $0 |
| 7+ Person Families | 0 (0.0%) | $0 |
| Total | 89 (100.0%) | $78,008 |
Family Income by Number of Earners in Clayton
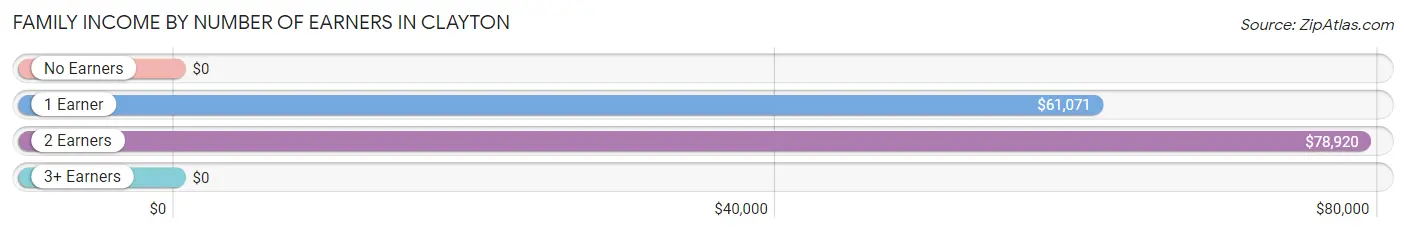
| Number of Earners | # Families | Median Income |
| No Earners | 12 (13.5%) | $0 |
| 1 Earner | 34 (38.2%) | $61,071 |
| 2 Earners | 33 (37.1%) | $78,920 |
| 3+ Earners | 10 (11.2%) | $0 |
| Total | 89 (100.0%) | $78,008 |
Household Income in Clayton
Household Income Brackets in Clayton
With 46 households falling in the category, the $75,000 to $99,999 income range is the most frequent in Clayton, accounting for 33.1% of all households.
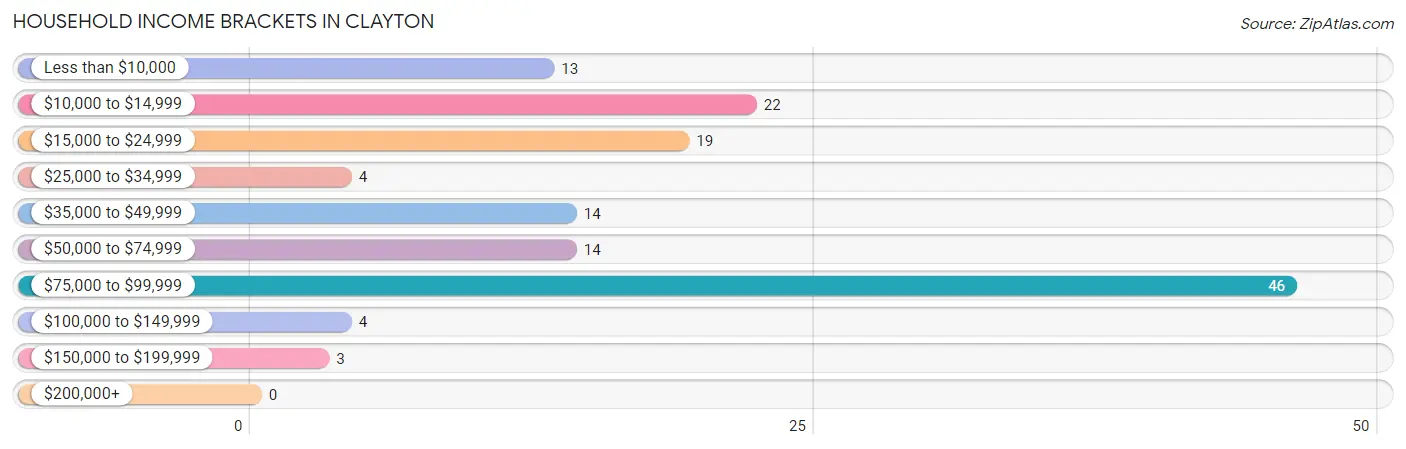
| Income Bracket | # Households | % Households |
| Less than $10,000 | 13 | 9.4% |
| $10,000 to $14,999 | 22 | 15.8% |
| $15,000 to $24,999 | 19 | 13.7% |
| $25,000 to $34,999 | 4 | 2.9% |
| $35,000 to $49,999 | 14 | 10.1% |
| $50,000 to $74,999 | 14 | 10.1% |
| $75,000 to $99,999 | 46 | 33.1% |
| $100,000 to $149,999 | 4 | 2.9% |
| $150,000 to $199,999 | 3 | 2.2% |
| $200,000+ | 0 | 0.0% |
Household Income by Householder Age in Clayton
The median household income in Clayton is $47,292, with the highest median household income of $78,657 found in the 45 to 64 years age bracket for the primary householder. A total of 61 households (43.9%) fall into this category.
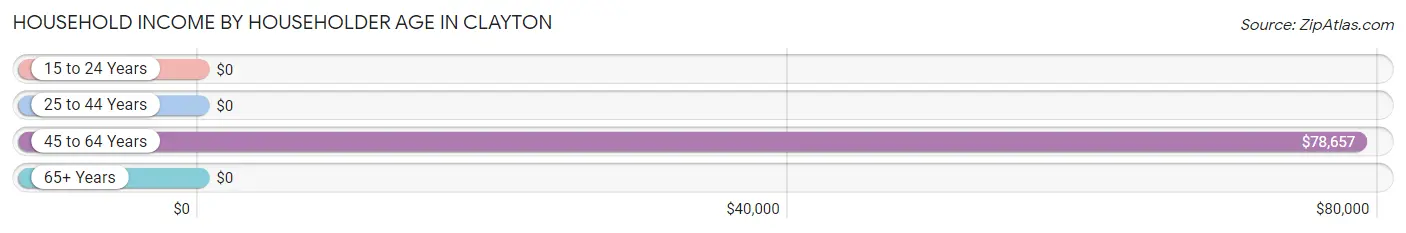
| Income Bracket | # Households | Median Income |
| 15 to 24 Years | 0 (0.0%) | $0 |
| 25 to 44 Years | 27 (19.4%) | $0 |
| 45 to 64 Years | 61 (43.9%) | $78,657 |
| 65+ Years | 51 (36.7%) | $0 |
| Total | 139 (100.0%) | $47,292 |
Poverty in Clayton
Income Below Poverty by Sex and Age in Clayton
With 17.9% poverty level for males and 25.8% for females among the residents of Clayton, 12 to 14 year old males and 35 to 44 year old females are the most vulnerable to poverty, with 4 males (57.1%) and 7 females (87.5%) in their respective age groups living below the poverty level.
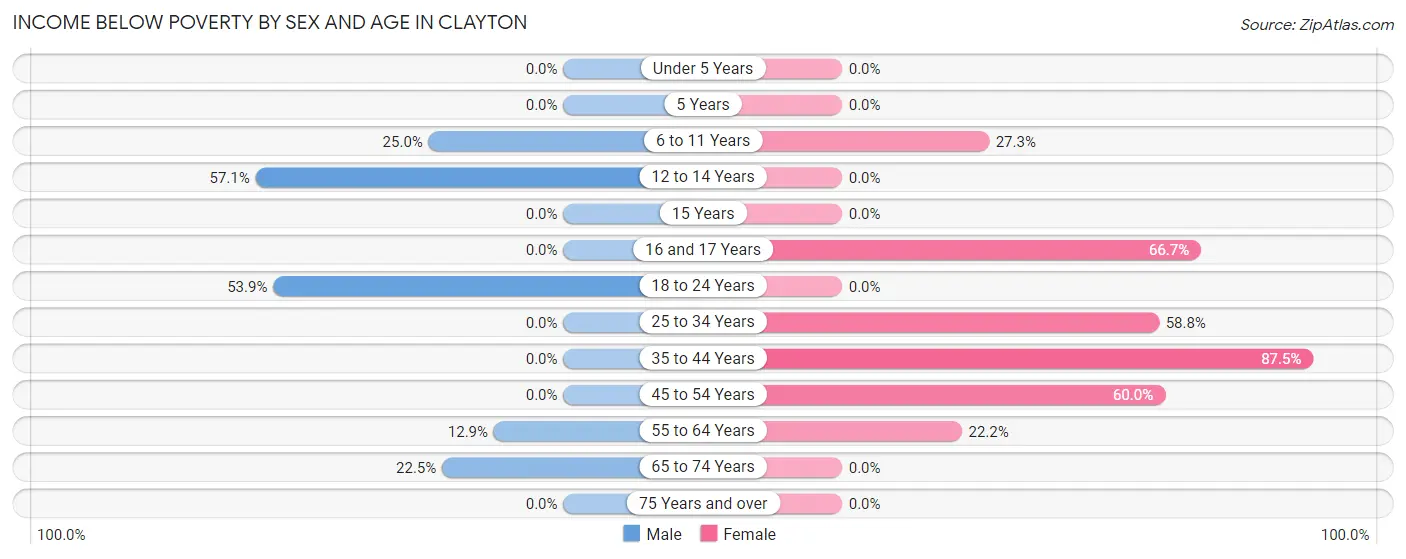
| Age Bracket | Male | Female |
| Under 5 Years | 0 (0.0%) | 0 (0.0%) |
| 5 Years | 0 (0.0%) | 0 (0.0%) |
| 6 to 11 Years | 5 (25.0%) | 6 (27.3%) |
| 12 to 14 Years | 4 (57.1%) | 0 (0.0%) |
| 15 Years | 0 (0.0%) | 0 (0.0%) |
| 16 and 17 Years | 0 (0.0%) | 4 (66.7%) |
| 18 to 24 Years | 7 (53.8%) | 0 (0.0%) |
| 25 to 34 Years | 0 (0.0%) | 10 (58.8%) |
| 35 to 44 Years | 0 (0.0%) | 7 (87.5%) |
| 45 to 54 Years | 0 (0.0%) | 3 (60.0%) |
| 55 to 64 Years | 4 (12.9%) | 10 (22.2%) |
| 65 to 74 Years | 9 (22.5%) | 0 (0.0%) |
| 75 Years and over | 0 (0.0%) | 0 (0.0%) |
| Total | 29 (17.9%) | 40 (25.8%) |
Income Above Poverty by Sex and Age in Clayton
According to the poverty statistics in Clayton, males aged under 5 years and females aged under 5 years are the age groups that are most secure financially, with 100.0% of males and 100.0% of females in these age groups living above the poverty line.
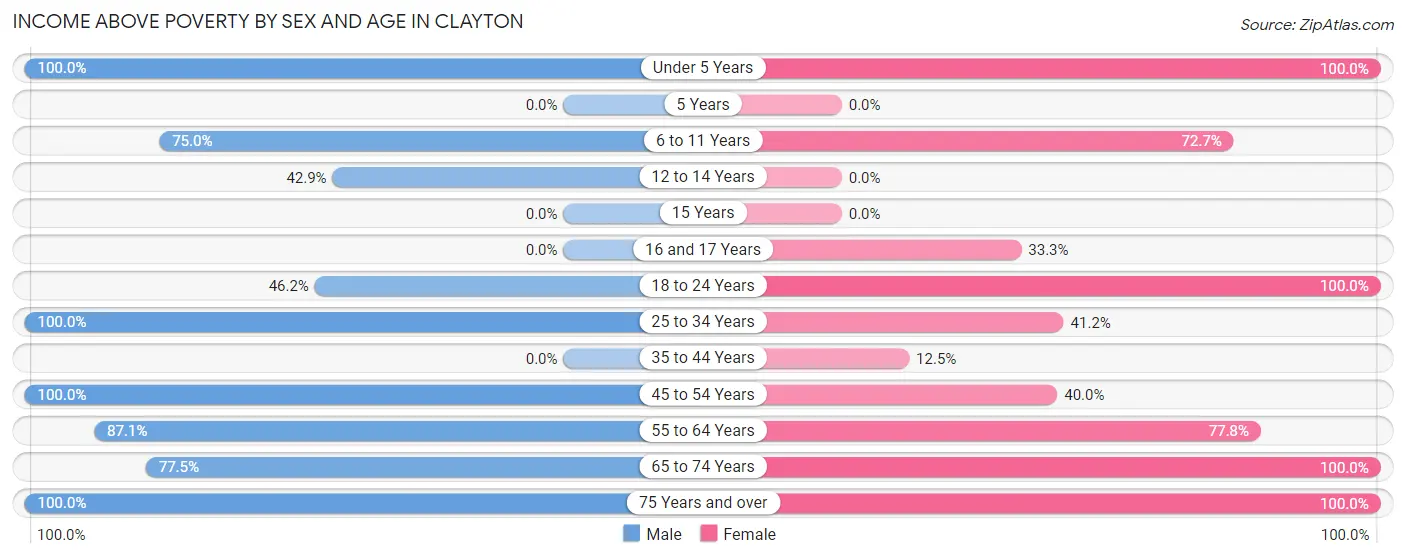
| Age Bracket | Male | Female |
| Under 5 Years | 15 (100.0%) | 6 (100.0%) |
| 5 Years | 0 (0.0%) | 0 (0.0%) |
| 6 to 11 Years | 15 (75.0%) | 16 (72.7%) |
| 12 to 14 Years | 3 (42.9%) | 0 (0.0%) |
| 15 Years | 0 (0.0%) | 0 (0.0%) |
| 16 and 17 Years | 0 (0.0%) | 2 (33.3%) |
| 18 to 24 Years | 6 (46.2%) | 16 (100.0%) |
| 25 to 34 Years | 17 (100.0%) | 7 (41.2%) |
| 35 to 44 Years | 0 (0.0%) | 1 (12.5%) |
| 45 to 54 Years | 2 (100.0%) | 2 (40.0%) |
| 55 to 64 Years | 27 (87.1%) | 35 (77.8%) |
| 65 to 74 Years | 31 (77.5%) | 20 (100.0%) |
| 75 Years and over | 17 (100.0%) | 10 (100.0%) |
| Total | 133 (82.1%) | 115 (74.2%) |
Income Below Poverty Among Married-Couple Families in Clayton
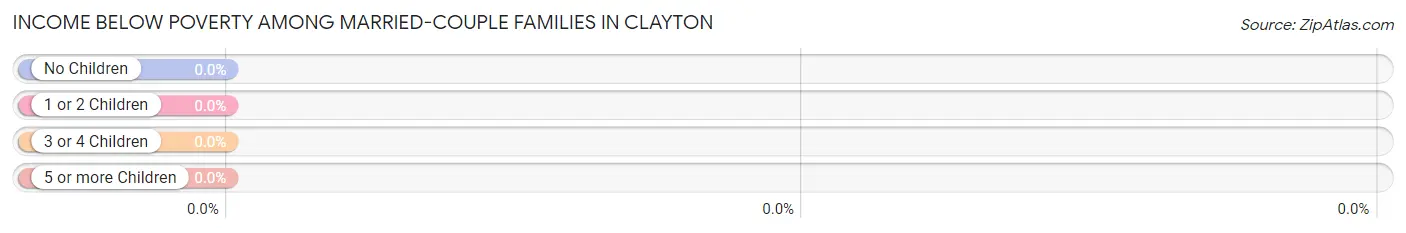
| Children | Above Poverty | Below Poverty |
| No Children | 57 (100.0%) | 0 (0.0%) |
| 1 or 2 Children | 5 (100.0%) | 0 (0.0%) |
| 3 or 4 Children | 0 (0.0%) | 0 (0.0%) |
| 5 or more Children | 0 (0.0%) | 0 (0.0%) |
| Total | 62 (100.0%) | 0 (0.0%) |
Income Below Poverty Among Single-Parent Households in Clayton
According to the poverty data in Clayton, 100.0% or 4 single-father households and 30.4% or 7 single-mother households are living below the poverty line. Among single-father households, those with 1 or 2 children have the highest poverty rate, with 4 households (100.0%) experiencing poverty. Likewise, among single-mother households, those with 1 or 2 children have the highest poverty rate, with 7 households (87.5%) falling below the poverty line.
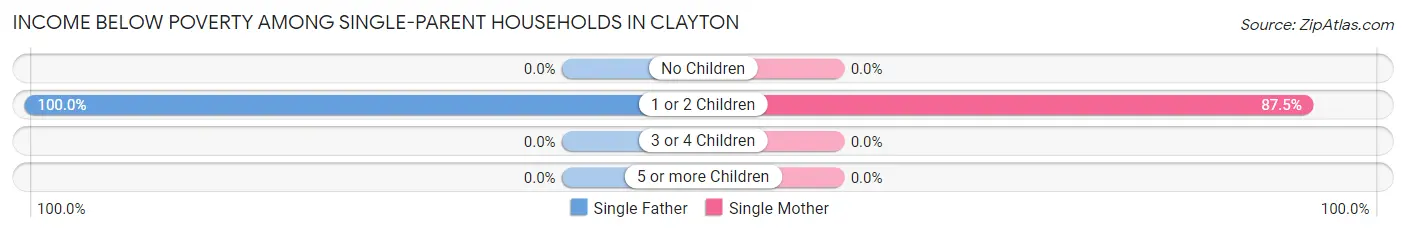
| Children | Single Father | Single Mother |
| No Children | 0 (0.0%) | 0 (0.0%) |
| 1 or 2 Children | 4 (100.0%) | 7 (87.5%) |
| 3 or 4 Children | 0 (0.0%) | 0 (0.0%) |
| 5 or more Children | 0 (0.0%) | 0 (0.0%) |
| Total | 4 (100.0%) | 7 (30.4%) |
Income Below Poverty Among Married-Couple vs Single-Parent Households in Clayton
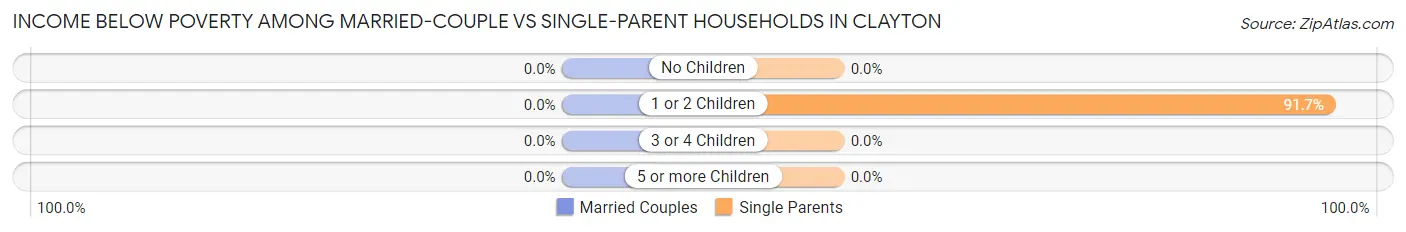
| Children | Married-Couple Families | Single-Parent Households |
| No Children | 0 (0.0%) | 0 (0.0%) |
| 1 or 2 Children | 0 (0.0%) | 11 (91.7%) |
| 3 or 4 Children | 0 (0.0%) | 0 (0.0%) |
| 5 or more Children | 0 (0.0%) | 0 (0.0%) |
| Total | 0 (0.0%) | 11 (40.7%) |
Race in Clayton
The most populous races in Clayton are Black / African American (161 | 50.8%), and White / Caucasian (156 | 49.2%).
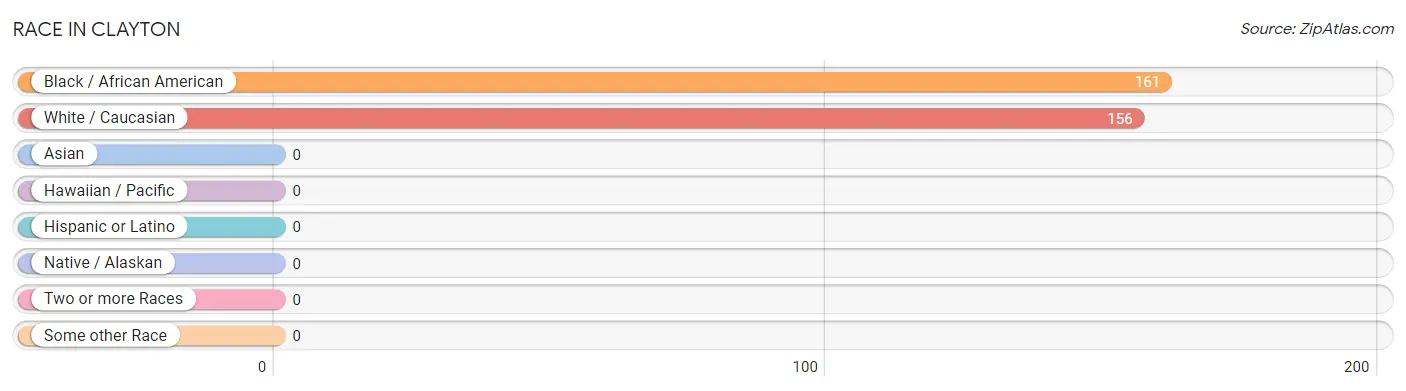
| Race | # Population | % Population |
| Asian | 0 | 0.0% |
| Black / African American | 161 | 50.8% |
| Hawaiian / Pacific | 0 | 0.0% |
| Hispanic or Latino | 0 | 0.0% |
| Native / Alaskan | 0 | 0.0% |
| White / Caucasian | 156 | 49.2% |
| Two or more Races | 0 | 0.0% |
| Some other Race | 0 | 0.0% |
| Total | 317 | 100.0% |
Ancestry in Clayton
The most populous ancestries reported in Clayton are American (36 | 11.4%), Irish (21 | 6.6%), English (12 | 3.8%), Italian (9 | 2.8%), and Scotch-Irish (5 | 1.6%), together accounting for 26.2% of all Clayton residents.
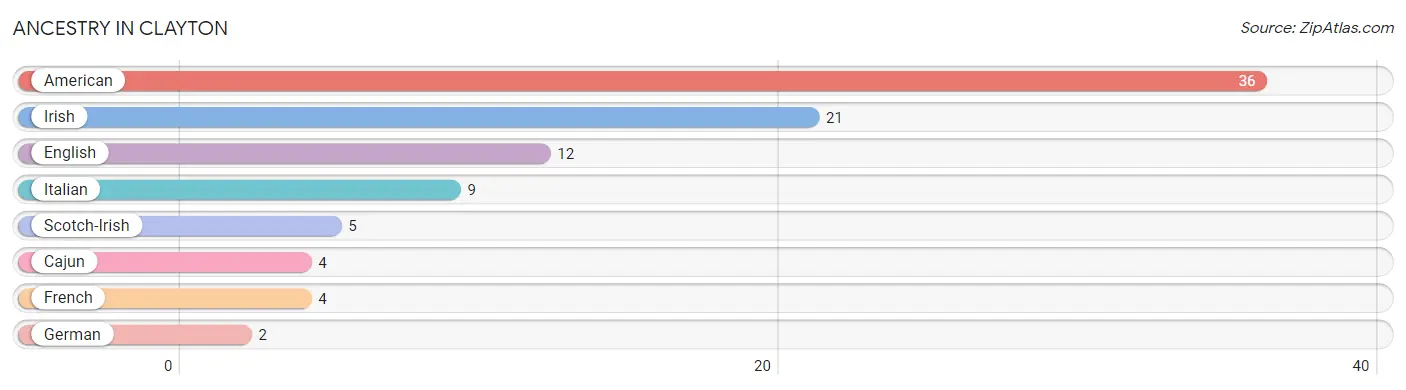
| Ancestry | # Population | % Population |
| American | 36 | 11.4% |
| Cajun | 4 | 1.3% |
| English | 12 | 3.8% |
| French | 4 | 1.3% |
| German | 2 | 0.6% |
| Irish | 21 | 6.6% |
| Italian | 9 | 2.8% |
| Scotch-Irish | 5 | 1.6% | View All 8 Rows |
Immigrants in Clayton

| Immigration Origin | # Population | % Population | View All 0 Rows |
Sex and Age in Clayton
Sex and Age in Clayton
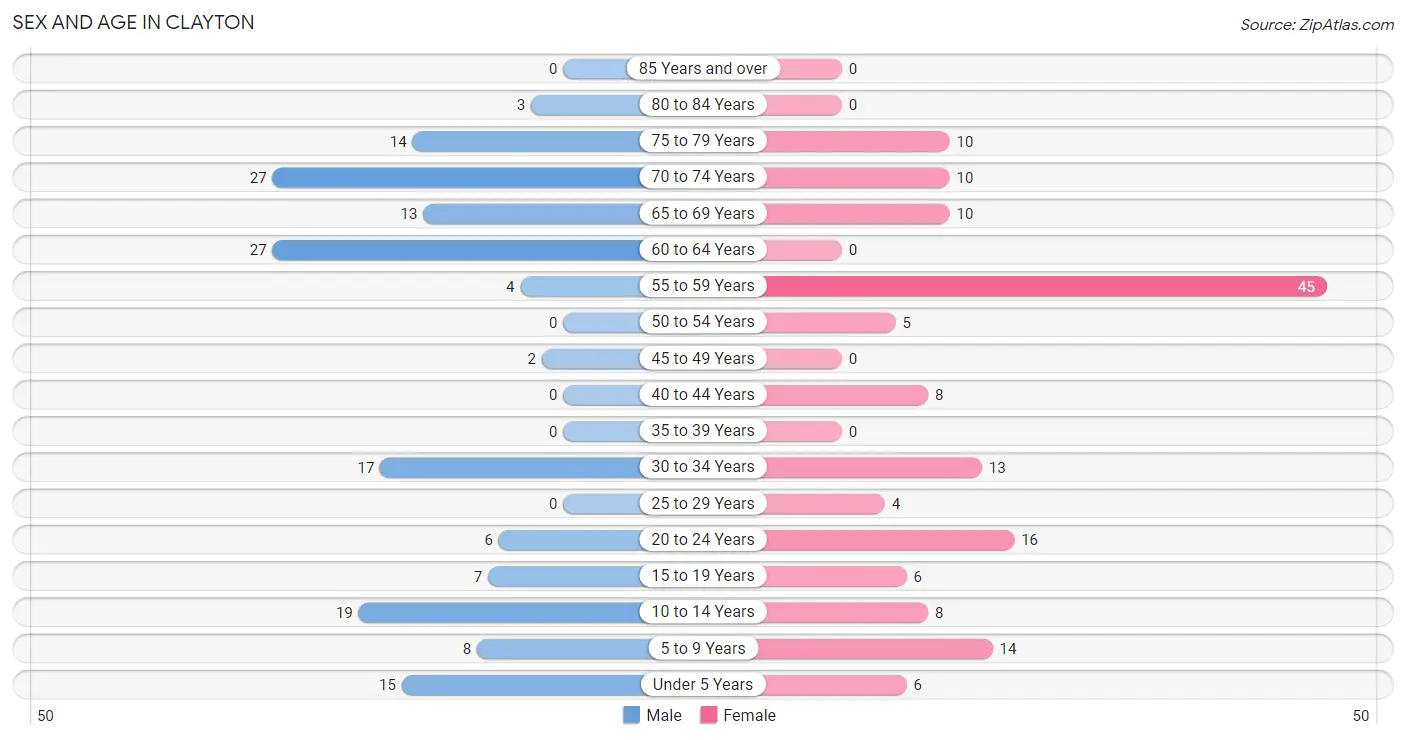
The most populous age groups in Clayton are 60 to 64 Years (27 | 16.7%) for men and 55 to 59 Years (45 | 29.0%) for women.
| Age Bracket | Male | Female |
| Under 5 Years | 15 (9.3%) | 6 (3.9%) |
| 5 to 9 Years | 8 (4.9%) | 14 (9.0%) |
| 10 to 14 Years | 19 (11.7%) | 8 (5.2%) |
| 15 to 19 Years | 7 (4.3%) | 6 (3.9%) |
| 20 to 24 Years | 6 (3.7%) | 16 (10.3%) |
| 25 to 29 Years | 0 (0.0%) | 4 (2.6%) |
| 30 to 34 Years | 17 (10.5%) | 13 (8.4%) |
| 35 to 39 Years | 0 (0.0%) | 0 (0.0%) |
| 40 to 44 Years | 0 (0.0%) | 8 (5.2%) |
| 45 to 49 Years | 2 (1.2%) | 0 (0.0%) |
| 50 to 54 Years | 0 (0.0%) | 5 (3.2%) |
| 55 to 59 Years | 4 (2.5%) | 45 (29.0%) |
| 60 to 64 Years | 27 (16.7%) | 0 (0.0%) |
| 65 to 69 Years | 13 (8.0%) | 10 (6.5%) |
| 70 to 74 Years | 27 (16.7%) | 10 (6.5%) |
| 75 to 79 Years | 14 (8.6%) | 10 (6.5%) |
| 80 to 84 Years | 3 (1.8%) | 0 (0.0%) |
| 85 Years and over | 0 (0.0%) | 0 (0.0%) |
| Total | 162 (100.0%) | 155 (100.0%) |
Families and Households in Clayton
Median Family Size in Clayton
The median family size in Clayton is 3.00 persons per family, with single female/mother families (23 | 25.8%) accounting for the largest median family size of 5.26 persons per family. On the other hand, married-couple families (62 | 69.7%) represent the smallest median family size with 2.19 persons per family.
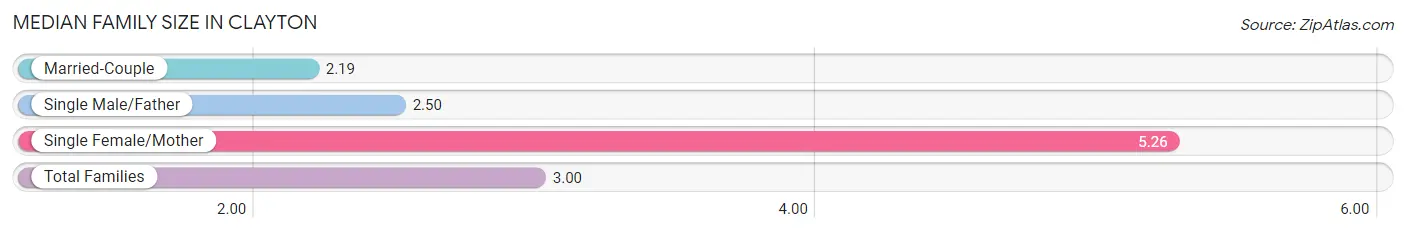
| Family Type | # Families | Family Size |
| Married-Couple | 62 (69.7%) | 2.19 |
| Single Male/Father | 4 (4.5%) | 2.50 |
| Single Female/Mother | 23 (25.8%) | 5.26 |
| Total Families | 89 (100.0%) | 3.00 |
Median Household Size in Clayton
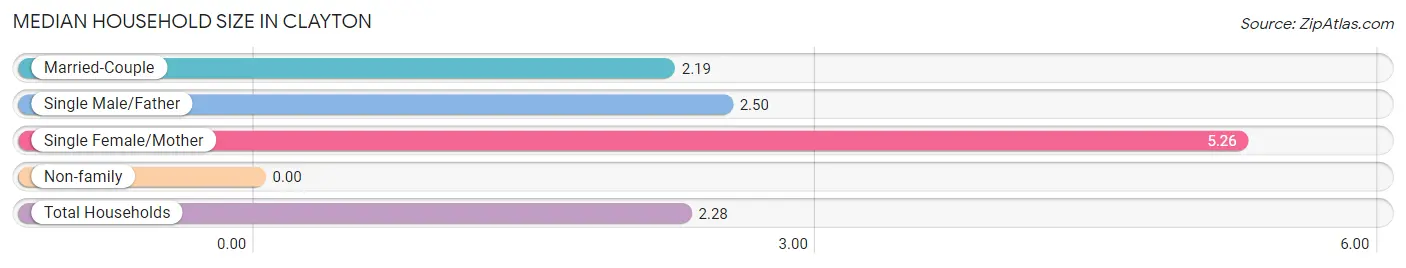
| Household Type | # Households | Household Size |
| Married-Couple | 62 (44.6%) | 2.19 |
| Single Male/Father | 4 (2.9%) | 2.50 |
| Single Female/Mother | 23 (16.6%) | 5.26 |
| Non-family | 50 (36.0%) | - |
| Total Households | 139 (100.0%) | 2.28 |
Household Size by Marriage Status in Clayton
Out of a total of 139 households in Clayton, 89 (64.0%) are family households, while 50 (36.0%) are nonfamily households. The most numerous type of family households are 2-person households, comprising 55, and the most common type of nonfamily households are 1-person households, comprising 50.
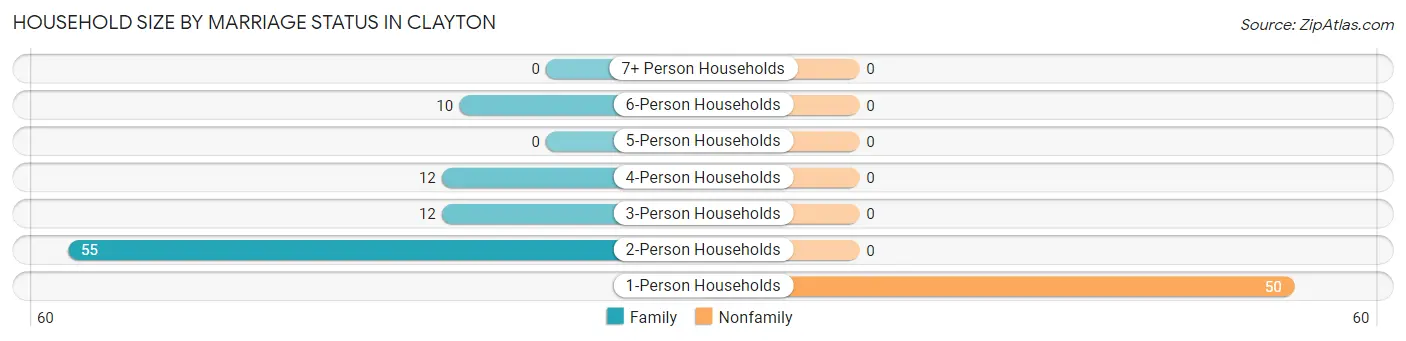
| Household Size | Family Households | Nonfamily Households |
| 1-Person Households | - | 50 (36.0%) |
| 2-Person Households | 55 (39.6%) | 0 (0.0%) |
| 3-Person Households | 12 (8.6%) | 0 (0.0%) |
| 4-Person Households | 12 (8.6%) | 0 (0.0%) |
| 5-Person Households | 0 (0.0%) | 0 (0.0%) |
| 6-Person Households | 10 (7.2%) | 0 (0.0%) |
| 7+ Person Households | 0 (0.0%) | 0 (0.0%) |
| Total | 89 (64.0%) | 50 (36.0%) |
Female Fertility in Clayton
Fertility by Age in Clayton
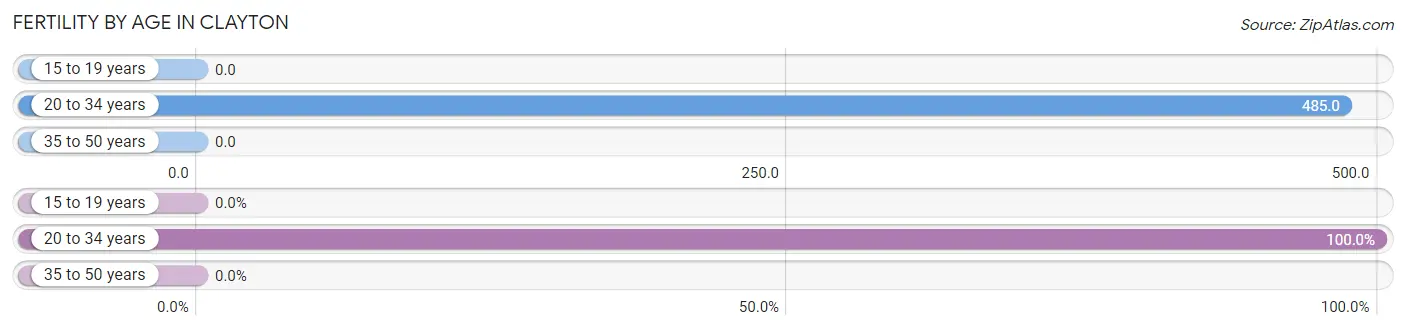
Average fertility rate in Clayton is 340.0 births per 1,000 women. Women in the age bracket of 20 to 34 years have the highest fertility rate with 485.0 births per 1,000 women. Women in the age bracket of 20 to 34 years acount for 100.0% of all women with births.
| Age Bracket | Women with Births | Births / 1,000 Women |
| 15 to 19 years | 0 (0.0%) | 0.0 |
| 20 to 34 years | 16 (100.0%) | 485.0 |
| 35 to 50 years | 0 (0.0%) | 0.0 |
| Total | 16 (100.0%) | 340.0 |
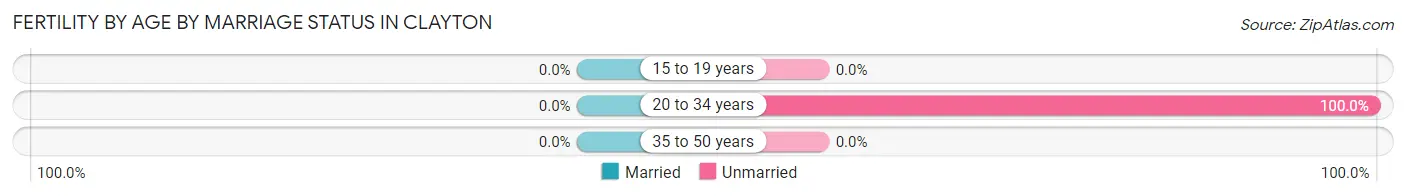
Fertility by Age by Marriage Status in Clayton
| Age Bracket | Married | Unmarried |
| 15 to 19 years | 0 (0.0%) | 0 (0.0%) |
| 20 to 34 years | 0 (0.0%) | 16 (100.0%) |
| 35 to 50 years | 0 (0.0%) | 0 (0.0%) |
| Total | 0 (0.0%) | 16 (100.0%) |
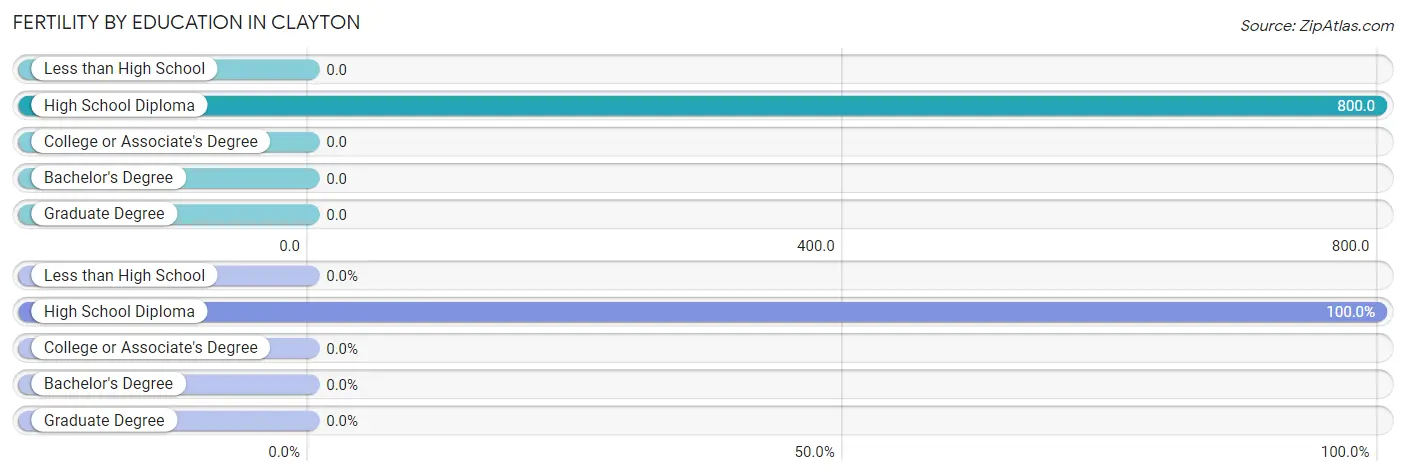
Fertility by Education in Clayton
| Educational Attainment | Women with Births | Births / 1,000 Women |
| Less than High School | 0 (0.0%) | 0.0 |
| High School Diploma | 16 (100.0%) | 800.0 |
| College or Associate's Degree | 0 (0.0%) | 0.0 |
| Bachelor's Degree | 0 (0.0%) | 0.0 |
| Graduate Degree | 0 (0.0%) | 0.0 |
| Total | 16 (100.0%) | 340.0 |
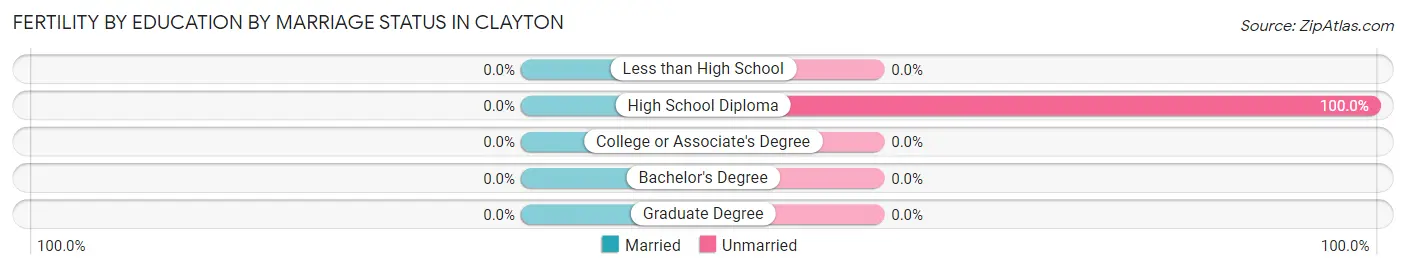
Fertility by Education by Marriage Status in Clayton
| Educational Attainment | Married | Unmarried |
| Less than High School | 0 (0.0%) | 0 (0.0%) |
| High School Diploma | 0 (0.0%) | 16 (100.0%) |
| College or Associate's Degree | 0 (0.0%) | 0 (0.0%) |
| Bachelor's Degree | 0 (0.0%) | 0 (0.0%) |
| Graduate Degree | 0 (0.0%) | 0 (0.0%) |
| Total | 0 (0.0%) | 16 (100.0%) |
Employment Characteristics in Clayton
Employment by Class of Employer in Clayton
Among the 139 employed individuals in Clayton, private company employees (131 | 94.2%), and federal government employees (8 | 5.8%) make up the most common classes of employment.
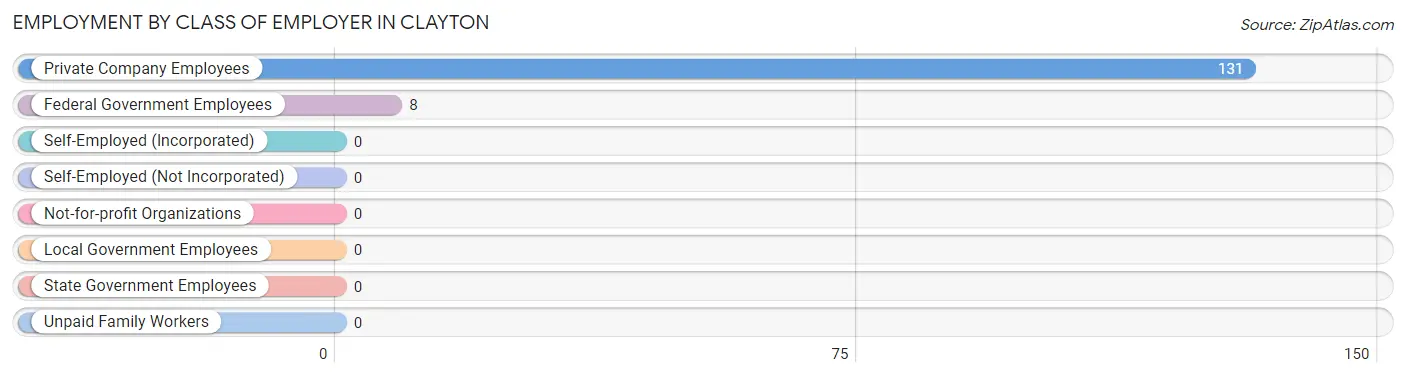
| Employer Class | # Employees | % Employees |
| Private Company Employees | 131 | 94.2% |
| Self-Employed (Incorporated) | 0 | 0.0% |
| Self-Employed (Not Incorporated) | 0 | 0.0% |
| Not-for-profit Organizations | 0 | 0.0% |
| Local Government Employees | 0 | 0.0% |
| State Government Employees | 0 | 0.0% |
| Federal Government Employees | 8 | 5.8% |
| Unpaid Family Workers | 0 | 0.0% |
| Total | 139 | 100.0% |
Employment Status by Age in Clayton
According to the labor force statistics for Clayton, out of the total population over 16 years of age (247), 59.1% or 146 individuals are in the labor force, with 4.8% or 7 of them unemployed. The age group with the highest labor force participation rate is 20 to 24 years, with 100.0% or 22 individuals in the labor force. Within the labor force, the 35 to 44 years age range has the highest percentage of unemployed individuals, with 87.5% or 7 of them being unemployed.
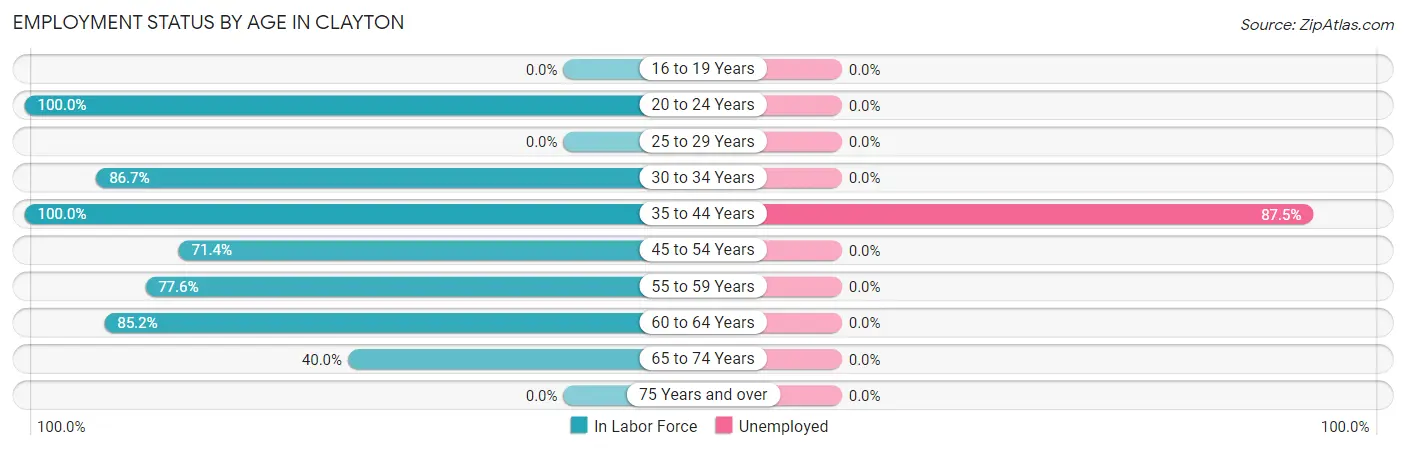
| Age Bracket | In Labor Force | Unemployed |
| 16 to 19 Years | 0 (0.0%) | 0 (0.0%) |
| 20 to 24 Years | 22 (100.0%) | 0 (0.0%) |
| 25 to 29 Years | 0 (0.0%) | 0 (0.0%) |
| 30 to 34 Years | 26 (86.7%) | 0 (0.0%) |
| 35 to 44 Years | 8 (100.0%) | 7 (87.5%) |
| 45 to 54 Years | 5 (71.4%) | 0 (0.0%) |
| 55 to 59 Years | 38 (77.6%) | 0 (0.0%) |
| 60 to 64 Years | 23 (85.2%) | 0 (0.0%) |
| 65 to 74 Years | 24 (40.0%) | 0 (0.0%) |
| 75 Years and over | 0 (0.0%) | 0 (0.0%) |
| Total | 146 (59.1%) | 7 (4.8%) |
Employment Status by Educational Attainment in Clayton
According to labor force statistics for Clayton, 80.0% of individuals (100) out of the total population between 25 and 64 years of age (125) are in the labor force, with 7.0% or 7 of them being unemployed. The group with the highest labor force participation rate are those with the educational attainment of bachelor's degree or higher, with 100.0% or 13 individuals in the labor force. Within the labor force, individuals with less than high school education have the highest percentage of unemployment, with 53.8% or 7 of them being unemployed.
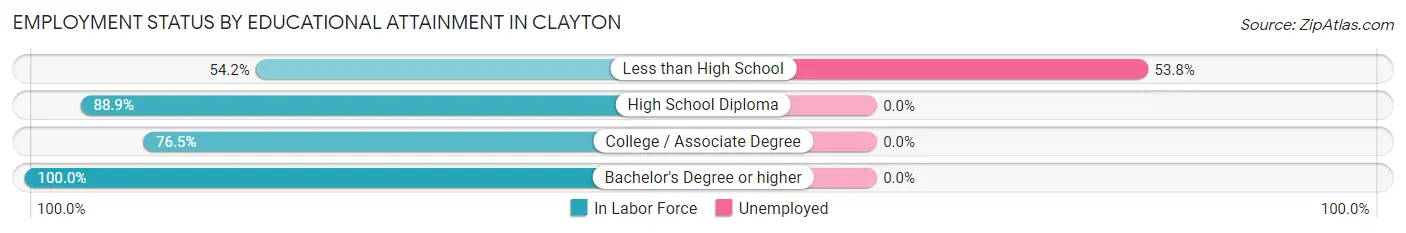
| Educational Attainment | In Labor Force | Unemployed |
| Less than High School | 13 (54.2%) | 13 (53.8%) |
| High School Diploma | 48 (88.9%) | 0 (0.0%) |
| College / Associate Degree | 26 (76.5%) | 0 (0.0%) |
| Bachelor's Degree or higher | 13 (100.0%) | 0 (0.0%) |
| Total | 100 (80.0%) | 9 (7.0%) |
Employment Occupations by Sex in Clayton
Management, Business, Science and Arts Occupations
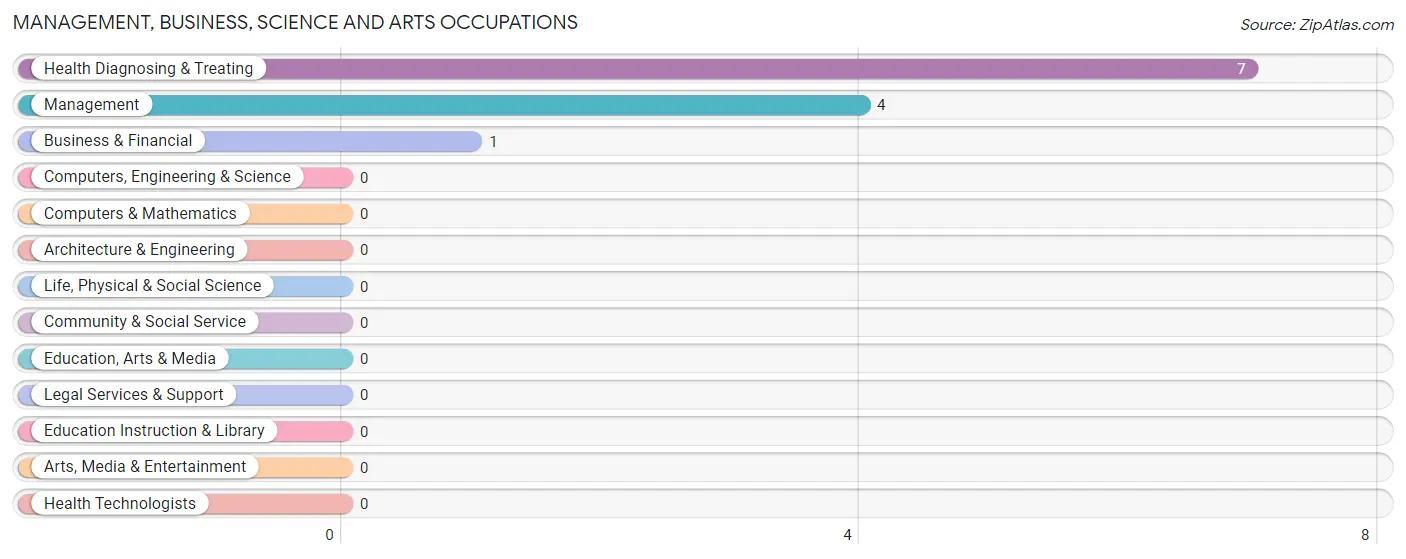
The most common Management, Business, Science and Arts occupations in Clayton are Health Diagnosing & Treating (7 | 5.0%), Management (4 | 2.9%), and Business & Financial (1 | 0.7%).
Management, Business, Science and Arts Occupations by Sex
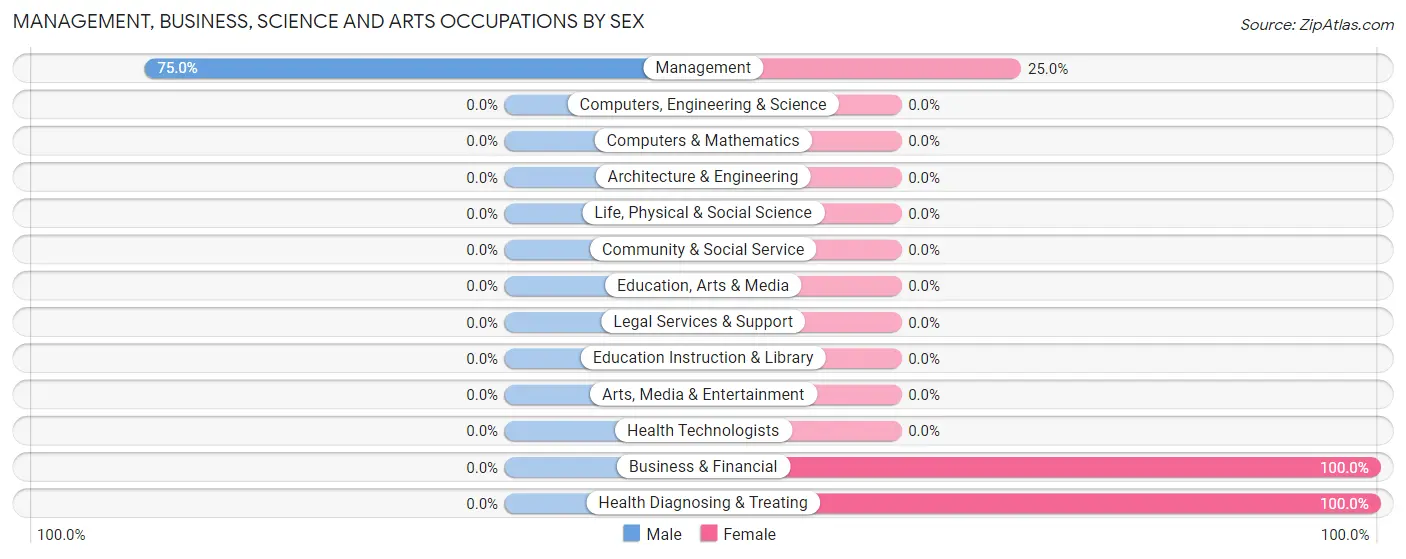
| Occupation | Male | Female |
| Management | 3 (75.0%) | 1 (25.0%) |
| Business & Financial | 0 (0.0%) | 1 (100.0%) |
| Computers, Engineering & Science | 0 (0.0%) | 0 (0.0%) |
| Computers & Mathematics | 0 (0.0%) | 0 (0.0%) |
| Architecture & Engineering | 0 (0.0%) | 0 (0.0%) |
| Life, Physical & Social Science | 0 (0.0%) | 0 (0.0%) |
| Community & Social Service | 0 (0.0%) | 0 (0.0%) |
| Education, Arts & Media | 0 (0.0%) | 0 (0.0%) |
| Legal Services & Support | 0 (0.0%) | 0 (0.0%) |
| Education Instruction & Library | 0 (0.0%) | 0 (0.0%) |
| Arts, Media & Entertainment | 0 (0.0%) | 0 (0.0%) |
| Health Diagnosing & Treating | 0 (0.0%) | 7 (100.0%) |
| Health Technologists | 0 (0.0%) | 0 (0.0%) |
| Total (Category) | 3 (25.0%) | 9 (75.0%) |
| Total (Overall) | 66 (47.5%) | 73 (52.5%) |
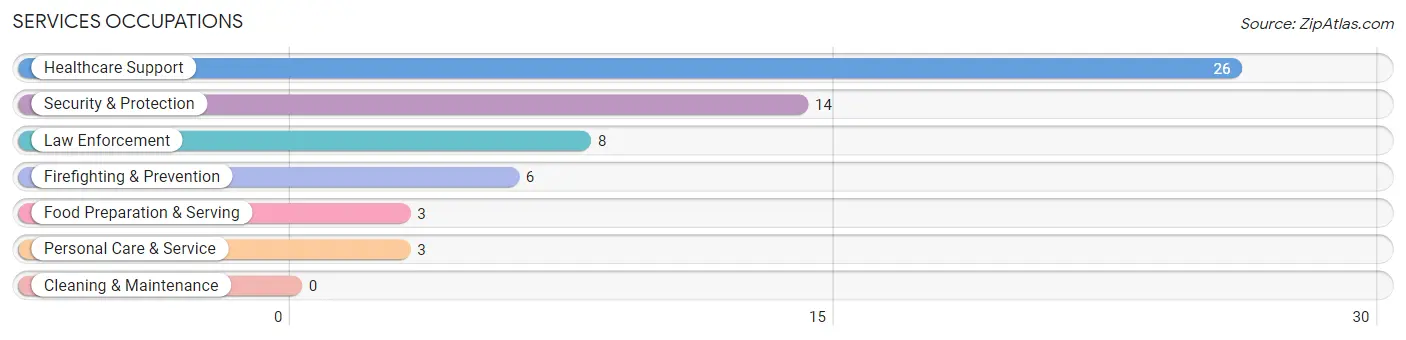
Services Occupations
The most common Services occupations in Clayton are Healthcare Support (26 | 18.7%), Security & Protection (14 | 10.1%), Law Enforcement (8 | 5.8%), Firefighting & Prevention (6 | 4.3%), and Food Preparation & Serving (3 | 2.2%).
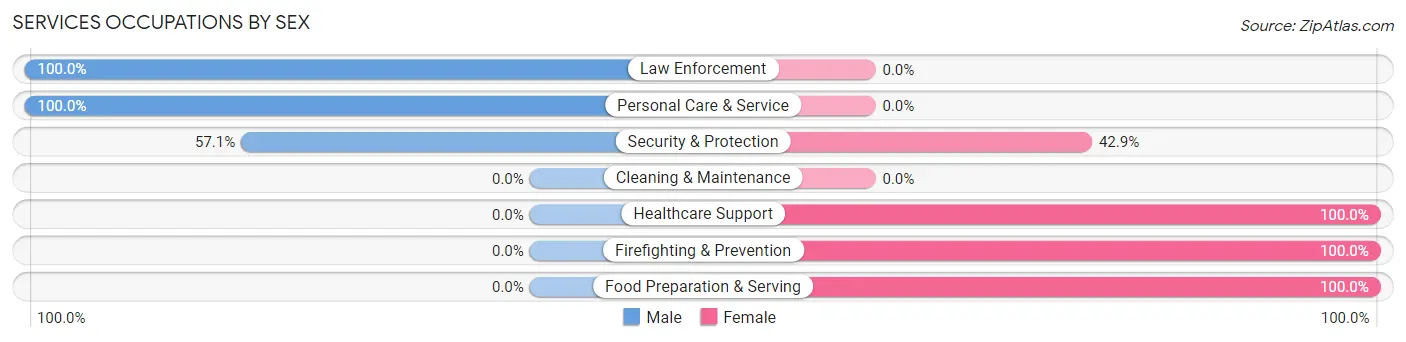
Services Occupations by Sex
Within the Services occupations in Clayton, the most male-oriented occupations are Law Enforcement (100.0%), Personal Care & Service (100.0%), and Security & Protection (57.1%), while the most female-oriented occupations are Healthcare Support (100.0%), Firefighting & Prevention (100.0%), and Food Preparation & Serving (100.0%).
| Occupation | Male | Female |
| Healthcare Support | 0 (0.0%) | 26 (100.0%) |
| Security & Protection | 8 (57.1%) | 6 (42.9%) |
| Firefighting & Prevention | 0 (0.0%) | 6 (100.0%) |
| Law Enforcement | 8 (100.0%) | 0 (0.0%) |
| Food Preparation & Serving | 0 (0.0%) | 3 (100.0%) |
| Cleaning & Maintenance | 0 (0.0%) | 0 (0.0%) |
| Personal Care & Service | 3 (100.0%) | 0 (0.0%) |
| Total (Category) | 11 (23.9%) | 35 (76.1%) |
| Total (Overall) | 66 (47.5%) | 73 (52.5%) |
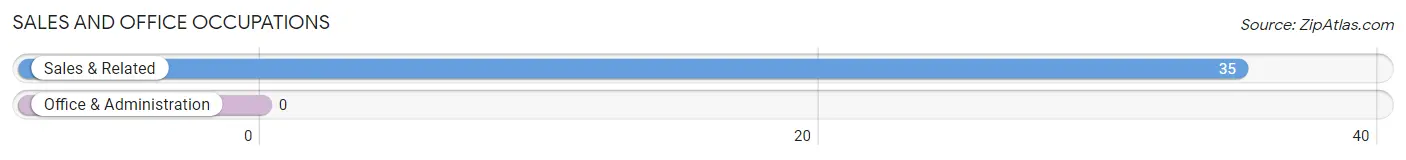
Sales and Office Occupations
The most common Sales and Office occupations in Clayton are , and Sales & Related (35 | 25.2%).
Sales and Office Occupations by Sex
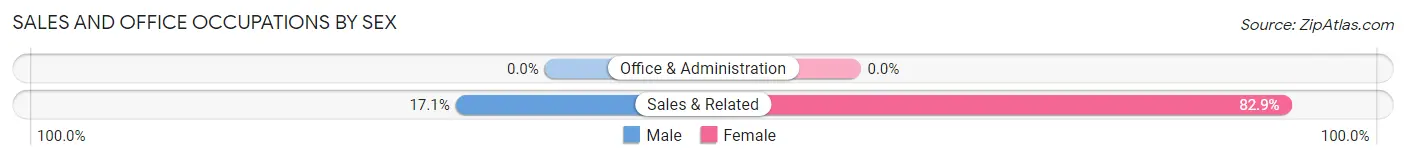
| Occupation | Male | Female |
| Sales & Related | 6 (17.1%) | 29 (82.9%) |
| Office & Administration | 0 (0.0%) | 0 (0.0%) |
| Total (Category) | 6 (17.1%) | 29 (82.9%) |
| Total (Overall) | 66 (47.5%) | 73 (52.5%) |
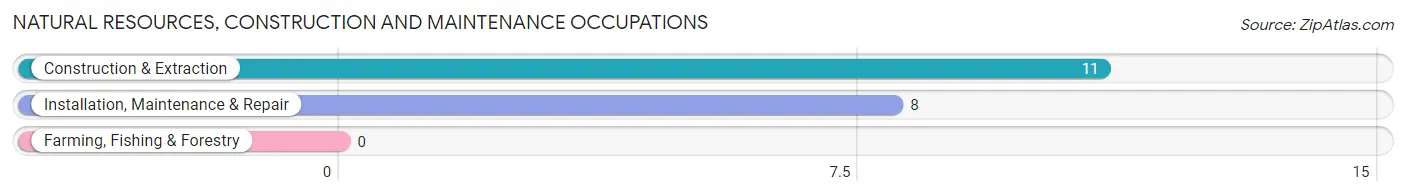
Natural Resources, Construction and Maintenance Occupations
The most common Natural Resources, Construction and Maintenance occupations in Clayton are Construction & Extraction (11 | 7.9%), and Installation, Maintenance & Repair (8 | 5.8%).
Natural Resources, Construction and Maintenance Occupations by Sex
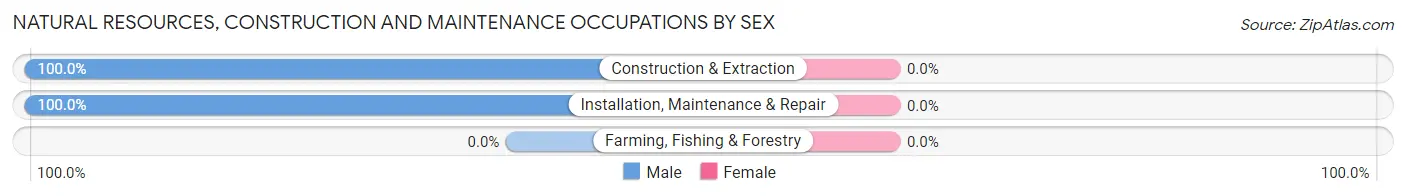
| Occupation | Male | Female |
| Farming, Fishing & Forestry | 0 (0.0%) | 0 (0.0%) |
| Construction & Extraction | 11 (100.0%) | 0 (0.0%) |
| Installation, Maintenance & Repair | 8 (100.0%) | 0 (0.0%) |
| Total (Category) | 19 (100.0%) | 0 (0.0%) |
| Total (Overall) | 66 (47.5%) | 73 (52.5%) |
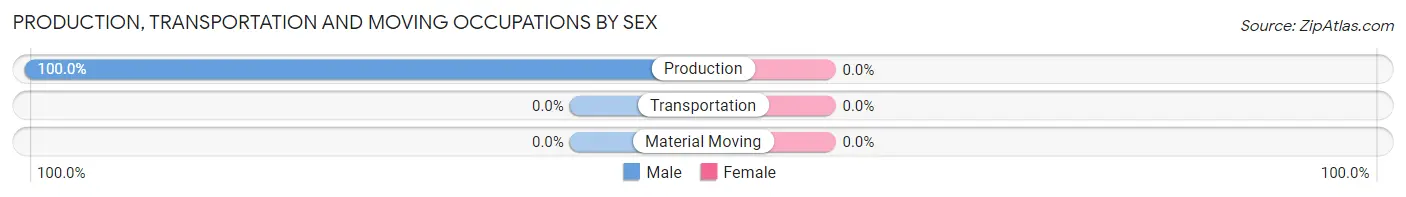
Production, Transportation and Moving Occupations
The most common Production, Transportation and Moving occupations in Clayton are , and Production (27 | 19.4%).
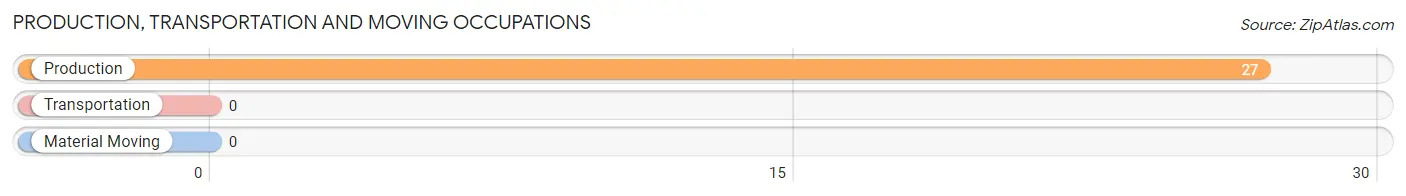
Production, Transportation and Moving Occupations by Sex
| Occupation | Male | Female |
| Production | 27 (100.0%) | 0 (0.0%) |
| Transportation | 0 (0.0%) | 0 (0.0%) |
| Material Moving | 0 (0.0%) | 0 (0.0%) |
| Total (Category) | 27 (100.0%) | 0 (0.0%) |
| Total (Overall) | 66 (47.5%) | 73 (52.5%) |
Employment Industries by Sex in Clayton
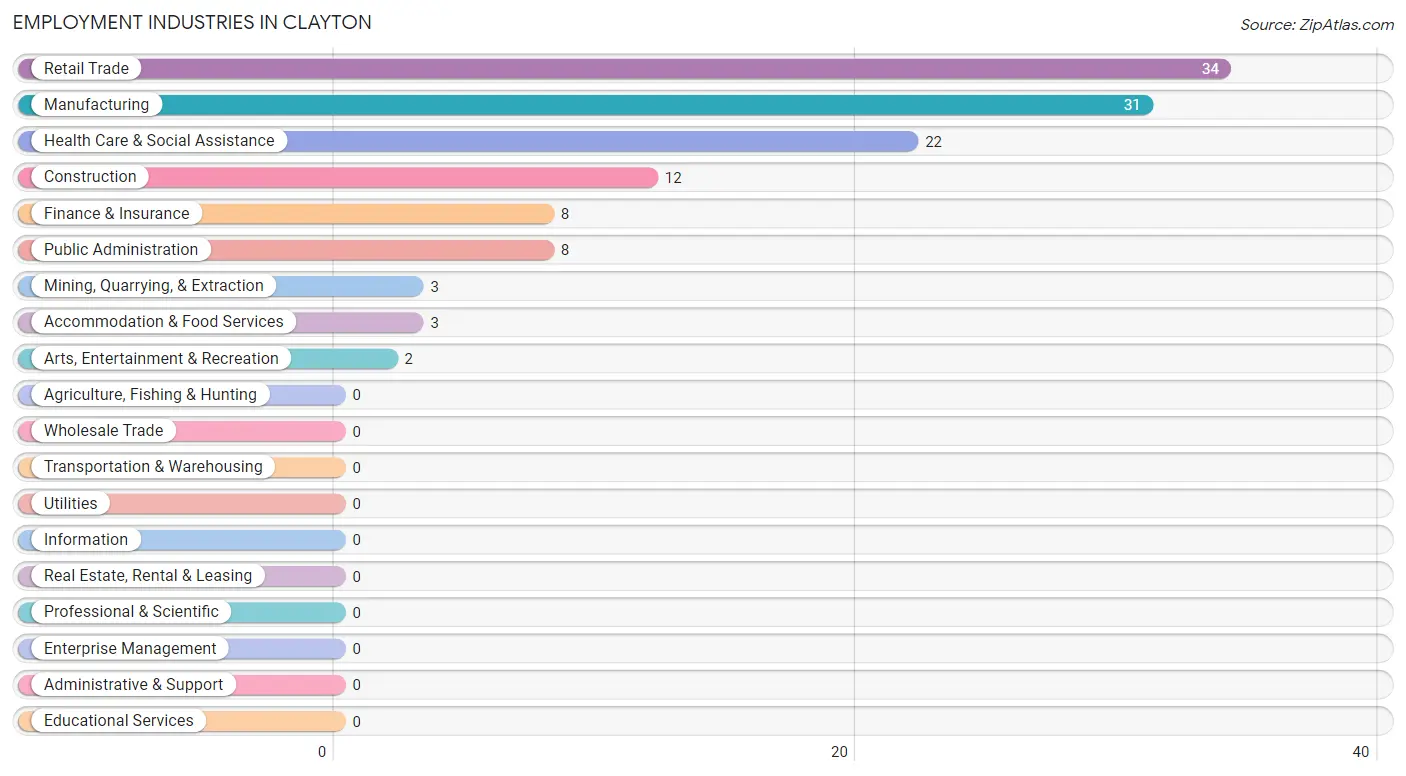
Employment Industries in Clayton
The major employment industries in Clayton include Retail Trade (34 | 24.5%), Manufacturing (31 | 22.3%), Health Care & Social Assistance (22 | 15.8%), Construction (12 | 8.6%), and Finance & Insurance (8 | 5.8%).
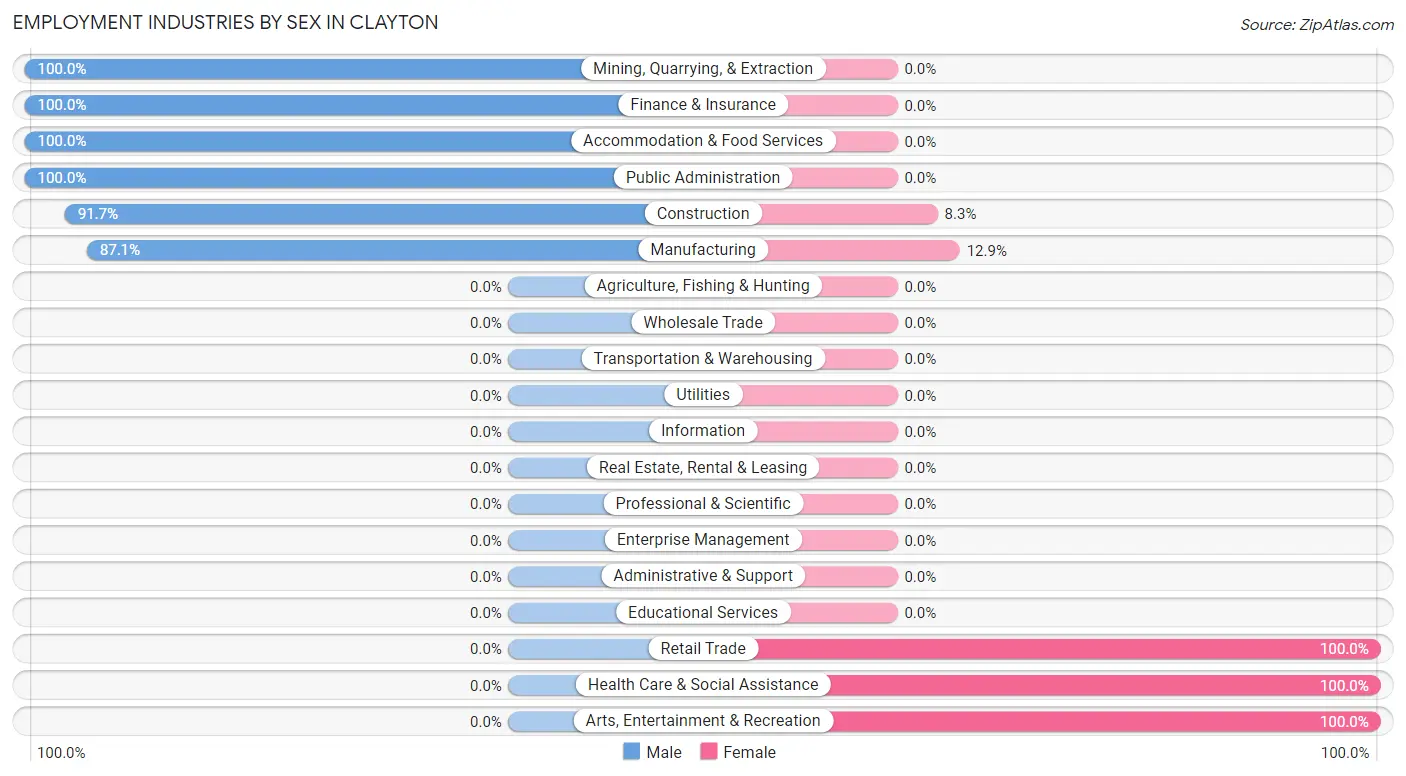
Employment Industries by Sex in Clayton
The Clayton industries that see more men than women are Mining, Quarrying, & Extraction (100.0%), Finance & Insurance (100.0%), and Accommodation & Food Services (100.0%), whereas the industries that tend to have a higher number of women are Retail Trade (100.0%), Health Care & Social Assistance (100.0%), and Arts, Entertainment & Recreation (100.0%).
| Industry | Male | Female |
| Agriculture, Fishing & Hunting | 0 (0.0%) | 0 (0.0%) |
| Mining, Quarrying, & Extraction | 3 (100.0%) | 0 (0.0%) |
| Construction | 11 (91.7%) | 1 (8.3%) |
| Manufacturing | 27 (87.1%) | 4 (12.9%) |
| Wholesale Trade | 0 (0.0%) | 0 (0.0%) |
| Retail Trade | 0 (0.0%) | 34 (100.0%) |
| Transportation & Warehousing | 0 (0.0%) | 0 (0.0%) |
| Utilities | 0 (0.0%) | 0 (0.0%) |
| Information | 0 (0.0%) | 0 (0.0%) |
| Finance & Insurance | 8 (100.0%) | 0 (0.0%) |
| Real Estate, Rental & Leasing | 0 (0.0%) | 0 (0.0%) |
| Professional & Scientific | 0 (0.0%) | 0 (0.0%) |
| Enterprise Management | 0 (0.0%) | 0 (0.0%) |
| Administrative & Support | 0 (0.0%) | 0 (0.0%) |
| Educational Services | 0 (0.0%) | 0 (0.0%) |
| Health Care & Social Assistance | 0 (0.0%) | 22 (100.0%) |
| Arts, Entertainment & Recreation | 0 (0.0%) | 2 (100.0%) |
| Accommodation & Food Services | 3 (100.0%) | 0 (0.0%) |
| Public Administration | 8 (100.0%) | 0 (0.0%) |
| Total | 66 (47.5%) | 73 (52.5%) |
Education in Clayton
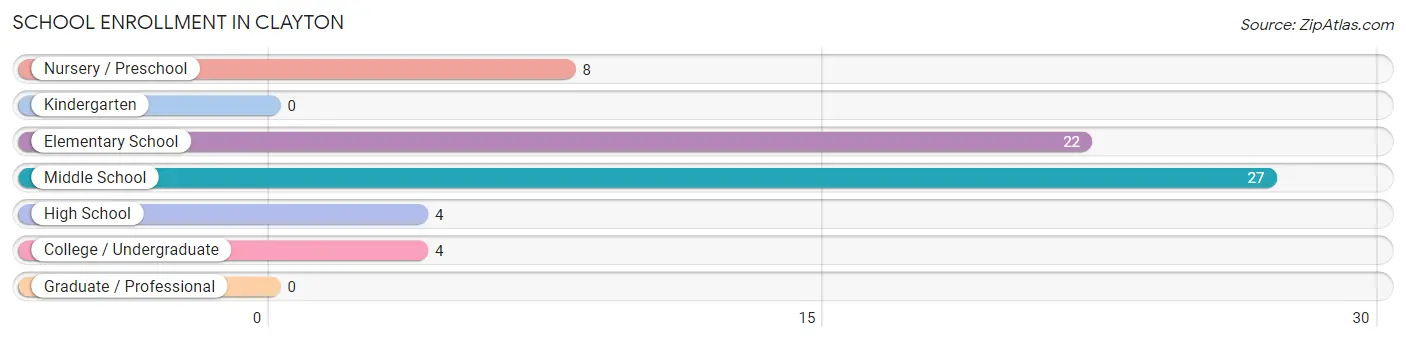
School Enrollment in Clayton
The most common levels of schooling among the 65 students in Clayton are middle school (27 | 41.5%), elementary school (22 | 33.9%), and nursery / preschool (8 | 12.3%).
| School Level | # Students | % Students |
| Nursery / Preschool | 8 | 12.3% |
| Kindergarten | 0 | 0.0% |
| Elementary School | 22 | 33.9% |
| Middle School | 27 | 41.5% |
| High School | 4 | 6.1% |
| College / Undergraduate | 4 | 6.1% |
| Graduate / Professional | 0 | 0.0% |
| Total | 65 | 100.0% |
School Enrollment by Age by Funding Source in Clayton
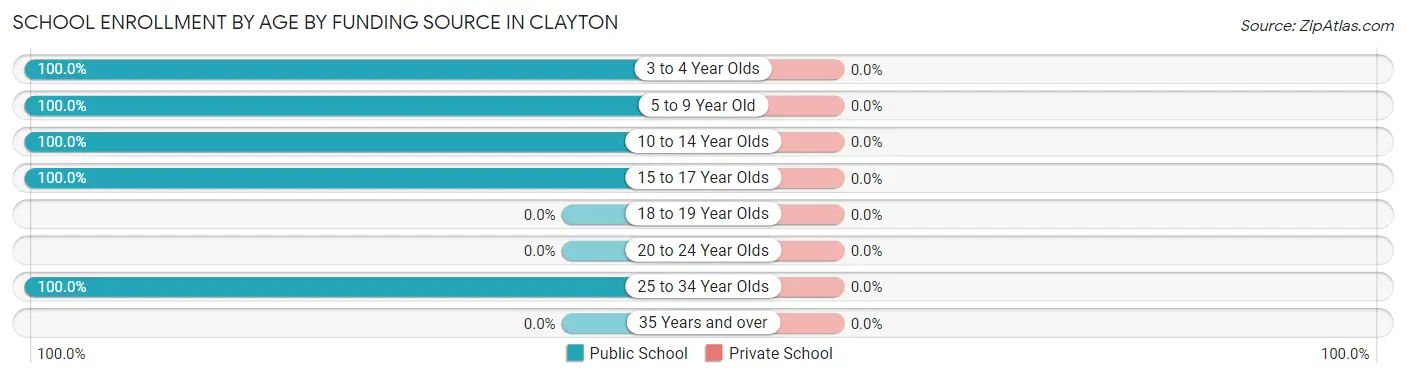
| Age Bracket | Public School | Private School |
| 3 to 4 Year Olds | 8 (100.0%) | 0 (0.0%) |
| 5 to 9 Year Old | 22 (100.0%) | 0 (0.0%) |
| 10 to 14 Year Olds | 27 (100.0%) | 0 (0.0%) |
| 15 to 17 Year Olds | 4 (100.0%) | 0 (0.0%) |
| 18 to 19 Year Olds | 0 (0.0%) | 0 (0.0%) |
| 20 to 24 Year Olds | 0 (0.0%) | 0 (0.0%) |
| 25 to 34 Year Olds | 4 (100.0%) | 0 (0.0%) |
| 35 Years and over | 0 (0.0%) | 0 (0.0%) |
| Total | 65 (100.0%) | 0 (0.0%) |
Educational Attainment by Field of Study in Clayton
Science & technology (10 | 38.5%), social sciences (8 | 30.8%), education (5 | 19.2%), and psychology (3 | 11.5%) are the most common fields of study among 26 individuals in Clayton who have obtained a bachelor's degree or higher.
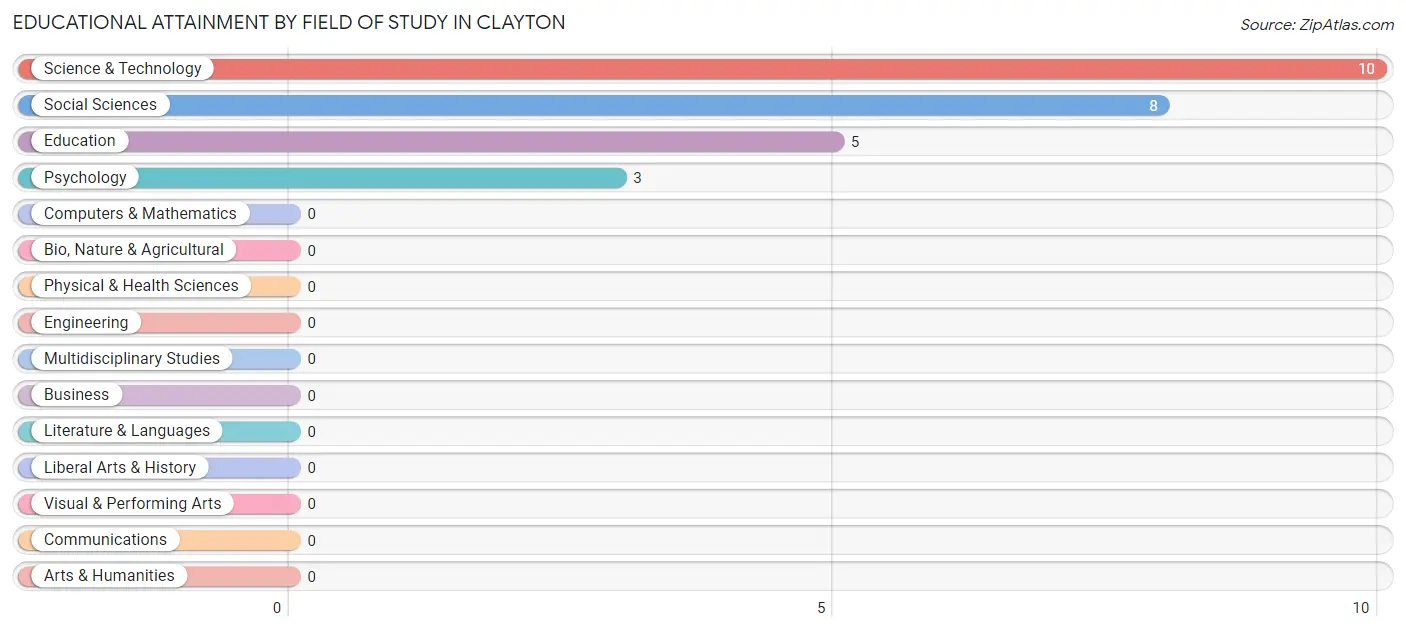
| Field of Study | # Graduates | % Graduates |
| Computers & Mathematics | 0 | 0.0% |
| Bio, Nature & Agricultural | 0 | 0.0% |
| Physical & Health Sciences | 0 | 0.0% |
| Psychology | 3 | 11.5% |
| Social Sciences | 8 | 30.8% |
| Engineering | 0 | 0.0% |
| Multidisciplinary Studies | 0 | 0.0% |
| Science & Technology | 10 | 38.5% |
| Business | 0 | 0.0% |
| Education | 5 | 19.2% |
| Literature & Languages | 0 | 0.0% |
| Liberal Arts & History | 0 | 0.0% |
| Visual & Performing Arts | 0 | 0.0% |
| Communications | 0 | 0.0% |
| Arts & Humanities | 0 | 0.0% |
| Total | 26 | 100.0% |
Transportation & Commute in Clayton
Vehicle Availability by Sex in Clayton
The most prevalent vehicle ownership categories in Clayton are males with 2 vehicles (39, accounting for 59.1%) and females with 2 vehicles (27, making up 53.4%).
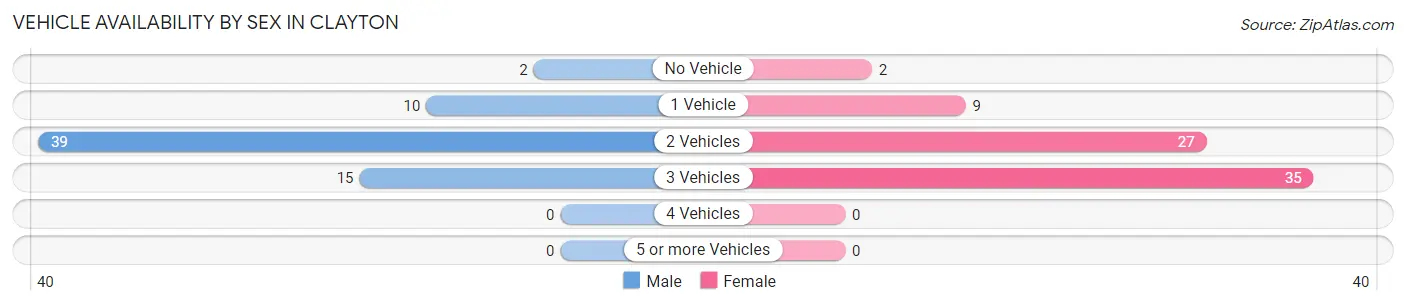
| Vehicles Available | Male | Female |
| No Vehicle | 2 (3.0%) | 2 (2.7%) |
| 1 Vehicle | 10 (15.1%) | 9 (12.3%) |
| 2 Vehicles | 39 (59.1%) | 27 (37.0%) |
| 3 Vehicles | 15 (22.7%) | 35 (47.9%) |
| 4 Vehicles | 0 (0.0%) | 0 (0.0%) |
| 5 or more Vehicles | 0 (0.0%) | 0 (0.0%) |
| Total | 66 (100.0%) | 73 (100.0%) |
Commute Time in Clayton
The most frequently occuring commute durations in Clayton are 30 to 34 minutes (37 commuters, 26.6%), 15 to 19 minutes (30 commuters, 21.6%), and 10 to 14 minutes (29 commuters, 20.9%).
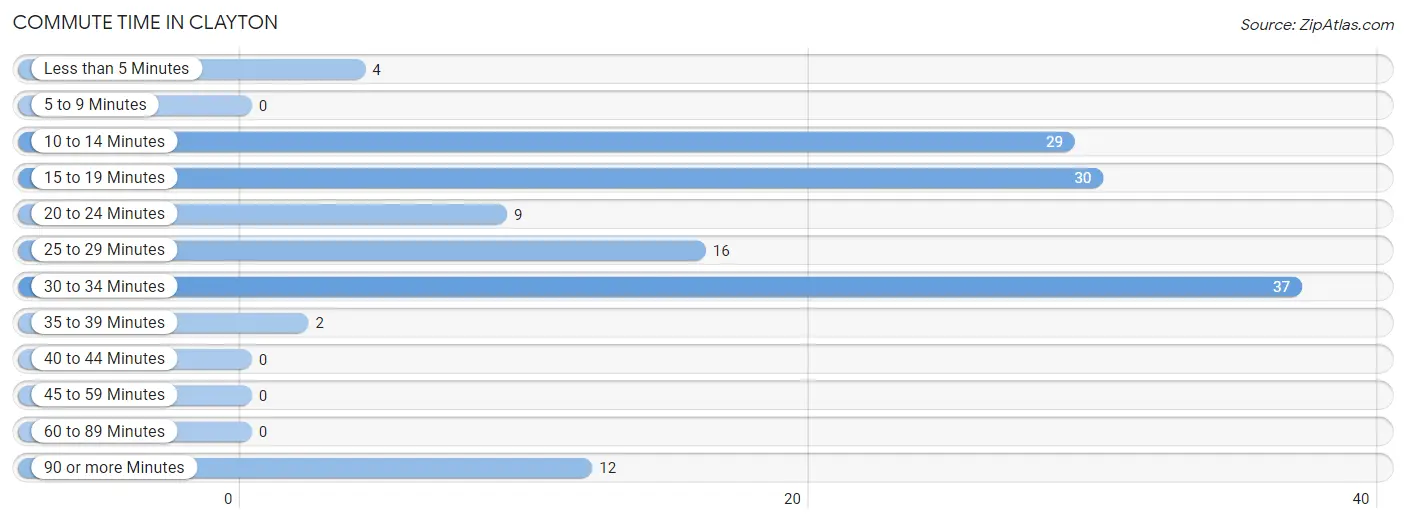
| Commute Time | # Commuters | % Commuters |
| Less than 5 Minutes | 4 | 2.9% |
| 5 to 9 Minutes | 0 | 0.0% |
| 10 to 14 Minutes | 29 | 20.9% |
| 15 to 19 Minutes | 30 | 21.6% |
| 20 to 24 Minutes | 9 | 6.5% |
| 25 to 29 Minutes | 16 | 11.5% |
| 30 to 34 Minutes | 37 | 26.6% |
| 35 to 39 Minutes | 2 | 1.4% |
| 40 to 44 Minutes | 0 | 0.0% |
| 45 to 59 Minutes | 0 | 0.0% |
| 60 to 89 Minutes | 0 | 0.0% |
| 90 or more Minutes | 12 | 8.6% |
Commute Time by Sex in Clayton
The most common commute times in Clayton are 30 to 34 minutes (31 commuters, 47.0%) for males and 10 to 14 minutes (29 commuters, 39.7%) for females.
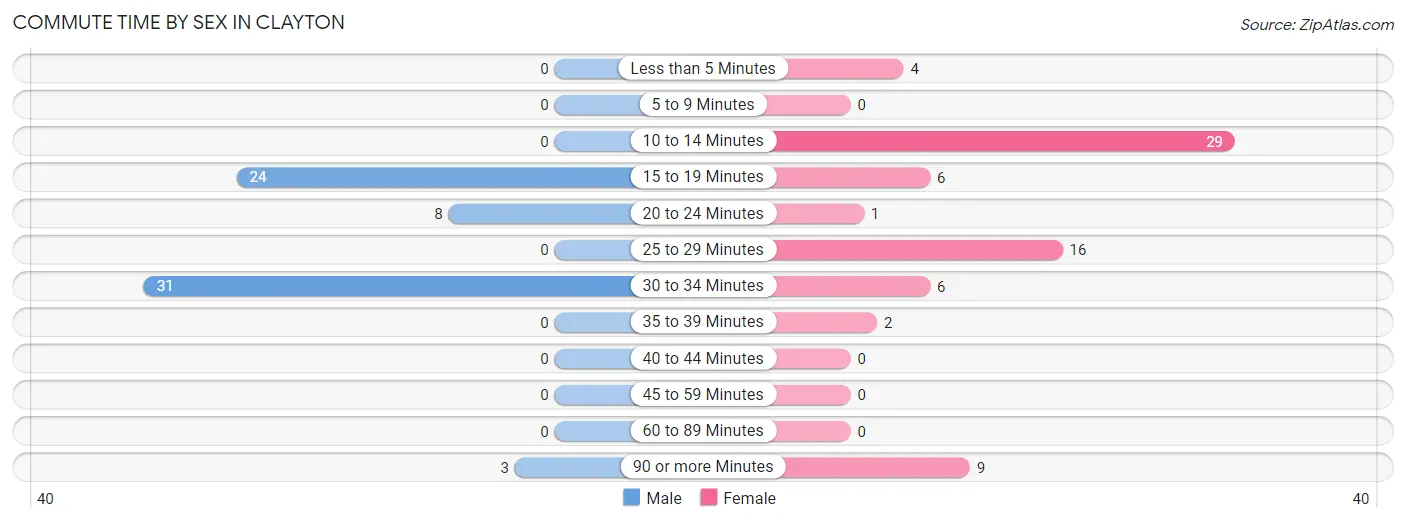
| Commute Time | Male | Female |
| Less than 5 Minutes | 0 (0.0%) | 4 (5.5%) |
| 5 to 9 Minutes | 0 (0.0%) | 0 (0.0%) |
| 10 to 14 Minutes | 0 (0.0%) | 29 (39.7%) |
| 15 to 19 Minutes | 24 (36.4%) | 6 (8.2%) |
| 20 to 24 Minutes | 8 (12.1%) | 1 (1.4%) |
| 25 to 29 Minutes | 0 (0.0%) | 16 (21.9%) |
| 30 to 34 Minutes | 31 (47.0%) | 6 (8.2%) |
| 35 to 39 Minutes | 0 (0.0%) | 2 (2.7%) |
| 40 to 44 Minutes | 0 (0.0%) | 0 (0.0%) |
| 45 to 59 Minutes | 0 (0.0%) | 0 (0.0%) |
| 60 to 89 Minutes | 0 (0.0%) | 0 (0.0%) |
| 90 or more Minutes | 3 (4.5%) | 9 (12.3%) |
Time of Departure to Work by Sex in Clayton
The most frequent times of departure to work in Clayton are 6:30 AM to 6:59 AM (32, 48.5%) for males and 7:30 AM to 7:59 AM (27, 37.0%) for females.
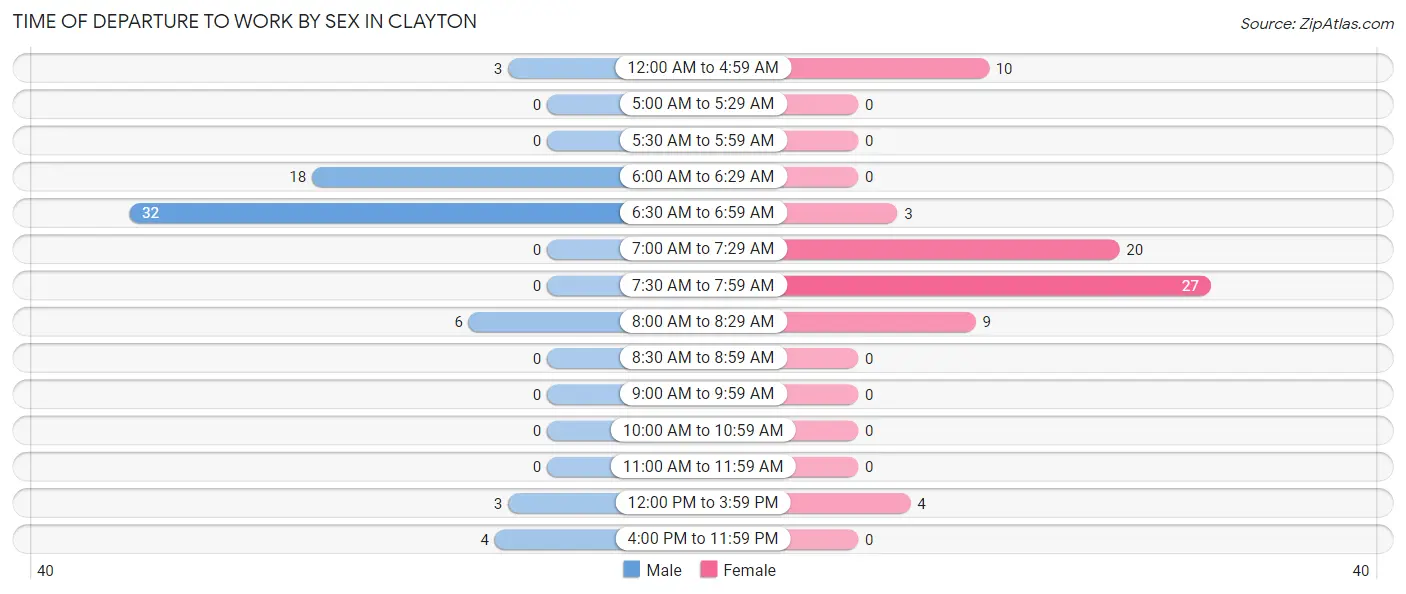
| Time of Departure | Male | Female |
| 12:00 AM to 4:59 AM | 3 (4.5%) | 10 (13.7%) |
| 5:00 AM to 5:29 AM | 0 (0.0%) | 0 (0.0%) |
| 5:30 AM to 5:59 AM | 0 (0.0%) | 0 (0.0%) |
| 6:00 AM to 6:29 AM | 18 (27.3%) | 0 (0.0%) |
| 6:30 AM to 6:59 AM | 32 (48.5%) | 3 (4.1%) |
| 7:00 AM to 7:29 AM | 0 (0.0%) | 20 (27.4%) |
| 7:30 AM to 7:59 AM | 0 (0.0%) | 27 (37.0%) |
| 8:00 AM to 8:29 AM | 6 (9.1%) | 9 (12.3%) |
| 8:30 AM to 8:59 AM | 0 (0.0%) | 0 (0.0%) |
| 9:00 AM to 9:59 AM | 0 (0.0%) | 0 (0.0%) |
| 10:00 AM to 10:59 AM | 0 (0.0%) | 0 (0.0%) |
| 11:00 AM to 11:59 AM | 0 (0.0%) | 0 (0.0%) |
| 12:00 PM to 3:59 PM | 3 (4.5%) | 4 (5.5%) |
| 4:00 PM to 11:59 PM | 4 (6.1%) | 0 (0.0%) |
| Total | 66 (100.0%) | 73 (100.0%) |
Housing Occupancy in Clayton
Occupancy by Ownership in Clayton
Of the total 139 dwellings in Clayton, owner-occupied units account for 82 (59.0%), while renter-occupied units make up 57 (41.0%).
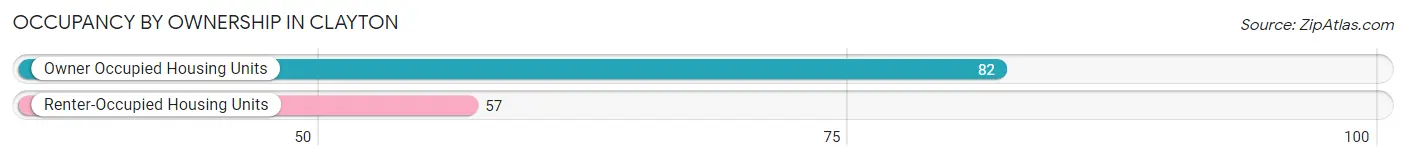
| Occupancy | # Housing Units | % Housing Units |
| Owner Occupied Housing Units | 82 | 59.0% |
| Renter-Occupied Housing Units | 57 | 41.0% |
| Total Occupied Housing Units | 139 | 100.0% |
Occupancy by Household Size in Clayton
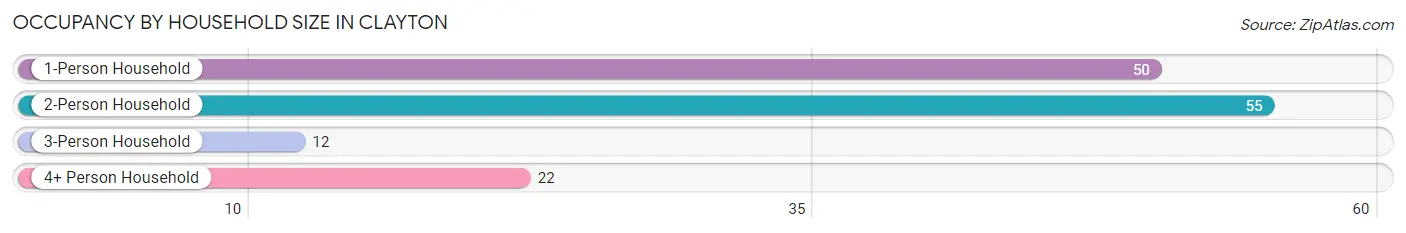
| Household Size | # Housing Units | % Housing Units |
| 1-Person Household | 50 | 36.0% |
| 2-Person Household | 55 | 39.6% |
| 3-Person Household | 12 | 8.6% |
| 4+ Person Household | 22 | 15.8% |
| Total Housing Units | 139 | 100.0% |
Occupancy by Ownership by Household Size in Clayton
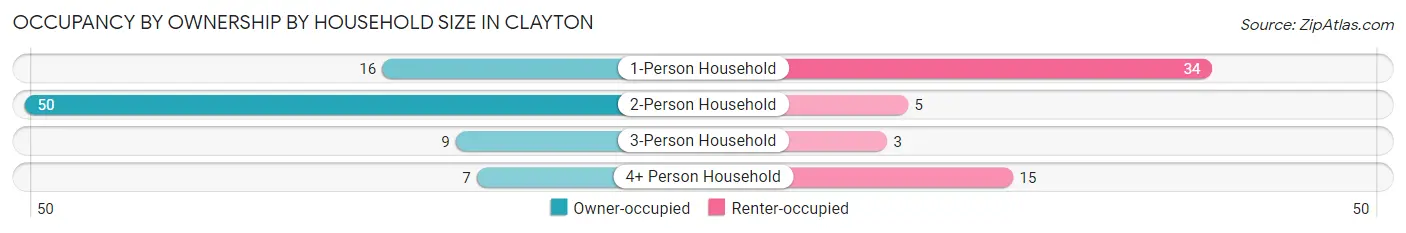
| Household Size | Owner-occupied | Renter-occupied |
| 1-Person Household | 16 (32.0%) | 34 (68.0%) |
| 2-Person Household | 50 (90.9%) | 5 (9.1%) |
| 3-Person Household | 9 (75.0%) | 3 (25.0%) |
| 4+ Person Household | 7 (31.8%) | 15 (68.2%) |
| Total Housing Units | 82 (59.0%) | 57 (41.0%) |
Occupancy by Educational Attainment in Clayton
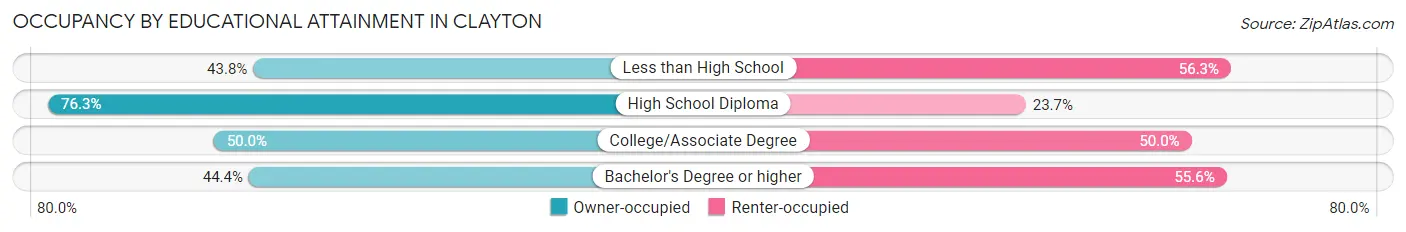
| Household Size | Owner-occupied | Renter-occupied |
| Less than High School | 14 (43.8%) | 18 (56.2%) |
| High School Diploma | 45 (76.3%) | 14 (23.7%) |
| College/Associate Degree | 15 (50.0%) | 15 (50.0%) |
| Bachelor's Degree or higher | 8 (44.4%) | 10 (55.6%) |
Occupancy by Age of Householder in Clayton
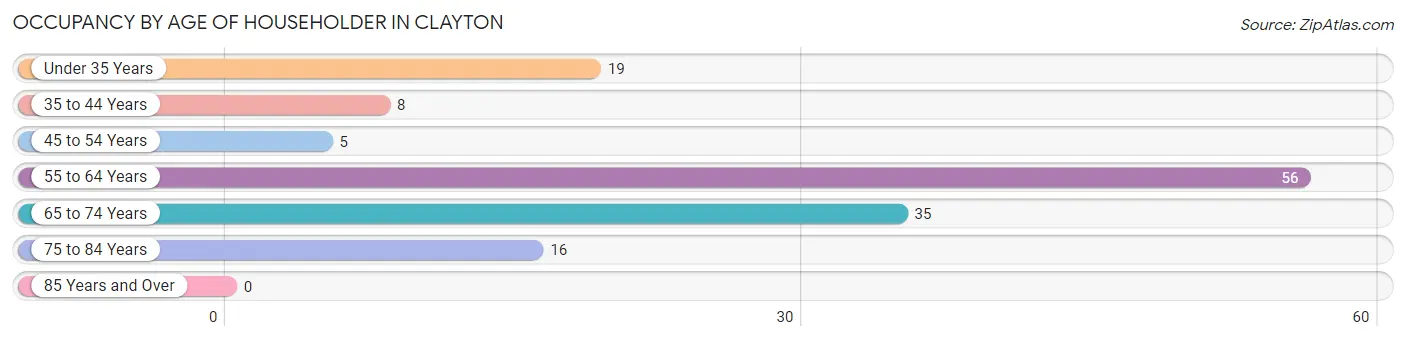
| Age Bracket | # Households | % Households |
| Under 35 Years | 19 | 13.7% |
| 35 to 44 Years | 8 | 5.8% |
| 45 to 54 Years | 5 | 3.6% |
| 55 to 64 Years | 56 | 40.3% |
| 65 to 74 Years | 35 | 25.2% |
| 75 to 84 Years | 16 | 11.5% |
| 85 Years and Over | 0 | 0.0% |
| Total | 139 | 100.0% |
Housing Finances in Clayton
Median Income by Occupancy in Clayton
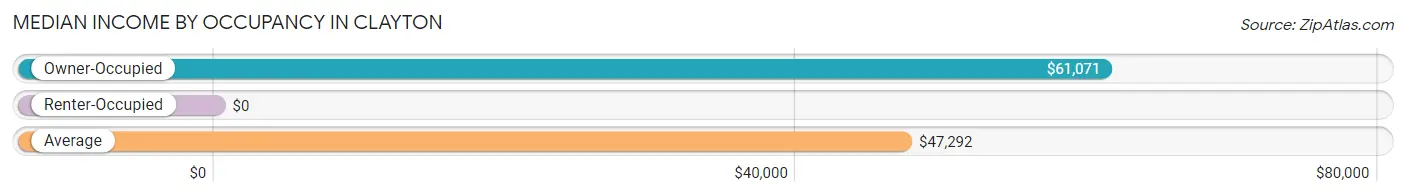
| Occupancy Type | # Households | Median Income |
| Owner-Occupied | 82 (59.0%) | $61,071 |
| Renter-Occupied | 57 (41.0%) | $0 |
| Average | 139 (100.0%) | $47,292 |
Occupancy by Householder Income Bracket in Clayton
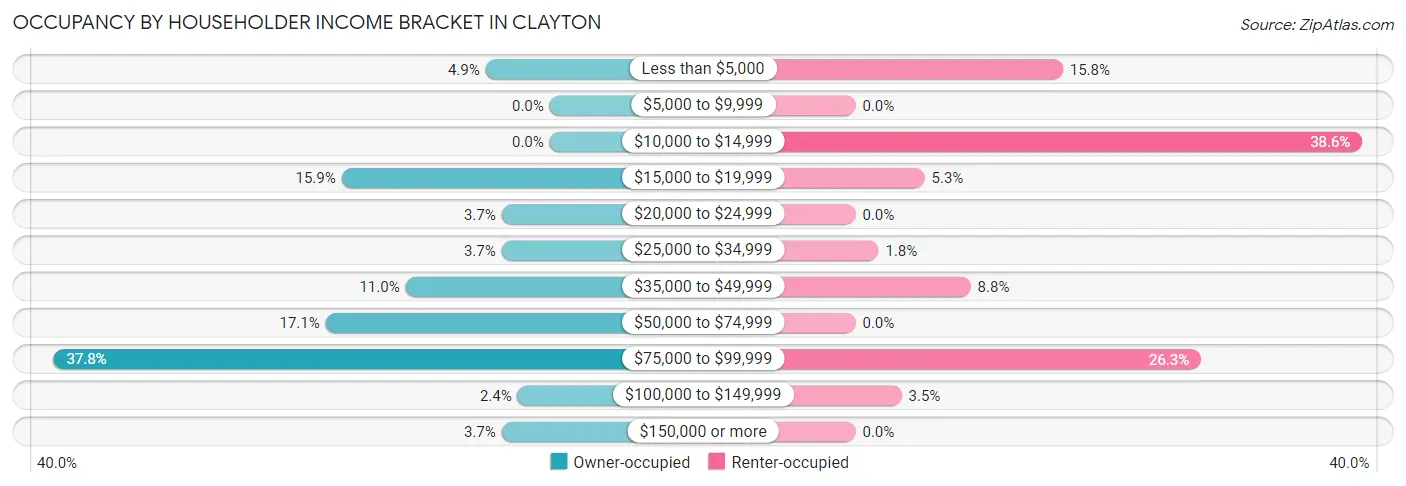
| Income Bracket | Owner-occupied | Renter-occupied |
| Less than $5,000 | 4 (4.9%) | 9 (15.8%) |
| $5,000 to $9,999 | 0 (0.0%) | 0 (0.0%) |
| $10,000 to $14,999 | 0 (0.0%) | 22 (38.6%) |
| $15,000 to $19,999 | 13 (15.9%) | 3 (5.3%) |
| $20,000 to $24,999 | 3 (3.7%) | 0 (0.0%) |
| $25,000 to $34,999 | 3 (3.7%) | 1 (1.8%) |
| $35,000 to $49,999 | 9 (11.0%) | 5 (8.8%) |
| $50,000 to $74,999 | 14 (17.1%) | 0 (0.0%) |
| $75,000 to $99,999 | 31 (37.8%) | 15 (26.3%) |
| $100,000 to $149,999 | 2 (2.4%) | 2 (3.5%) |
| $150,000 or more | 3 (3.7%) | 0 (0.0%) |
| Total | 82 (100.0%) | 57 (100.0%) |
Monthly Housing Cost Tiers in Clayton
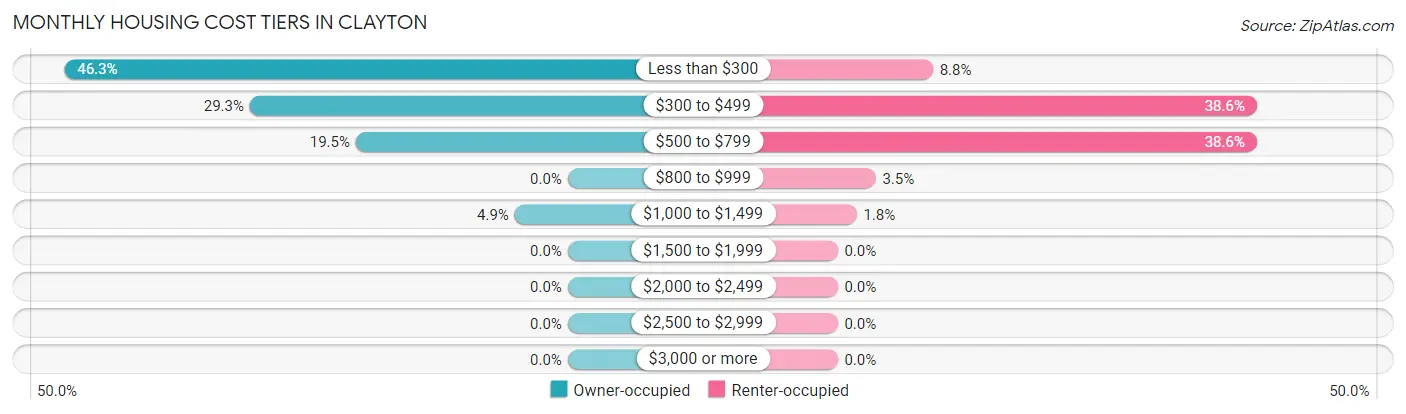
| Monthly Cost | Owner-occupied | Renter-occupied |
| Less than $300 | 38 (46.3%) | 5 (8.8%) |
| $300 to $499 | 24 (29.3%) | 22 (38.6%) |
| $500 to $799 | 16 (19.5%) | 22 (38.6%) |
| $800 to $999 | 0 (0.0%) | 2 (3.5%) |
| $1,000 to $1,499 | 4 (4.9%) | 1 (1.8%) |
| $1,500 to $1,999 | 0 (0.0%) | 0 (0.0%) |
| $2,000 to $2,499 | 0 (0.0%) | 0 (0.0%) |
| $2,500 to $2,999 | 0 (0.0%) | 0 (0.0%) |
| $3,000 or more | 0 (0.0%) | 0 (0.0%) |
| Total | 82 (100.0%) | 57 (100.0%) |
Physical Housing Characteristics in Clayton
Housing Structures in Clayton
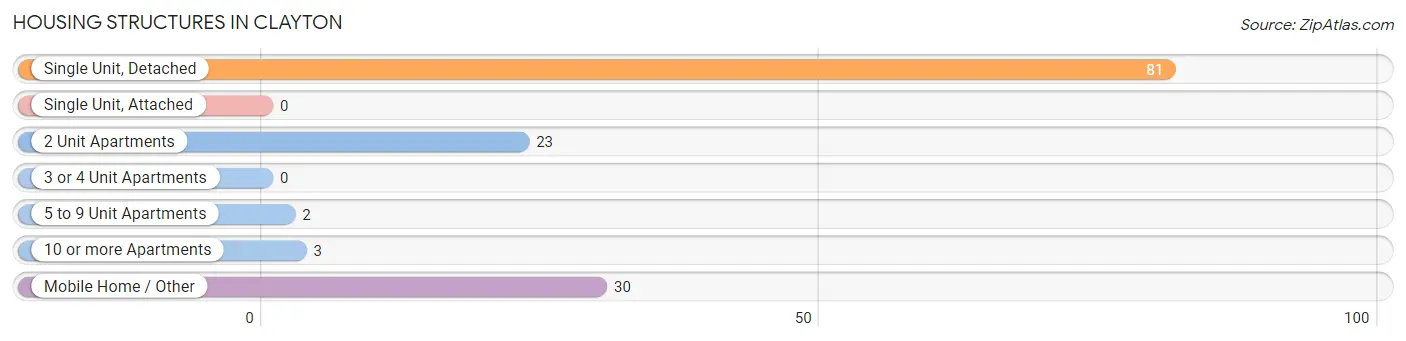
| Structure Type | # Housing Units | % Housing Units |
| Single Unit, Detached | 81 | 58.3% |
| Single Unit, Attached | 0 | 0.0% |
| 2 Unit Apartments | 23 | 16.6% |
| 3 or 4 Unit Apartments | 0 | 0.0% |
| 5 to 9 Unit Apartments | 2 | 1.4% |
| 10 or more Apartments | 3 | 2.2% |
| Mobile Home / Other | 30 | 21.6% |
| Total | 139 | 100.0% |
Housing Structures by Occupancy in Clayton
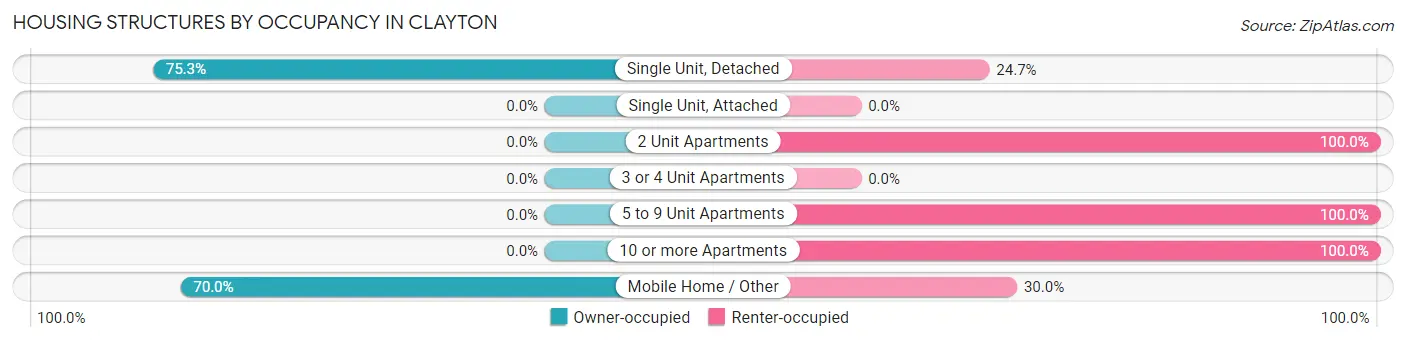
| Structure Type | Owner-occupied | Renter-occupied |
| Single Unit, Detached | 61 (75.3%) | 20 (24.7%) |
| Single Unit, Attached | 0 (0.0%) | 0 (0.0%) |
| 2 Unit Apartments | 0 (0.0%) | 23 (100.0%) |
| 3 or 4 Unit Apartments | 0 (0.0%) | 0 (0.0%) |
| 5 to 9 Unit Apartments | 0 (0.0%) | 2 (100.0%) |
| 10 or more Apartments | 0 (0.0%) | 3 (100.0%) |
| Mobile Home / Other | 21 (70.0%) | 9 (30.0%) |
| Total | 82 (59.0%) | 57 (41.0%) |
Housing Structures by Number of Rooms in Clayton
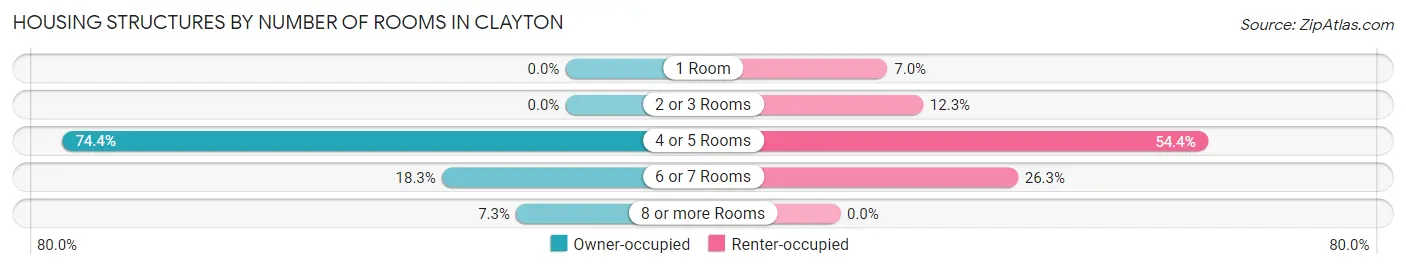
| Number of Rooms | Owner-occupied | Renter-occupied |
| 1 Room | 0 (0.0%) | 4 (7.0%) |
| 2 or 3 Rooms | 0 (0.0%) | 7 (12.3%) |
| 4 or 5 Rooms | 61 (74.4%) | 31 (54.4%) |
| 6 or 7 Rooms | 15 (18.3%) | 15 (26.3%) |
| 8 or more Rooms | 6 (7.3%) | 0 (0.0%) |
| Total | 82 (100.0%) | 57 (100.0%) |
Housing Structure by Heating Type in Clayton
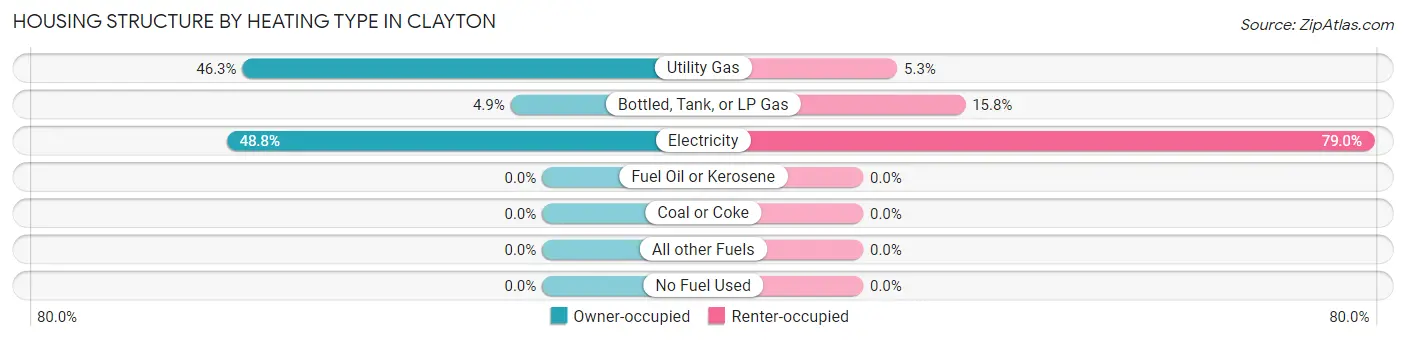
| Heating Type | Owner-occupied | Renter-occupied |
| Utility Gas | 38 (46.3%) | 3 (5.3%) |
| Bottled, Tank, or LP Gas | 4 (4.9%) | 9 (15.8%) |
| Electricity | 40 (48.8%) | 45 (78.9%) |
| Fuel Oil or Kerosene | 0 (0.0%) | 0 (0.0%) |
| Coal or Coke | 0 (0.0%) | 0 (0.0%) |
| All other Fuels | 0 (0.0%) | 0 (0.0%) |
| No Fuel Used | 0 (0.0%) | 0 (0.0%) |
| Total | 82 (100.0%) | 57 (100.0%) |
Household Vehicle Usage in Clayton
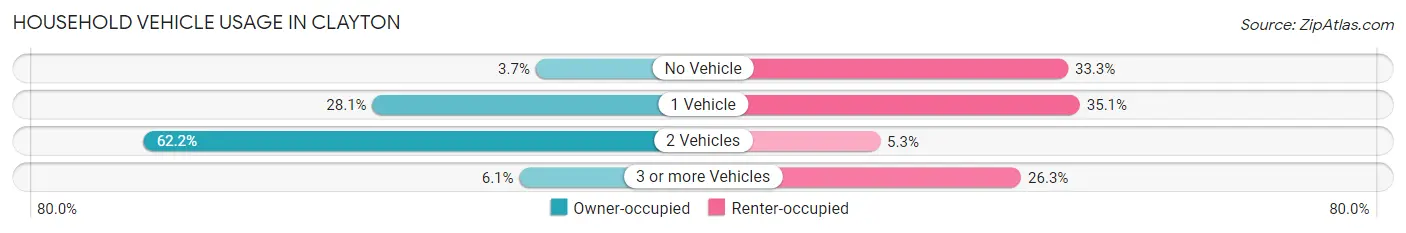
| Vehicles per Household | Owner-occupied | Renter-occupied |
| No Vehicle | 3 (3.7%) | 19 (33.3%) |
| 1 Vehicle | 23 (28.1%) | 20 (35.1%) |
| 2 Vehicles | 51 (62.2%) | 3 (5.3%) |
| 3 or more Vehicles | 5 (6.1%) | 15 (26.3%) |
| Total | 82 (100.0%) | 57 (100.0%) |
Real Estate & Mortgages in Clayton
Real Estate and Mortgage Overview in Clayton
| Characteristic | Without Mortgage | With Mortgage |
| Housing Units | 69 | 13 |
| Median Property Value | $61,900 | $0 |
| Median Household Income | $61,964 | $0 |
| Monthly Housing Costs | $295 | $0 |
| Real Estate Taxes | $459 | $0 |
Property Value by Mortgage Status in Clayton
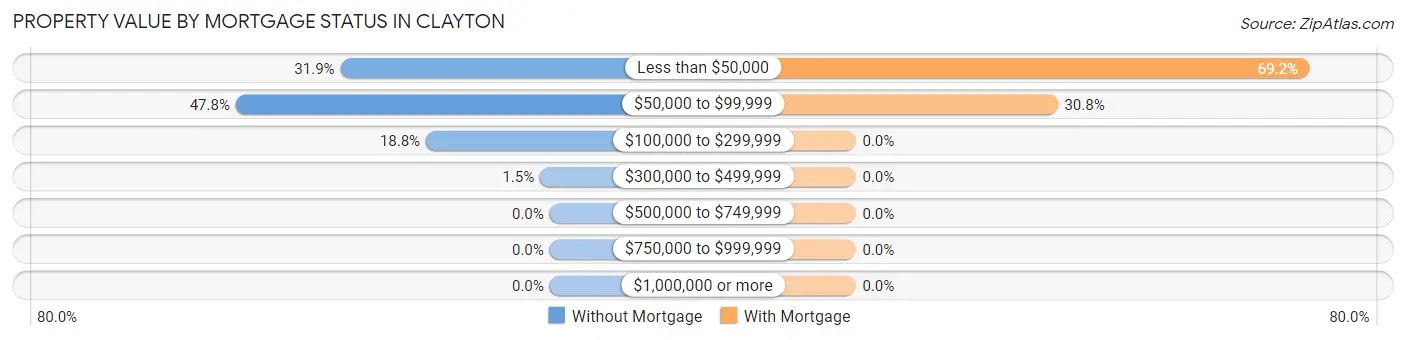
| Property Value | Without Mortgage | With Mortgage |
| Less than $50,000 | 22 (31.9%) | 9 (69.2%) |
| $50,000 to $99,999 | 33 (47.8%) | 4 (30.8%) |
| $100,000 to $299,999 | 13 (18.8%) | 0 (0.0%) |
| $300,000 to $499,999 | 1 (1.5%) | 0 (0.0%) |
| $500,000 to $749,999 | 0 (0.0%) | 0 (0.0%) |
| $750,000 to $999,999 | 0 (0.0%) | 0 (0.0%) |
| $1,000,000 or more | 0 (0.0%) | 0 (0.0%) |
| Total | 69 (100.0%) | 13 (100.0%) |
Household Income by Mortgage Status in Clayton
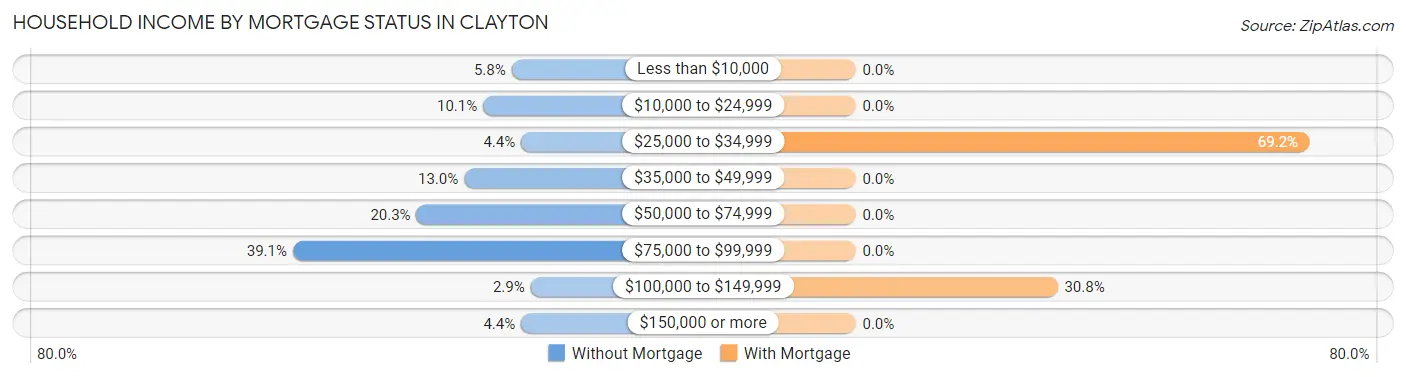
| Household Income | Without Mortgage | With Mortgage |
| Less than $10,000 | 4 (5.8%) | 0 (0.0%) |
| $10,000 to $24,999 | 7 (10.1%) | 0 (0.0%) |
| $25,000 to $34,999 | 3 (4.3%) | 9 (69.2%) |
| $35,000 to $49,999 | 9 (13.0%) | 0 (0.0%) |
| $50,000 to $74,999 | 14 (20.3%) | 0 (0.0%) |
| $75,000 to $99,999 | 27 (39.1%) | 0 (0.0%) |
| $100,000 to $149,999 | 2 (2.9%) | 4 (30.8%) |
| $150,000 or more | 3 (4.3%) | 0 (0.0%) |
| Total | 69 (100.0%) | 13 (100.0%) |
Property Value to Household Income Ratio in Clayton
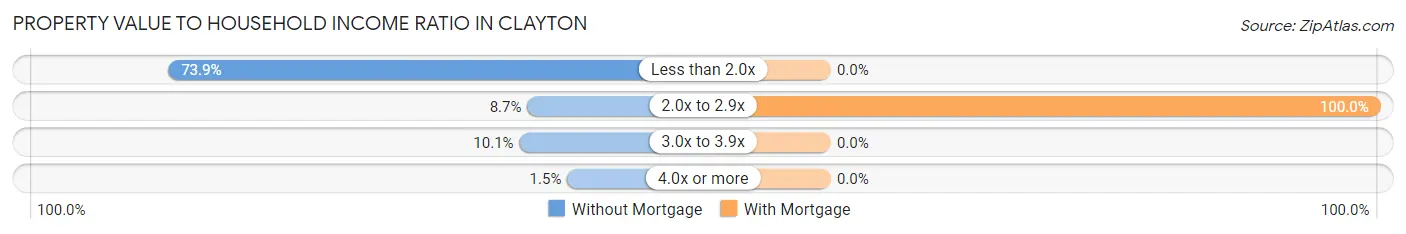
| Value-to-Income Ratio | Without Mortgage | With Mortgage |
| Less than 2.0x | 51 (73.9%) | 0 (0.0%) |
| 2.0x to 2.9x | 6 (8.7%) | 13 (100.0%) |
| 3.0x to 3.9x | 7 (10.1%) | 0 (0.0%) |
| 4.0x or more | 1 (1.5%) | 0 (0.0%) |
| Total | 69 (100.0%) | 13 (100.0%) |
Real Estate Taxes by Mortgage Status in Clayton
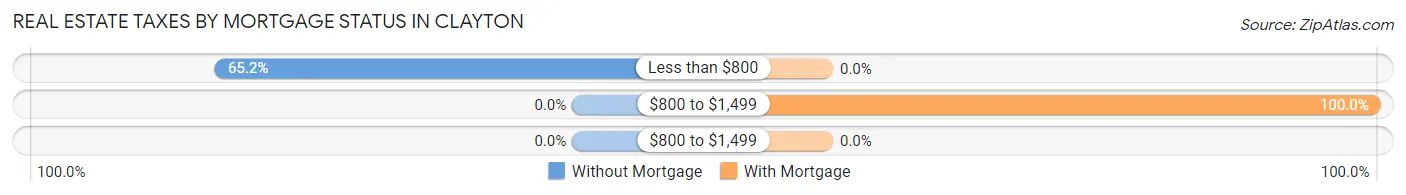
| Property Taxes | Without Mortgage | With Mortgage |
| Less than $800 | 45 (65.2%) | 0 (0.0%) |
| $800 to $1,499 | 0 (0.0%) | 13 (100.0%) |
| $800 to $1,499 | 0 (0.0%) | 0 (0.0%) |
| Total | 69 (100.0%) | 13 (100.0%) |
Health & Disability in Clayton
Health Insurance Coverage by Age in Clayton
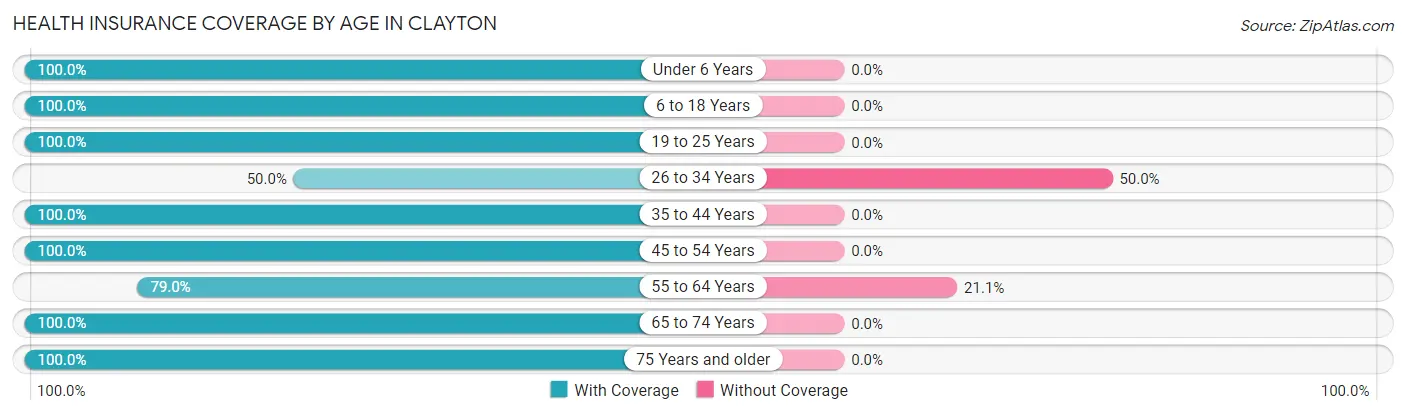
| Age Bracket | With Coverage | Without Coverage |
| Under 6 Years | 21 (100.0%) | 0 (0.0%) |
| 6 to 18 Years | 55 (100.0%) | 0 (0.0%) |
| 19 to 25 Years | 29 (100.0%) | 0 (0.0%) |
| 26 to 34 Years | 17 (50.0%) | 17 (50.0%) |
| 35 to 44 Years | 8 (100.0%) | 0 (0.0%) |
| 45 to 54 Years | 7 (100.0%) | 0 (0.0%) |
| 55 to 64 Years | 60 (78.9%) | 16 (21.0%) |
| 65 to 74 Years | 60 (100.0%) | 0 (0.0%) |
| 75 Years and older | 27 (100.0%) | 0 (0.0%) |
| Total | 284 (89.6%) | 33 (10.4%) |
Health Insurance Coverage by Citizenship Status in Clayton
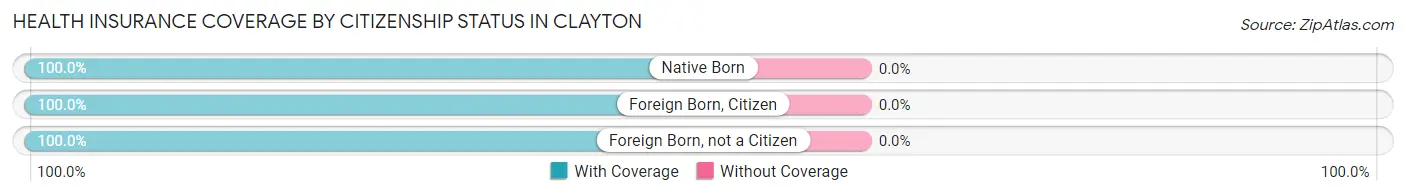
| Citizenship Status | With Coverage | Without Coverage |
| Native Born | 21 (100.0%) | 0 (0.0%) |
| Foreign Born, Citizen | 55 (100.0%) | 0 (0.0%) |
| Foreign Born, not a Citizen | 29 (100.0%) | 0 (0.0%) |
Health Insurance Coverage by Household Income in Clayton
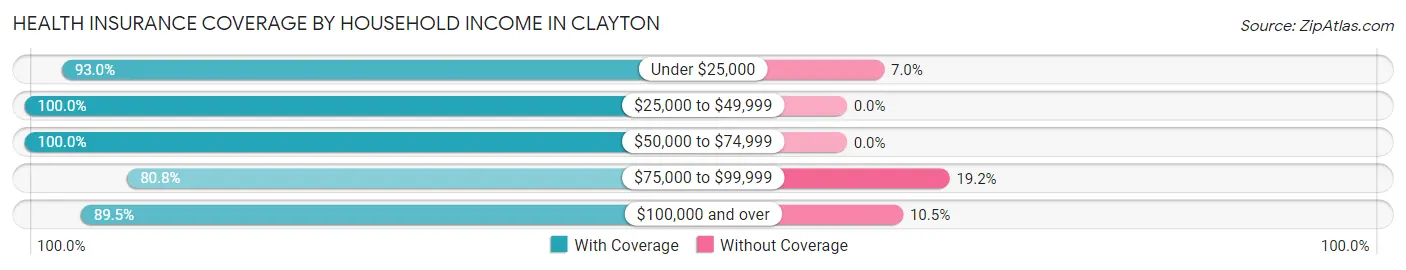
| Household Income | With Coverage | Without Coverage |
| Under $25,000 | 80 (93.0%) | 6 (7.0%) |
| $25,000 to $49,999 | 57 (100.0%) | 0 (0.0%) |
| $50,000 to $74,999 | 25 (100.0%) | 0 (0.0%) |
| $75,000 to $99,999 | 105 (80.8%) | 25 (19.2%) |
| $100,000 and over | 17 (89.5%) | 2 (10.5%) |
Public vs Private Health Insurance Coverage by Age in Clayton
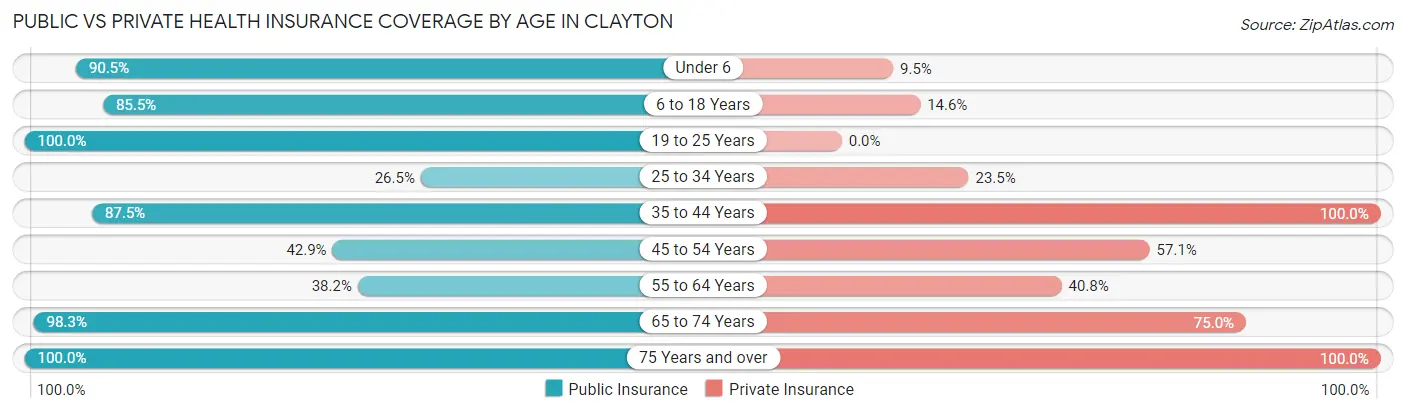
| Age Bracket | Public Insurance | Private Insurance |
| Under 6 | 19 (90.5%) | 2 (9.5%) |
| 6 to 18 Years | 47 (85.5%) | 8 (14.5%) |
| 19 to 25 Years | 29 (100.0%) | 0 (0.0%) |
| 25 to 34 Years | 9 (26.5%) | 8 (23.5%) |
| 35 to 44 Years | 7 (87.5%) | 8 (100.0%) |
| 45 to 54 Years | 3 (42.9%) | 4 (57.1%) |
| 55 to 64 Years | 29 (38.2%) | 31 (40.8%) |
| 65 to 74 Years | 59 (98.3%) | 45 (75.0%) |
| 75 Years and over | 27 (100.0%) | 27 (100.0%) |
| Total | 229 (72.2%) | 133 (42.0%) |
Disability Status by Sex by Age in Clayton
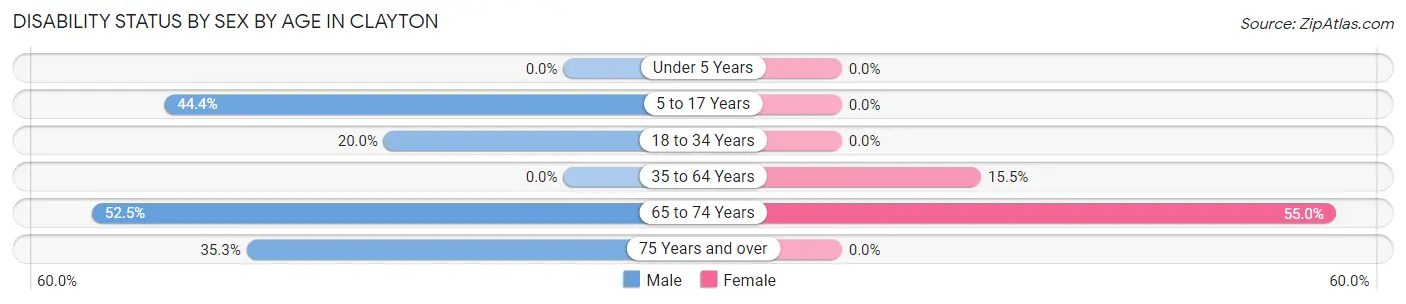
| Age Bracket | Male | Female |
| Under 5 Years | 0 (0.0%) | 0 (0.0%) |
| 5 to 17 Years | 12 (44.4%) | 0 (0.0%) |
| 18 to 34 Years | 6 (20.0%) | 0 (0.0%) |
| 35 to 64 Years | 0 (0.0%) | 9 (15.5%) |
| 65 to 74 Years | 21 (52.5%) | 11 (55.0%) |
| 75 Years and over | 6 (35.3%) | 0 (0.0%) |
Disability Class by Sex by Age in Clayton
Disability Class: Hearing Difficulty
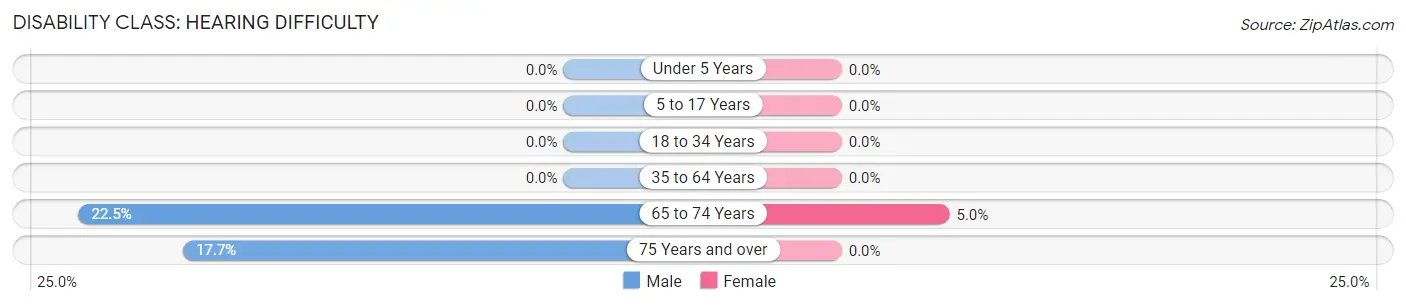
| Age Bracket | Male | Female |
| Under 5 Years | 0 (0.0%) | 0 (0.0%) |
| 5 to 17 Years | 0 (0.0%) | 0 (0.0%) |
| 18 to 34 Years | 0 (0.0%) | 0 (0.0%) |
| 35 to 64 Years | 0 (0.0%) | 0 (0.0%) |
| 65 to 74 Years | 9 (22.5%) | 1 (5.0%) |
| 75 Years and over | 3 (17.6%) | 0 (0.0%) |
Disability Class: Vision Difficulty
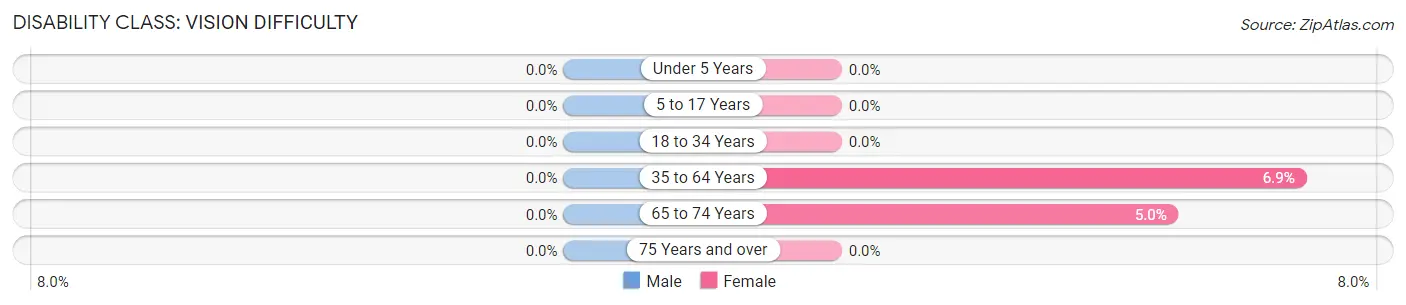
| Age Bracket | Male | Female |
| Under 5 Years | 0 (0.0%) | 0 (0.0%) |
| 5 to 17 Years | 0 (0.0%) | 0 (0.0%) |
| 18 to 34 Years | 0 (0.0%) | 0 (0.0%) |
| 35 to 64 Years | 0 (0.0%) | 4 (6.9%) |
| 65 to 74 Years | 0 (0.0%) | 1 (5.0%) |
| 75 Years and over | 0 (0.0%) | 0 (0.0%) |
Disability Class: Cognitive Difficulty
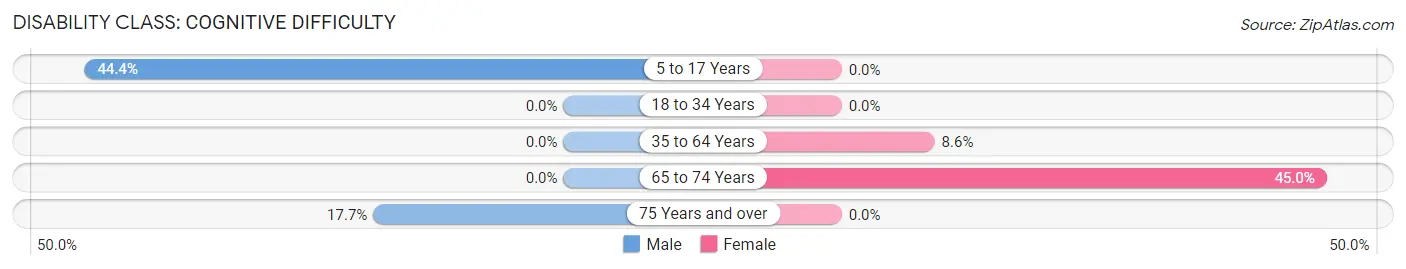
| Age Bracket | Male | Female |
| 5 to 17 Years | 12 (44.4%) | 0 (0.0%) |
| 18 to 34 Years | 0 (0.0%) | 0 (0.0%) |
| 35 to 64 Years | 0 (0.0%) | 5 (8.6%) |
| 65 to 74 Years | 0 (0.0%) | 9 (45.0%) |
| 75 Years and over | 3 (17.6%) | 0 (0.0%) |
Disability Class: Ambulatory Difficulty
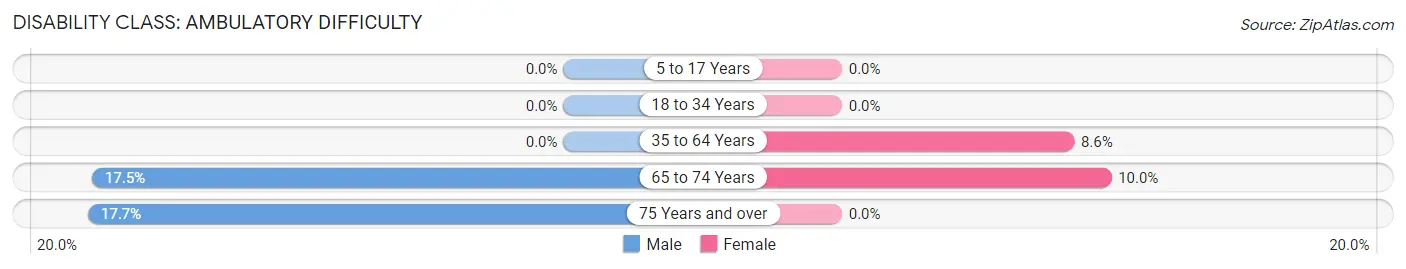
| Age Bracket | Male | Female |
| 5 to 17 Years | 0 (0.0%) | 0 (0.0%) |
| 18 to 34 Years | 0 (0.0%) | 0 (0.0%) |
| 35 to 64 Years | 0 (0.0%) | 5 (8.6%) |
| 65 to 74 Years | 7 (17.5%) | 2 (10.0%) |
| 75 Years and over | 3 (17.6%) | 0 (0.0%) |
Disability Class: Self-Care Difficulty
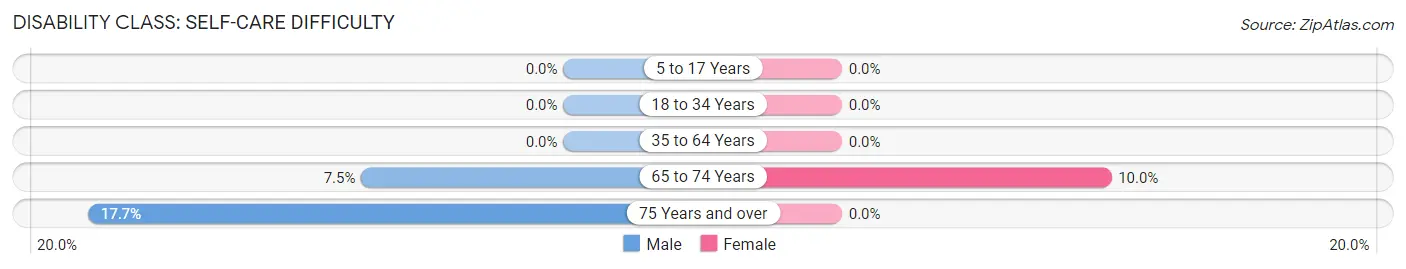
| Age Bracket | Male | Female |
| 5 to 17 Years | 0 (0.0%) | 0 (0.0%) |
| 18 to 34 Years | 0 (0.0%) | 0 (0.0%) |
| 35 to 64 Years | 0 (0.0%) | 0 (0.0%) |
| 65 to 74 Years | 3 (7.5%) | 2 (10.0%) |
| 75 Years and over | 3 (17.6%) | 0 (0.0%) |
Technology Access in Clayton
Computing Device Access in Clayton
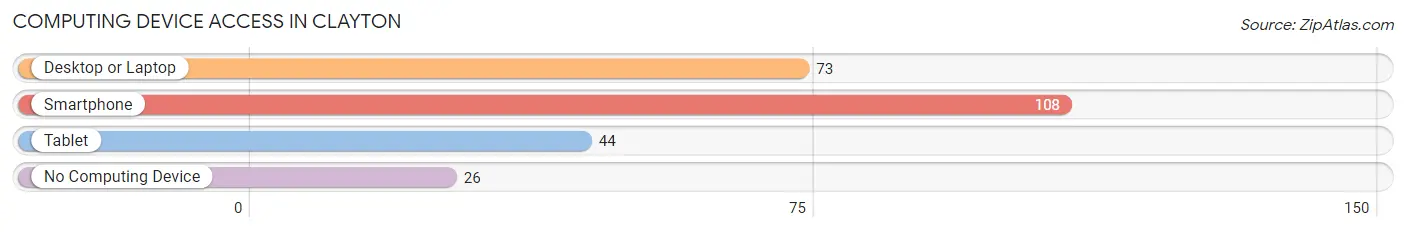
| Device Type | # Households | % Households |
| Desktop or Laptop | 73 | 52.5% |
| Smartphone | 108 | 77.7% |
| Tablet | 44 | 31.7% |
| No Computing Device | 26 | 18.7% |
| Total | 139 | 100.0% |
Internet Access in Clayton
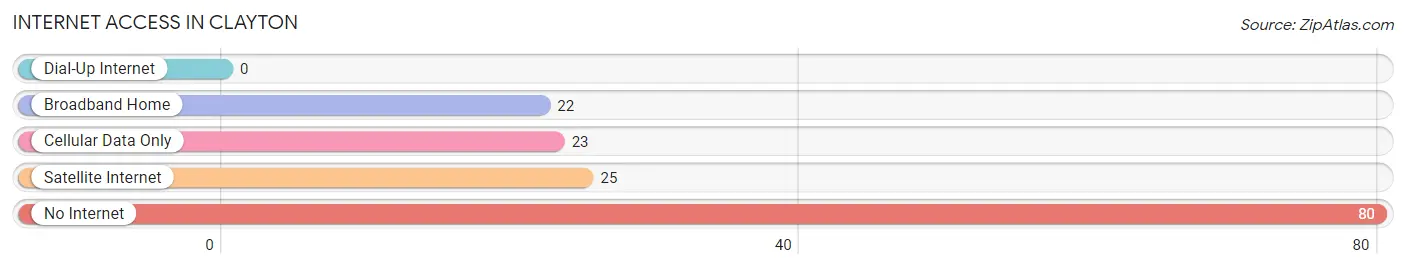
| Internet Type | # Households | % Households |
| Dial-Up Internet | 0 | 0.0% |
| Broadband Home | 22 | 15.8% |
| Cellular Data Only | 23 | 16.6% |
| Satellite Internet | 25 | 18.0% |
| No Internet | 80 | 57.6% |
| Total | 139 | 100.0% |
Clayton Summary
Clayton is a small town located in the northern part of Louisiana, United States. It is situated in the parish of Jackson and is part of the Ruston-Grambling Metropolitan Statistical Area. The town has a population of 1,845 as of the 2010 census.
History
Clayton was founded in 1883 by a group of settlers from the nearby town of Ruston. The town was named after the first postmaster, William Clayton. The town was originally a farming community, but it soon developed into a small industrial center. The town was incorporated in 1891 and the first mayor was elected in 1892.
In the early 1900s, Clayton was a thriving community with a variety of businesses, including a cotton gin, a sawmill, a grist mill, a blacksmith shop, and a general store. The town also had a school, a bank, and a hotel.
In the 1920s, the town experienced a period of growth and development. The population increased from 1,000 to 1,500 and the town was connected to the national railway system. The town also had a movie theater, a library, and a hospital.
In the 1950s, the town experienced a period of decline. The population decreased to 1,200 and many businesses closed. The town was also affected by the Great Depression and World War II.
In the 1970s, the town experienced a period of revitalization. The population increased to 1,800 and the town was connected to the interstate highway system. The town also had a new library, a new hospital, and a new school.
Geography
Clayton is located in the northern part of Louisiana, in the parish of Jackson. The town is situated at the intersection of US Highway 80 and Louisiana Highway 4. The town is located about 25 miles east of Ruston and about 50 miles north of Monroe.
The town is situated on a flat plain and is surrounded by rolling hills. The town is located in a humid subtropical climate zone and has hot, humid summers and mild winters. The average annual temperature is 68 degrees Fahrenheit and the average annual precipitation is 48 inches.
Economy
The economy of Clayton is largely based on agriculture and manufacturing. The town is home to several large farms, which produce cotton, soybeans, corn, and other crops. The town also has several manufacturing plants, which produce furniture, clothing, and other products.
The town also has several retail stores, restaurants, and other businesses. The town is also home to a hospital, a library, and a movie theater.
Demographics
As of the 2010 census, the population of Clayton was 1,845. The racial makeup of the town was 79.3% White, 17.3% African American, 0.7% Native American, 0.3% Asian, 0.1% Pacific Islander, and 2.3% from other races. The median household income was $31,250 and the median family income was $37,500.
Conclusion
Clayton is a small town located in the northern part of Louisiana. The town has a long history and has experienced periods of growth and decline. The town is largely based on agriculture and manufacturing and has several retail stores, restaurants, and other businesses. The population of Clayton is 1,845 and the town has a diverse racial makeup.
Common Questions
What is Per Capita Income in Clayton?
Per Capita income in Clayton is $23,140.
What is the Median Family Income in Clayton?
Median Family Income in Clayton is $78,008.
What is the Median Household income in Clayton?
Median Household Income in Clayton is $47,292.
What is Income or Wage Gap in Clayton?
Income or Wage Gap in Clayton is 61.7%.
Women in Clayton earn 38.3 cents for every dollar earned by a man.
What is Inequality or Gini Index in Clayton?
Inequality or Gini Index in Clayton is 0.42.
What is the Total Population of Clayton?
Total Population of Clayton is 317.
What is the Total Male Population of Clayton?
Total Male Population of Clayton is 162.
What is the Total Female Population of Clayton?
Total Female Population of Clayton is 155.
What is the Ratio of Males per 100 Females in Clayton?
There are 104.52 Males per 100 Females in Clayton.
What is the Ratio of Females per 100 Males in Clayton?
There are 95.68 Females per 100 Males in Clayton.
What is the Median Population Age in Clayton?
Median Population Age in Clayton is 55.3 Years.
What is the Average Family Size in Clayton
Average Family Size in Clayton is 3.0 People.
What is the Average Household Size in Clayton
Average Household Size in Clayton is 2.3 People.
How Large is the Labor Force in Clayton?
There are 146 People in the Labor Forcein in Clayton.
What is the Percentage of People in the Labor Force in Clayton?
59.1% of People are in the Labor Force in Clayton.
What is the Unemployment Rate in Clayton?
Unemployment Rate in Clayton is 4.8%.