Chatham, LA Map & Demographics
Chatham Map
Chatham Overview
$14,204
PER CAPITA INCOME
$36,154
AVG FAMILY INCOME
$28,750
AVG HOUSEHOLD INCOME
29.3%
WAGE / INCOME GAP [ % ]
70.7¢/ $1
WAGE / INCOME GAP [ $ ]
0.39
INEQUALITY / GINI INDEX
783
TOTAL POPULATION
302
MALE POPULATION
481
FEMALE POPULATION
62.79
MALES / 100 FEMALES
159.27
FEMALES / 100 MALES
30.5
MEDIAN AGE
4.7
AVG FAMILY SIZE
2.9
AVG HOUSEHOLD SIZE
221
LABOR FORCE [ PEOPLE ]
37.5%
PERCENT IN LABOR FORCE
1.4%
UNEMPLOYMENT RATE
Chatham Zip Codes
Chatham Area Codes
Income in Chatham
Income Overview in Chatham
Per Capita Income in Chatham is $14,204, while median incomes of families and households are $36,154 and $28,750 respectively.
| Characteristic | Number | Measure |
| Per Capita Income | 783 | $14,204 |
| Median Family Income | 122 | $36,154 |
| Mean Family Income | 122 | $43,016 |
| Median Household Income | 266 | $28,750 |
| Mean Household Income | 266 | $35,200 |
| Income Deficit | 122 | $0 |
| Wage / Income Gap (%) | 783 | 29.29% |
| Wage / Income Gap ($) | 783 | 70.71¢ per $1 |
| Gini / Inequality Index | 783 | 0.39 |
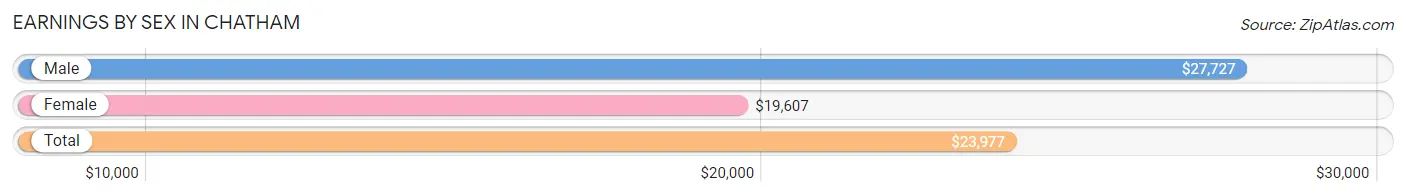
Earnings by Sex in Chatham
Average Earnings in Chatham are $23,977, $27,727 for men and $19,607 for women, a difference of 29.3%.
| Sex | Number | Average Earnings |
| Male | 146 (59.6%) | $27,727 |
| Female | 99 (40.4%) | $19,607 |
| Total | 245 (100.0%) | $23,977 |
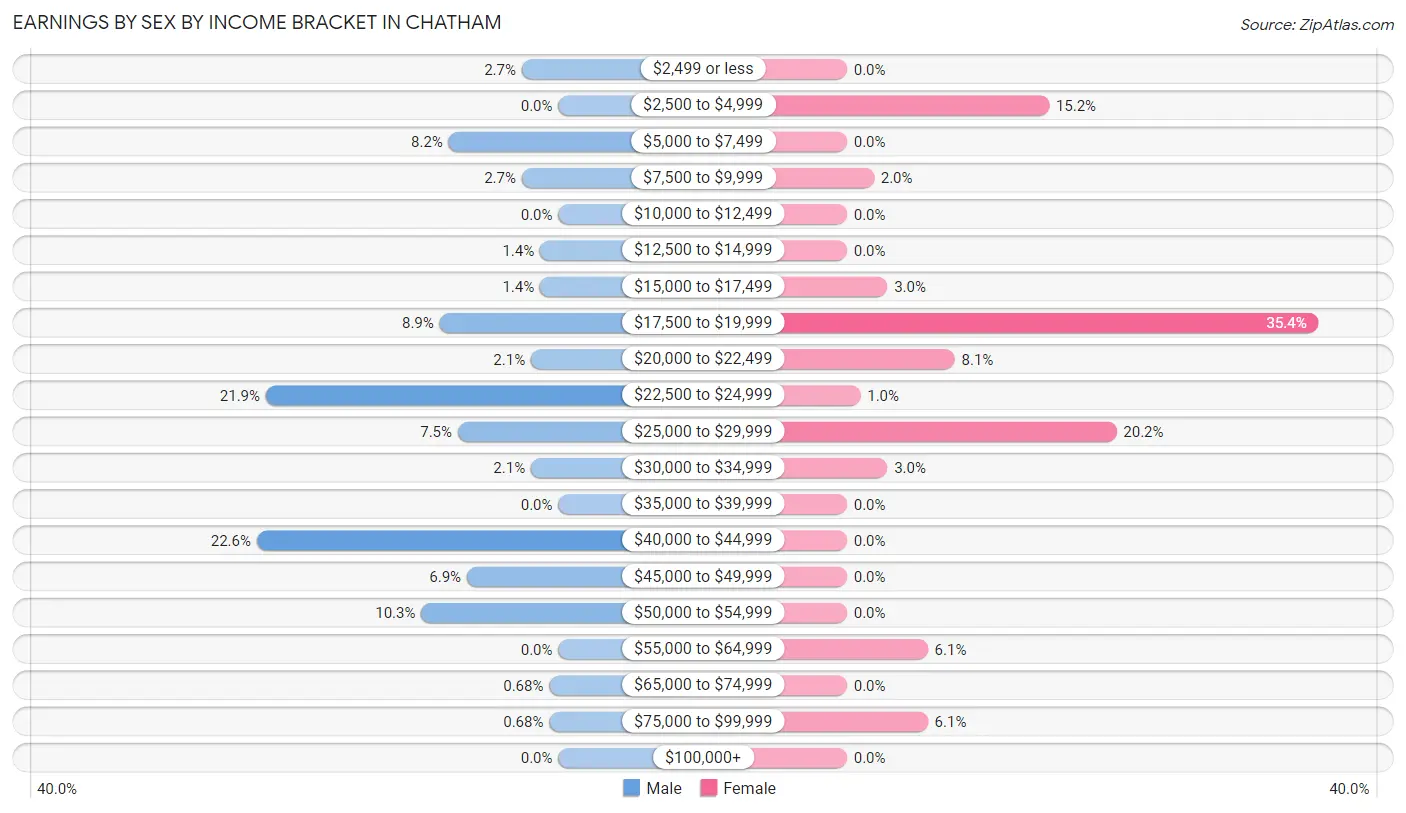
Earnings by Sex by Income Bracket in Chatham
The most common earnings brackets in Chatham are $40,000 to $44,999 for men (33 | 22.6%) and $17,500 to $19,999 for women (35 | 35.3%).
| Income | Male | Female |
| $2,499 or less | 4 (2.7%) | 0 (0.0%) |
| $2,500 to $4,999 | 0 (0.0%) | 15 (15.1%) |
| $5,000 to $7,499 | 12 (8.2%) | 0 (0.0%) |
| $7,500 to $9,999 | 4 (2.7%) | 2 (2.0%) |
| $10,000 to $12,499 | 0 (0.0%) | 0 (0.0%) |
| $12,500 to $14,999 | 2 (1.4%) | 0 (0.0%) |
| $15,000 to $17,499 | 2 (1.4%) | 3 (3.0%) |
| $17,500 to $19,999 | 13 (8.9%) | 35 (35.3%) |
| $20,000 to $22,499 | 3 (2.1%) | 8 (8.1%) |
| $22,500 to $24,999 | 32 (21.9%) | 1 (1.0%) |
| $25,000 to $29,999 | 11 (7.5%) | 20 (20.2%) |
| $30,000 to $34,999 | 3 (2.1%) | 3 (3.0%) |
| $35,000 to $39,999 | 0 (0.0%) | 0 (0.0%) |
| $40,000 to $44,999 | 33 (22.6%) | 0 (0.0%) |
| $45,000 to $49,999 | 10 (6.9%) | 0 (0.0%) |
| $50,000 to $54,999 | 15 (10.3%) | 0 (0.0%) |
| $55,000 to $64,999 | 0 (0.0%) | 6 (6.1%) |
| $65,000 to $74,999 | 1 (0.7%) | 0 (0.0%) |
| $75,000 to $99,999 | 1 (0.7%) | 6 (6.1%) |
| $100,000+ | 0 (0.0%) | 0 (0.0%) |
| Total | 146 (100.0%) | 99 (100.0%) |
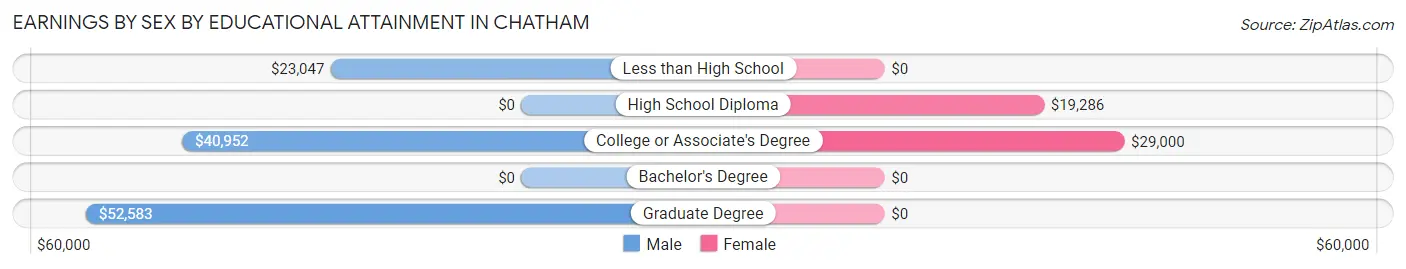
Earnings by Sex by Educational Attainment in Chatham
Average earnings in Chatham are $27,727 for men and $19,679 for women, a difference of 29.0%. Men with an educational attainment of graduate degree enjoy the highest average annual earnings of $52,583, while those with less than high school education earn the least with $23,047. Women with an educational attainment of college or associate's degree earn the most with the average annual earnings of $29,000, while those with high school diploma education have the smallest earnings of $19,286.
| Educational Attainment | Male Income | Female Income |
| Less than High School | $23,047 | $0 |
| High School Diploma | - | - |
| College or Associate's Degree | $40,952 | $29,000 |
| Bachelor's Degree | - | - |
| Graduate Degree | $52,583 | $0 |
| Total | $27,727 | $19,679 |
Family Income in Chatham
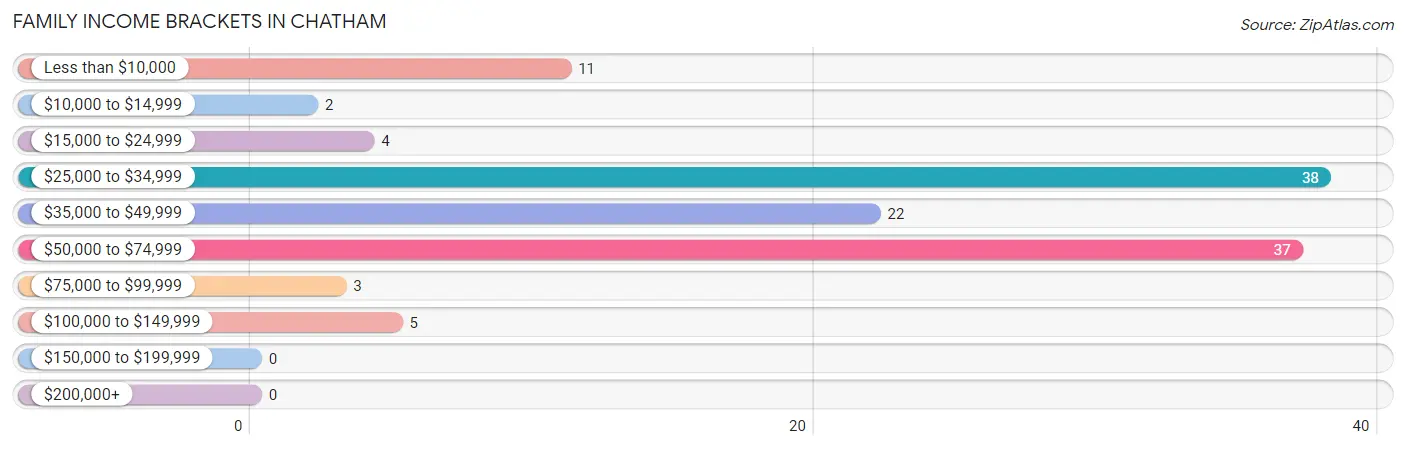
Family Income Brackets in Chatham
According to the Chatham family income data, there are 38 families falling into the $25,000 to $34,999 income range, which is the most common income bracket and makes up 31.1% of all families.
| Income Bracket | # Families | % Families |
| Less than $10,000 | 11 | 9.0% |
| $10,000 to $14,999 | 2 | 1.6% |
| $15,000 to $24,999 | 4 | 3.3% |
| $25,000 to $34,999 | 38 | 31.1% |
| $35,000 to $49,999 | 22 | 18.0% |
| $50,000 to $74,999 | 37 | 30.3% |
| $75,000 to $99,999 | 3 | 2.5% |
| $100,000 to $149,999 | 5 | 4.1% |
| $150,000 to $199,999 | 0 | 0.0% |
| $200,000+ | 0 | 0.0% |
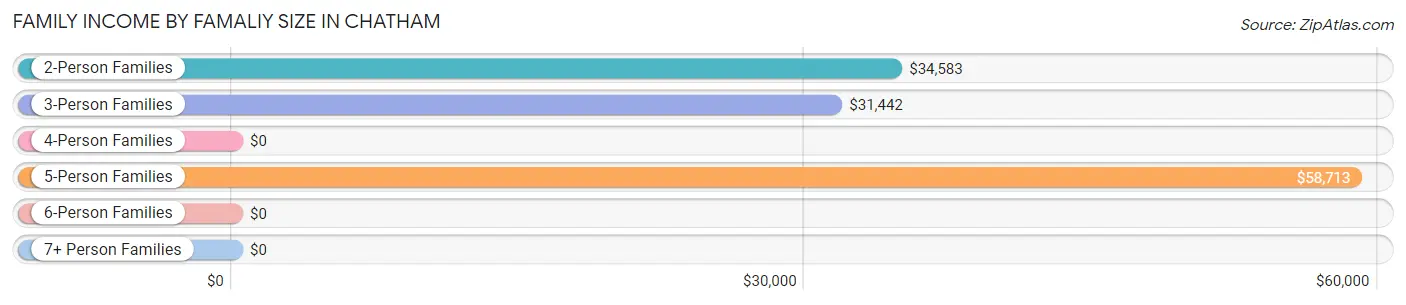
Family Income by Famaliy Size in Chatham
5-person families (35 | 28.7%) account for the highest median family income in Chatham with $58,713 per family, while 2-person families (17 | 13.9%) have the highest median income of $17,292 per family member.
| Income Bracket | # Families | Median Income |
| 2-Person Families | 17 (13.9%) | $34,583 |
| 3-Person Families | 59 (48.4%) | $31,442 |
| 4-Person Families | 11 (9.0%) | $0 |
| 5-Person Families | 35 (28.7%) | $58,713 |
| 6-Person Families | 0 (0.0%) | $0 |
| 7+ Person Families | 0 (0.0%) | $0 |
| Total | 122 (100.0%) | $36,154 |
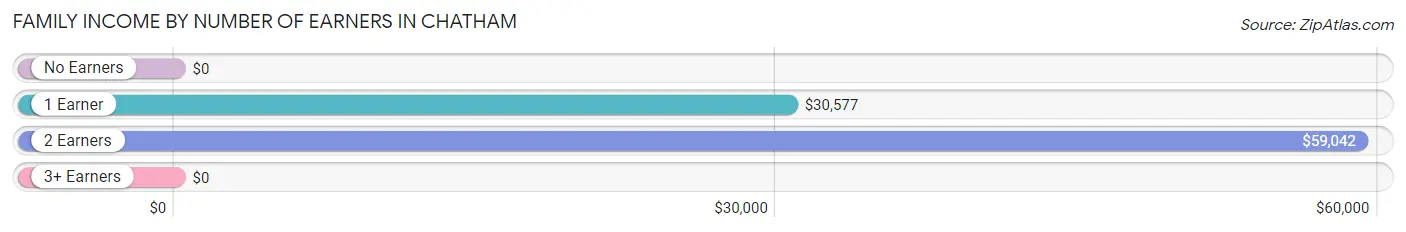
Family Income by Number of Earners in Chatham
| Number of Earners | # Families | Median Income |
| No Earners | 27 (22.1%) | $0 |
| 1 Earner | 58 (47.5%) | $30,577 |
| 2 Earners | 37 (30.3%) | $59,042 |
| 3+ Earners | 0 (0.0%) | $0 |
| Total | 122 (100.0%) | $36,154 |
Household Income in Chatham
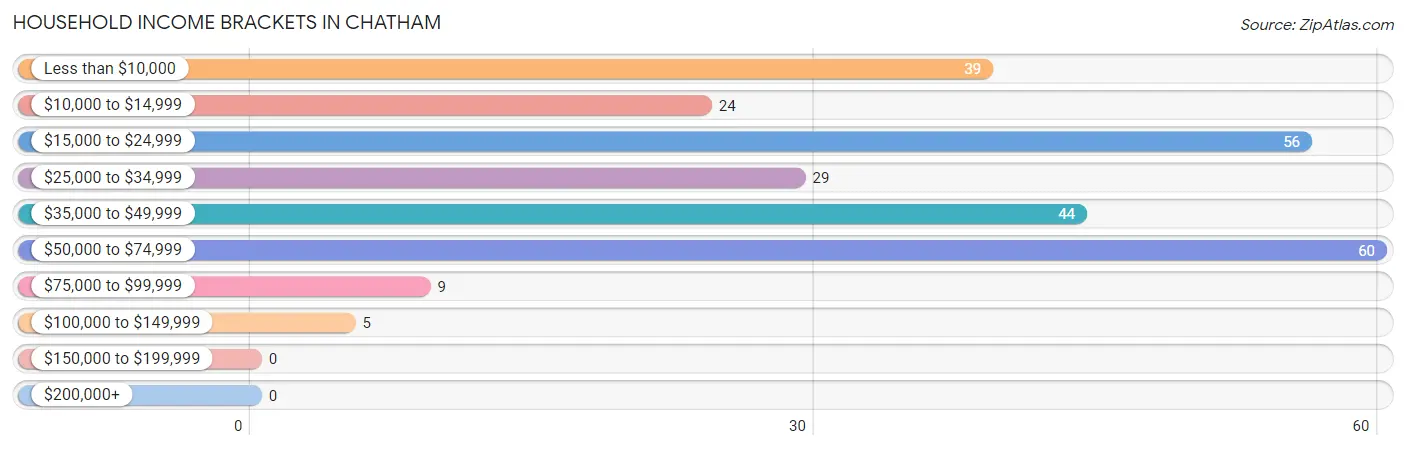
Household Income Brackets in Chatham
With 60 households falling in the category, the $50,000 to $74,999 income range is the most frequent in Chatham, accounting for 22.6% of all households.
| Income Bracket | # Households | % Households |
| Less than $10,000 | 39 | 14.7% |
| $10,000 to $14,999 | 24 | 9.0% |
| $15,000 to $24,999 | 56 | 21.1% |
| $25,000 to $34,999 | 29 | 10.9% |
| $35,000 to $49,999 | 44 | 16.5% |
| $50,000 to $74,999 | 60 | 22.6% |
| $75,000 to $99,999 | 9 | 3.4% |
| $100,000 to $149,999 | 5 | 1.9% |
| $150,000 to $199,999 | 0 | 0.0% |
| $200,000+ | 0 | 0.0% |
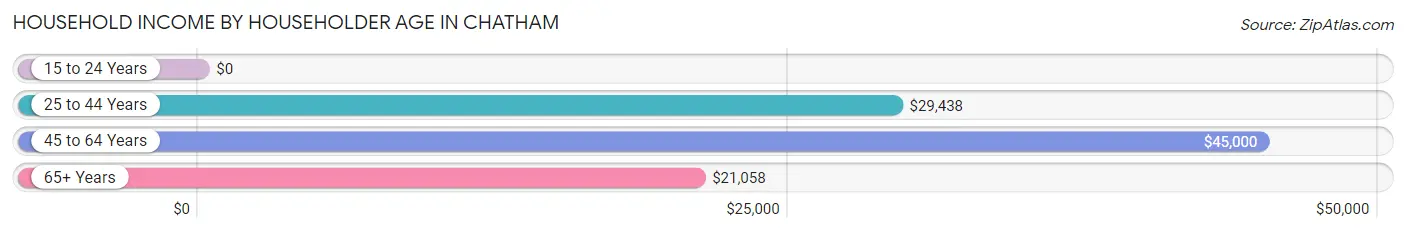
Household Income by Householder Age in Chatham
The median household income in Chatham is $28,750, with the highest median household income of $45,000 found in the 45 to 64 years age bracket for the primary householder. A total of 84 households (31.6%) fall into this category. Meanwhile, the 15 to 24 years age bracket for the primary householder has the lowest median household income of $0, with 2 households (0.7%) in this group.
| Income Bracket | # Households | Median Income |
| 15 to 24 Years | 2 (0.7%) | $0 |
| 25 to 44 Years | 117 (44.0%) | $29,438 |
| 45 to 64 Years | 84 (31.6%) | $45,000 |
| 65+ Years | 63 (23.7%) | $21,058 |
| Total | 266 (100.0%) | $28,750 |
Poverty in Chatham
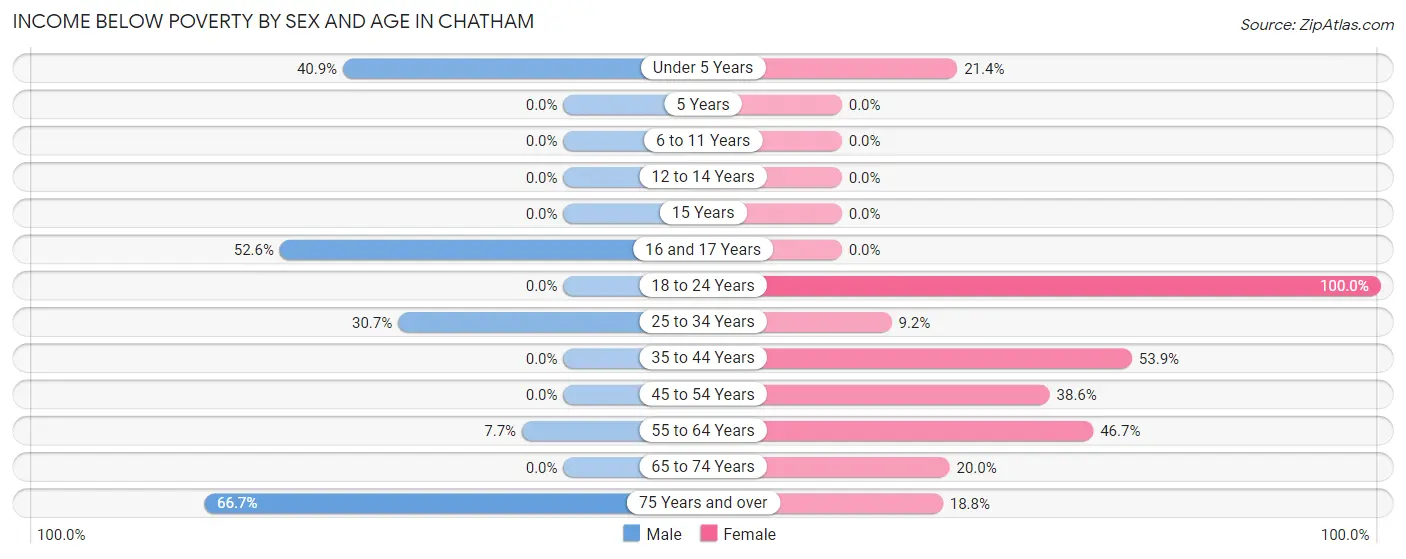
Income Below Poverty by Sex and Age in Chatham
With 21.2% poverty level for males and 19.3% for females among the residents of Chatham, 75 year old and over males and 18 to 24 year old females are the most vulnerable to poverty, with 8 males (66.7%) and 4 females (100.0%) in their respective age groups living below the poverty level.
| Age Bracket | Male | Female |
| Under 5 Years | 18 (40.9%) | 12 (21.4%) |
| 5 Years | 0 (0.0%) | 0 (0.0%) |
| 6 to 11 Years | 0 (0.0%) | 0 (0.0%) |
| 12 to 14 Years | 0 (0.0%) | 0 (0.0%) |
| 15 Years | 0 (0.0%) | 0 (0.0%) |
| 16 and 17 Years | 10 (52.6%) | 0 (0.0%) |
| 18 to 24 Years | 0 (0.0%) | 4 (100.0%) |
| 25 to 34 Years | 27 (30.7%) | 18 (9.2%) |
| 35 to 44 Years | 0 (0.0%) | 14 (53.8%) |
| 45 to 54 Years | 0 (0.0%) | 27 (38.6%) |
| 55 to 64 Years | 1 (7.7%) | 7 (46.7%) |
| 65 to 74 Years | 0 (0.0%) | 5 (20.0%) |
| 75 Years and over | 8 (66.7%) | 6 (18.8%) |
| Total | 64 (21.2%) | 93 (19.3%) |
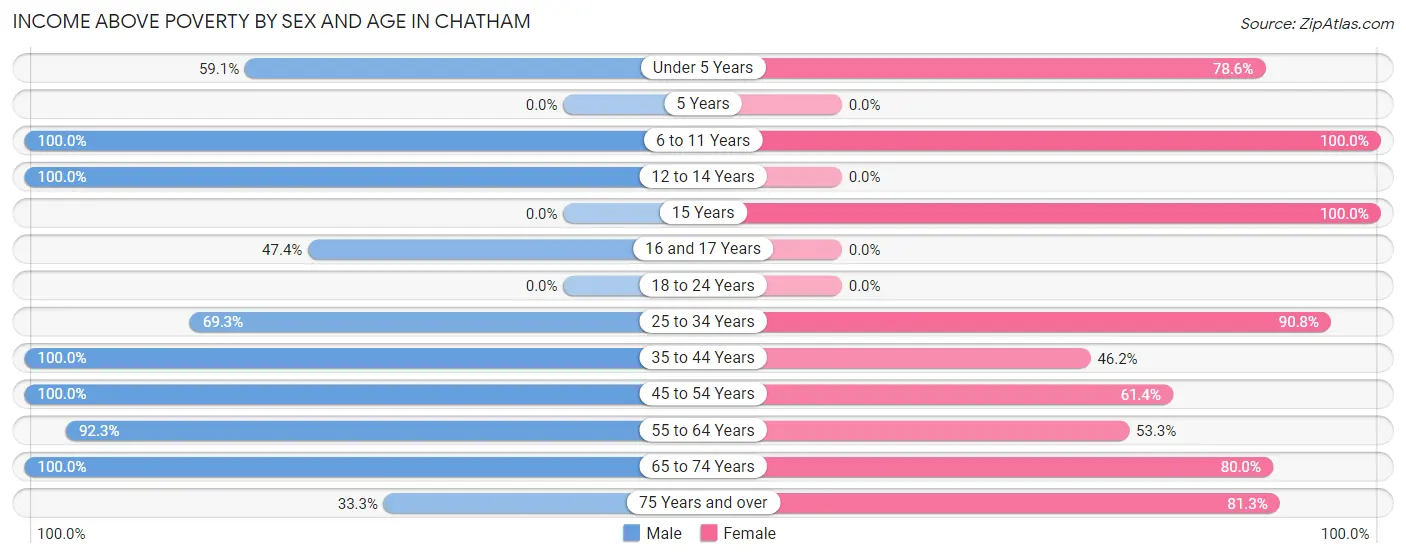
Income Above Poverty by Sex and Age in Chatham
According to the poverty statistics in Chatham, males aged 6 to 11 years and females aged 6 to 11 years are the age groups that are most secure financially, with 100.0% of males and 100.0% of females in these age groups living above the poverty line.
| Age Bracket | Male | Female |
| Under 5 Years | 26 (59.1%) | 44 (78.6%) |
| 5 Years | 0 (0.0%) | 0 (0.0%) |
| 6 to 11 Years | 14 (100.0%) | 54 (100.0%) |
| 12 to 14 Years | 21 (100.0%) | 0 (0.0%) |
| 15 Years | 0 (0.0%) | 4 (100.0%) |
| 16 and 17 Years | 9 (47.4%) | 0 (0.0%) |
| 18 to 24 Years | 0 (0.0%) | 0 (0.0%) |
| 25 to 34 Years | 61 (69.3%) | 177 (90.8%) |
| 35 to 44 Years | 36 (100.0%) | 12 (46.2%) |
| 45 to 54 Years | 42 (100.0%) | 43 (61.4%) |
| 55 to 64 Years | 12 (92.3%) | 8 (53.3%) |
| 65 to 74 Years | 13 (100.0%) | 20 (80.0%) |
| 75 Years and over | 4 (33.3%) | 26 (81.2%) |
| Total | 238 (78.8%) | 388 (80.7%) |
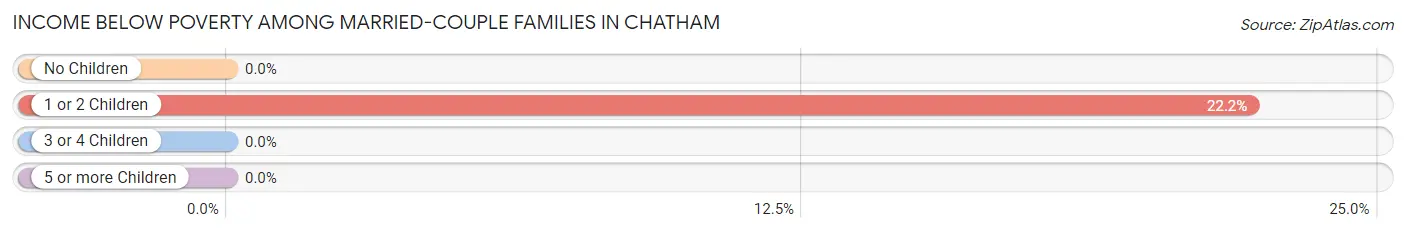
Income Below Poverty Among Married-Couple Families in Chatham
The poverty statistics for married-couple families in Chatham show that 3.3% or 2 of the total 60 families live below the poverty line. Families with 1 or 2 children have the highest poverty rate of 22.2%, comprising of 2 families. On the other hand, families with no children have the lowest poverty rate of 0.0%, which includes 0 families.
| Children | Above Poverty | Below Poverty |
| No Children | 21 (100.0%) | 0 (0.0%) |
| 1 or 2 Children | 7 (77.8%) | 2 (22.2%) |
| 3 or 4 Children | 30 (100.0%) | 0 (0.0%) |
| 5 or more Children | 0 (0.0%) | 0 (0.0%) |
| Total | 58 (96.7%) | 2 (3.3%) |
Income Below Poverty Among Single-Parent Households in Chatham
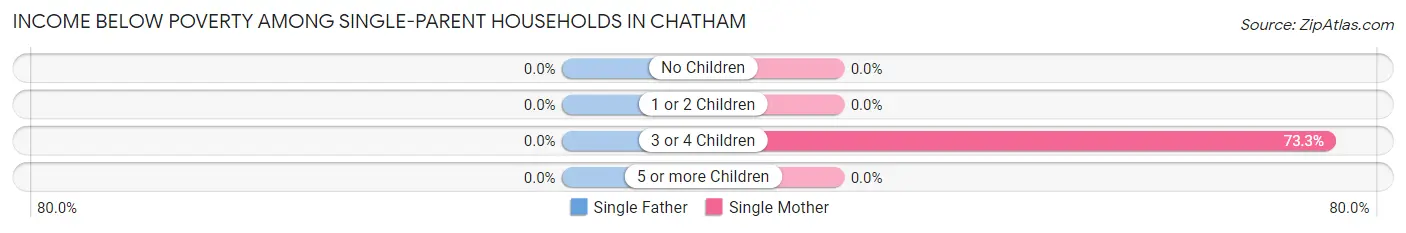
| Children | Single Father | Single Mother |
| No Children | 0 (0.0%) | 0 (0.0%) |
| 1 or 2 Children | 0 (0.0%) | 0 (0.0%) |
| 3 or 4 Children | 0 (0.0%) | 11 (73.3%) |
| 5 or more Children | 0 (0.0%) | 0 (0.0%) |
| Total | 0 (0.0%) | 11 (23.9%) |
Income Below Poverty Among Married-Couple vs Single-Parent Households in Chatham
The poverty data for Chatham shows that 2 of the married-couple family households (3.3%) and 11 of the single-parent households (17.7%) are living below the poverty level. Within the married-couple family households, those with 1 or 2 children have the highest poverty rate, with 2 households (22.2%) falling below the poverty line. Among the single-parent households, those with 3 or 4 children have the highest poverty rate, with 11 household (73.3%) living below poverty.
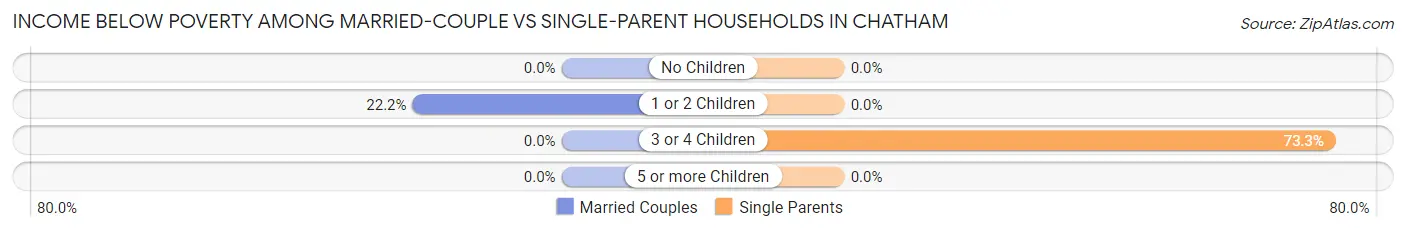
| Children | Married-Couple Families | Single-Parent Households |
| No Children | 0 (0.0%) | 0 (0.0%) |
| 1 or 2 Children | 2 (22.2%) | 0 (0.0%) |
| 3 or 4 Children | 0 (0.0%) | 11 (73.3%) |
| 5 or more Children | 0 (0.0%) | 0 (0.0%) |
| Total | 2 (3.3%) | 11 (17.7%) |
Race in Chatham
The most populous races in Chatham are White / Caucasian (409 | 52.2%), Black / African American (275 | 35.1%), and Two or more Races (99 | 12.6%).
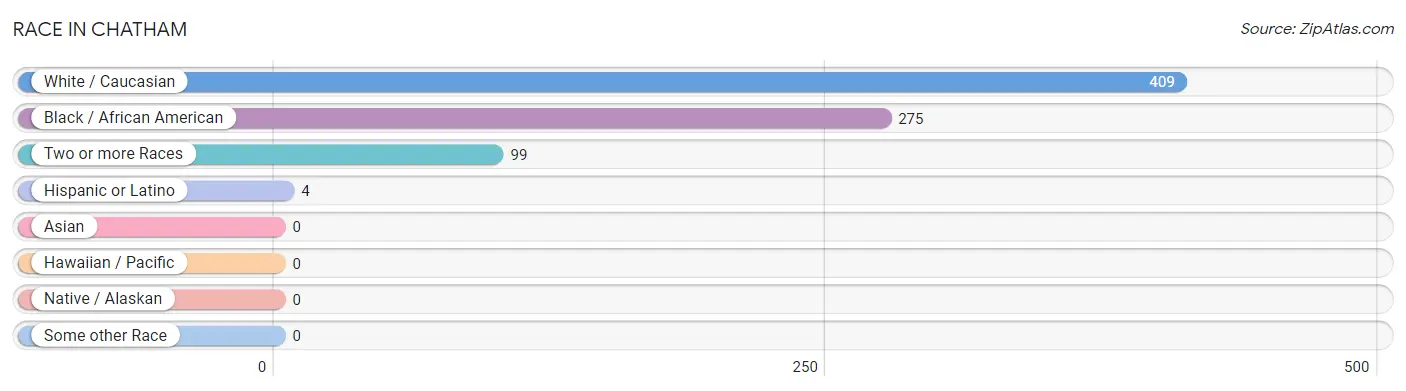
| Race | # Population | % Population |
| Asian | 0 | 0.0% |
| Black / African American | 275 | 35.1% |
| Hawaiian / Pacific | 0 | 0.0% |
| Hispanic or Latino | 4 | 0.5% |
| Native / Alaskan | 0 | 0.0% |
| White / Caucasian | 409 | 52.2% |
| Two or more Races | 99 | 12.6% |
| Some other Race | 0 | 0.0% |
| Total | 783 | 100.0% |
Ancestry in Chatham
The most populous ancestries reported in Chatham are Irish (84 | 10.7%), German (82 | 10.5%), American (46 | 5.9%), English (14 | 1.8%), and French (9 | 1.1%), together accounting for 30.0% of all Chatham residents.
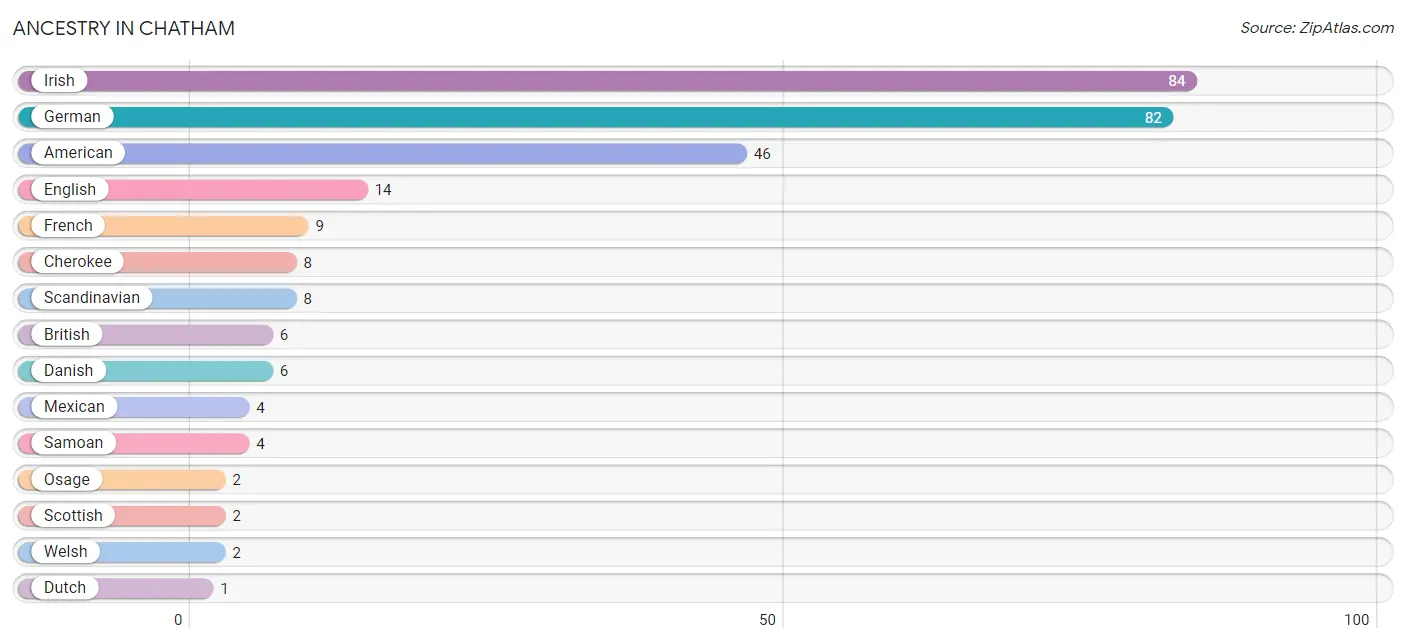
| Ancestry | # Population | % Population |
| American | 46 | 5.9% |
| British | 6 | 0.8% |
| Cherokee | 8 | 1.0% |
| Danish | 6 | 0.8% |
| Dutch | 1 | 0.1% |
| English | 14 | 1.8% |
| French | 9 | 1.1% |
| German | 82 | 10.5% |
| Irish | 84 | 10.7% |
| Mexican | 4 | 0.5% |
| Osage | 2 | 0.3% |
| Samoan | 4 | 0.5% |
| Scandinavian | 8 | 1.0% |
| Scottish | 2 | 0.3% |
| Welsh | 2 | 0.3% | View All 15 Rows |
Immigrants in Chatham

| Immigration Origin | # Population | % Population | View All 0 Rows |
Sex and Age in Chatham
Sex and Age in Chatham
The most populous age groups in Chatham are 30 to 34 Years (58 | 19.2%) for men and 25 to 29 Years (122 | 25.4%) for women.
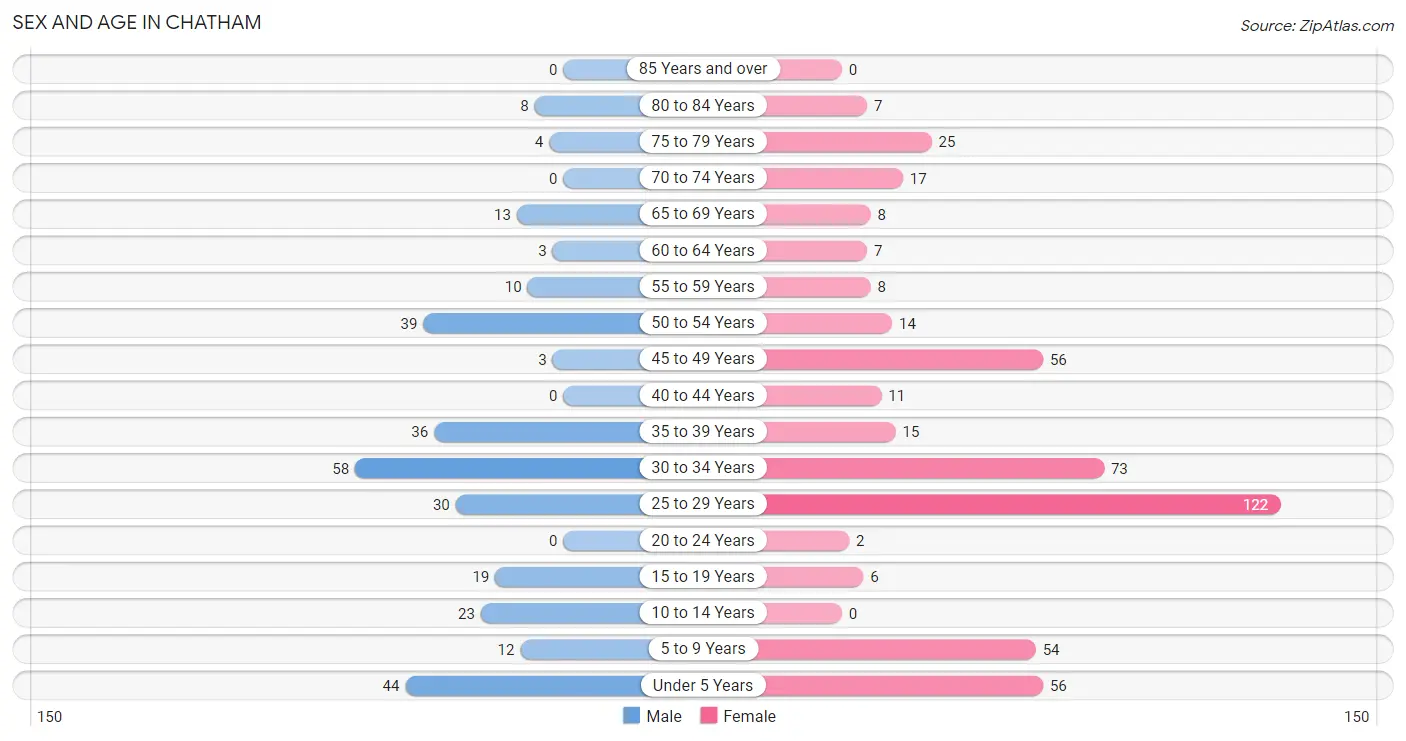
| Age Bracket | Male | Female |
| Under 5 Years | 44 (14.6%) | 56 (11.6%) |
| 5 to 9 Years | 12 (4.0%) | 54 (11.2%) |
| 10 to 14 Years | 23 (7.6%) | 0 (0.0%) |
| 15 to 19 Years | 19 (6.3%) | 6 (1.3%) |
| 20 to 24 Years | 0 (0.0%) | 2 (0.4%) |
| 25 to 29 Years | 30 (9.9%) | 122 (25.4%) |
| 30 to 34 Years | 58 (19.2%) | 73 (15.2%) |
| 35 to 39 Years | 36 (11.9%) | 15 (3.1%) |
| 40 to 44 Years | 0 (0.0%) | 11 (2.3%) |
| 45 to 49 Years | 3 (1.0%) | 56 (11.6%) |
| 50 to 54 Years | 39 (12.9%) | 14 (2.9%) |
| 55 to 59 Years | 10 (3.3%) | 8 (1.7%) |
| 60 to 64 Years | 3 (1.0%) | 7 (1.5%) |
| 65 to 69 Years | 13 (4.3%) | 8 (1.7%) |
| 70 to 74 Years | 0 (0.0%) | 17 (3.5%) |
| 75 to 79 Years | 4 (1.3%) | 25 (5.2%) |
| 80 to 84 Years | 8 (2.6%) | 7 (1.5%) |
| 85 Years and over | 0 (0.0%) | 0 (0.0%) |
| Total | 302 (100.0%) | 481 (100.0%) |
Families and Households in Chatham
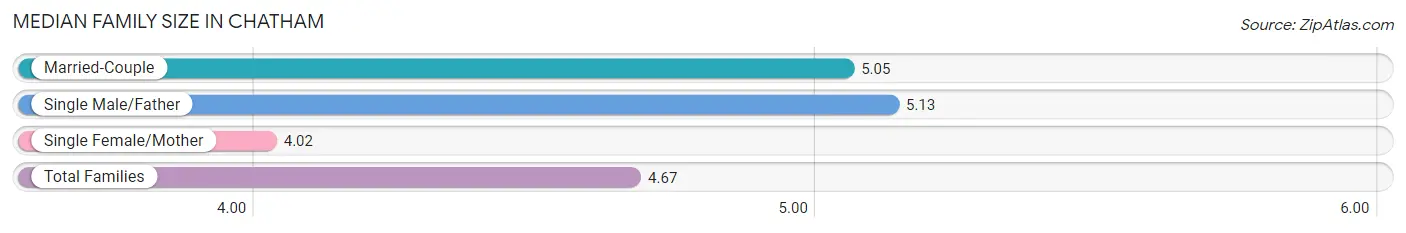
Median Family Size in Chatham
The median family size in Chatham is 4.67 persons per family, with single male/father families (16 | 13.1%) accounting for the largest median family size of 5.13 persons per family. On the other hand, single female/mother families (46 | 37.7%) represent the smallest median family size with 4.02 persons per family.
| Family Type | # Families | Family Size |
| Married-Couple | 60 (49.2%) | 5.05 |
| Single Male/Father | 16 (13.1%) | 5.13 |
| Single Female/Mother | 46 (37.7%) | 4.02 |
| Total Families | 122 (100.0%) | 4.67 |
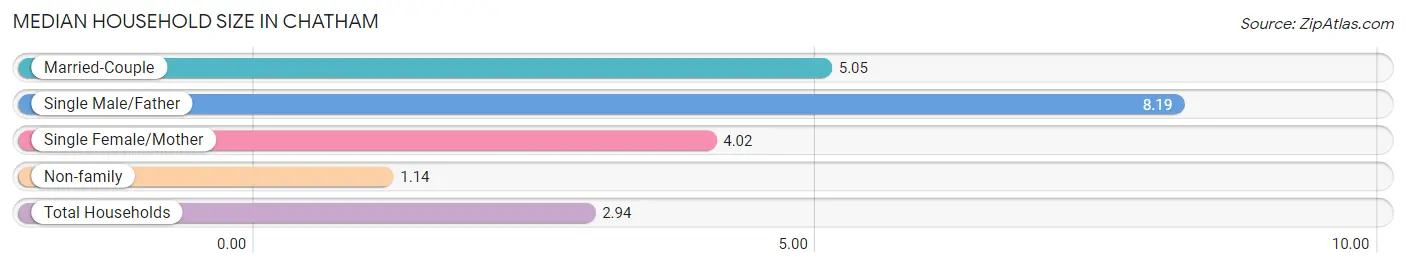
Median Household Size in Chatham
The median household size in Chatham is 2.94 persons per household, with single male/father households (16 | 6.0%) accounting for the largest median household size of 8.19 persons per household. non-family households (144 | 54.1%) represent the smallest median household size with 1.14 persons per household.
| Household Type | # Households | Household Size |
| Married-Couple | 60 (22.6%) | 5.05 |
| Single Male/Father | 16 (6.0%) | 8.19 |
| Single Female/Mother | 46 (17.3%) | 4.02 |
| Non-family | 144 (54.1%) | 1.14 |
| Total Households | 266 (100.0%) | 2.94 |
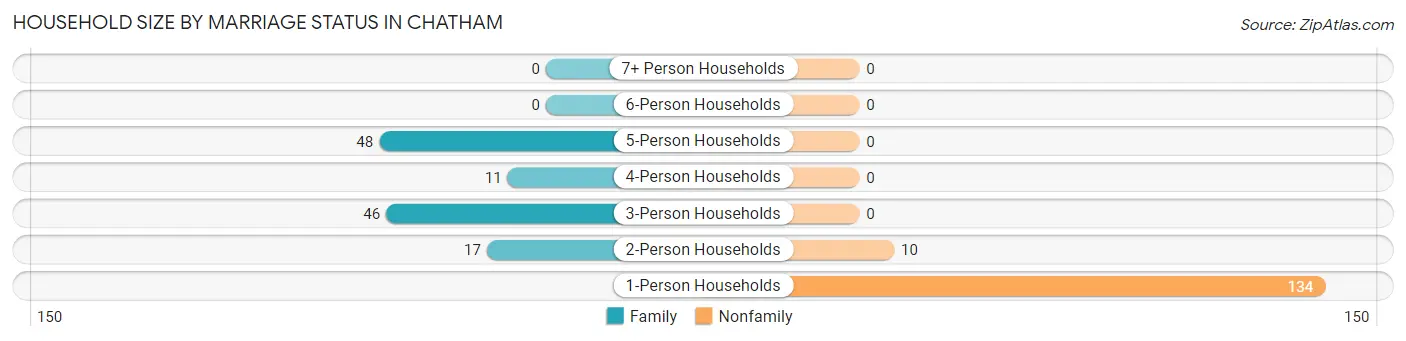
Household Size by Marriage Status in Chatham
Out of a total of 266 households in Chatham, 122 (45.9%) are family households, while 144 (54.1%) are nonfamily households. The most numerous type of family households are 5-person households, comprising 48, and the most common type of nonfamily households are 1-person households, comprising 134.
| Household Size | Family Households | Nonfamily Households |
| 1-Person Households | - | 134 (50.4%) |
| 2-Person Households | 17 (6.4%) | 10 (3.8%) |
| 3-Person Households | 46 (17.3%) | 0 (0.0%) |
| 4-Person Households | 11 (4.1%) | 0 (0.0%) |
| 5-Person Households | 48 (18.0%) | 0 (0.0%) |
| 6-Person Households | 0 (0.0%) | 0 (0.0%) |
| 7+ Person Households | 0 (0.0%) | 0 (0.0%) |
| Total | 122 (45.9%) | 144 (54.1%) |
Female Fertility in Chatham
Fertility by Age in Chatham
Average fertility rate in Chatham is 119.0 births per 1,000 women. Women in the age bracket of 35 to 50 years have the highest fertility rate with 146.0 births per 1,000 women. Women in the age bracket of 20 to 34 years acount for 64.7% of all women with births.
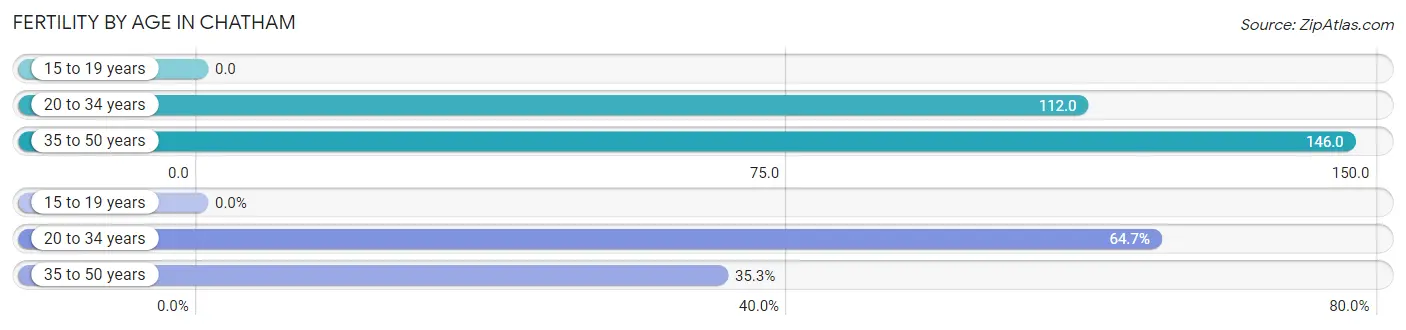
| Age Bracket | Women with Births | Births / 1,000 Women |
| 15 to 19 years | 0 (0.0%) | 0.0 |
| 20 to 34 years | 22 (64.7%) | 112.0 |
| 35 to 50 years | 12 (35.3%) | 146.0 |
| Total | 34 (100.0%) | 119.0 |
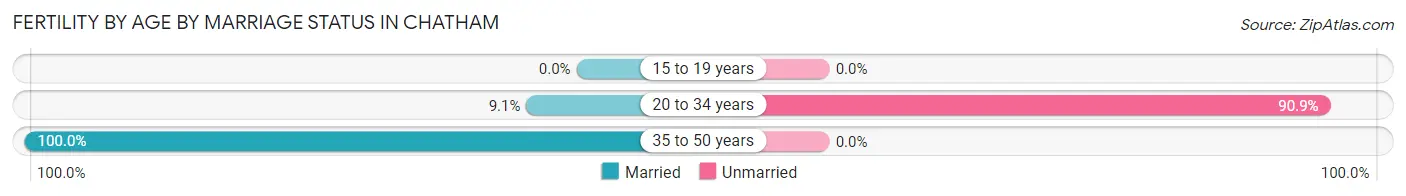
Fertility by Age by Marriage Status in Chatham
41.2% of women with births (34) in Chatham are married. The highest percentage of unmarried women with births falls into 20 to 34 years age bracket with 90.9% of them unmarried at the time of birth, while the lowest percentage of unmarried women with births belong to 35 to 50 years age bracket with 0.0% of them unmarried.
| Age Bracket | Married | Unmarried |
| 15 to 19 years | 0 (0.0%) | 0 (0.0%) |
| 20 to 34 years | 2 (9.1%) | 20 (90.9%) |
| 35 to 50 years | 12 (100.0%) | 0 (0.0%) |
| Total | 14 (41.2%) | 20 (58.8%) |
Fertility by Education in Chatham
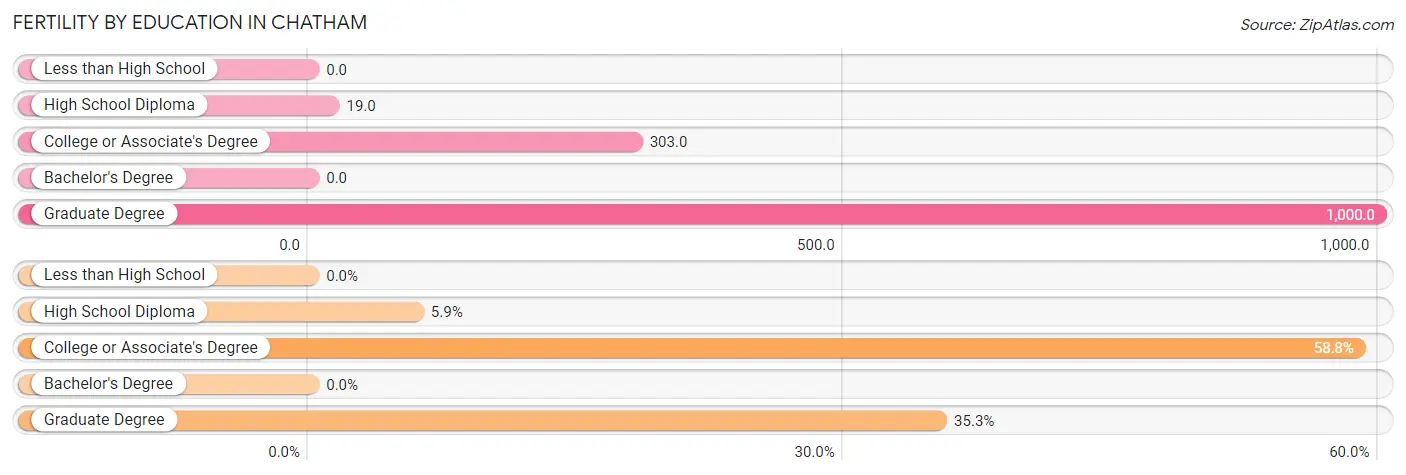
| Educational Attainment | Women with Births | Births / 1,000 Women |
| Less than High School | 0 (0.0%) | 0.0 |
| High School Diploma | 2 (5.9%) | 19.0 |
| College or Associate's Degree | 20 (58.8%) | 303.0 |
| Bachelor's Degree | 0 (0.0%) | 0.0 |
| Graduate Degree | 12 (35.3%) | 1,000.0 |
| Total | 34 (100.0%) | 119.0 |
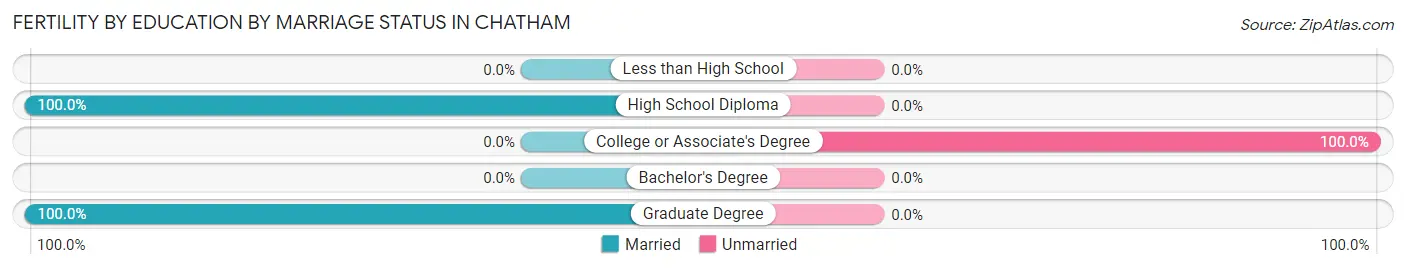
Fertility by Education by Marriage Status in Chatham
58.8% of women with births in Chatham are unmarried. Women with the educational attainment of high school diploma are most likely to be married with 100.0% of them married at childbirth, while women with the educational attainment of college or associate's degree are least likely to be married with 100.0% of them unmarried at childbirth.
| Educational Attainment | Married | Unmarried |
| Less than High School | 0 (0.0%) | 0 (0.0%) |
| High School Diploma | 2 (100.0%) | 0 (0.0%) |
| College or Associate's Degree | 0 (0.0%) | 20 (100.0%) |
| Bachelor's Degree | 0 (0.0%) | 0 (0.0%) |
| Graduate Degree | 12 (100.0%) | 0 (0.0%) |
| Total | 14 (41.2%) | 20 (58.8%) |
Employment Characteristics in Chatham
Employment by Class of Employer in Chatham
Among the 218 employed individuals in Chatham, private company employees (151 | 69.3%), not-for-profit organizations (28 | 12.8%), and self-employed (not incorporated) (12 | 5.5%) make up the most common classes of employment.
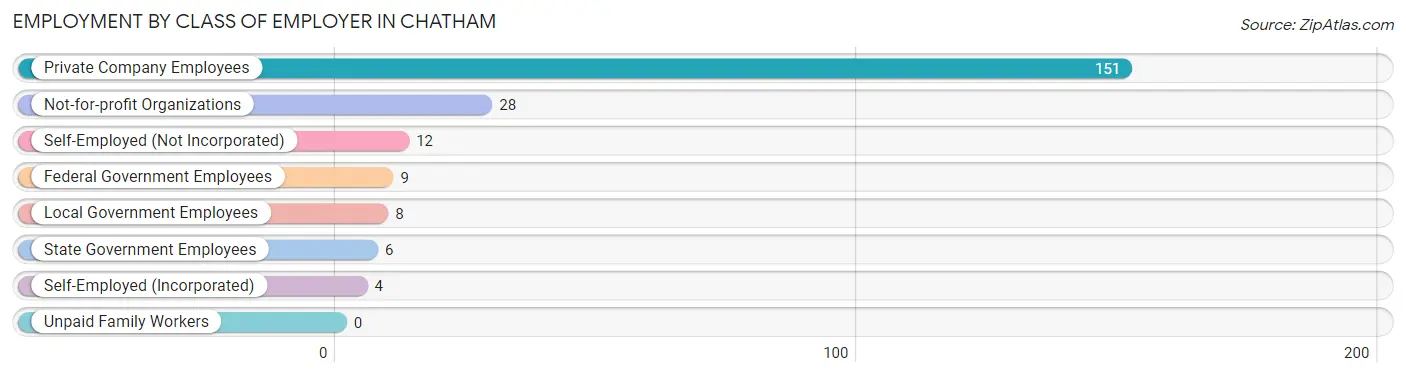
| Employer Class | # Employees | % Employees |
| Private Company Employees | 151 | 69.3% |
| Self-Employed (Incorporated) | 4 | 1.8% |
| Self-Employed (Not Incorporated) | 12 | 5.5% |
| Not-for-profit Organizations | 28 | 12.8% |
| Local Government Employees | 8 | 3.7% |
| State Government Employees | 6 | 2.8% |
| Federal Government Employees | 9 | 4.1% |
| Unpaid Family Workers | 0 | 0.0% |
| Total | 218 | 100.0% |
Employment Status by Age in Chatham
According to the labor force statistics for Chatham, out of the total population over 16 years of age (590), 37.5% or 221 individuals are in the labor force, with 1.4% or 3 of them unemployed. The age group with the highest labor force participation rate is 35 to 44 years, with 82.3% or 51 individuals in the labor force. Within the labor force, the 25 to 29 years age range has the highest percentage of unemployed individuals, with 5.4% or 2 of them being unemployed.
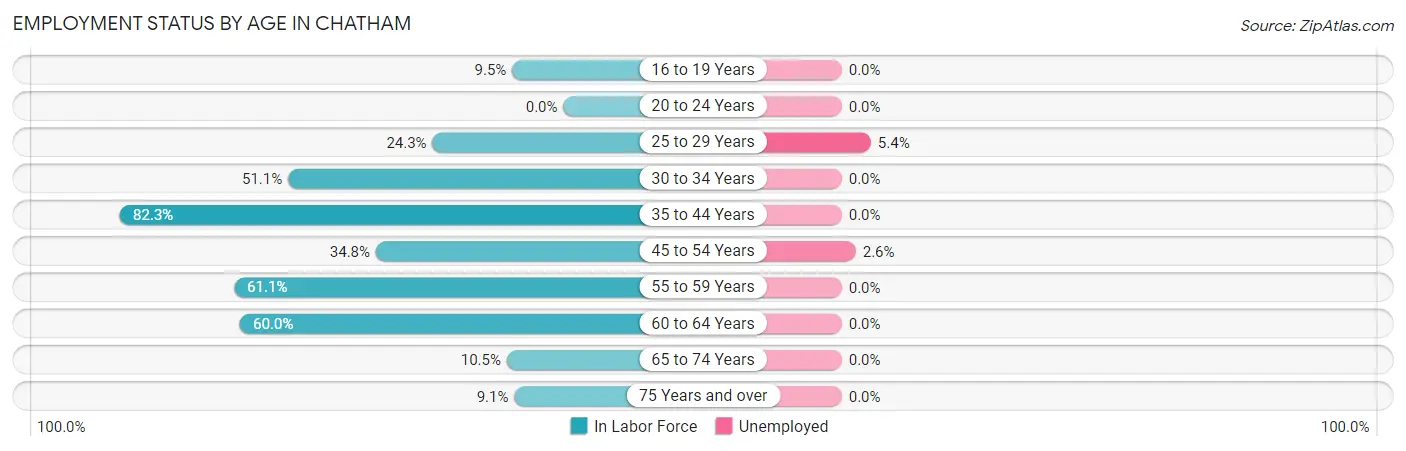
| Age Bracket | In Labor Force | Unemployed |
| 16 to 19 Years | 2 (9.5%) | 0 (0.0%) |
| 20 to 24 Years | 0 (0.0%) | 0 (0.0%) |
| 25 to 29 Years | 37 (24.3%) | 2 (5.4%) |
| 30 to 34 Years | 67 (51.1%) | 0 (0.0%) |
| 35 to 44 Years | 51 (82.3%) | 0 (0.0%) |
| 45 to 54 Years | 39 (34.8%) | 1 (2.6%) |
| 55 to 59 Years | 11 (61.1%) | 0 (0.0%) |
| 60 to 64 Years | 6 (60.0%) | 0 (0.0%) |
| 65 to 74 Years | 4 (10.5%) | 0 (0.0%) |
| 75 Years and over | 4 (9.1%) | 0 (0.0%) |
| Total | 221 (37.5%) | 3 (1.4%) |
Employment Status by Educational Attainment in Chatham
According to labor force statistics for Chatham, 43.5% of individuals (211) out of the total population between 25 and 64 years of age (485) are in the labor force, with 1.4% or 3 of them being unemployed. The group with the highest labor force participation rate are those with the educational attainment of bachelor's degree or higher, with 87.1% or 54 individuals in the labor force. Within the labor force, individuals with less than high school education have the highest percentage of unemployment, with 5.1% or 2 of them being unemployed.
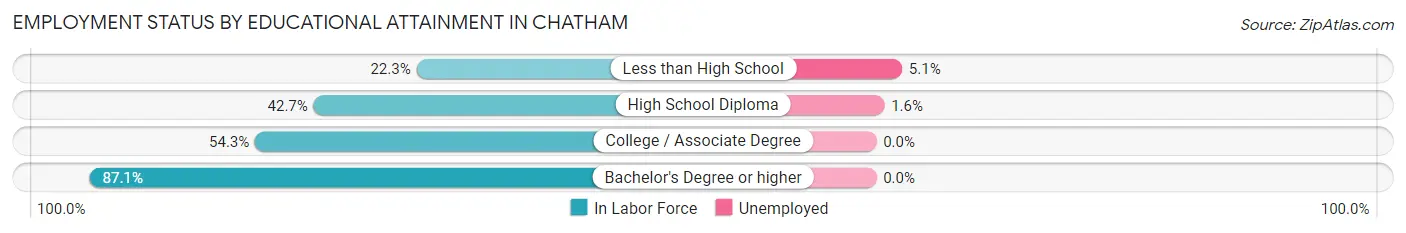
| Educational Attainment | In Labor Force | Unemployed |
| Less than High School | 39 (22.3%) | 9 (5.1%) |
| High School Diploma | 61 (42.7%) | 2 (1.6%) |
| College / Associate Degree | 57 (54.3%) | 0 (0.0%) |
| Bachelor's Degree or higher | 54 (87.1%) | 0 (0.0%) |
| Total | 211 (43.5%) | 7 (1.4%) |
Employment Occupations by Sex in Chatham
Management, Business, Science and Arts Occupations
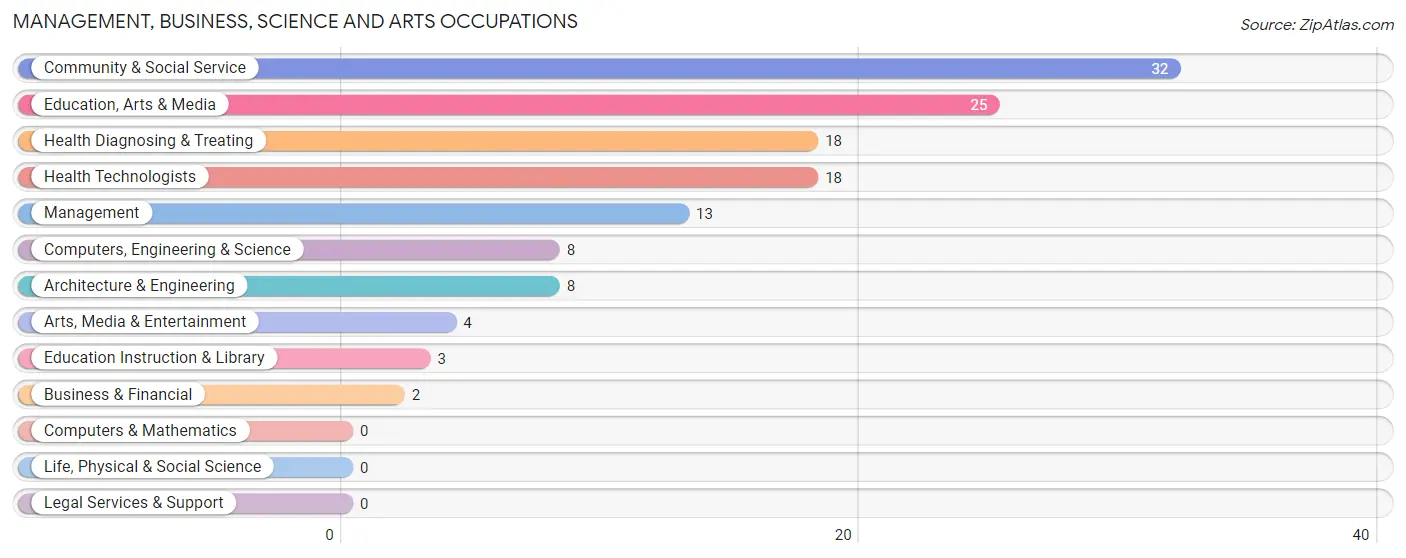
The most common Management, Business, Science and Arts occupations in Chatham are Community & Social Service (32 | 14.7%), Education, Arts & Media (25 | 11.5%), Health Diagnosing & Treating (18 | 8.3%), Health Technologists (18 | 8.3%), and Management (13 | 6.0%).
Management, Business, Science and Arts Occupations by Sex
Within the Management, Business, Science and Arts occupations in Chatham, the most male-oriented occupations are Management (100.0%), Computers, Engineering & Science (100.0%), and Architecture & Engineering (100.0%), while the most female-oriented occupations are Business & Financial (100.0%), Education Instruction & Library (100.0%), and Health Diagnosing & Treating (100.0%).
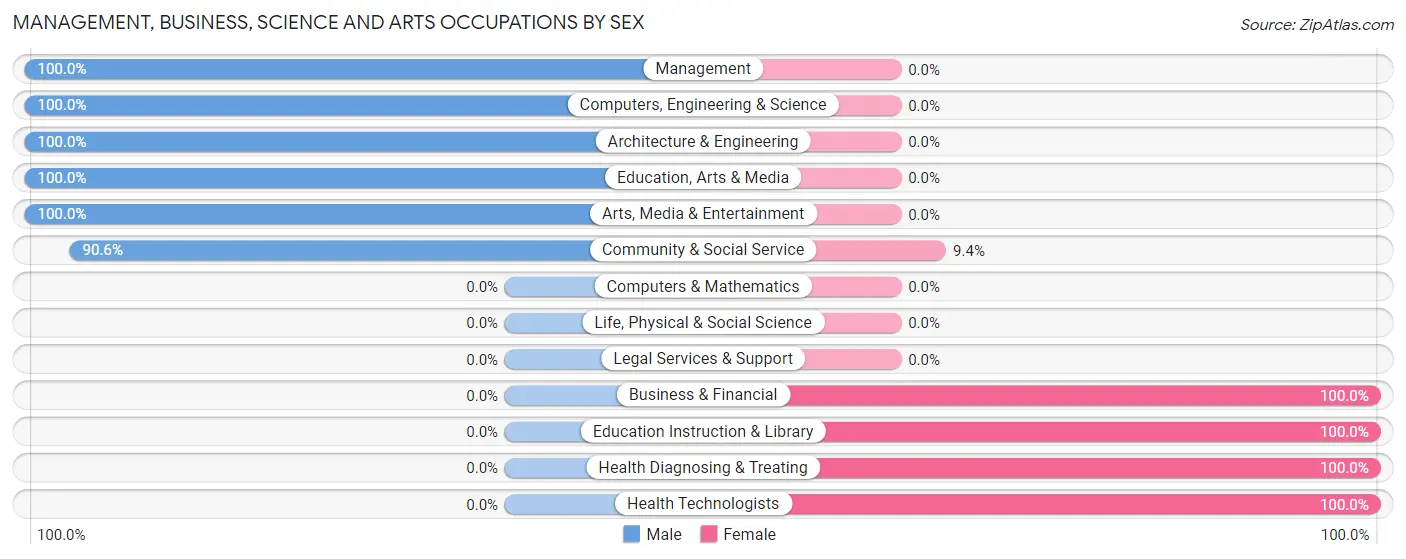
| Occupation | Male | Female |
| Management | 13 (100.0%) | 0 (0.0%) |
| Business & Financial | 0 (0.0%) | 2 (100.0%) |
| Computers, Engineering & Science | 8 (100.0%) | 0 (0.0%) |
| Computers & Mathematics | 0 (0.0%) | 0 (0.0%) |
| Architecture & Engineering | 8 (100.0%) | 0 (0.0%) |
| Life, Physical & Social Science | 0 (0.0%) | 0 (0.0%) |
| Community & Social Service | 29 (90.6%) | 3 (9.4%) |
| Education, Arts & Media | 25 (100.0%) | 0 (0.0%) |
| Legal Services & Support | 0 (0.0%) | 0 (0.0%) |
| Education Instruction & Library | 0 (0.0%) | 3 (100.0%) |
| Arts, Media & Entertainment | 4 (100.0%) | 0 (0.0%) |
| Health Diagnosing & Treating | 0 (0.0%) | 18 (100.0%) |
| Health Technologists | 0 (0.0%) | 18 (100.0%) |
| Total (Category) | 50 (68.5%) | 23 (31.5%) |
| Total (Overall) | 119 (54.6%) | 99 (45.4%) |
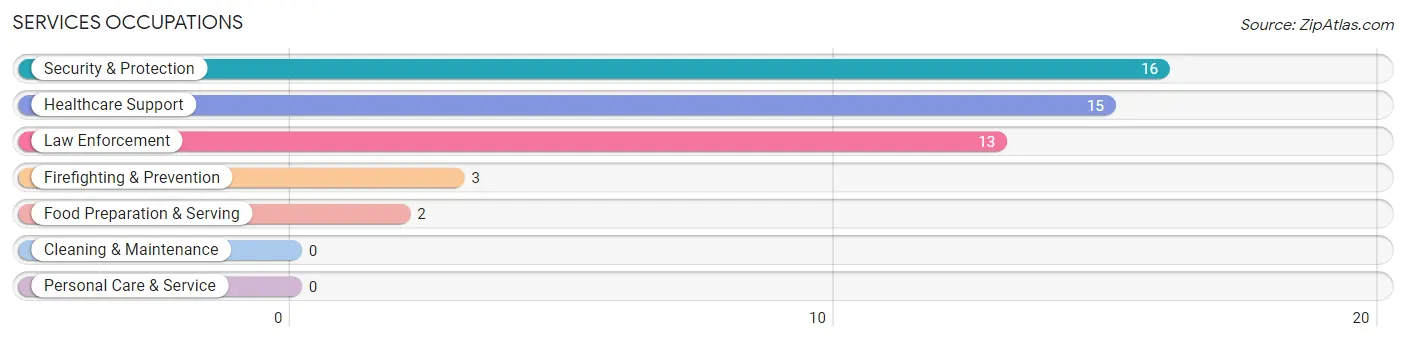
Services Occupations
The most common Services occupations in Chatham are Security & Protection (16 | 7.3%), Healthcare Support (15 | 6.9%), Law Enforcement (13 | 6.0%), Firefighting & Prevention (3 | 1.4%), and Food Preparation & Serving (2 | 0.9%).
Services Occupations by Sex
Within the Services occupations in Chatham, the most male-oriented occupations are Security & Protection (100.0%), Firefighting & Prevention (100.0%), and Law Enforcement (100.0%), while the most female-oriented occupations are Food Preparation & Serving (100.0%), and Healthcare Support (53.3%).
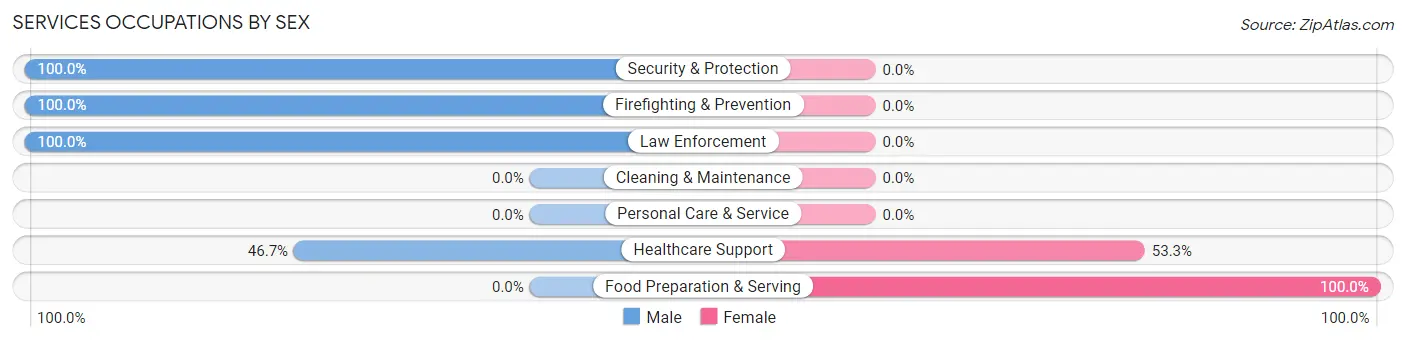
| Occupation | Male | Female |
| Healthcare Support | 7 (46.7%) | 8 (53.3%) |
| Security & Protection | 16 (100.0%) | 0 (0.0%) |
| Firefighting & Prevention | 3 (100.0%) | 0 (0.0%) |
| Law Enforcement | 13 (100.0%) | 0 (0.0%) |
| Food Preparation & Serving | 0 (0.0%) | 2 (100.0%) |
| Cleaning & Maintenance | 0 (0.0%) | 0 (0.0%) |
| Personal Care & Service | 0 (0.0%) | 0 (0.0%) |
| Total (Category) | 23 (69.7%) | 10 (30.3%) |
| Total (Overall) | 119 (54.6%) | 99 (45.4%) |
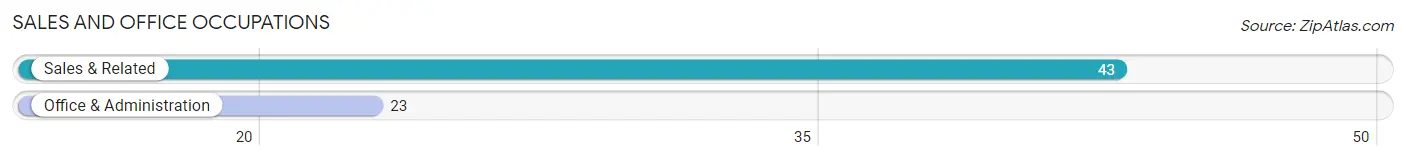
Sales and Office Occupations
The most common Sales and Office occupations in Chatham are Sales & Related (43 | 19.7%), and Office & Administration (23 | 10.5%).
Sales and Office Occupations by Sex
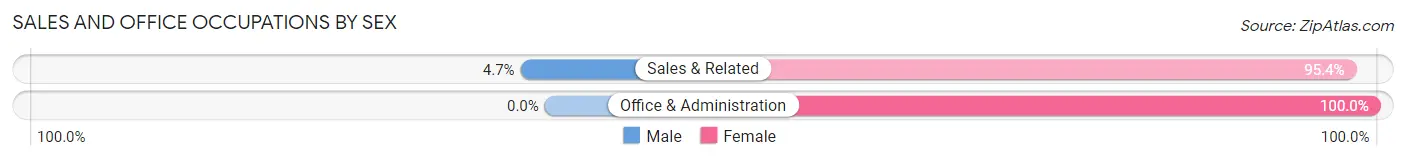
| Occupation | Male | Female |
| Sales & Related | 2 (4.6%) | 41 (95.4%) |
| Office & Administration | 0 (0.0%) | 23 (100.0%) |
| Total (Category) | 2 (3.0%) | 64 (97.0%) |
| Total (Overall) | 119 (54.6%) | 99 (45.4%) |
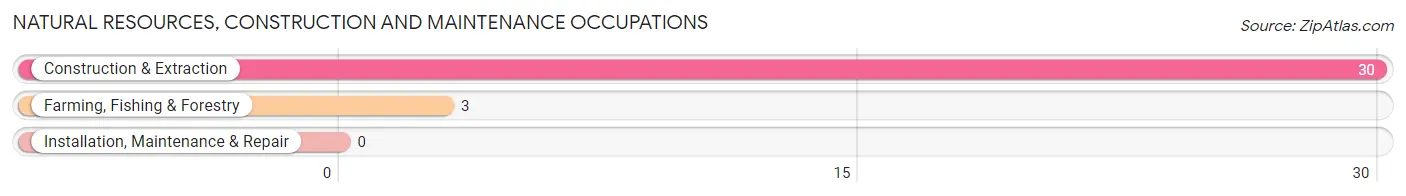
Natural Resources, Construction and Maintenance Occupations
The most common Natural Resources, Construction and Maintenance occupations in Chatham are Construction & Extraction (30 | 13.8%), and Farming, Fishing & Forestry (3 | 1.4%).
Natural Resources, Construction and Maintenance Occupations by Sex
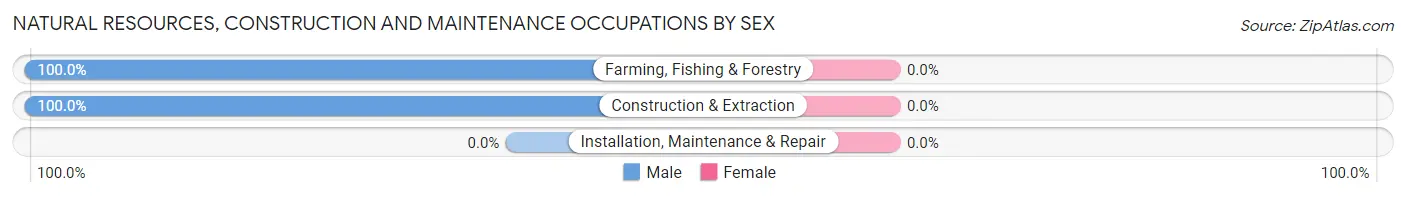
| Occupation | Male | Female |
| Farming, Fishing & Forestry | 3 (100.0%) | 0 (0.0%) |
| Construction & Extraction | 30 (100.0%) | 0 (0.0%) |
| Installation, Maintenance & Repair | 0 (0.0%) | 0 (0.0%) |
| Total (Category) | 33 (100.0%) | 0 (0.0%) |
| Total (Overall) | 119 (54.6%) | 99 (45.4%) |
Production, Transportation and Moving Occupations
The most common Production, Transportation and Moving occupations in Chatham are Production (9 | 4.1%), and Material Moving (4 | 1.8%).
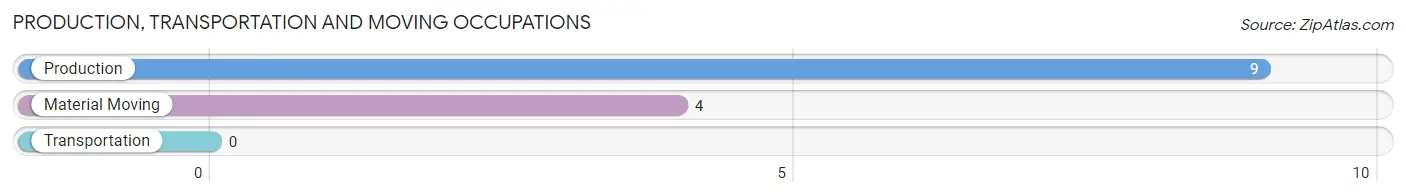
Production, Transportation and Moving Occupations by Sex
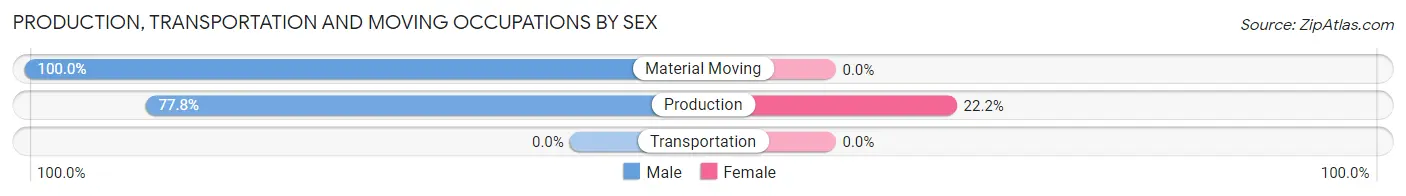
| Occupation | Male | Female |
| Production | 7 (77.8%) | 2 (22.2%) |
| Transportation | 0 (0.0%) | 0 (0.0%) |
| Material Moving | 4 (100.0%) | 0 (0.0%) |
| Total (Category) | 11 (84.6%) | 2 (15.4%) |
| Total (Overall) | 119 (54.6%) | 99 (45.4%) |
Employment Industries by Sex in Chatham
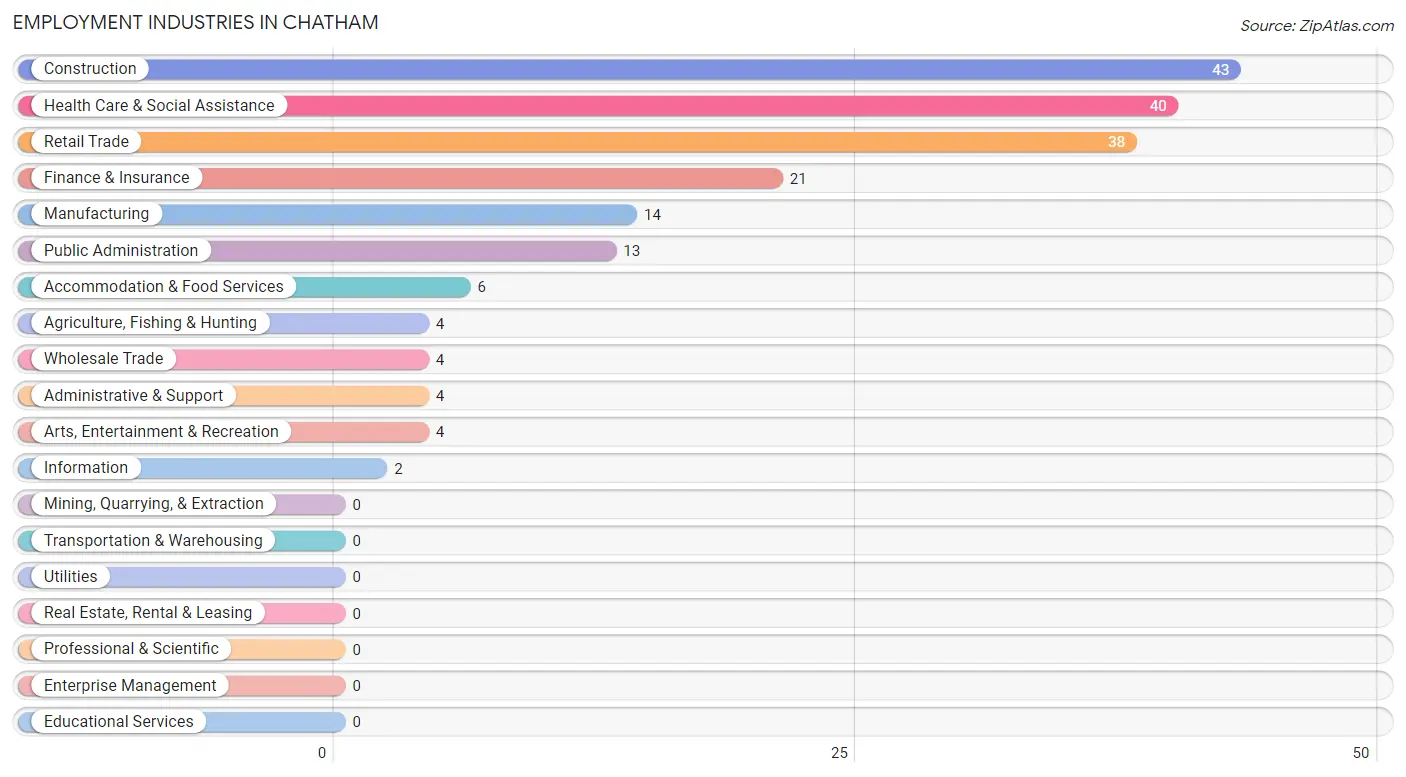
Employment Industries in Chatham
The major employment industries in Chatham include Construction (43 | 19.7%), Health Care & Social Assistance (40 | 18.3%), Retail Trade (38 | 17.4%), Finance & Insurance (21 | 9.6%), and Manufacturing (14 | 6.4%).
Employment Industries by Sex in Chatham
The Chatham industries that see more men than women are Agriculture, Fishing & Hunting (100.0%), Construction (100.0%), and Administrative & Support (100.0%), whereas the industries that tend to have a higher number of women are Wholesale Trade (100.0%), Information (100.0%), and Finance & Insurance (100.0%).
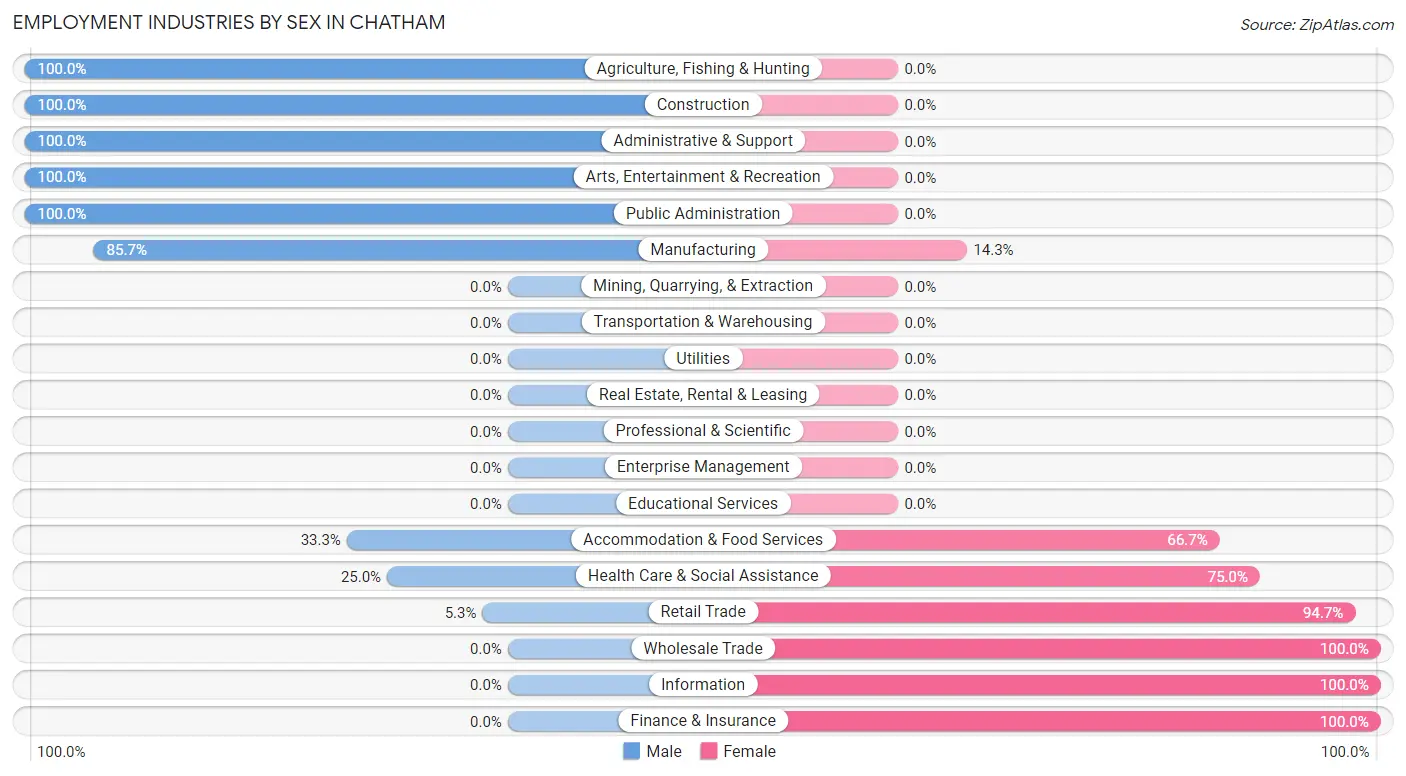
| Industry | Male | Female |
| Agriculture, Fishing & Hunting | 4 (100.0%) | 0 (0.0%) |
| Mining, Quarrying, & Extraction | 0 (0.0%) | 0 (0.0%) |
| Construction | 43 (100.0%) | 0 (0.0%) |
| Manufacturing | 12 (85.7%) | 2 (14.3%) |
| Wholesale Trade | 0 (0.0%) | 4 (100.0%) |
| Retail Trade | 2 (5.3%) | 36 (94.7%) |
| Transportation & Warehousing | 0 (0.0%) | 0 (0.0%) |
| Utilities | 0 (0.0%) | 0 (0.0%) |
| Information | 0 (0.0%) | 2 (100.0%) |
| Finance & Insurance | 0 (0.0%) | 21 (100.0%) |
| Real Estate, Rental & Leasing | 0 (0.0%) | 0 (0.0%) |
| Professional & Scientific | 0 (0.0%) | 0 (0.0%) |
| Enterprise Management | 0 (0.0%) | 0 (0.0%) |
| Administrative & Support | 4 (100.0%) | 0 (0.0%) |
| Educational Services | 0 (0.0%) | 0 (0.0%) |
| Health Care & Social Assistance | 10 (25.0%) | 30 (75.0%) |
| Arts, Entertainment & Recreation | 4 (100.0%) | 0 (0.0%) |
| Accommodation & Food Services | 2 (33.3%) | 4 (66.7%) |
| Public Administration | 13 (100.0%) | 0 (0.0%) |
| Total | 119 (54.6%) | 99 (45.4%) |
Education in Chatham
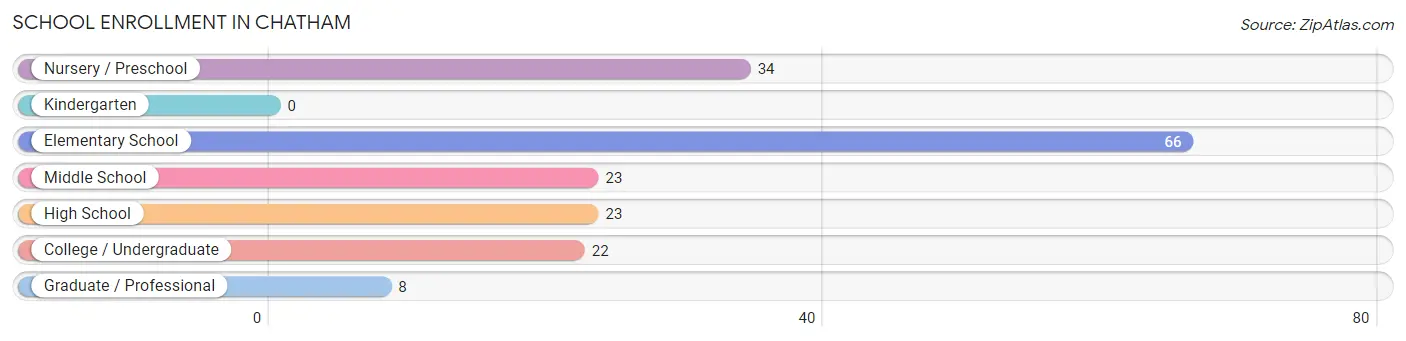
School Enrollment in Chatham
The most common levels of schooling among the 176 students in Chatham are elementary school (66 | 37.5%), nursery / preschool (34 | 19.3%), and middle school (23 | 13.1%).
| School Level | # Students | % Students |
| Nursery / Preschool | 34 | 19.3% |
| Kindergarten | 0 | 0.0% |
| Elementary School | 66 | 37.5% |
| Middle School | 23 | 13.1% |
| High School | 23 | 13.1% |
| College / Undergraduate | 22 | 12.5% |
| Graduate / Professional | 8 | 4.5% |
| Total | 176 | 100.0% |
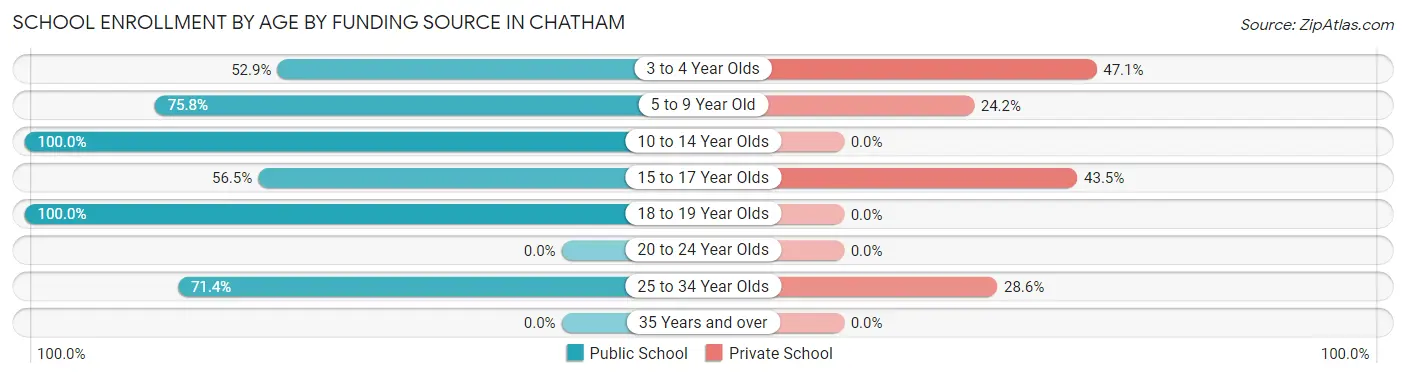
School Enrollment by Age by Funding Source in Chatham
Out of a total of 176 students who are enrolled in schools in Chatham, 50 (28.4%) attend a private institution, while the remaining 126 (71.6%) are enrolled in public schools. The age group of 3 to 4 year olds has the highest likelihood of being enrolled in private schools, with 16 (47.1% in the age bracket) enrolled. Conversely, the age group of 10 to 14 year olds has the lowest likelihood of being enrolled in a private school, with 23 (100.0% in the age bracket) attending a public institution.
| Age Bracket | Public School | Private School |
| 3 to 4 Year Olds | 18 (52.9%) | 16 (47.1%) |
| 5 to 9 Year Old | 50 (75.8%) | 16 (24.2%) |
| 10 to 14 Year Olds | 23 (100.0%) | 0 (0.0%) |
| 15 to 17 Year Olds | 13 (56.5%) | 10 (43.5%) |
| 18 to 19 Year Olds | 2 (100.0%) | 0 (0.0%) |
| 20 to 24 Year Olds | 0 (0.0%) | 0 (0.0%) |
| 25 to 34 Year Olds | 20 (71.4%) | 8 (28.6%) |
| 35 Years and over | 0 (0.0%) | 0 (0.0%) |
| Total | 126 (71.6%) | 50 (28.4%) |
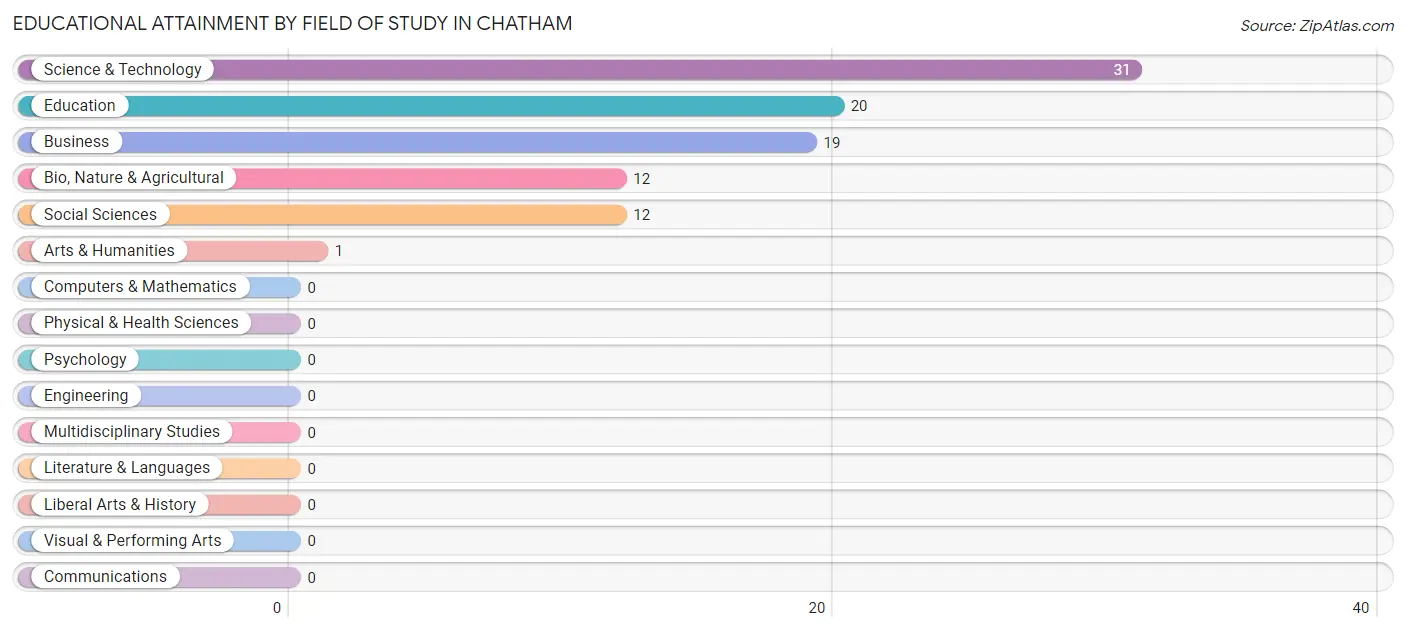
Educational Attainment by Field of Study in Chatham
Science & technology (31 | 32.6%), education (20 | 21.0%), business (19 | 20.0%), bio, nature & agricultural (12 | 12.6%), and social sciences (12 | 12.6%) are the most common fields of study among 95 individuals in Chatham who have obtained a bachelor's degree or higher.
| Field of Study | # Graduates | % Graduates |
| Computers & Mathematics | 0 | 0.0% |
| Bio, Nature & Agricultural | 12 | 12.6% |
| Physical & Health Sciences | 0 | 0.0% |
| Psychology | 0 | 0.0% |
| Social Sciences | 12 | 12.6% |
| Engineering | 0 | 0.0% |
| Multidisciplinary Studies | 0 | 0.0% |
| Science & Technology | 31 | 32.6% |
| Business | 19 | 20.0% |
| Education | 20 | 21.0% |
| Literature & Languages | 0 | 0.0% |
| Liberal Arts & History | 0 | 0.0% |
| Visual & Performing Arts | 0 | 0.0% |
| Communications | 0 | 0.0% |
| Arts & Humanities | 1 | 1.1% |
| Total | 95 | 100.0% |
Transportation & Commute in Chatham
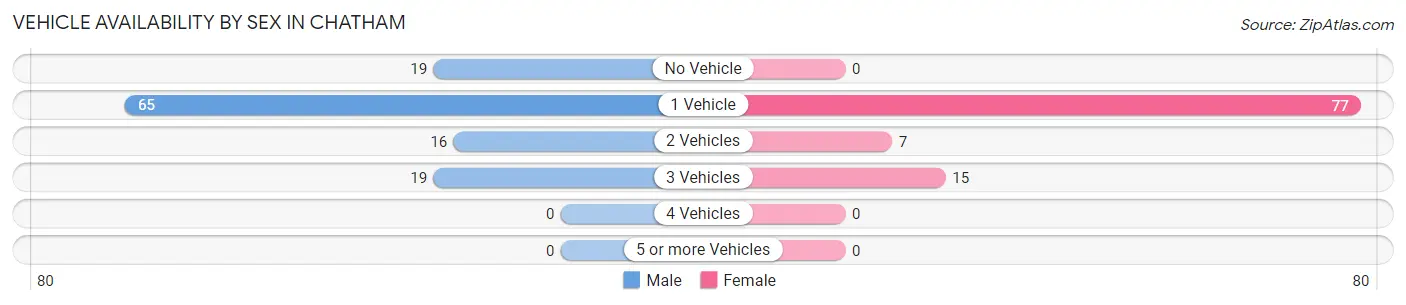
Vehicle Availability by Sex in Chatham
The most prevalent vehicle ownership categories in Chatham are males with 1 vehicle (65, accounting for 54.6%) and females with 1 vehicle (77, making up 65.7%).
| Vehicles Available | Male | Female |
| No Vehicle | 19 (16.0%) | 0 (0.0%) |
| 1 Vehicle | 65 (54.6%) | 77 (77.8%) |
| 2 Vehicles | 16 (13.5%) | 7 (7.1%) |
| 3 Vehicles | 19 (16.0%) | 15 (15.1%) |
| 4 Vehicles | 0 (0.0%) | 0 (0.0%) |
| 5 or more Vehicles | 0 (0.0%) | 0 (0.0%) |
| Total | 119 (100.0%) | 99 (100.0%) |
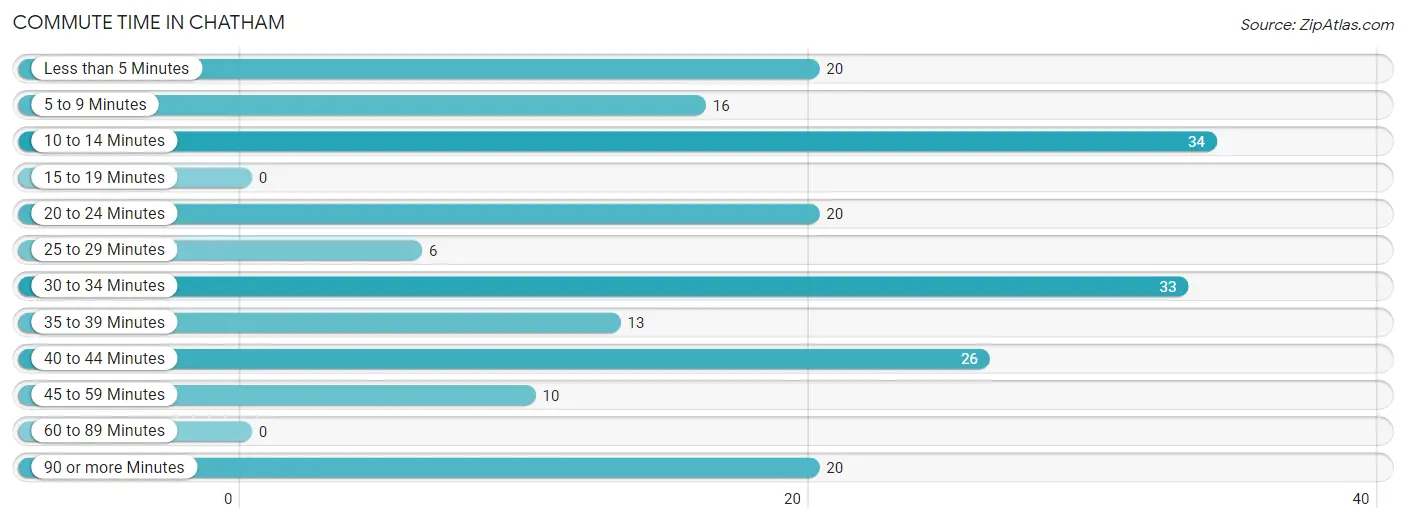
Commute Time in Chatham
The most frequently occuring commute durations in Chatham are 10 to 14 minutes (34 commuters, 17.2%), 30 to 34 minutes (33 commuters, 16.7%), and 40 to 44 minutes (26 commuters, 13.1%).
| Commute Time | # Commuters | % Commuters |
| Less than 5 Minutes | 20 | 10.1% |
| 5 to 9 Minutes | 16 | 8.1% |
| 10 to 14 Minutes | 34 | 17.2% |
| 15 to 19 Minutes | 0 | 0.0% |
| 20 to 24 Minutes | 20 | 10.1% |
| 25 to 29 Minutes | 6 | 3.0% |
| 30 to 34 Minutes | 33 | 16.7% |
| 35 to 39 Minutes | 13 | 6.6% |
| 40 to 44 Minutes | 26 | 13.1% |
| 45 to 59 Minutes | 10 | 5.1% |
| 60 to 89 Minutes | 0 | 0.0% |
| 90 or more Minutes | 20 | 10.1% |
Commute Time by Sex in Chatham
The most common commute times in Chatham are 30 to 34 minutes (22 commuters, 18.5%) for males and 10 to 14 minutes (34 commuters, 43.0%) for females.
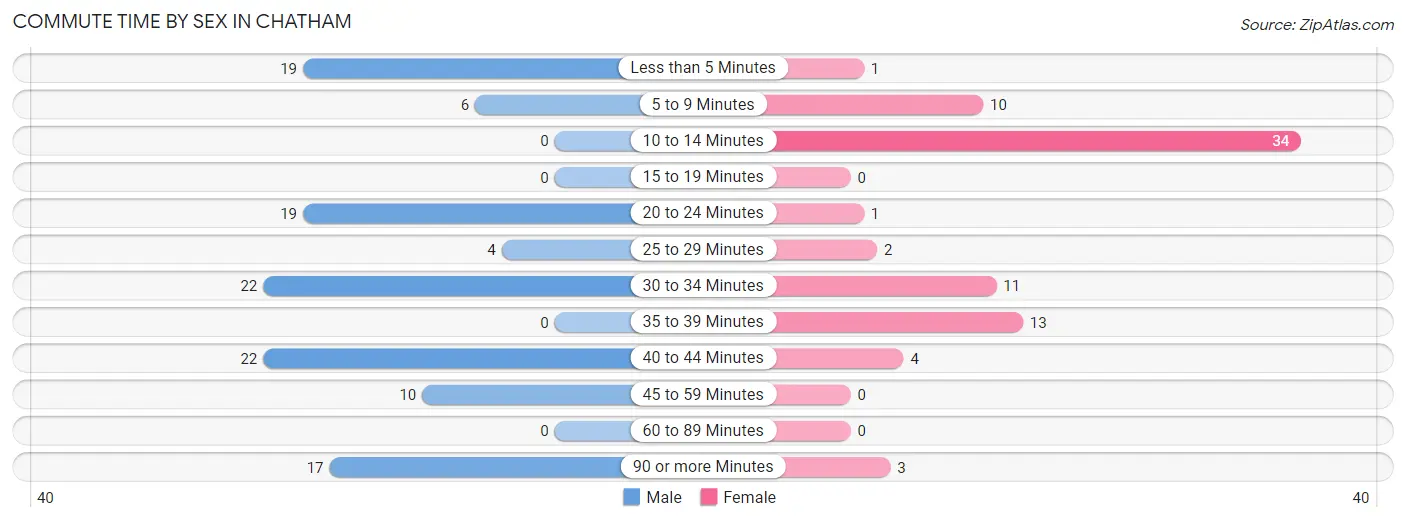
| Commute Time | Male | Female |
| Less than 5 Minutes | 19 (16.0%) | 1 (1.3%) |
| 5 to 9 Minutes | 6 (5.0%) | 10 (12.7%) |
| 10 to 14 Minutes | 0 (0.0%) | 34 (43.0%) |
| 15 to 19 Minutes | 0 (0.0%) | 0 (0.0%) |
| 20 to 24 Minutes | 19 (16.0%) | 1 (1.3%) |
| 25 to 29 Minutes | 4 (3.4%) | 2 (2.5%) |
| 30 to 34 Minutes | 22 (18.5%) | 11 (13.9%) |
| 35 to 39 Minutes | 0 (0.0%) | 13 (16.5%) |
| 40 to 44 Minutes | 22 (18.5%) | 4 (5.1%) |
| 45 to 59 Minutes | 10 (8.4%) | 0 (0.0%) |
| 60 to 89 Minutes | 0 (0.0%) | 0 (0.0%) |
| 90 or more Minutes | 17 (14.3%) | 3 (3.8%) |
Time of Departure to Work by Sex in Chatham
The most frequent times of departure to work in Chatham are 7:00 AM to 7:29 AM (27, 22.7%) for males and 7:30 AM to 7:59 AM (48, 60.8%) for females.
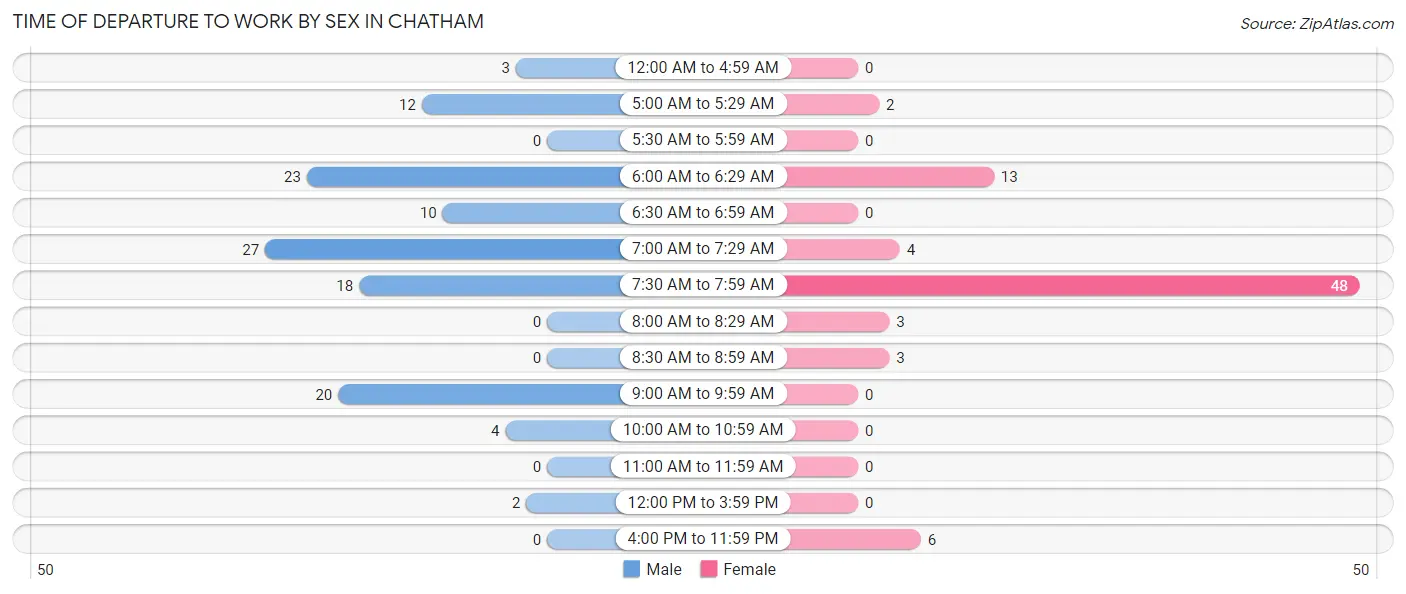
| Time of Departure | Male | Female |
| 12:00 AM to 4:59 AM | 3 (2.5%) | 0 (0.0%) |
| 5:00 AM to 5:29 AM | 12 (10.1%) | 2 (2.5%) |
| 5:30 AM to 5:59 AM | 0 (0.0%) | 0 (0.0%) |
| 6:00 AM to 6:29 AM | 23 (19.3%) | 13 (16.5%) |
| 6:30 AM to 6:59 AM | 10 (8.4%) | 0 (0.0%) |
| 7:00 AM to 7:29 AM | 27 (22.7%) | 4 (5.1%) |
| 7:30 AM to 7:59 AM | 18 (15.1%) | 48 (60.8%) |
| 8:00 AM to 8:29 AM | 0 (0.0%) | 3 (3.8%) |
| 8:30 AM to 8:59 AM | 0 (0.0%) | 3 (3.8%) |
| 9:00 AM to 9:59 AM | 20 (16.8%) | 0 (0.0%) |
| 10:00 AM to 10:59 AM | 4 (3.4%) | 0 (0.0%) |
| 11:00 AM to 11:59 AM | 0 (0.0%) | 0 (0.0%) |
| 12:00 PM to 3:59 PM | 2 (1.7%) | 0 (0.0%) |
| 4:00 PM to 11:59 PM | 0 (0.0%) | 6 (7.6%) |
| Total | 119 (100.0%) | 79 (100.0%) |
Housing Occupancy in Chatham
Occupancy by Ownership in Chatham
Of the total 266 dwellings in Chatham, owner-occupied units account for 100 (37.6%), while renter-occupied units make up 166 (62.4%).
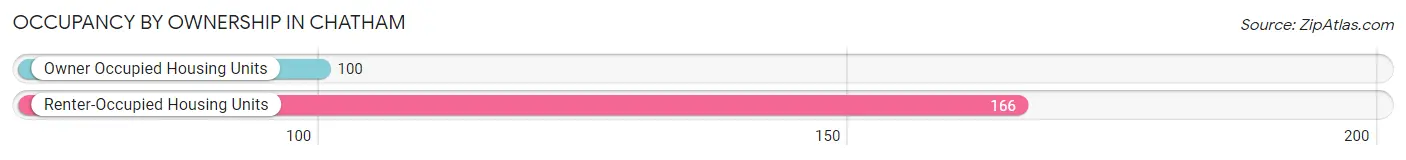
| Occupancy | # Housing Units | % Housing Units |
| Owner Occupied Housing Units | 100 | 37.6% |
| Renter-Occupied Housing Units | 166 | 62.4% |
| Total Occupied Housing Units | 266 | 100.0% |
Occupancy by Household Size in Chatham
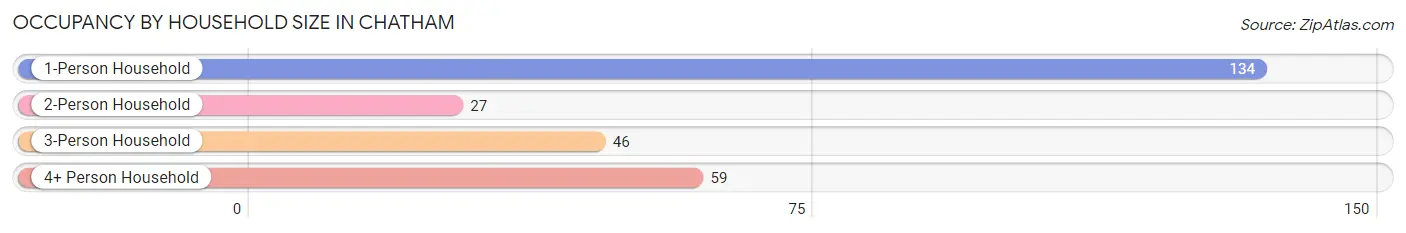
| Household Size | # Housing Units | % Housing Units |
| 1-Person Household | 134 | 50.4% |
| 2-Person Household | 27 | 10.2% |
| 3-Person Household | 46 | 17.3% |
| 4+ Person Household | 59 | 22.2% |
| Total Housing Units | 266 | 100.0% |
Occupancy by Ownership by Household Size in Chatham
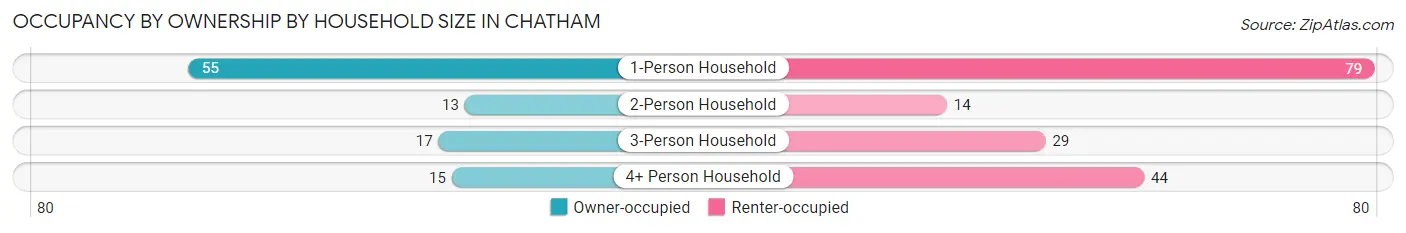
| Household Size | Owner-occupied | Renter-occupied |
| 1-Person Household | 55 (41.0%) | 79 (59.0%) |
| 2-Person Household | 13 (48.1%) | 14 (51.8%) |
| 3-Person Household | 17 (37.0%) | 29 (63.0%) |
| 4+ Person Household | 15 (25.4%) | 44 (74.6%) |
| Total Housing Units | 100 (37.6%) | 166 (62.4%) |
Occupancy by Educational Attainment in Chatham
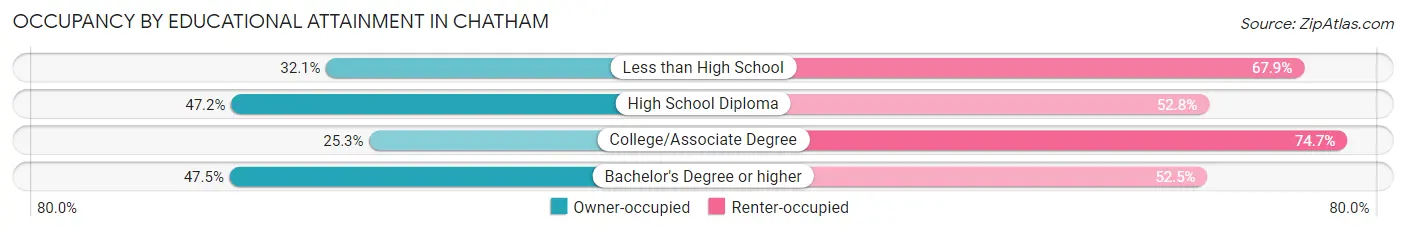
| Household Size | Owner-occupied | Renter-occupied |
| Less than High School | 18 (32.1%) | 38 (67.9%) |
| High School Diploma | 34 (47.2%) | 38 (52.8%) |
| College/Associate Degree | 20 (25.3%) | 59 (74.7%) |
| Bachelor's Degree or higher | 28 (47.5%) | 31 (52.5%) |
Occupancy by Age of Householder in Chatham
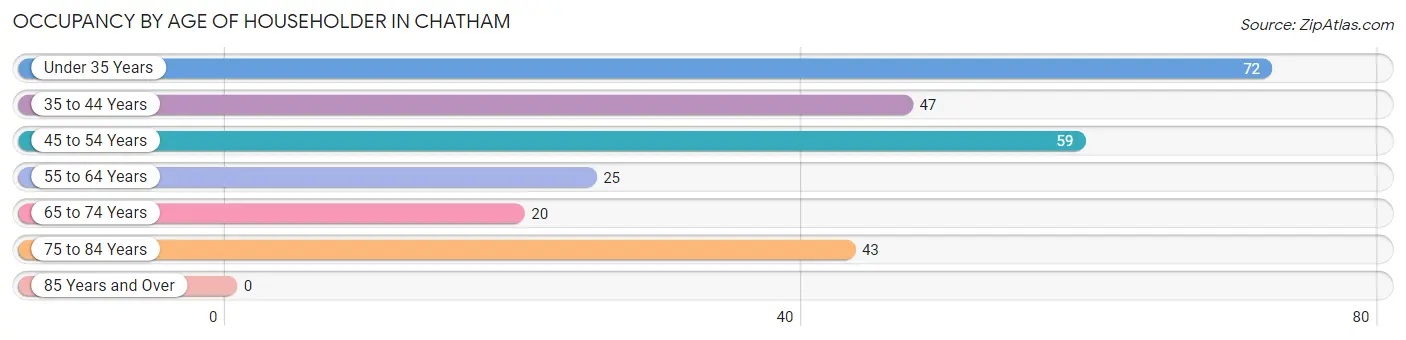
| Age Bracket | # Households | % Households |
| Under 35 Years | 72 | 27.1% |
| 35 to 44 Years | 47 | 17.7% |
| 45 to 54 Years | 59 | 22.2% |
| 55 to 64 Years | 25 | 9.4% |
| 65 to 74 Years | 20 | 7.5% |
| 75 to 84 Years | 43 | 16.2% |
| 85 Years and Over | 0 | 0.0% |
| Total | 266 | 100.0% |
Housing Finances in Chatham
Median Income by Occupancy in Chatham
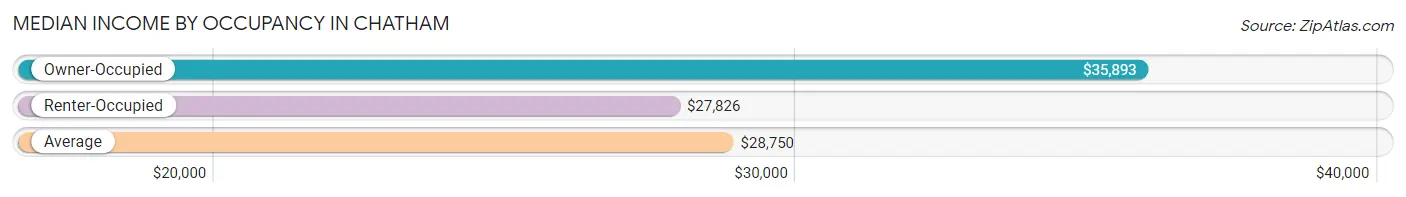
| Occupancy Type | # Households | Median Income |
| Owner-Occupied | 100 (37.6%) | $35,893 |
| Renter-Occupied | 166 (62.4%) | $27,826 |
| Average | 266 (100.0%) | $28,750 |
Occupancy by Householder Income Bracket in Chatham
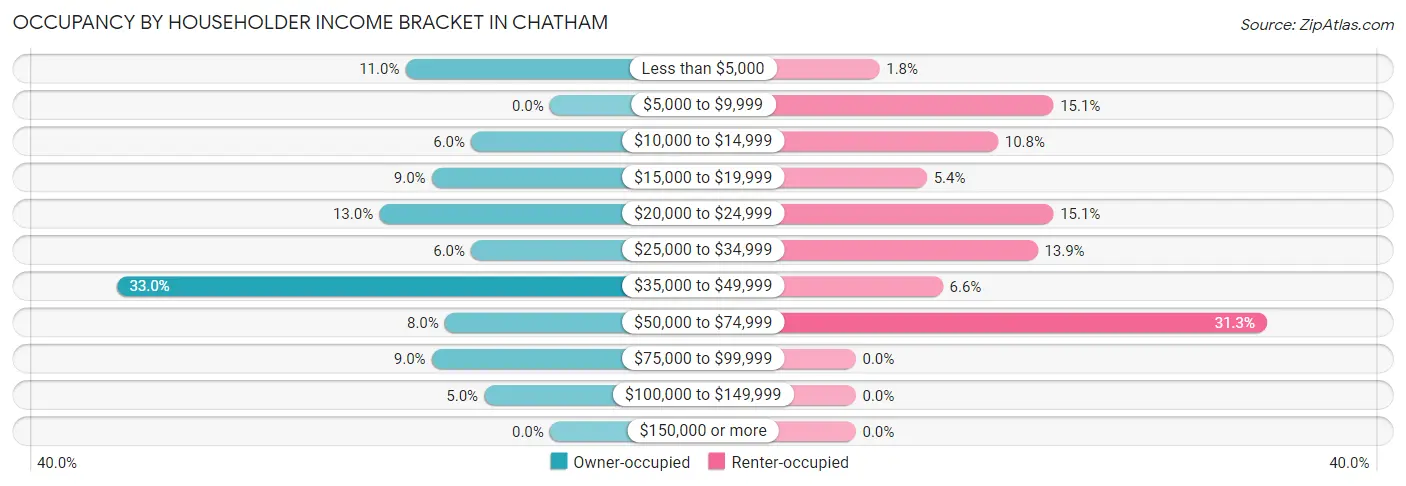
| Income Bracket | Owner-occupied | Renter-occupied |
| Less than $5,000 | 11 (11.0%) | 3 (1.8%) |
| $5,000 to $9,999 | 0 (0.0%) | 25 (15.1%) |
| $10,000 to $14,999 | 6 (6.0%) | 18 (10.8%) |
| $15,000 to $19,999 | 9 (9.0%) | 9 (5.4%) |
| $20,000 to $24,999 | 13 (13.0%) | 25 (15.1%) |
| $25,000 to $34,999 | 6 (6.0%) | 23 (13.9%) |
| $35,000 to $49,999 | 33 (33.0%) | 11 (6.6%) |
| $50,000 to $74,999 | 8 (8.0%) | 52 (31.3%) |
| $75,000 to $99,999 | 9 (9.0%) | 0 (0.0%) |
| $100,000 to $149,999 | 5 (5.0%) | 0 (0.0%) |
| $150,000 or more | 0 (0.0%) | 0 (0.0%) |
| Total | 100 (100.0%) | 166 (100.0%) |
Monthly Housing Cost Tiers in Chatham
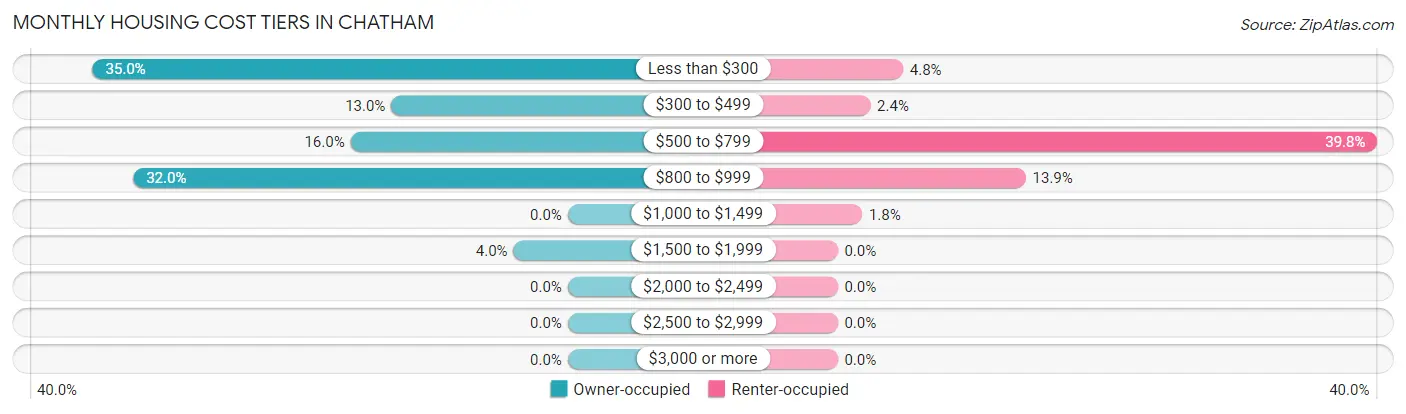
| Monthly Cost | Owner-occupied | Renter-occupied |
| Less than $300 | 35 (35.0%) | 8 (4.8%) |
| $300 to $499 | 13 (13.0%) | 4 (2.4%) |
| $500 to $799 | 16 (16.0%) | 66 (39.8%) |
| $800 to $999 | 32 (32.0%) | 23 (13.9%) |
| $1,000 to $1,499 | 0 (0.0%) | 3 (1.8%) |
| $1,500 to $1,999 | 4 (4.0%) | 0 (0.0%) |
| $2,000 to $2,499 | 0 (0.0%) | 0 (0.0%) |
| $2,500 to $2,999 | 0 (0.0%) | 0 (0.0%) |
| $3,000 or more | 0 (0.0%) | 0 (0.0%) |
| Total | 100 (100.0%) | 166 (100.0%) |
Physical Housing Characteristics in Chatham
Housing Structures in Chatham
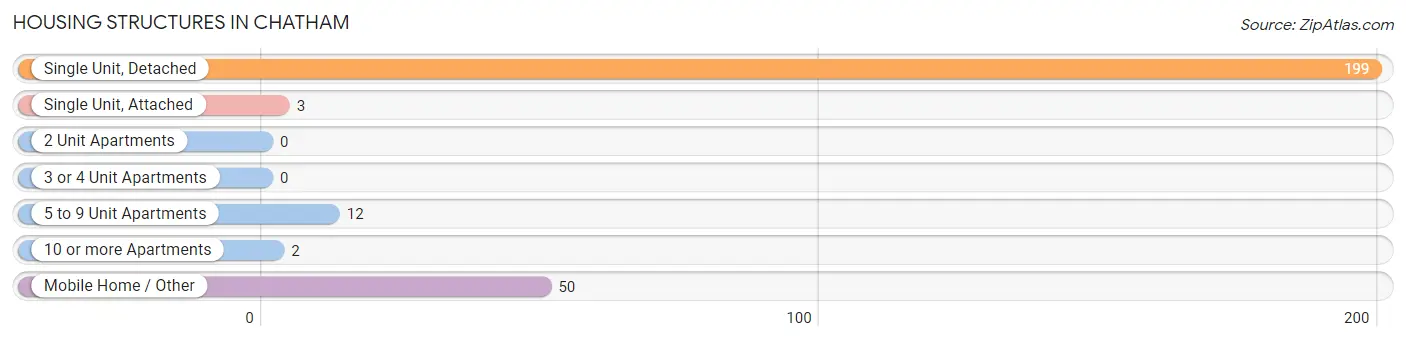
| Structure Type | # Housing Units | % Housing Units |
| Single Unit, Detached | 199 | 74.8% |
| Single Unit, Attached | 3 | 1.1% |
| 2 Unit Apartments | 0 | 0.0% |
| 3 or 4 Unit Apartments | 0 | 0.0% |
| 5 to 9 Unit Apartments | 12 | 4.5% |
| 10 or more Apartments | 2 | 0.7% |
| Mobile Home / Other | 50 | 18.8% |
| Total | 266 | 100.0% |
Housing Structures by Occupancy in Chatham
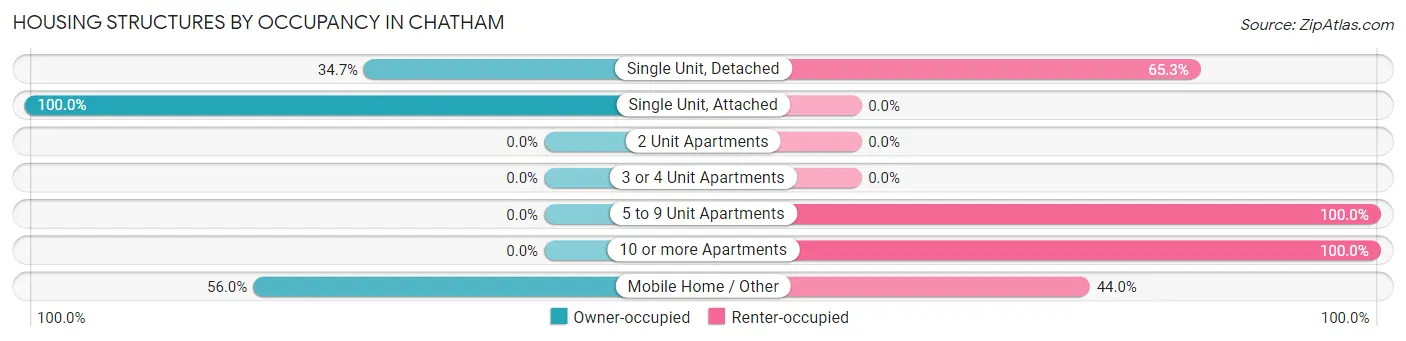
| Structure Type | Owner-occupied | Renter-occupied |
| Single Unit, Detached | 69 (34.7%) | 130 (65.3%) |
| Single Unit, Attached | 3 (100.0%) | 0 (0.0%) |
| 2 Unit Apartments | 0 (0.0%) | 0 (0.0%) |
| 3 or 4 Unit Apartments | 0 (0.0%) | 0 (0.0%) |
| 5 to 9 Unit Apartments | 0 (0.0%) | 12 (100.0%) |
| 10 or more Apartments | 0 (0.0%) | 2 (100.0%) |
| Mobile Home / Other | 28 (56.0%) | 22 (44.0%) |
| Total | 100 (37.6%) | 166 (62.4%) |
Housing Structures by Number of Rooms in Chatham
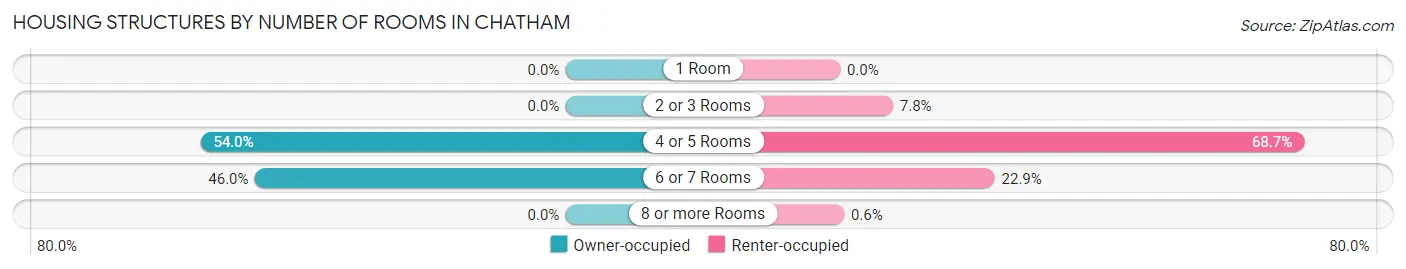
| Number of Rooms | Owner-occupied | Renter-occupied |
| 1 Room | 0 (0.0%) | 0 (0.0%) |
| 2 or 3 Rooms | 0 (0.0%) | 13 (7.8%) |
| 4 or 5 Rooms | 54 (54.0%) | 114 (68.7%) |
| 6 or 7 Rooms | 46 (46.0%) | 38 (22.9%) |
| 8 or more Rooms | 0 (0.0%) | 1 (0.6%) |
| Total | 100 (100.0%) | 166 (100.0%) |
Housing Structure by Heating Type in Chatham
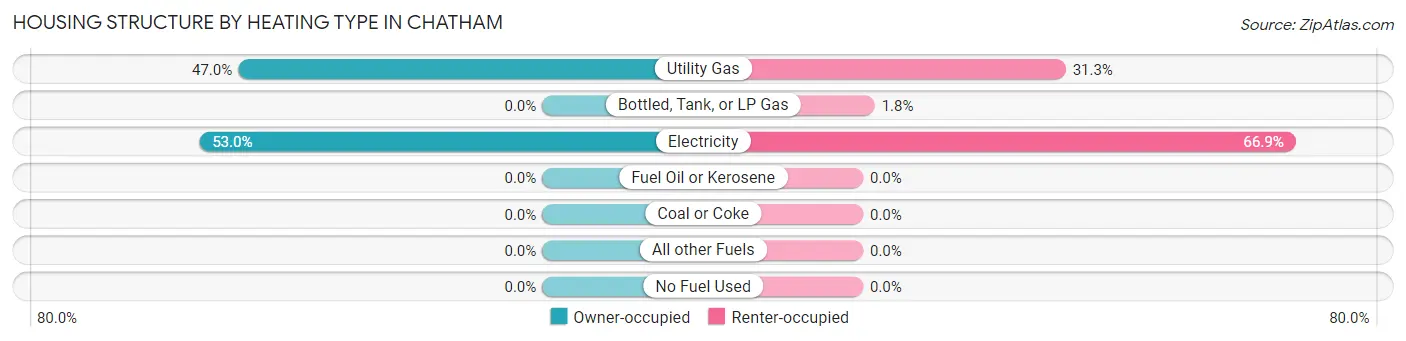
| Heating Type | Owner-occupied | Renter-occupied |
| Utility Gas | 47 (47.0%) | 52 (31.3%) |
| Bottled, Tank, or LP Gas | 0 (0.0%) | 3 (1.8%) |
| Electricity | 53 (53.0%) | 111 (66.9%) |
| Fuel Oil or Kerosene | 0 (0.0%) | 0 (0.0%) |
| Coal or Coke | 0 (0.0%) | 0 (0.0%) |
| All other Fuels | 0 (0.0%) | 0 (0.0%) |
| No Fuel Used | 0 (0.0%) | 0 (0.0%) |
| Total | 100 (100.0%) | 166 (100.0%) |
Household Vehicle Usage in Chatham
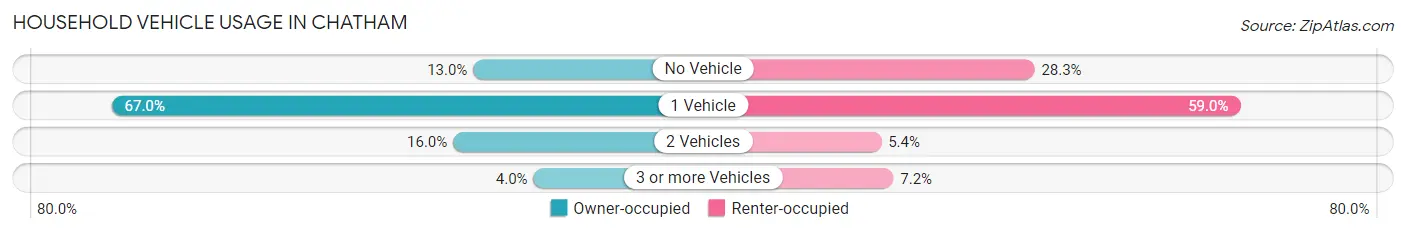
| Vehicles per Household | Owner-occupied | Renter-occupied |
| No Vehicle | 13 (13.0%) | 47 (28.3%) |
| 1 Vehicle | 67 (67.0%) | 98 (59.0%) |
| 2 Vehicles | 16 (16.0%) | 9 (5.4%) |
| 3 or more Vehicles | 4 (4.0%) | 12 (7.2%) |
| Total | 100 (100.0%) | 166 (100.0%) |
Real Estate & Mortgages in Chatham
Real Estate and Mortgage Overview in Chatham
| Characteristic | Without Mortgage | With Mortgage |
| Housing Units | 48 | 52 |
| Median Property Value | $24,000 | $58,400 |
| Median Household Income | $33,333 | $0 |
| Monthly Housing Costs | $221 | $0 |
| Real Estate Taxes | $199 | $8 |
Property Value by Mortgage Status in Chatham
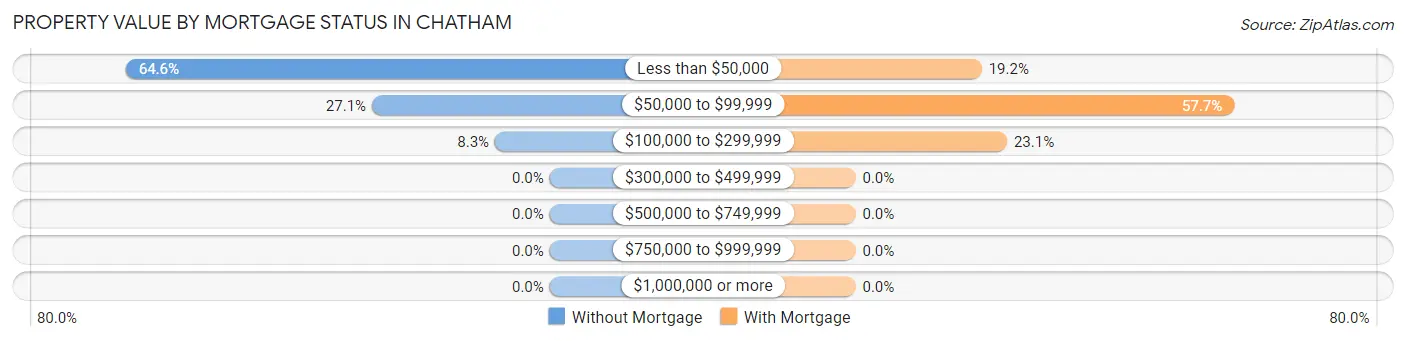
| Property Value | Without Mortgage | With Mortgage |
| Less than $50,000 | 31 (64.6%) | 10 (19.2%) |
| $50,000 to $99,999 | 13 (27.1%) | 30 (57.7%) |
| $100,000 to $299,999 | 4 (8.3%) | 12 (23.1%) |
| $300,000 to $499,999 | 0 (0.0%) | 0 (0.0%) |
| $500,000 to $749,999 | 0 (0.0%) | 0 (0.0%) |
| $750,000 to $999,999 | 0 (0.0%) | 0 (0.0%) |
| $1,000,000 or more | 0 (0.0%) | 0 (0.0%) |
| Total | 48 (100.0%) | 52 (100.0%) |
Household Income by Mortgage Status in Chatham
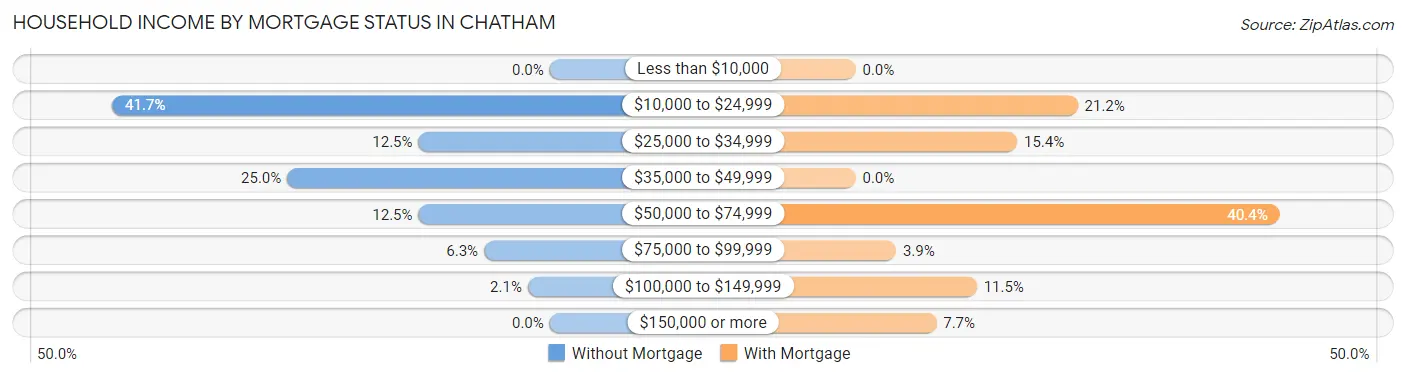
| Household Income | Without Mortgage | With Mortgage |
| Less than $10,000 | 0 (0.0%) | 0 (0.0%) |
| $10,000 to $24,999 | 20 (41.7%) | 11 (21.1%) |
| $25,000 to $34,999 | 6 (12.5%) | 8 (15.4%) |
| $35,000 to $49,999 | 12 (25.0%) | 0 (0.0%) |
| $50,000 to $74,999 | 6 (12.5%) | 21 (40.4%) |
| $75,000 to $99,999 | 3 (6.2%) | 2 (3.8%) |
| $100,000 to $149,999 | 1 (2.1%) | 6 (11.5%) |
| $150,000 or more | 0 (0.0%) | 4 (7.7%) |
| Total | 48 (100.0%) | 52 (100.0%) |
Property Value to Household Income Ratio in Chatham
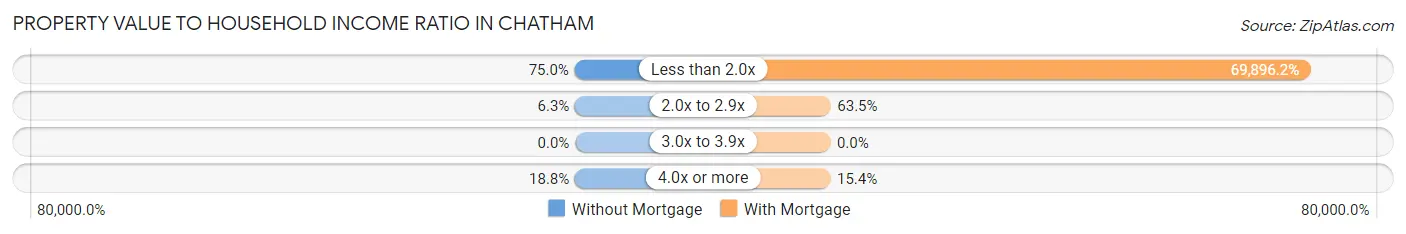
| Value-to-Income Ratio | Without Mortgage | With Mortgage |
| Less than 2.0x | 36 (75.0%) | 36,346 (69,896.2%) |
| 2.0x to 2.9x | 3 (6.2%) | 33 (63.5%) |
| 3.0x to 3.9x | 0 (0.0%) | 0 (0.0%) |
| 4.0x or more | 9 (18.8%) | 8 (15.4%) |
| Total | 48 (100.0%) | 52 (100.0%) |
Real Estate Taxes by Mortgage Status in Chatham
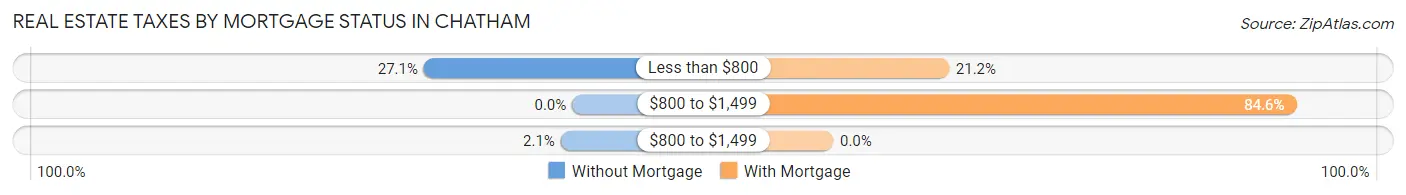
| Property Taxes | Without Mortgage | With Mortgage |
| Less than $800 | 13 (27.1%) | 11 (21.1%) |
| $800 to $1,499 | 0 (0.0%) | 44 (84.6%) |
| $800 to $1,499 | 1 (2.1%) | 0 (0.0%) |
| Total | 48 (100.0%) | 52 (100.0%) |
Health & Disability in Chatham
Health Insurance Coverage by Age in Chatham
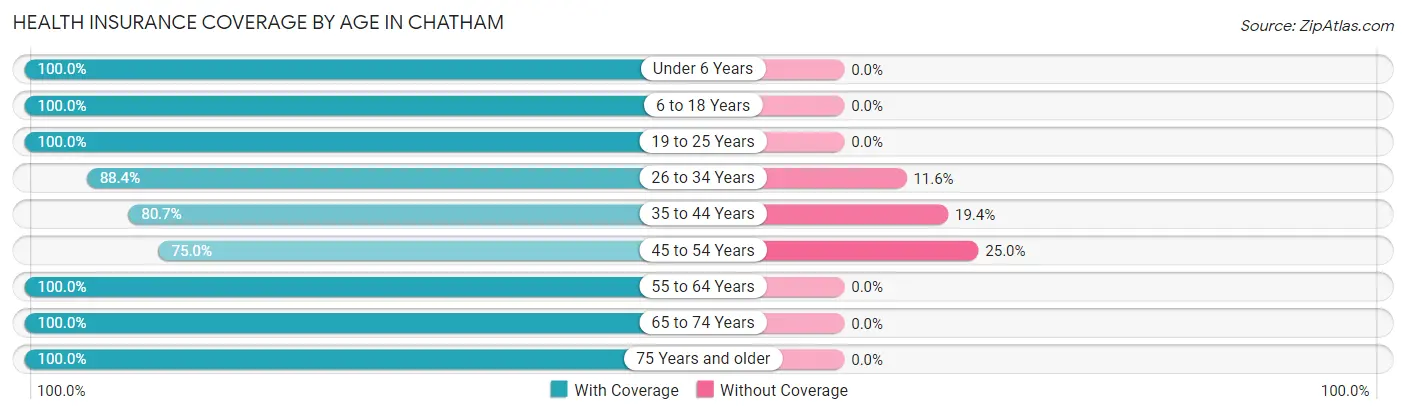
| Age Bracket | With Coverage | Without Coverage |
| Under 6 Years | 100 (100.0%) | 0 (0.0%) |
| 6 to 18 Years | 114 (100.0%) | 0 (0.0%) |
| 19 to 25 Years | 9 (100.0%) | 0 (0.0%) |
| 26 to 34 Years | 244 (88.4%) | 32 (11.6%) |
| 35 to 44 Years | 50 (80.6%) | 12 (19.4%) |
| 45 to 54 Years | 84 (75.0%) | 28 (25.0%) |
| 55 to 64 Years | 28 (100.0%) | 0 (0.0%) |
| 65 to 74 Years | 38 (100.0%) | 0 (0.0%) |
| 75 Years and older | 44 (100.0%) | 0 (0.0%) |
| Total | 711 (90.8%) | 72 (9.2%) |
Health Insurance Coverage by Citizenship Status in Chatham
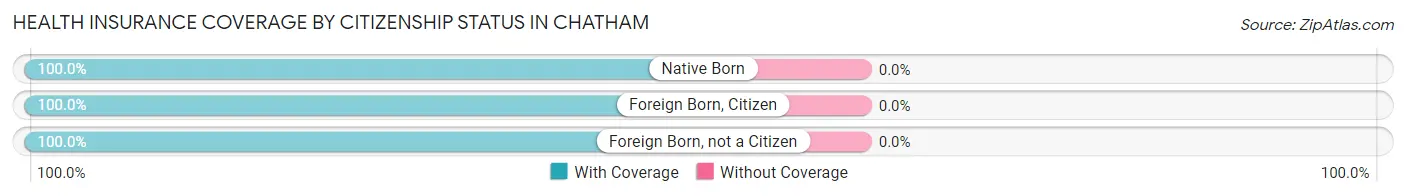
| Citizenship Status | With Coverage | Without Coverage |
| Native Born | 100 (100.0%) | 0 (0.0%) |
| Foreign Born, Citizen | 114 (100.0%) | 0 (0.0%) |
| Foreign Born, not a Citizen | 9 (100.0%) | 0 (0.0%) |
Health Insurance Coverage by Household Income in Chatham
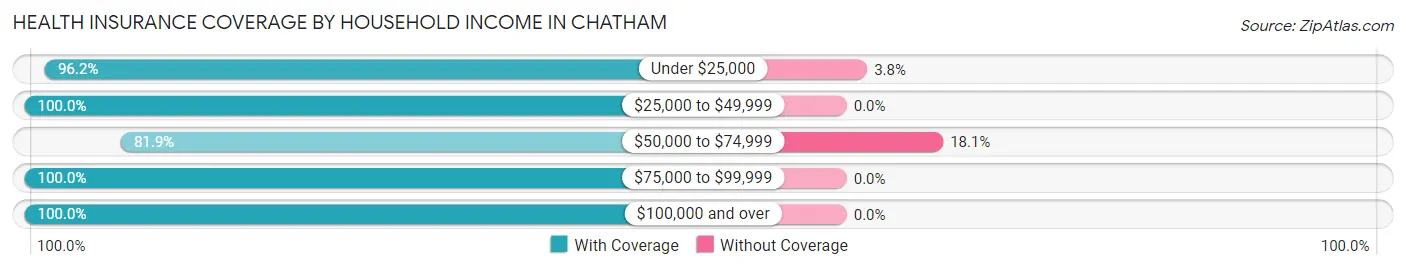
| Household Income | With Coverage | Without Coverage |
| Under $25,000 | 176 (96.2%) | 7 (3.8%) |
| $25,000 to $49,999 | 210 (100.0%) | 0 (0.0%) |
| $50,000 to $74,999 | 295 (81.9%) | 65 (18.1%) |
| $75,000 to $99,999 | 21 (100.0%) | 0 (0.0%) |
| $100,000 and over | 9 (100.0%) | 0 (0.0%) |
Public vs Private Health Insurance Coverage by Age in Chatham
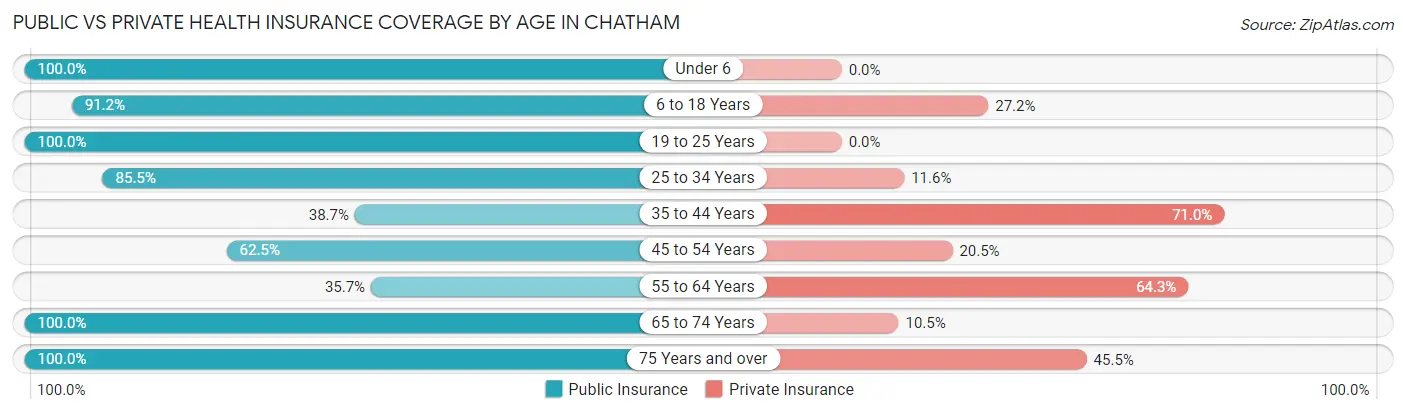
| Age Bracket | Public Insurance | Private Insurance |
| Under 6 | 100 (100.0%) | 0 (0.0%) |
| 6 to 18 Years | 104 (91.2%) | 31 (27.2%) |
| 19 to 25 Years | 9 (100.0%) | 0 (0.0%) |
| 25 to 34 Years | 236 (85.5%) | 32 (11.6%) |
| 35 to 44 Years | 24 (38.7%) | 44 (71.0%) |
| 45 to 54 Years | 70 (62.5%) | 23 (20.5%) |
| 55 to 64 Years | 10 (35.7%) | 18 (64.3%) |
| 65 to 74 Years | 38 (100.0%) | 4 (10.5%) |
| 75 Years and over | 44 (100.0%) | 20 (45.5%) |
| Total | 635 (81.1%) | 172 (22.0%) |
Disability Status by Sex by Age in Chatham
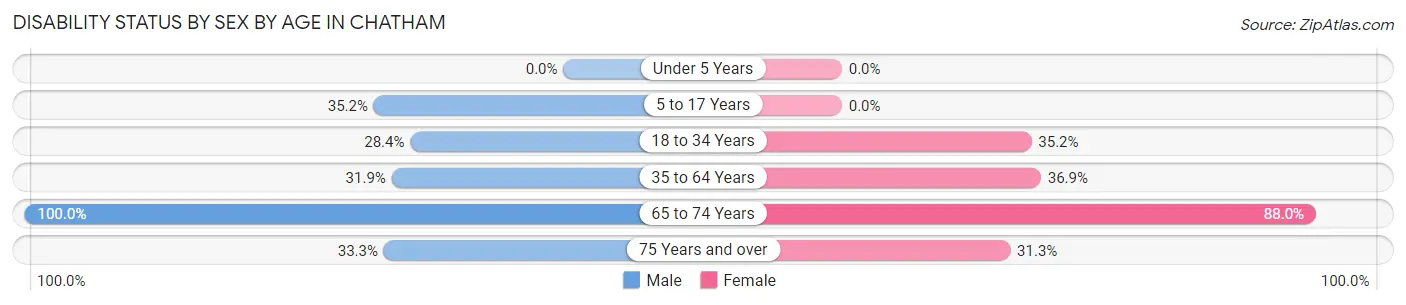
| Age Bracket | Male | Female |
| Under 5 Years | 0 (0.0%) | 0 (0.0%) |
| 5 to 17 Years | 19 (35.2%) | 0 (0.0%) |
| 18 to 34 Years | 25 (28.4%) | 70 (35.2%) |
| 35 to 64 Years | 29 (31.9%) | 41 (36.9%) |
| 65 to 74 Years | 13 (100.0%) | 22 (88.0%) |
| 75 Years and over | 4 (33.3%) | 10 (31.2%) |
Disability Class by Sex by Age in Chatham
Disability Class: Hearing Difficulty
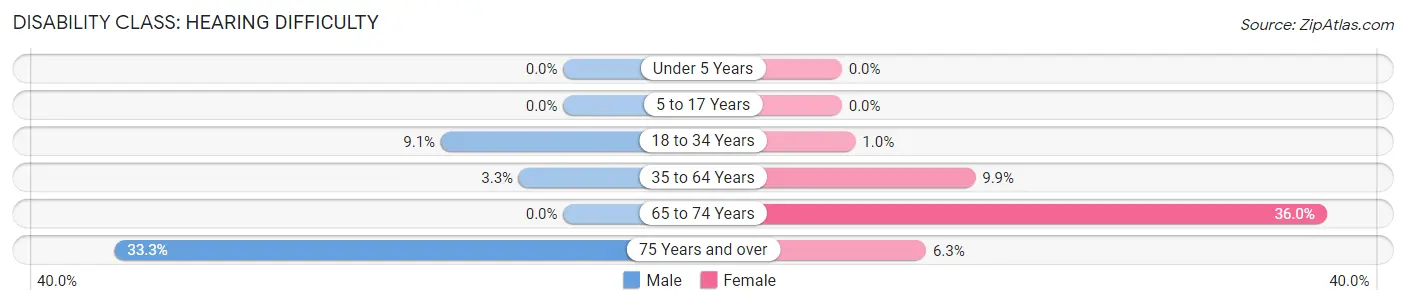
| Age Bracket | Male | Female |
| Under 5 Years | 0 (0.0%) | 0 (0.0%) |
| 5 to 17 Years | 0 (0.0%) | 0 (0.0%) |
| 18 to 34 Years | 8 (9.1%) | 2 (1.0%) |
| 35 to 64 Years | 3 (3.3%) | 11 (9.9%) |
| 65 to 74 Years | 0 (0.0%) | 9 (36.0%) |
| 75 Years and over | 4 (33.3%) | 2 (6.2%) |
Disability Class: Vision Difficulty
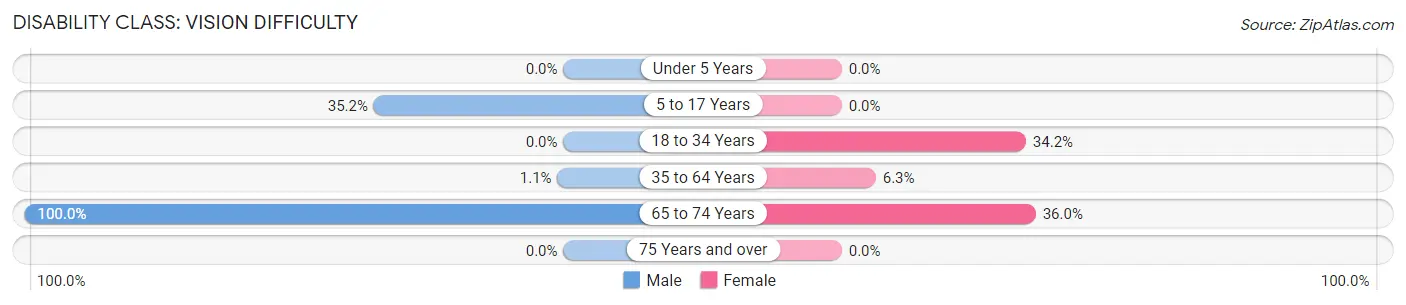
| Age Bracket | Male | Female |
| Under 5 Years | 0 (0.0%) | 0 (0.0%) |
| 5 to 17 Years | 19 (35.2%) | 0 (0.0%) |
| 18 to 34 Years | 0 (0.0%) | 68 (34.2%) |
| 35 to 64 Years | 1 (1.1%) | 7 (6.3%) |
| 65 to 74 Years | 13 (100.0%) | 9 (36.0%) |
| 75 Years and over | 0 (0.0%) | 0 (0.0%) |
Disability Class: Cognitive Difficulty
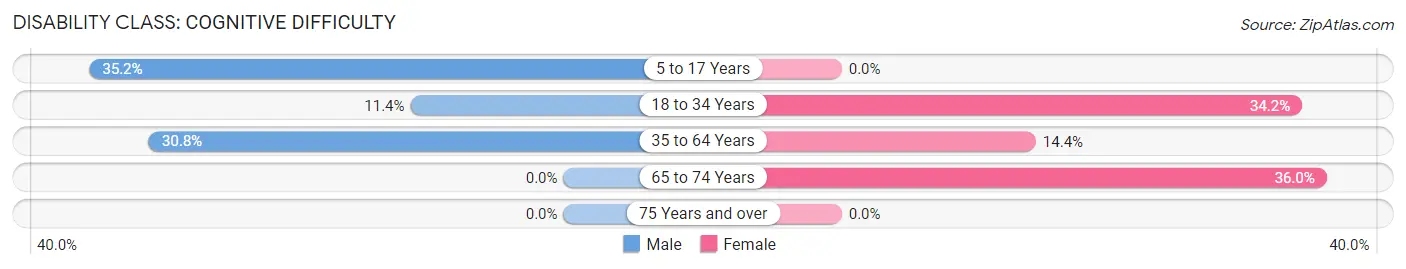
| Age Bracket | Male | Female |
| 5 to 17 Years | 19 (35.2%) | 0 (0.0%) |
| 18 to 34 Years | 10 (11.4%) | 68 (34.2%) |
| 35 to 64 Years | 28 (30.8%) | 16 (14.4%) |
| 65 to 74 Years | 0 (0.0%) | 9 (36.0%) |
| 75 Years and over | 0 (0.0%) | 0 (0.0%) |
Disability Class: Ambulatory Difficulty
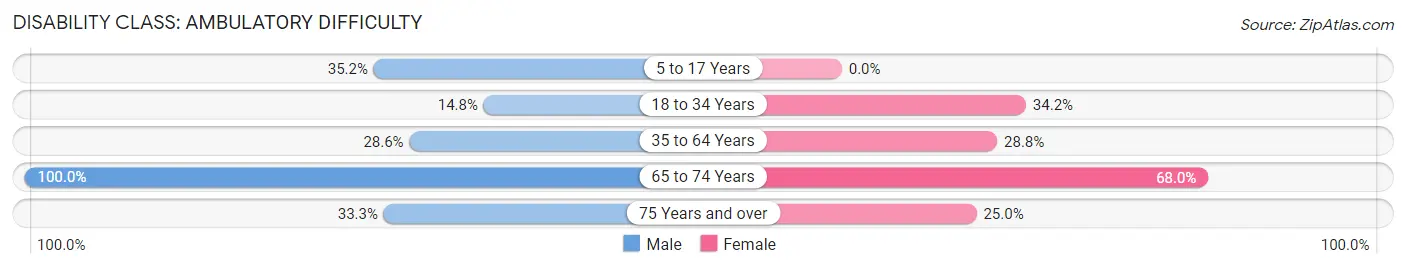
| Age Bracket | Male | Female |
| 5 to 17 Years | 19 (35.2%) | 0 (0.0%) |
| 18 to 34 Years | 13 (14.8%) | 68 (34.2%) |
| 35 to 64 Years | 26 (28.6%) | 32 (28.8%) |
| 65 to 74 Years | 13 (100.0%) | 17 (68.0%) |
| 75 Years and over | 4 (33.3%) | 8 (25.0%) |
Disability Class: Self-Care Difficulty
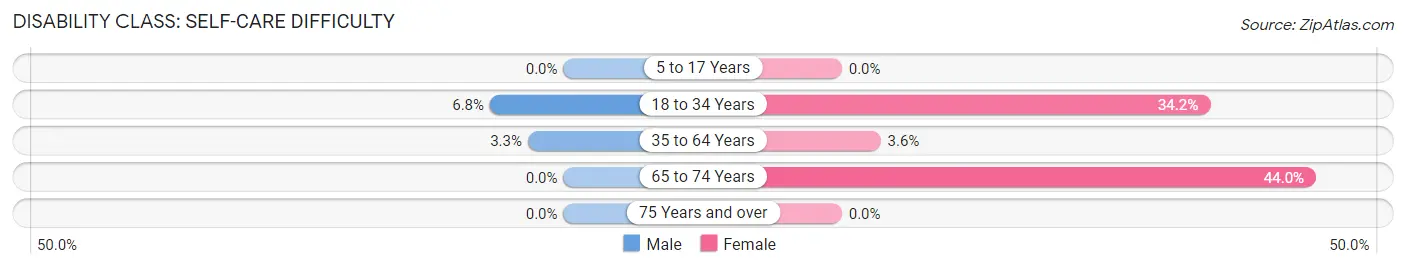
| Age Bracket | Male | Female |
| 5 to 17 Years | 0 (0.0%) | 0 (0.0%) |
| 18 to 34 Years | 6 (6.8%) | 68 (34.2%) |
| 35 to 64 Years | 3 (3.3%) | 4 (3.6%) |
| 65 to 74 Years | 0 (0.0%) | 11 (44.0%) |
| 75 Years and over | 0 (0.0%) | 0 (0.0%) |
Technology Access in Chatham
Computing Device Access in Chatham
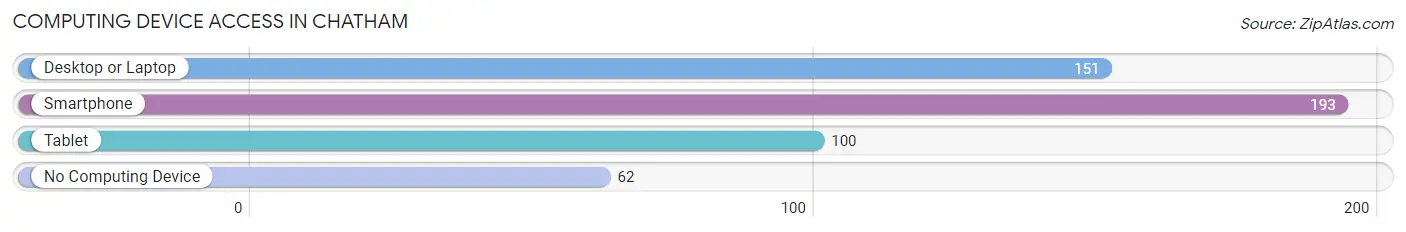
| Device Type | # Households | % Households |
| Desktop or Laptop | 151 | 56.8% |
| Smartphone | 193 | 72.6% |
| Tablet | 100 | 37.6% |
| No Computing Device | 62 | 23.3% |
| Total | 266 | 100.0% |
Internet Access in Chatham
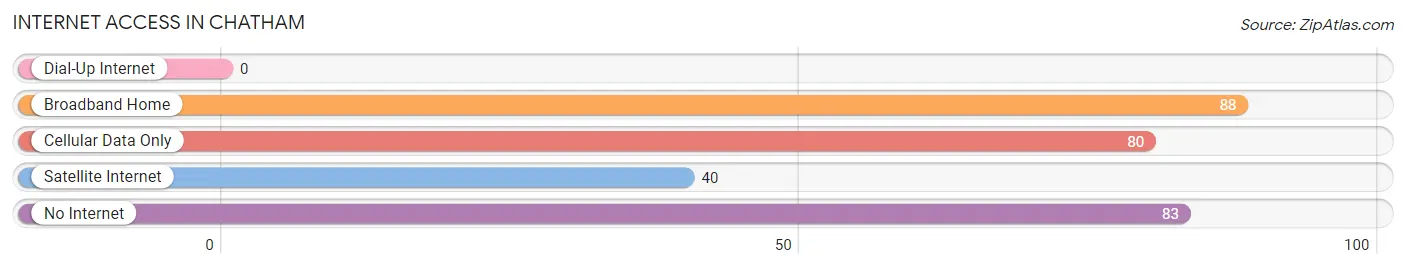
| Internet Type | # Households | % Households |
| Dial-Up Internet | 0 | 0.0% |
| Broadband Home | 88 | 33.1% |
| Cellular Data Only | 80 | 30.1% |
| Satellite Internet | 40 | 15.0% |
| No Internet | 83 | 31.2% |
| Total | 266 | 100.0% |
Chatham Summary
Chatham is a small town located in the state of Louisiana, in the United States. It is situated in the northern part of the state, in the parish of St. Tammany. The town has a population of approximately 1,000 people, and is located about 30 miles north of New Orleans.
Geography
Chatham is located in the northern part of St. Tammany Parish, in the state of Louisiana. It is situated on the banks of the Tchefuncte River, and is surrounded by the towns of Abita Springs, Covington, and Mandeville. The town is located about 30 miles north of New Orleans, and is part of the New Orleans metropolitan area. The town is situated on a flat plain, and is surrounded by forests and wetlands.
Climate
Chatham has a humid subtropical climate, with hot and humid summers, and mild winters. The average temperature in the summer months is around 80°F, and in the winter months it is around 50°F. The town receives an average of 60 inches of precipitation per year, with most of it falling in the summer months.
Demographics
As of the 2010 census, the population of Chatham was 1,000 people. The racial makeup of the town was 97.2% White, 0.7% African American, 0.3% Native American, 0.3% Asian, 0.1% Pacific Islander, 0.3% from other races, and 1.3% from two or more races. Hispanic or Latino of any race were 1.3% of the population.
Economy
The economy of Chatham is largely based on agriculture and tourism. The town is home to several farms, which produce a variety of crops, including corn, soybeans, and cotton. The town is also home to several restaurants, which serve local seafood and other dishes. Tourism is also an important part of the local economy, as the town is located near several popular attractions, such as the Tchefuncte River, the Abita Springs Golf Course, and the Fontainebleau State Park.
History
Chatham was founded in 1820 by a group of settlers from the nearby town of Abita Springs. The town was named after the Chatham Plantation, which was located nearby. The town grew slowly over the years, and by the late 19th century, it had become a popular destination for tourists. In the early 20th century, the town was home to several sawmills and lumber mills, which provided employment for many of the town’s residents. In the late 20th century, the town began to experience a decline in population, as many of its residents moved away in search of better job opportunities. Today, Chatham is a small, rural town, with a population of approximately 1,000 people.
Common Questions
What is Per Capita Income in Chatham?
Per Capita income in Chatham is $14,204.
What is the Median Family Income in Chatham?
Median Family Income in Chatham is $36,154.
What is the Median Household income in Chatham?
Median Household Income in Chatham is $28,750.
What is Income or Wage Gap in Chatham?
Income or Wage Gap in Chatham is 29.3%.
Women in Chatham earn 70.7 cents for every dollar earned by a man.
What is Inequality or Gini Index in Chatham?
Inequality or Gini Index in Chatham is 0.39.
What is the Total Population of Chatham?
Total Population of Chatham is 783.
What is the Total Male Population of Chatham?
Total Male Population of Chatham is 302.
What is the Total Female Population of Chatham?
Total Female Population of Chatham is 481.
What is the Ratio of Males per 100 Females in Chatham?
There are 62.79 Males per 100 Females in Chatham.
What is the Ratio of Females per 100 Males in Chatham?
There are 159.27 Females per 100 Males in Chatham.
What is the Median Population Age in Chatham?
Median Population Age in Chatham is 30.5 Years.
What is the Average Family Size in Chatham
Average Family Size in Chatham is 4.7 People.
What is the Average Household Size in Chatham
Average Household Size in Chatham is 2.9 People.
How Large is the Labor Force in Chatham?
There are 221 People in the Labor Forcein in Chatham.
What is the Percentage of People in the Labor Force in Chatham?
37.5% of People are in the Labor Force in Chatham.
What is the Unemployment Rate in Chatham?
Unemployment Rate in Chatham is 1.4%.