Center Point, LA Map & Demographics
Center Point Map
Center Point Overview
$14,101
PER CAPITA INCOME
0.46
INEQUALITY / GINI INDEX
807
TOTAL POPULATION
447
MALE POPULATION
360
FEMALE POPULATION
124.17
MALES / 100 FEMALES
80.54
FEMALES / 100 MALES
43.4
MEDIAN AGE
3.7
AVG FAMILY SIZE
3.4
AVG HOUSEHOLD SIZE
284
LABOR FORCE [ PEOPLE ]
52.1%
PERCENT IN LABOR FORCE
Center Point Zip Codes
Center Point Area Codes
Income in Center Point
Income Overview in Center Point
| Characteristic | Number | Measure |
| Per Capita Income | 807 | $14,101 |
| Median Family Income | 177 | $0 |
| Mean Family Income | 177 | $47,170 |
| Median Household Income | 212 | $0 |
| Mean Household Income | 212 | $47,661 |
| Income Deficit | 177 | $0 |
| Wage / Income Gap (%) | 807 | 0.00% |
| Wage / Income Gap ($) | 807 | 100.00¢ per $1 |
| Gini / Inequality Index | 807 | 0.46 |
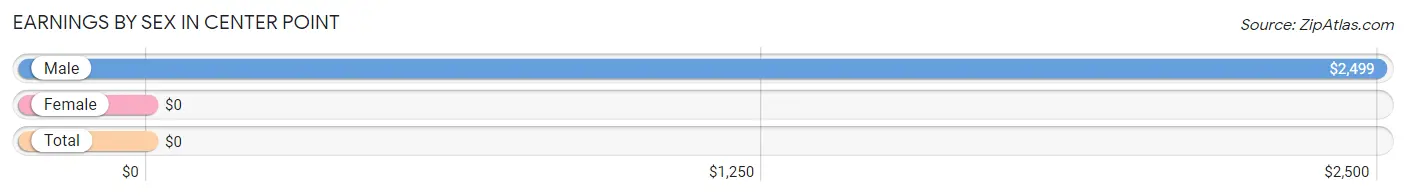
Earnings by Sex in Center Point
| Sex | Number | Average Earnings |
| Male | 134 (47.2%) | $2,499 |
| Female | 150 (52.8%) | $0 |
| Total | 284 (100.0%) | $0 |
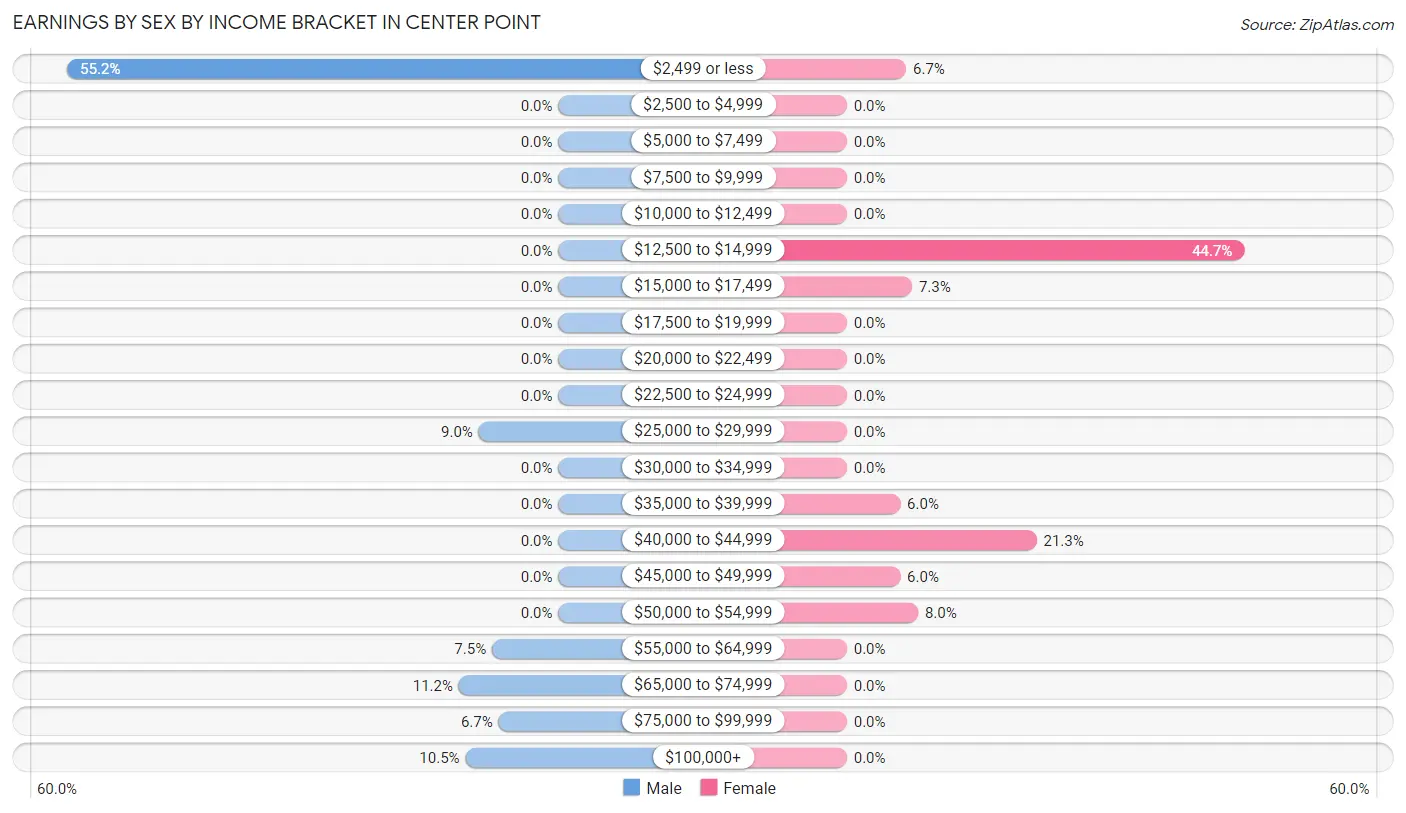
Earnings by Sex by Income Bracket in Center Point
The most common earnings brackets in Center Point are $2,499 or less for men (74 | 55.2%) and $12,500 to $14,999 for women (67 | 44.7%).
| Income | Male | Female |
| $2,499 or less | 74 (55.2%) | 10 (6.7%) |
| $2,500 to $4,999 | 0 (0.0%) | 0 (0.0%) |
| $5,000 to $7,499 | 0 (0.0%) | 0 (0.0%) |
| $7,500 to $9,999 | 0 (0.0%) | 0 (0.0%) |
| $10,000 to $12,499 | 0 (0.0%) | 0 (0.0%) |
| $12,500 to $14,999 | 0 (0.0%) | 67 (44.7%) |
| $15,000 to $17,499 | 0 (0.0%) | 11 (7.3%) |
| $17,500 to $19,999 | 0 (0.0%) | 0 (0.0%) |
| $20,000 to $22,499 | 0 (0.0%) | 0 (0.0%) |
| $22,500 to $24,999 | 0 (0.0%) | 0 (0.0%) |
| $25,000 to $29,999 | 12 (9.0%) | 0 (0.0%) |
| $30,000 to $34,999 | 0 (0.0%) | 0 (0.0%) |
| $35,000 to $39,999 | 0 (0.0%) | 9 (6.0%) |
| $40,000 to $44,999 | 0 (0.0%) | 32 (21.3%) |
| $45,000 to $49,999 | 0 (0.0%) | 9 (6.0%) |
| $50,000 to $54,999 | 0 (0.0%) | 12 (8.0%) |
| $55,000 to $64,999 | 10 (7.5%) | 0 (0.0%) |
| $65,000 to $74,999 | 15 (11.2%) | 0 (0.0%) |
| $75,000 to $99,999 | 9 (6.7%) | 0 (0.0%) |
| $100,000+ | 14 (10.4%) | 0 (0.0%) |
| Total | 134 (100.0%) | 150 (100.0%) |
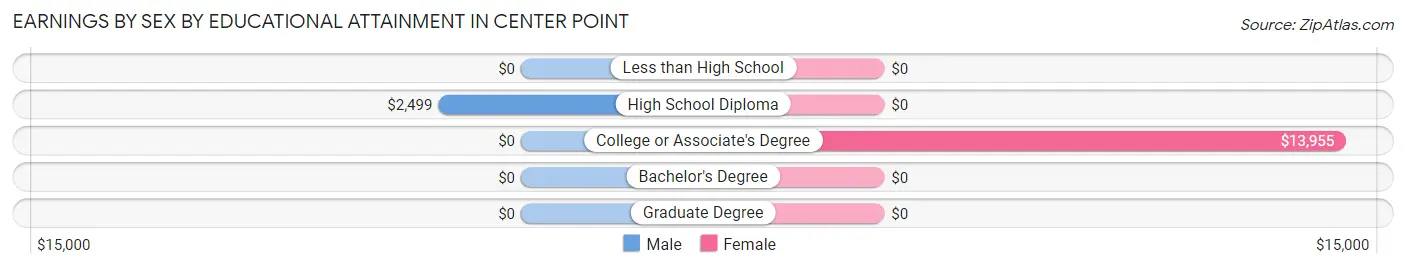
Earnings by Sex by Educational Attainment in Center Point
| Educational Attainment | Male Income | Female Income |
| Less than High School | - | - |
| High School Diploma | $2,499 | $0 |
| College or Associate's Degree | - | - |
| Bachelor's Degree | - | - |
| Graduate Degree | - | - |
| Total | $2,499 | $0 |
Family Income in Center Point
Family Income Brackets in Center Point
According to the Center Point family income data, there are 73 families falling into the $10,000 to $14,999 income range, which is the most common income bracket and makes up 41.2% of all families.
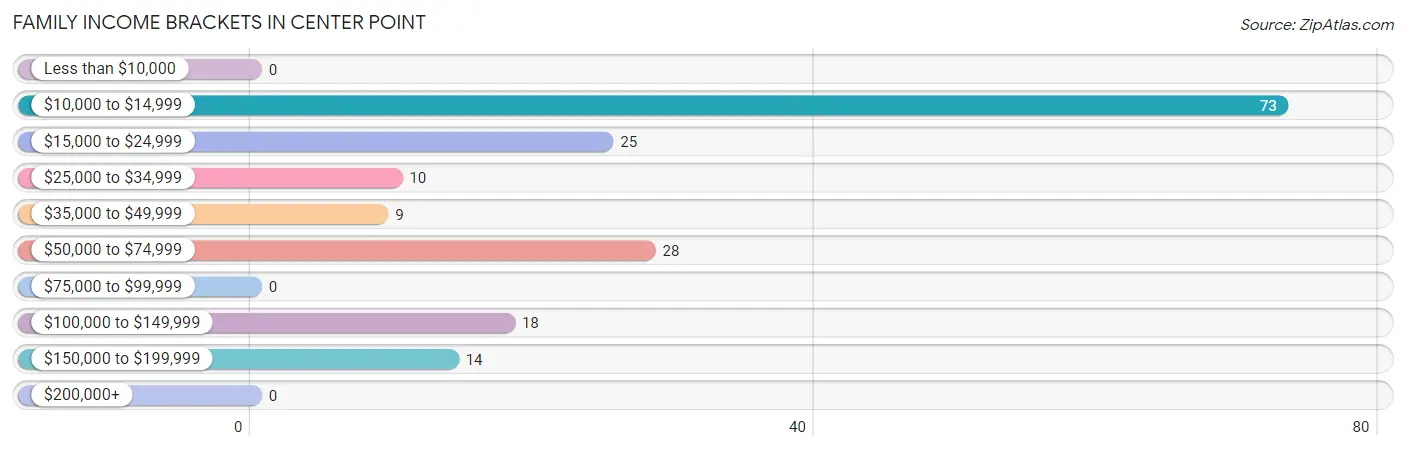
| Income Bracket | # Families | % Families |
| Less than $10,000 | 0 | 0.0% |
| $10,000 to $14,999 | 73 | 41.2% |
| $15,000 to $24,999 | 25 | 14.1% |
| $25,000 to $34,999 | 10 | 5.6% |
| $35,000 to $49,999 | 9 | 5.1% |
| $50,000 to $74,999 | 28 | 15.8% |
| $75,000 to $99,999 | 0 | 0.0% |
| $100,000 to $149,999 | 18 | 10.2% |
| $150,000 to $199,999 | 14 | 7.9% |
| $200,000+ | 0 | 0.0% |
Family Income by Famaliy Size in Center Point
3-person families (106 | 59.9%) account for the highest median family income in Center Point with $14,315 per family, while 3-person families (106 | 59.9%) have the highest median income of $4,772 per family member.
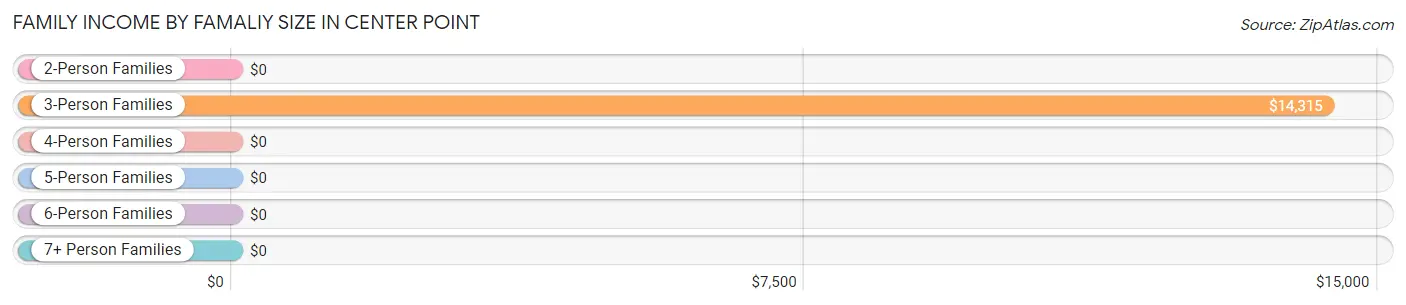
| Income Bracket | # Families | Median Income |
| 2-Person Families | 37 (20.9%) | $0 |
| 3-Person Families | 106 (59.9%) | $14,315 |
| 4-Person Families | 14 (7.9%) | $0 |
| 5-Person Families | 20 (11.3%) | $0 |
| 6-Person Families | 0 (0.0%) | $0 |
| 7+ Person Families | 0 (0.0%) | $0 |
| Total | 177 (100.0%) | $0 |
Family Income by Number of Earners in Center Point
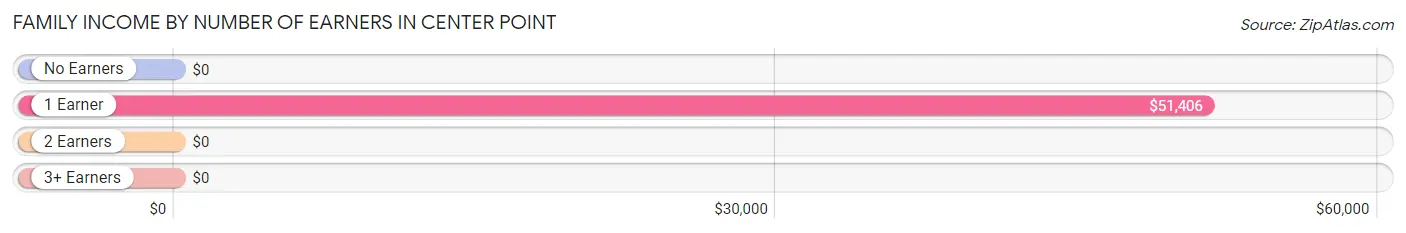
| Number of Earners | # Families | Median Income |
| No Earners | 44 (24.9%) | $0 |
| 1 Earner | 27 (15.2%) | $51,406 |
| 2 Earners | 106 (59.9%) | $0 |
| 3+ Earners | 0 (0.0%) | $0 |
| Total | 177 (100.0%) | $0 |
Household Income in Center Point
Household Income Brackets in Center Point
With 73 households falling in the category, the $10,000 to $14,999 income range is the most frequent in Center Point, accounting for 34.4% of all households.
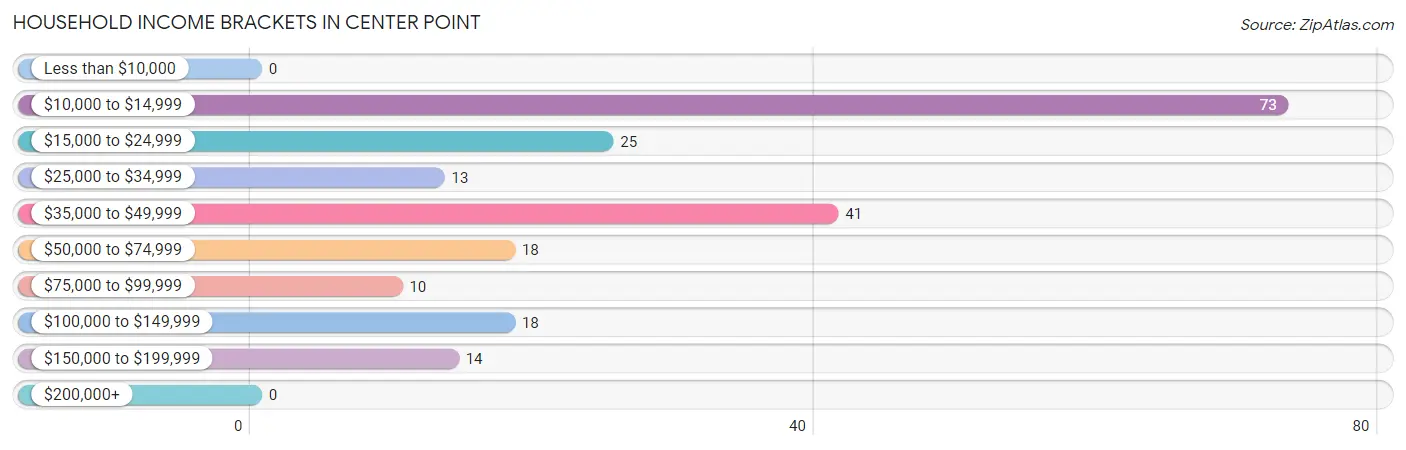
| Income Bracket | # Households | % Households |
| Less than $10,000 | 0 | 0.0% |
| $10,000 to $14,999 | 73 | 34.4% |
| $15,000 to $24,999 | 25 | 11.8% |
| $25,000 to $34,999 | 13 | 6.1% |
| $35,000 to $49,999 | 41 | 19.3% |
| $50,000 to $74,999 | 18 | 8.5% |
| $75,000 to $99,999 | 10 | 4.7% |
| $100,000 to $149,999 | 18 | 8.5% |
| $150,000 to $199,999 | 14 | 6.6% |
| $200,000+ | 0 | 0.0% |
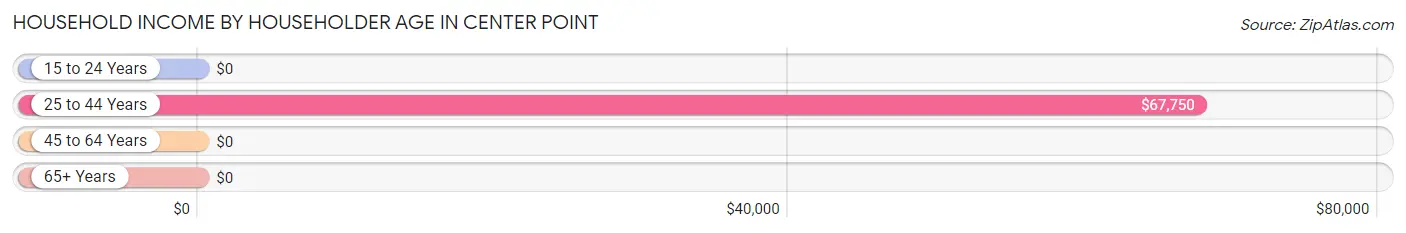
Household Income by Householder Age in Center Point
The median household income in Center Point is $0, with the highest median household income of $67,750 found in the 25 to 44 years age bracket for the primary householder. A total of 66 households (31.1%) fall into this category.
| Income Bracket | # Households | Median Income |
| 15 to 24 Years | 0 (0.0%) | $0 |
| 25 to 44 Years | 66 (31.1%) | $67,750 |
| 45 to 64 Years | 82 (38.7%) | $0 |
| 65+ Years | 64 (30.2%) | $0 |
| Total | 212 (100.0%) | $0 |
Poverty in Center Point
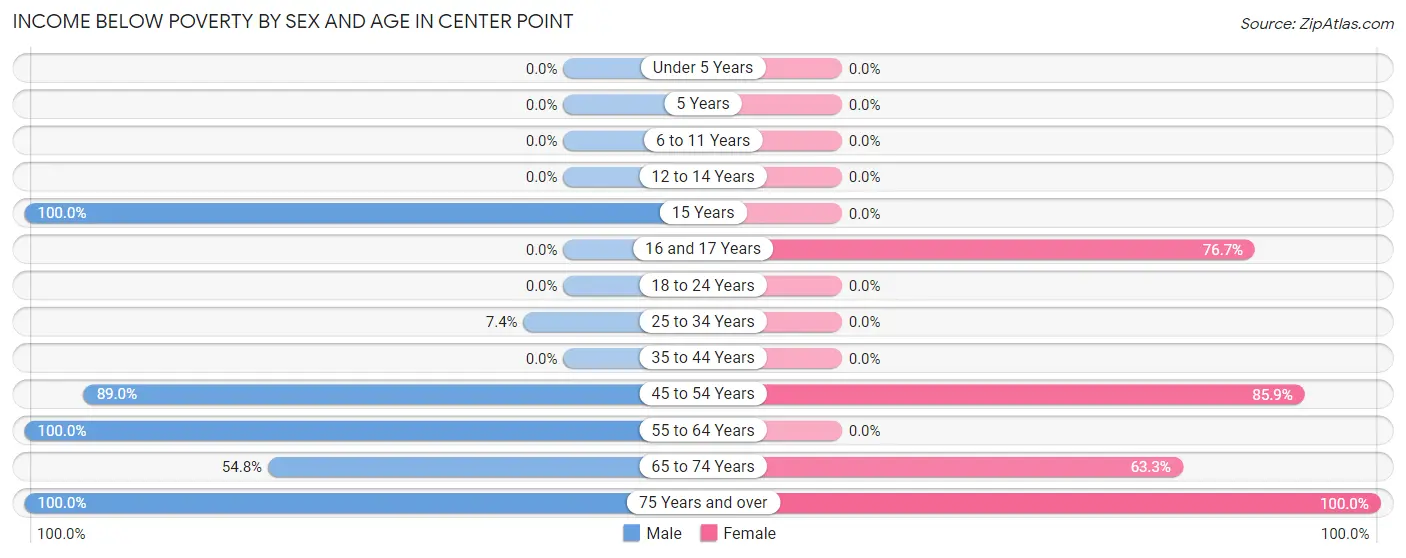
Income Below Poverty by Sex and Age in Center Point
With 62.2% poverty level for males and 52.2% for females among the residents of Center Point, 15 year old males and 75 year old and over females are the most vulnerable to poverty, with 141 males (100.0%) and 32 females (100.0%) in their respective age groups living below the poverty level.
| Age Bracket | Male | Female |
| Under 5 Years | 0 (0.0%) | 0 (0.0%) |
| 5 Years | 0 (0.0%) | 0 (0.0%) |
| 6 to 11 Years | 0 (0.0%) | 0 (0.0%) |
| 12 to 14 Years | 0 (0.0%) | 0 (0.0%) |
| 15 Years | 141 (100.0%) | 0 (0.0%) |
| 16 and 17 Years | 0 (0.0%) | 46 (76.7%) |
| 18 to 24 Years | 0 (0.0%) | 0 (0.0%) |
| 25 to 34 Years | 2 (7.4%) | 0 (0.0%) |
| 35 to 44 Years | 0 (0.0%) | 0 (0.0%) |
| 45 to 54 Years | 73 (89.0%) | 67 (85.9%) |
| 55 to 64 Years | 1 (100.0%) | 0 (0.0%) |
| 65 to 74 Years | 34 (54.8%) | 31 (63.3%) |
| 75 Years and over | 16 (100.0%) | 32 (100.0%) |
| Total | 267 (62.2%) | 176 (52.2%) |
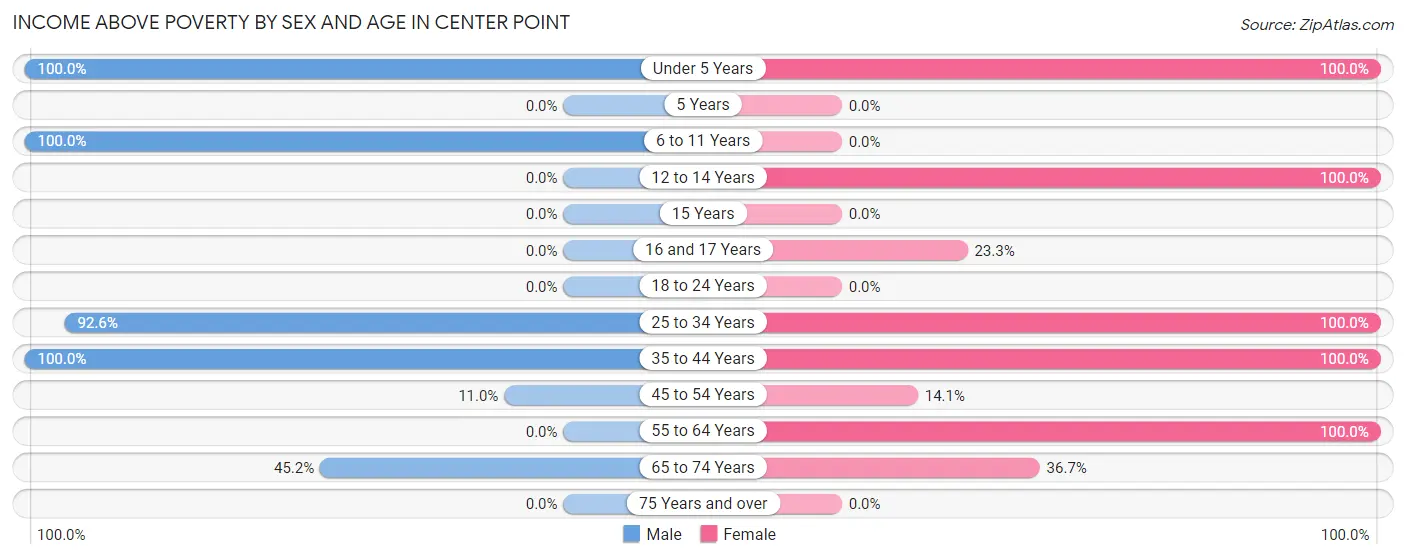
Income Above Poverty by Sex and Age in Center Point
According to the poverty statistics in Center Point, males aged under 5 years and females aged under 5 years are the age groups that are most secure financially, with 100.0% of males and 100.0% of females in these age groups living above the poverty line.
| Age Bracket | Male | Female |
| Under 5 Years | 42 (100.0%) | 20 (100.0%) |
| 5 Years | 0 (0.0%) | 0 (0.0%) |
| 6 to 11 Years | 32 (100.0%) | 0 (0.0%) |
| 12 to 14 Years | 0 (0.0%) | 17 (100.0%) |
| 15 Years | 0 (0.0%) | 0 (0.0%) |
| 16 and 17 Years | 0 (0.0%) | 14 (23.3%) |
| 18 to 24 Years | 0 (0.0%) | 0 (0.0%) |
| 25 to 34 Years | 25 (92.6%) | 19 (100.0%) |
| 35 to 44 Years | 26 (100.0%) | 44 (100.0%) |
| 45 to 54 Years | 9 (11.0%) | 11 (14.1%) |
| 55 to 64 Years | 0 (0.0%) | 18 (100.0%) |
| 65 to 74 Years | 28 (45.2%) | 18 (36.7%) |
| 75 Years and over | 0 (0.0%) | 0 (0.0%) |
| Total | 162 (37.8%) | 161 (47.8%) |
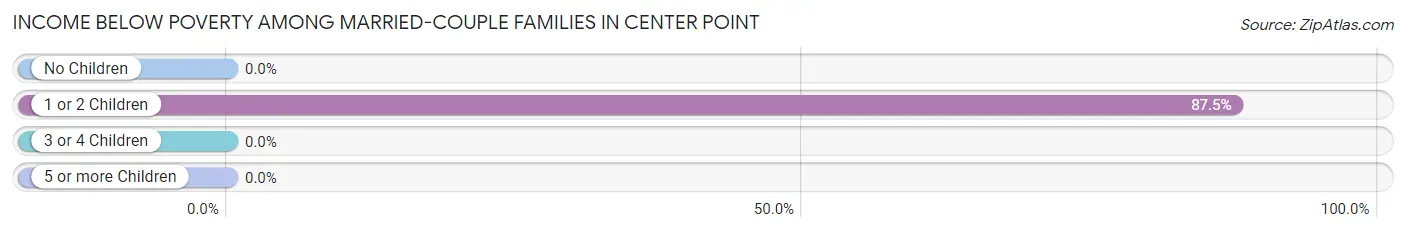
Income Below Poverty Among Married-Couple Families in Center Point
The poverty statistics for married-couple families in Center Point show that 61.6% or 98 of the total 159 families live below the poverty line. Families with 1 or 2 children have the highest poverty rate of 87.5%, comprising of 98 families. On the other hand, families with no children have the lowest poverty rate of 0.0%, which includes 0 families.
| Children | Above Poverty | Below Poverty |
| No Children | 37 (100.0%) | 0 (0.0%) |
| 1 or 2 Children | 14 (12.5%) | 98 (87.5%) |
| 3 or 4 Children | 10 (100.0%) | 0 (0.0%) |
| 5 or more Children | 0 (0.0%) | 0 (0.0%) |
| Total | 61 (38.4%) | 98 (61.6%) |
Income Below Poverty Among Single-Parent Households in Center Point
| Children | Single Father | Single Mother |
| No Children | 0 (0.0%) | 0 (0.0%) |
| 1 or 2 Children | 0 (0.0%) | 0 (0.0%) |
| 3 or 4 Children | 0 (0.0%) | 0 (0.0%) |
| 5 or more Children | 0 (0.0%) | 0 (0.0%) |
| Total | 0 (0.0%) | 0 (0.0%) |
Income Below Poverty Among Married-Couple vs Single-Parent Households in Center Point
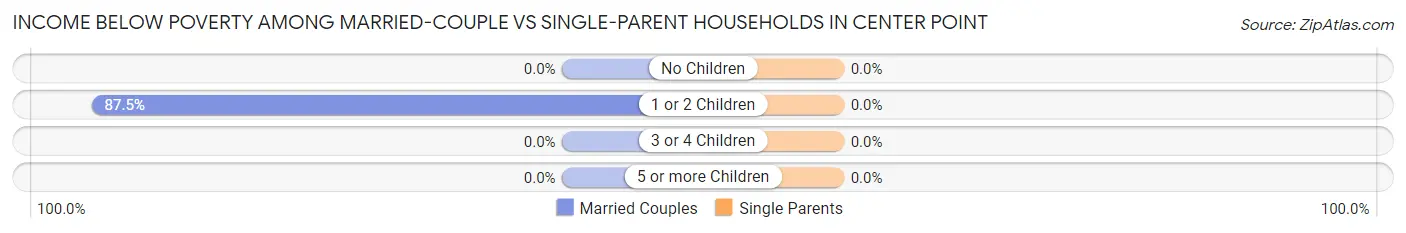
| Children | Married-Couple Families | Single-Parent Households |
| No Children | 0 (0.0%) | 0 (0.0%) |
| 1 or 2 Children | 98 (87.5%) | 0 (0.0%) |
| 3 or 4 Children | 0 (0.0%) | 0 (0.0%) |
| 5 or more Children | 0 (0.0%) | 0 (0.0%) |
| Total | 98 (61.6%) | 0 (0.0%) |
Race in Center Point
The most populous races in Center Point are White / Caucasian (689 | 85.4%), Two or more Races (112 | 13.9%), and Asian (6 | 0.7%).
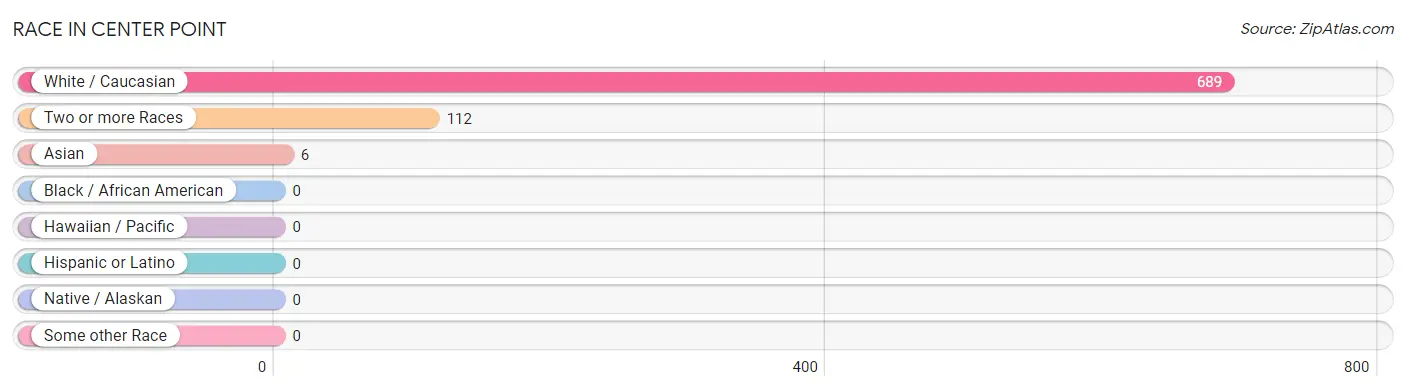
| Race | # Population | % Population |
| Asian | 6 | 0.7% |
| Black / African American | 0 | 0.0% |
| Hawaiian / Pacific | 0 | 0.0% |
| Hispanic or Latino | 0 | 0.0% |
| Native / Alaskan | 0 | 0.0% |
| White / Caucasian | 689 | 85.4% |
| Two or more Races | 112 | 13.9% |
| Some other Race | 0 | 0.0% |
| Total | 807 | 100.0% |
Ancestry in Center Point
The most populous ancestries reported in Center Point are French (154 | 19.1%), American (120 | 14.9%), English (17 | 2.1%), German (10 | 1.2%), and Cajun (8 | 1.0%), together accounting for 38.3% of all Center Point residents.
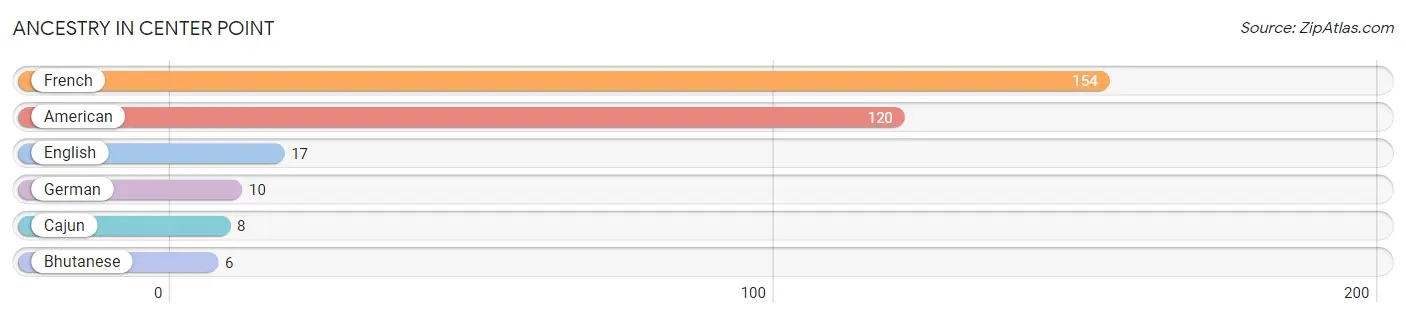
| Ancestry | # Population | % Population |
| American | 120 | 14.9% |
| Bhutanese | 6 | 0.7% |
| Cajun | 8 | 1.0% |
| English | 17 | 2.1% |
| French | 154 | 19.1% |
| German | 10 | 1.2% | View All 6 Rows |
Immigrants in Center Point

| Immigration Origin | # Population | % Population | View All 0 Rows |
Sex and Age in Center Point
Sex and Age in Center Point
The most populous age groups in Center Point are 15 to 19 Years (141 | 31.5%) for men and 50 to 54 Years (67 | 18.6%) for women.
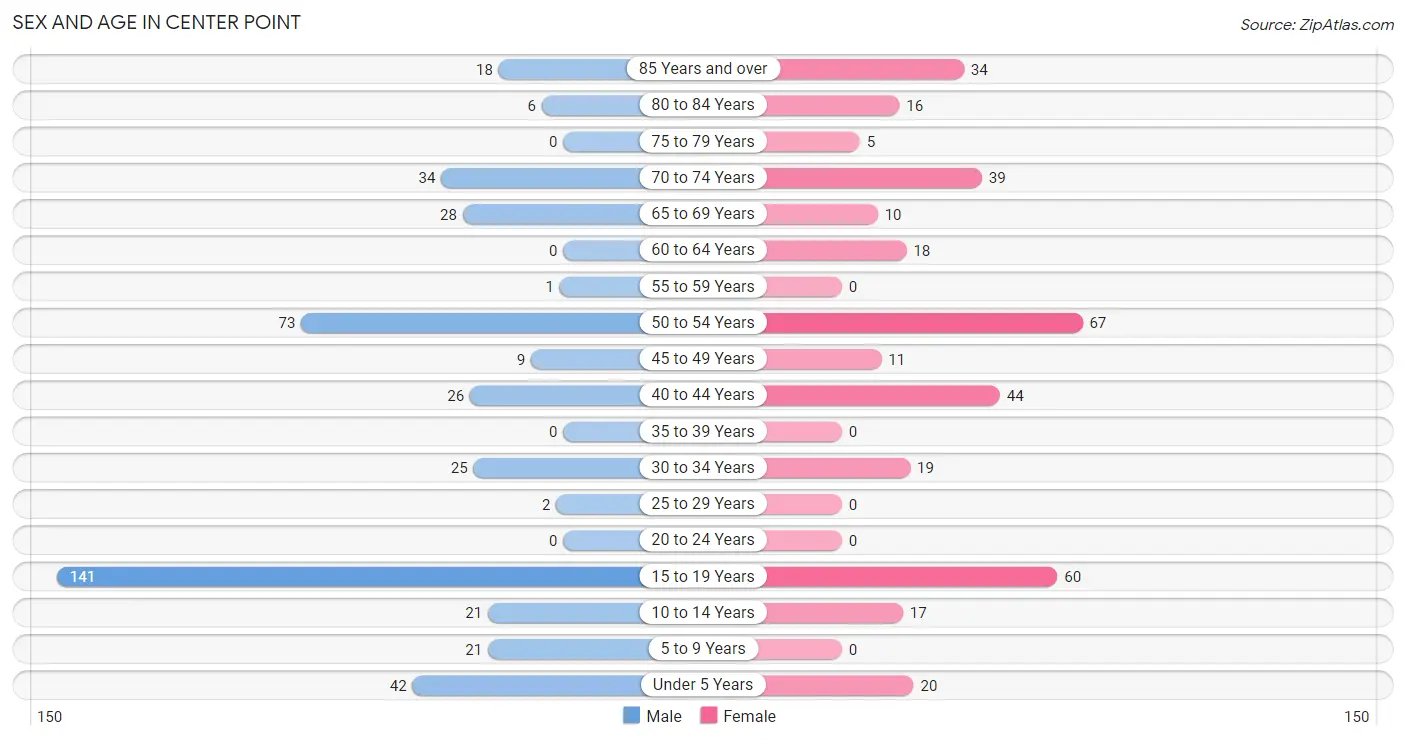
| Age Bracket | Male | Female |
| Under 5 Years | 42 (9.4%) | 20 (5.6%) |
| 5 to 9 Years | 21 (4.7%) | 0 (0.0%) |
| 10 to 14 Years | 21 (4.7%) | 17 (4.7%) |
| 15 to 19 Years | 141 (31.5%) | 60 (16.7%) |
| 20 to 24 Years | 0 (0.0%) | 0 (0.0%) |
| 25 to 29 Years | 2 (0.4%) | 0 (0.0%) |
| 30 to 34 Years | 25 (5.6%) | 19 (5.3%) |
| 35 to 39 Years | 0 (0.0%) | 0 (0.0%) |
| 40 to 44 Years | 26 (5.8%) | 44 (12.2%) |
| 45 to 49 Years | 9 (2.0%) | 11 (3.1%) |
| 50 to 54 Years | 73 (16.3%) | 67 (18.6%) |
| 55 to 59 Years | 1 (0.2%) | 0 (0.0%) |
| 60 to 64 Years | 0 (0.0%) | 18 (5.0%) |
| 65 to 69 Years | 28 (6.3%) | 10 (2.8%) |
| 70 to 74 Years | 34 (7.6%) | 39 (10.8%) |
| 75 to 79 Years | 0 (0.0%) | 5 (1.4%) |
| 80 to 84 Years | 6 (1.3%) | 16 (4.4%) |
| 85 Years and over | 18 (4.0%) | 34 (9.4%) |
| Total | 447 (100.0%) | 360 (100.0%) |
Families and Households in Center Point
Median Family Size in Center Point
The median family size in Center Point is 3.74 persons per family, with single male/father families (10 | 5.7%) accounting for the largest median family size of 5.8 persons per family. On the other hand, single female/mother families (8 | 4.5%) represent the smallest median family size with 3.00 persons per family.
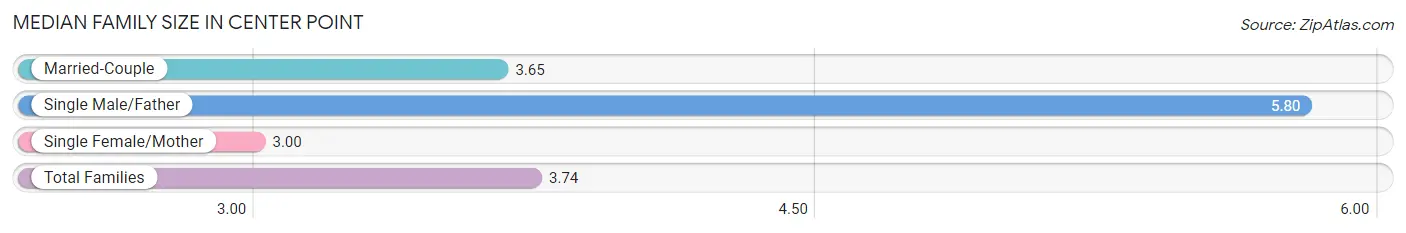
| Family Type | # Families | Family Size |
| Married-Couple | 159 (89.8%) | 3.65 |
| Single Male/Father | 10 (5.7%) | 5.80 |
| Single Female/Mother | 8 (4.5%) | 3.00 |
| Total Families | 177 (100.0%) | 3.74 |
Median Household Size in Center Point
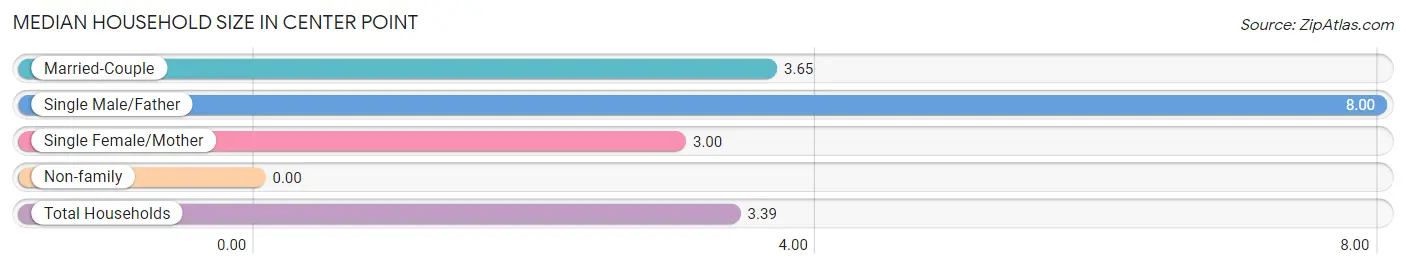
| Household Type | # Households | Household Size |
| Married-Couple | 159 (75.0%) | 3.65 |
| Single Male/Father | 10 (4.7%) | 8.00 |
| Single Female/Mother | 8 (3.8%) | 3.00 |
| Non-family | 35 (16.5%) | - |
| Total Households | 212 (100.0%) | 3.39 |
Household Size by Marriage Status in Center Point
Out of a total of 212 households in Center Point, 177 (83.5%) are family households, while 35 (16.5%) are nonfamily households. The most numerous type of family households are 3-person households, comprising 106, and the most common type of nonfamily households are 1-person households, comprising 35.
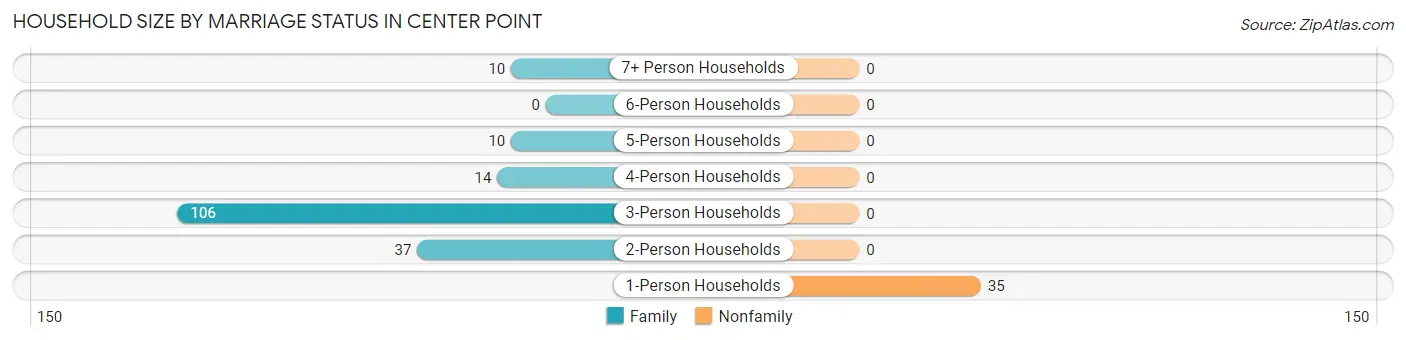
| Household Size | Family Households | Nonfamily Households |
| 1-Person Households | - | 35 (16.5%) |
| 2-Person Households | 37 (17.4%) | 0 (0.0%) |
| 3-Person Households | 106 (50.0%) | 0 (0.0%) |
| 4-Person Households | 14 (6.6%) | 0 (0.0%) |
| 5-Person Households | 10 (4.7%) | 0 (0.0%) |
| 6-Person Households | 0 (0.0%) | 0 (0.0%) |
| 7+ Person Households | 10 (4.7%) | 0 (0.0%) |
| Total | 177 (83.5%) | 35 (16.5%) |
Female Fertility in Center Point
Fertility by Age in Center Point
Average fertility rate in Center Point is 75.0 births per 1,000 women. Women in the age bracket of 20 to 34 years have the highest fertility rate with 526.0 births per 1,000 women. Women in the age bracket of 20 to 34 years acount for 100.0% of all women with births.
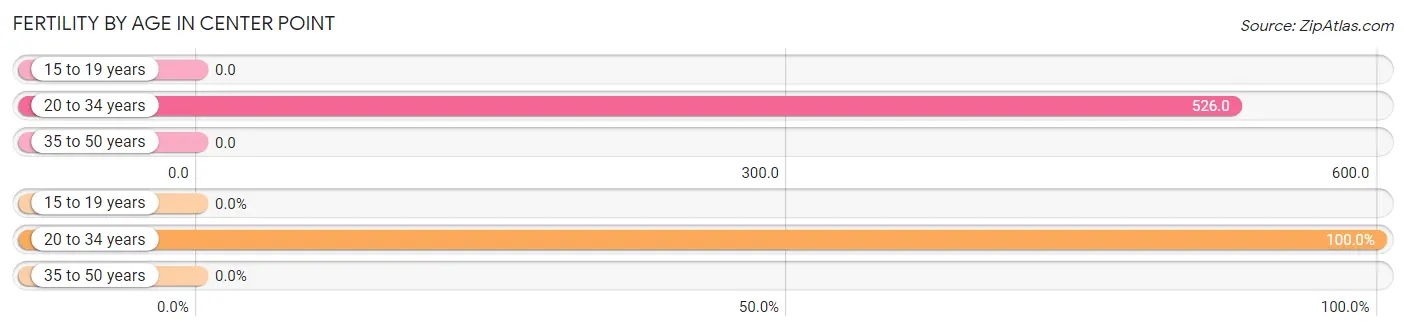
| Age Bracket | Women with Births | Births / 1,000 Women |
| 15 to 19 years | 0 (0.0%) | 0.0 |
| 20 to 34 years | 10 (100.0%) | 526.0 |
| 35 to 50 years | 0 (0.0%) | 0.0 |
| Total | 10 (100.0%) | 75.0 |
Fertility by Age by Marriage Status in Center Point
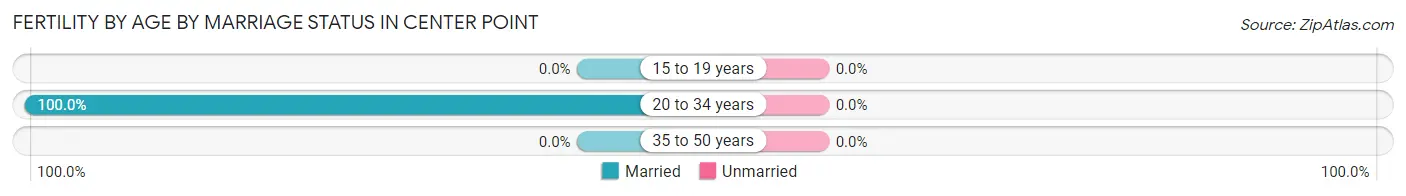
| Age Bracket | Married | Unmarried |
| 15 to 19 years | 0 (0.0%) | 0 (0.0%) |
| 20 to 34 years | 10 (100.0%) | 0 (0.0%) |
| 35 to 50 years | 0 (0.0%) | 0 (0.0%) |
| Total | 10 (100.0%) | 0 (0.0%) |
Fertility by Education in Center Point
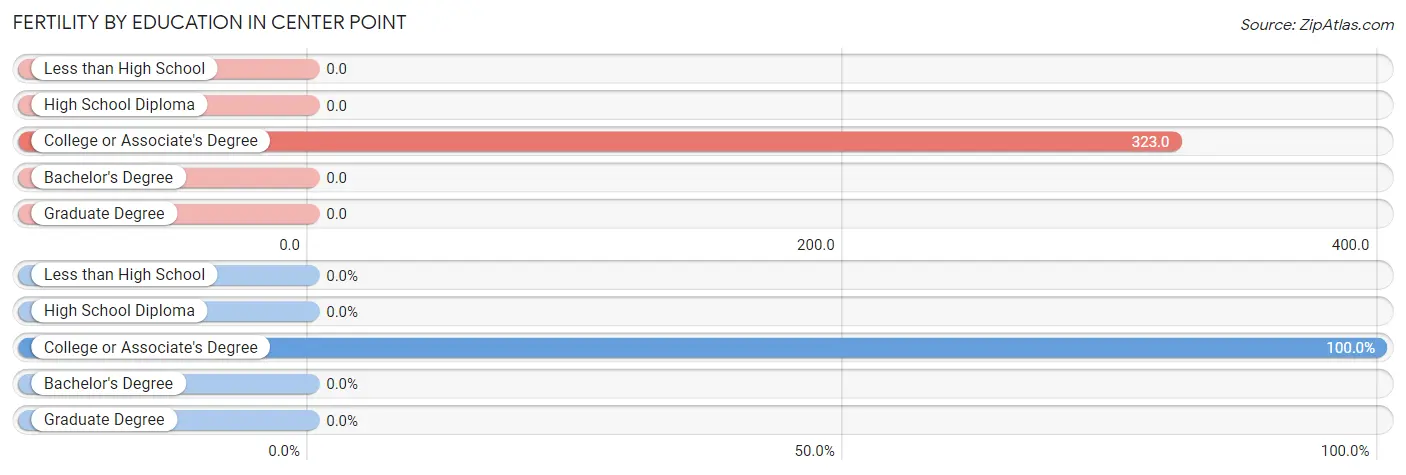
| Educational Attainment | Women with Births | Births / 1,000 Women |
| Less than High School | 0 (0.0%) | 0.0 |
| High School Diploma | 0 (0.0%) | 0.0 |
| College or Associate's Degree | 10 (100.0%) | 323.0 |
| Bachelor's Degree | 0 (0.0%) | 0.0 |
| Graduate Degree | 0 (0.0%) | 0.0 |
| Total | 10 (100.0%) | 75.0 |
Fertility by Education by Marriage Status in Center Point
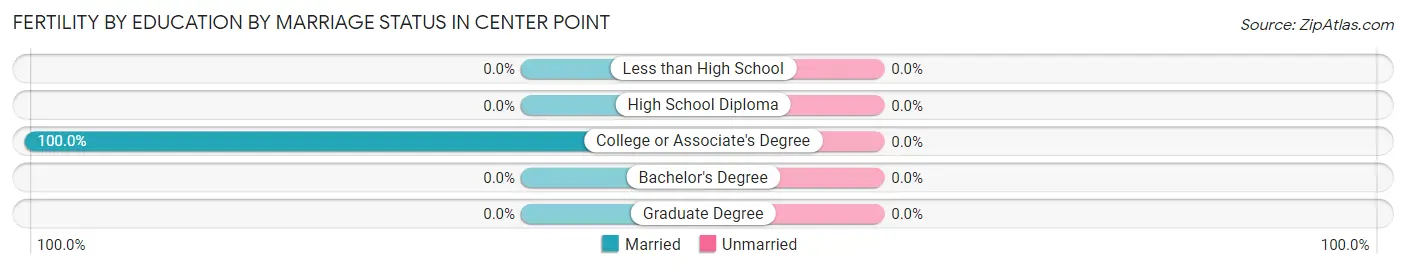
| Educational Attainment | Married | Unmarried |
| Less than High School | 0 (0.0%) | 0 (0.0%) |
| High School Diploma | 0 (0.0%) | 0 (0.0%) |
| College or Associate's Degree | 10 (100.0%) | 0 (0.0%) |
| Bachelor's Degree | 0 (0.0%) | 0 (0.0%) |
| Graduate Degree | 0 (0.0%) | 0 (0.0%) |
| Total | 10 (100.0%) | 0 (0.0%) |
Employment Characteristics in Center Point
Employment by Class of Employer in Center Point
Among the 283 employed individuals in Center Point, self-employed (not incorporated) (73 | 25.8%), self-employed (incorporated) (67 | 23.7%), and private company employees (56 | 19.8%) make up the most common classes of employment.
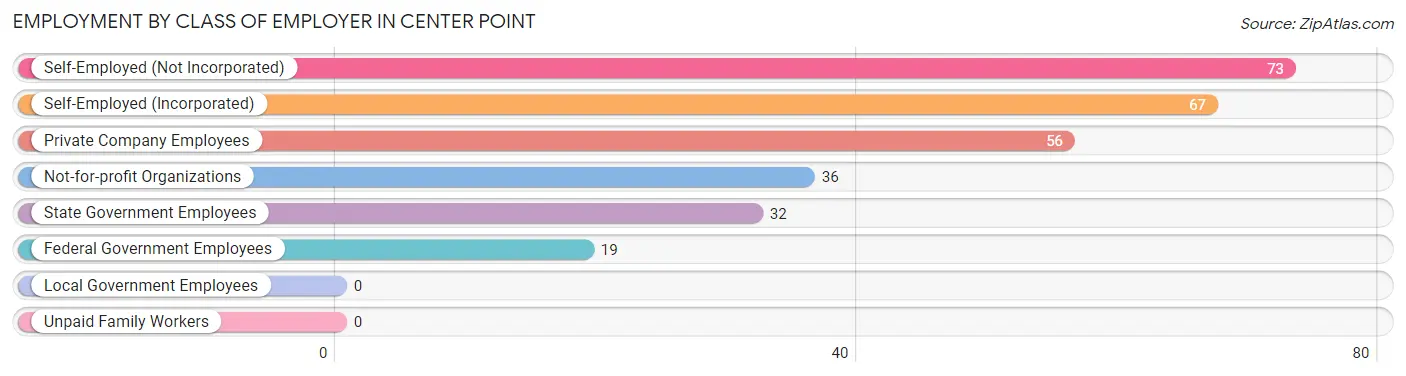
| Employer Class | # Employees | % Employees |
| Private Company Employees | 56 | 19.8% |
| Self-Employed (Incorporated) | 67 | 23.7% |
| Self-Employed (Not Incorporated) | 73 | 25.8% |
| Not-for-profit Organizations | 36 | 12.7% |
| Local Government Employees | 0 | 0.0% |
| State Government Employees | 32 | 11.3% |
| Federal Government Employees | 19 | 6.7% |
| Unpaid Family Workers | 0 | 0.0% |
| Total | 283 | 100.0% |
Employment Status by Age in Center Point
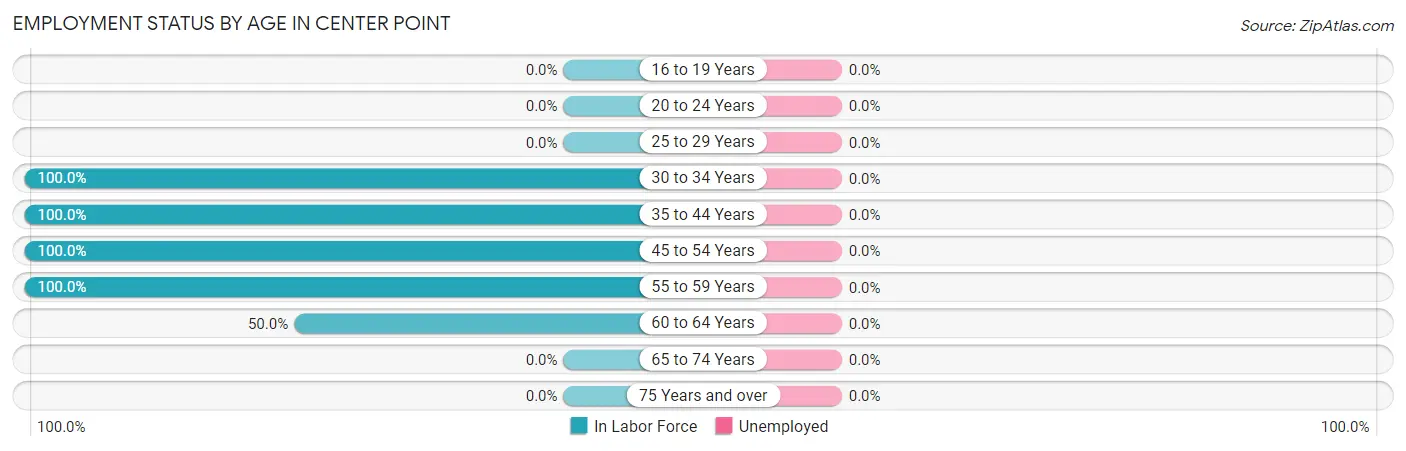
| Age Bracket | In Labor Force | Unemployed |
| 16 to 19 Years | 0 (0.0%) | 0 (0.0%) |
| 20 to 24 Years | 0 (0.0%) | 0 (0.0%) |
| 25 to 29 Years | 0 (0.0%) | 0 (0.0%) |
| 30 to 34 Years | 44 (100.0%) | 0 (0.0%) |
| 35 to 44 Years | 70 (100.0%) | 0 (0.0%) |
| 45 to 54 Years | 160 (100.0%) | 0 (0.0%) |
| 55 to 59 Years | 1 (100.0%) | 0 (0.0%) |
| 60 to 64 Years | 9 (50.0%) | 0 (0.0%) |
| 65 to 74 Years | 0 (0.0%) | 0 (0.0%) |
| 75 Years and over | 0 (0.0%) | 0 (0.0%) |
| Total | 284 (52.1%) | 0 (0.0%) |
Employment Status by Educational Attainment in Center Point
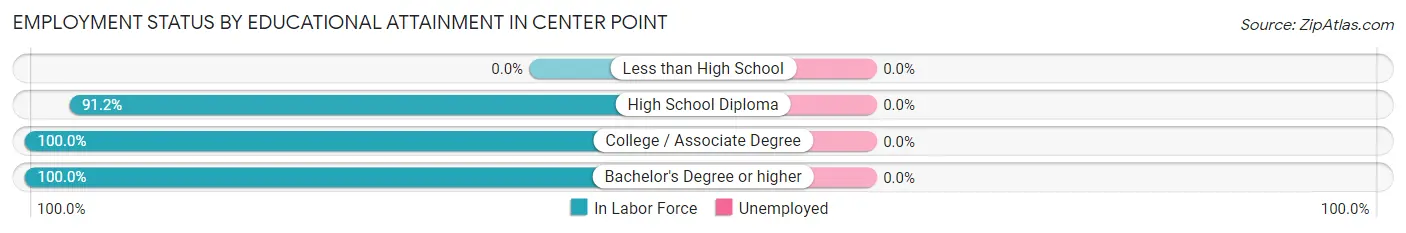
| Educational Attainment | In Labor Force | Unemployed |
| Less than High School | 0 (0.0%) | 0 (0.0%) |
| High School Diploma | 114 (91.2%) | 0 (0.0%) |
| College / Associate Degree | 108 (100.0%) | 0 (0.0%) |
| Bachelor's Degree or higher | 62 (100.0%) | 0 (0.0%) |
| Total | 284 (96.3%) | 0 (0.0%) |
Employment Occupations by Sex in Center Point
Management, Business, Science and Arts Occupations
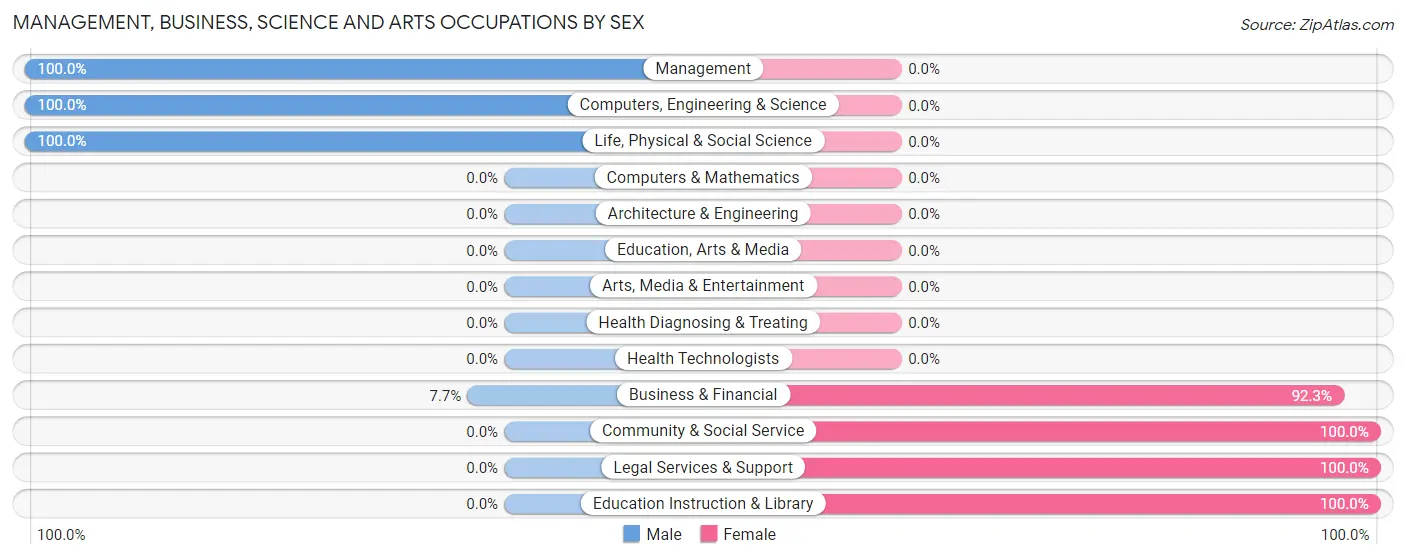
The most common Management, Business, Science and Arts occupations in Center Point are Management (88 | 32.1%), Community & Social Service (41 | 15.0%), Education Instruction & Library (32 | 11.7%), Computers, Engineering & Science (14 | 5.1%), and Life, Physical & Social Science (14 | 5.1%).
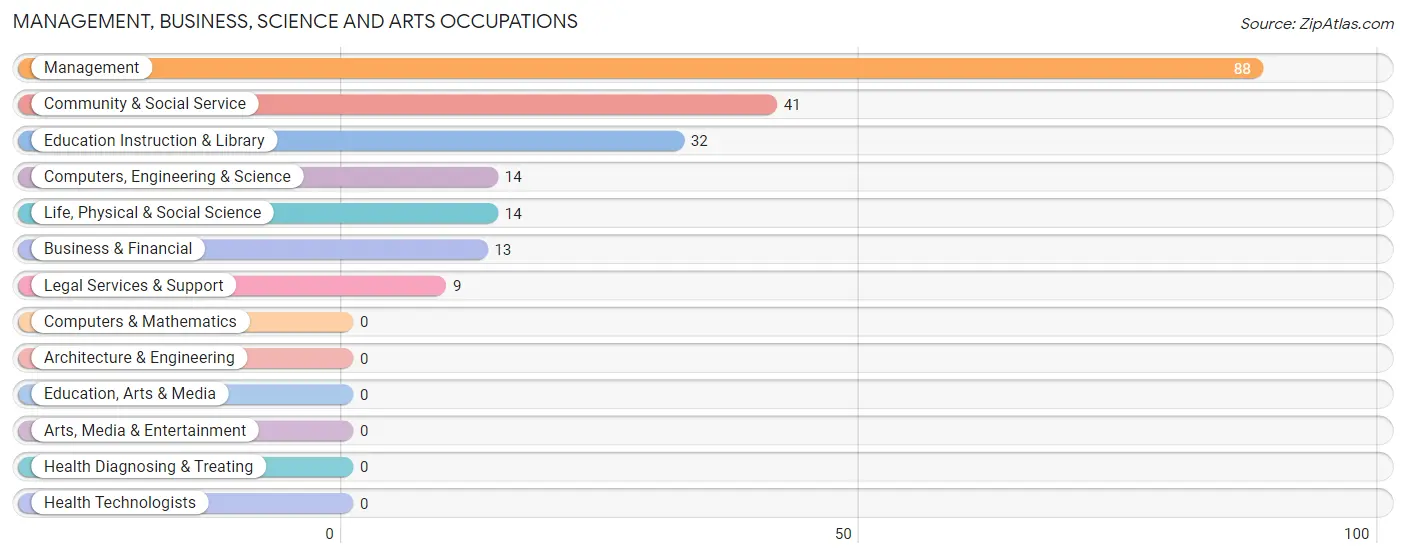
Management, Business, Science and Arts Occupations by Sex
Within the Management, Business, Science and Arts occupations in Center Point, the most male-oriented occupations are Management (100.0%), Computers, Engineering & Science (100.0%), and Life, Physical & Social Science (100.0%), while the most female-oriented occupations are Community & Social Service (100.0%), Legal Services & Support (100.0%), and Education Instruction & Library (100.0%).
| Occupation | Male | Female |
| Management | 88 (100.0%) | 0 (0.0%) |
| Business & Financial | 1 (7.7%) | 12 (92.3%) |
| Computers, Engineering & Science | 14 (100.0%) | 0 (0.0%) |
| Computers & Mathematics | 0 (0.0%) | 0 (0.0%) |
| Architecture & Engineering | 0 (0.0%) | 0 (0.0%) |
| Life, Physical & Social Science | 14 (100.0%) | 0 (0.0%) |
| Community & Social Service | 0 (0.0%) | 41 (100.0%) |
| Education, Arts & Media | 0 (0.0%) | 0 (0.0%) |
| Legal Services & Support | 0 (0.0%) | 9 (100.0%) |
| Education Instruction & Library | 0 (0.0%) | 32 (100.0%) |
| Arts, Media & Entertainment | 0 (0.0%) | 0 (0.0%) |
| Health Diagnosing & Treating | 0 (0.0%) | 0 (0.0%) |
| Health Technologists | 0 (0.0%) | 0 (0.0%) |
| Total (Category) | 103 (66.0%) | 53 (34.0%) |
| Total (Overall) | 124 (45.3%) | 150 (54.7%) |
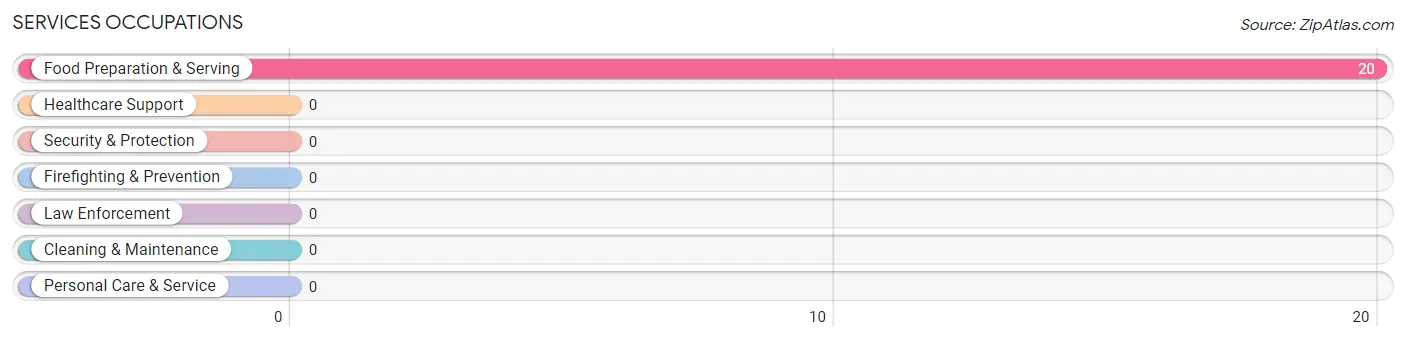
Services Occupations
The most common Services occupations in Center Point are , and Food Preparation & Serving (20 | 7.3%).
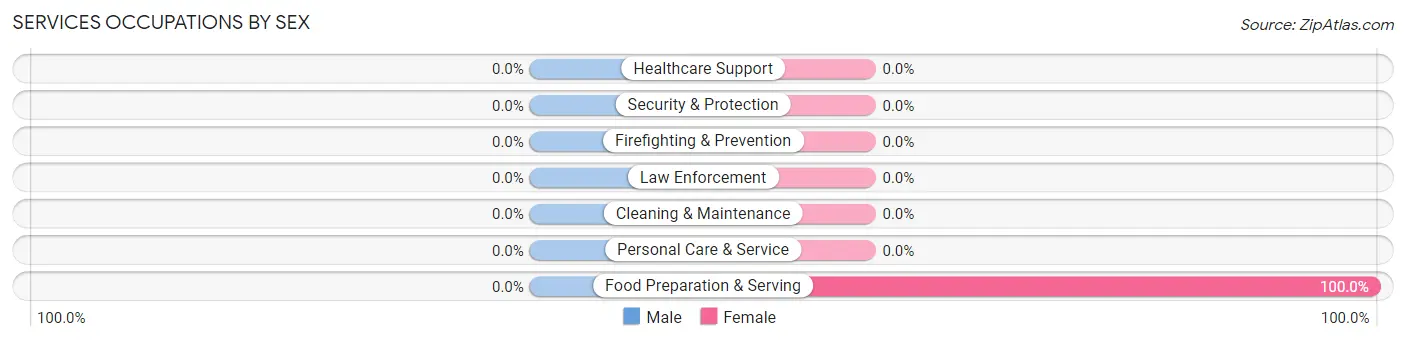
Services Occupations by Sex
| Occupation | Male | Female |
| Healthcare Support | 0 (0.0%) | 0 (0.0%) |
| Security & Protection | 0 (0.0%) | 0 (0.0%) |
| Firefighting & Prevention | 0 (0.0%) | 0 (0.0%) |
| Law Enforcement | 0 (0.0%) | 0 (0.0%) |
| Food Preparation & Serving | 0 (0.0%) | 20 (100.0%) |
| Cleaning & Maintenance | 0 (0.0%) | 0 (0.0%) |
| Personal Care & Service | 0 (0.0%) | 0 (0.0%) |
| Total (Category) | 0 (0.0%) | 20 (100.0%) |
| Total (Overall) | 124 (45.3%) | 150 (54.7%) |
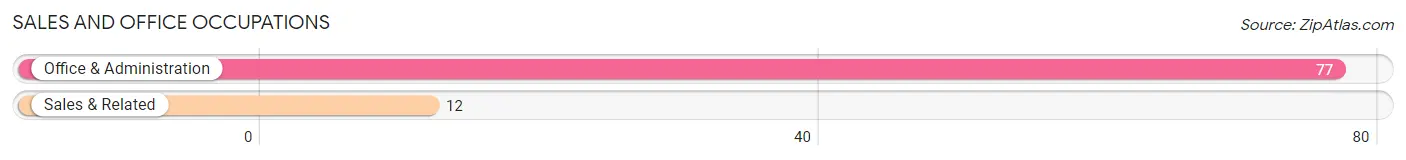
Sales and Office Occupations
The most common Sales and Office occupations in Center Point are Office & Administration (77 | 28.1%), and Sales & Related (12 | 4.4%).
Sales and Office Occupations by Sex
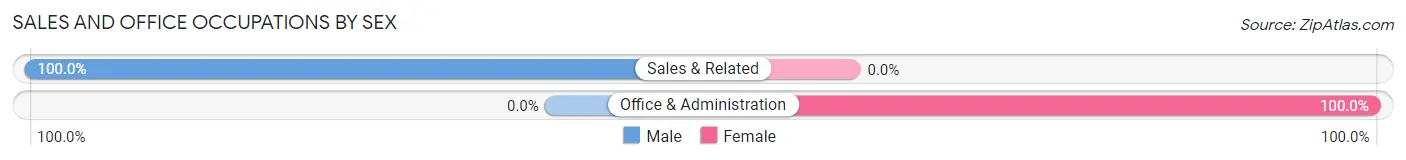
| Occupation | Male | Female |
| Sales & Related | 12 (100.0%) | 0 (0.0%) |
| Office & Administration | 0 (0.0%) | 77 (100.0%) |
| Total (Category) | 12 (13.5%) | 77 (86.5%) |
| Total (Overall) | 124 (45.3%) | 150 (54.7%) |
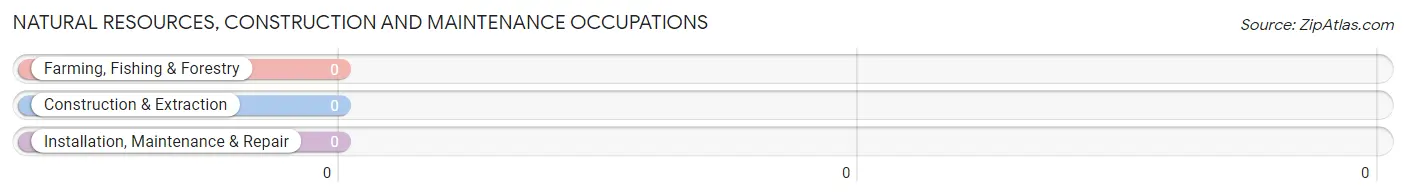
Natural Resources, Construction and Maintenance Occupations
Natural Resources, Construction and Maintenance Occupations by Sex
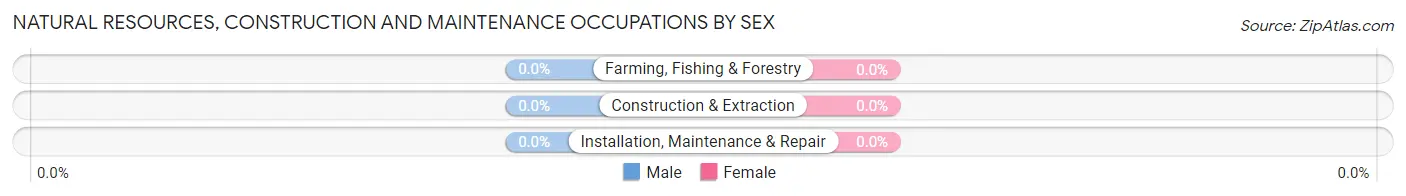
| Occupation | Male | Female |
| Farming, Fishing & Forestry | 0 (0.0%) | 0 (0.0%) |
| Construction & Extraction | 0 (0.0%) | 0 (0.0%) |
| Installation, Maintenance & Repair | 0 (0.0%) | 0 (0.0%) |
| Total (Category) | 0 (0.0%) | 0 (0.0%) |
| Total (Overall) | 124 (45.3%) | 150 (54.7%) |
Production, Transportation and Moving Occupations
The most common Production, Transportation and Moving occupations in Center Point are , and Production (9 | 3.3%).
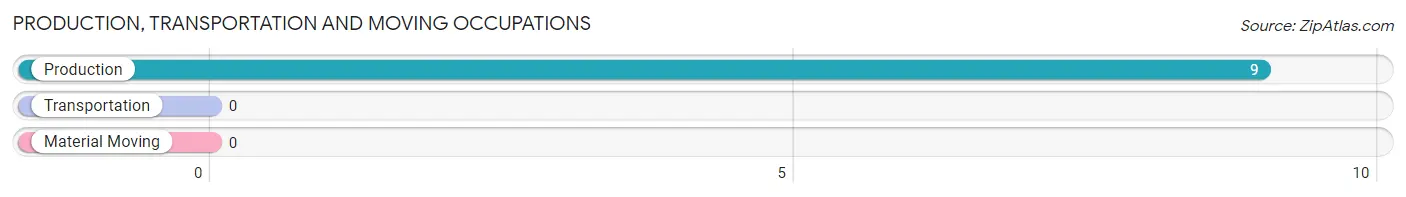
Production, Transportation and Moving Occupations by Sex
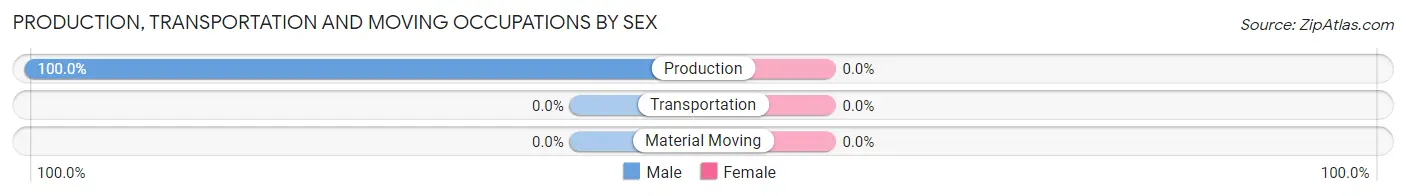
| Occupation | Male | Female |
| Production | 9 (100.0%) | 0 (0.0%) |
| Transportation | 0 (0.0%) | 0 (0.0%) |
| Material Moving | 0 (0.0%) | 0 (0.0%) |
| Total (Category) | 9 (100.0%) | 0 (0.0%) |
| Total (Overall) | 124 (45.3%) | 150 (54.7%) |
Employment Industries by Sex in Center Point
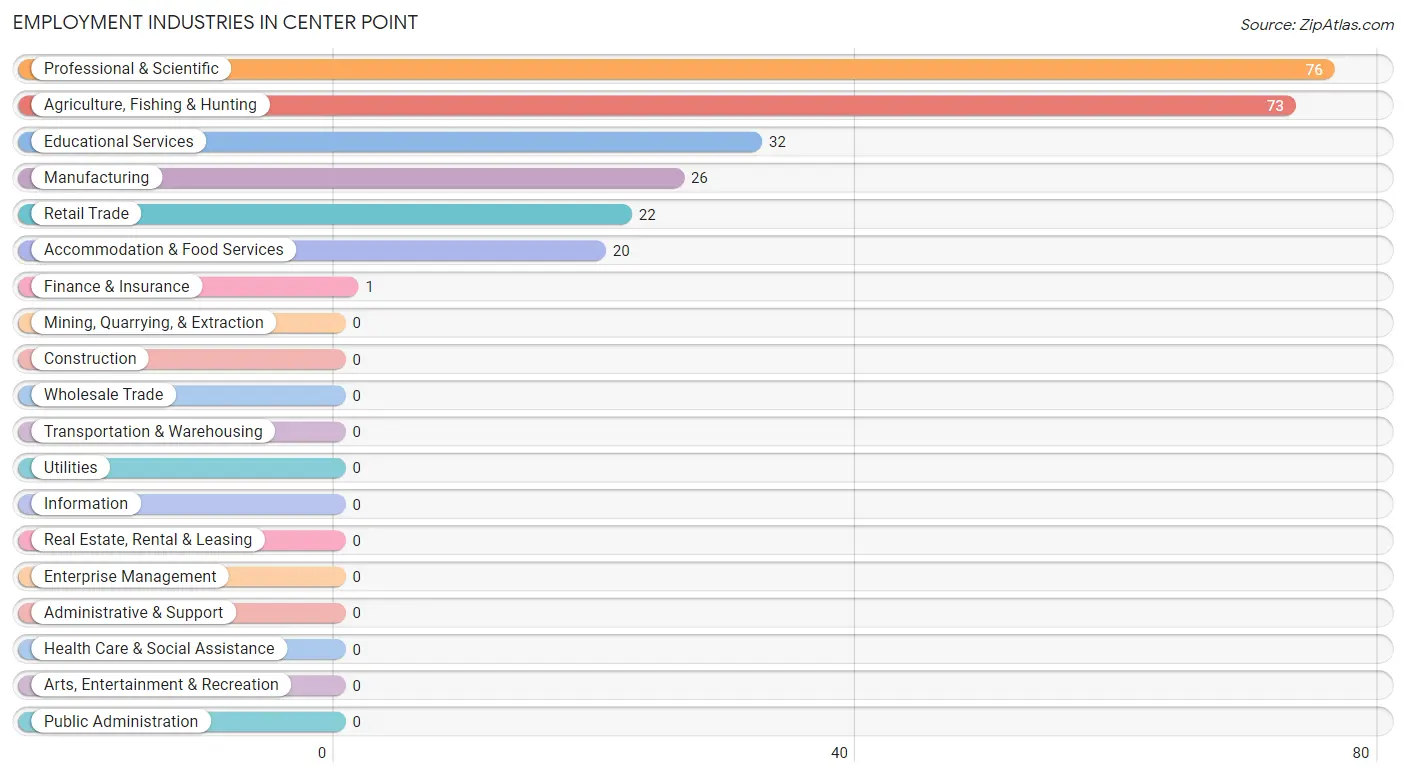
Employment Industries in Center Point
The major employment industries in Center Point include Professional & Scientific (76 | 27.7%), Agriculture, Fishing & Hunting (73 | 26.6%), Educational Services (32 | 11.7%), Manufacturing (26 | 9.5%), and Retail Trade (22 | 8.0%).
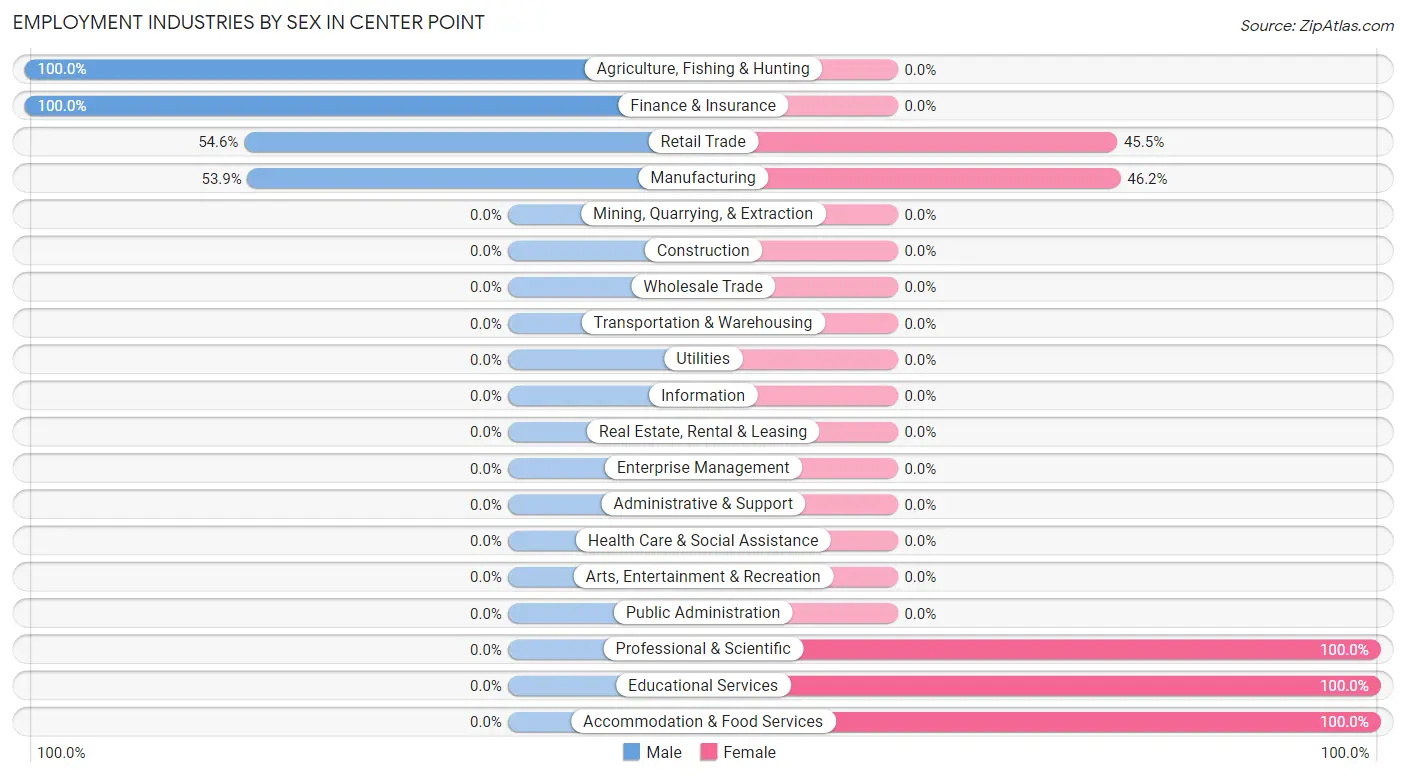
Employment Industries by Sex in Center Point
The Center Point industries that see more men than women are Agriculture, Fishing & Hunting (100.0%), Finance & Insurance (100.0%), and Retail Trade (54.5%), whereas the industries that tend to have a higher number of women are Professional & Scientific (100.0%), Educational Services (100.0%), and Accommodation & Food Services (100.0%).
| Industry | Male | Female |
| Agriculture, Fishing & Hunting | 73 (100.0%) | 0 (0.0%) |
| Mining, Quarrying, & Extraction | 0 (0.0%) | 0 (0.0%) |
| Construction | 0 (0.0%) | 0 (0.0%) |
| Manufacturing | 14 (53.8%) | 12 (46.2%) |
| Wholesale Trade | 0 (0.0%) | 0 (0.0%) |
| Retail Trade | 12 (54.5%) | 10 (45.5%) |
| Transportation & Warehousing | 0 (0.0%) | 0 (0.0%) |
| Utilities | 0 (0.0%) | 0 (0.0%) |
| Information | 0 (0.0%) | 0 (0.0%) |
| Finance & Insurance | 1 (100.0%) | 0 (0.0%) |
| Real Estate, Rental & Leasing | 0 (0.0%) | 0 (0.0%) |
| Professional & Scientific | 0 (0.0%) | 76 (100.0%) |
| Enterprise Management | 0 (0.0%) | 0 (0.0%) |
| Administrative & Support | 0 (0.0%) | 0 (0.0%) |
| Educational Services | 0 (0.0%) | 32 (100.0%) |
| Health Care & Social Assistance | 0 (0.0%) | 0 (0.0%) |
| Arts, Entertainment & Recreation | 0 (0.0%) | 0 (0.0%) |
| Accommodation & Food Services | 0 (0.0%) | 20 (100.0%) |
| Public Administration | 0 (0.0%) | 0 (0.0%) |
| Total | 124 (45.3%) | 150 (54.7%) |
Education in Center Point
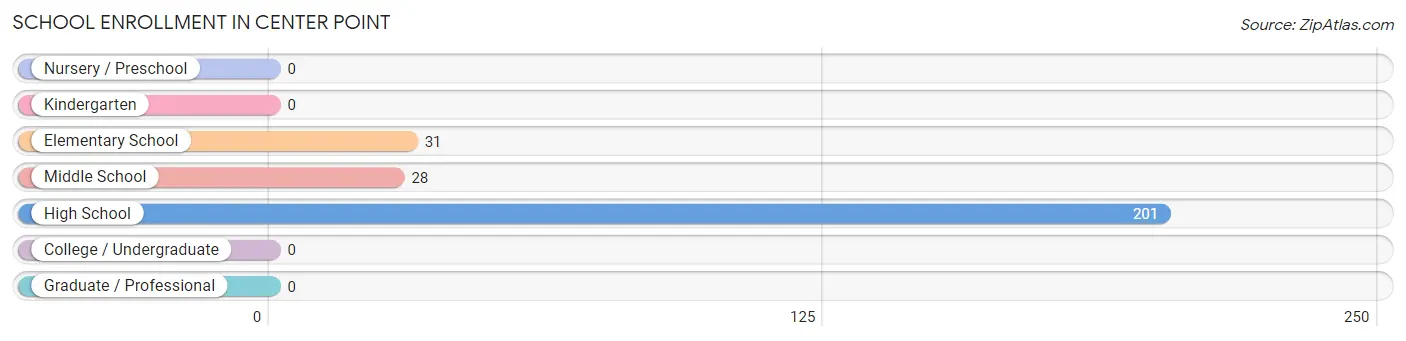
School Enrollment in Center Point
The most common levels of schooling among the 260 students in Center Point are high school (201 | 77.3%), elementary school (31 | 11.9%), and middle school (28 | 10.8%).
| School Level | # Students | % Students |
| Nursery / Preschool | 0 | 0.0% |
| Kindergarten | 0 | 0.0% |
| Elementary School | 31 | 11.9% |
| Middle School | 28 | 10.8% |
| High School | 201 | 77.3% |
| College / Undergraduate | 0 | 0.0% |
| Graduate / Professional | 0 | 0.0% |
| Total | 260 | 100.0% |
School Enrollment by Age by Funding Source in Center Point
Out of a total of 260 students who are enrolled in schools in Center Point, 141 (54.2%) attend a private institution, while the remaining 119 (45.8%) are enrolled in public schools. The age group of 15 to 17 year olds has the highest likelihood of being enrolled in private schools, with 141 (70.2% in the age bracket) enrolled. Conversely, the age group of 5 to 9 year old has the lowest likelihood of being enrolled in a private school, with 21 (100.0% in the age bracket) attending a public institution.
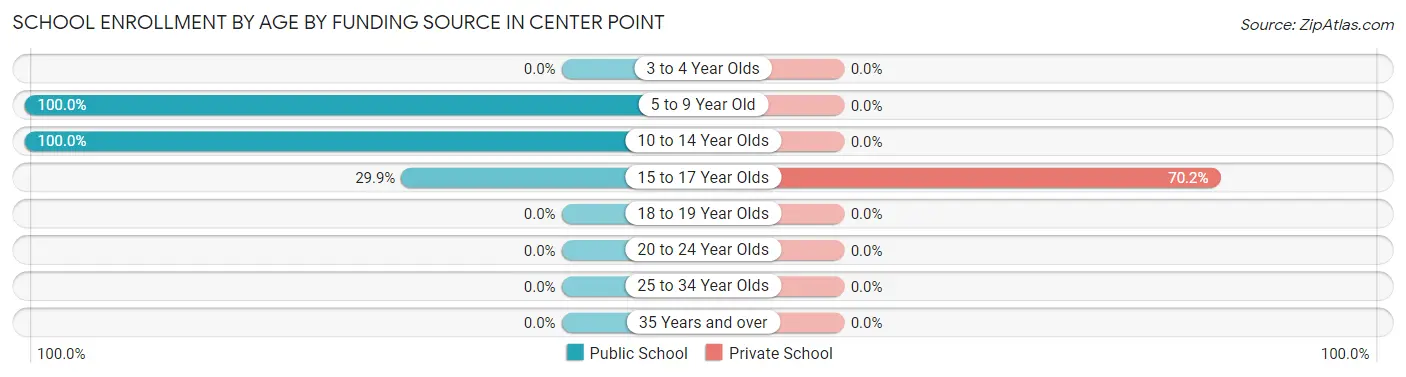
| Age Bracket | Public School | Private School |
| 3 to 4 Year Olds | 0 (0.0%) | 0 (0.0%) |
| 5 to 9 Year Old | 21 (100.0%) | 0 (0.0%) |
| 10 to 14 Year Olds | 38 (100.0%) | 0 (0.0%) |
| 15 to 17 Year Olds | 60 (29.8%) | 141 (70.2%) |
| 18 to 19 Year Olds | 0 (0.0%) | 0 (0.0%) |
| 20 to 24 Year Olds | 0 (0.0%) | 0 (0.0%) |
| 25 to 34 Year Olds | 0 (0.0%) | 0 (0.0%) |
| 35 Years and over | 0 (0.0%) | 0 (0.0%) |
| Total | 119 (45.8%) | 141 (54.2%) |
Educational Attainment by Field of Study in Center Point
Education (48 | 43.6%), psychology (15 | 13.6%), liberal arts & history (14 | 12.7%), arts & humanities (13 | 11.8%), and science & technology (10 | 9.1%) are the most common fields of study among 110 individuals in Center Point who have obtained a bachelor's degree or higher.
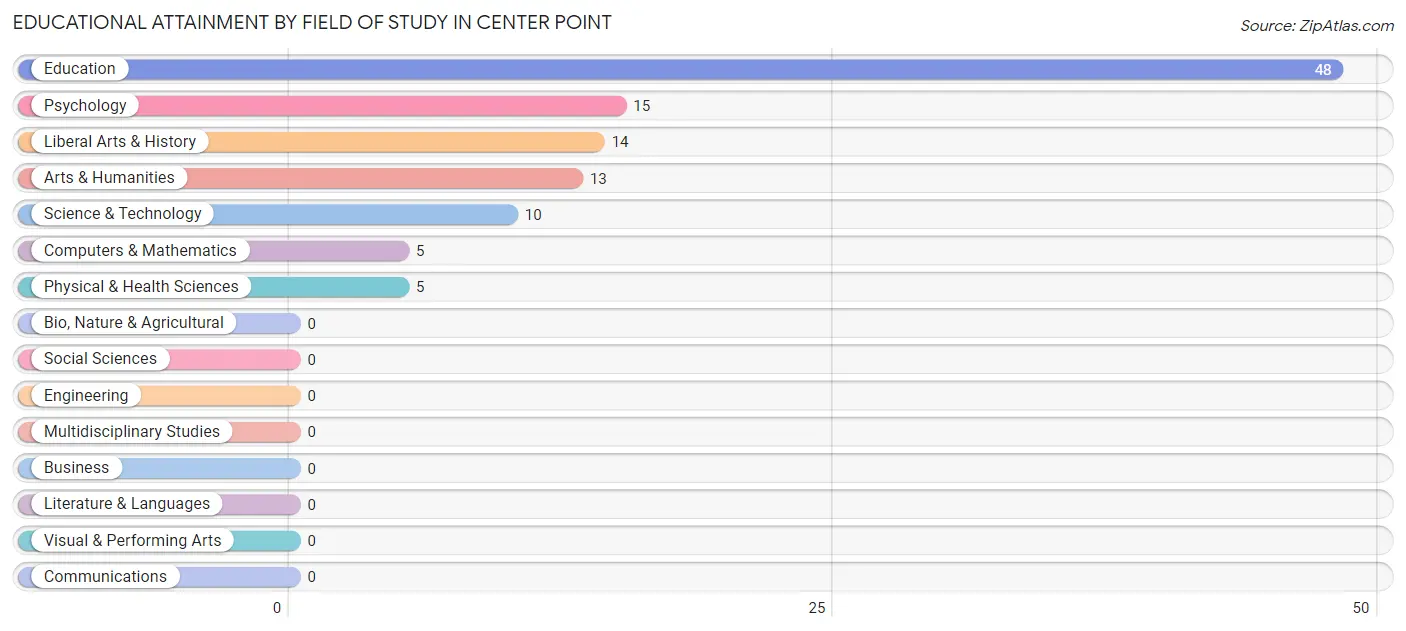
| Field of Study | # Graduates | % Graduates |
| Computers & Mathematics | 5 | 4.5% |
| Bio, Nature & Agricultural | 0 | 0.0% |
| Physical & Health Sciences | 5 | 4.5% |
| Psychology | 15 | 13.6% |
| Social Sciences | 0 | 0.0% |
| Engineering | 0 | 0.0% |
| Multidisciplinary Studies | 0 | 0.0% |
| Science & Technology | 10 | 9.1% |
| Business | 0 | 0.0% |
| Education | 48 | 43.6% |
| Literature & Languages | 0 | 0.0% |
| Liberal Arts & History | 14 | 12.7% |
| Visual & Performing Arts | 0 | 0.0% |
| Communications | 0 | 0.0% |
| Arts & Humanities | 13 | 11.8% |
| Total | 110 | 100.0% |
Transportation & Commute in Center Point
Vehicle Availability by Sex in Center Point
The most prevalent vehicle ownership categories in Center Point are males with 4 vehicles (73, accounting for 54.9%) and females with 4 vehicles (67, making up 48.7%).
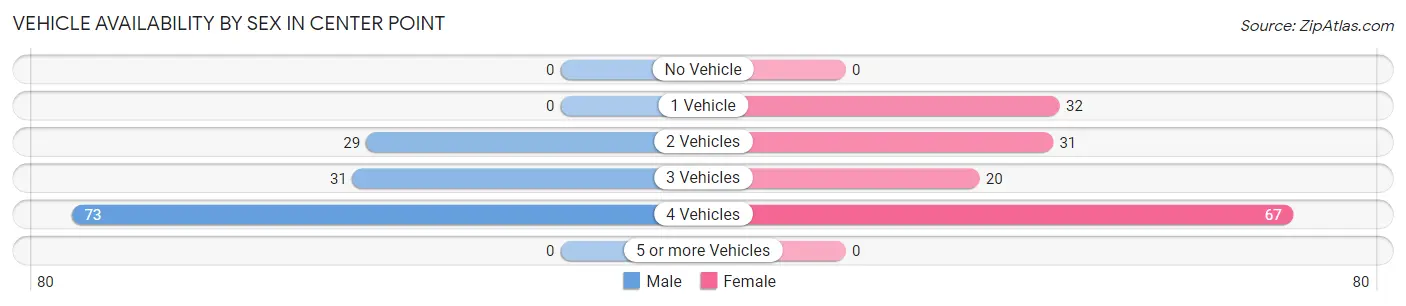
| Vehicles Available | Male | Female |
| No Vehicle | 0 (0.0%) | 0 (0.0%) |
| 1 Vehicle | 0 (0.0%) | 32 (21.3%) |
| 2 Vehicles | 29 (21.8%) | 31 (20.7%) |
| 3 Vehicles | 31 (23.3%) | 20 (13.3%) |
| 4 Vehicles | 73 (54.9%) | 67 (44.7%) |
| 5 or more Vehicles | 0 (0.0%) | 0 (0.0%) |
| Total | 133 (100.0%) | 150 (100.0%) |
Commute Time in Center Point
The most frequently occuring commute durations in Center Point are 30 to 34 minutes (185 commuters, 65.4%), 90 or more minutes (32 commuters, 11.3%), and 45 to 59 minutes (22 commuters, 7.8%).
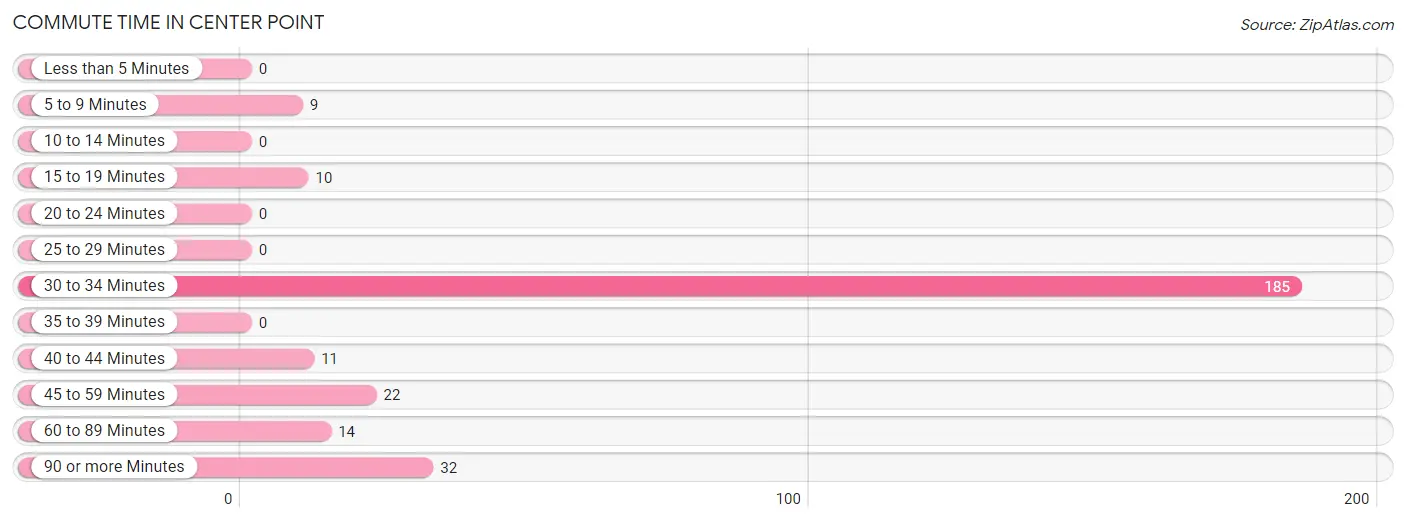
| Commute Time | # Commuters | % Commuters |
| Less than 5 Minutes | 0 | 0.0% |
| 5 to 9 Minutes | 9 | 3.2% |
| 10 to 14 Minutes | 0 | 0.0% |
| 15 to 19 Minutes | 10 | 3.5% |
| 20 to 24 Minutes | 0 | 0.0% |
| 25 to 29 Minutes | 0 | 0.0% |
| 30 to 34 Minutes | 185 | 65.4% |
| 35 to 39 Minutes | 0 | 0.0% |
| 40 to 44 Minutes | 11 | 3.9% |
| 45 to 59 Minutes | 22 | 7.8% |
| 60 to 89 Minutes | 14 | 5.0% |
| 90 or more Minutes | 32 | 11.3% |
Commute Time by Sex in Center Point
The most common commute times in Center Point are 30 to 34 minutes (97 commuters, 72.9%) for males and 30 to 34 minutes (88 commuters, 58.7%) for females.

| Commute Time | Male | Female |
| Less than 5 Minutes | 0 (0.0%) | 0 (0.0%) |
| 5 to 9 Minutes | 0 (0.0%) | 9 (6.0%) |
| 10 to 14 Minutes | 0 (0.0%) | 0 (0.0%) |
| 15 to 19 Minutes | 0 (0.0%) | 10 (6.7%) |
| 20 to 24 Minutes | 0 (0.0%) | 0 (0.0%) |
| 25 to 29 Minutes | 0 (0.0%) | 0 (0.0%) |
| 30 to 34 Minutes | 97 (72.9%) | 88 (58.7%) |
| 35 to 39 Minutes | 0 (0.0%) | 0 (0.0%) |
| 40 to 44 Minutes | 0 (0.0%) | 11 (7.3%) |
| 45 to 59 Minutes | 22 (16.5%) | 0 (0.0%) |
| 60 to 89 Minutes | 14 (10.5%) | 0 (0.0%) |
| 90 or more Minutes | 0 (0.0%) | 32 (21.3%) |
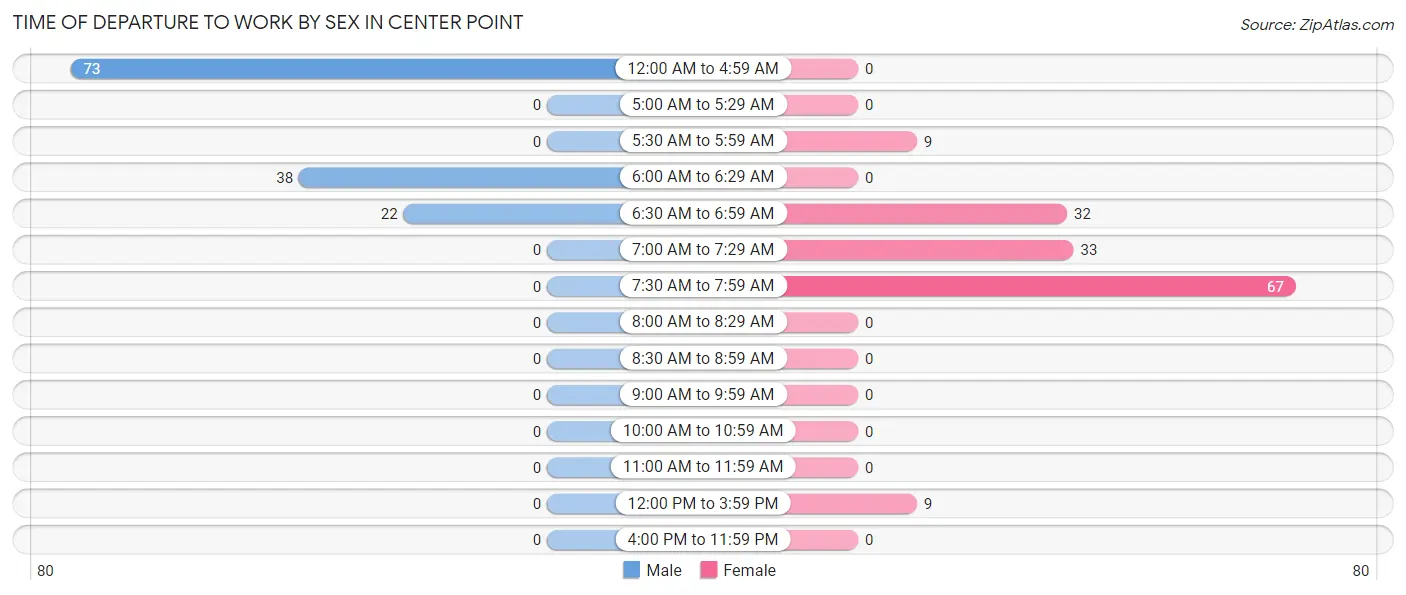
Time of Departure to Work by Sex in Center Point
The most frequent times of departure to work in Center Point are 12:00 AM to 4:59 AM (73, 54.9%) for males and 7:30 AM to 7:59 AM (67, 44.7%) for females.
| Time of Departure | Male | Female |
| 12:00 AM to 4:59 AM | 73 (54.9%) | 0 (0.0%) |
| 5:00 AM to 5:29 AM | 0 (0.0%) | 0 (0.0%) |
| 5:30 AM to 5:59 AM | 0 (0.0%) | 9 (6.0%) |
| 6:00 AM to 6:29 AM | 38 (28.6%) | 0 (0.0%) |
| 6:30 AM to 6:59 AM | 22 (16.5%) | 32 (21.3%) |
| 7:00 AM to 7:29 AM | 0 (0.0%) | 33 (22.0%) |
| 7:30 AM to 7:59 AM | 0 (0.0%) | 67 (44.7%) |
| 8:00 AM to 8:29 AM | 0 (0.0%) | 0 (0.0%) |
| 8:30 AM to 8:59 AM | 0 (0.0%) | 0 (0.0%) |
| 9:00 AM to 9:59 AM | 0 (0.0%) | 0 (0.0%) |
| 10:00 AM to 10:59 AM | 0 (0.0%) | 0 (0.0%) |
| 11:00 AM to 11:59 AM | 0 (0.0%) | 0 (0.0%) |
| 12:00 PM to 3:59 PM | 0 (0.0%) | 9 (6.0%) |
| 4:00 PM to 11:59 PM | 0 (0.0%) | 0 (0.0%) |
| Total | 133 (100.0%) | 150 (100.0%) |
Housing Occupancy in Center Point
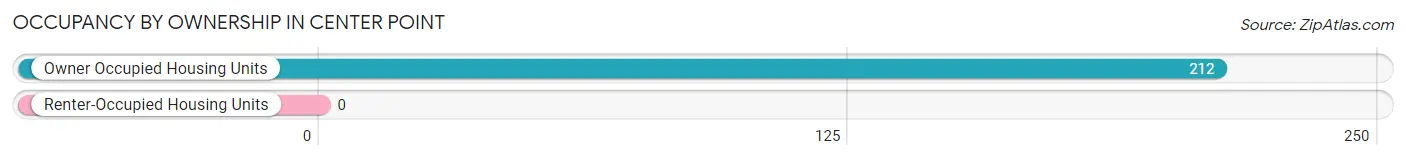
Occupancy by Ownership in Center Point
Of the total 212 dwellings in Center Point, owner-occupied units account for 212 (100.0%), while renter-occupied units make up 0 (0.0%).
| Occupancy | # Housing Units | % Housing Units |
| Owner Occupied Housing Units | 212 | 100.0% |
| Renter-Occupied Housing Units | 0 | 0.0% |
| Total Occupied Housing Units | 212 | 100.0% |
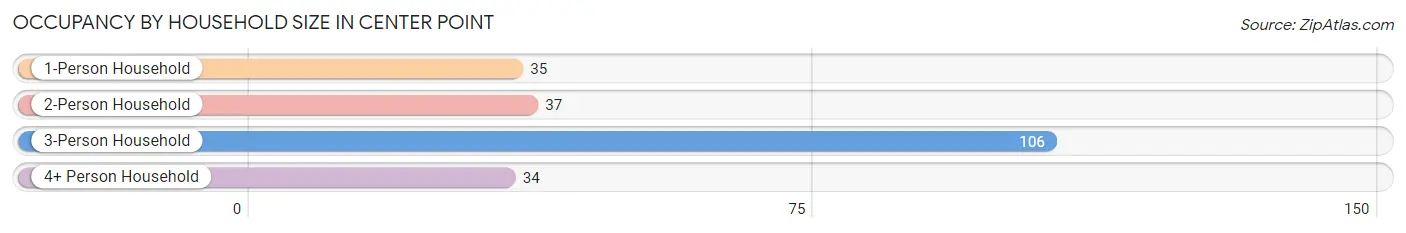
Occupancy by Household Size in Center Point
| Household Size | # Housing Units | % Housing Units |
| 1-Person Household | 35 | 16.5% |
| 2-Person Household | 37 | 17.4% |
| 3-Person Household | 106 | 50.0% |
| 4+ Person Household | 34 | 16.0% |
| Total Housing Units | 212 | 100.0% |
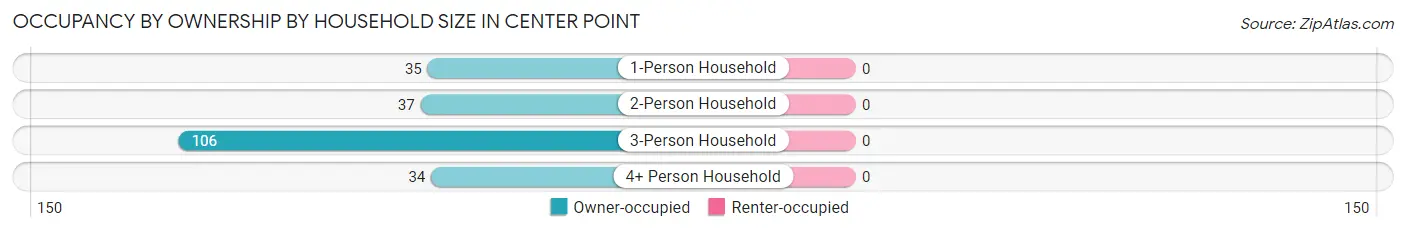
Occupancy by Ownership by Household Size in Center Point
| Household Size | Owner-occupied | Renter-occupied |
| 1-Person Household | 35 (100.0%) | 0 (0.0%) |
| 2-Person Household | 37 (100.0%) | 0 (0.0%) |
| 3-Person Household | 106 (100.0%) | 0 (0.0%) |
| 4+ Person Household | 34 (100.0%) | 0 (0.0%) |
| Total Housing Units | 212 (100.0%) | 0 (0.0%) |
Occupancy by Educational Attainment in Center Point
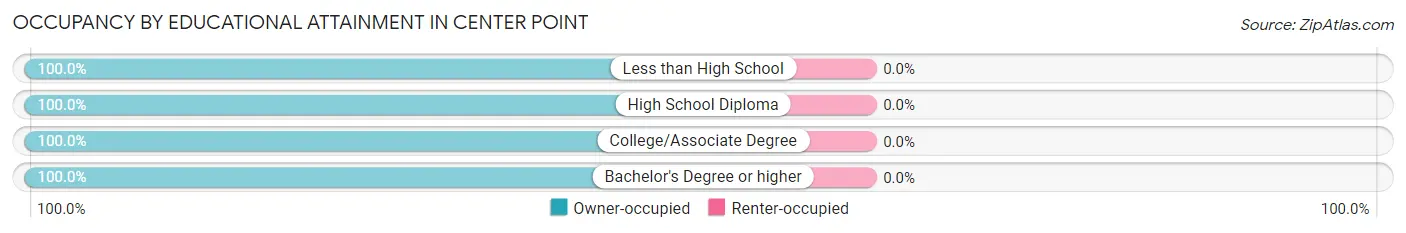
| Household Size | Owner-occupied | Renter-occupied |
| Less than High School | 35 (100.0%) | 0 (0.0%) |
| High School Diploma | 94 (100.0%) | 0 (0.0%) |
| College/Associate Degree | 20 (100.0%) | 0 (0.0%) |
| Bachelor's Degree or higher | 63 (100.0%) | 0 (0.0%) |
Occupancy by Age of Householder in Center Point
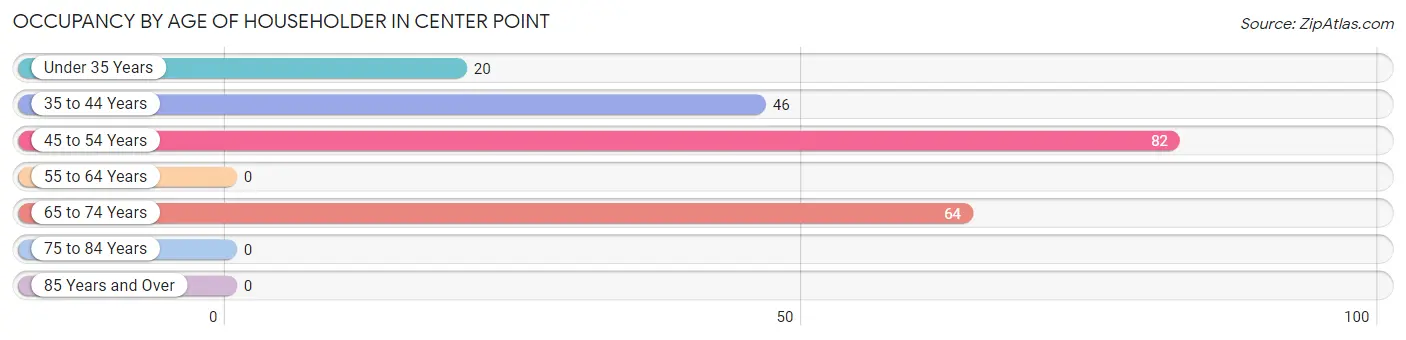
| Age Bracket | # Households | % Households |
| Under 35 Years | 20 | 9.4% |
| 35 to 44 Years | 46 | 21.7% |
| 45 to 54 Years | 82 | 38.7% |
| 55 to 64 Years | 0 | 0.0% |
| 65 to 74 Years | 64 | 30.2% |
| 75 to 84 Years | 0 | 0.0% |
| 85 Years and Over | 0 | 0.0% |
| Total | 212 | 100.0% |
Housing Finances in Center Point
Median Income by Occupancy in Center Point
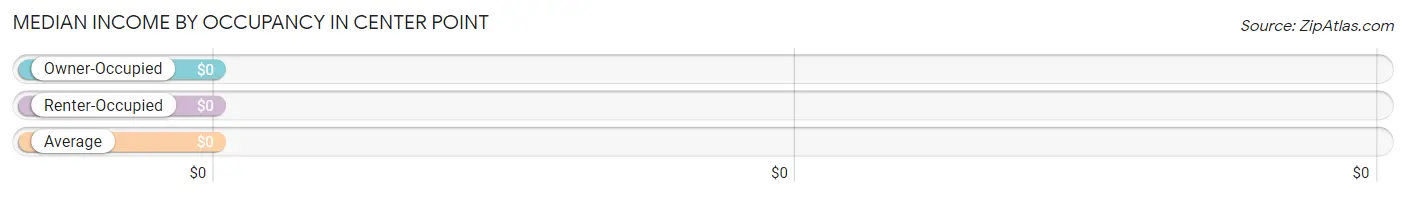
| Occupancy Type | # Households | Median Income |
| Owner-Occupied | 212 (100.0%) | $0 |
| Renter-Occupied | 0 (0.0%) | $0 |
| Average | 212 (100.0%) | $0 |
Occupancy by Householder Income Bracket in Center Point
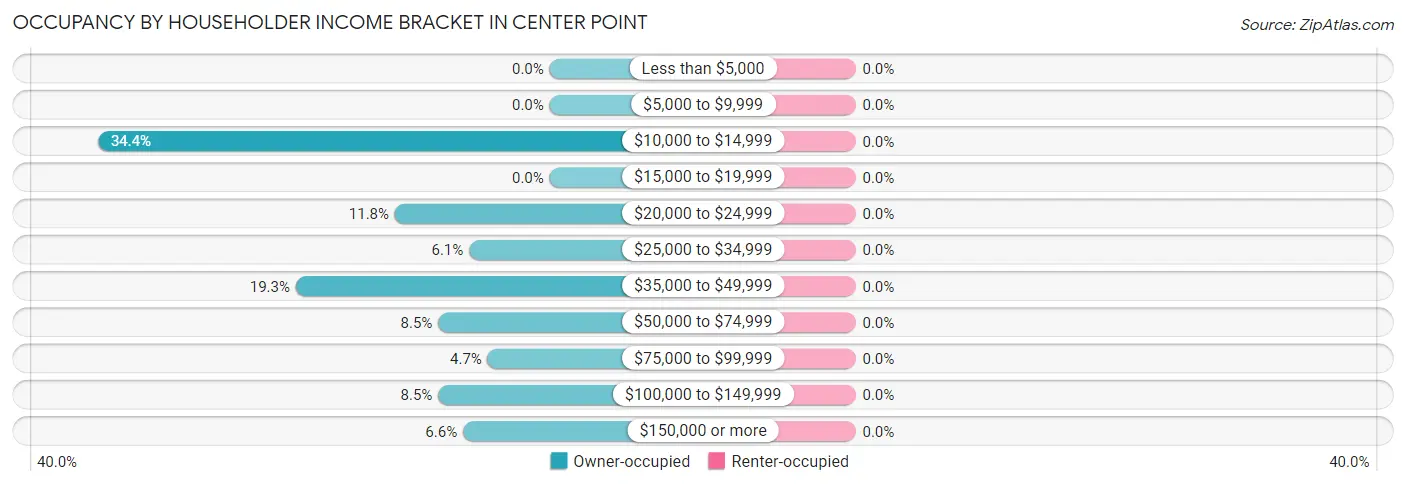
| Income Bracket | Owner-occupied | Renter-occupied |
| Less than $5,000 | 0 (0.0%) | 0 (0.0%) |
| $5,000 to $9,999 | 0 (0.0%) | 0 (0.0%) |
| $10,000 to $14,999 | 73 (34.4%) | 0 (0.0%) |
| $15,000 to $19,999 | 0 (0.0%) | 0 (0.0%) |
| $20,000 to $24,999 | 25 (11.8%) | 0 (0.0%) |
| $25,000 to $34,999 | 13 (6.1%) | 0 (0.0%) |
| $35,000 to $49,999 | 41 (19.3%) | 0 (0.0%) |
| $50,000 to $74,999 | 18 (8.5%) | 0 (0.0%) |
| $75,000 to $99,999 | 10 (4.7%) | 0 (0.0%) |
| $100,000 to $149,999 | 18 (8.5%) | 0 (0.0%) |
| $150,000 or more | 14 (6.6%) | 0 (0.0%) |
| Total | 212 (100.0%) | 0 (0.0%) |
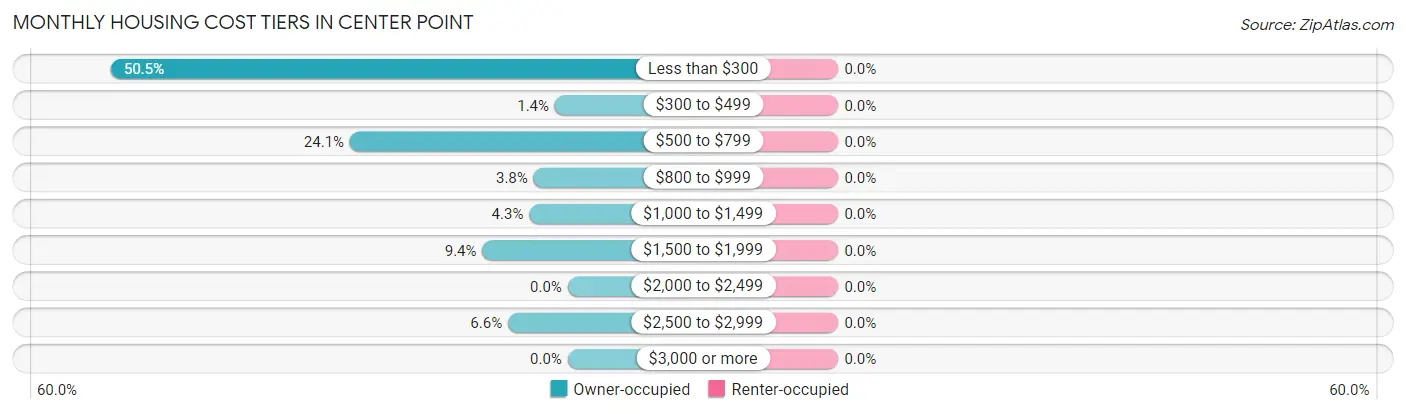
Monthly Housing Cost Tiers in Center Point
| Monthly Cost | Owner-occupied | Renter-occupied |
| Less than $300 | 107 (50.5%) | 0 (0.0%) |
| $300 to $499 | 3 (1.4%) | 0 (0.0%) |
| $500 to $799 | 51 (24.1%) | 0 (0.0%) |
| $800 to $999 | 8 (3.8%) | 0 (0.0%) |
| $1,000 to $1,499 | 9 (4.3%) | 0 (0.0%) |
| $1,500 to $1,999 | 20 (9.4%) | 0 (0.0%) |
| $2,000 to $2,499 | 0 (0.0%) | 0 (0.0%) |
| $2,500 to $2,999 | 14 (6.6%) | 0 (0.0%) |
| $3,000 or more | 0 (0.0%) | 0 (0.0%) |
| Total | 212 (100.0%) | 0 (0.0%) |
Physical Housing Characteristics in Center Point
Housing Structures in Center Point
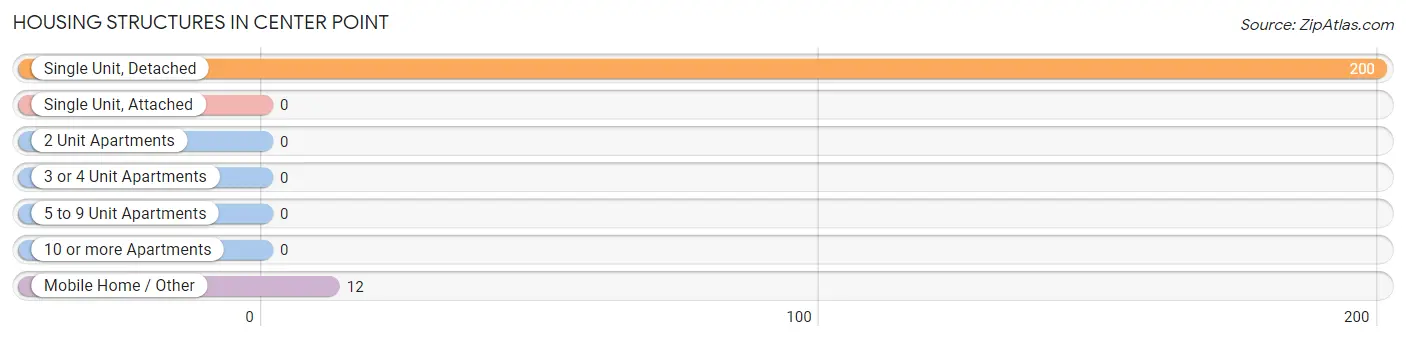
| Structure Type | # Housing Units | % Housing Units |
| Single Unit, Detached | 200 | 94.3% |
| Single Unit, Attached | 0 | 0.0% |
| 2 Unit Apartments | 0 | 0.0% |
| 3 or 4 Unit Apartments | 0 | 0.0% |
| 5 to 9 Unit Apartments | 0 | 0.0% |
| 10 or more Apartments | 0 | 0.0% |
| Mobile Home / Other | 12 | 5.7% |
| Total | 212 | 100.0% |
Housing Structures by Occupancy in Center Point
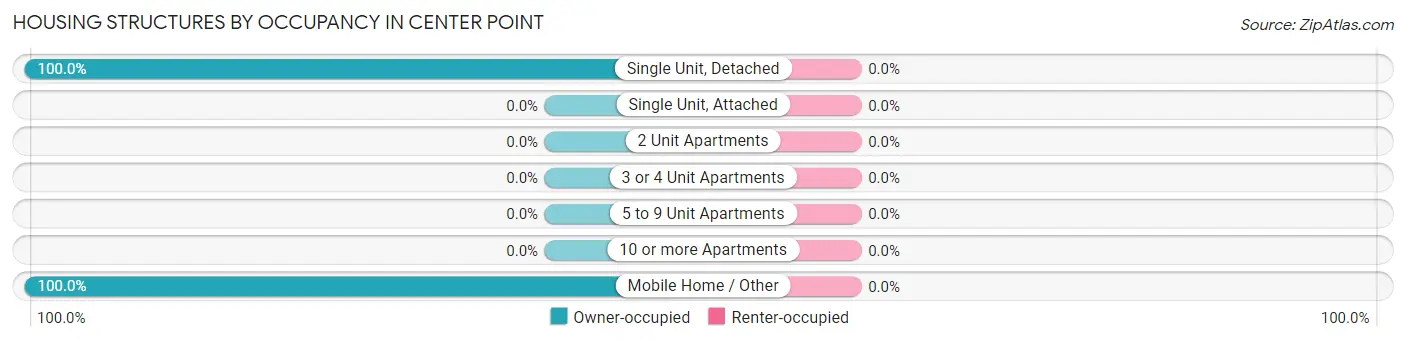
| Structure Type | Owner-occupied | Renter-occupied |
| Single Unit, Detached | 200 (100.0%) | 0 (0.0%) |
| Single Unit, Attached | 0 (0.0%) | 0 (0.0%) |
| 2 Unit Apartments | 0 (0.0%) | 0 (0.0%) |
| 3 or 4 Unit Apartments | 0 (0.0%) | 0 (0.0%) |
| 5 to 9 Unit Apartments | 0 (0.0%) | 0 (0.0%) |
| 10 or more Apartments | 0 (0.0%) | 0 (0.0%) |
| Mobile Home / Other | 12 (100.0%) | 0 (0.0%) |
| Total | 212 (100.0%) | 0 (0.0%) |
Housing Structures by Number of Rooms in Center Point
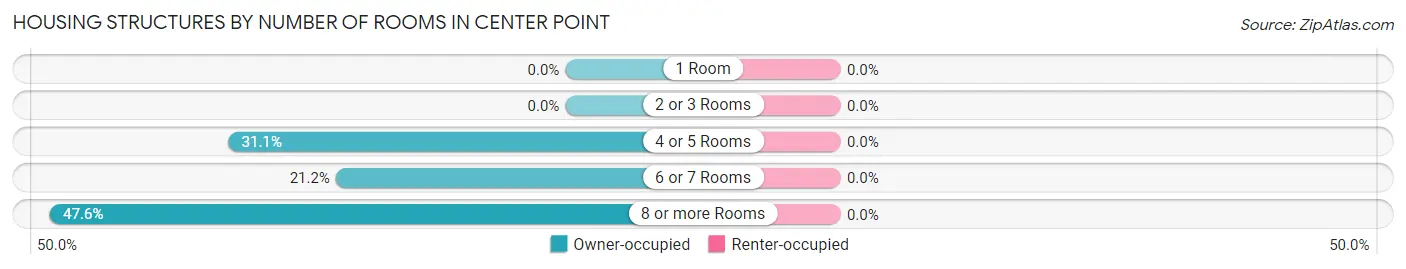
| Number of Rooms | Owner-occupied | Renter-occupied |
| 1 Room | 0 (0.0%) | 0 (0.0%) |
| 2 or 3 Rooms | 0 (0.0%) | 0 (0.0%) |
| 4 or 5 Rooms | 66 (31.1%) | 0 (0.0%) |
| 6 or 7 Rooms | 45 (21.2%) | 0 (0.0%) |
| 8 or more Rooms | 101 (47.6%) | 0 (0.0%) |
| Total | 212 (100.0%) | 0 (0.0%) |
Housing Structure by Heating Type in Center Point
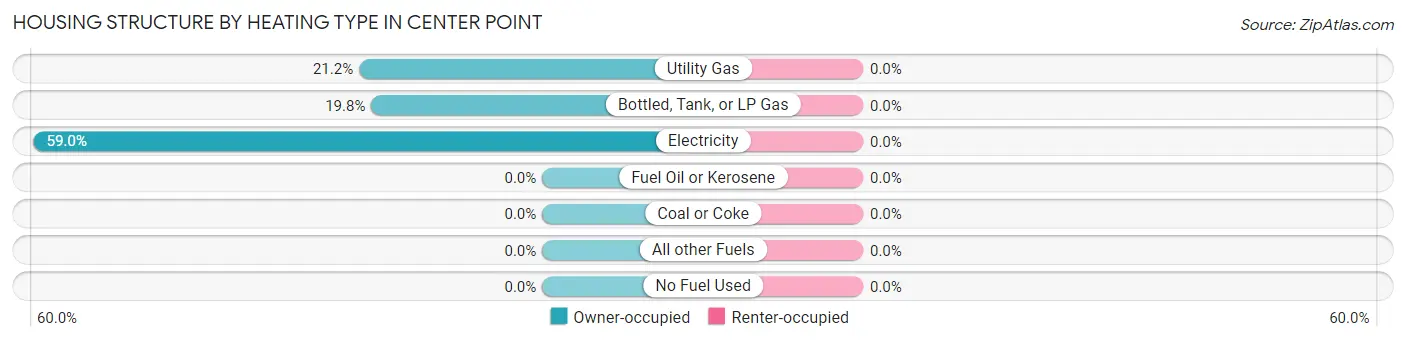
| Heating Type | Owner-occupied | Renter-occupied |
| Utility Gas | 45 (21.2%) | 0 (0.0%) |
| Bottled, Tank, or LP Gas | 42 (19.8%) | 0 (0.0%) |
| Electricity | 125 (59.0%) | 0 (0.0%) |
| Fuel Oil or Kerosene | 0 (0.0%) | 0 (0.0%) |
| Coal or Coke | 0 (0.0%) | 0 (0.0%) |
| All other Fuels | 0 (0.0%) | 0 (0.0%) |
| No Fuel Used | 0 (0.0%) | 0 (0.0%) |
| Total | 212 (100.0%) | 0 (0.0%) |
Household Vehicle Usage in Center Point
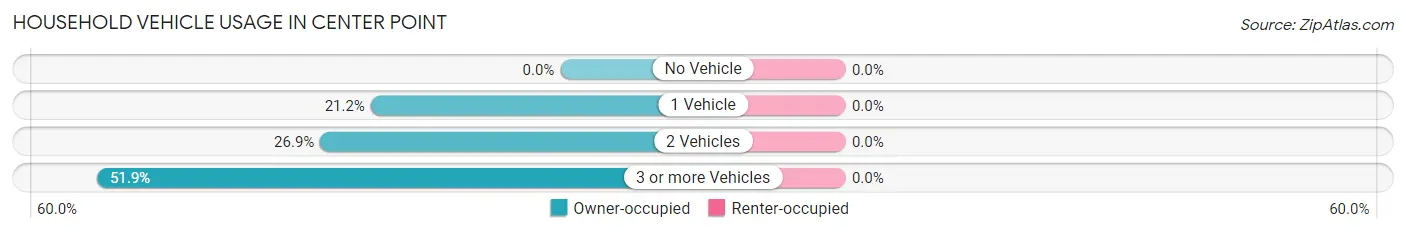
| Vehicles per Household | Owner-occupied | Renter-occupied |
| No Vehicle | 0 (0.0%) | 0 (0.0%) |
| 1 Vehicle | 45 (21.2%) | 0 (0.0%) |
| 2 Vehicles | 57 (26.9%) | 0 (0.0%) |
| 3 or more Vehicles | 110 (51.9%) | 0 (0.0%) |
| Total | 212 (100.0%) | 0 (0.0%) |
Real Estate & Mortgages in Center Point
Real Estate and Mortgage Overview in Center Point
| Characteristic | Without Mortgage | With Mortgage |
| Housing Units | 148 | 64 |
| Median Property Value | $158,400 | $252,100 |
| Median Household Income | - | - |
| Monthly Housing Costs | - | - |
| Real Estate Taxes | $199 | $30 |
Property Value by Mortgage Status in Center Point
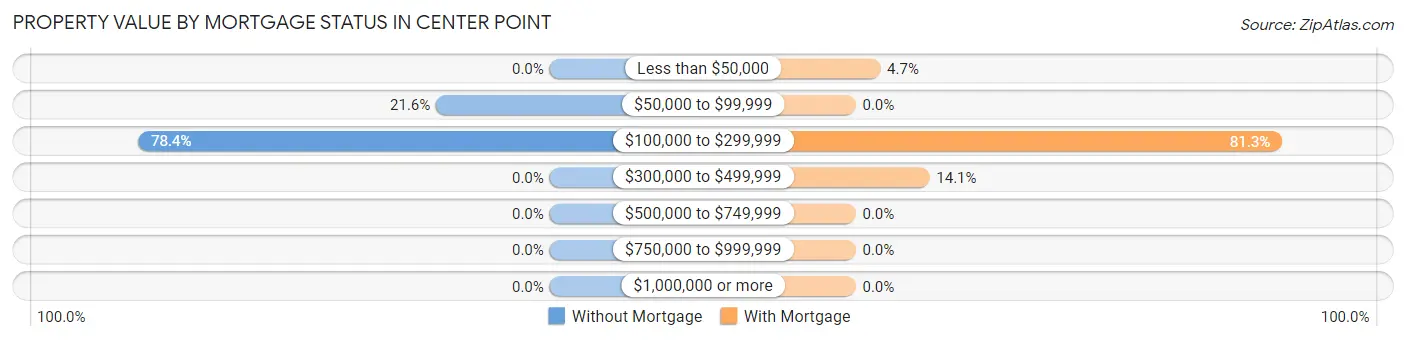
| Property Value | Without Mortgage | With Mortgage |
| Less than $50,000 | 0 (0.0%) | 3 (4.7%) |
| $50,000 to $99,999 | 32 (21.6%) | 0 (0.0%) |
| $100,000 to $299,999 | 116 (78.4%) | 52 (81.2%) |
| $300,000 to $499,999 | 0 (0.0%) | 9 (14.1%) |
| $500,000 to $749,999 | 0 (0.0%) | 0 (0.0%) |
| $750,000 to $999,999 | 0 (0.0%) | 0 (0.0%) |
| $1,000,000 or more | 0 (0.0%) | 0 (0.0%) |
| Total | 148 (100.0%) | 64 (100.0%) |
Household Income by Mortgage Status in Center Point
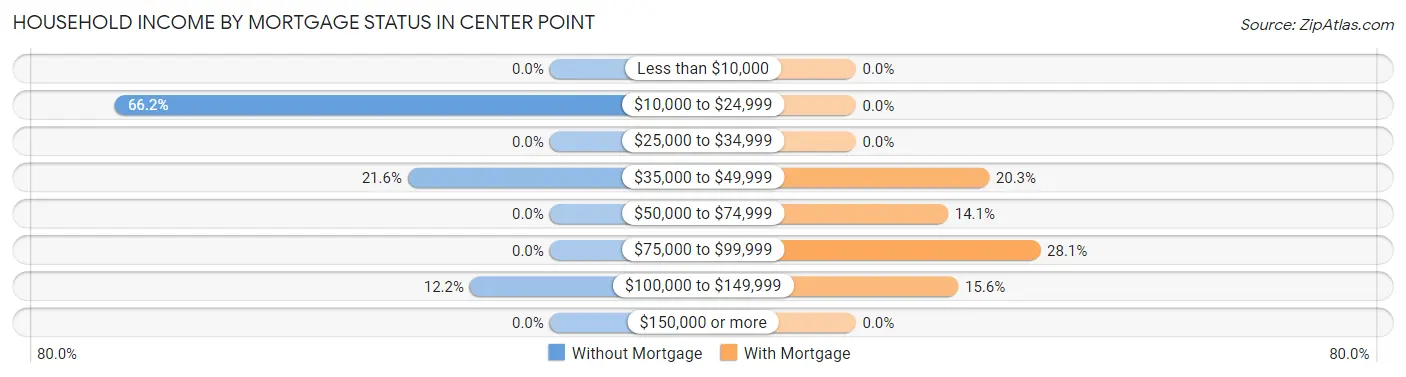
| Household Income | Without Mortgage | With Mortgage |
| Less than $10,000 | 0 (0.0%) | 0 (0.0%) |
| $10,000 to $24,999 | 98 (66.2%) | 0 (0.0%) |
| $25,000 to $34,999 | 0 (0.0%) | 0 (0.0%) |
| $35,000 to $49,999 | 32 (21.6%) | 13 (20.3%) |
| $50,000 to $74,999 | 0 (0.0%) | 9 (14.1%) |
| $75,000 to $99,999 | 0 (0.0%) | 18 (28.1%) |
| $100,000 to $149,999 | 18 (12.2%) | 10 (15.6%) |
| $150,000 or more | 0 (0.0%) | 0 (0.0%) |
| Total | 148 (100.0%) | 64 (100.0%) |
Property Value to Household Income Ratio in Center Point
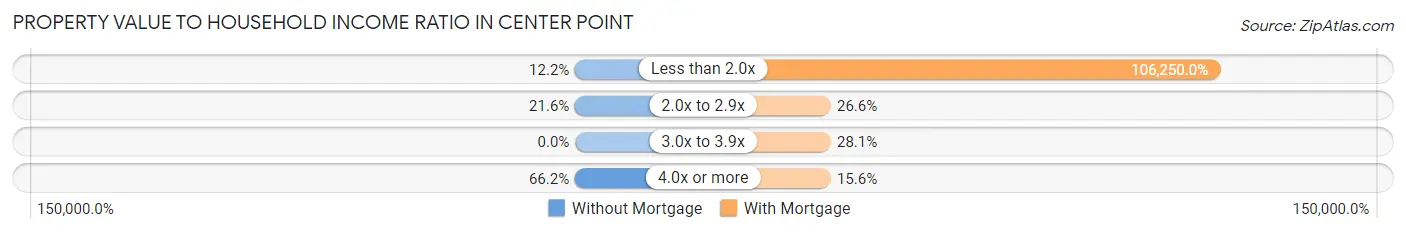
| Value-to-Income Ratio | Without Mortgage | With Mortgage |
| Less than 2.0x | 18 (12.2%) | 68,000 (106,250.0%) |
| 2.0x to 2.9x | 32 (21.6%) | 17 (26.6%) |
| 3.0x to 3.9x | 0 (0.0%) | 18 (28.1%) |
| 4.0x or more | 98 (66.2%) | 10 (15.6%) |
| Total | 148 (100.0%) | 64 (100.0%) |
Real Estate Taxes by Mortgage Status in Center Point
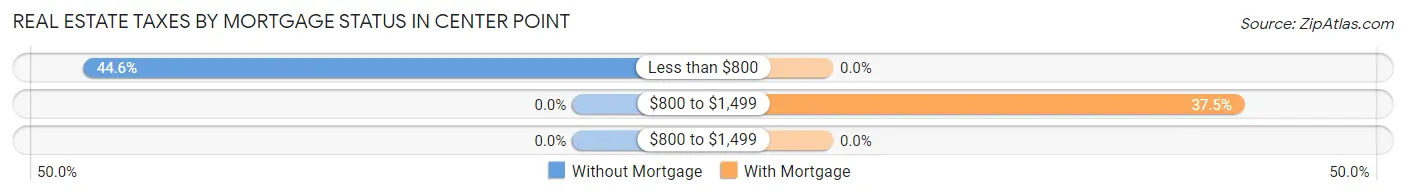
| Property Taxes | Without Mortgage | With Mortgage |
| Less than $800 | 66 (44.6%) | 0 (0.0%) |
| $800 to $1,499 | 0 (0.0%) | 24 (37.5%) |
| $800 to $1,499 | 0 (0.0%) | 0 (0.0%) |
| Total | 148 (100.0%) | 64 (100.0%) |
Health & Disability in Center Point
Health Insurance Coverage by Age in Center Point
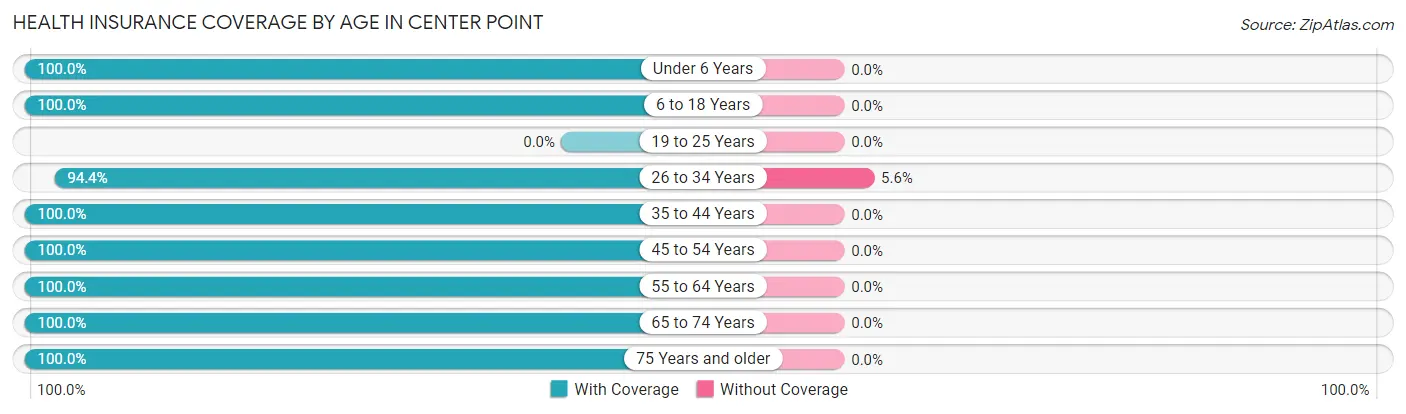
| Age Bracket | With Coverage | Without Coverage |
| Under 6 Years | 62 (100.0%) | 0 (0.0%) |
| 6 to 18 Years | 260 (100.0%) | 0 (0.0%) |
| 19 to 25 Years | 0 (0.0%) | 0 (0.0%) |
| 26 to 34 Years | 34 (94.4%) | 2 (5.6%) |
| 35 to 44 Years | 70 (100.0%) | 0 (0.0%) |
| 45 to 54 Years | 160 (100.0%) | 0 (0.0%) |
| 55 to 64 Years | 19 (100.0%) | 0 (0.0%) |
| 65 to 74 Years | 111 (100.0%) | 0 (0.0%) |
| 75 Years and older | 48 (100.0%) | 0 (0.0%) |
| Total | 764 (99.7%) | 2 (0.3%) |
Health Insurance Coverage by Citizenship Status in Center Point
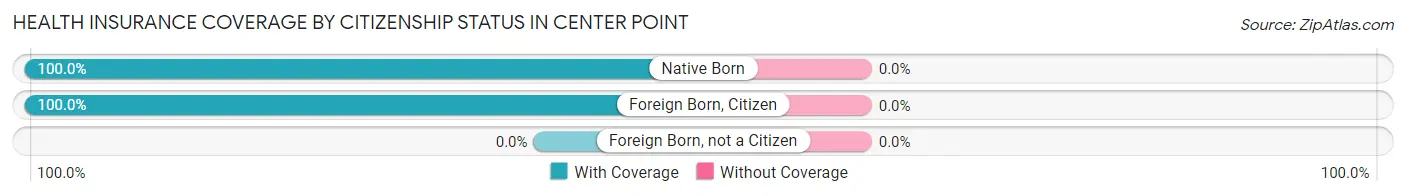
| Citizenship Status | With Coverage | Without Coverage |
| Native Born | 62 (100.0%) | 0 (0.0%) |
| Foreign Born, Citizen | 260 (100.0%) | 0 (0.0%) |
| Foreign Born, not a Citizen | 0 (0.0%) | 0 (0.0%) |
Health Insurance Coverage by Household Income in Center Point
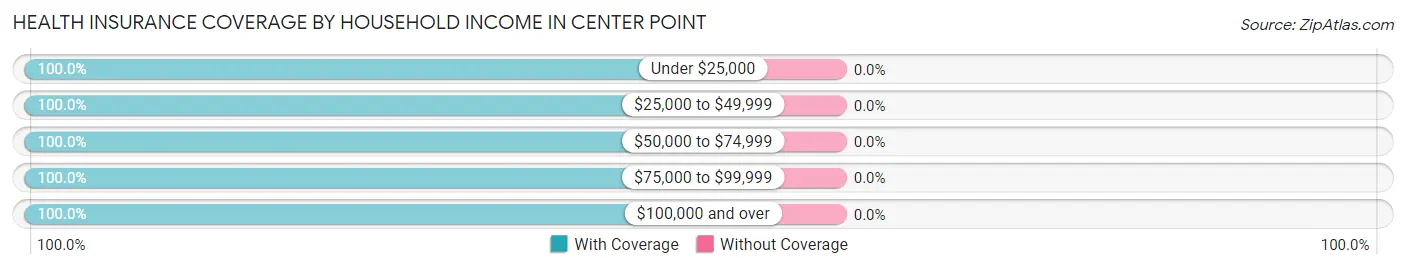
| Household Income | With Coverage | Without Coverage |
| Under $25,000 | 386 (100.0%) | 0 (0.0%) |
| $25,000 to $49,999 | 70 (100.0%) | 0 (0.0%) |
| $50,000 to $74,999 | 91 (100.0%) | 0 (0.0%) |
| $75,000 to $99,999 | 70 (100.0%) | 0 (0.0%) |
| $100,000 and over | 92 (100.0%) | 0 (0.0%) |
Public vs Private Health Insurance Coverage by Age in Center Point
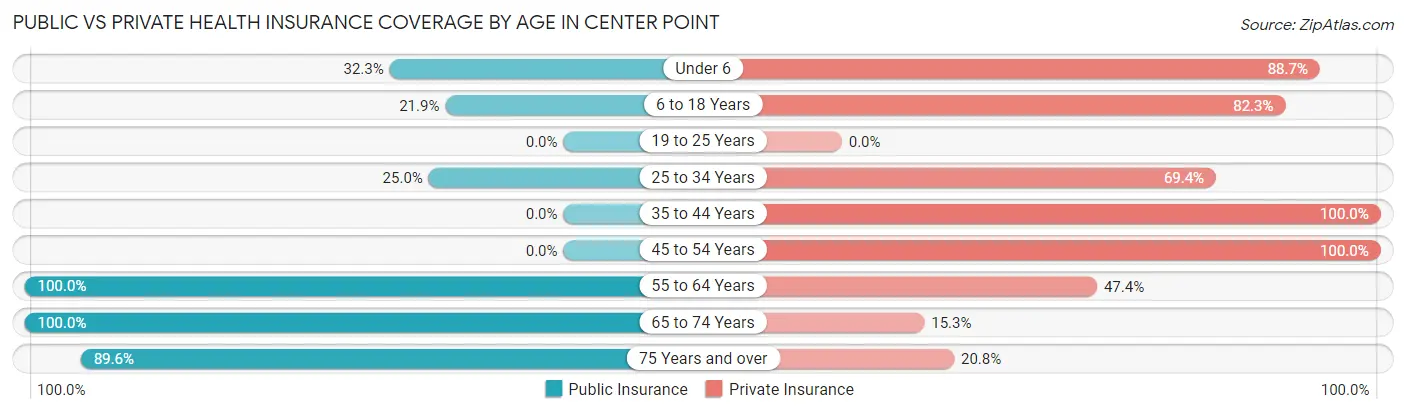
| Age Bracket | Public Insurance | Private Insurance |
| Under 6 | 20 (32.3%) | 55 (88.7%) |
| 6 to 18 Years | 57 (21.9%) | 214 (82.3%) |
| 19 to 25 Years | 0 (0.0%) | 0 (0.0%) |
| 25 to 34 Years | 9 (25.0%) | 25 (69.4%) |
| 35 to 44 Years | 0 (0.0%) | 70 (100.0%) |
| 45 to 54 Years | 0 (0.0%) | 160 (100.0%) |
| 55 to 64 Years | 19 (100.0%) | 9 (47.4%) |
| 65 to 74 Years | 111 (100.0%) | 17 (15.3%) |
| 75 Years and over | 43 (89.6%) | 10 (20.8%) |
| Total | 259 (33.8%) | 560 (73.1%) |
Disability Status by Sex by Age in Center Point
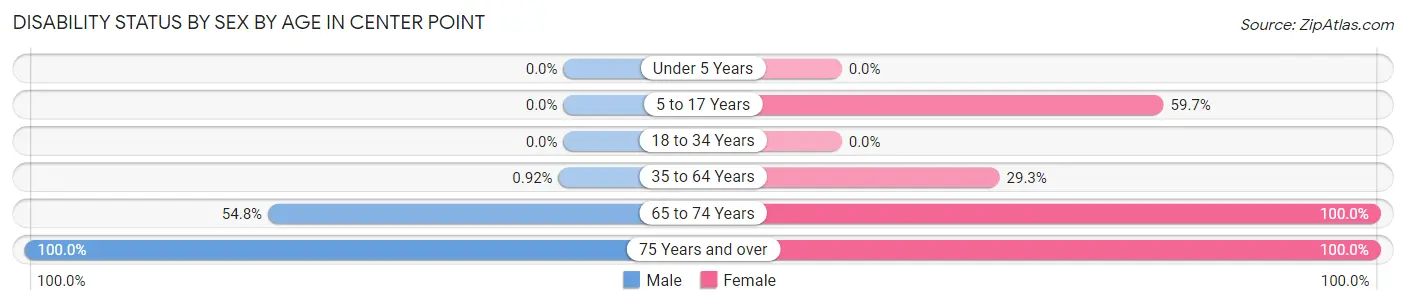
| Age Bracket | Male | Female |
| Under 5 Years | 0 (0.0%) | 0 (0.0%) |
| 5 to 17 Years | 0 (0.0%) | 46 (59.7%) |
| 18 to 34 Years | 0 (0.0%) | 0 (0.0%) |
| 35 to 64 Years | 1 (0.9%) | 41 (29.3%) |
| 65 to 74 Years | 34 (54.8%) | 49 (100.0%) |
| 75 Years and over | 16 (100.0%) | 32 (100.0%) |
Disability Class by Sex by Age in Center Point
Disability Class: Hearing Difficulty
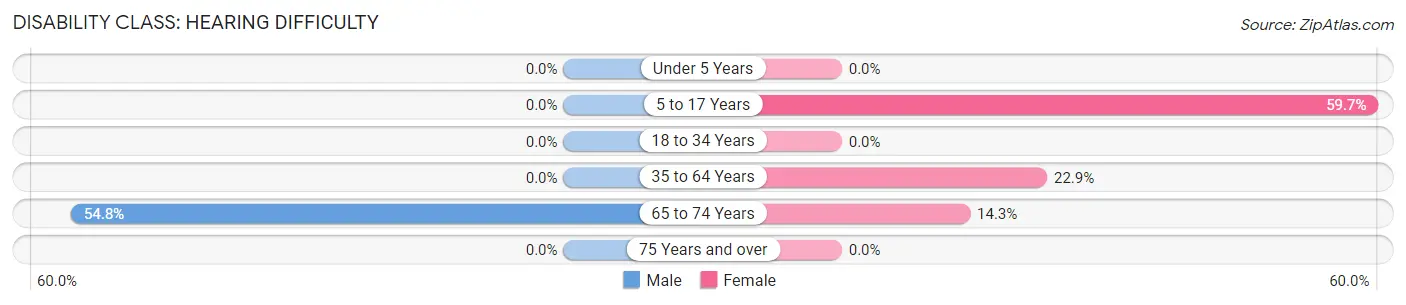
| Age Bracket | Male | Female |
| Under 5 Years | 0 (0.0%) | 0 (0.0%) |
| 5 to 17 Years | 0 (0.0%) | 46 (59.7%) |
| 18 to 34 Years | 0 (0.0%) | 0 (0.0%) |
| 35 to 64 Years | 0 (0.0%) | 32 (22.9%) |
| 65 to 74 Years | 34 (54.8%) | 7 (14.3%) |
| 75 Years and over | 0 (0.0%) | 0 (0.0%) |
Disability Class: Vision Difficulty
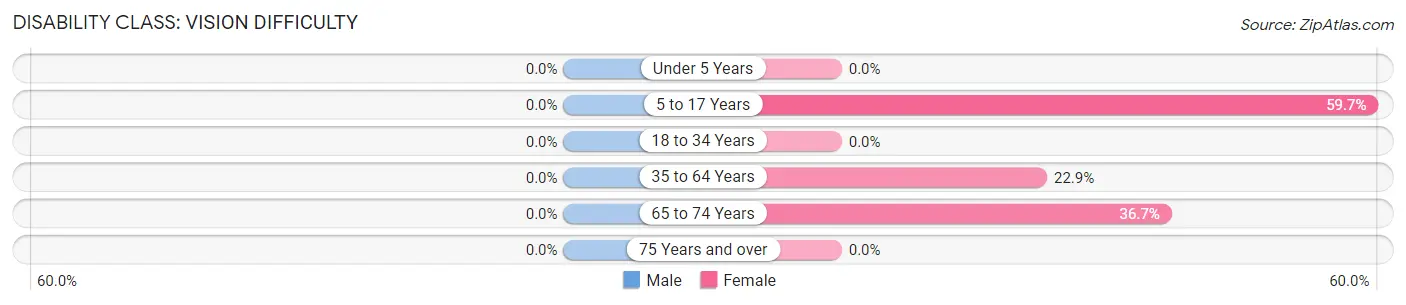
| Age Bracket | Male | Female |
| Under 5 Years | 0 (0.0%) | 0 (0.0%) |
| 5 to 17 Years | 0 (0.0%) | 46 (59.7%) |
| 18 to 34 Years | 0 (0.0%) | 0 (0.0%) |
| 35 to 64 Years | 0 (0.0%) | 32 (22.9%) |
| 65 to 74 Years | 0 (0.0%) | 18 (36.7%) |
| 75 Years and over | 0 (0.0%) | 0 (0.0%) |
Disability Class: Cognitive Difficulty
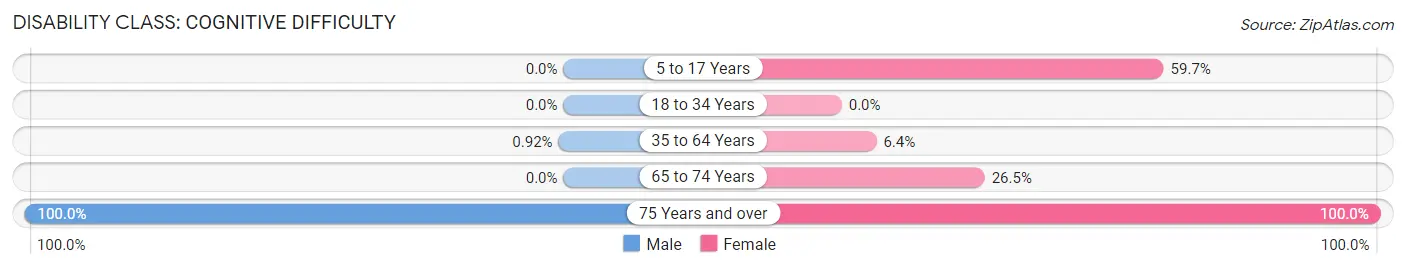
| Age Bracket | Male | Female |
| 5 to 17 Years | 0 (0.0%) | 46 (59.7%) |
| 18 to 34 Years | 0 (0.0%) | 0 (0.0%) |
| 35 to 64 Years | 1 (0.9%) | 9 (6.4%) |
| 65 to 74 Years | 0 (0.0%) | 13 (26.5%) |
| 75 Years and over | 16 (100.0%) | 32 (100.0%) |
Disability Class: Ambulatory Difficulty
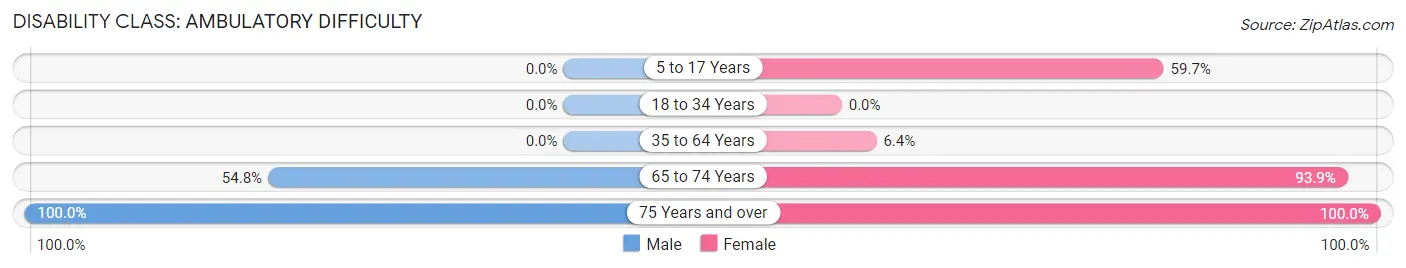
| Age Bracket | Male | Female |
| 5 to 17 Years | 0 (0.0%) | 46 (59.7%) |
| 18 to 34 Years | 0 (0.0%) | 0 (0.0%) |
| 35 to 64 Years | 0 (0.0%) | 9 (6.4%) |
| 65 to 74 Years | 34 (54.8%) | 46 (93.9%) |
| 75 Years and over | 16 (100.0%) | 32 (100.0%) |
Disability Class: Self-Care Difficulty
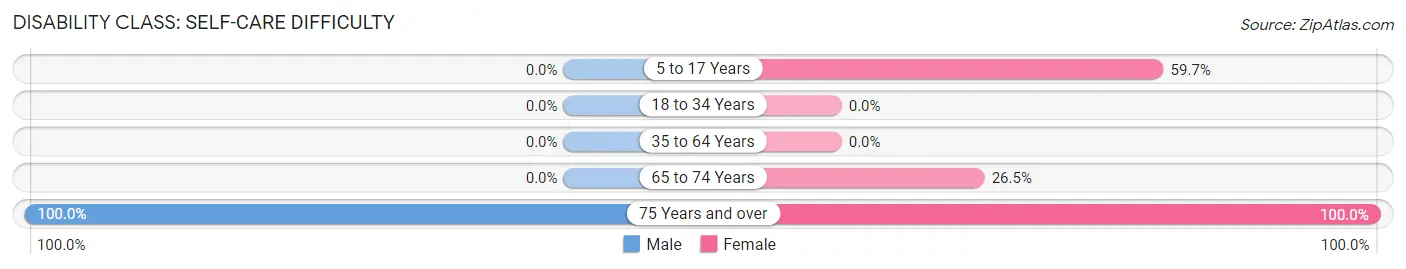
| Age Bracket | Male | Female |
| 5 to 17 Years | 0 (0.0%) | 46 (59.7%) |
| 18 to 34 Years | 0 (0.0%) | 0 (0.0%) |
| 35 to 64 Years | 0 (0.0%) | 0 (0.0%) |
| 65 to 74 Years | 0 (0.0%) | 13 (26.5%) |
| 75 Years and over | 16 (100.0%) | 32 (100.0%) |
Technology Access in Center Point
Computing Device Access in Center Point
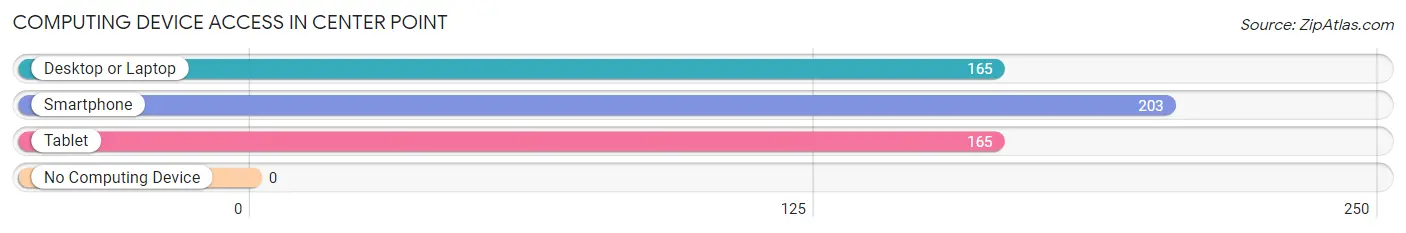
| Device Type | # Households | % Households |
| Desktop or Laptop | 165 | 77.8% |
| Smartphone | 203 | 95.8% |
| Tablet | 165 | 77.8% |
| No Computing Device | 0 | 0.0% |
| Total | 212 | 100.0% |
Internet Access in Center Point
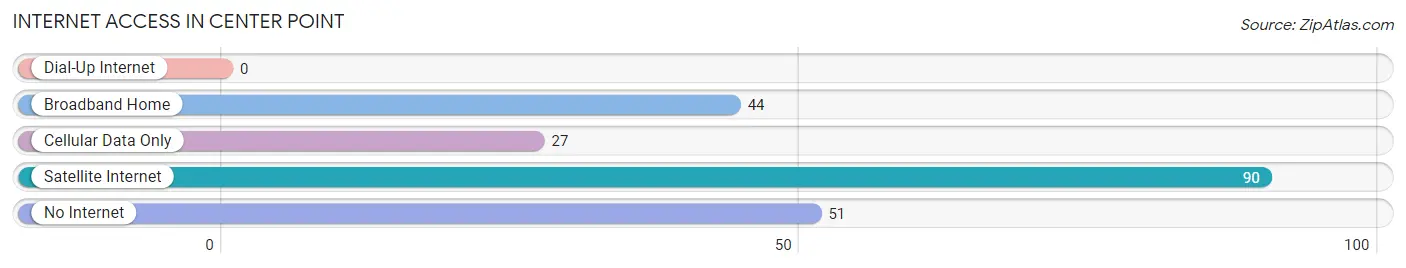
| Internet Type | # Households | % Households |
| Dial-Up Internet | 0 | 0.0% |
| Broadband Home | 44 | 20.7% |
| Cellular Data Only | 27 | 12.7% |
| Satellite Internet | 90 | 42.4% |
| No Internet | 51 | 24.1% |
| Total | 212 | 100.0% |
Center Point Summary
Pointe-à-la-Hache is a small unincorporated community located in Plaquemines Parish, Louisiana, United States. It is situated along the Mississippi River, approximately 40 miles south of New Orleans. The community is part of the Greater New Orleans Metropolitan Statistical Area.
History
Pointe-à-la-Hache was first settled in the early 1700s by French settlers. The name of the community is derived from the French phrase “pointe à la hache” which translates to “point of the axe”. The name is believed to have been given to the area due to the abundance of cypress trees in the area which were used to make axes.
In the early 1800s, Pointe-à-la-Hache was a thriving port town. It was a major hub for the cotton and sugar industries, and was home to several large plantations. The town was also a popular destination for steamboat travel.
In the late 1800s, the town began to decline due to the decline of the cotton and sugar industries. The town was further devastated by the Great Mississippi Flood of 1927, which destroyed much of the town’s infrastructure.
Geography
Pointe-à-la-Hache is located in Plaquemines Parish, Louisiana, approximately 40 miles south of New Orleans. The community is situated along the Mississippi River, and is bordered by the towns of Belle Chasse and Buras.
The town has a total area of 0.7 square miles, all of which is land. The town is located at an elevation of 8 feet above sea level.
Economy
The economy of Pointe-à-la-Hache is largely based on fishing and tourism. The town is home to several seafood processing plants, which provide employment for many of the town’s residents. The town is also a popular destination for recreational fishing, and is home to several marinas and boat launches.
Demographics
As of the 2010 census, the population of Pointe-à-la-Hache was 1,092. The racial makeup of the town was 79.2% White, 17.2% African American, 0.7% Native American, 0.3% Asian, 0.1% Pacific Islander, and 2.5% from other races. Hispanic or Latino of any race were 2.2% of the population.
The median household income in Pointe-à-la-Hache was $37,917, and the median family income was $45,625. The per capita income for the town was $17,845. About 17.2% of families and 20.2% of the population were below the poverty line, including 28.3% of those under age 18 and 11.2% of those age 65 or over.
Common Questions
What is Per Capita Income in Center Point?
Per Capita income in Center Point is $14,101.
What is Inequality or Gini Index in Center Point?
Inequality or Gini Index in Center Point is 0.46.
What is the Total Population of Center Point?
Total Population of Center Point is 807.
What is the Total Male Population of Center Point?
Total Male Population of Center Point is 447.
What is the Total Female Population of Center Point?
Total Female Population of Center Point is 360.
What is the Ratio of Males per 100 Females in Center Point?
There are 124.17 Males per 100 Females in Center Point.
What is the Ratio of Females per 100 Males in Center Point?
There are 80.54 Females per 100 Males in Center Point.
What is the Median Population Age in Center Point?
Median Population Age in Center Point is 43.4 Years.
What is the Average Family Size in Center Point
Average Family Size in Center Point is 3.7 People.
What is the Average Household Size in Center Point
Average Household Size in Center Point is 3.4 People.
How Large is the Labor Force in Center Point?
There are 284 People in the Labor Forcein in Center Point.
What is the Percentage of People in the Labor Force in Center Point?
52.1% of People are in the Labor Force in Center Point.