Natchitoches Parish, LA Map & Demographics
Natchitoches Parish Map
Natchitoches Parish Overview
$25,302
PER CAPITA INCOME
$61,598
AVG FAMILY INCOME
$41,310
AVG HOUSEHOLD INCOME
31.8%
WAGE / INCOME GAP [ % ]
68.2¢/ $1
WAGE / INCOME GAP [ $ ]
$13,092
FAMILY INCOME DEFICIT
0.53
INEQUALITY / GINI INDEX
37,478
TOTAL POPULATION
18,089
MALE POPULATION
19,389
FEMALE POPULATION
93.30
MALES / 100 FEMALES
107.19
FEMALES / 100 MALES
33.3
MEDIAN AGE
3.4
AVG FAMILY SIZE
2.6
AVG HOUSEHOLD SIZE
15,521
LABOR FORCE [ PEOPLE ]
51.9%
PERCENT IN LABOR FORCE
8.9%
UNEMPLOYMENT RATE
Natchitoches Parish Area Codes
Income in Natchitoches Parish
Income Overview in Natchitoches Parish
Per Capita Income in Natchitoches Parish is $25,302, while median incomes of families and households are $61,598 and $41,310 respectively.
| Characteristic | Number | Measure |
| Per Capita Income | 37,478 | $25,302 |
| Median Family Income | 7,859 | $61,598 |
| Mean Family Income | 7,859 | $85,106 |
| Median Household Income | 13,866 | $41,310 |
| Mean Household Income | 13,866 | $65,033 |
| Income Deficit | 7,859 | $13,092 |
| Wage / Income Gap (%) | 37,478 | 31.83% |
| Wage / Income Gap ($) | 37,478 | 68.17¢ per $1 |
| Gini / Inequality Index | 37,478 | 0.53 |
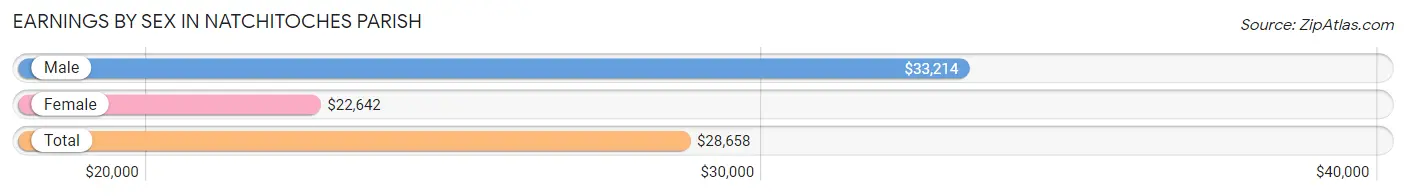
Earnings by Sex in Natchitoches Parish
Average Earnings in Natchitoches Parish are $28,658, $33,214 for men and $22,642 for women, a difference of 31.8%.
| Sex | Number | Average Earnings |
| Male | 7,656 (48.4%) | $33,214 |
| Female | 8,156 (51.6%) | $22,642 |
| Total | 15,812 (100.0%) | $28,658 |
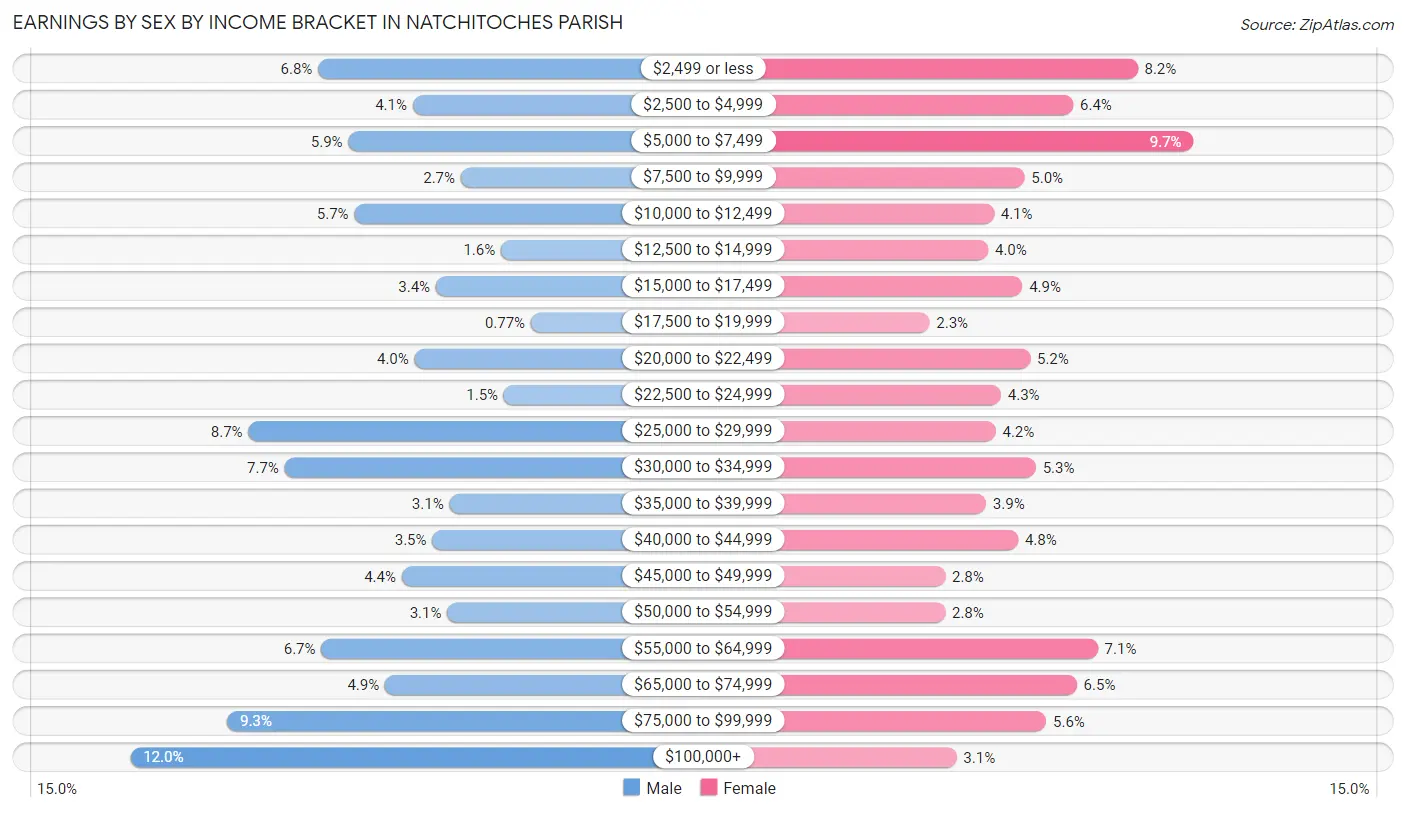
Earnings by Sex by Income Bracket in Natchitoches Parish
The most common earnings brackets in Natchitoches Parish are $100,000+ for men (921 | 12.0%) and $5,000 to $7,499 for women (794 | 9.7%).
| Income | Male | Female |
| $2,499 or less | 517 (6.8%) | 666 (8.2%) |
| $2,500 to $4,999 | 313 (4.1%) | 519 (6.4%) |
| $5,000 to $7,499 | 452 (5.9%) | 794 (9.7%) |
| $7,500 to $9,999 | 210 (2.7%) | 407 (5.0%) |
| $10,000 to $12,499 | 439 (5.7%) | 337 (4.1%) |
| $12,500 to $14,999 | 123 (1.6%) | 324 (4.0%) |
| $15,000 to $17,499 | 263 (3.4%) | 402 (4.9%) |
| $17,500 to $19,999 | 59 (0.8%) | 189 (2.3%) |
| $20,000 to $22,499 | 309 (4.0%) | 420 (5.1%) |
| $22,500 to $24,999 | 117 (1.5%) | 353 (4.3%) |
| $25,000 to $29,999 | 667 (8.7%) | 341 (4.2%) |
| $30,000 to $34,999 | 589 (7.7%) | 433 (5.3%) |
| $35,000 to $39,999 | 234 (3.1%) | 319 (3.9%) |
| $40,000 to $44,999 | 271 (3.5%) | 392 (4.8%) |
| $45,000 to $49,999 | 337 (4.4%) | 225 (2.8%) |
| $50,000 to $54,999 | 239 (3.1%) | 225 (2.8%) |
| $55,000 to $64,999 | 510 (6.7%) | 575 (7.0%) |
| $65,000 to $74,999 | 373 (4.9%) | 527 (6.5%) |
| $75,000 to $99,999 | 713 (9.3%) | 457 (5.6%) |
| $100,000+ | 921 (12.0%) | 251 (3.1%) |
| Total | 7,656 (100.0%) | 8,156 (100.0%) |
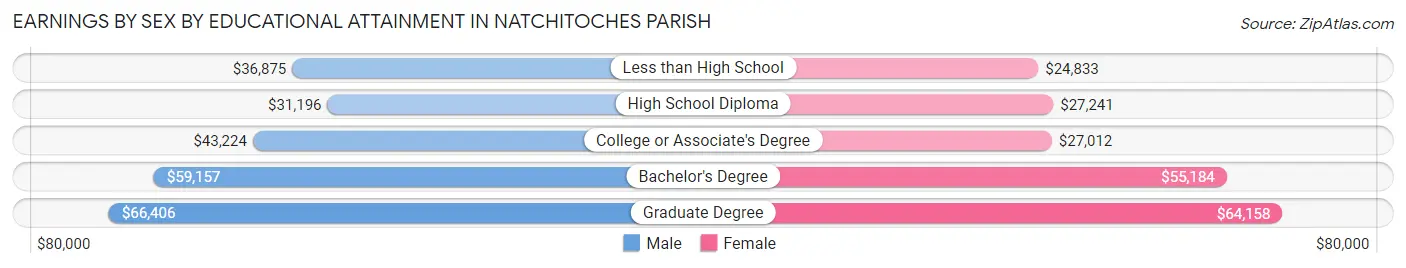
Earnings by Sex by Educational Attainment in Natchitoches Parish
Average earnings in Natchitoches Parish are $42,555 for men and $34,932 for women, a difference of 17.9%. Men with an educational attainment of graduate degree enjoy the highest average annual earnings of $66,406, while those with high school diploma education earn the least with $31,196. Women with an educational attainment of graduate degree earn the most with the average annual earnings of $64,158, while those with less than high school education have the smallest earnings of $24,833.
| Educational Attainment | Male Income | Female Income |
| Less than High School | $36,875 | $24,833 |
| High School Diploma | $31,196 | $27,241 |
| College or Associate's Degree | $43,224 | $27,012 |
| Bachelor's Degree | $59,157 | $55,184 |
| Graduate Degree | $66,406 | $64,158 |
| Total | $42,555 | $34,932 |
Family Income in Natchitoches Parish
Family Income Brackets in Natchitoches Parish
According to the Natchitoches Parish family income data, there are 1,470 families falling into the $100,000 to $149,999 income range, which is the most common income bracket and makes up 18.7% of all families. Conversely, the $10,000 to $14,999 income bracket is the least frequent group with only 401 families (5.1%) belonging to this category.
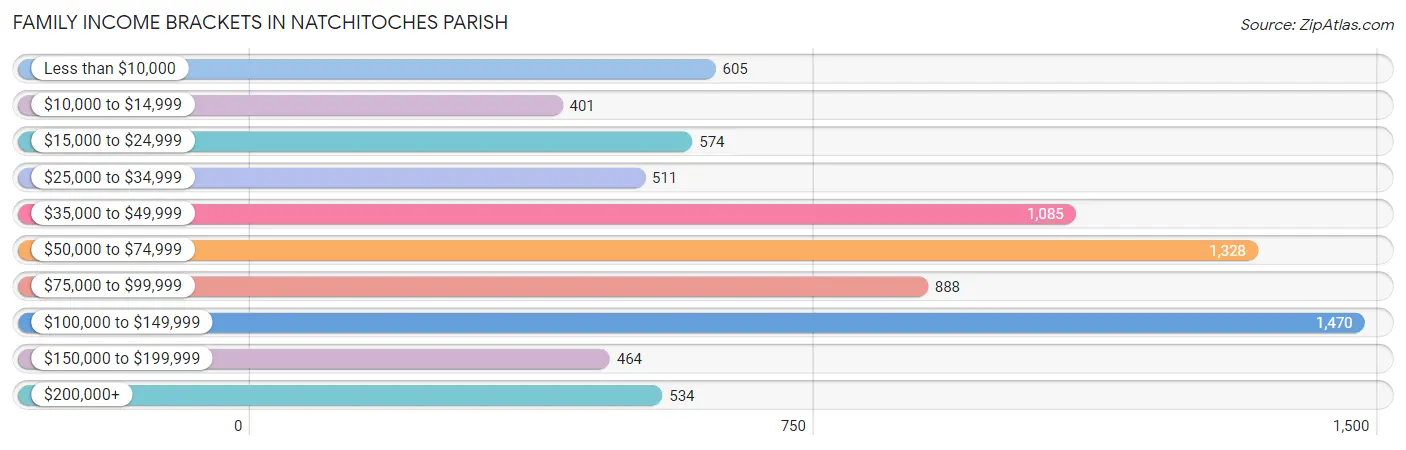
| Income Bracket | # Families | % Families |
| Less than $10,000 | 605 | 7.7% |
| $10,000 to $14,999 | 401 | 5.1% |
| $15,000 to $24,999 | 574 | 7.3% |
| $25,000 to $34,999 | 511 | 6.5% |
| $35,000 to $49,999 | 1,085 | 13.8% |
| $50,000 to $74,999 | 1,328 | 16.9% |
| $75,000 to $99,999 | 888 | 11.3% |
| $100,000 to $149,999 | 1,470 | 18.7% |
| $150,000 to $199,999 | 464 | 5.9% |
| $200,000+ | 534 | 6.8% |
Family Income by Famaliy Size in Natchitoches Parish
4-person families (1,021 | 13.0%) account for the highest median family income in Natchitoches Parish with $82,743 per family, while 2-person families (4,233 | 53.9%) have the highest median income of $28,549 per family member.
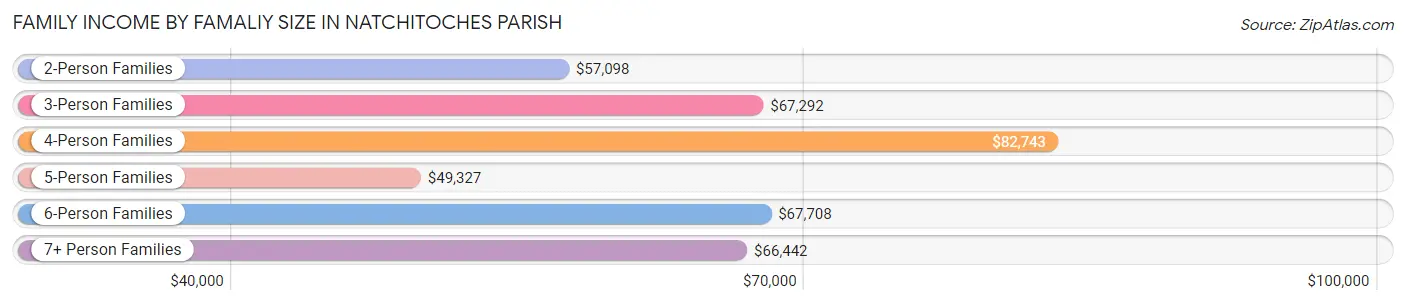
| Income Bracket | # Families | Median Income |
| 2-Person Families | 4,233 (53.9%) | $57,098 |
| 3-Person Families | 1,909 (24.3%) | $67,292 |
| 4-Person Families | 1,021 (13.0%) | $82,743 |
| 5-Person Families | 354 (4.5%) | $49,327 |
| 6-Person Families | 253 (3.2%) | $67,708 |
| 7+ Person Families | 89 (1.1%) | $66,442 |
| Total | 7,859 (100.0%) | $61,598 |
Family Income by Number of Earners in Natchitoches Parish
The median family income in Natchitoches Parish is $61,598, with families comprising 2 earners (2,807) having the highest median family income of $105,291, while families with no earners (1,960) have the lowest median family income of $32,672, accounting for 35.7% and 24.9% of families, respectively.
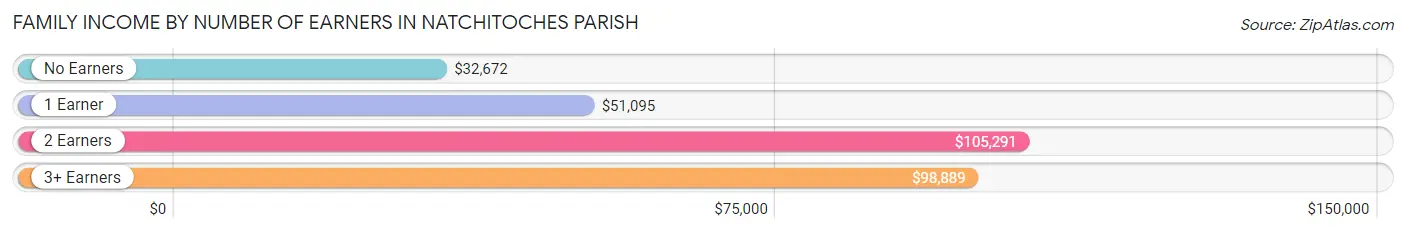
| Number of Earners | # Families | Median Income |
| No Earners | 1,960 (24.9%) | $32,672 |
| 1 Earner | 2,718 (34.6%) | $51,095 |
| 2 Earners | 2,807 (35.7%) | $105,291 |
| 3+ Earners | 374 (4.8%) | $98,889 |
| Total | 7,859 (100.0%) | $61,598 |
Household Income in Natchitoches Parish
Household Income Brackets in Natchitoches Parish
With 1,914 households falling in the category, the $100,000 to $149,999 income range is the most frequent in Natchitoches Parish, accounting for 13.8% of all households. In contrast, only 513 households (3.7%) fall into the $150,000 to $199,999 income bracket, making it the least populous group.
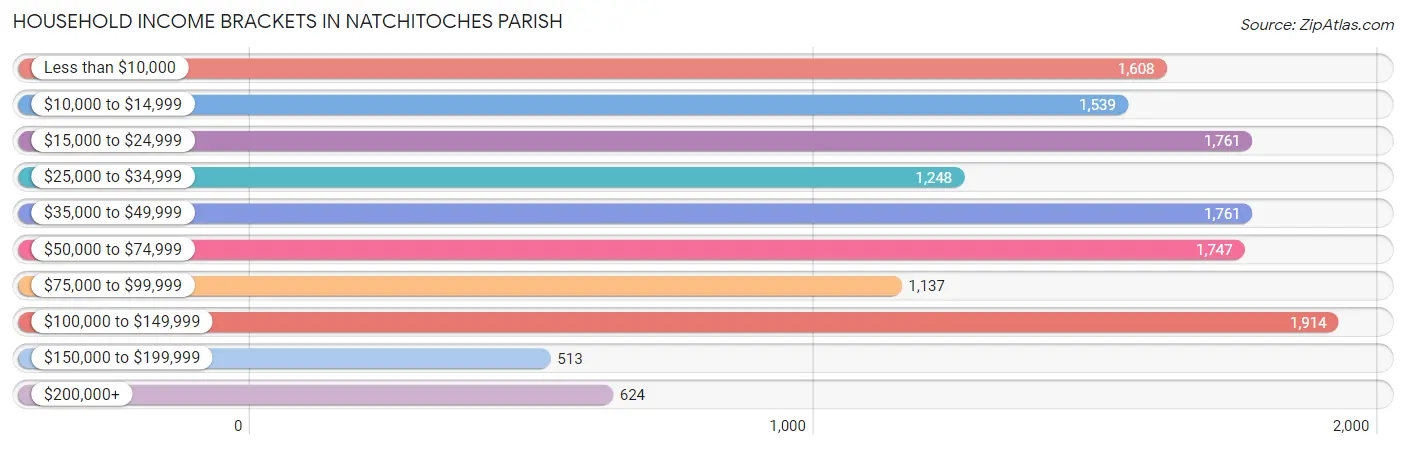
| Income Bracket | # Households | % Households |
| Less than $10,000 | 1,608 | 11.6% |
| $10,000 to $14,999 | 1,539 | 11.1% |
| $15,000 to $24,999 | 1,761 | 12.7% |
| $25,000 to $34,999 | 1,248 | 9.0% |
| $35,000 to $49,999 | 1,761 | 12.7% |
| $50,000 to $74,999 | 1,747 | 12.6% |
| $75,000 to $99,999 | 1,137 | 8.2% |
| $100,000 to $149,999 | 1,914 | 13.8% |
| $150,000 to $199,999 | 513 | 3.7% |
| $200,000+ | 624 | 4.5% |
Household Income by Householder Age in Natchitoches Parish
The median household income in Natchitoches Parish is $41,310, with the highest median household income of $48,165 found in the 25 to 44 years age bracket for the primary householder. A total of 3,859 households (27.8%) fall into this category. Meanwhile, the 15 to 24 years age bracket for the primary householder has the lowest median household income of $16,850, with 1,320 households (9.5%) in this group.
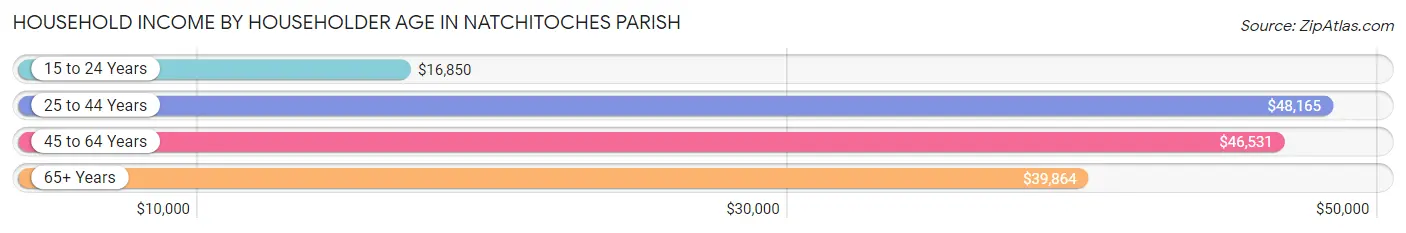
| Income Bracket | # Households | Median Income |
| 15 to 24 Years | 1,320 (9.5%) | $16,850 |
| 25 to 44 Years | 3,859 (27.8%) | $48,165 |
| 45 to 64 Years | 4,759 (34.3%) | $46,531 |
| 65+ Years | 3,928 (28.3%) | $39,864 |
| Total | 13,866 (100.0%) | $41,310 |
Poverty in Natchitoches Parish
Income Below Poverty by Sex and Age in Natchitoches Parish
With 23.5% poverty level for males and 28.2% for females among the residents of Natchitoches Parish, 18 to 24 year old males and 18 to 24 year old females are the most vulnerable to poverty, with 1,297 males (48.7%) and 1,609 females (60.1%) in their respective age groups living below the poverty level.
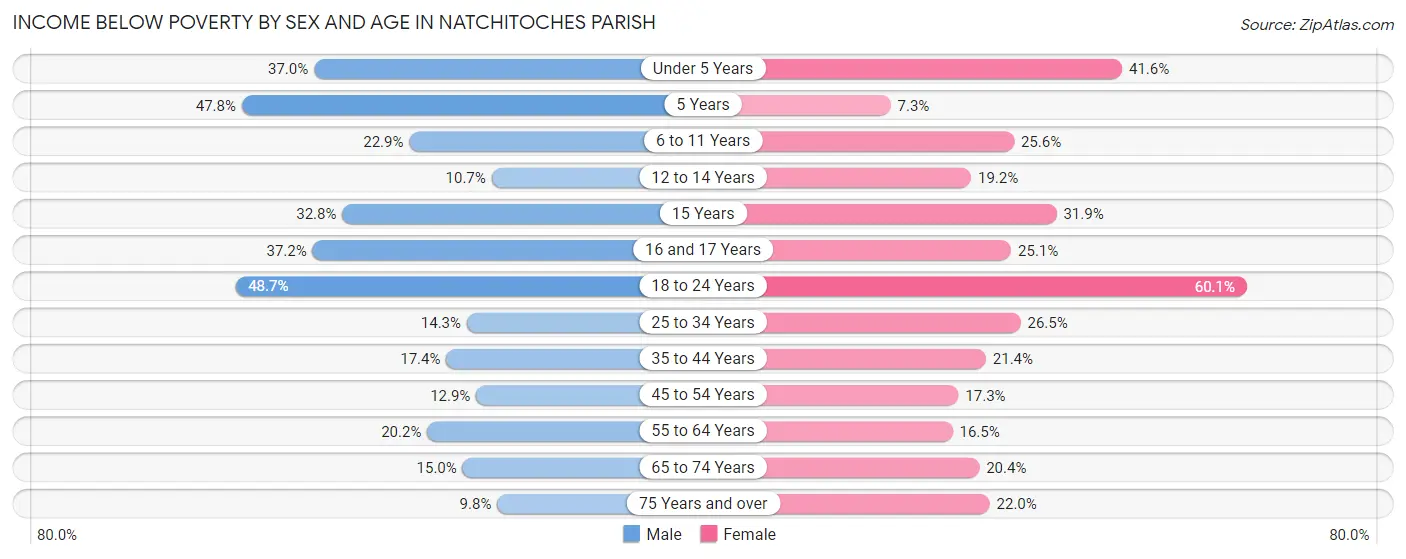
| Age Bracket | Male | Female |
| Under 5 Years | 412 (37.0%) | 472 (41.6%) |
| 5 Years | 53 (47.7%) | 10 (7.2%) |
| 6 to 11 Years | 365 (22.9%) | 384 (25.6%) |
| 12 to 14 Years | 79 (10.6%) | 114 (19.2%) |
| 15 Years | 128 (32.8%) | 51 (31.9%) |
| 16 and 17 Years | 143 (37.2%) | 139 (25.1%) |
| 18 to 24 Years | 1,297 (48.7%) | 1,609 (60.1%) |
| 25 to 34 Years | 291 (14.3%) | 543 (26.5%) |
| 35 to 44 Years | 293 (17.4%) | 425 (21.4%) |
| 45 to 54 Years | 234 (12.9%) | 339 (17.3%) |
| 55 to 64 Years | 387 (20.2%) | 360 (16.5%) |
| 65 to 74 Years | 252 (15.0%) | 401 (20.4%) |
| 75 Years and over | 101 (9.8%) | 302 (22.0%) |
| Total | 4,035 (23.5%) | 5,149 (28.2%) |
Income Above Poverty by Sex and Age in Natchitoches Parish
According to the poverty statistics in Natchitoches Parish, males aged 75 years and over and females aged 5 years are the age groups that are most secure financially, with 90.2% of males and 92.7% of females in these age groups living above the poverty line.
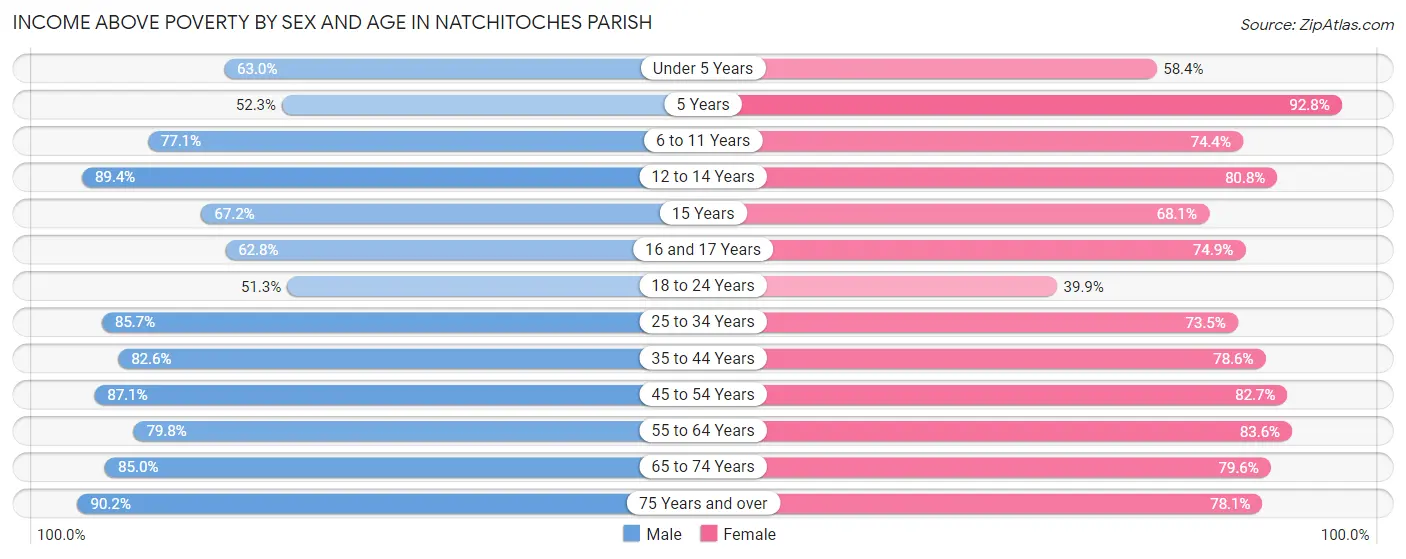
| Age Bracket | Male | Female |
| Under 5 Years | 701 (63.0%) | 662 (58.4%) |
| 5 Years | 58 (52.2%) | 128 (92.7%) |
| 6 to 11 Years | 1,230 (77.1%) | 1,118 (74.4%) |
| 12 to 14 Years | 663 (89.3%) | 480 (80.8%) |
| 15 Years | 262 (67.2%) | 109 (68.1%) |
| 16 and 17 Years | 241 (62.8%) | 414 (74.9%) |
| 18 to 24 Years | 1,365 (51.3%) | 1,067 (39.9%) |
| 25 to 34 Years | 1,740 (85.7%) | 1,503 (73.5%) |
| 35 to 44 Years | 1,393 (82.6%) | 1,562 (78.6%) |
| 45 to 54 Years | 1,574 (87.1%) | 1,618 (82.7%) |
| 55 to 64 Years | 1,528 (79.8%) | 1,828 (83.6%) |
| 65 to 74 Years | 1,432 (85.0%) | 1,564 (79.6%) |
| 75 Years and over | 928 (90.2%) | 1,074 (78.0%) |
| Total | 13,115 (76.5%) | 13,127 (71.8%) |
Income Below Poverty Among Married-Couple Families in Natchitoches Parish
The poverty statistics for married-couple families in Natchitoches Parish show that 5.8% or 298 of the total 5,162 families live below the poverty line. Families with 3 or 4 children have the highest poverty rate of 12.2%, comprising of 34 families. On the other hand, families with 5 or more children have the lowest poverty rate of 0.0%, which includes 0 families.
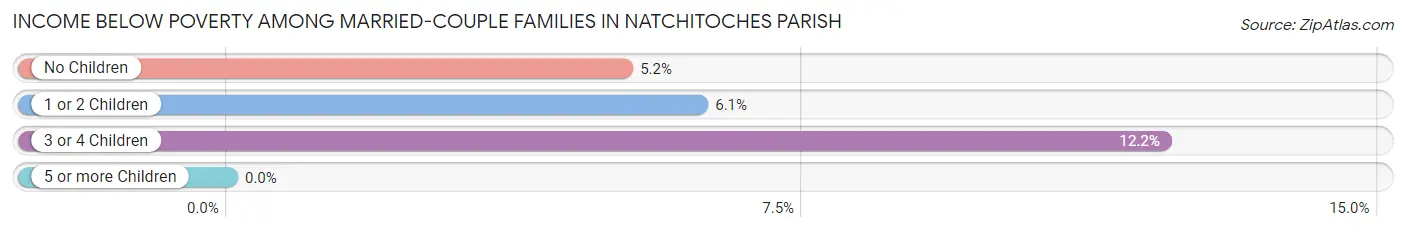
| Children | Above Poverty | Below Poverty |
| No Children | 3,311 (94.8%) | 180 (5.2%) |
| 1 or 2 Children | 1,285 (93.9%) | 84 (6.1%) |
| 3 or 4 Children | 245 (87.8%) | 34 (12.2%) |
| 5 or more Children | 23 (100.0%) | 0 (0.0%) |
| Total | 4,864 (94.2%) | 298 (5.8%) |
Income Below Poverty Among Single-Parent Households in Natchitoches Parish
According to the poverty data in Natchitoches Parish, 18.9% or 92 single-father households and 41.3% or 913 single-mother households are living below the poverty line. Among single-father households, those with 3 or 4 children have the highest poverty rate, with 2 households (100.0%) experiencing poverty. Likewise, among single-mother households, those with 3 or 4 children have the highest poverty rate, with 181 households (80.1%) falling below the poverty line.
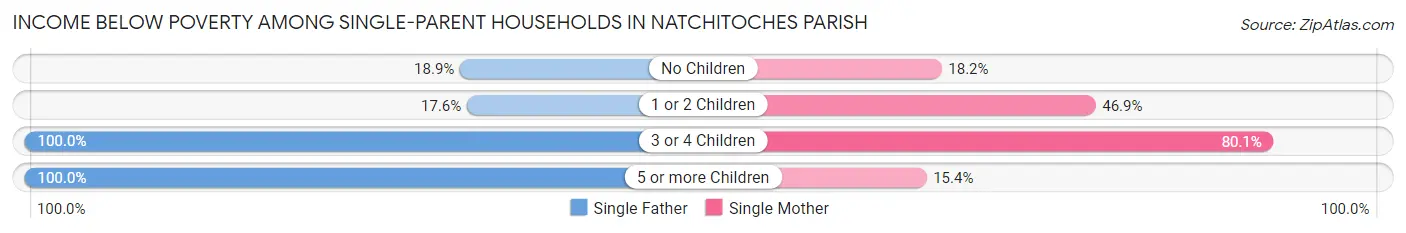
| Children | Single Father | Single Mother |
| No Children | 57 (18.9%) | 123 (18.2%) |
| 1 or 2 Children | 32 (17.6%) | 607 (46.9%) |
| 3 or 4 Children | 2 (100.0%) | 181 (80.1%) |
| 5 or more Children | 1 (100.0%) | 2 (15.4%) |
| Total | 92 (18.9%) | 913 (41.3%) |
Income Below Poverty Among Married-Couple vs Single-Parent Households in Natchitoches Parish
The poverty data for Natchitoches Parish shows that 298 of the married-couple family households (5.8%) and 1,005 of the single-parent households (37.3%) are living below the poverty level. Within the married-couple family households, those with 3 or 4 children have the highest poverty rate, with 34 households (12.2%) falling below the poverty line. Among the single-parent households, those with 3 or 4 children have the highest poverty rate, with 183 household (80.3%) living below poverty.
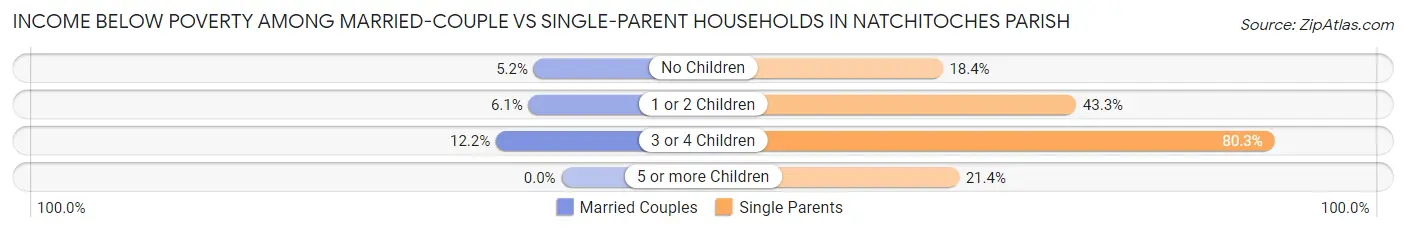
| Children | Married-Couple Families | Single-Parent Households |
| No Children | 180 (5.2%) | 180 (18.4%) |
| 1 or 2 Children | 84 (6.1%) | 639 (43.3%) |
| 3 or 4 Children | 34 (12.2%) | 183 (80.3%) |
| 5 or more Children | 0 (0.0%) | 3 (21.4%) |
| Total | 298 (5.8%) | 1,005 (37.3%) |
Race in Natchitoches Parish
The most populous races in Natchitoches Parish are White / Caucasian (19,170 | 51.1%), Black / African American (15,269 | 40.7%), and Two or more Races (1,478 | 3.9%).
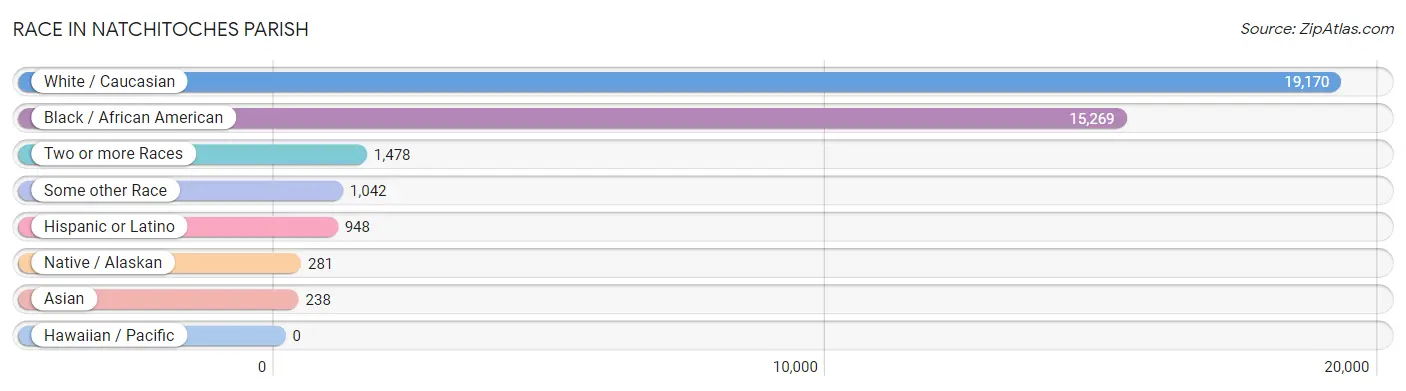
| Race | # Population | % Population |
| Asian | 238 | 0.6% |
| Black / African American | 15,269 | 40.7% |
| Hawaiian / Pacific | 0 | 0.0% |
| Hispanic or Latino | 948 | 2.5% |
| Native / Alaskan | 281 | 0.7% |
| White / Caucasian | 19,170 | 51.1% |
| Two or more Races | 1,478 | 3.9% |
| Some other Race | 1,042 | 2.8% |
| Total | 37,478 | 100.0% |
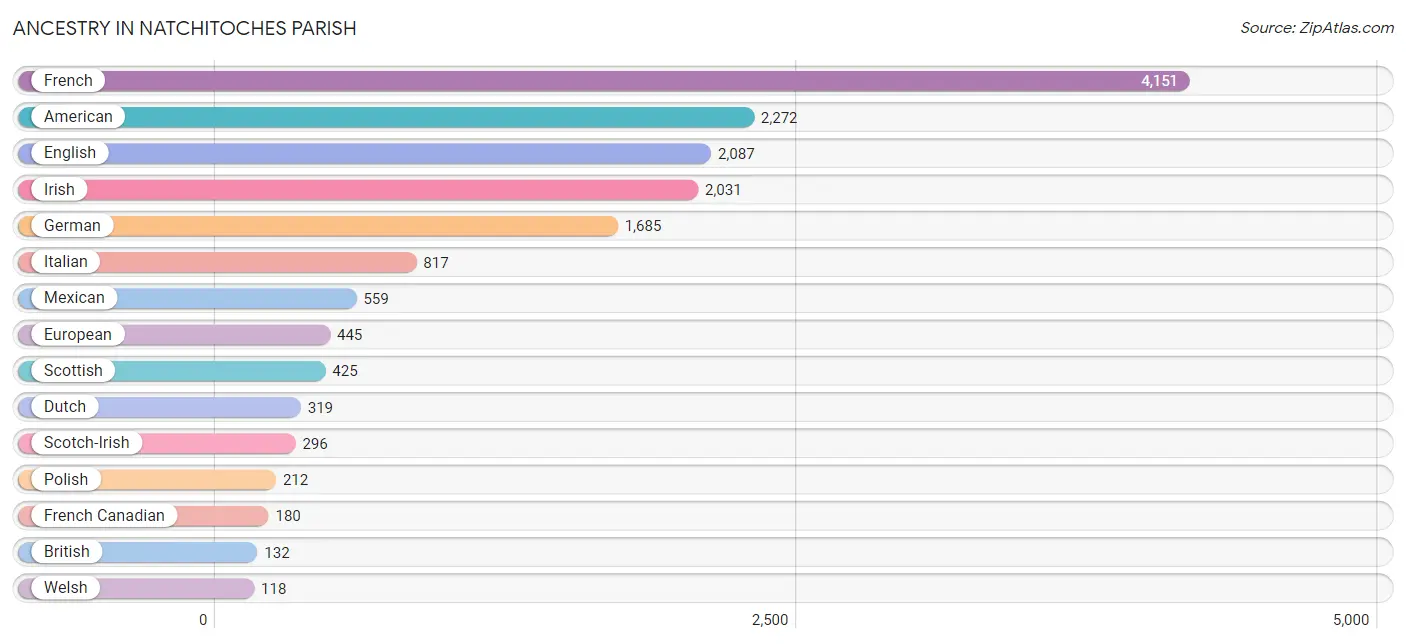
Ancestry in Natchitoches Parish
The most populous ancestries reported in Natchitoches Parish are French (4,151 | 11.1%), American (2,272 | 6.1%), English (2,087 | 5.6%), Irish (2,031 | 5.4%), and German (1,685 | 4.5%), together accounting for 32.6% of all Natchitoches Parish residents.
| Ancestry | # Population | % Population |
| African | 92 | 0.3% |
| American | 2,272 | 6.1% |
| Apache | 6 | 0.0% |
| Arab | 51 | 0.1% |
| Austrian | 86 | 0.2% |
| Basque | 48 | 0.1% |
| Belgian | 26 | 0.1% |
| Blackfeet | 11 | 0.0% |
| British | 132 | 0.4% |
| Burmese | 44 | 0.1% |
| Cajun | 45 | 0.1% |
| Celtic | 3 | 0.0% |
| Central American | 54 | 0.1% |
| Central American Indian | 50 | 0.1% |
| Cherokee | 75 | 0.2% |
| Choctaw | 37 | 0.1% |
| Colombian | 3 | 0.0% |
| Creek | 1 | 0.0% |
| Croatian | 12 | 0.0% |
| Cuban | 35 | 0.1% |
| Czech | 51 | 0.1% |
| Danish | 10 | 0.0% |
| Dutch | 319 | 0.9% |
| Dutch West Indian | 7 | 0.0% |
| Eastern European | 12 | 0.0% |
| Egyptian | 1 | 0.0% |
| English | 2,087 | 5.6% |
| European | 445 | 1.2% |
| Finnish | 2 | 0.0% |
| French | 4,151 | 11.1% |
| French American Indian | 5 | 0.0% |
| French Canadian | 180 | 0.5% |
| German | 1,685 | 4.5% |
| Greek | 37 | 0.1% |
| Guamanian / Chamorro | 13 | 0.0% |
| Guatemalan | 13 | 0.0% |
| Haitian | 34 | 0.1% |
| Honduran | 26 | 0.1% |
| Houma | 3 | 0.0% |
| Indian (Asian) | 106 | 0.3% |
| Inupiat | 4 | 0.0% |
| Irish | 2,031 | 5.4% |
| Iroquois | 18 | 0.1% |
| Italian | 817 | 2.2% |
| Jamaican | 16 | 0.0% |
| Jordanian | 10 | 0.0% |
| Korean | 35 | 0.1% |
| Lebanese | 4 | 0.0% |
| Mexican | 559 | 1.5% |
| Mexican American Indian | 2 | 0.0% |
| Native Hawaiian | 2 | 0.0% |
| Nigerian | 4 | 0.0% |
| Northern European | 59 | 0.2% |
| Norwegian | 40 | 0.1% |
| Polish | 212 | 0.6% |
| Portuguese | 12 | 0.0% |
| Potawatomi | 4 | 0.0% |
| Pueblo | 27 | 0.1% |
| Puerto Rican | 89 | 0.2% |
| Romanian | 1 | 0.0% |
| Russian | 14 | 0.0% |
| Salvadoran | 15 | 0.0% |
| Scandinavian | 17 | 0.1% |
| Scotch-Irish | 296 | 0.8% |
| Scottish | 425 | 1.1% |
| Serbian | 3 | 0.0% |
| Shoshone | 10 | 0.0% |
| Slovak | 2 | 0.0% |
| South American | 3 | 0.0% |
| Spaniard | 71 | 0.2% |
| Spanish | 68 | 0.2% |
| Sri Lankan | 35 | 0.1% |
| Subsaharan African | 96 | 0.3% |
| Swedish | 47 | 0.1% |
| Swiss | 10 | 0.0% |
| Syrian | 15 | 0.0% |
| Thai | 72 | 0.2% |
| Trinidadian and Tobagonian | 15 | 0.0% |
| Vietnamese | 25 | 0.1% |
| Welsh | 118 | 0.3% | View All 80 Rows |
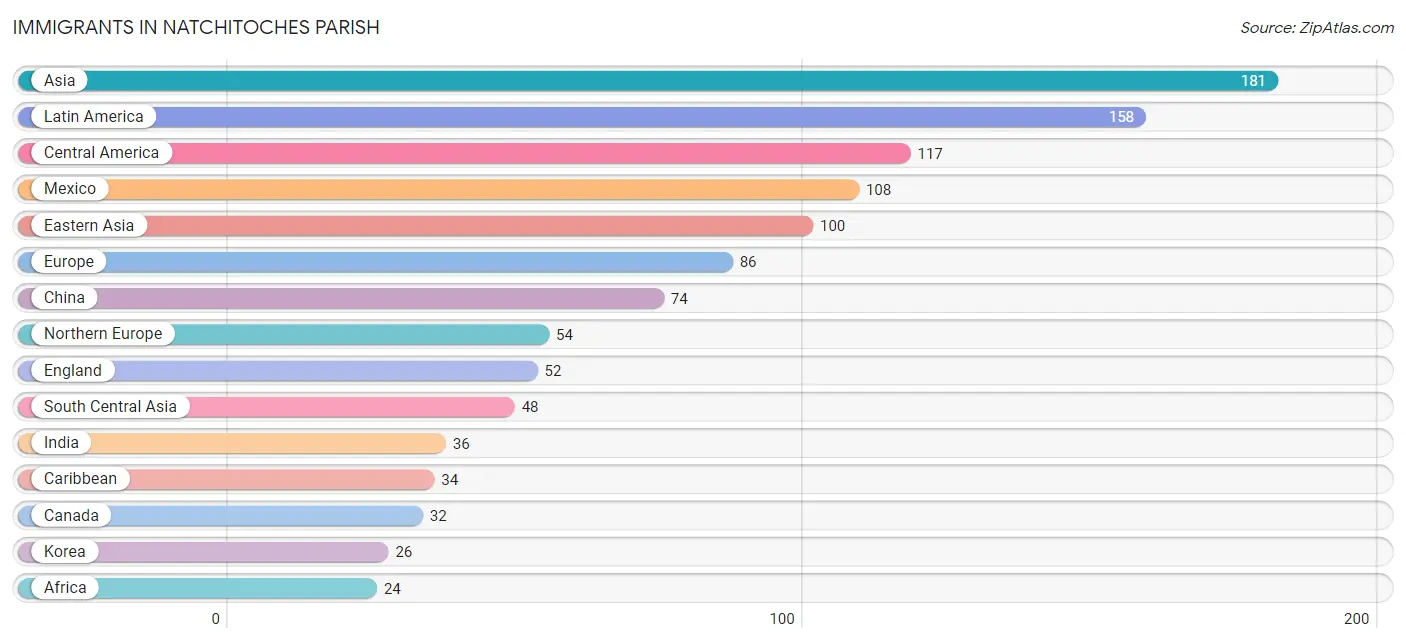
Immigrants in Natchitoches Parish
The most numerous immigrant groups reported in Natchitoches Parish came from Asia (181 | 0.5%), Latin America (158 | 0.4%), Central America (117 | 0.3%), Mexico (108 | 0.3%), and Eastern Asia (100 | 0.3%), together accounting for 1.8% of all Natchitoches Parish residents.
| Immigration Origin | # Population | % Population |
| Africa | 24 | 0.1% |
| Asia | 181 | 0.5% |
| Bangladesh | 12 | 0.0% |
| Belgium | 2 | 0.0% |
| Canada | 32 | 0.1% |
| Caribbean | 34 | 0.1% |
| Central America | 117 | 0.3% |
| China | 74 | 0.2% |
| Colombia | 3 | 0.0% |
| Cuba | 19 | 0.1% |
| Eastern Africa | 1 | 0.0% |
| Eastern Asia | 100 | 0.3% |
| Eastern Europe | 3 | 0.0% |
| El Salvador | 1 | 0.0% |
| England | 52 | 0.1% |
| Europe | 86 | 0.2% |
| France | 5 | 0.0% |
| Germany | 9 | 0.0% |
| Honduras | 8 | 0.0% |
| India | 36 | 0.1% |
| Italy | 13 | 0.0% |
| Jordan | 10 | 0.0% |
| Korea | 26 | 0.1% |
| Latin America | 158 | 0.4% |
| Mexico | 108 | 0.3% |
| Nigeria | 6 | 0.0% |
| Northern Africa | 15 | 0.0% |
| Northern Europe | 54 | 0.1% |
| Peru | 4 | 0.0% |
| Saudi Arabia | 1 | 0.0% |
| Serbia | 3 | 0.0% |
| South Africa | 2 | 0.0% |
| South America | 7 | 0.0% |
| South Central Asia | 48 | 0.1% |
| South Eastern Asia | 22 | 0.1% |
| Southern Europe | 13 | 0.0% |
| Trinidad and Tobago | 15 | 0.0% |
| Vietnam | 22 | 0.1% |
| Western Africa | 6 | 0.0% |
| Western Asia | 11 | 0.0% |
| Western Europe | 16 | 0.0% | View All 41 Rows |
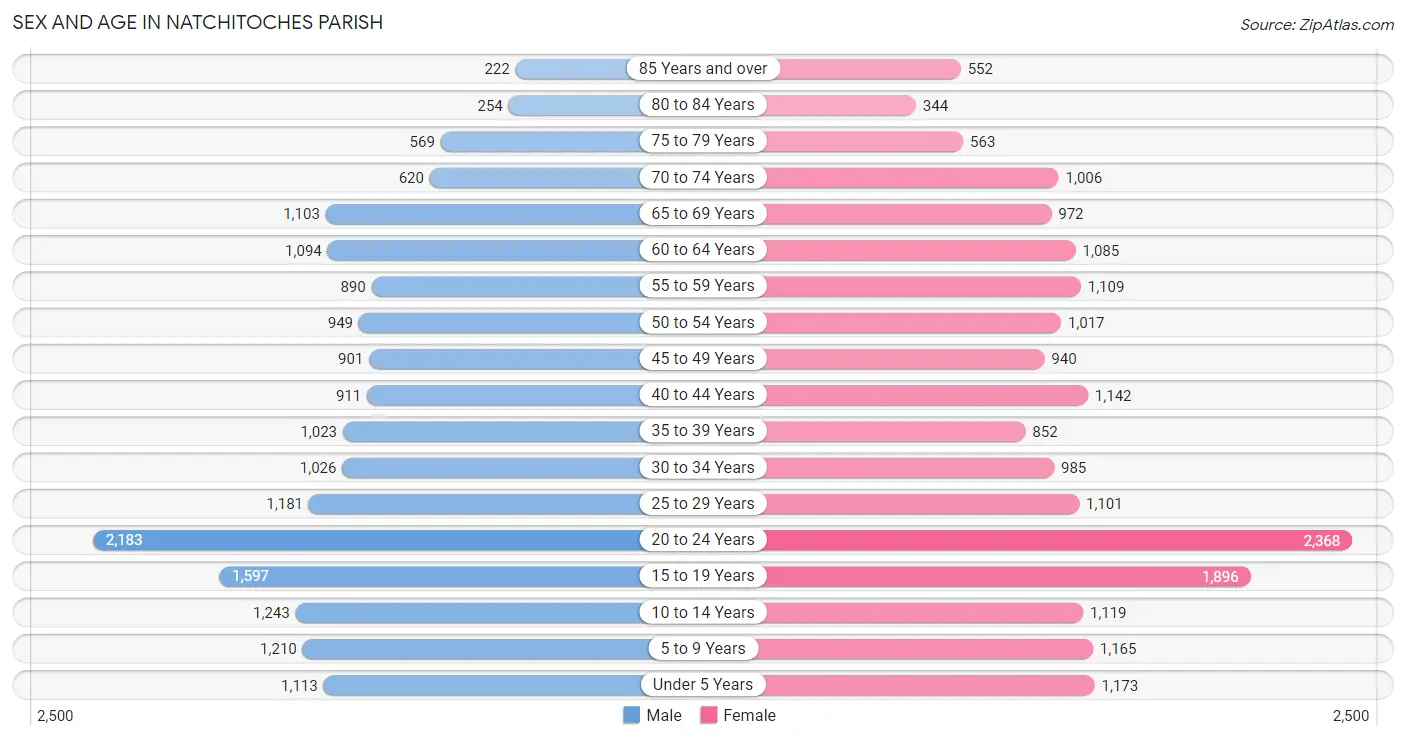
Sex and Age in Natchitoches Parish
Sex and Age in Natchitoches Parish
The most populous age groups in Natchitoches Parish are 20 to 24 Years (2,183 | 12.1%) for men and 20 to 24 Years (2,368 | 12.2%) for women.
| Age Bracket | Male | Female |
| Under 5 Years | 1,113 (6.1%) | 1,173 (6.0%) |
| 5 to 9 Years | 1,210 (6.7%) | 1,165 (6.0%) |
| 10 to 14 Years | 1,243 (6.9%) | 1,119 (5.8%) |
| 15 to 19 Years | 1,597 (8.8%) | 1,896 (9.8%) |
| 20 to 24 Years | 2,183 (12.1%) | 2,368 (12.2%) |
| 25 to 29 Years | 1,181 (6.5%) | 1,101 (5.7%) |
| 30 to 34 Years | 1,026 (5.7%) | 985 (5.1%) |
| 35 to 39 Years | 1,023 (5.7%) | 852 (4.4%) |
| 40 to 44 Years | 911 (5.0%) | 1,142 (5.9%) |
| 45 to 49 Years | 901 (5.0%) | 940 (4.9%) |
| 50 to 54 Years | 949 (5.2%) | 1,017 (5.2%) |
| 55 to 59 Years | 890 (4.9%) | 1,109 (5.7%) |
| 60 to 64 Years | 1,094 (6.0%) | 1,085 (5.6%) |
| 65 to 69 Years | 1,103 (6.1%) | 972 (5.0%) |
| 70 to 74 Years | 620 (3.4%) | 1,006 (5.2%) |
| 75 to 79 Years | 569 (3.2%) | 563 (2.9%) |
| 80 to 84 Years | 254 (1.4%) | 344 (1.8%) |
| 85 Years and over | 222 (1.2%) | 552 (2.9%) |
| Total | 18,089 (100.0%) | 19,389 (100.0%) |
Families and Households in Natchitoches Parish
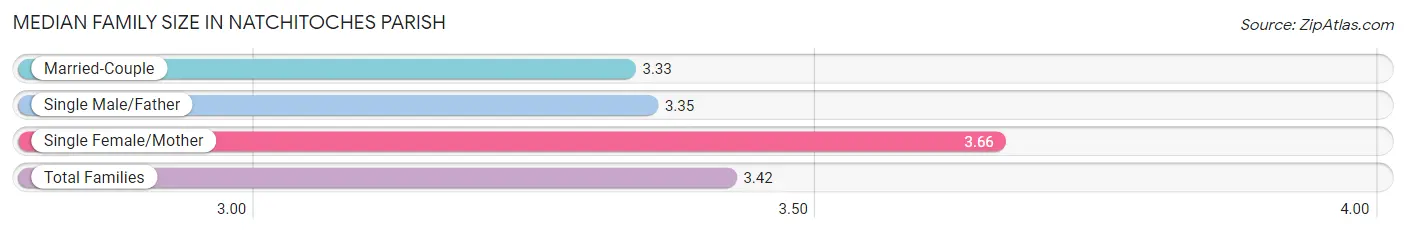
Median Family Size in Natchitoches Parish
The median family size in Natchitoches Parish is 3.42 persons per family, with single female/mother families (2,210 | 28.1%) accounting for the largest median family size of 3.66 persons per family. On the other hand, married-couple families (5,162 | 65.7%) represent the smallest median family size with 3.33 persons per family.
| Family Type | # Families | Family Size |
| Married-Couple | 5,162 (65.7%) | 3.33 |
| Single Male/Father | 487 (6.2%) | 3.35 |
| Single Female/Mother | 2,210 (28.1%) | 3.66 |
| Total Families | 7,859 (100.0%) | 3.42 |
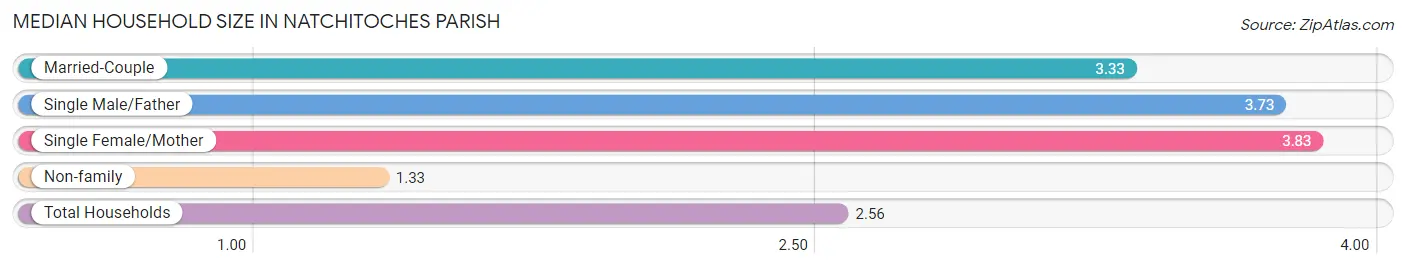
Median Household Size in Natchitoches Parish
The median household size in Natchitoches Parish is 2.56 persons per household, with single female/mother households (2,210 | 15.9%) accounting for the largest median household size of 3.83 persons per household. non-family households (6,007 | 43.3%) represent the smallest median household size with 1.33 persons per household.
| Household Type | # Households | Household Size |
| Married-Couple | 5,162 (37.2%) | 3.33 |
| Single Male/Father | 487 (3.5%) | 3.73 |
| Single Female/Mother | 2,210 (15.9%) | 3.83 |
| Non-family | 6,007 (43.3%) | 1.33 |
| Total Households | 13,866 (100.0%) | 2.56 |
Household Size by Marriage Status in Natchitoches Parish
Out of a total of 13,866 households in Natchitoches Parish, 7,859 (56.7%) are family households, while 6,007 (43.3%) are nonfamily households. The most numerous type of family households are 2-person households, comprising 4,025, and the most common type of nonfamily households are 1-person households, comprising 4,968.
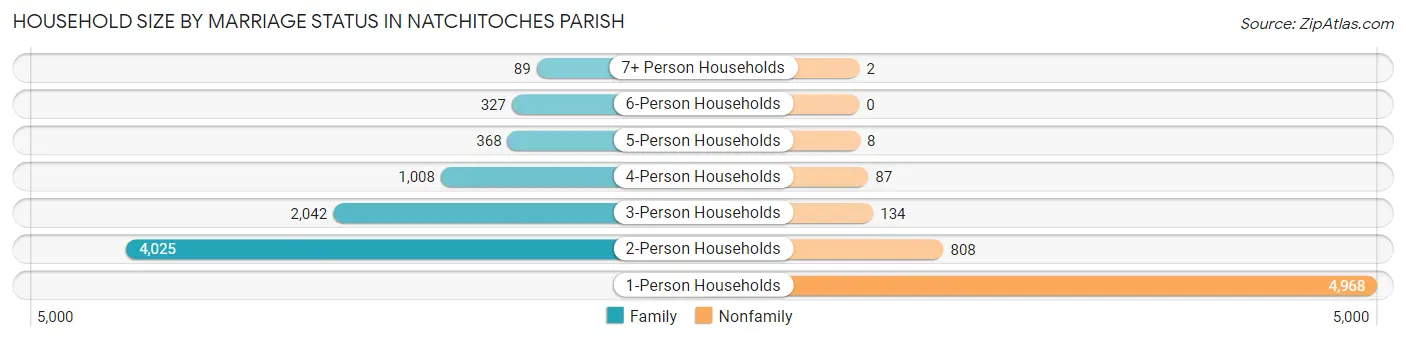
| Household Size | Family Households | Nonfamily Households |
| 1-Person Households | - | 4,968 (35.8%) |
| 2-Person Households | 4,025 (29.0%) | 808 (5.8%) |
| 3-Person Households | 2,042 (14.7%) | 134 (1.0%) |
| 4-Person Households | 1,008 (7.3%) | 87 (0.6%) |
| 5-Person Households | 368 (2.6%) | 8 (0.1%) |
| 6-Person Households | 327 (2.4%) | 0 (0.0%) |
| 7+ Person Households | 89 (0.6%) | 2 (0.0%) |
| Total | 7,859 (56.7%) | 6,007 (43.3%) |
Female Fertility in Natchitoches Parish
Fertility by Age in Natchitoches Parish
Average fertility rate in Natchitoches Parish is 60.0 births per 1,000 women. Women in the age bracket of 20 to 34 years have the highest fertility rate with 104.0 births per 1,000 women. Women in the age bracket of 20 to 34 years acount for 82.4% of all women with births.
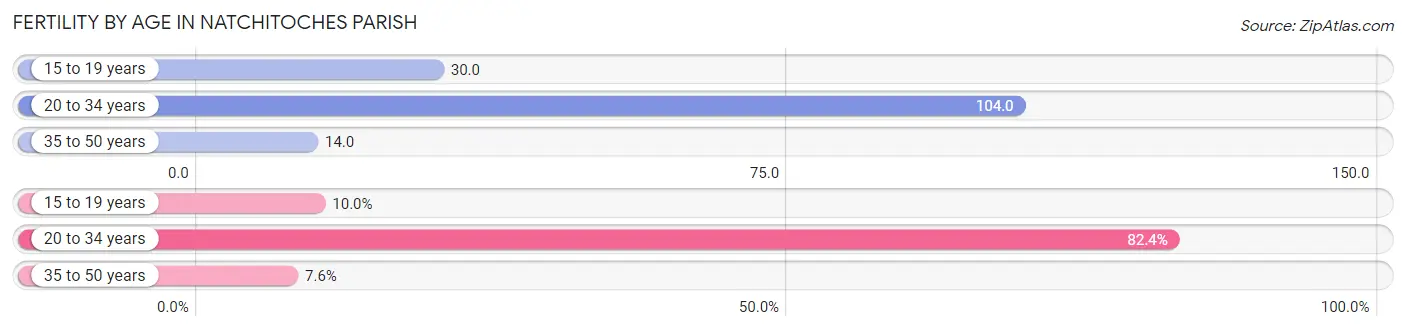
| Age Bracket | Women with Births | Births / 1,000 Women |
| 15 to 19 years | 56 (10.0%) | 30.0 |
| 20 to 34 years | 464 (82.4%) | 104.0 |
| 35 to 50 years | 43 (7.6%) | 14.0 |
| Total | 563 (100.0%) | 60.0 |
Fertility by Age by Marriage Status in Natchitoches Parish
48.7% of women with births (563) in Natchitoches Parish are married. The highest percentage of unmarried women with births falls into 15 to 19 years age bracket with 100.0% of them unmarried at the time of birth, while the lowest percentage of unmarried women with births belong to 35 to 50 years age bracket with 11.6% of them unmarried.
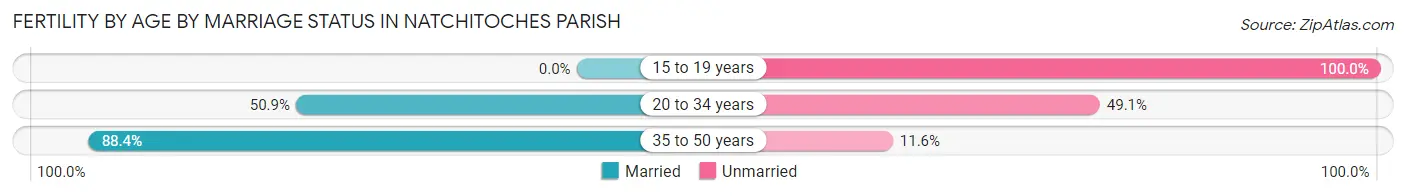
| Age Bracket | Married | Unmarried |
| 15 to 19 years | 0 (0.0%) | 56 (100.0%) |
| 20 to 34 years | 236 (50.9%) | 228 (49.1%) |
| 35 to 50 years | 38 (88.4%) | 5 (11.6%) |
| Total | 274 (48.7%) | 289 (51.3%) |
Fertility by Education in Natchitoches Parish
Average fertility rate in Natchitoches Parish is 60.0 births per 1,000 women. Women with the education attainment of graduate degree have the highest fertility rate of 159.0 births per 1,000 women, while women with the education attainment of bachelor's degree have the lowest fertility at 34.0 births per 1,000 women. Women with the education attainment of high school diploma represent 40.7% of all women with births.
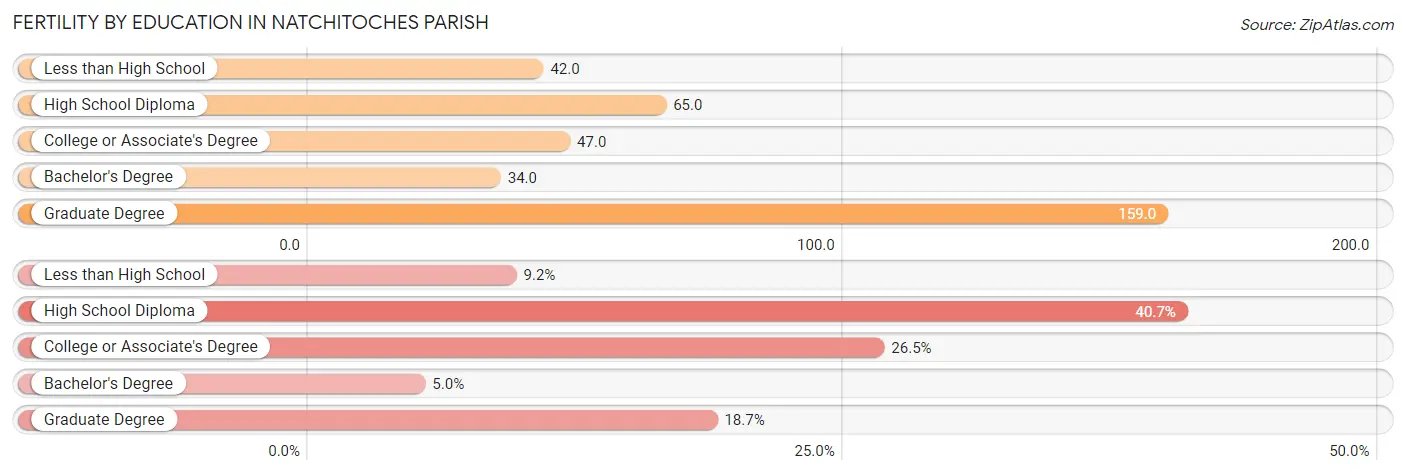
| Educational Attainment | Women with Births | Births / 1,000 Women |
| Less than High School | 52 (9.2%) | 42.0 |
| High School Diploma | 229 (40.7%) | 65.0 |
| College or Associate's Degree | 149 (26.5%) | 47.0 |
| Bachelor's Degree | 28 (5.0%) | 34.0 |
| Graduate Degree | 105 (18.6%) | 159.0 |
| Total | 563 (100.0%) | 60.0 |
Fertility by Education by Marriage Status in Natchitoches Parish
51.3% of women with births in Natchitoches Parish are unmarried. Women with the educational attainment of graduate degree are most likely to be married with 100.0% of them married at childbirth, while women with the educational attainment of less than high school are least likely to be married with 76.9% of them unmarried at childbirth.
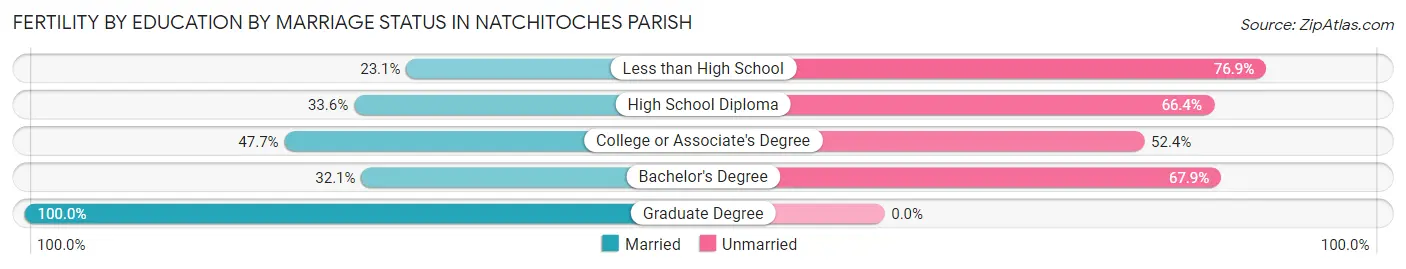
| Educational Attainment | Married | Unmarried |
| Less than High School | 12 (23.1%) | 40 (76.9%) |
| High School Diploma | 77 (33.6%) | 152 (66.4%) |
| College or Associate's Degree | 71 (47.6%) | 78 (52.3%) |
| Bachelor's Degree | 9 (32.1%) | 19 (67.9%) |
| Graduate Degree | 105 (100.0%) | 0 (0.0%) |
| Total | 274 (48.7%) | 289 (51.3%) |
Employment Characteristics in Natchitoches Parish
Employment by Class of Employer in Natchitoches Parish
Among the 14,014 employed individuals in Natchitoches Parish, private company employees (8,848 | 63.1%), state government employees (1,546 | 11.0%), and local government employees (1,041 | 7.4%) make up the most common classes of employment.
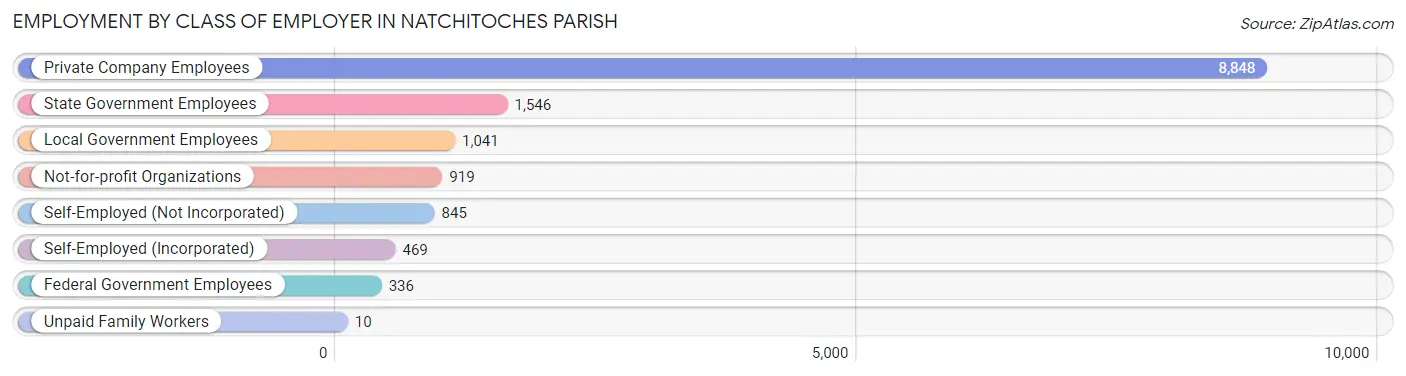
| Employer Class | # Employees | % Employees |
| Private Company Employees | 8,848 | 63.1% |
| Self-Employed (Incorporated) | 469 | 3.4% |
| Self-Employed (Not Incorporated) | 845 | 6.0% |
| Not-for-profit Organizations | 919 | 6.6% |
| Local Government Employees | 1,041 | 7.4% |
| State Government Employees | 1,546 | 11.0% |
| Federal Government Employees | 336 | 2.4% |
| Unpaid Family Workers | 10 | 0.1% |
| Total | 14,014 | 100.0% |
Employment Status by Age in Natchitoches Parish
According to the labor force statistics for Natchitoches Parish, out of the total population over 16 years of age (29,905), 51.9% or 15,521 individuals are in the labor force, with 8.9% or 1,381 of them unemployed. The age group with the highest labor force participation rate is 45 to 54 years, with 77.6% or 2,954 individuals in the labor force. Within the labor force, the 16 to 19 years age range has the highest percentage of unemployed individuals, with 31.5% or 279 of them being unemployed.
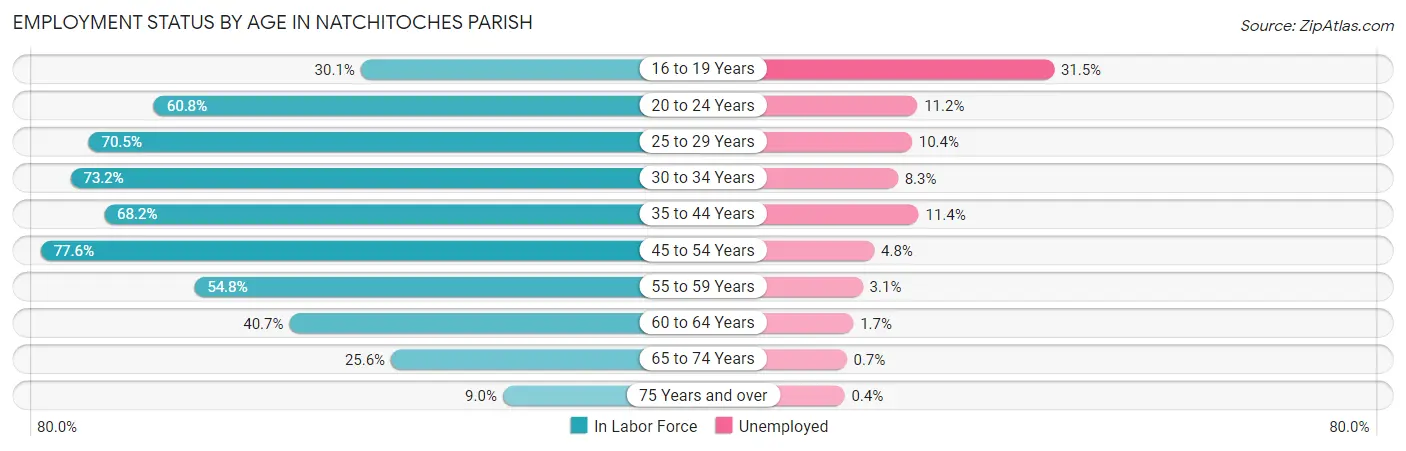
| Age Bracket | In Labor Force | Unemployed |
| 16 to 19 Years | 886 (30.1%) | 279 (31.5%) |
| 20 to 24 Years | 2,767 (60.8%) | 310 (11.2%) |
| 25 to 29 Years | 1,609 (70.5%) | 167 (10.4%) |
| 30 to 34 Years | 1,472 (73.2%) | 122 (8.3%) |
| 35 to 44 Years | 2,679 (68.2%) | 305 (11.4%) |
| 45 to 54 Years | 2,954 (77.6%) | 142 (4.8%) |
| 55 to 59 Years | 1,095 (54.8%) | 34 (3.1%) |
| 60 to 64 Years | 887 (40.7%) | 15 (1.7%) |
| 65 to 74 Years | 947 (25.6%) | 7 (0.7%) |
| 75 Years and over | 225 (9.0%) | 1 (0.4%) |
| Total | 15,521 (51.9%) | 1,381 (8.9%) |
Employment Status by Educational Attainment in Natchitoches Parish
According to labor force statistics for Natchitoches Parish, 66.0% of individuals (10,696) out of the total population between 25 and 64 years of age (16,206) are in the labor force, with 7.3% or 781 of them being unemployed. The group with the highest labor force participation rate are those with the educational attainment of bachelor's degree or higher, with 89.5% or 2,975 individuals in the labor force. Within the labor force, individuals with high school diploma education have the highest percentage of unemployment, with 14.0% or 481 of them being unemployed.
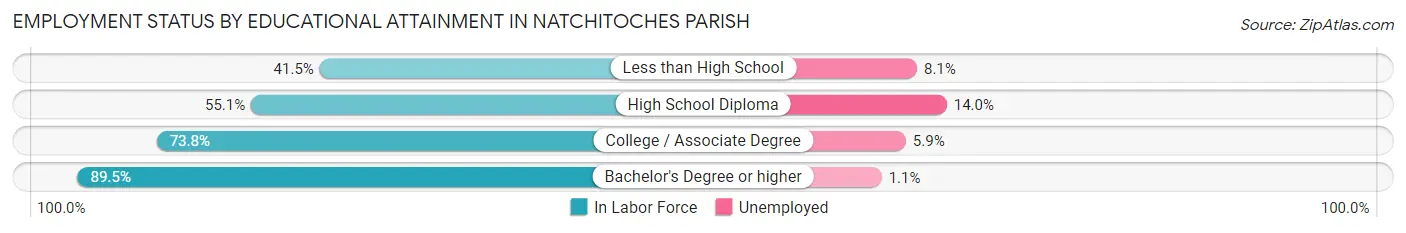
| Educational Attainment | In Labor Force | Unemployed |
| Less than High School | 799 (41.5%) | 156 (8.1%) |
| High School Diploma | 3,435 (55.1%) | 873 (14.0%) |
| College / Associate Degree | 3,484 (73.8%) | 279 (5.9%) |
| Bachelor's Degree or higher | 2,975 (89.5%) | 37 (1.1%) |
| Total | 10,696 (66.0%) | 1,183 (7.3%) |
Employment Occupations by Sex in Natchitoches Parish
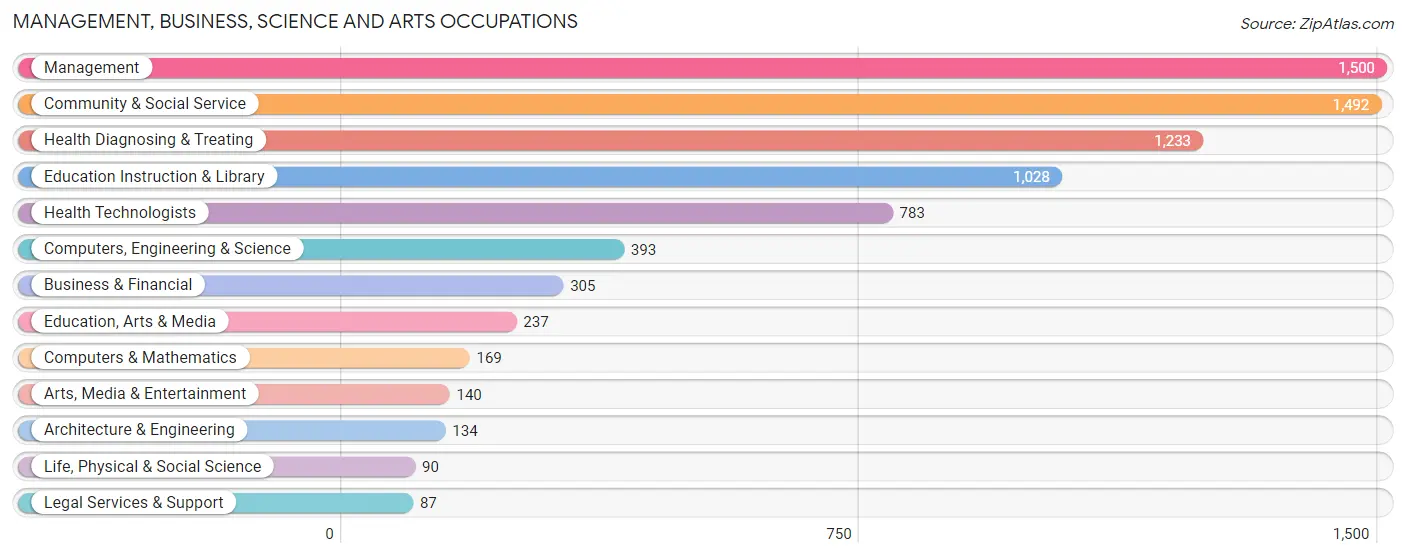
Management, Business, Science and Arts Occupations
The most common Management, Business, Science and Arts occupations in Natchitoches Parish are Management (1,500 | 10.6%), Community & Social Service (1,492 | 10.6%), Health Diagnosing & Treating (1,233 | 8.7%), Education Instruction & Library (1,028 | 7.3%), and Health Technologists (783 | 5.5%).
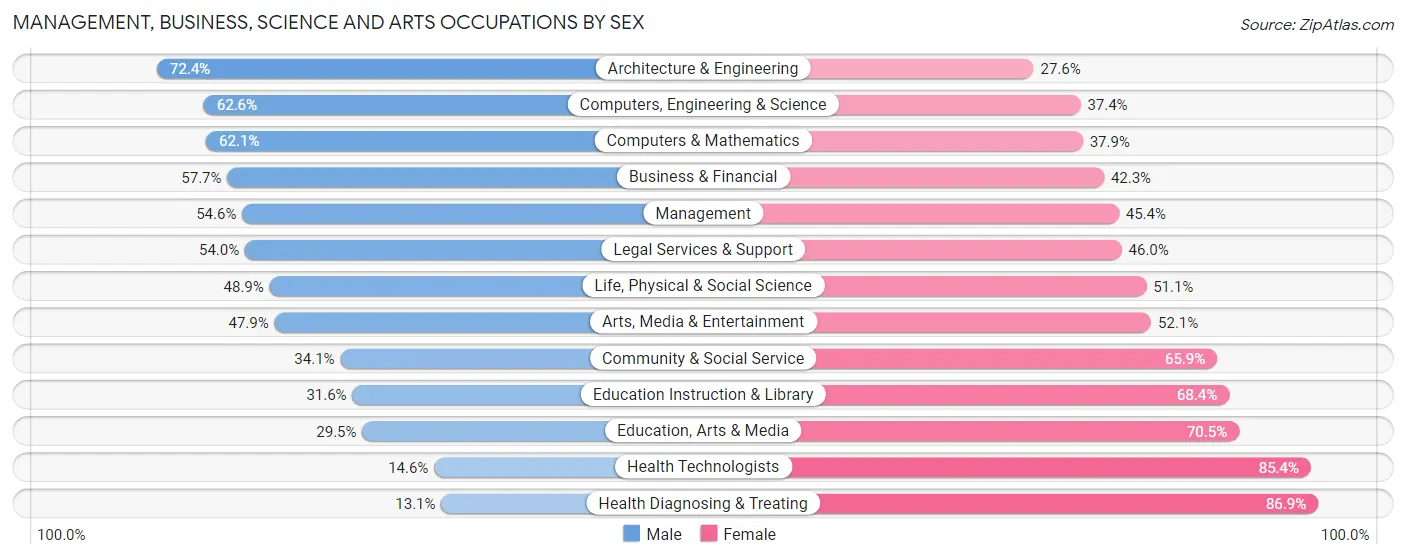
Management, Business, Science and Arts Occupations by Sex
Within the Management, Business, Science and Arts occupations in Natchitoches Parish, the most male-oriented occupations are Architecture & Engineering (72.4%), Computers, Engineering & Science (62.6%), and Computers & Mathematics (62.1%), while the most female-oriented occupations are Health Diagnosing & Treating (86.9%), Health Technologists (85.4%), and Education, Arts & Media (70.5%).
| Occupation | Male | Female |
| Management | 819 (54.6%) | 681 (45.4%) |
| Business & Financial | 176 (57.7%) | 129 (42.3%) |
| Computers, Engineering & Science | 246 (62.6%) | 147 (37.4%) |
| Computers & Mathematics | 105 (62.1%) | 64 (37.9%) |
| Architecture & Engineering | 97 (72.4%) | 37 (27.6%) |
| Life, Physical & Social Science | 44 (48.9%) | 46 (51.1%) |
| Community & Social Service | 509 (34.1%) | 983 (65.9%) |
| Education, Arts & Media | 70 (29.5%) | 167 (70.5%) |
| Legal Services & Support | 47 (54.0%) | 40 (46.0%) |
| Education Instruction & Library | 325 (31.6%) | 703 (68.4%) |
| Arts, Media & Entertainment | 67 (47.9%) | 73 (52.1%) |
| Health Diagnosing & Treating | 161 (13.1%) | 1,072 (86.9%) |
| Health Technologists | 114 (14.6%) | 669 (85.4%) |
| Total (Category) | 1,911 (38.8%) | 3,012 (61.2%) |
| Total (Overall) | 6,856 (48.5%) | 7,271 (51.5%) |
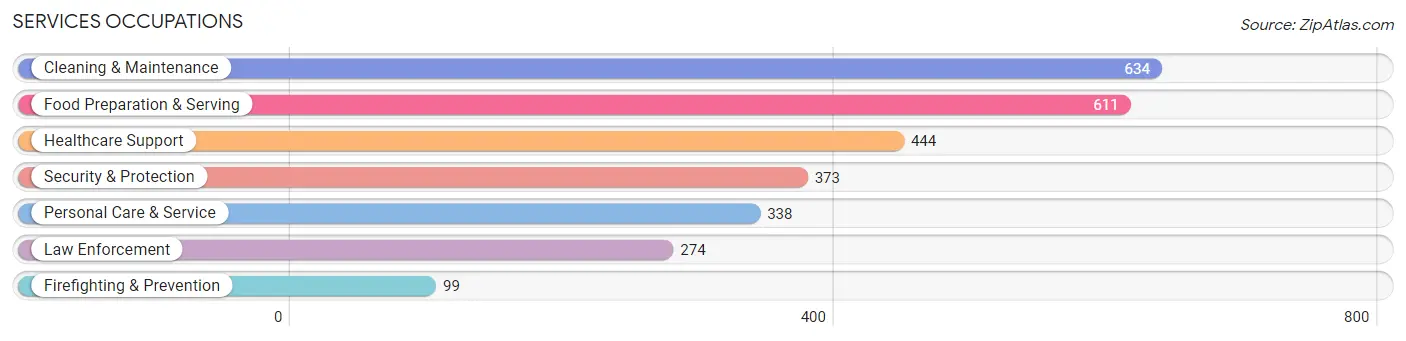
Services Occupations
The most common Services occupations in Natchitoches Parish are Cleaning & Maintenance (634 | 4.5%), Food Preparation & Serving (611 | 4.3%), Healthcare Support (444 | 3.1%), Security & Protection (373 | 2.6%), and Personal Care & Service (338 | 2.4%).
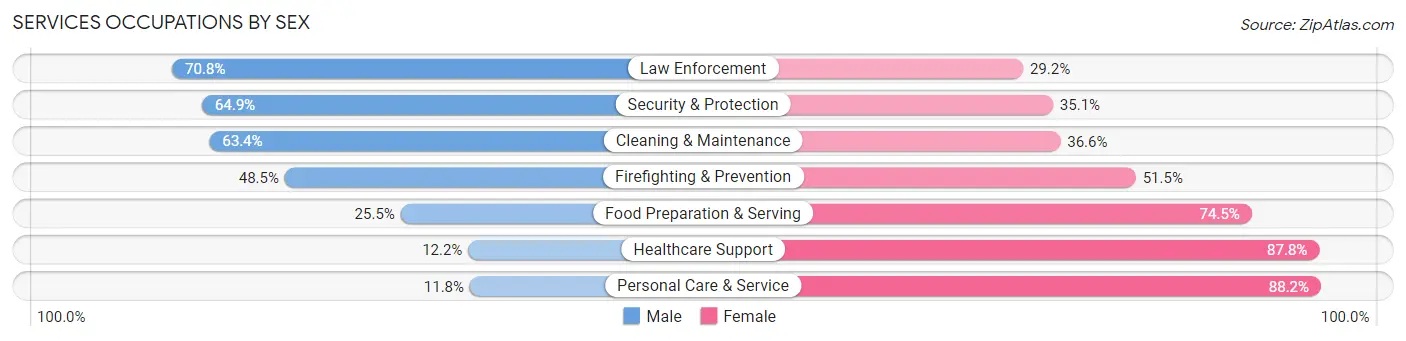
Services Occupations by Sex
Within the Services occupations in Natchitoches Parish, the most male-oriented occupations are Law Enforcement (70.8%), Security & Protection (64.9%), and Cleaning & Maintenance (63.4%), while the most female-oriented occupations are Personal Care & Service (88.2%), Healthcare Support (87.8%), and Food Preparation & Serving (74.5%).
| Occupation | Male | Female |
| Healthcare Support | 54 (12.2%) | 390 (87.8%) |
| Security & Protection | 242 (64.9%) | 131 (35.1%) |
| Firefighting & Prevention | 48 (48.5%) | 51 (51.5%) |
| Law Enforcement | 194 (70.8%) | 80 (29.2%) |
| Food Preparation & Serving | 156 (25.5%) | 455 (74.5%) |
| Cleaning & Maintenance | 402 (63.4%) | 232 (36.6%) |
| Personal Care & Service | 40 (11.8%) | 298 (88.2%) |
| Total (Category) | 894 (37.2%) | 1,506 (62.7%) |
| Total (Overall) | 6,856 (48.5%) | 7,271 (51.5%) |
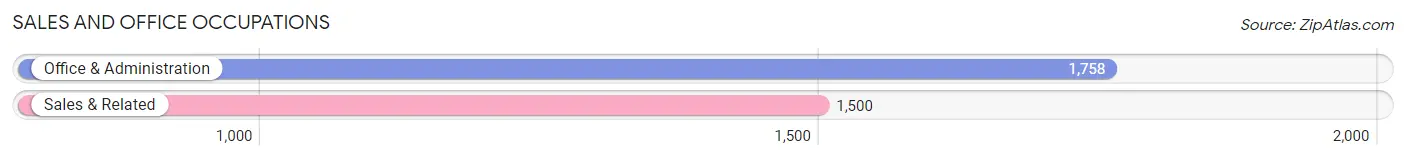
Sales and Office Occupations
The most common Sales and Office occupations in Natchitoches Parish are Office & Administration (1,758 | 12.4%), and Sales & Related (1,500 | 10.6%).
Sales and Office Occupations by Sex
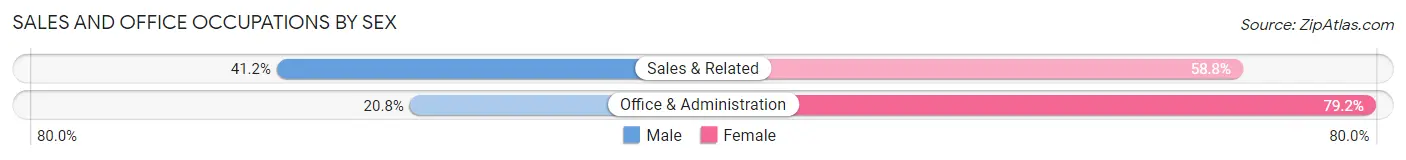
| Occupation | Male | Female |
| Sales & Related | 618 (41.2%) | 882 (58.8%) |
| Office & Administration | 365 (20.8%) | 1,393 (79.2%) |
| Total (Category) | 983 (30.2%) | 2,275 (69.8%) |
| Total (Overall) | 6,856 (48.5%) | 7,271 (51.5%) |
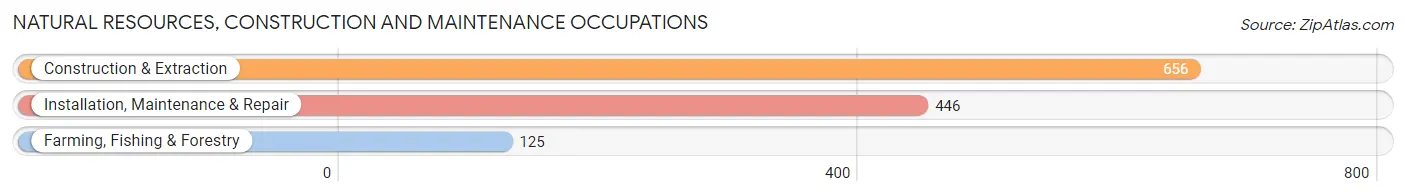
Natural Resources, Construction and Maintenance Occupations
The most common Natural Resources, Construction and Maintenance occupations in Natchitoches Parish are Construction & Extraction (656 | 4.6%), Installation, Maintenance & Repair (446 | 3.2%), and Farming, Fishing & Forestry (125 | 0.9%).
Natural Resources, Construction and Maintenance Occupations by Sex
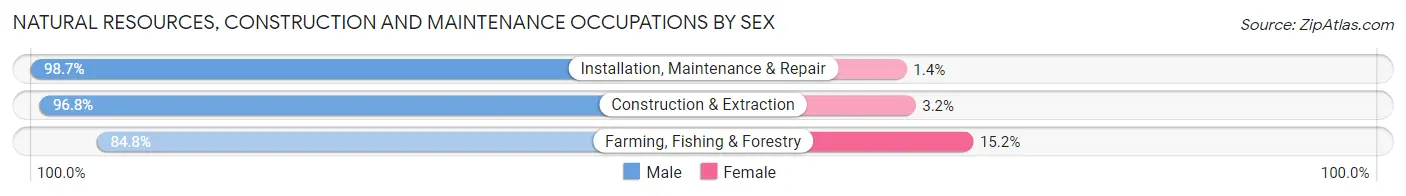
| Occupation | Male | Female |
| Farming, Fishing & Forestry | 106 (84.8%) | 19 (15.2%) |
| Construction & Extraction | 635 (96.8%) | 21 (3.2%) |
| Installation, Maintenance & Repair | 440 (98.7%) | 6 (1.3%) |
| Total (Category) | 1,181 (96.3%) | 46 (3.7%) |
| Total (Overall) | 6,856 (48.5%) | 7,271 (51.5%) |
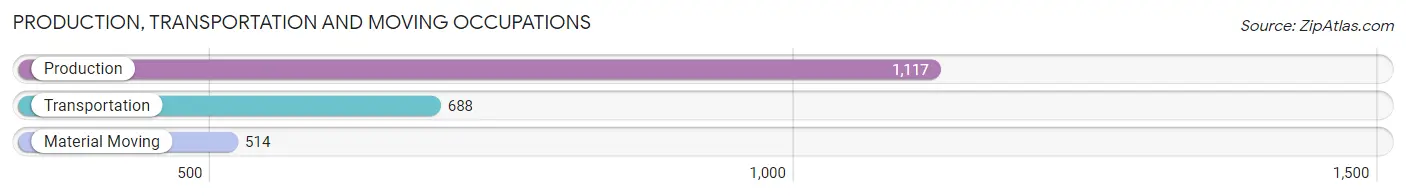
Production, Transportation and Moving Occupations
The most common Production, Transportation and Moving occupations in Natchitoches Parish are Production (1,117 | 7.9%), Transportation (688 | 4.9%), and Material Moving (514 | 3.6%).
Production, Transportation and Moving Occupations by Sex
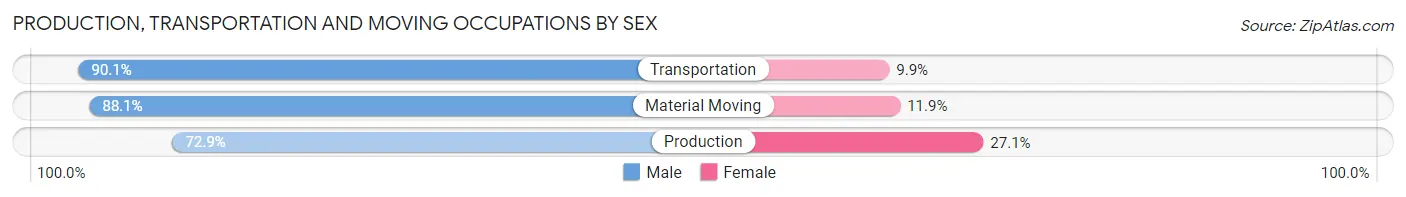
| Occupation | Male | Female |
| Production | 814 (72.9%) | 303 (27.1%) |
| Transportation | 620 (90.1%) | 68 (9.9%) |
| Material Moving | 453 (88.1%) | 61 (11.9%) |
| Total (Category) | 1,887 (81.4%) | 432 (18.6%) |
| Total (Overall) | 6,856 (48.5%) | 7,271 (51.5%) |
Employment Industries by Sex in Natchitoches Parish
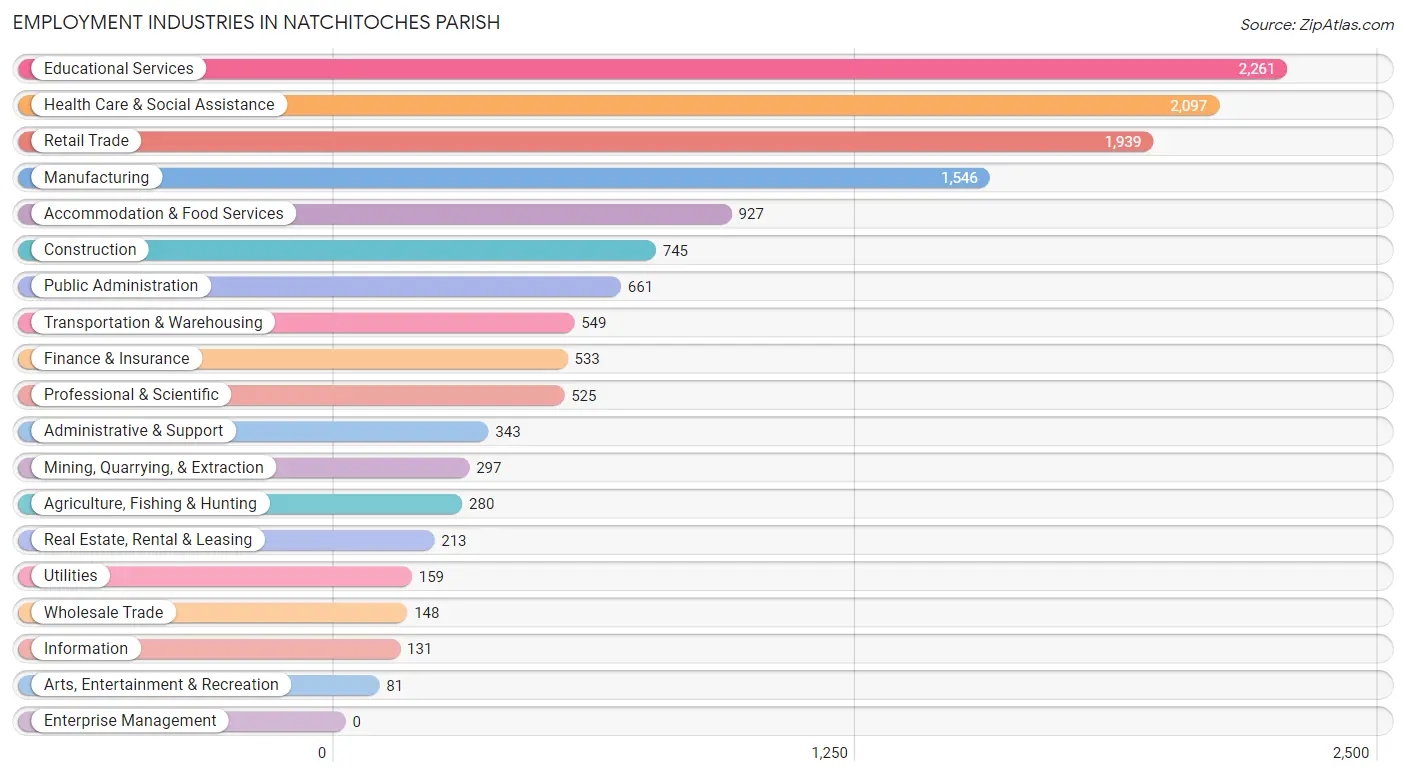
Employment Industries in Natchitoches Parish
The major employment industries in Natchitoches Parish include Educational Services (2,261 | 16.0%), Health Care & Social Assistance (2,097 | 14.8%), Retail Trade (1,939 | 13.7%), Manufacturing (1,546 | 10.9%), and Accommodation & Food Services (927 | 6.6%).
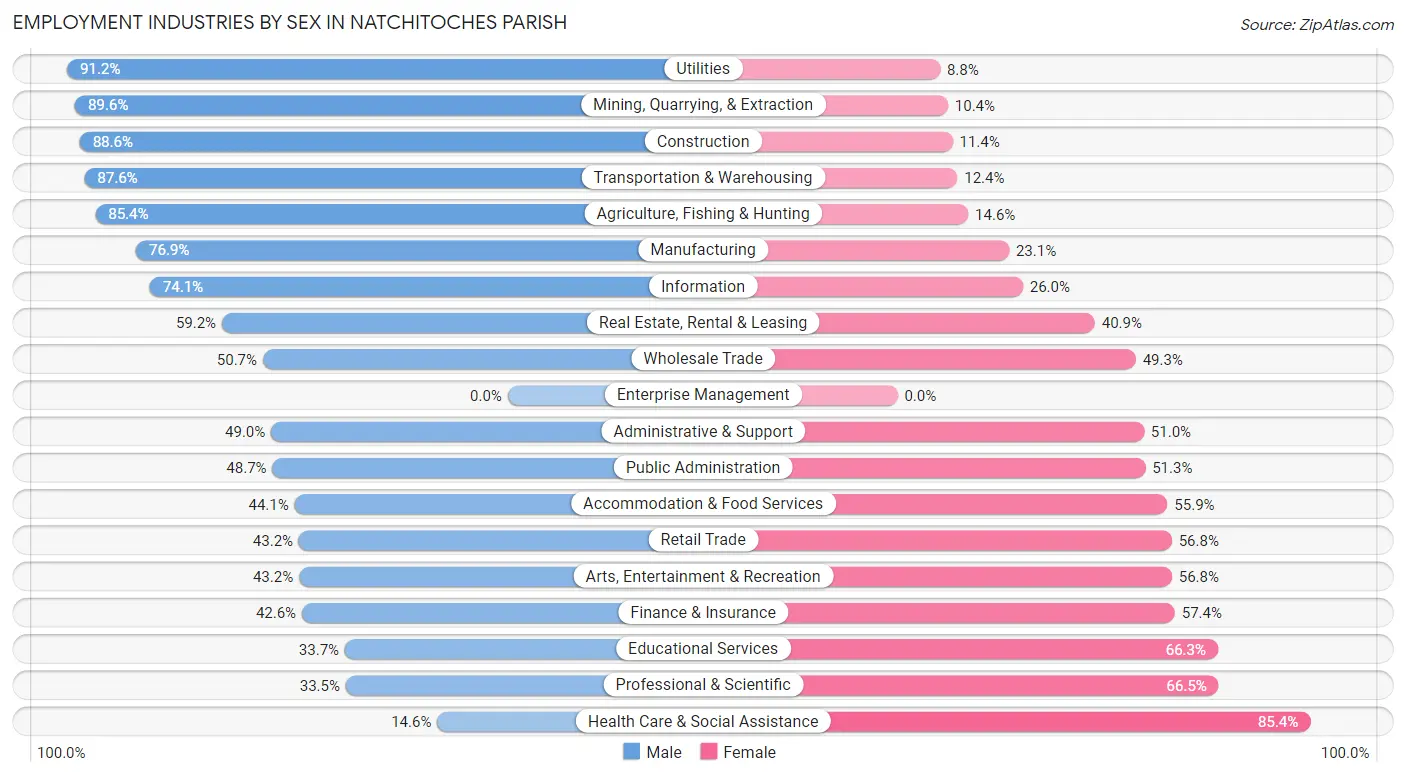
Employment Industries by Sex in Natchitoches Parish
The Natchitoches Parish industries that see more men than women are Utilities (91.2%), Mining, Quarrying, & Extraction (89.6%), and Construction (88.6%), whereas the industries that tend to have a higher number of women are Health Care & Social Assistance (85.4%), Professional & Scientific (66.5%), and Educational Services (66.3%).
| Industry | Male | Female |
| Agriculture, Fishing & Hunting | 239 (85.4%) | 41 (14.6%) |
| Mining, Quarrying, & Extraction | 266 (89.6%) | 31 (10.4%) |
| Construction | 660 (88.6%) | 85 (11.4%) |
| Manufacturing | 1,189 (76.9%) | 357 (23.1%) |
| Wholesale Trade | 75 (50.7%) | 73 (49.3%) |
| Retail Trade | 838 (43.2%) | 1,101 (56.8%) |
| Transportation & Warehousing | 481 (87.6%) | 68 (12.4%) |
| Utilities | 145 (91.2%) | 14 (8.8%) |
| Information | 97 (74.1%) | 34 (26.0%) |
| Finance & Insurance | 227 (42.6%) | 306 (57.4%) |
| Real Estate, Rental & Leasing | 126 (59.2%) | 87 (40.8%) |
| Professional & Scientific | 176 (33.5%) | 349 (66.5%) |
| Enterprise Management | 0 (0.0%) | 0 (0.0%) |
| Administrative & Support | 168 (49.0%) | 175 (51.0%) |
| Educational Services | 762 (33.7%) | 1,499 (66.3%) |
| Health Care & Social Assistance | 306 (14.6%) | 1,791 (85.4%) |
| Arts, Entertainment & Recreation | 35 (43.2%) | 46 (56.8%) |
| Accommodation & Food Services | 409 (44.1%) | 518 (55.9%) |
| Public Administration | 322 (48.7%) | 339 (51.3%) |
| Total | 6,856 (48.5%) | 7,271 (51.5%) |
Education in Natchitoches Parish
School Enrollment in Natchitoches Parish
The most common levels of schooling among the 10,987 students in Natchitoches Parish are college / undergraduate (4,440 | 40.4%), elementary school (2,028 | 18.5%), and high school (1,849 | 16.8%).
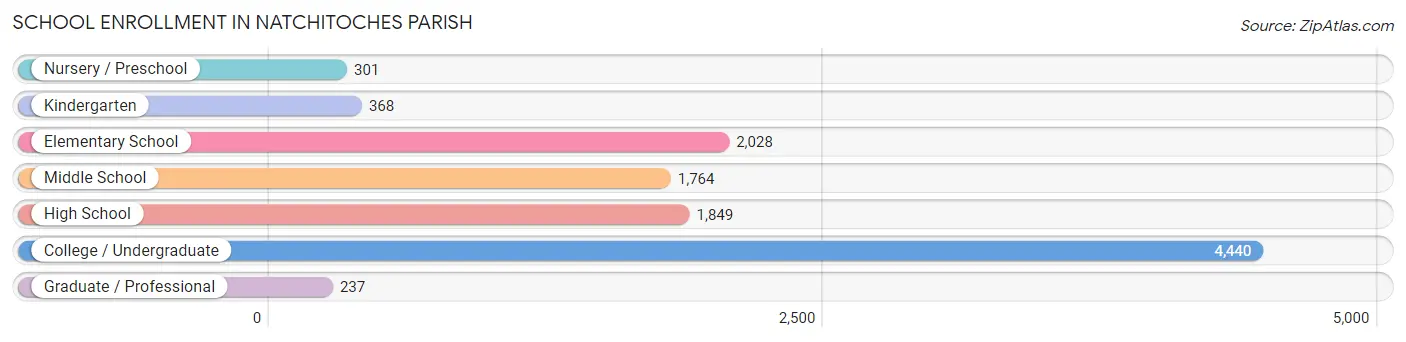
| School Level | # Students | % Students |
| Nursery / Preschool | 301 | 2.7% |
| Kindergarten | 368 | 3.4% |
| Elementary School | 2,028 | 18.5% |
| Middle School | 1,764 | 16.1% |
| High School | 1,849 | 16.8% |
| College / Undergraduate | 4,440 | 40.4% |
| Graduate / Professional | 237 | 2.2% |
| Total | 10,987 | 100.0% |
School Enrollment by Age by Funding Source in Natchitoches Parish
Out of a total of 10,987 students who are enrolled in schools in Natchitoches Parish, 1,242 (11.3%) attend a private institution, while the remaining 9,745 (88.7%) are enrolled in public schools. The age group of 35 years and over has the highest likelihood of being enrolled in private schools, with 94 (23.6% in the age bracket) enrolled. Conversely, the age group of 18 to 19 year olds has the lowest likelihood of being enrolled in a private school, with 1,608 (95.8% in the age bracket) attending a public institution.
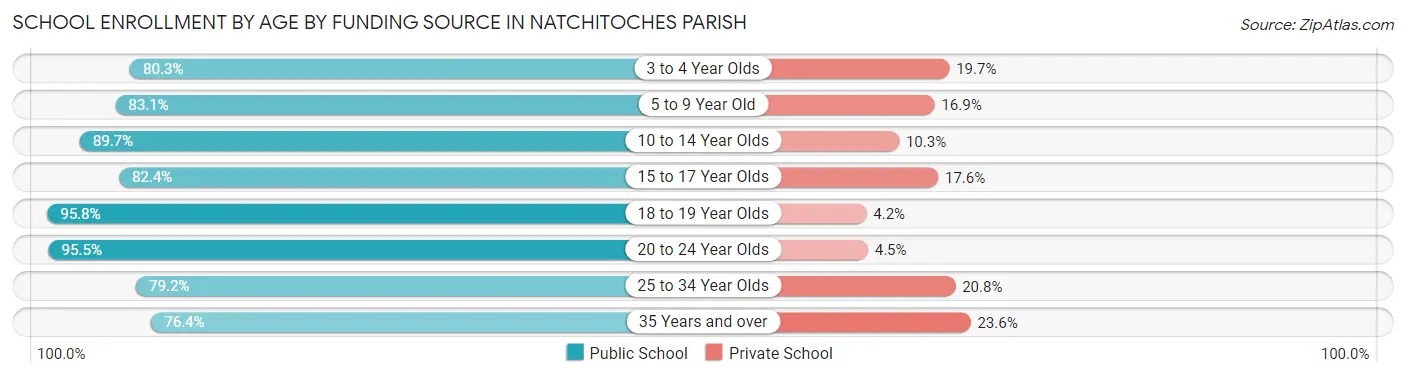
| Age Bracket | Public School | Private School |
| 3 to 4 Year Olds | 188 (80.3%) | 46 (19.7%) |
| 5 to 9 Year Old | 1,940 (83.1%) | 395 (16.9%) |
| 10 to 14 Year Olds | 1,942 (89.7%) | 223 (10.3%) |
| 15 to 17 Year Olds | 1,139 (82.4%) | 243 (17.6%) |
| 18 to 19 Year Olds | 1,608 (95.8%) | 71 (4.2%) |
| 20 to 24 Year Olds | 2,425 (95.5%) | 114 (4.5%) |
| 25 to 34 Year Olds | 202 (79.2%) | 53 (20.8%) |
| 35 Years and over | 304 (76.4%) | 94 (23.6%) |
| Total | 9,745 (88.7%) | 1,242 (11.3%) |
Educational Attainment by Field of Study in Natchitoches Parish
Education (1,008 | 17.7%), science & technology (854 | 15.0%), business (847 | 14.9%), arts & humanities (539 | 9.5%), and liberal arts & history (489 | 8.6%) are the most common fields of study among 5,692 individuals in Natchitoches Parish who have obtained a bachelor's degree or higher.
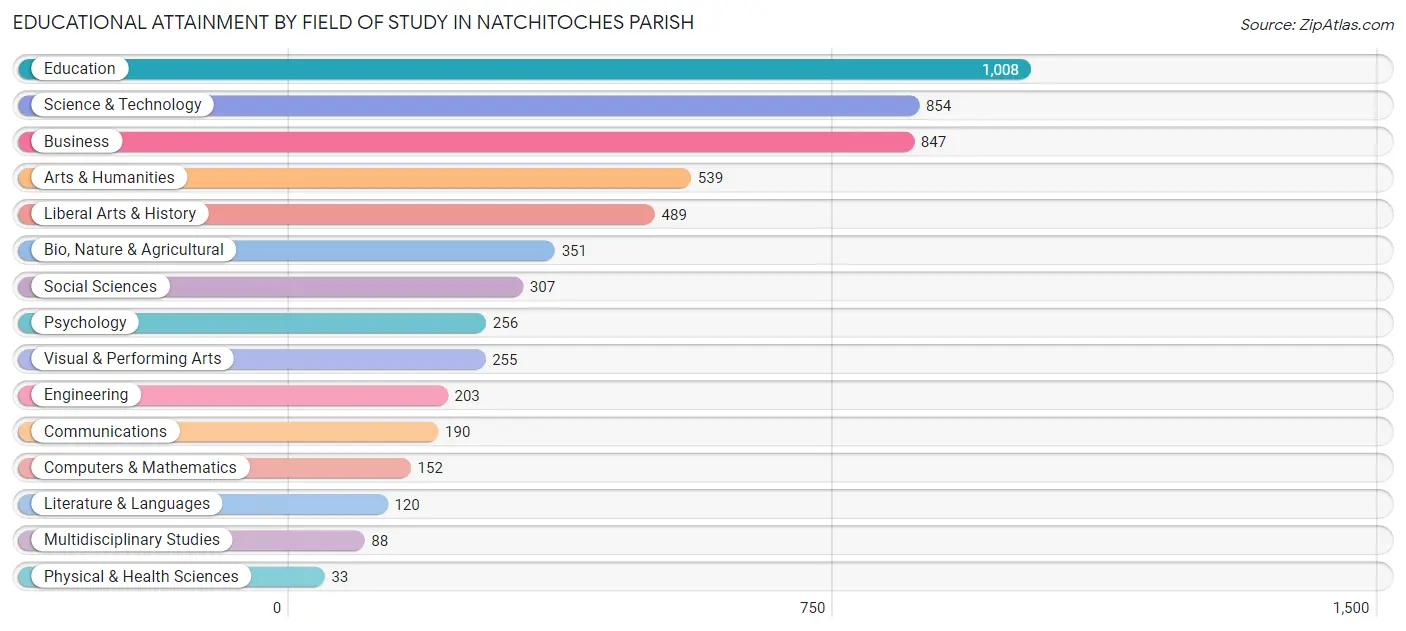
| Field of Study | # Graduates | % Graduates |
| Computers & Mathematics | 152 | 2.7% |
| Bio, Nature & Agricultural | 351 | 6.2% |
| Physical & Health Sciences | 33 | 0.6% |
| Psychology | 256 | 4.5% |
| Social Sciences | 307 | 5.4% |
| Engineering | 203 | 3.6% |
| Multidisciplinary Studies | 88 | 1.5% |
| Science & Technology | 854 | 15.0% |
| Business | 847 | 14.9% |
| Education | 1,008 | 17.7% |
| Literature & Languages | 120 | 2.1% |
| Liberal Arts & History | 489 | 8.6% |
| Visual & Performing Arts | 255 | 4.5% |
| Communications | 190 | 3.3% |
| Arts & Humanities | 539 | 9.5% |
| Total | 5,692 | 100.0% |
Transportation & Commute in Natchitoches Parish
Vehicle Availability by Sex in Natchitoches Parish
The most prevalent vehicle ownership categories in Natchitoches Parish are males with 2 vehicles (2,680, accounting for 39.5%) and females with 2 vehicles (2,805, making up 39.1%).
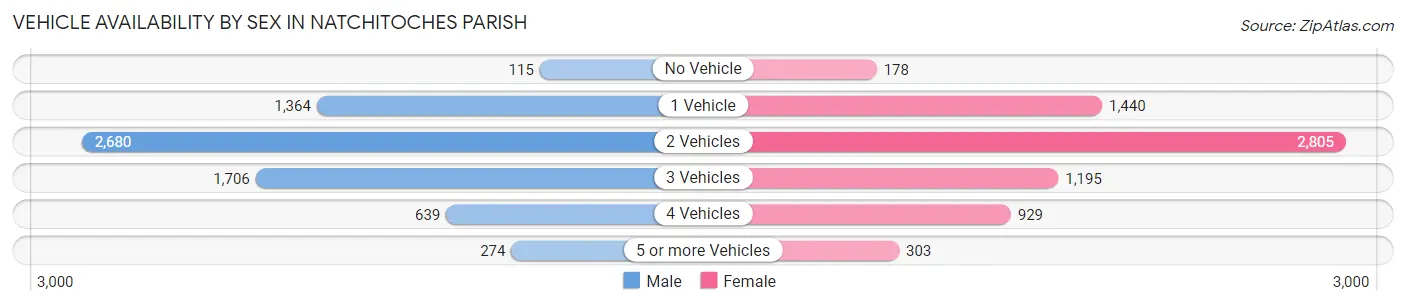
| Vehicles Available | Male | Female |
| No Vehicle | 115 (1.7%) | 178 (2.6%) |
| 1 Vehicle | 1,364 (20.1%) | 1,440 (21.0%) |
| 2 Vehicles | 2,680 (39.5%) | 2,805 (40.9%) |
| 3 Vehicles | 1,706 (25.2%) | 1,195 (17.4%) |
| 4 Vehicles | 639 (9.4%) | 929 (13.6%) |
| 5 or more Vehicles | 274 (4.0%) | 303 (4.4%) |
| Total | 6,778 (100.0%) | 6,850 (100.0%) |
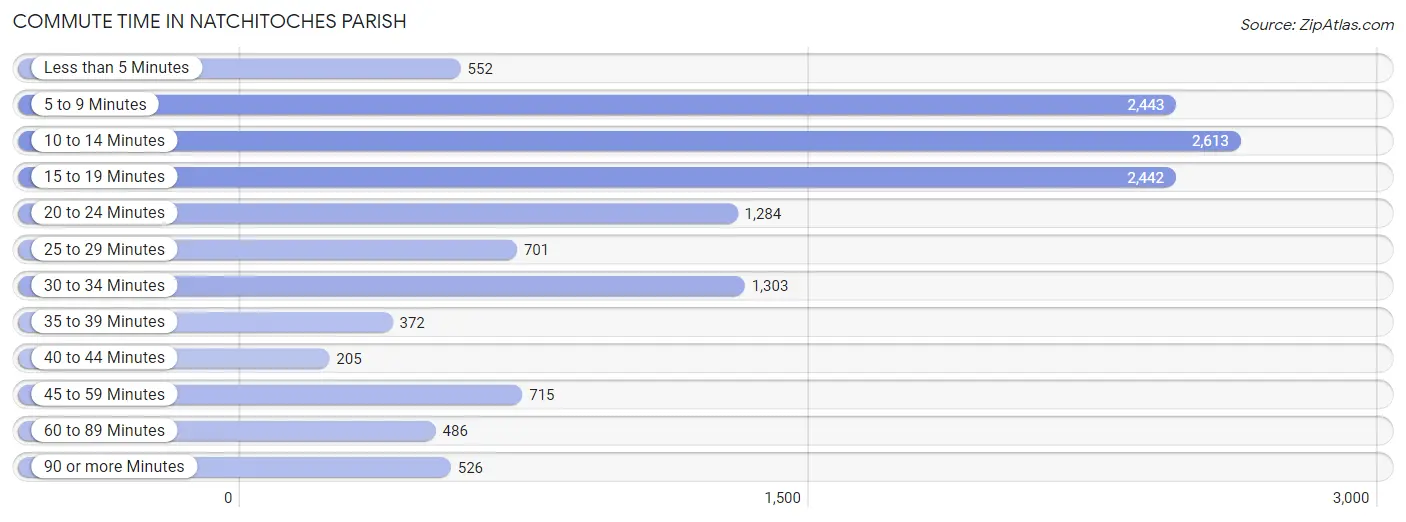
Commute Time in Natchitoches Parish
The most frequently occuring commute durations in Natchitoches Parish are 10 to 14 minutes (2,613 commuters, 19.2%), 5 to 9 minutes (2,443 commuters, 17.9%), and 15 to 19 minutes (2,442 commuters, 17.9%).
| Commute Time | # Commuters | % Commuters |
| Less than 5 Minutes | 552 | 4.1% |
| 5 to 9 Minutes | 2,443 | 17.9% |
| 10 to 14 Minutes | 2,613 | 19.2% |
| 15 to 19 Minutes | 2,442 | 17.9% |
| 20 to 24 Minutes | 1,284 | 9.4% |
| 25 to 29 Minutes | 701 | 5.1% |
| 30 to 34 Minutes | 1,303 | 9.6% |
| 35 to 39 Minutes | 372 | 2.7% |
| 40 to 44 Minutes | 205 | 1.5% |
| 45 to 59 Minutes | 715 | 5.2% |
| 60 to 89 Minutes | 486 | 3.6% |
| 90 or more Minutes | 526 | 3.9% |
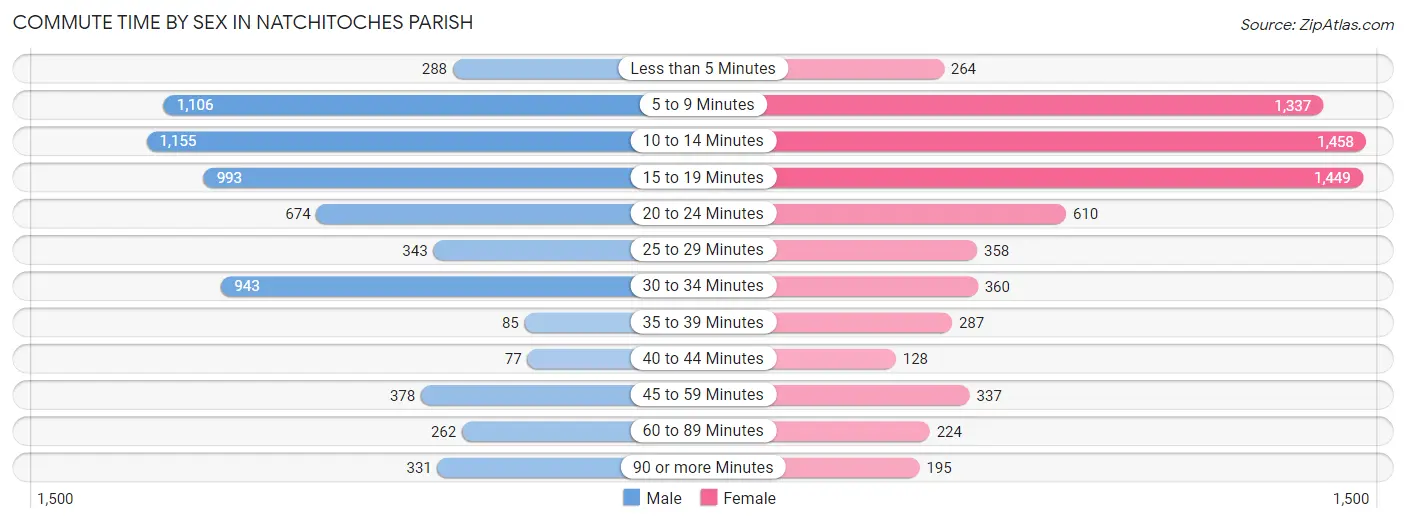
Commute Time by Sex in Natchitoches Parish
The most common commute times in Natchitoches Parish are 10 to 14 minutes (1,155 commuters, 17.4%) for males and 10 to 14 minutes (1,458 commuters, 20.8%) for females.
| Commute Time | Male | Female |
| Less than 5 Minutes | 288 (4.3%) | 264 (3.8%) |
| 5 to 9 Minutes | 1,106 (16.7%) | 1,337 (19.1%) |
| 10 to 14 Minutes | 1,155 (17.4%) | 1,458 (20.8%) |
| 15 to 19 Minutes | 993 (15.0%) | 1,449 (20.7%) |
| 20 to 24 Minutes | 674 (10.2%) | 610 (8.7%) |
| 25 to 29 Minutes | 343 (5.2%) | 358 (5.1%) |
| 30 to 34 Minutes | 943 (14.2%) | 360 (5.1%) |
| 35 to 39 Minutes | 85 (1.3%) | 287 (4.1%) |
| 40 to 44 Minutes | 77 (1.2%) | 128 (1.8%) |
| 45 to 59 Minutes | 378 (5.7%) | 337 (4.8%) |
| 60 to 89 Minutes | 262 (4.0%) | 224 (3.2%) |
| 90 or more Minutes | 331 (5.0%) | 195 (2.8%) |
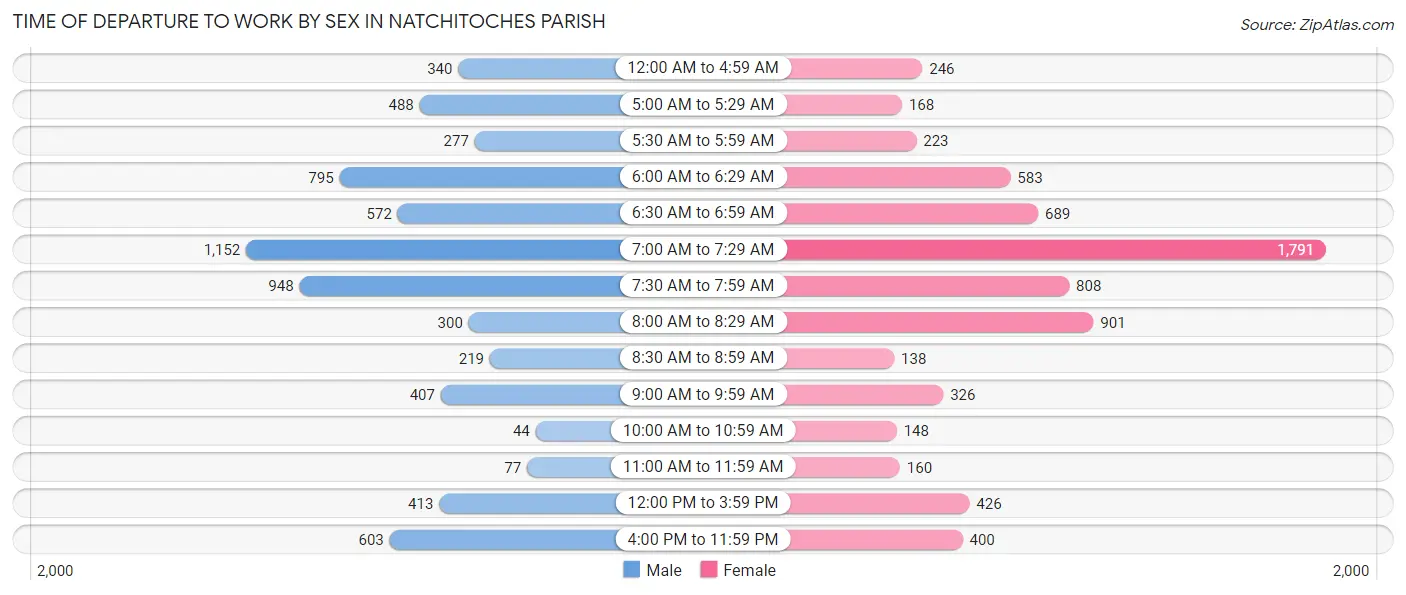
Time of Departure to Work by Sex in Natchitoches Parish
The most frequent times of departure to work in Natchitoches Parish are 7:00 AM to 7:29 AM (1,152, 17.4%) for males and 7:00 AM to 7:29 AM (1,791, 25.6%) for females.
| Time of Departure | Male | Female |
| 12:00 AM to 4:59 AM | 340 (5.1%) | 246 (3.5%) |
| 5:00 AM to 5:29 AM | 488 (7.3%) | 168 (2.4%) |
| 5:30 AM to 5:59 AM | 277 (4.2%) | 223 (3.2%) |
| 6:00 AM to 6:29 AM | 795 (12.0%) | 583 (8.3%) |
| 6:30 AM to 6:59 AM | 572 (8.6%) | 689 (9.8%) |
| 7:00 AM to 7:29 AM | 1,152 (17.4%) | 1,791 (25.6%) |
| 7:30 AM to 7:59 AM | 948 (14.3%) | 808 (11.5%) |
| 8:00 AM to 8:29 AM | 300 (4.5%) | 901 (12.9%) |
| 8:30 AM to 8:59 AM | 219 (3.3%) | 138 (2.0%) |
| 9:00 AM to 9:59 AM | 407 (6.1%) | 326 (4.6%) |
| 10:00 AM to 10:59 AM | 44 (0.7%) | 148 (2.1%) |
| 11:00 AM to 11:59 AM | 77 (1.2%) | 160 (2.3%) |
| 12:00 PM to 3:59 PM | 413 (6.2%) | 426 (6.1%) |
| 4:00 PM to 11:59 PM | 603 (9.1%) | 400 (5.7%) |
| Total | 6,635 (100.0%) | 7,007 (100.0%) |
Housing Occupancy in Natchitoches Parish
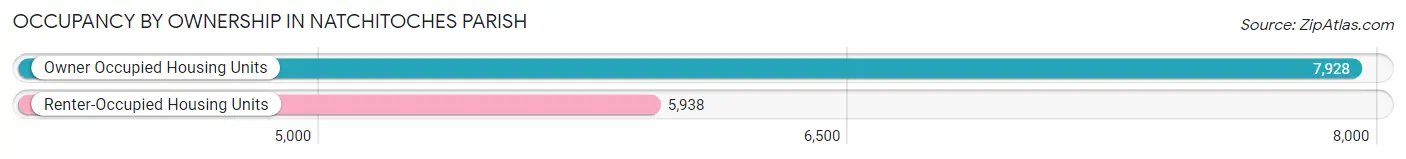
Occupancy by Ownership in Natchitoches Parish
Of the total 13,866 dwellings in Natchitoches Parish, owner-occupied units account for 7,928 (57.2%), while renter-occupied units make up 5,938 (42.8%).
| Occupancy | # Housing Units | % Housing Units |
| Owner Occupied Housing Units | 7,928 | 57.2% |
| Renter-Occupied Housing Units | 5,938 | 42.8% |
| Total Occupied Housing Units | 13,866 | 100.0% |
Occupancy by Household Size in Natchitoches Parish
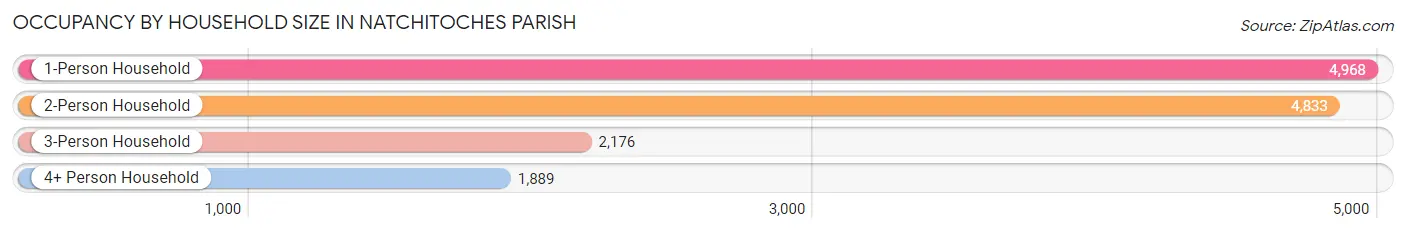
| Household Size | # Housing Units | % Housing Units |
| 1-Person Household | 4,968 | 35.8% |
| 2-Person Household | 4,833 | 34.9% |
| 3-Person Household | 2,176 | 15.7% |
| 4+ Person Household | 1,889 | 13.6% |
| Total Housing Units | 13,866 | 100.0% |
Occupancy by Ownership by Household Size in Natchitoches Parish
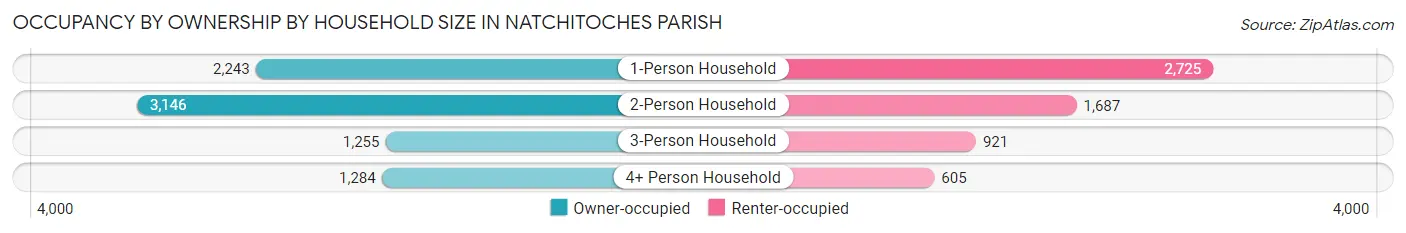
| Household Size | Owner-occupied | Renter-occupied |
| 1-Person Household | 2,243 (45.2%) | 2,725 (54.8%) |
| 2-Person Household | 3,146 (65.1%) | 1,687 (34.9%) |
| 3-Person Household | 1,255 (57.7%) | 921 (42.3%) |
| 4+ Person Household | 1,284 (68.0%) | 605 (32.0%) |
| Total Housing Units | 7,928 (57.2%) | 5,938 (42.8%) |
Occupancy by Educational Attainment in Natchitoches Parish
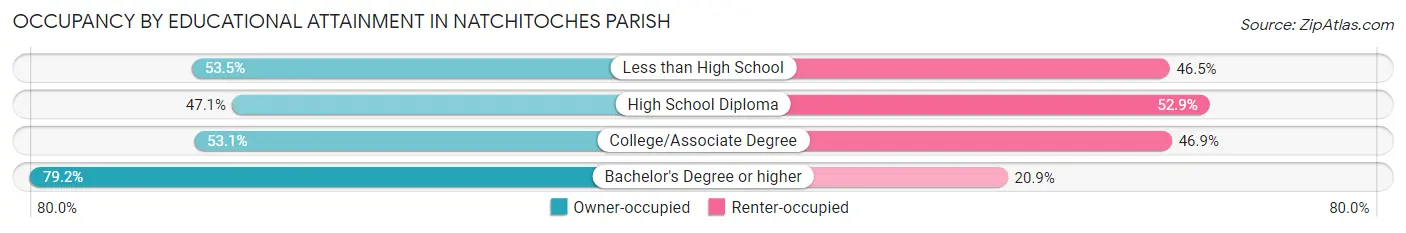
| Household Size | Owner-occupied | Renter-occupied |
| Less than High School | 737 (53.5%) | 641 (46.5%) |
| High School Diploma | 2,427 (47.1%) | 2,723 (52.9%) |
| College/Associate Degree | 2,130 (53.1%) | 1,880 (46.9%) |
| Bachelor's Degree or higher | 2,634 (79.1%) | 694 (20.8%) |
Occupancy by Age of Householder in Natchitoches Parish
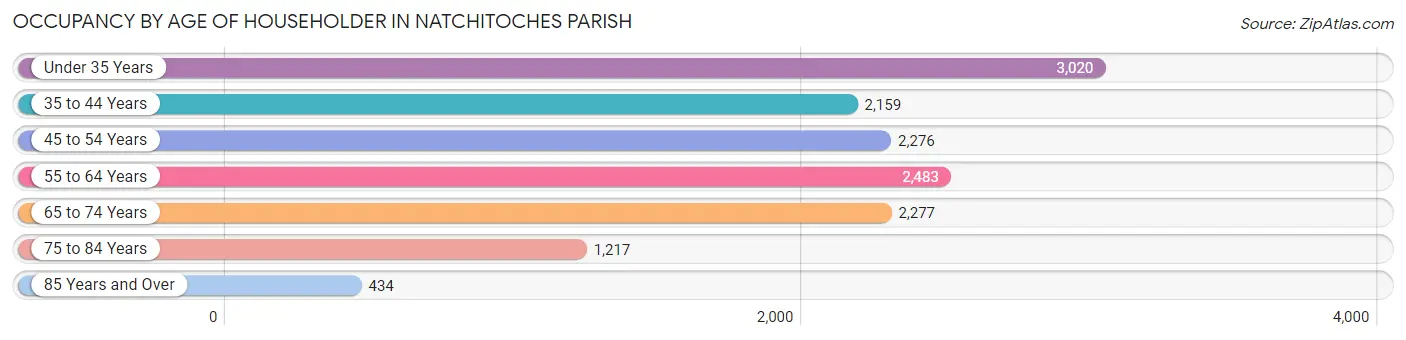
| Age Bracket | # Households | % Households |
| Under 35 Years | 3,020 | 21.8% |
| 35 to 44 Years | 2,159 | 15.6% |
| 45 to 54 Years | 2,276 | 16.4% |
| 55 to 64 Years | 2,483 | 17.9% |
| 65 to 74 Years | 2,277 | 16.4% |
| 75 to 84 Years | 1,217 | 8.8% |
| 85 Years and Over | 434 | 3.1% |
| Total | 13,866 | 100.0% |
Housing Finances in Natchitoches Parish
Median Income by Occupancy in Natchitoches Parish
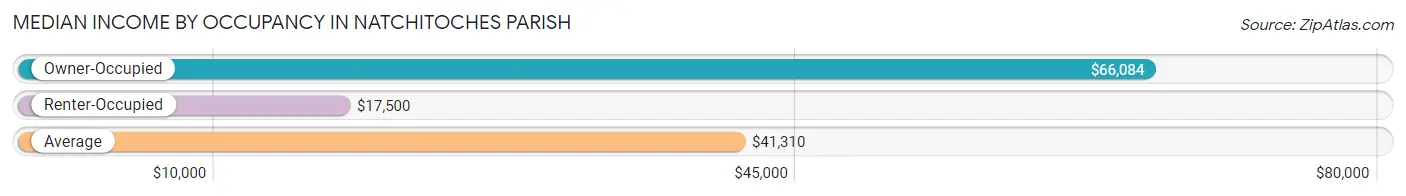
| Occupancy Type | # Households | Median Income |
| Owner-Occupied | 7,928 (57.2%) | $66,084 |
| Renter-Occupied | 5,938 (42.8%) | $17,500 |
| Average | 13,866 (100.0%) | $41,310 |
Occupancy by Householder Income Bracket in Natchitoches Parish
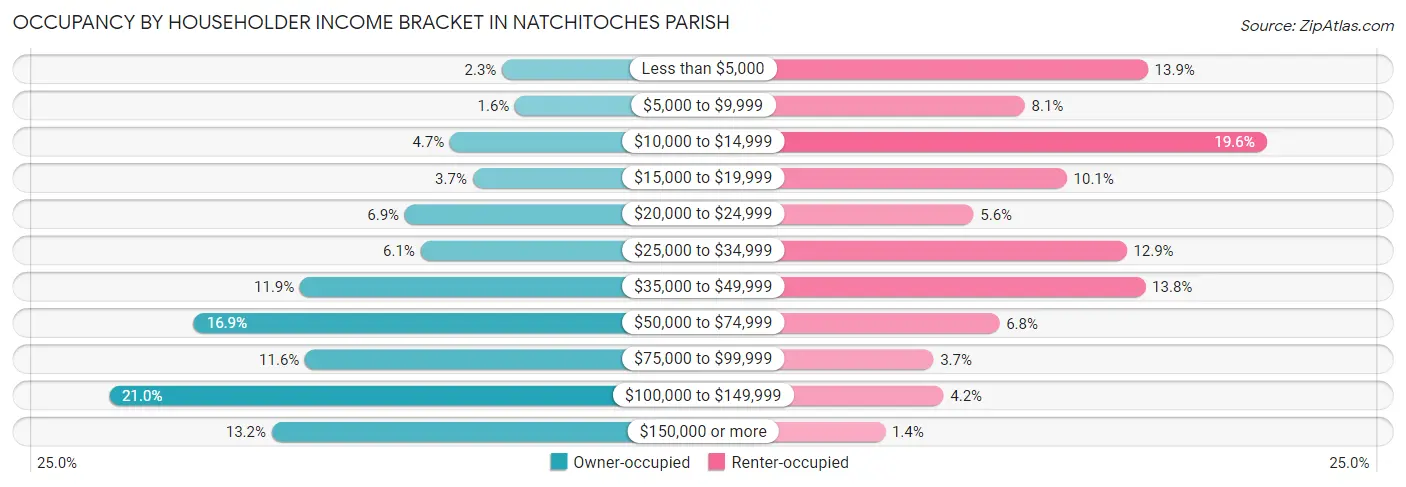
| Income Bracket | Owner-occupied | Renter-occupied |
| Less than $5,000 | 179 (2.3%) | 826 (13.9%) |
| $5,000 to $9,999 | 130 (1.6%) | 478 (8.1%) |
| $10,000 to $14,999 | 376 (4.7%) | 1,162 (19.6%) |
| $15,000 to $19,999 | 290 (3.7%) | 597 (10.1%) |
| $20,000 to $24,999 | 546 (6.9%) | 333 (5.6%) |
| $25,000 to $34,999 | 487 (6.1%) | 766 (12.9%) |
| $35,000 to $49,999 | 942 (11.9%) | 819 (13.8%) |
| $50,000 to $74,999 | 1,343 (16.9%) | 406 (6.8%) |
| $75,000 to $99,999 | 923 (11.6%) | 220 (3.7%) |
| $100,000 to $149,999 | 1,663 (21.0%) | 248 (4.2%) |
| $150,000 or more | 1,049 (13.2%) | 83 (1.4%) |
| Total | 7,928 (100.0%) | 5,938 (100.0%) |
Monthly Housing Cost Tiers in Natchitoches Parish
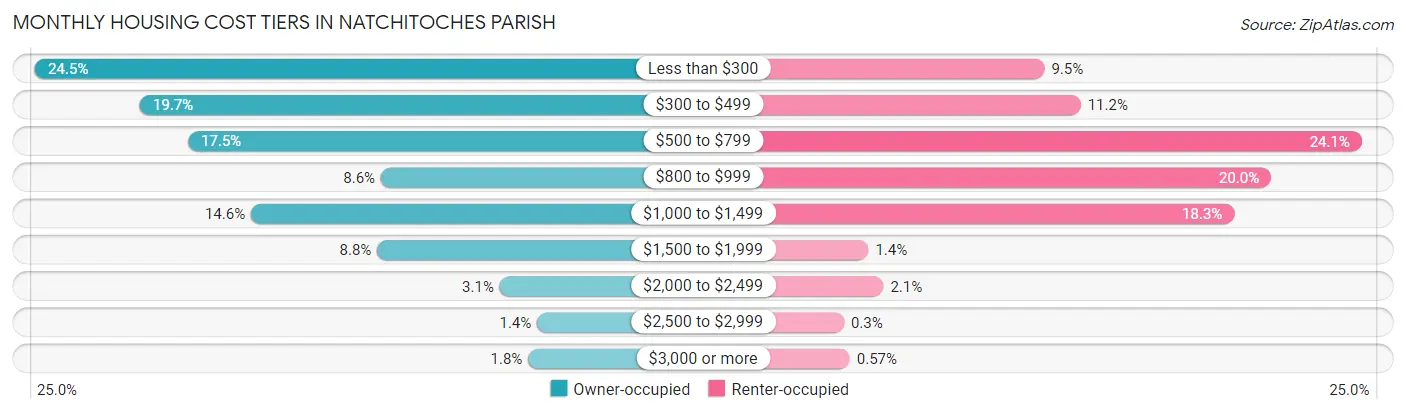
| Monthly Cost | Owner-occupied | Renter-occupied |
| Less than $300 | 1,944 (24.5%) | 566 (9.5%) |
| $300 to $499 | 1,561 (19.7%) | 665 (11.2%) |
| $500 to $799 | 1,386 (17.5%) | 1,433 (24.1%) |
| $800 to $999 | 682 (8.6%) | 1,185 (20.0%) |
| $1,000 to $1,499 | 1,156 (14.6%) | 1,084 (18.3%) |
| $1,500 to $1,999 | 695 (8.8%) | 85 (1.4%) |
| $2,000 to $2,499 | 248 (3.1%) | 126 (2.1%) |
| $2,500 to $2,999 | 112 (1.4%) | 18 (0.3%) |
| $3,000 or more | 144 (1.8%) | 34 (0.6%) |
| Total | 7,928 (100.0%) | 5,938 (100.0%) |
Physical Housing Characteristics in Natchitoches Parish
Housing Structures in Natchitoches Parish
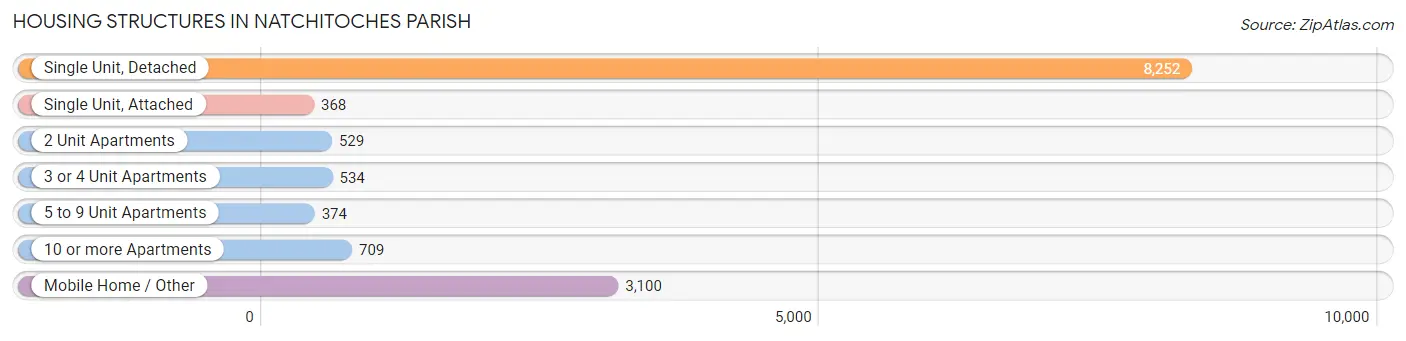
| Structure Type | # Housing Units | % Housing Units |
| Single Unit, Detached | 8,252 | 59.5% |
| Single Unit, Attached | 368 | 2.6% |
| 2 Unit Apartments | 529 | 3.8% |
| 3 or 4 Unit Apartments | 534 | 3.8% |
| 5 to 9 Unit Apartments | 374 | 2.7% |
| 10 or more Apartments | 709 | 5.1% |
| Mobile Home / Other | 3,100 | 22.4% |
| Total | 13,866 | 100.0% |
Housing Structures by Occupancy in Natchitoches Parish
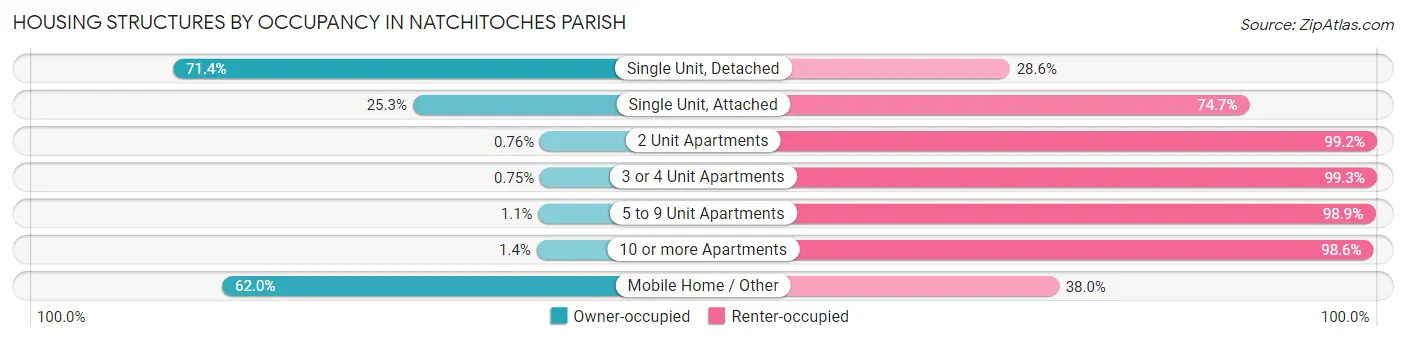
| Structure Type | Owner-occupied | Renter-occupied |
| Single Unit, Detached | 5,892 (71.4%) | 2,360 (28.6%) |
| Single Unit, Attached | 93 (25.3%) | 275 (74.7%) |
| 2 Unit Apartments | 4 (0.8%) | 525 (99.2%) |
| 3 or 4 Unit Apartments | 4 (0.7%) | 530 (99.3%) |
| 5 to 9 Unit Apartments | 4 (1.1%) | 370 (98.9%) |
| 10 or more Apartments | 10 (1.4%) | 699 (98.6%) |
| Mobile Home / Other | 1,921 (62.0%) | 1,179 (38.0%) |
| Total | 7,928 (57.2%) | 5,938 (42.8%) |
Housing Structures by Number of Rooms in Natchitoches Parish
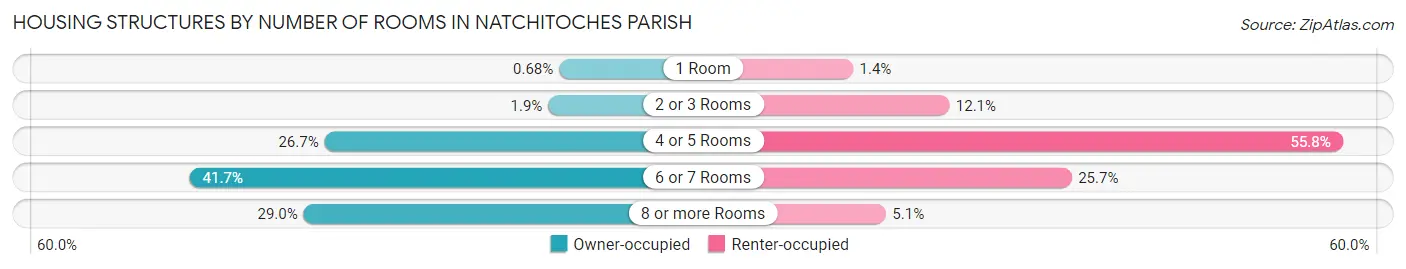
| Number of Rooms | Owner-occupied | Renter-occupied |
| 1 Room | 54 (0.7%) | 84 (1.4%) |
| 2 or 3 Rooms | 150 (1.9%) | 718 (12.1%) |
| 4 or 5 Rooms | 2,118 (26.7%) | 3,312 (55.8%) |
| 6 or 7 Rooms | 3,304 (41.7%) | 1,524 (25.7%) |
| 8 or more Rooms | 2,302 (29.0%) | 300 (5.1%) |
| Total | 7,928 (100.0%) | 5,938 (100.0%) |
Housing Structure by Heating Type in Natchitoches Parish
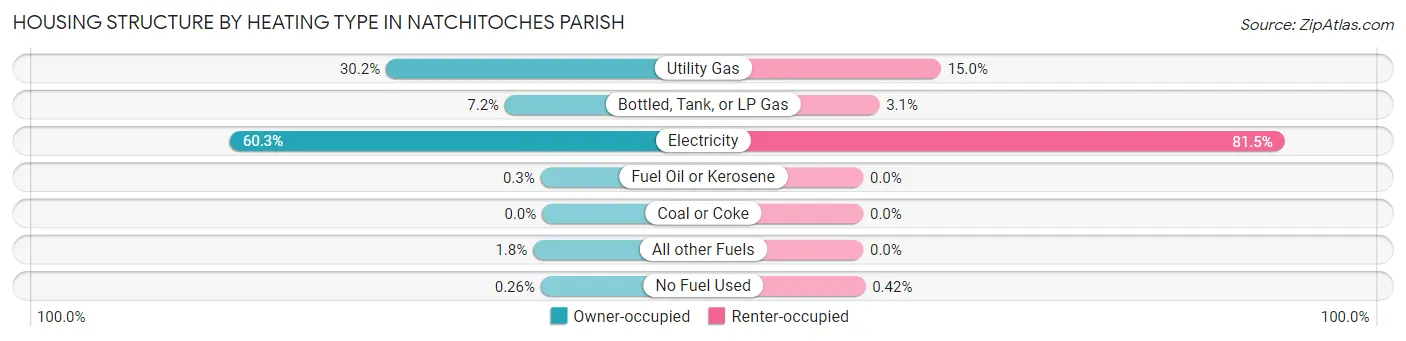
| Heating Type | Owner-occupied | Renter-occupied |
| Utility Gas | 2,392 (30.2%) | 891 (15.0%) |
| Bottled, Tank, or LP Gas | 569 (7.2%) | 185 (3.1%) |
| Electricity | 4,783 (60.3%) | 4,837 (81.5%) |
| Fuel Oil or Kerosene | 24 (0.3%) | 0 (0.0%) |
| Coal or Coke | 0 (0.0%) | 0 (0.0%) |
| All other Fuels | 139 (1.8%) | 0 (0.0%) |
| No Fuel Used | 21 (0.3%) | 25 (0.4%) |
| Total | 7,928 (100.0%) | 5,938 (100.0%) |
Household Vehicle Usage in Natchitoches Parish
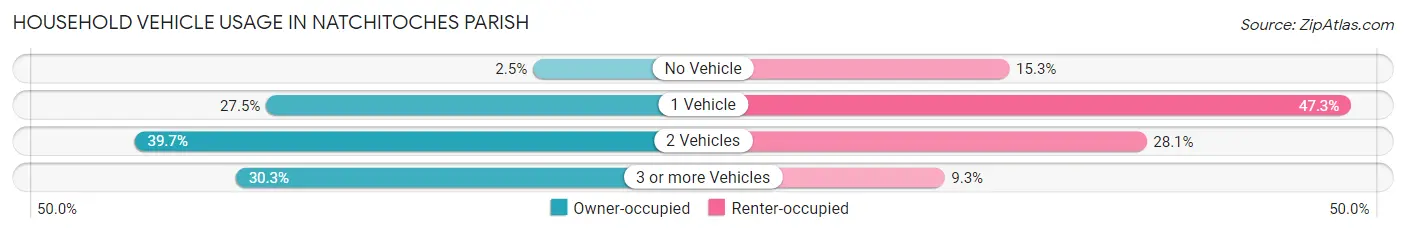
| Vehicles per Household | Owner-occupied | Renter-occupied |
| No Vehicle | 201 (2.5%) | 910 (15.3%) |
| 1 Vehicle | 2,176 (27.5%) | 2,806 (47.2%) |
| 2 Vehicles | 3,150 (39.7%) | 1,671 (28.1%) |
| 3 or more Vehicles | 2,401 (30.3%) | 551 (9.3%) |
| Total | 7,928 (100.0%) | 5,938 (100.0%) |
Real Estate & Mortgages in Natchitoches Parish
Real Estate and Mortgage Overview in Natchitoches Parish
| Characteristic | Without Mortgage | With Mortgage |
| Housing Units | 4,691 | 3,237 |
| Median Property Value | $112,000 | $200,200 |
| Median Household Income | $47,530 | $611 |
| Monthly Housing Costs | $361 | $135 |
| Real Estate Taxes | $428 | $665 |
Property Value by Mortgage Status in Natchitoches Parish
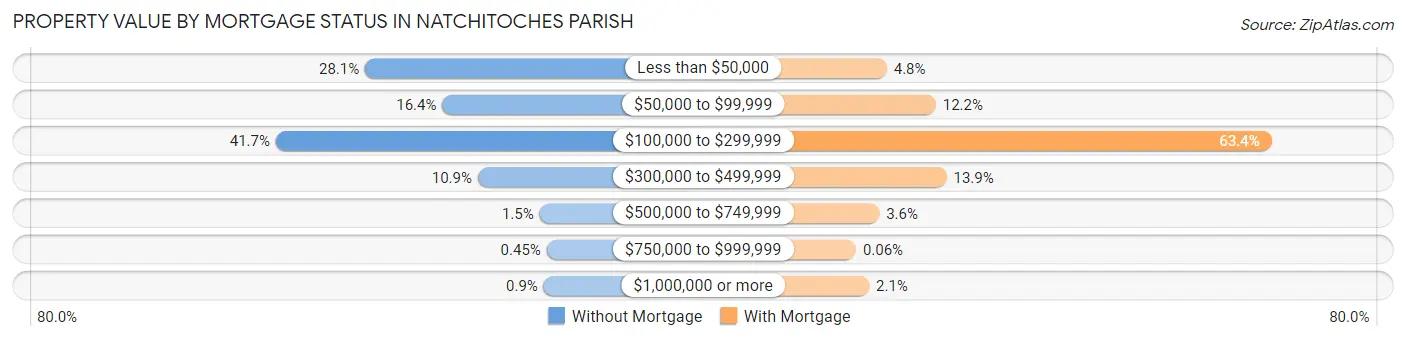
| Property Value | Without Mortgage | With Mortgage |
| Less than $50,000 | 1,319 (28.1%) | 154 (4.8%) |
| $50,000 to $99,999 | 767 (16.4%) | 396 (12.2%) |
| $100,000 to $299,999 | 1,957 (41.7%) | 2,052 (63.4%) |
| $300,000 to $499,999 | 513 (10.9%) | 449 (13.9%) |
| $500,000 to $749,999 | 72 (1.5%) | 117 (3.6%) |
| $750,000 to $999,999 | 21 (0.4%) | 2 (0.1%) |
| $1,000,000 or more | 42 (0.9%) | 67 (2.1%) |
| Total | 4,691 (100.0%) | 3,237 (100.0%) |
Household Income by Mortgage Status in Natchitoches Parish
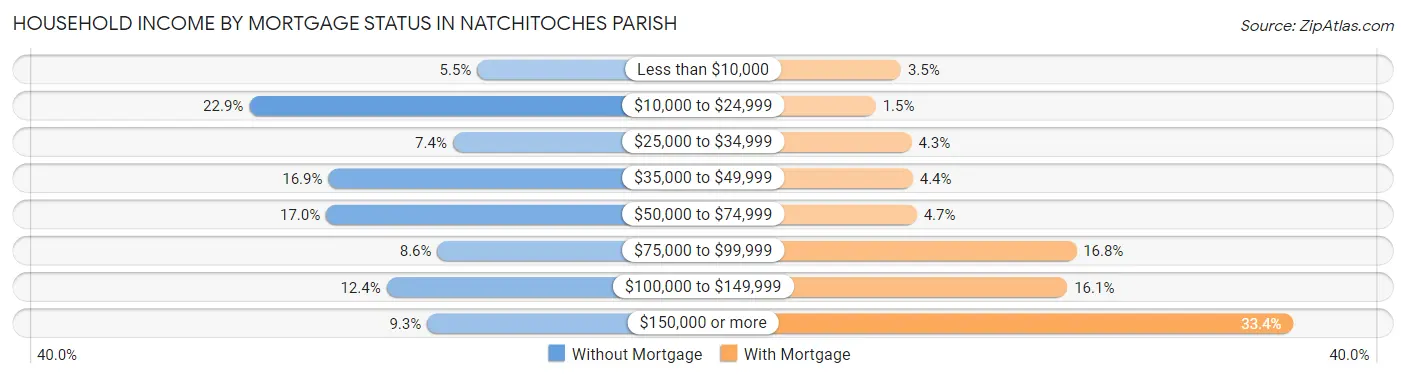
| Household Income | Without Mortgage | With Mortgage |
| Less than $10,000 | 259 (5.5%) | 112 (3.5%) |
| $10,000 to $24,999 | 1,074 (22.9%) | 50 (1.5%) |
| $25,000 to $34,999 | 346 (7.4%) | 138 (4.3%) |
| $35,000 to $49,999 | 791 (16.9%) | 141 (4.4%) |
| $50,000 to $74,999 | 799 (17.0%) | 151 (4.7%) |
| $75,000 to $99,999 | 401 (8.6%) | 544 (16.8%) |
| $100,000 to $149,999 | 583 (12.4%) | 522 (16.1%) |
| $150,000 or more | 438 (9.3%) | 1,080 (33.4%) |
| Total | 4,691 (100.0%) | 3,237 (100.0%) |
Property Value to Household Income Ratio in Natchitoches Parish
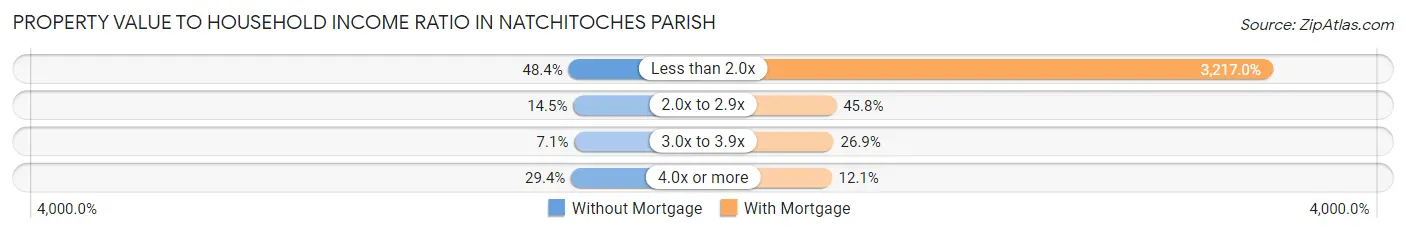
| Value-to-Income Ratio | Without Mortgage | With Mortgage |
| Less than 2.0x | 2,270 (48.4%) | 104,135 (3,217.0%) |
| 2.0x to 2.9x | 679 (14.5%) | 1,482 (45.8%) |
| 3.0x to 3.9x | 333 (7.1%) | 872 (26.9%) |
| 4.0x or more | 1,379 (29.4%) | 393 (12.1%) |
| Total | 4,691 (100.0%) | 3,237 (100.0%) |
Real Estate Taxes by Mortgage Status in Natchitoches Parish
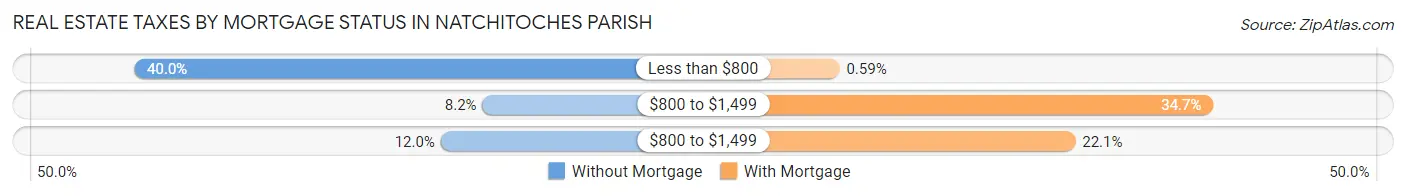
| Property Taxes | Without Mortgage | With Mortgage |
| Less than $800 | 1,877 (40.0%) | 19 (0.6%) |
| $800 to $1,499 | 384 (8.2%) | 1,124 (34.7%) |
| $800 to $1,499 | 563 (12.0%) | 716 (22.1%) |
| Total | 4,691 (100.0%) | 3,237 (100.0%) |
Health & Disability in Natchitoches Parish
Health Insurance Coverage by Age in Natchitoches Parish
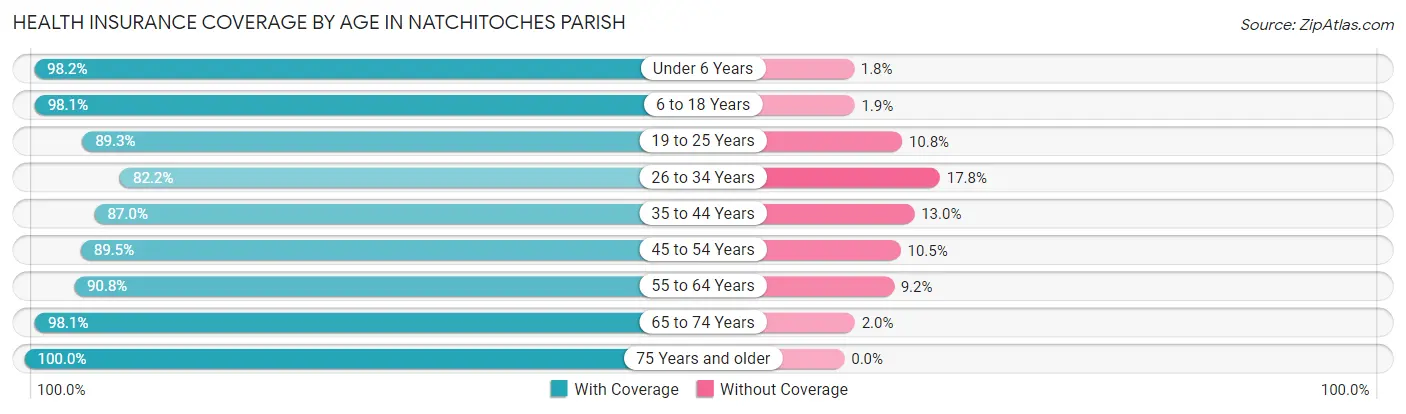
| Age Bracket | With Coverage | Without Coverage |
| Under 6 Years | 2,493 (98.2%) | 45 (1.8%) |
| 6 to 18 Years | 6,759 (98.1%) | 131 (1.9%) |
| 19 to 25 Years | 5,336 (89.2%) | 643 (10.7%) |
| 26 to 34 Years | 3,064 (82.2%) | 664 (17.8%) |
| 35 to 44 Years | 3,181 (87.0%) | 477 (13.0%) |
| 45 to 54 Years | 3,370 (89.5%) | 395 (10.5%) |
| 55 to 64 Years | 3,725 (90.8%) | 378 (9.2%) |
| 65 to 74 Years | 3,578 (98.1%) | 71 (1.9%) |
| 75 Years and older | 2,405 (100.0%) | 0 (0.0%) |
| Total | 33,911 (92.4%) | 2,804 (7.6%) |
Health Insurance Coverage by Citizenship Status in Natchitoches Parish
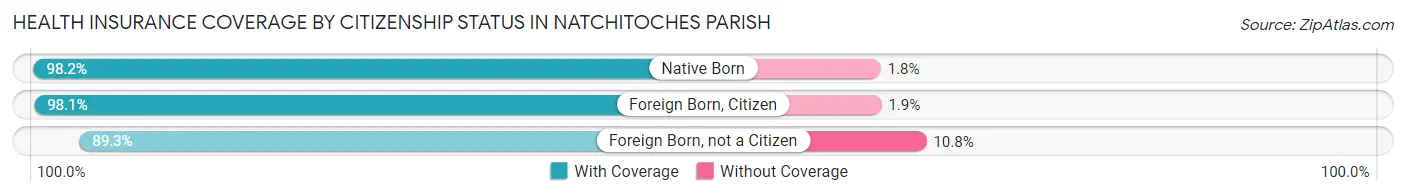
| Citizenship Status | With Coverage | Without Coverage |
| Native Born | 2,493 (98.2%) | 45 (1.8%) |
| Foreign Born, Citizen | 6,759 (98.1%) | 131 (1.9%) |
| Foreign Born, not a Citizen | 5,336 (89.2%) | 643 (10.7%) |
Health Insurance Coverage by Household Income in Natchitoches Parish
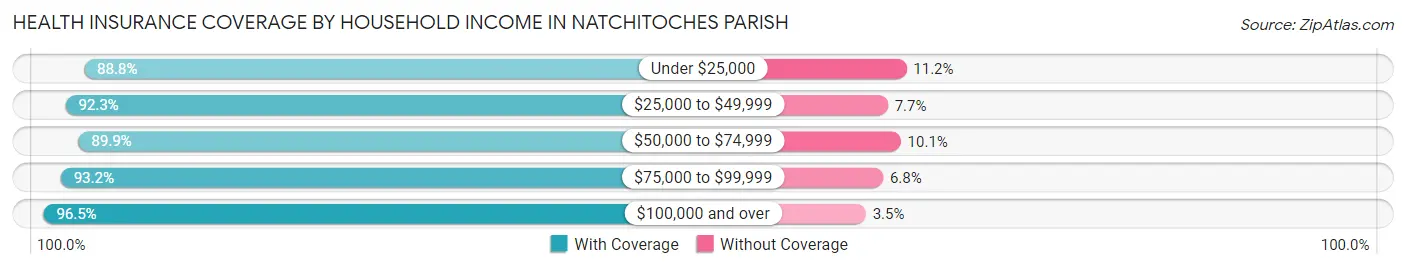
| Household Income | With Coverage | Without Coverage |
| Under $25,000 | 8,036 (88.8%) | 1,009 (11.2%) |
| $25,000 to $49,999 | 7,162 (92.3%) | 594 (7.7%) |
| $50,000 to $74,999 | 4,881 (89.9%) | 548 (10.1%) |
| $75,000 to $99,999 | 3,421 (93.2%) | 249 (6.8%) |
| $100,000 and over | 9,228 (96.5%) | 339 (3.5%) |
Public vs Private Health Insurance Coverage by Age in Natchitoches Parish
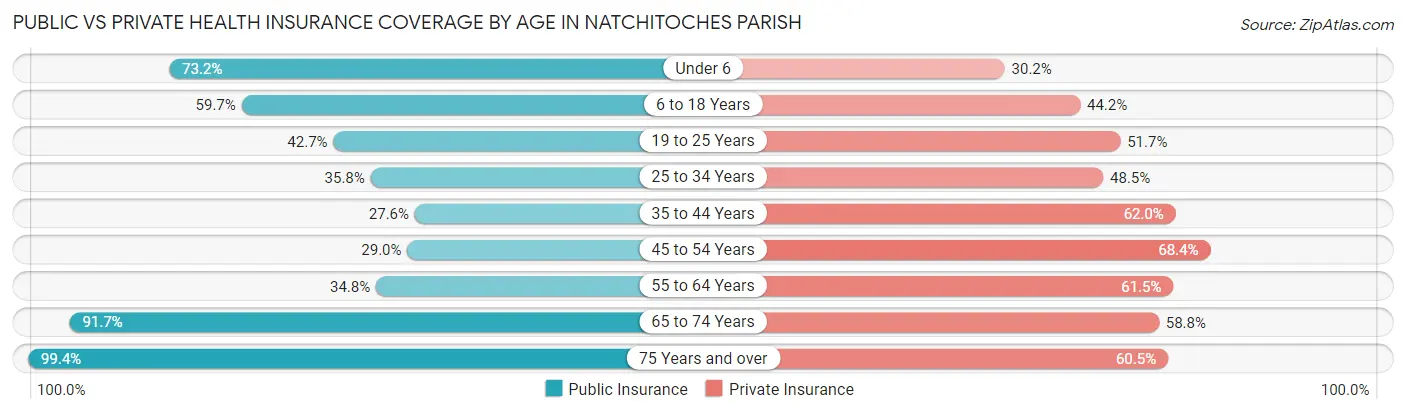
| Age Bracket | Public Insurance | Private Insurance |
| Under 6 | 1,857 (73.2%) | 767 (30.2%) |
| 6 to 18 Years | 4,115 (59.7%) | 3,047 (44.2%) |
| 19 to 25 Years | 2,552 (42.7%) | 3,090 (51.7%) |
| 25 to 34 Years | 1,334 (35.8%) | 1,808 (48.5%) |
| 35 to 44 Years | 1,008 (27.6%) | 2,267 (62.0%) |
| 45 to 54 Years | 1,090 (28.9%) | 2,576 (68.4%) |
| 55 to 64 Years | 1,426 (34.8%) | 2,524 (61.5%) |
| 65 to 74 Years | 3,345 (91.7%) | 2,147 (58.8%) |
| 75 Years and over | 2,390 (99.4%) | 1,456 (60.5%) |
| Total | 19,117 (52.1%) | 19,682 (53.6%) |
Disability Status by Sex by Age in Natchitoches Parish
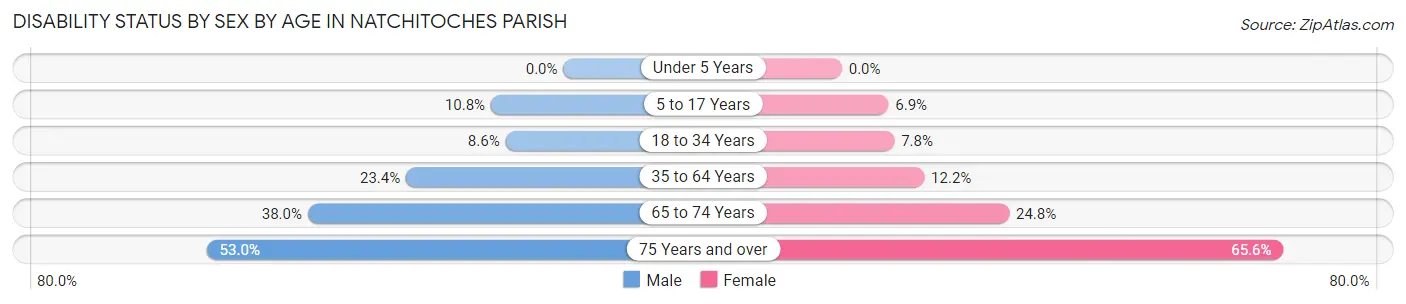
| Age Bracket | Male | Female |
| Under 5 Years | 0 (0.0%) | 0 (0.0%) |
| 5 to 17 Years | 347 (10.7%) | 207 (6.9%) |
| 18 to 34 Years | 429 (8.6%) | 438 (7.8%) |
| 35 to 64 Years | 1,260 (23.4%) | 750 (12.2%) |
| 65 to 74 Years | 639 (38.0%) | 488 (24.8%) |
| 75 Years and over | 545 (53.0%) | 902 (65.5%) |
Disability Class by Sex by Age in Natchitoches Parish
Disability Class: Hearing Difficulty
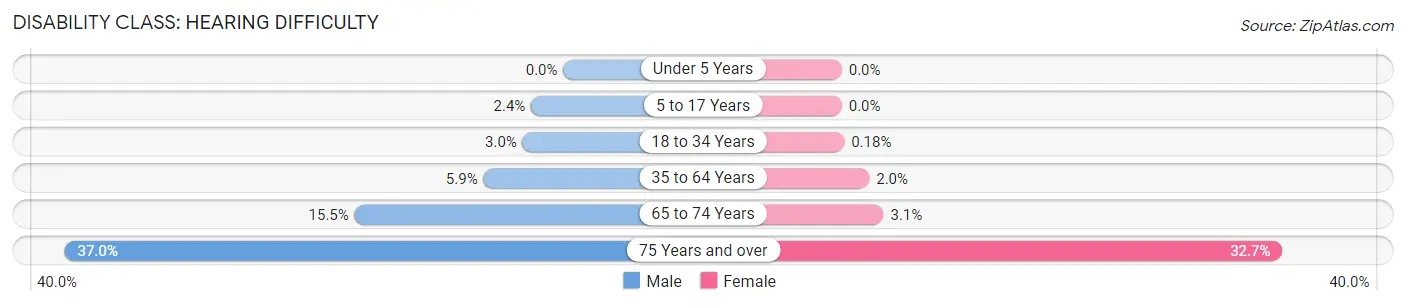
| Age Bracket | Male | Female |
| Under 5 Years | 0 (0.0%) | 0 (0.0%) |
| 5 to 17 Years | 77 (2.4%) | 0 (0.0%) |
| 18 to 34 Years | 151 (3.0%) | 10 (0.2%) |
| 35 to 64 Years | 320 (5.9%) | 125 (2.0%) |
| 65 to 74 Years | 261 (15.5%) | 61 (3.1%) |
| 75 Years and over | 381 (37.0%) | 450 (32.7%) |
Disability Class: Vision Difficulty
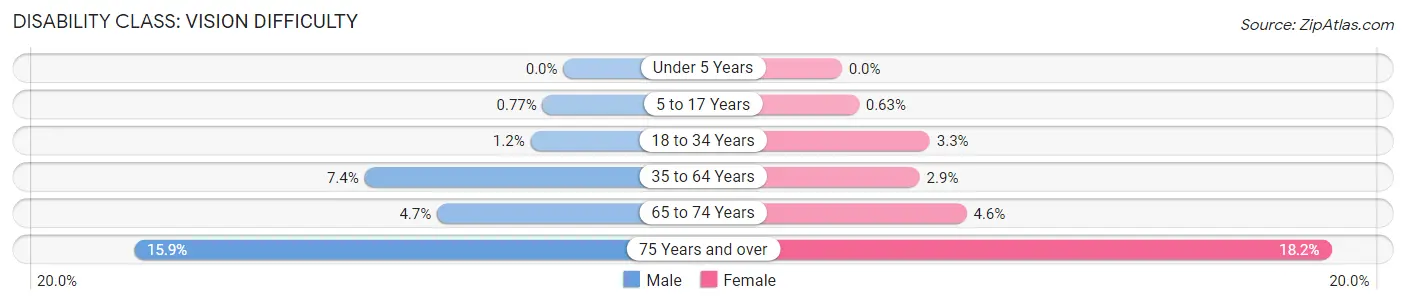
| Age Bracket | Male | Female |
| Under 5 Years | 0 (0.0%) | 0 (0.0%) |
| 5 to 17 Years | 25 (0.8%) | 19 (0.6%) |
| 18 to 34 Years | 61 (1.2%) | 184 (3.3%) |
| 35 to 64 Years | 398 (7.4%) | 177 (2.9%) |
| 65 to 74 Years | 79 (4.7%) | 91 (4.6%) |
| 75 Years and over | 164 (15.9%) | 250 (18.2%) |
Disability Class: Cognitive Difficulty
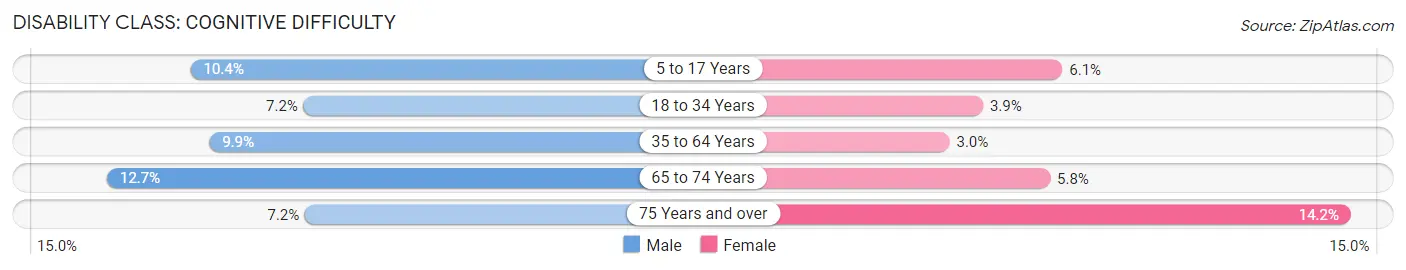
| Age Bracket | Male | Female |
| 5 to 17 Years | 335 (10.4%) | 184 (6.1%) |
| 18 to 34 Years | 361 (7.2%) | 221 (3.9%) |
| 35 to 64 Years | 532 (9.9%) | 184 (3.0%) |
| 65 to 74 Years | 214 (12.7%) | 114 (5.8%) |
| 75 Years and over | 74 (7.2%) | 195 (14.2%) |
Disability Class: Ambulatory Difficulty
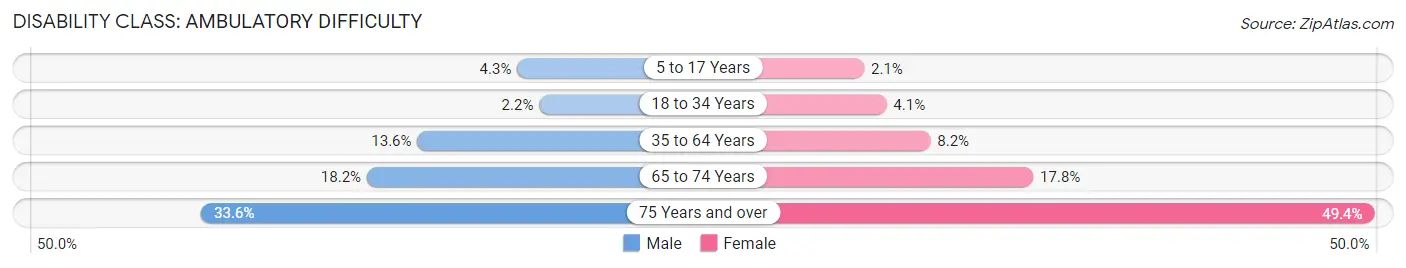
| Age Bracket | Male | Female |
| 5 to 17 Years | 138 (4.3%) | 62 (2.1%) |
| 18 to 34 Years | 112 (2.2%) | 233 (4.1%) |
| 35 to 64 Years | 731 (13.6%) | 504 (8.2%) |
| 65 to 74 Years | 307 (18.2%) | 349 (17.8%) |
| 75 Years and over | 346 (33.6%) | 680 (49.4%) |
Disability Class: Self-Care Difficulty
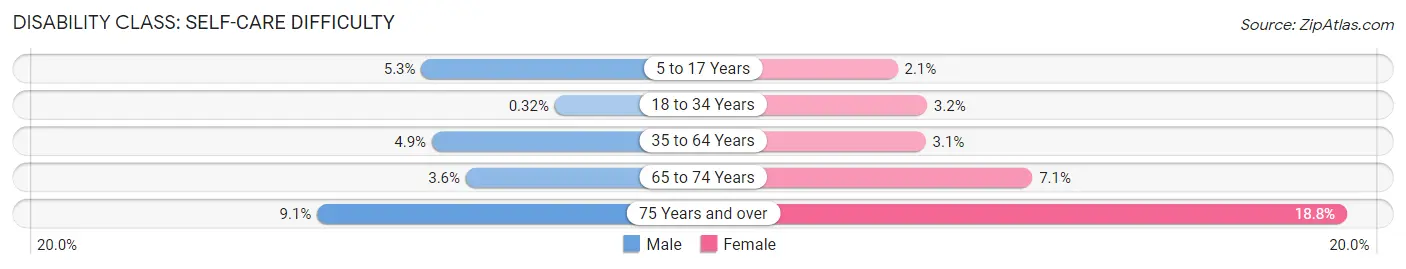
| Age Bracket | Male | Female |
| 5 to 17 Years | 170 (5.3%) | 62 (2.1%) |
| 18 to 34 Years | 16 (0.3%) | 178 (3.2%) |
| 35 to 64 Years | 263 (4.9%) | 191 (3.1%) |
| 65 to 74 Years | 61 (3.6%) | 139 (7.1%) |
| 75 Years and over | 94 (9.1%) | 258 (18.8%) |
Technology Access in Natchitoches Parish
Computing Device Access in Natchitoches Parish
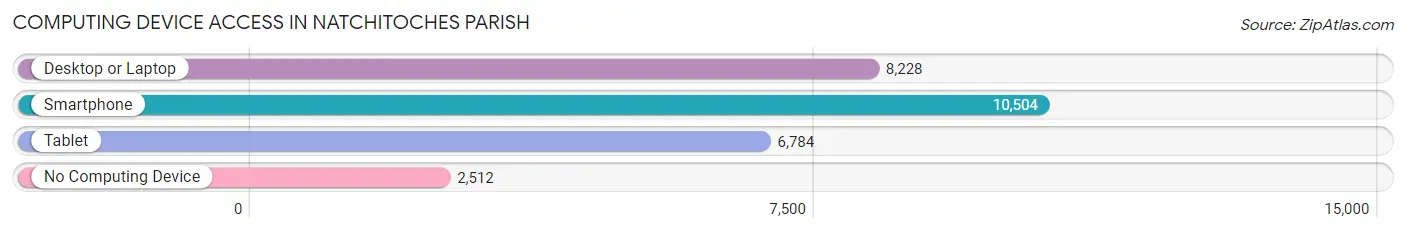
| Device Type | # Households | % Households |
| Desktop or Laptop | 8,228 | 59.3% |
| Smartphone | 10,504 | 75.7% |
| Tablet | 6,784 | 48.9% |
| No Computing Device | 2,512 | 18.1% |
| Total | 13,866 | 100.0% |
Internet Access in Natchitoches Parish
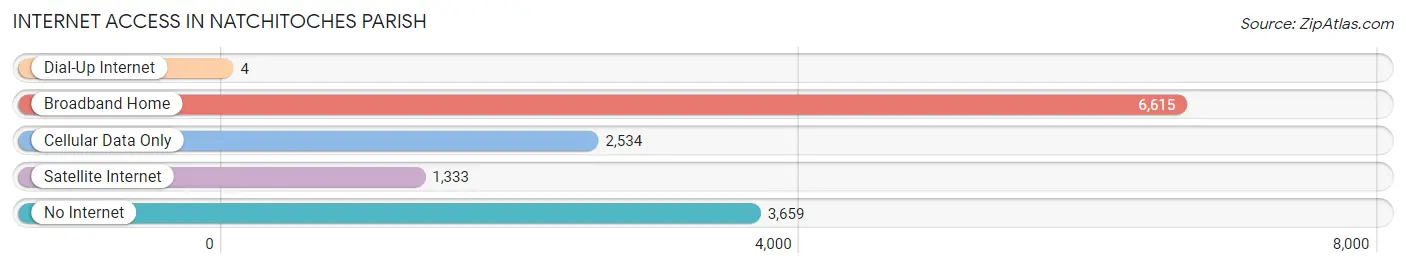
| Internet Type | # Households | % Households |
| Dial-Up Internet | 4 | 0.0% |
| Broadband Home | 6,615 | 47.7% |
| Cellular Data Only | 2,534 | 18.3% |
| Satellite Internet | 1,333 | 9.6% |
| No Internet | 3,659 | 26.4% |
| Total | 13,866 | 100.0% |
Natchitoches Parish Summary
Natchitoches Parish, Louisiana is located in the northwestern corner of the state and is part of the Natchitoches-Sabine Parish Metropolitan Statistical Area. The parish is bordered by Red River Parish to the north, DeSoto Parish to the east, Sabine Parish to the south, and Texas to the west. The parish seat is the city of Natchitoches, which is the oldest permanent settlement in the Louisiana Purchase.
History
Natchitoches Parish was established in 1805, making it one of the oldest parishes in the state. The parish was named after the Natchitoches Native American tribe, which had inhabited the area for centuries prior to European settlement. The first European settlers in the area were French-Canadian fur traders, who established a trading post in the area in 1714. The area was later ceded to the United States in the Louisiana Purchase of 1803.
The parish was an important center of the cotton industry in the 19th century, and the city of Natchitoches was a major port for the shipment of cotton to New Orleans. The parish was also the site of several Civil War battles, including the Battle of Natchitoches in 1863.
Geography
Natchitoches Parish covers an area of 1,299 square miles and is located in the northwestern corner of the state. The parish is bordered by Red River Parish to the north, DeSoto Parish to the east, Sabine Parish to the south, and Texas to the west. The parish is located in the East Gulf Coastal Plain region of Louisiana and is mostly flat, with some rolling hills in the northern part of the parish. The Red River forms the western border of the parish, and the Cane River forms the eastern border.
The parish is home to several lakes, including Lake Natchitoches, Lake Bistineau, and Lake Bistineau State Park. The parish also contains several state parks, including the Kisatchie National Forest, the Cane River Creole National Historical Park, and the Natchitoches National Fish Hatchery.
Economy
Natchitoches Parish has a diverse economy, with the largest industries being manufacturing, retail trade, and health care. The largest employers in the parish are Natchitoches Regional Medical Center, Natchitoches Parish School Board, and Natchitoches Parish Government.
The parish is also home to several large agricultural operations, including cotton, soybeans, corn, and hay. The parish is also home to several timber operations, and the Kisatchie National Forest is a major source of timber for the region.
Demographics
As of the 2010 census, Natchitoches Parish had a population of 39,566. The population was 53.2% White, 40.3% African American, 0.5% Native American, 0.7% Asian, and 4.3% from other races. The median household income was $37,845, and the median family income was $45,845.
The largest cities in the parish are Natchitoches, with a population of 18,323, and Campti, with a population of 1,764. The parish is also home to several small towns, including Ashland, Cloutierville, and Natchez.
Common Questions
What is Per Capita Income in Natchitoches Parish?
Per Capita income in Natchitoches Parish is $25,302.
What is the Median Family Income in Natchitoches Parish?
Median Family Income in Natchitoches Parish is $61,598.
What is the Median Household income in Natchitoches Parish?
Median Household Income in Natchitoches Parish is $41,310.
What is Income or Wage Gap in Natchitoches Parish?
Income or Wage Gap in Natchitoches Parish is 31.8%.
Women in Natchitoches Parish earn 68.2 cents for every dollar earned by a man.
What is Family Income Deficit in Natchitoches Parish?
Family Income Deficit in Natchitoches Parish is $13,092.
Families that are below poverty line in Natchitoches Parish earn $13,092 less on average than the poverty threshold level.
What is Inequality or Gini Index in Natchitoches Parish?
Inequality or Gini Index in Natchitoches Parish is 0.53.
What is the Total Population of Natchitoches Parish?
Total Population of Natchitoches Parish is 37,478.
What is the Total Male Population of Natchitoches Parish?
Total Male Population of Natchitoches Parish is 18,089.
What is the Total Female Population of Natchitoches Parish?
Total Female Population of Natchitoches Parish is 19,389.
What is the Ratio of Males per 100 Females in Natchitoches Parish?
There are 93.30 Males per 100 Females in Natchitoches Parish.
What is the Ratio of Females per 100 Males in Natchitoches Parish?
There are 107.19 Females per 100 Males in Natchitoches Parish.
What is the Median Population Age in Natchitoches Parish?
Median Population Age in Natchitoches Parish is 33.3 Years.
What is the Average Family Size in Natchitoches Parish
Average Family Size in Natchitoches Parish is 3.4 People.
What is the Average Household Size in Natchitoches Parish
Average Household Size in Natchitoches Parish is 2.6 People.
How Large is the Labor Force in Natchitoches Parish?
There are 15,521 People in the Labor Forcein in Natchitoches Parish.
What is the Percentage of People in the Labor Force in Natchitoches Parish?
51.9% of People are in the Labor Force in Natchitoches Parish.
What is the Unemployment Rate in Natchitoches Parish?
Unemployment Rate in Natchitoches Parish is 8.9%.