Bunkie, LA Map & Demographics
Bunkie Map
Bunkie Overview
$20,729
PER CAPITA INCOME
$29,665
AVG FAMILY INCOME
$21,888
AVG HOUSEHOLD INCOME
55.1%
WAGE / INCOME GAP [ % ]
44.9¢/ $1
WAGE / INCOME GAP [ $ ]
$15,626
FAMILY INCOME DEFICIT
0.53
INEQUALITY / GINI INDEX
3,362
TOTAL POPULATION
1,362
MALE POPULATION
2,000
FEMALE POPULATION
68.10
MALES / 100 FEMALES
146.84
FEMALES / 100 MALES
47.9
MEDIAN AGE
3.1
AVG FAMILY SIZE
2.1
AVG HOUSEHOLD SIZE
1,151
LABOR FORCE [ PEOPLE ]
43.8%
PERCENT IN LABOR FORCE
11.2%
UNEMPLOYMENT RATE
Bunkie Zip Codes
Bunkie Area Codes
Income in Bunkie
Income Overview in Bunkie
Per Capita Income in Bunkie is $20,729, while median incomes of families and households are $29,665 and $21,888 respectively.
| Characteristic | Number | Measure |
| Per Capita Income | 3,362 | $20,729 |
| Median Family Income | 759 | $29,665 |
| Mean Family Income | 759 | $55,008 |
| Median Household Income | 1,563 | $21,888 |
| Mean Household Income | 1,563 | $35,381 |
| Income Deficit | 759 | $15,626 |
| Wage / Income Gap (%) | 3,362 | 55.10% |
| Wage / Income Gap ($) | 3,362 | 44.90¢ per $1 |
| Gini / Inequality Index | 3,362 | 0.53 |
Earnings by Sex in Bunkie
Average Earnings in Bunkie are $19,643, $34,028 for men and $15,280 for women, a difference of 55.1%.
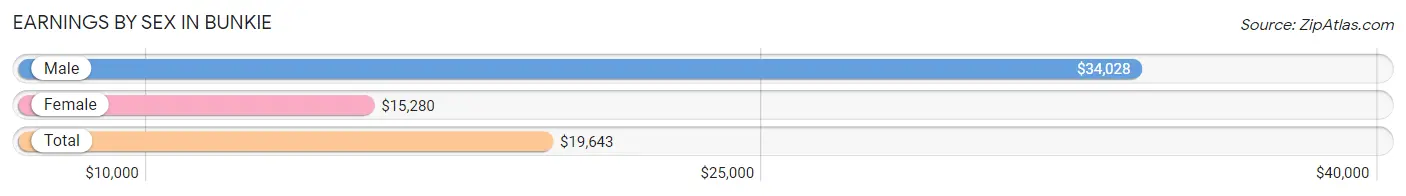
| Sex | Number | Average Earnings |
| Male | 471 (40.9%) | $34,028 |
| Female | 681 (59.1%) | $15,280 |
| Total | 1,152 (100.0%) | $19,643 |
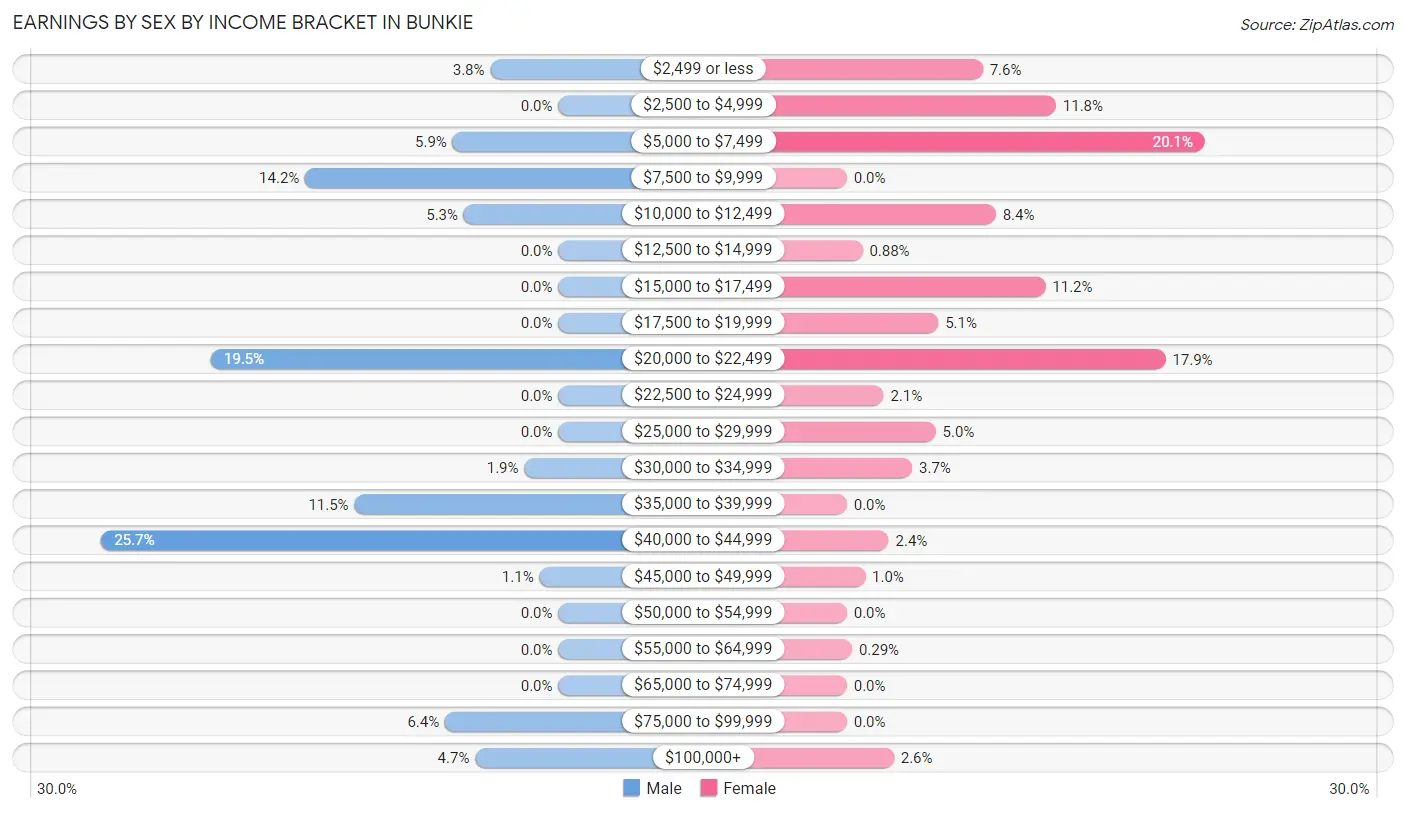
Earnings by Sex by Income Bracket in Bunkie
The most common earnings brackets in Bunkie are $40,000 to $44,999 for men (121 | 25.7%) and $5,000 to $7,499 for women (137 | 20.1%).
| Income | Male | Female |
| $2,499 or less | 18 (3.8%) | 52 (7.6%) |
| $2,500 to $4,999 | 0 (0.0%) | 80 (11.7%) |
| $5,000 to $7,499 | 28 (5.9%) | 137 (20.1%) |
| $7,500 to $9,999 | 67 (14.2%) | 0 (0.0%) |
| $10,000 to $12,499 | 25 (5.3%) | 57 (8.4%) |
| $12,500 to $14,999 | 0 (0.0%) | 6 (0.9%) |
| $15,000 to $17,499 | 0 (0.0%) | 76 (11.2%) |
| $17,500 to $19,999 | 0 (0.0%) | 35 (5.1%) |
| $20,000 to $22,499 | 92 (19.5%) | 122 (17.9%) |
| $22,500 to $24,999 | 0 (0.0%) | 14 (2.1%) |
| $25,000 to $29,999 | 0 (0.0%) | 34 (5.0%) |
| $30,000 to $34,999 | 9 (1.9%) | 25 (3.7%) |
| $35,000 to $39,999 | 54 (11.5%) | 0 (0.0%) |
| $40,000 to $44,999 | 121 (25.7%) | 16 (2.4%) |
| $45,000 to $49,999 | 5 (1.1%) | 7 (1.0%) |
| $50,000 to $54,999 | 0 (0.0%) | 0 (0.0%) |
| $55,000 to $64,999 | 0 (0.0%) | 2 (0.3%) |
| $65,000 to $74,999 | 0 (0.0%) | 0 (0.0%) |
| $75,000 to $99,999 | 30 (6.4%) | 0 (0.0%) |
| $100,000+ | 22 (4.7%) | 18 (2.6%) |
| Total | 471 (100.0%) | 681 (100.0%) |
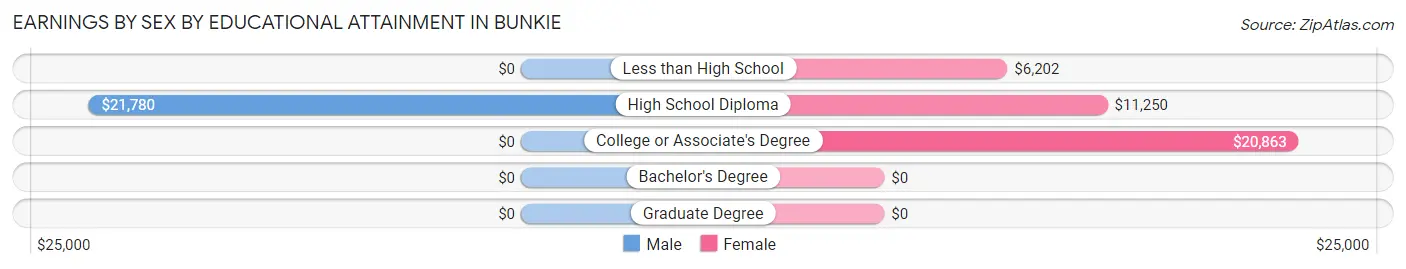
Earnings by Sex by Educational Attainment in Bunkie
Average earnings in Bunkie are $34,861 for men and $14,583 for women, a difference of 58.2%. Men with an educational attainment of high school diploma enjoy the highest average annual earnings of $21,780, while those with high school diploma education earn the least with $21,780. Women with an educational attainment of college or associate's degree earn the most with the average annual earnings of $20,863, while those with less than high school education have the smallest earnings of $6,202.
| Educational Attainment | Male Income | Female Income |
| Less than High School | - | - |
| High School Diploma | $21,780 | $11,250 |
| College or Associate's Degree | - | - |
| Bachelor's Degree | - | - |
| Graduate Degree | - | - |
| Total | $34,861 | $14,583 |
Family Income in Bunkie
Family Income Brackets in Bunkie
According to the Bunkie family income data, there are 174 families falling into the $15,000 to $24,999 income range, which is the most common income bracket and makes up 22.9% of all families.
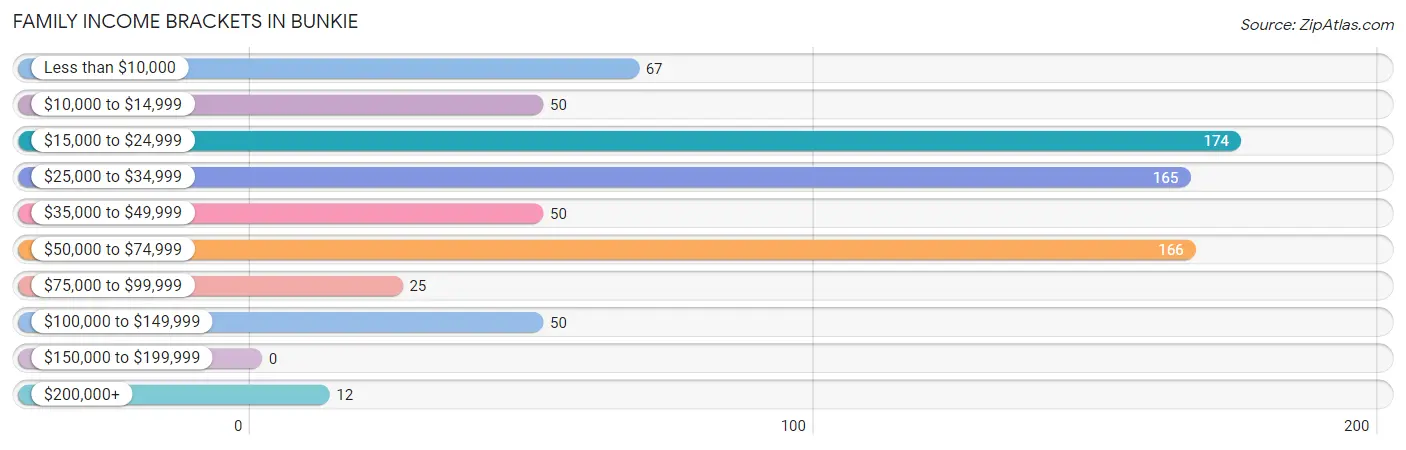
| Income Bracket | # Families | % Families |
| Less than $10,000 | 67 | 8.8% |
| $10,000 to $14,999 | 50 | 6.6% |
| $15,000 to $24,999 | 174 | 22.9% |
| $25,000 to $34,999 | 165 | 21.7% |
| $35,000 to $49,999 | 50 | 6.6% |
| $50,000 to $74,999 | 166 | 21.9% |
| $75,000 to $99,999 | 25 | 3.3% |
| $100,000 to $149,999 | 50 | 6.6% |
| $150,000 to $199,999 | 0 | 0.0% |
| $200,000+ | 12 | 1.6% |
Family Income by Famaliy Size in Bunkie
2-person families (435 | 57.3%) account for the highest median family income in Bunkie with $27,469 per family, while 2-person families (435 | 57.3%) have the highest median income of $13,734 per family member.
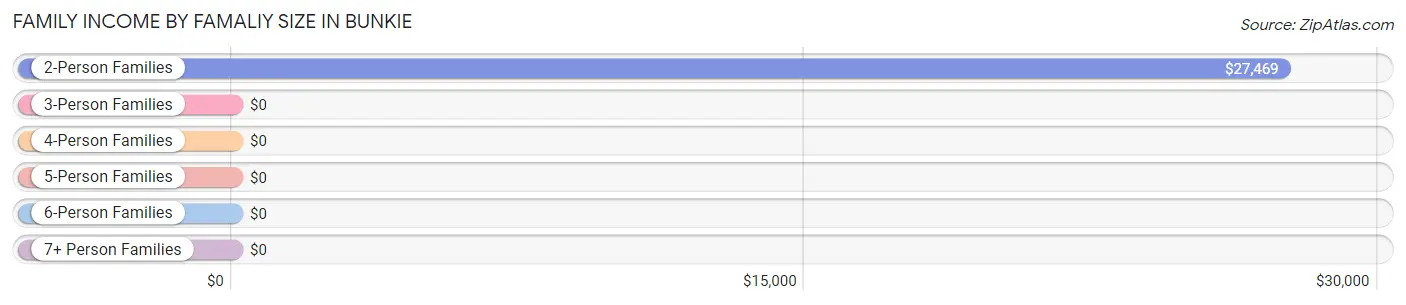
| Income Bracket | # Families | Median Income |
| 2-Person Families | 435 (57.3%) | $27,469 |
| 3-Person Families | 136 (17.9%) | $0 |
| 4-Person Families | 91 (12.0%) | $0 |
| 5-Person Families | 72 (9.5%) | $0 |
| 6-Person Families | 0 (0.0%) | $0 |
| 7+ Person Families | 25 (3.3%) | $0 |
| Total | 759 (100.0%) | $29,665 |
Family Income by Number of Earners in Bunkie
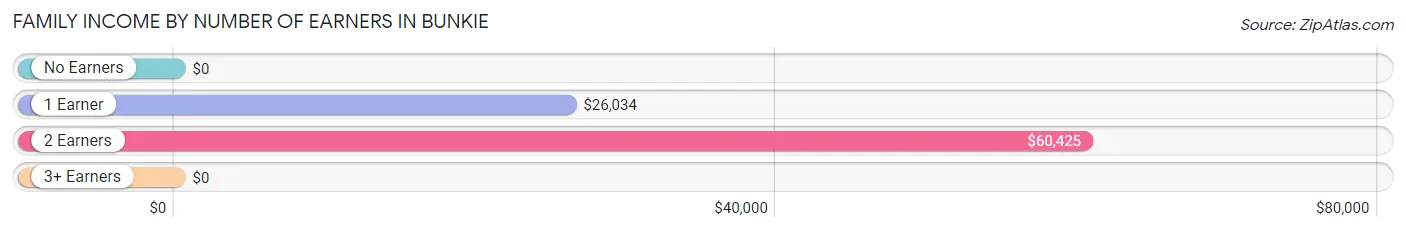
| Number of Earners | # Families | Median Income |
| No Earners | 156 (20.5%) | $0 |
| 1 Earner | 398 (52.4%) | $26,034 |
| 2 Earners | 199 (26.2%) | $60,425 |
| 3+ Earners | 6 (0.8%) | $0 |
| Total | 759 (100.0%) | $29,665 |
Household Income in Bunkie
Household Income Brackets in Bunkie
With 469 households falling in the category, the $15,000 to $24,999 income range is the most frequent in Bunkie, accounting for 30.0% of all households.
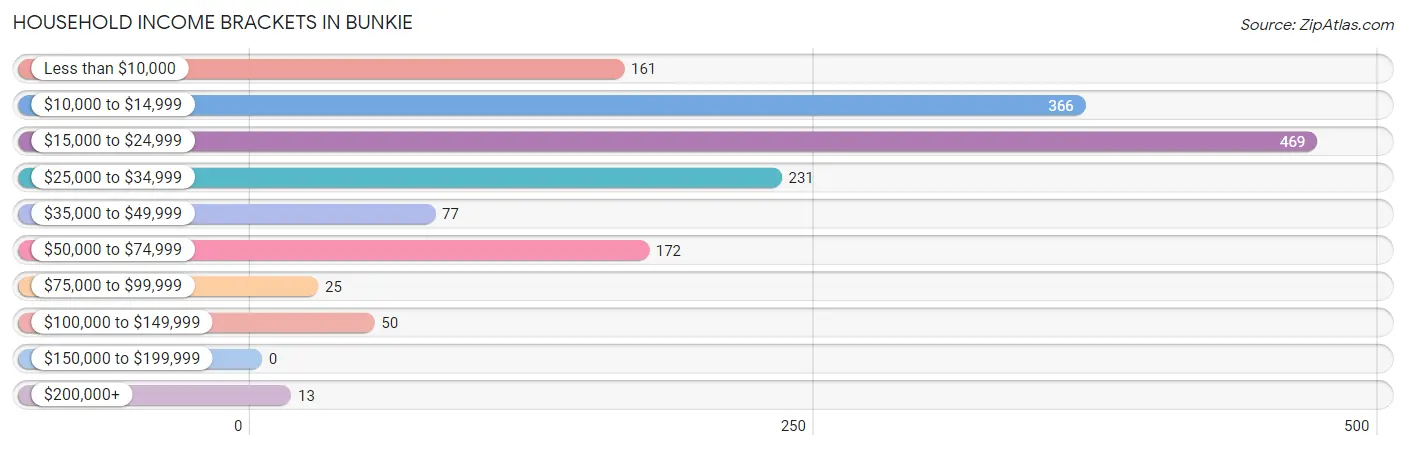
| Income Bracket | # Households | % Households |
| Less than $10,000 | 161 | 10.3% |
| $10,000 to $14,999 | 366 | 23.4% |
| $15,000 to $24,999 | 469 | 30.0% |
| $25,000 to $34,999 | 231 | 14.8% |
| $35,000 to $49,999 | 77 | 4.9% |
| $50,000 to $74,999 | 172 | 11.0% |
| $75,000 to $99,999 | 25 | 1.6% |
| $100,000 to $149,999 | 50 | 3.2% |
| $150,000 to $199,999 | 0 | 0.0% |
| $200,000+ | 13 | 0.8% |
Household Income by Householder Age in Bunkie
The median household income in Bunkie is $21,888, with the highest median household income of $23,275 found in the 65+ years age bracket for the primary householder. A total of 621 households (39.7%) fall into this category. Meanwhile, the 15 to 24 years age bracket for the primary householder has the lowest median household income of $0, with 65 households (4.2%) in this group.
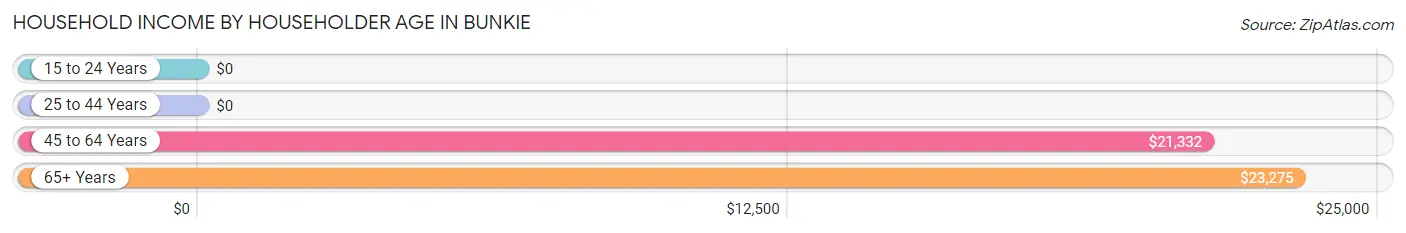
| Income Bracket | # Households | Median Income |
| 15 to 24 Years | 65 (4.2%) | $0 |
| 25 to 44 Years | 287 (18.4%) | $0 |
| 45 to 64 Years | 590 (37.8%) | $21,332 |
| 65+ Years | 621 (39.7%) | $23,275 |
| Total | 1,563 (100.0%) | $21,888 |
Poverty in Bunkie
Income Below Poverty by Sex and Age in Bunkie
With 36.7% poverty level for males and 45.2% for females among the residents of Bunkie, under 5 year old males and 6 to 11 year old females are the most vulnerable to poverty, with 78 males (100.0%) and 217 females (100.0%) in their respective age groups living below the poverty level.
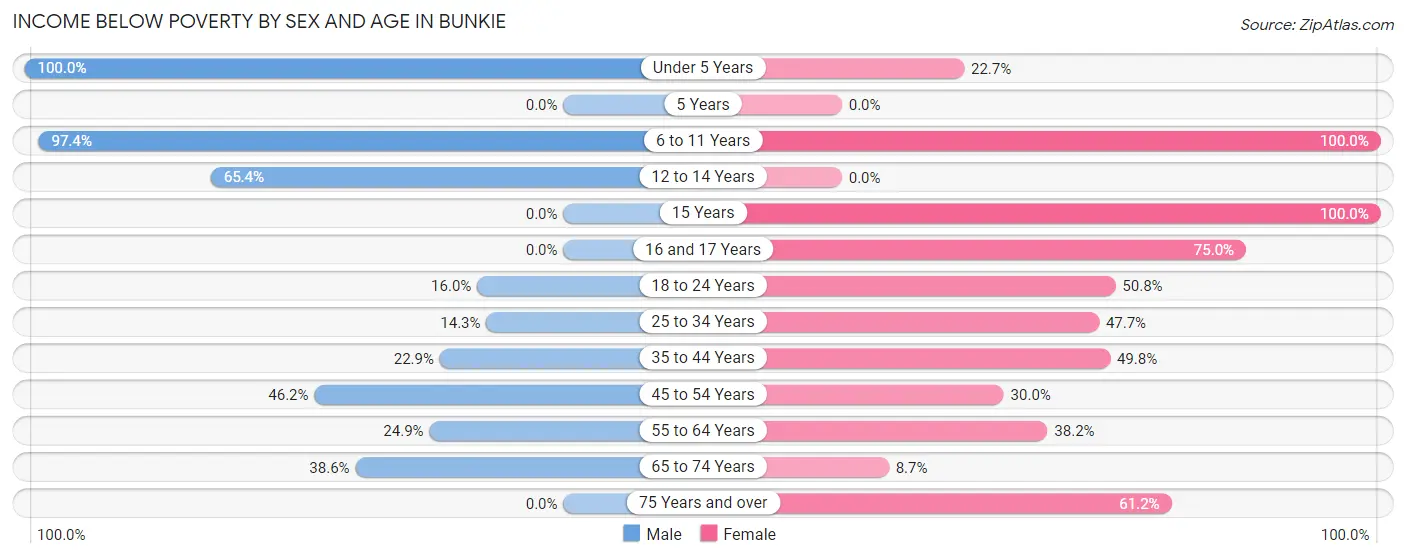
| Age Bracket | Male | Female |
| Under 5 Years | 78 (100.0%) | 27 (22.7%) |
| 5 Years | 0 (0.0%) | 0 (0.0%) |
| 6 to 11 Years | 75 (97.4%) | 217 (100.0%) |
| 12 to 14 Years | 106 (65.4%) | 0 (0.0%) |
| 15 Years | 0 (0.0%) | 16 (100.0%) |
| 16 and 17 Years | 0 (0.0%) | 9 (75.0%) |
| 18 to 24 Years | 28 (16.0%) | 32 (50.8%) |
| 25 to 34 Years | 18 (14.3%) | 21 (47.7%) |
| 35 to 44 Years | 25 (22.9%) | 114 (49.8%) |
| 45 to 54 Years | 55 (46.2%) | 70 (30.0%) |
| 55 to 64 Years | 45 (24.9%) | 116 (38.2%) |
| 65 to 74 Years | 66 (38.6%) | 25 (8.7%) |
| 75 Years and over | 0 (0.0%) | 230 (61.2%) |
| Total | 496 (36.7%) | 877 (45.2%) |
Income Above Poverty by Sex and Age in Bunkie
According to the poverty statistics in Bunkie, males aged 15 years and females aged 12 to 14 years are the age groups that are most secure financially, with 100.0% of males and 100.0% of females in these age groups living above the poverty line.
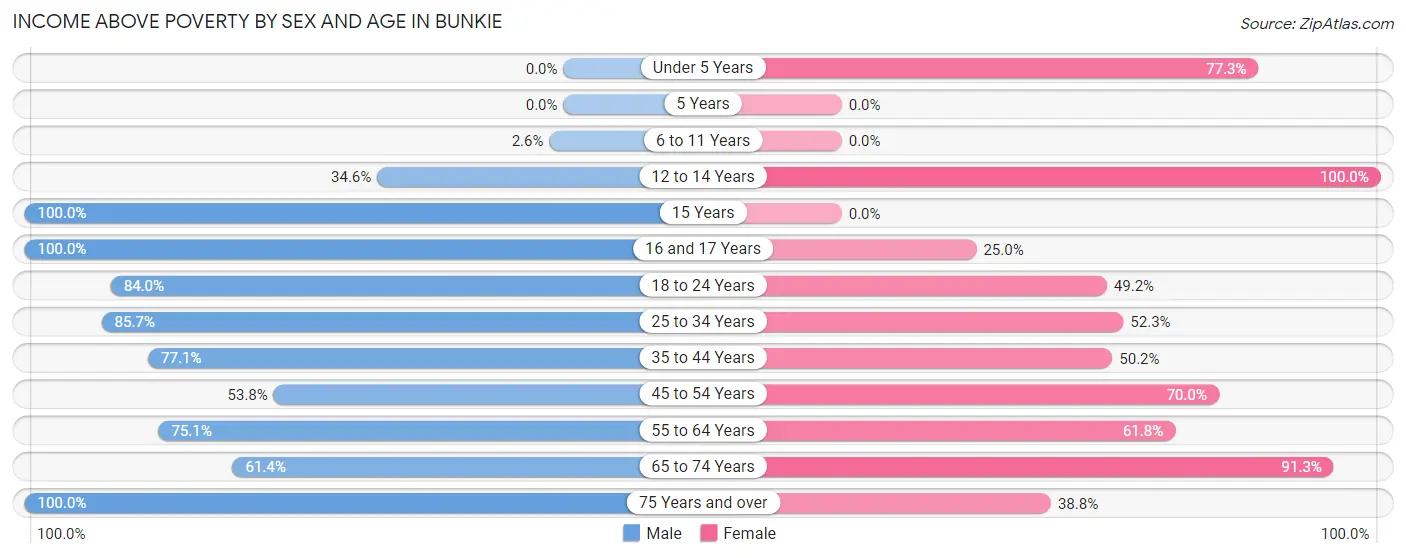
| Age Bracket | Male | Female |
| Under 5 Years | 0 (0.0%) | 92 (77.3%) |
| 5 Years | 0 (0.0%) | 0 (0.0%) |
| 6 to 11 Years | 2 (2.6%) | 0 (0.0%) |
| 12 to 14 Years | 56 (34.6%) | 40 (100.0%) |
| 15 Years | 26 (100.0%) | 0 (0.0%) |
| 16 and 17 Years | 36 (100.0%) | 3 (25.0%) |
| 18 to 24 Years | 147 (84.0%) | 31 (49.2%) |
| 25 to 34 Years | 108 (85.7%) | 23 (52.3%) |
| 35 to 44 Years | 84 (77.1%) | 115 (50.2%) |
| 45 to 54 Years | 64 (53.8%) | 163 (70.0%) |
| 55 to 64 Years | 136 (75.1%) | 188 (61.8%) |
| 65 to 74 Years | 105 (61.4%) | 262 (91.3%) |
| 75 Years and over | 92 (100.0%) | 146 (38.8%) |
| Total | 856 (63.3%) | 1,063 (54.8%) |
Income Below Poverty Among Married-Couple Families in Bunkie
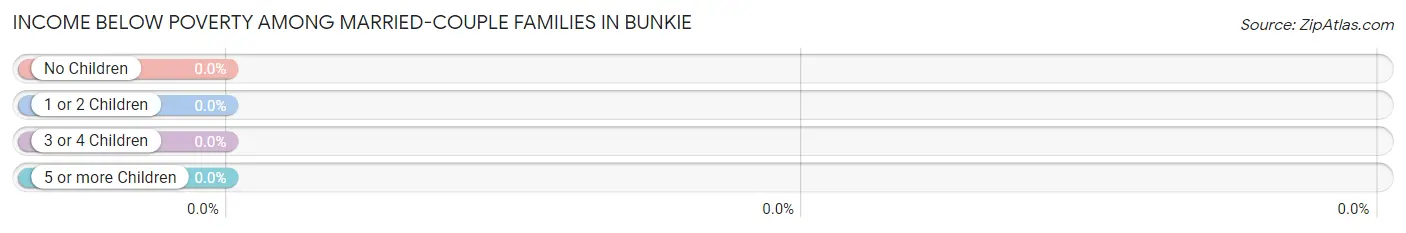
| Children | Above Poverty | Below Poverty |
| No Children | 187 (100.0%) | 0 (0.0%) |
| 1 or 2 Children | 25 (100.0%) | 0 (0.0%) |
| 3 or 4 Children | 0 (0.0%) | 0 (0.0%) |
| 5 or more Children | 0 (0.0%) | 0 (0.0%) |
| Total | 212 (100.0%) | 0 (0.0%) |
Income Below Poverty Among Single-Parent Households in Bunkie
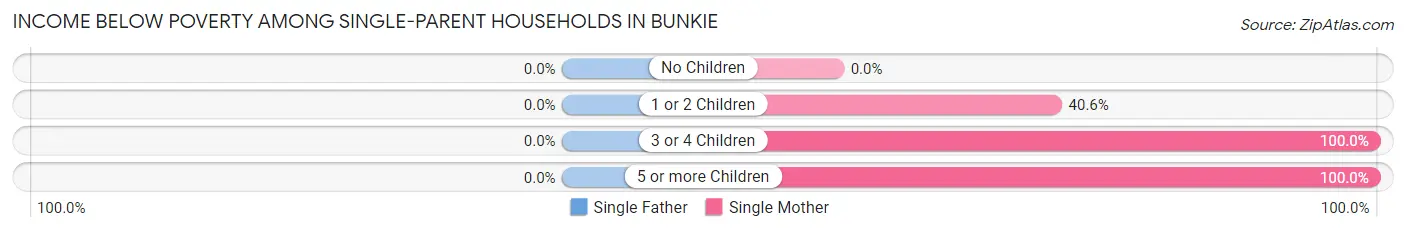
| Children | Single Father | Single Mother |
| No Children | 0 (0.0%) | 0 (0.0%) |
| 1 or 2 Children | 0 (0.0%) | 82 (40.6%) |
| 3 or 4 Children | 0 (0.0%) | 67 (100.0%) |
| 5 or more Children | 0 (0.0%) | 25 (100.0%) |
| Total | 0 (0.0%) | 174 (45.9%) |
Income Below Poverty Among Married-Couple vs Single-Parent Households in Bunkie
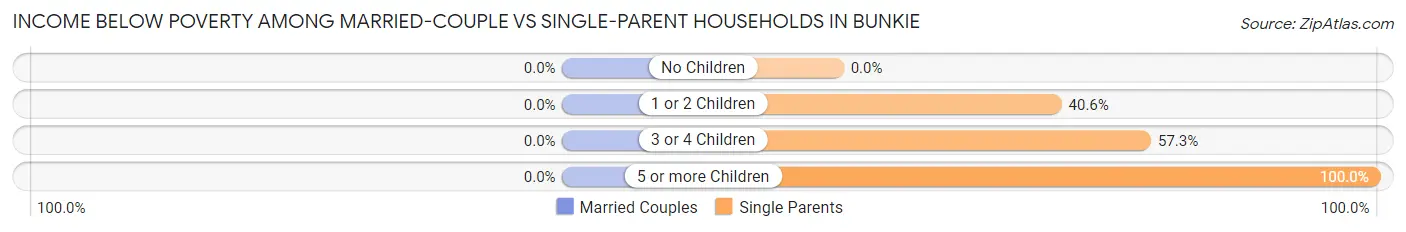
| Children | Married-Couple Families | Single-Parent Households |
| No Children | 0 (0.0%) | 0 (0.0%) |
| 1 or 2 Children | 0 (0.0%) | 82 (40.6%) |
| 3 or 4 Children | 0 (0.0%) | 67 (57.3%) |
| 5 or more Children | 0 (0.0%) | 25 (100.0%) |
| Total | 0 (0.0%) | 174 (31.8%) |
Race in Bunkie
The most populous races in Bunkie are Black / African American (1,835 | 54.6%), White / Caucasian (1,309 | 38.9%), and Two or more Races (160 | 4.8%).
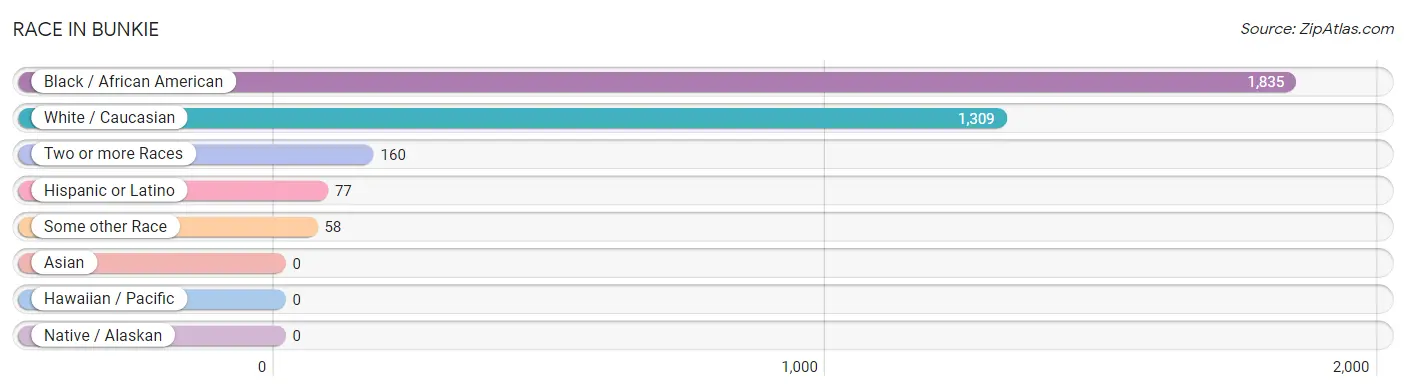
| Race | # Population | % Population |
| Asian | 0 | 0.0% |
| Black / African American | 1,835 | 54.6% |
| Hawaiian / Pacific | 0 | 0.0% |
| Hispanic or Latino | 77 | 2.3% |
| Native / Alaskan | 0 | 0.0% |
| White / Caucasian | 1,309 | 38.9% |
| Two or more Races | 160 | 4.8% |
| Some other Race | 58 | 1.7% |
| Total | 3,362 | 100.0% |
Ancestry in Bunkie
The most populous ancestries reported in Bunkie are French (454 | 13.5%), Irish (371 | 11.0%), Italian (215 | 6.4%), Cajun (160 | 4.8%), and German (126 | 3.7%), together accounting for 39.4% of all Bunkie residents.
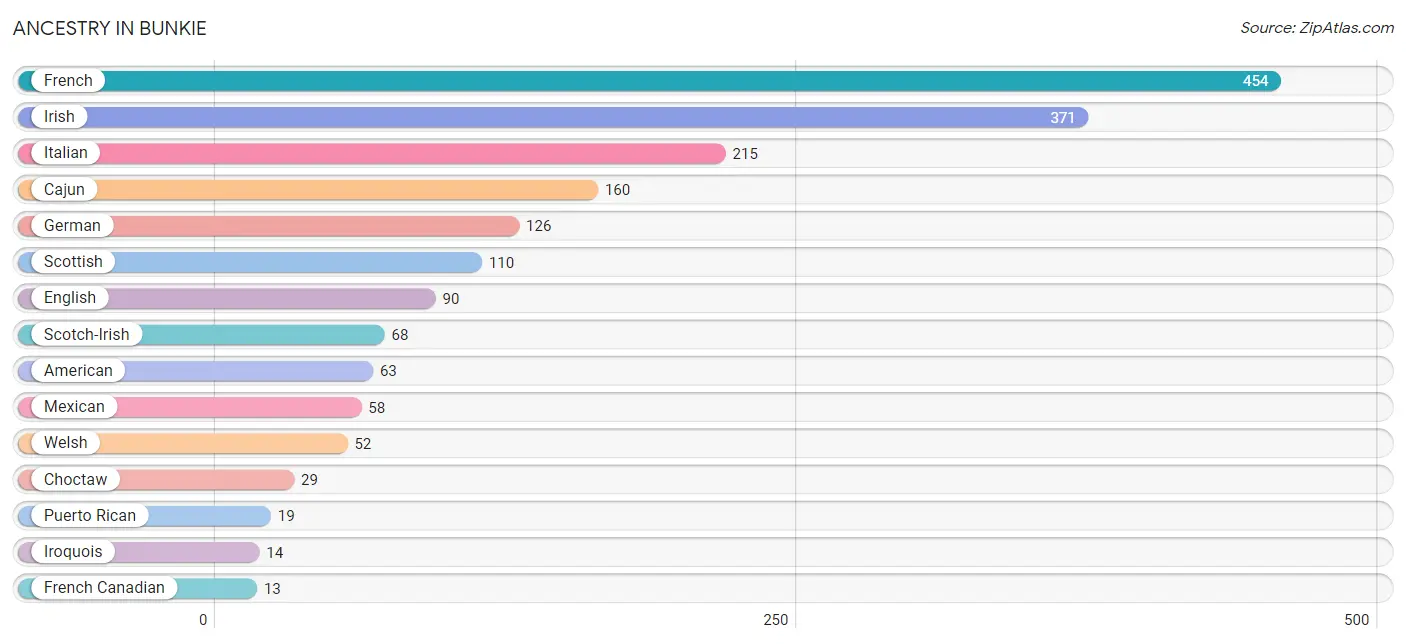
| Ancestry | # Population | % Population |
| American | 63 | 1.9% |
| Cajun | 160 | 4.8% |
| Choctaw | 29 | 0.9% |
| English | 90 | 2.7% |
| French | 454 | 13.5% |
| French Canadian | 13 | 0.4% |
| German | 126 | 3.7% |
| Irish | 371 | 11.0% |
| Iroquois | 14 | 0.4% |
| Italian | 215 | 6.4% |
| Mexican | 58 | 1.7% |
| Puerto Rican | 19 | 0.6% |
| Scotch-Irish | 68 | 2.0% |
| Scottish | 110 | 3.3% |
| Swiss | 7 | 0.2% |
| Welsh | 52 | 1.5% | View All 16 Rows |
Immigrants in Bunkie

| Immigration Origin | # Population | % Population | View All 0 Rows |
Sex and Age in Bunkie
Sex and Age in Bunkie
The most populous age groups in Bunkie are 20 to 24 Years (175 | 12.9%) for men and 60 to 64 Years (226 | 11.3%) for women.
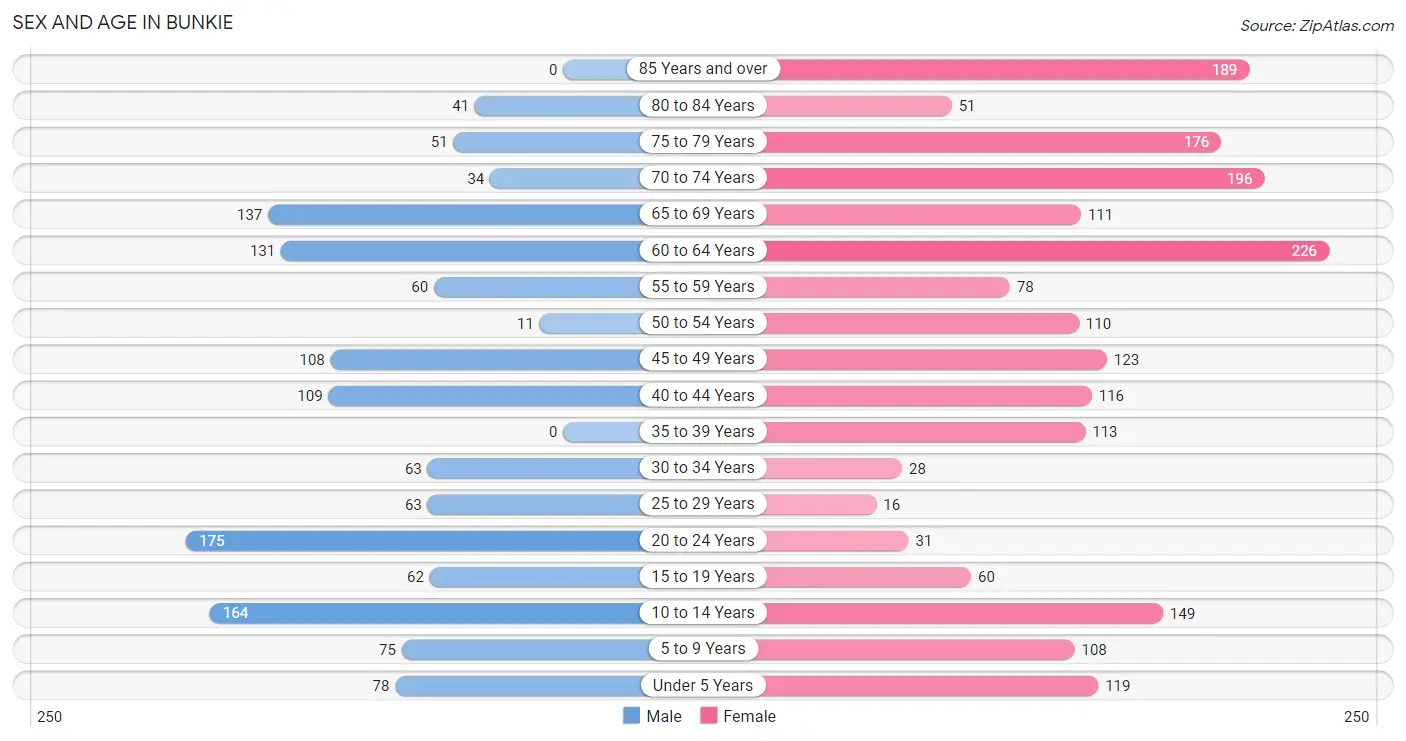
| Age Bracket | Male | Female |
| Under 5 Years | 78 (5.7%) | 119 (5.9%) |
| 5 to 9 Years | 75 (5.5%) | 108 (5.4%) |
| 10 to 14 Years | 164 (12.0%) | 149 (7.4%) |
| 15 to 19 Years | 62 (4.5%) | 60 (3.0%) |
| 20 to 24 Years | 175 (12.9%) | 31 (1.5%) |
| 25 to 29 Years | 63 (4.6%) | 16 (0.8%) |
| 30 to 34 Years | 63 (4.6%) | 28 (1.4%) |
| 35 to 39 Years | 0 (0.0%) | 113 (5.7%) |
| 40 to 44 Years | 109 (8.0%) | 116 (5.8%) |
| 45 to 49 Years | 108 (7.9%) | 123 (6.1%) |
| 50 to 54 Years | 11 (0.8%) | 110 (5.5%) |
| 55 to 59 Years | 60 (4.4%) | 78 (3.9%) |
| 60 to 64 Years | 131 (9.6%) | 226 (11.3%) |
| 65 to 69 Years | 137 (10.1%) | 111 (5.6%) |
| 70 to 74 Years | 34 (2.5%) | 196 (9.8%) |
| 75 to 79 Years | 51 (3.7%) | 176 (8.8%) |
| 80 to 84 Years | 41 (3.0%) | 51 (2.5%) |
| 85 Years and over | 0 (0.0%) | 189 (9.5%) |
| Total | 1,362 (100.0%) | 2,000 (100.0%) |
Families and Households in Bunkie
Median Family Size in Bunkie
The median family size in Bunkie is 3.13 persons per family, with single female/mother families (379 | 49.9%) accounting for the largest median family size of 3.58 persons per family. On the other hand, married-couple families (212 | 27.9%) represent the smallest median family size with 2.56 persons per family.
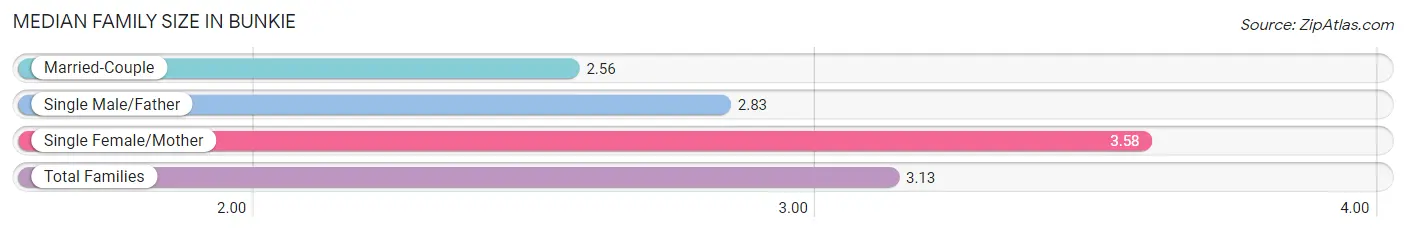
| Family Type | # Families | Family Size |
| Married-Couple | 212 (27.9%) | 2.56 |
| Single Male/Father | 168 (22.1%) | 2.83 |
| Single Female/Mother | 379 (49.9%) | 3.58 |
| Total Families | 759 (100.0%) | 3.13 |
Median Household Size in Bunkie
The median household size in Bunkie is 2.11 persons per household, with single female/mother households (379 | 24.2%) accounting for the largest median household size of 3.63 persons per household. non-family households (804 | 51.4%) represent the smallest median household size with 1.04 persons per household.
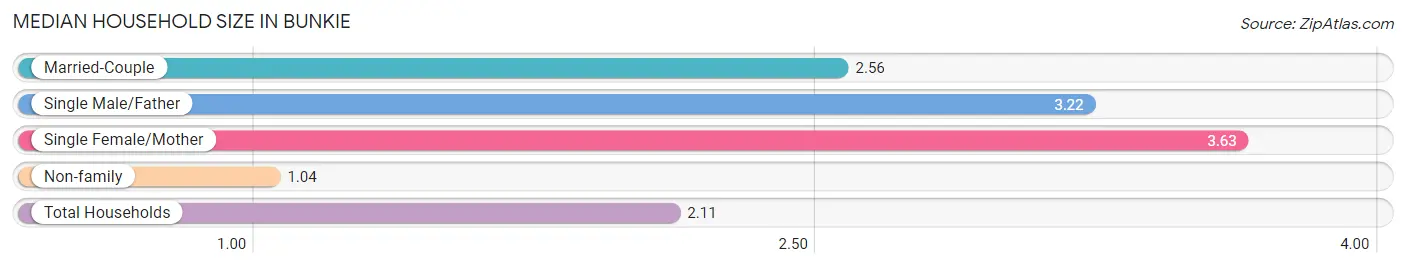
| Household Type | # Households | Household Size |
| Married-Couple | 212 (13.6%) | 2.56 |
| Single Male/Father | 168 (10.7%) | 3.22 |
| Single Female/Mother | 379 (24.2%) | 3.63 |
| Non-family | 804 (51.4%) | 1.04 |
| Total Households | 1,563 (100.0%) | 2.11 |
Household Size by Marriage Status in Bunkie
Out of a total of 1,563 households in Bunkie, 759 (48.6%) are family households, while 804 (51.4%) are nonfamily households. The most numerous type of family households are 2-person households, comprising 435, and the most common type of nonfamily households are 1-person households, comprising 771.
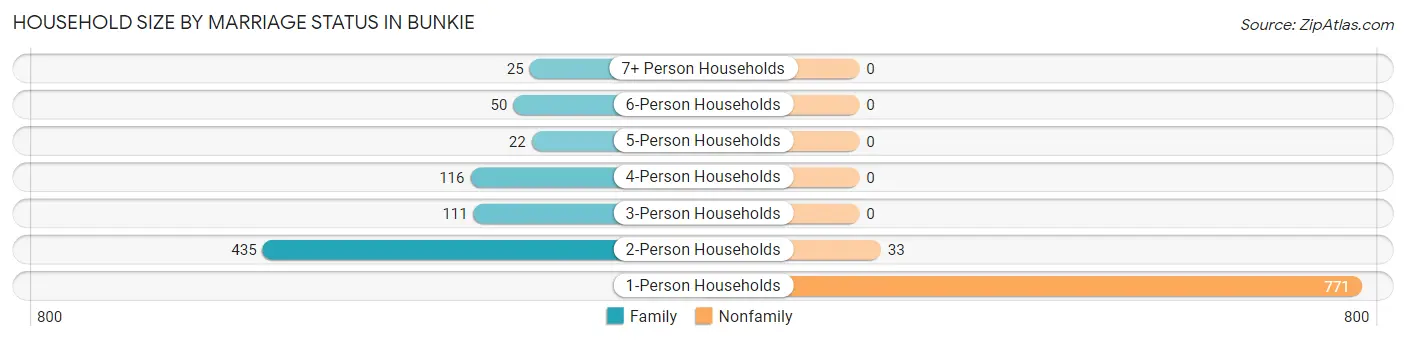
| Household Size | Family Households | Nonfamily Households |
| 1-Person Households | - | 771 (49.3%) |
| 2-Person Households | 435 (27.8%) | 33 (2.1%) |
| 3-Person Households | 111 (7.1%) | 0 (0.0%) |
| 4-Person Households | 116 (7.4%) | 0 (0.0%) |
| 5-Person Households | 22 (1.4%) | 0 (0.0%) |
| 6-Person Households | 50 (3.2%) | 0 (0.0%) |
| 7+ Person Households | 25 (1.6%) | 0 (0.0%) |
| Total | 759 (48.6%) | 804 (51.4%) |
Female Fertility in Bunkie
Fertility by Age in Bunkie
Average fertility rate in Bunkie is 323.0 births per 1,000 women. Women in the age bracket of 20 to 34 years have the highest fertility rate with 547.0 births per 1,000 women. Women in the age bracket of 35 to 50 years acount for 74.5% of all women with births.
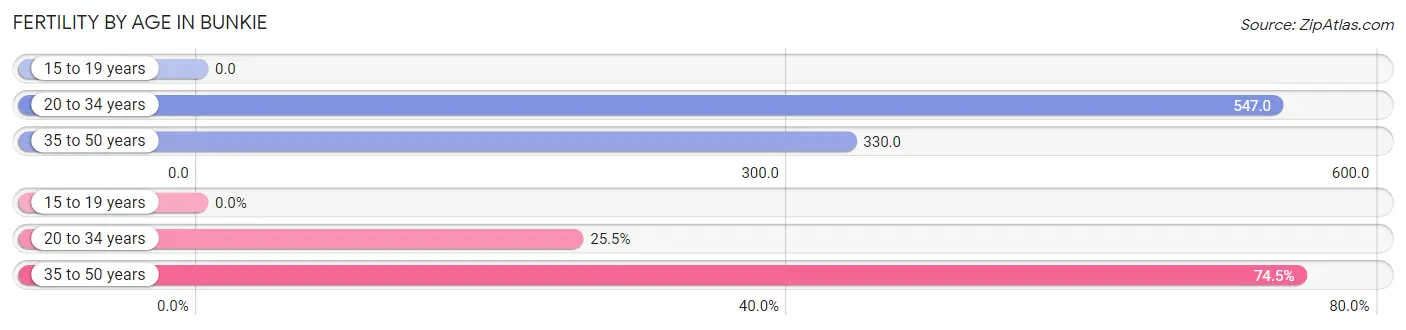
| Age Bracket | Women with Births | Births / 1,000 Women |
| 15 to 19 years | 0 (0.0%) | 0.0 |
| 20 to 34 years | 41 (25.5%) | 547.0 |
| 35 to 50 years | 120 (74.5%) | 330.0 |
| Total | 161 (100.0%) | 323.0 |
Fertility by Age by Marriage Status in Bunkie
9.9% of women with births (161) in Bunkie are married. The highest percentage of unmarried women with births falls into 35 to 50 years age bracket with 100.0% of them unmarried at the time of birth, while the lowest percentage of unmarried women with births belong to 20 to 34 years age bracket with 61.0% of them unmarried.
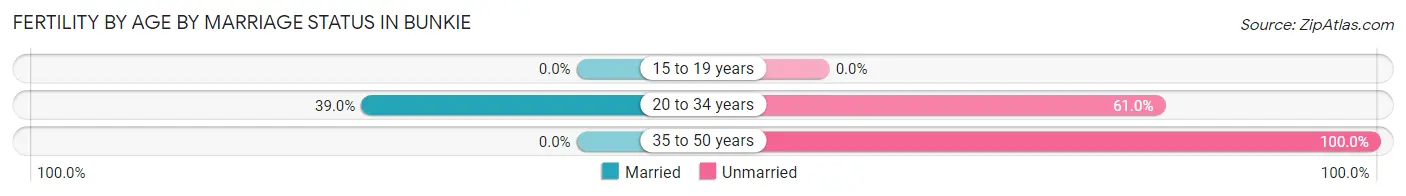
| Age Bracket | Married | Unmarried |
| 15 to 19 years | 0 (0.0%) | 0 (0.0%) |
| 20 to 34 years | 16 (39.0%) | 25 (61.0%) |
| 35 to 50 years | 0 (0.0%) | 120 (100.0%) |
| Total | 16 (9.9%) | 145 (90.1%) |
Fertility by Education in Bunkie
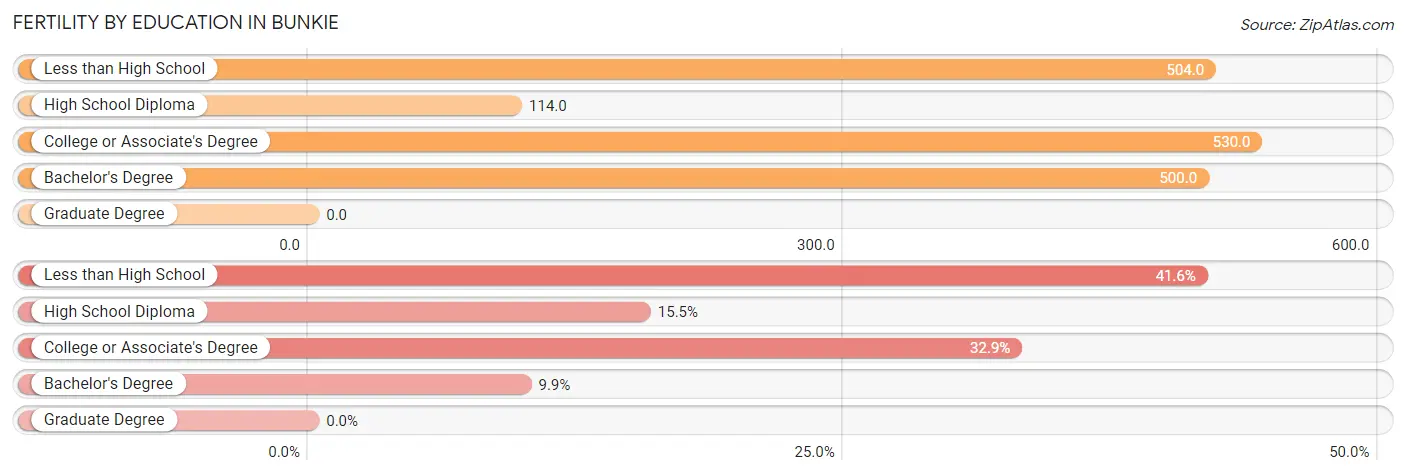
| Educational Attainment | Women with Births | Births / 1,000 Women |
| Less than High School | 67 (41.6%) | 504.0 |
| High School Diploma | 25 (15.5%) | 114.0 |
| College or Associate's Degree | 53 (32.9%) | 530.0 |
| Bachelor's Degree | 16 (9.9%) | 500.0 |
| Graduate Degree | 0 (0.0%) | 0.0 |
| Total | 161 (100.0%) | 323.0 |
Fertility by Education by Marriage Status in Bunkie
90.1% of women with births in Bunkie are unmarried. Women with the educational attainment of bachelor's degree are most likely to be married with 100.0% of them married at childbirth, while women with the educational attainment of less than high school are least likely to be married with 100.0% of them unmarried at childbirth.
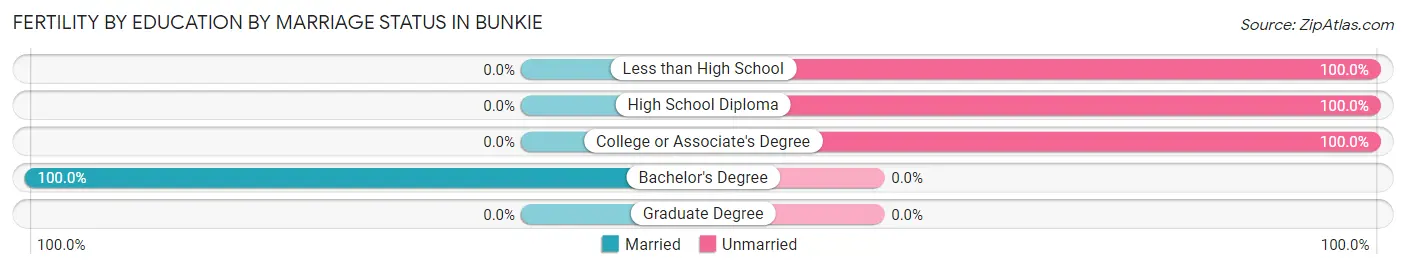
| Educational Attainment | Married | Unmarried |
| Less than High School | 0 (0.0%) | 67 (100.0%) |
| High School Diploma | 0 (0.0%) | 25 (100.0%) |
| College or Associate's Degree | 0 (0.0%) | 53 (100.0%) |
| Bachelor's Degree | 16 (100.0%) | 0 (0.0%) |
| Graduate Degree | 0 (0.0%) | 0 (0.0%) |
| Total | 16 (9.9%) | 145 (90.1%) |
Employment Characteristics in Bunkie
Employment by Class of Employer in Bunkie
Among the 991 employed individuals in Bunkie, private company employees (699 | 70.5%), self-employed (not incorporated) (140 | 14.1%), and not-for-profit organizations (50 | 5.1%) make up the most common classes of employment.
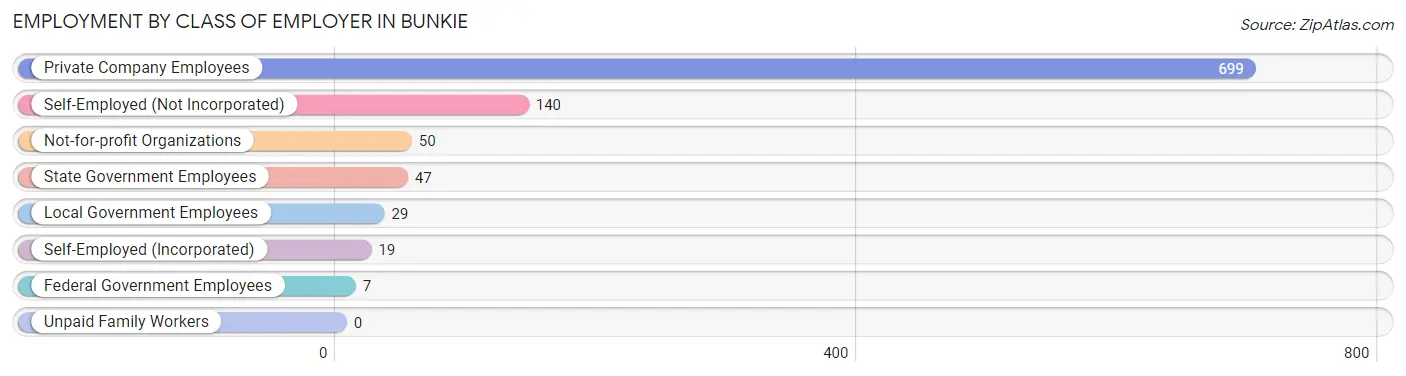
| Employer Class | # Employees | % Employees |
| Private Company Employees | 699 | 70.5% |
| Self-Employed (Incorporated) | 19 | 1.9% |
| Self-Employed (Not Incorporated) | 140 | 14.1% |
| Not-for-profit Organizations | 50 | 5.1% |
| Local Government Employees | 29 | 2.9% |
| State Government Employees | 47 | 4.7% |
| Federal Government Employees | 7 | 0.7% |
| Unpaid Family Workers | 0 | 0.0% |
| Total | 991 | 100.0% |
Employment Status by Age in Bunkie
According to the labor force statistics for Bunkie, out of the total population over 16 years of age (2,627), 43.8% or 1,151 individuals are in the labor force, with 11.2% or 129 of them unemployed. The age group with the highest labor force participation rate is 25 to 29 years, with 100.0% or 79 individuals in the labor force. Within the labor force, the 45 to 54 years age range has the highest percentage of unemployed individuals, with 40.2% or 72 of them being unemployed.
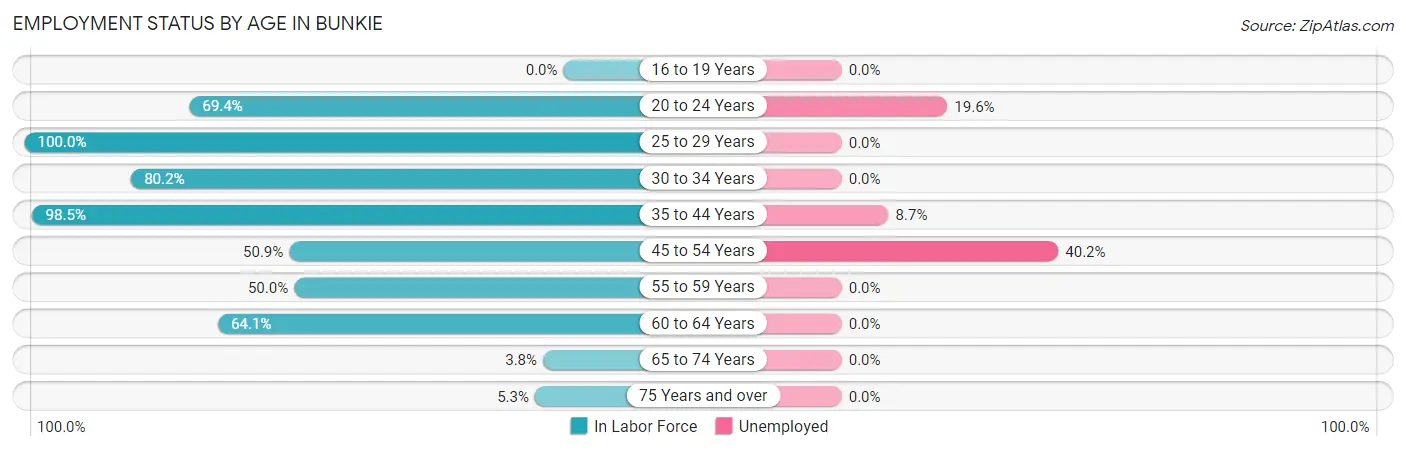
| Age Bracket | In Labor Force | Unemployed |
| 16 to 19 Years | 0 (0.0%) | 0 (0.0%) |
| 20 to 24 Years | 143 (69.4%) | 28 (19.6%) |
| 25 to 29 Years | 79 (100.0%) | 0 (0.0%) |
| 30 to 34 Years | 73 (80.2%) | 0 (0.0%) |
| 35 to 44 Years | 333 (98.5%) | 29 (8.7%) |
| 45 to 54 Years | 179 (50.9%) | 72 (40.2%) |
| 55 to 59 Years | 69 (50.0%) | 0 (0.0%) |
| 60 to 64 Years | 229 (64.1%) | 0 (0.0%) |
| 65 to 74 Years | 18 (3.8%) | 0 (0.0%) |
| 75 Years and over | 27 (5.3%) | 0 (0.0%) |
| Total | 1,151 (43.8%) | 129 (11.2%) |
Employment Status by Educational Attainment in Bunkie
According to labor force statistics for Bunkie, 71.0% of individuals (962) out of the total population between 25 and 64 years of age (1,355) are in the labor force, with 10.5% or 101 of them being unemployed. The group with the highest labor force participation rate are those with the educational attainment of high school diploma, with 80.1% or 553 individuals in the labor force. Within the labor force, individuals with bachelor's degree or higher education have the highest percentage of unemployment, with 34.8% or 16 of them being unemployed.
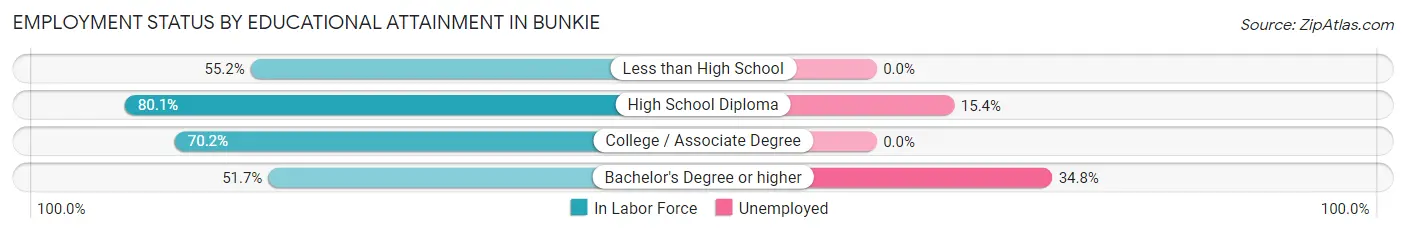
| Educational Attainment | In Labor Force | Unemployed |
| Less than High School | 153 (55.2%) | 0 (0.0%) |
| High School Diploma | 553 (80.1%) | 106 (15.4%) |
| College / Associate Degree | 210 (70.2%) | 0 (0.0%) |
| Bachelor's Degree or higher | 46 (51.7%) | 31 (34.8%) |
| Total | 962 (71.0%) | 142 (10.5%) |
Employment Occupations by Sex in Bunkie
Management, Business, Science and Arts Occupations
The most common Management, Business, Science and Arts occupations in Bunkie are Management (25 | 2.5%), Business & Financial (22 | 2.1%), Community & Social Service (21 | 2.1%), Education Instruction & Library (21 | 2.1%), and Health Diagnosing & Treating (14 | 1.4%).
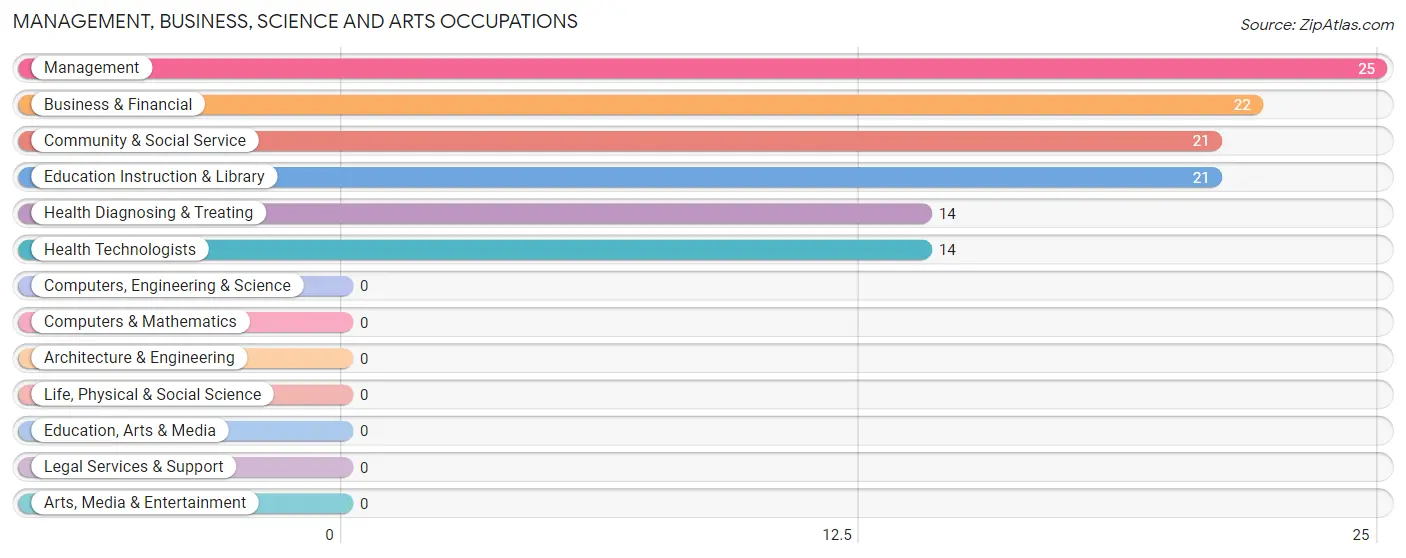
Management, Business, Science and Arts Occupations by Sex
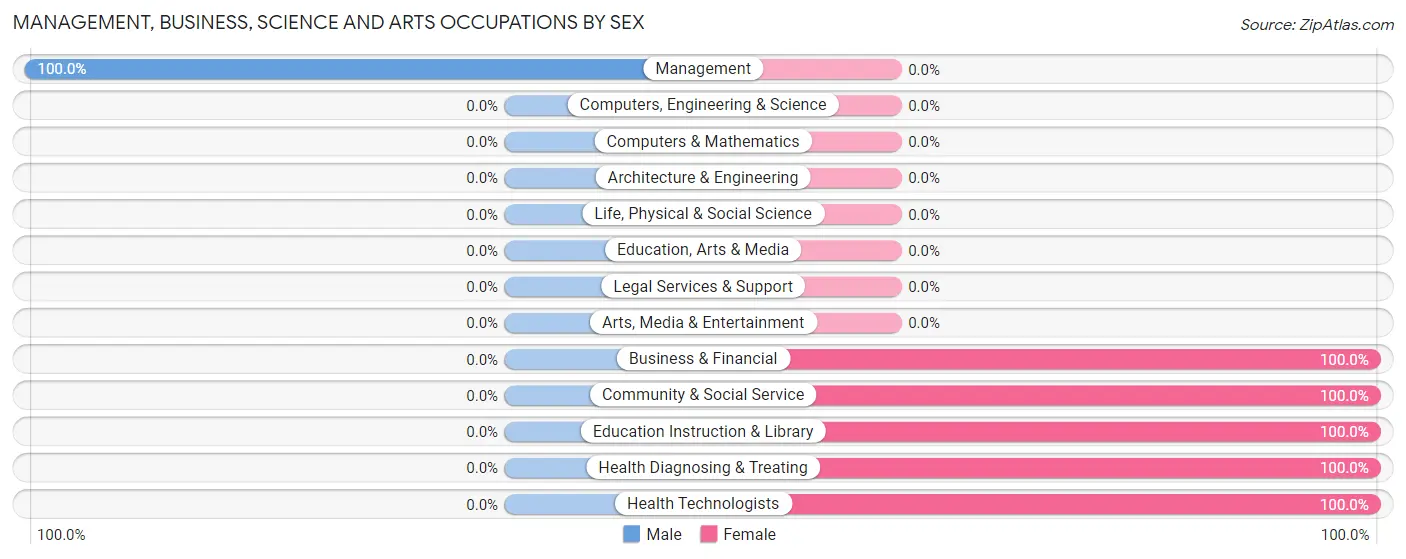
| Occupation | Male | Female |
| Management | 25 (100.0%) | 0 (0.0%) |
| Business & Financial | 0 (0.0%) | 22 (100.0%) |
| Computers, Engineering & Science | 0 (0.0%) | 0 (0.0%) |
| Computers & Mathematics | 0 (0.0%) | 0 (0.0%) |
| Architecture & Engineering | 0 (0.0%) | 0 (0.0%) |
| Life, Physical & Social Science | 0 (0.0%) | 0 (0.0%) |
| Community & Social Service | 0 (0.0%) | 21 (100.0%) |
| Education, Arts & Media | 0 (0.0%) | 0 (0.0%) |
| Legal Services & Support | 0 (0.0%) | 0 (0.0%) |
| Education Instruction & Library | 0 (0.0%) | 21 (100.0%) |
| Arts, Media & Entertainment | 0 (0.0%) | 0 (0.0%) |
| Health Diagnosing & Treating | 0 (0.0%) | 14 (100.0%) |
| Health Technologists | 0 (0.0%) | 14 (100.0%) |
| Total (Category) | 25 (30.5%) | 57 (69.5%) |
| Total (Overall) | 425 (41.6%) | 596 (58.4%) |
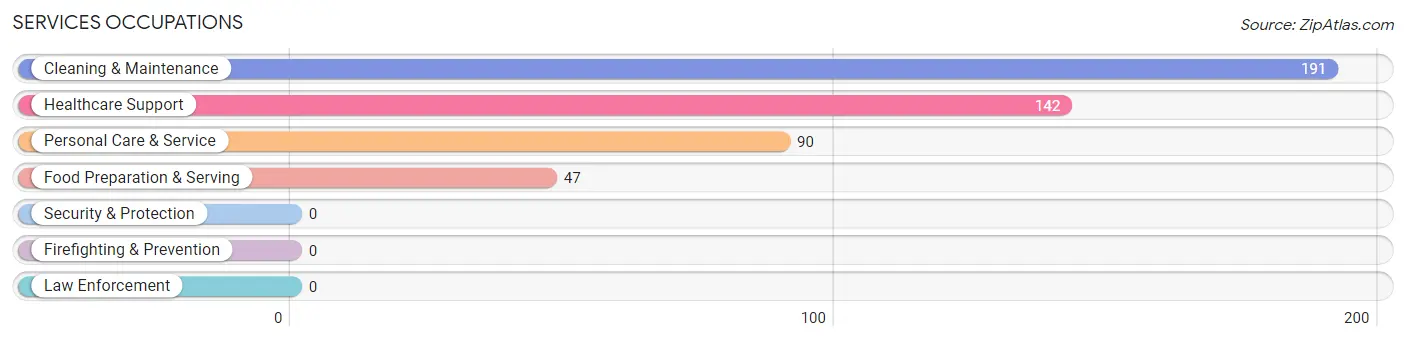
Services Occupations
The most common Services occupations in Bunkie are Cleaning & Maintenance (191 | 18.7%), Healthcare Support (142 | 13.9%), Personal Care & Service (90 | 8.8%), and Food Preparation & Serving (47 | 4.6%).
Services Occupations by Sex
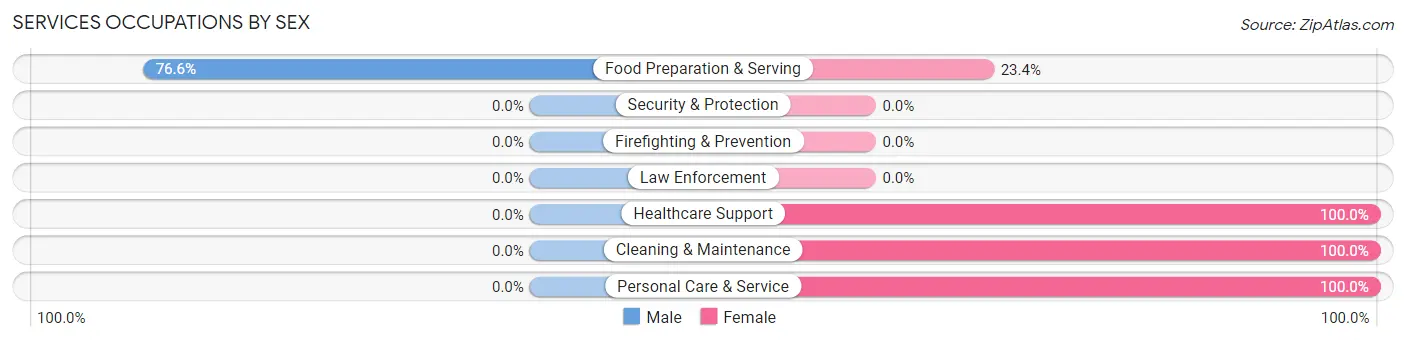
| Occupation | Male | Female |
| Healthcare Support | 0 (0.0%) | 142 (100.0%) |
| Security & Protection | 0 (0.0%) | 0 (0.0%) |
| Firefighting & Prevention | 0 (0.0%) | 0 (0.0%) |
| Law Enforcement | 0 (0.0%) | 0 (0.0%) |
| Food Preparation & Serving | 36 (76.6%) | 11 (23.4%) |
| Cleaning & Maintenance | 0 (0.0%) | 191 (100.0%) |
| Personal Care & Service | 0 (0.0%) | 90 (100.0%) |
| Total (Category) | 36 (7.7%) | 434 (92.3%) |
| Total (Overall) | 425 (41.6%) | 596 (58.4%) |
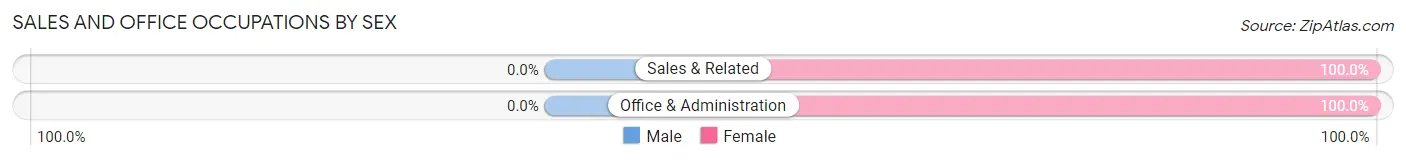
Sales and Office Occupations
The most common Sales and Office occupations in Bunkie are Sales & Related (80 | 7.8%), and Office & Administration (21 | 2.1%).
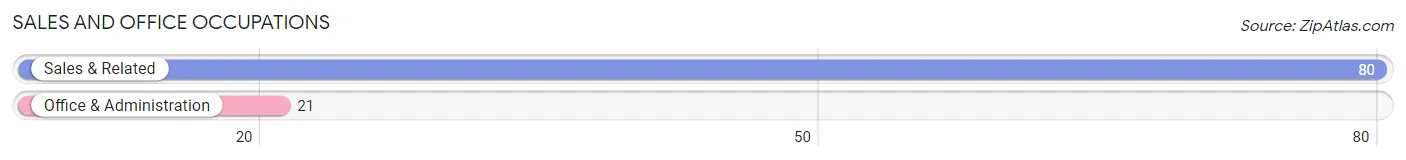
Sales and Office Occupations by Sex
| Occupation | Male | Female |
| Sales & Related | 0 (0.0%) | 80 (100.0%) |
| Office & Administration | 0 (0.0%) | 21 (100.0%) |
| Total (Category) | 0 (0.0%) | 101 (100.0%) |
| Total (Overall) | 425 (41.6%) | 596 (58.4%) |
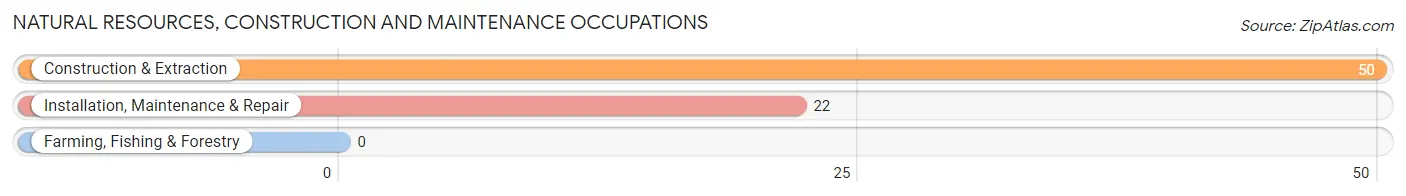
Natural Resources, Construction and Maintenance Occupations
The most common Natural Resources, Construction and Maintenance occupations in Bunkie are Construction & Extraction (50 | 4.9%), and Installation, Maintenance & Repair (22 | 2.1%).
Natural Resources, Construction and Maintenance Occupations by Sex
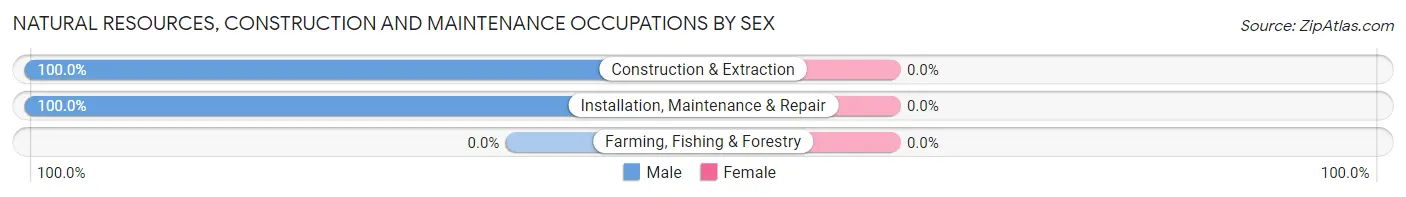
| Occupation | Male | Female |
| Farming, Fishing & Forestry | 0 (0.0%) | 0 (0.0%) |
| Construction & Extraction | 50 (100.0%) | 0 (0.0%) |
| Installation, Maintenance & Repair | 22 (100.0%) | 0 (0.0%) |
| Total (Category) | 72 (100.0%) | 0 (0.0%) |
| Total (Overall) | 425 (41.6%) | 596 (58.4%) |
Production, Transportation and Moving Occupations
The most common Production, Transportation and Moving occupations in Bunkie are Production (190 | 18.6%), Material Moving (66 | 6.5%), and Transportation (40 | 3.9%).
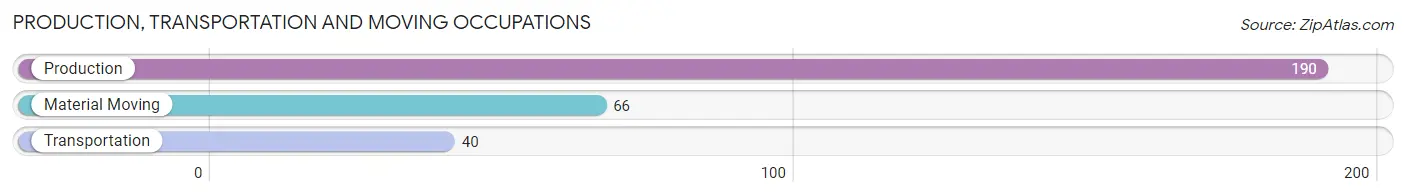
Production, Transportation and Moving Occupations by Sex
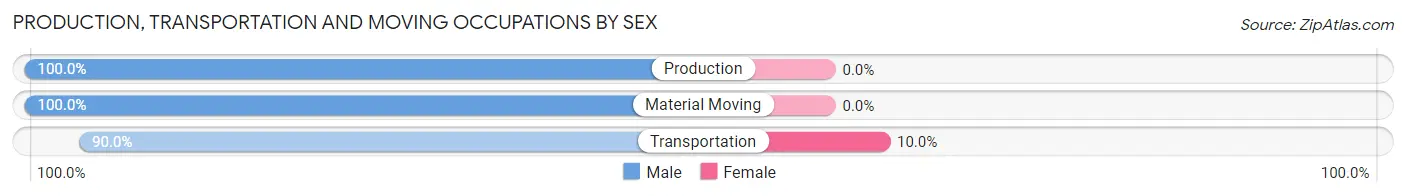
| Occupation | Male | Female |
| Production | 190 (100.0%) | 0 (0.0%) |
| Transportation | 36 (90.0%) | 4 (10.0%) |
| Material Moving | 66 (100.0%) | 0 (0.0%) |
| Total (Category) | 292 (98.7%) | 4 (1.3%) |
| Total (Overall) | 425 (41.6%) | 596 (58.4%) |
Employment Industries by Sex in Bunkie
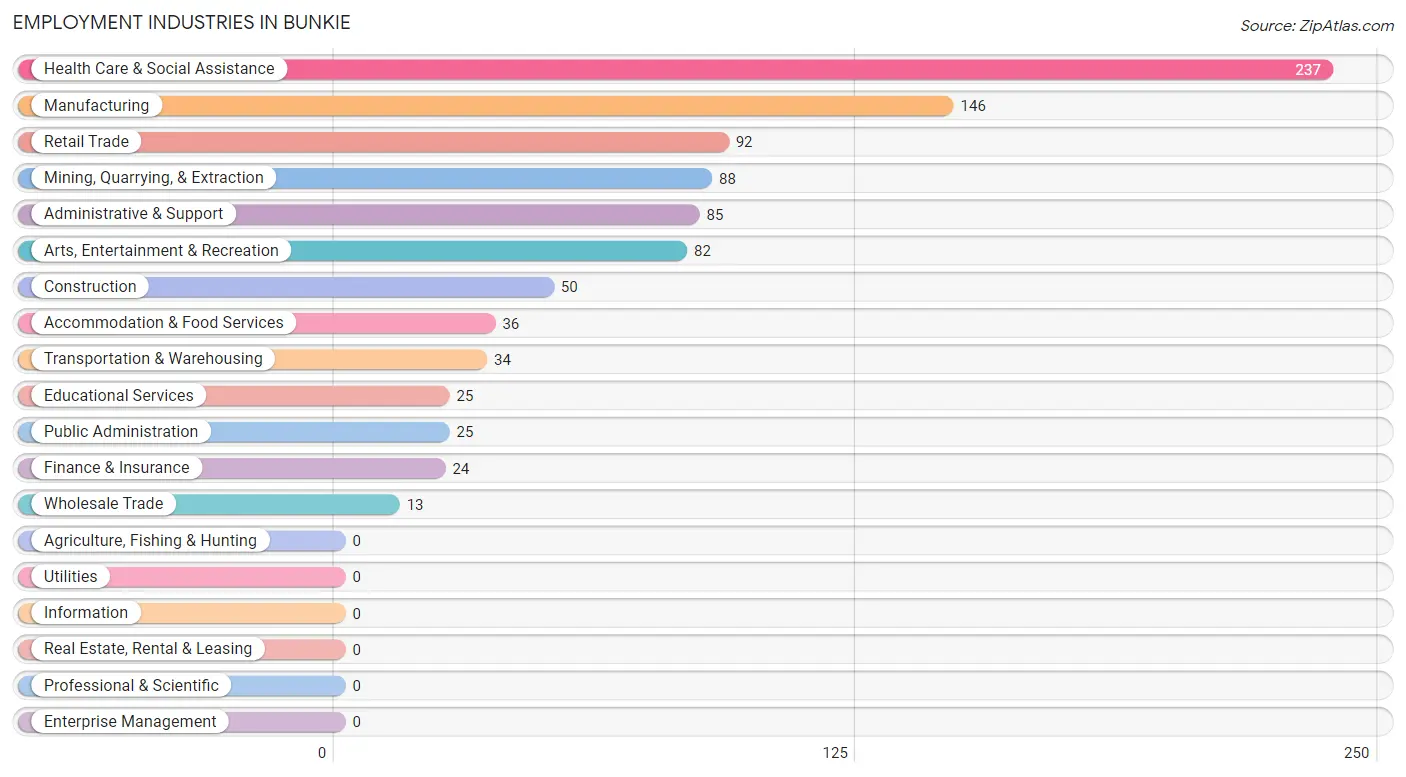
Employment Industries in Bunkie
The major employment industries in Bunkie include Health Care & Social Assistance (237 | 23.2%), Manufacturing (146 | 14.3%), Retail Trade (92 | 9.0%), Mining, Quarrying, & Extraction (88 | 8.6%), and Administrative & Support (85 | 8.3%).
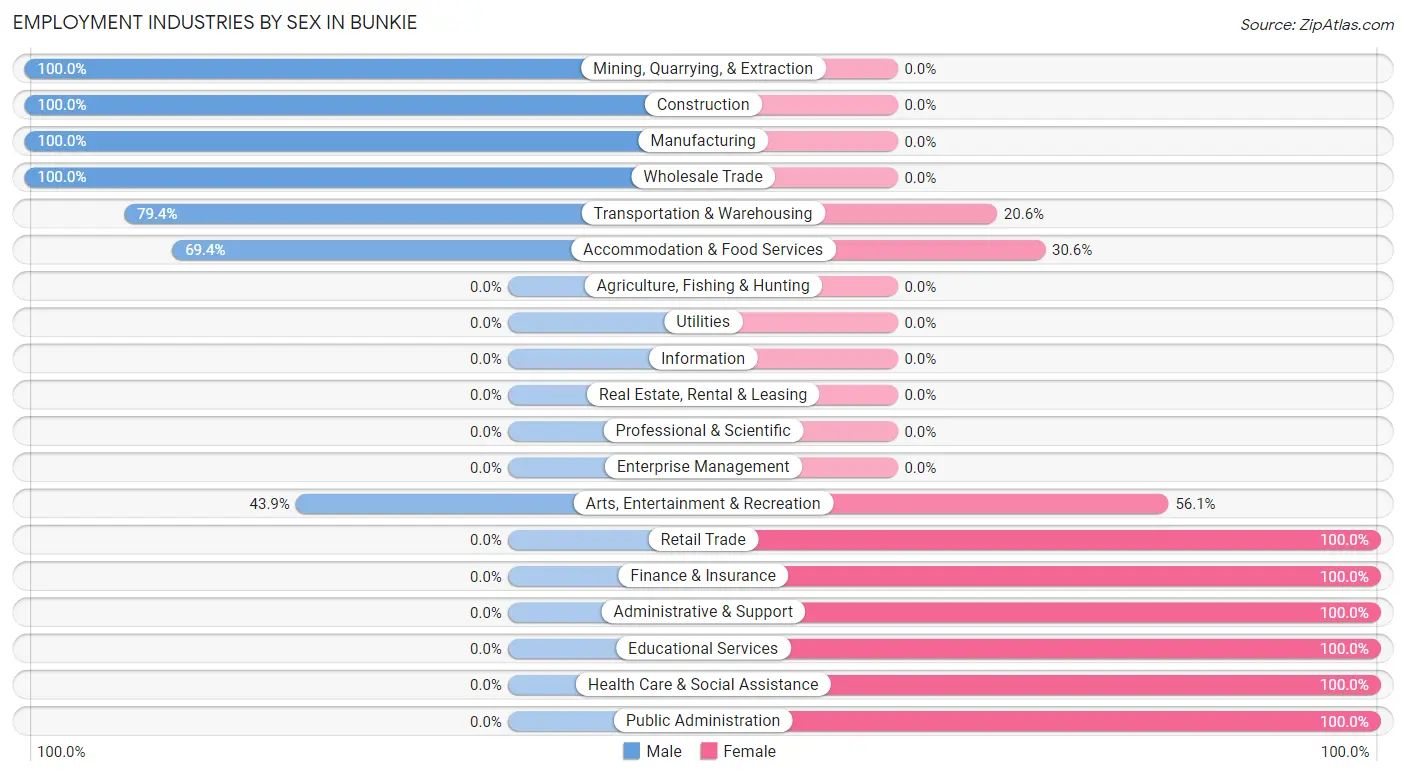
Employment Industries by Sex in Bunkie
The Bunkie industries that see more men than women are Mining, Quarrying, & Extraction (100.0%), Construction (100.0%), and Manufacturing (100.0%), whereas the industries that tend to have a higher number of women are Retail Trade (100.0%), Finance & Insurance (100.0%), and Administrative & Support (100.0%).
| Industry | Male | Female |
| Agriculture, Fishing & Hunting | 0 (0.0%) | 0 (0.0%) |
| Mining, Quarrying, & Extraction | 88 (100.0%) | 0 (0.0%) |
| Construction | 50 (100.0%) | 0 (0.0%) |
| Manufacturing | 146 (100.0%) | 0 (0.0%) |
| Wholesale Trade | 13 (100.0%) | 0 (0.0%) |
| Retail Trade | 0 (0.0%) | 92 (100.0%) |
| Transportation & Warehousing | 27 (79.4%) | 7 (20.6%) |
| Utilities | 0 (0.0%) | 0 (0.0%) |
| Information | 0 (0.0%) | 0 (0.0%) |
| Finance & Insurance | 0 (0.0%) | 24 (100.0%) |
| Real Estate, Rental & Leasing | 0 (0.0%) | 0 (0.0%) |
| Professional & Scientific | 0 (0.0%) | 0 (0.0%) |
| Enterprise Management | 0 (0.0%) | 0 (0.0%) |
| Administrative & Support | 0 (0.0%) | 85 (100.0%) |
| Educational Services | 0 (0.0%) | 25 (100.0%) |
| Health Care & Social Assistance | 0 (0.0%) | 237 (100.0%) |
| Arts, Entertainment & Recreation | 36 (43.9%) | 46 (56.1%) |
| Accommodation & Food Services | 25 (69.4%) | 11 (30.6%) |
| Public Administration | 0 (0.0%) | 25 (100.0%) |
| Total | 425 (41.6%) | 596 (58.4%) |
Education in Bunkie
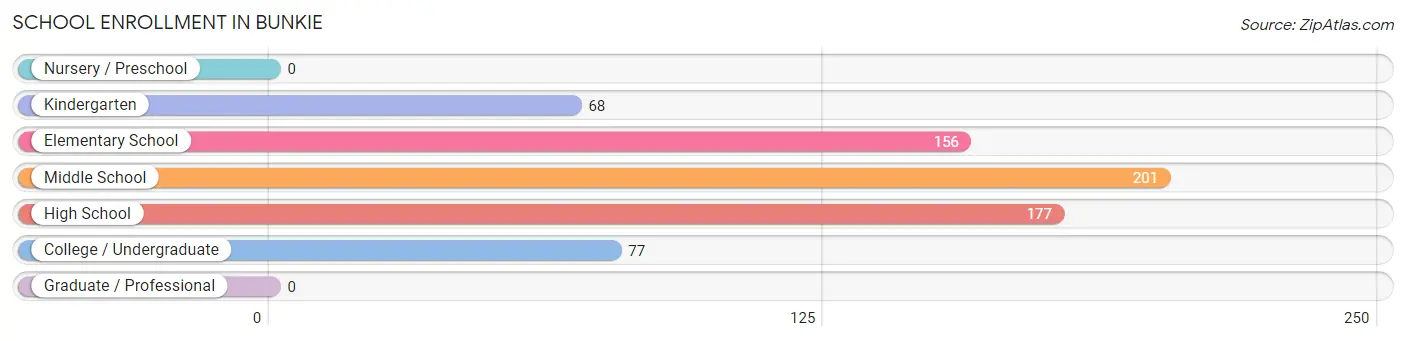
School Enrollment in Bunkie
The most common levels of schooling among the 679 students in Bunkie are middle school (201 | 29.6%), high school (177 | 26.1%), and elementary school (156 | 23.0%).
| School Level | # Students | % Students |
| Nursery / Preschool | 0 | 0.0% |
| Kindergarten | 68 | 10.0% |
| Elementary School | 156 | 23.0% |
| Middle School | 201 | 29.6% |
| High School | 177 | 26.1% |
| College / Undergraduate | 77 | 11.3% |
| Graduate / Professional | 0 | 0.0% |
| Total | 679 | 100.0% |
School Enrollment by Age by Funding Source in Bunkie
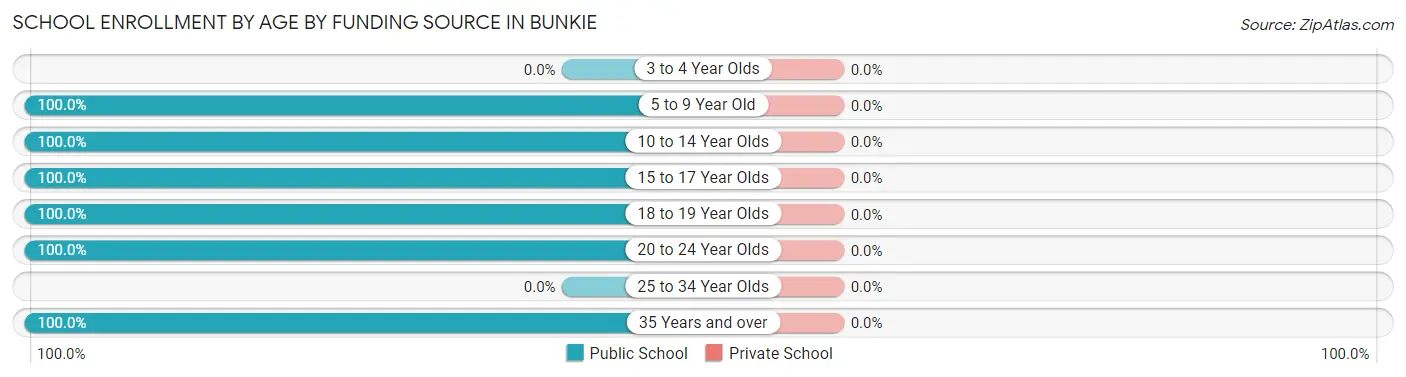
| Age Bracket | Public School | Private School |
| 3 to 4 Year Olds | 0 (0.0%) | 0 (0.0%) |
| 5 to 9 Year Old | 183 (100.0%) | 0 (0.0%) |
| 10 to 14 Year Olds | 313 (100.0%) | 0 (0.0%) |
| 15 to 17 Year Olds | 90 (100.0%) | 0 (0.0%) |
| 18 to 19 Year Olds | 16 (100.0%) | 0 (0.0%) |
| 20 to 24 Year Olds | 71 (100.0%) | 0 (0.0%) |
| 25 to 34 Year Olds | 0 (0.0%) | 0 (0.0%) |
| 35 Years and over | 6 (100.0%) | 0 (0.0%) |
| Total | 679 (100.0%) | 0 (0.0%) |
Educational Attainment by Field of Study in Bunkie
Education (137 | 50.9%), science & technology (57 | 21.2%), business (43 | 16.0%), literature & languages (16 | 5.9%), and communications (16 | 5.9%) are the most common fields of study among 269 individuals in Bunkie who have obtained a bachelor's degree or higher.
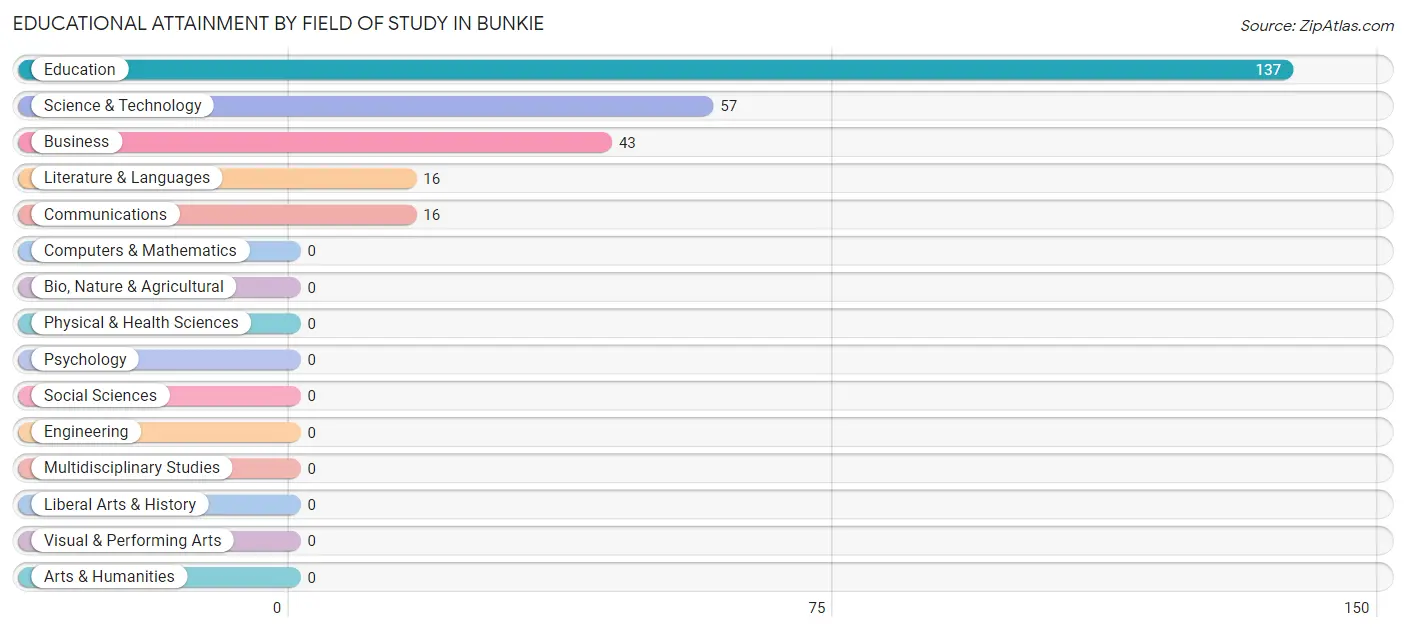
| Field of Study | # Graduates | % Graduates |
| Computers & Mathematics | 0 | 0.0% |
| Bio, Nature & Agricultural | 0 | 0.0% |
| Physical & Health Sciences | 0 | 0.0% |
| Psychology | 0 | 0.0% |
| Social Sciences | 0 | 0.0% |
| Engineering | 0 | 0.0% |
| Multidisciplinary Studies | 0 | 0.0% |
| Science & Technology | 57 | 21.2% |
| Business | 43 | 16.0% |
| Education | 137 | 50.9% |
| Literature & Languages | 16 | 5.9% |
| Liberal Arts & History | 0 | 0.0% |
| Visual & Performing Arts | 0 | 0.0% |
| Communications | 16 | 5.9% |
| Arts & Humanities | 0 | 0.0% |
| Total | 269 | 100.0% |
Transportation & Commute in Bunkie
Vehicle Availability by Sex in Bunkie
The most prevalent vehicle ownership categories in Bunkie are males with 1 vehicle (203, accounting for 51.4%) and females with 1 vehicle (292, making up 34.1%).
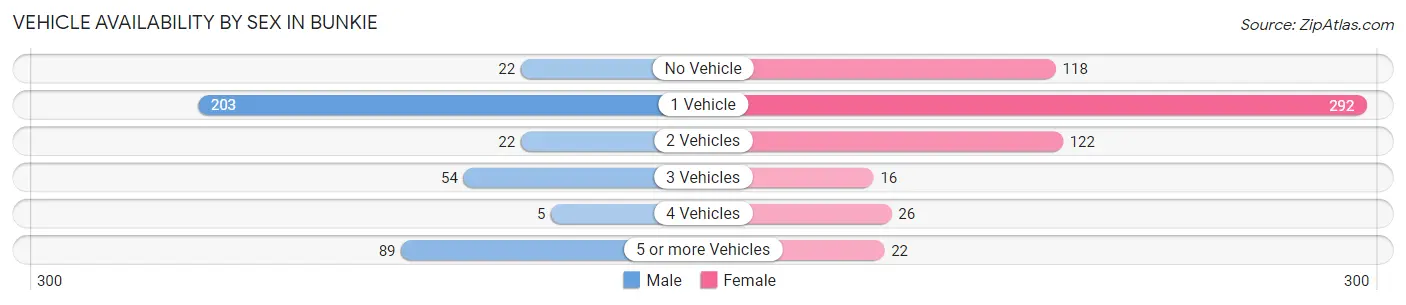
| Vehicles Available | Male | Female |
| No Vehicle | 22 (5.6%) | 118 (19.8%) |
| 1 Vehicle | 203 (51.4%) | 292 (49.0%) |
| 2 Vehicles | 22 (5.6%) | 122 (20.5%) |
| 3 Vehicles | 54 (13.7%) | 16 (2.7%) |
| 4 Vehicles | 5 (1.3%) | 26 (4.4%) |
| 5 or more Vehicles | 89 (22.5%) | 22 (3.7%) |
| Total | 395 (100.0%) | 596 (100.0%) |
Commute Time in Bunkie
The most frequently occuring commute durations in Bunkie are 15 to 19 minutes (250 commuters, 26.5%), 10 to 14 minutes (154 commuters, 16.3%), and 30 to 34 minutes (129 commuters, 13.7%).
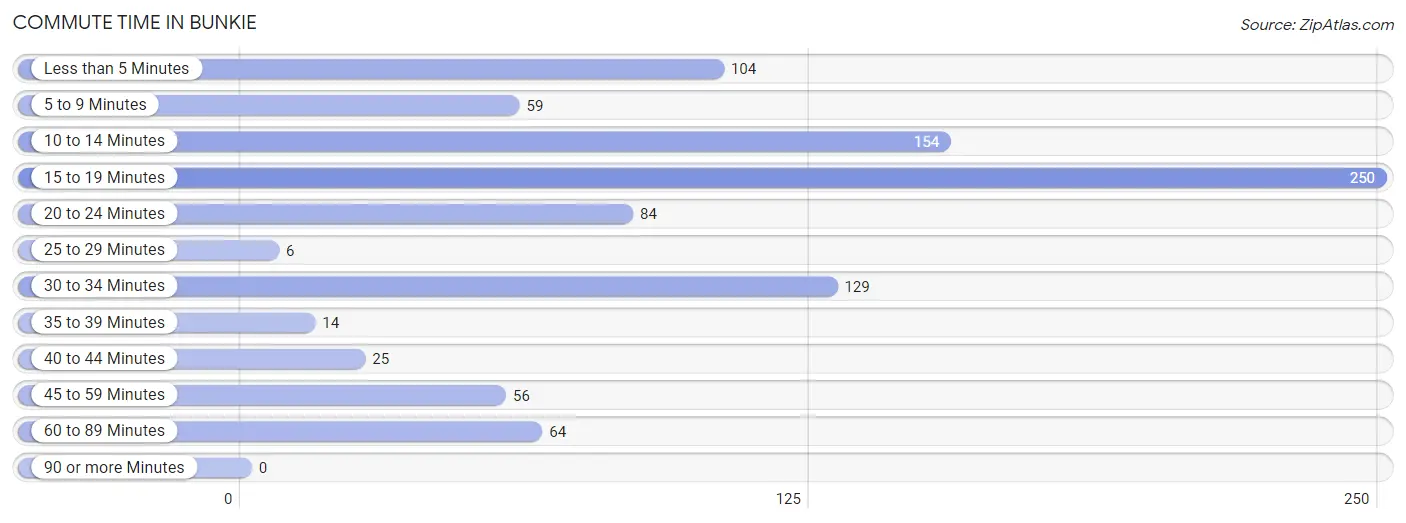
| Commute Time | # Commuters | % Commuters |
| Less than 5 Minutes | 104 | 11.0% |
| 5 to 9 Minutes | 59 | 6.2% |
| 10 to 14 Minutes | 154 | 16.3% |
| 15 to 19 Minutes | 250 | 26.5% |
| 20 to 24 Minutes | 84 | 8.9% |
| 25 to 29 Minutes | 6 | 0.6% |
| 30 to 34 Minutes | 129 | 13.7% |
| 35 to 39 Minutes | 14 | 1.5% |
| 40 to 44 Minutes | 25 | 2.6% |
| 45 to 59 Minutes | 56 | 5.9% |
| 60 to 89 Minutes | 64 | 6.8% |
| 90 or more Minutes | 0 | 0.0% |
Commute Time by Sex in Bunkie
The most common commute times in Bunkie are 15 to 19 minutes (128 commuters, 32.4%) for males and 10 to 14 minutes (129 commuters, 23.4%) for females.
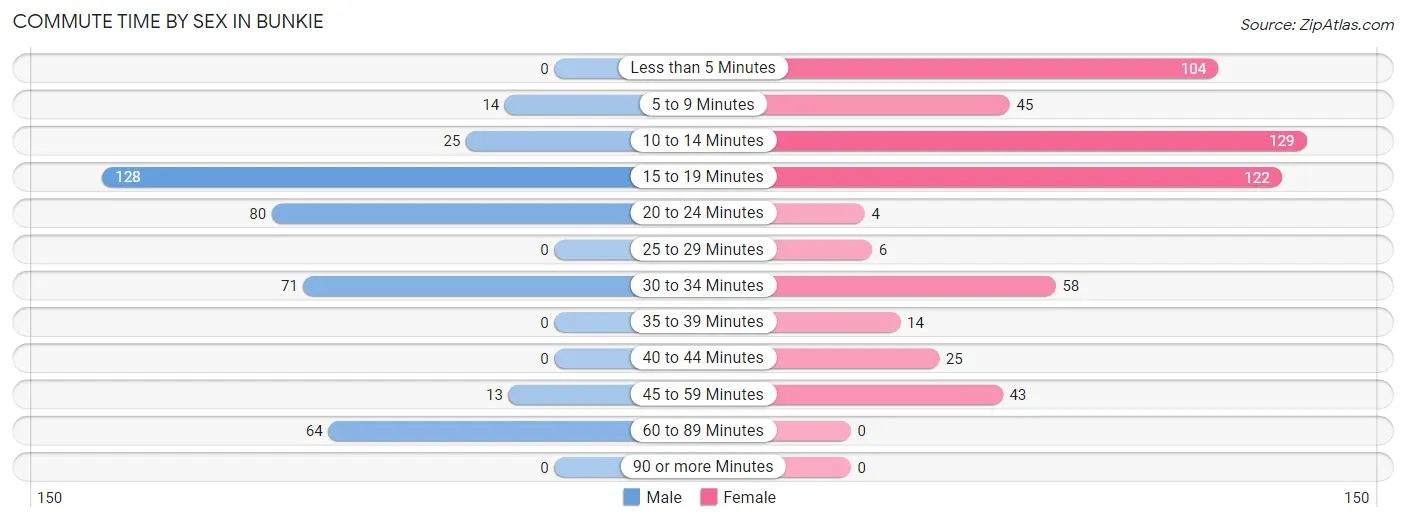
| Commute Time | Male | Female |
| Less than 5 Minutes | 0 (0.0%) | 104 (18.9%) |
| 5 to 9 Minutes | 14 (3.5%) | 45 (8.2%) |
| 10 to 14 Minutes | 25 (6.3%) | 129 (23.4%) |
| 15 to 19 Minutes | 128 (32.4%) | 122 (22.2%) |
| 20 to 24 Minutes | 80 (20.3%) | 4 (0.7%) |
| 25 to 29 Minutes | 0 (0.0%) | 6 (1.1%) |
| 30 to 34 Minutes | 71 (18.0%) | 58 (10.5%) |
| 35 to 39 Minutes | 0 (0.0%) | 14 (2.5%) |
| 40 to 44 Minutes | 0 (0.0%) | 25 (4.5%) |
| 45 to 59 Minutes | 13 (3.3%) | 43 (7.8%) |
| 60 to 89 Minutes | 64 (16.2%) | 0 (0.0%) |
| 90 or more Minutes | 0 (0.0%) | 0 (0.0%) |
Time of Departure to Work by Sex in Bunkie
The most frequent times of departure to work in Bunkie are 5:00 AM to 5:29 AM (161, 40.8%) for males and 6:00 AM to 6:29 AM (129, 23.4%) for females.
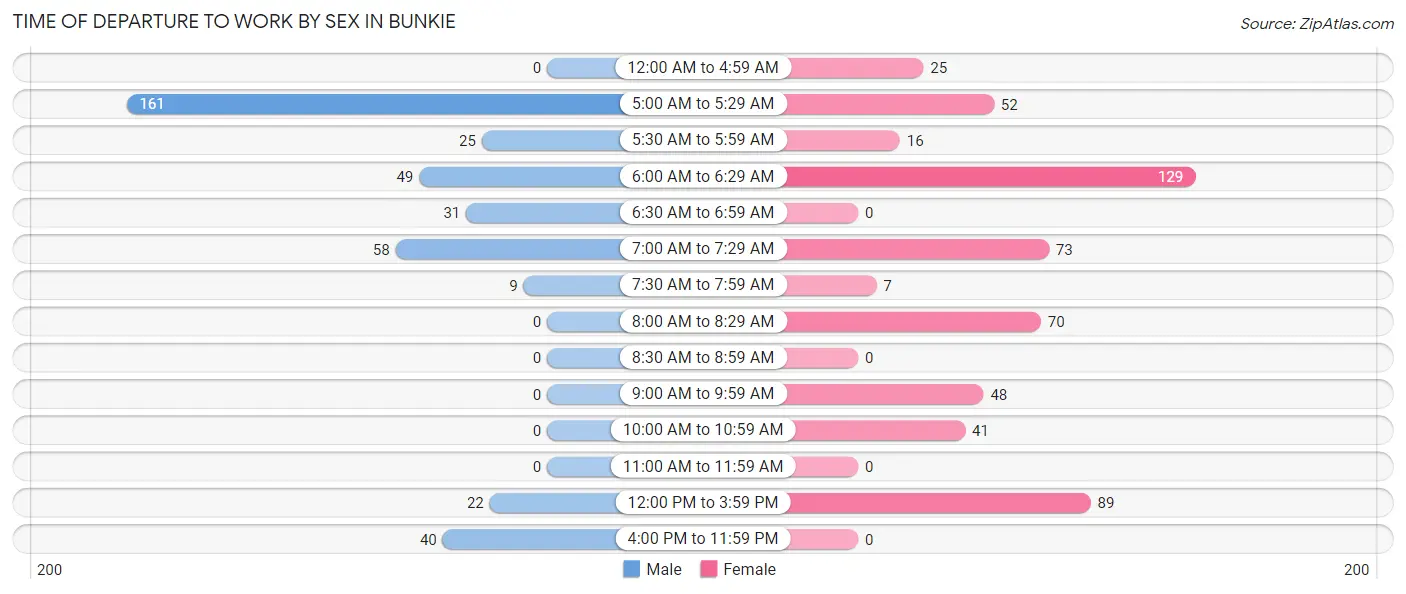
| Time of Departure | Male | Female |
| 12:00 AM to 4:59 AM | 0 (0.0%) | 25 (4.5%) |
| 5:00 AM to 5:29 AM | 161 (40.8%) | 52 (9.5%) |
| 5:30 AM to 5:59 AM | 25 (6.3%) | 16 (2.9%) |
| 6:00 AM to 6:29 AM | 49 (12.4%) | 129 (23.4%) |
| 6:30 AM to 6:59 AM | 31 (7.9%) | 0 (0.0%) |
| 7:00 AM to 7:29 AM | 58 (14.7%) | 73 (13.3%) |
| 7:30 AM to 7:59 AM | 9 (2.3%) | 7 (1.3%) |
| 8:00 AM to 8:29 AM | 0 (0.0%) | 70 (12.7%) |
| 8:30 AM to 8:59 AM | 0 (0.0%) | 0 (0.0%) |
| 9:00 AM to 9:59 AM | 0 (0.0%) | 48 (8.7%) |
| 10:00 AM to 10:59 AM | 0 (0.0%) | 41 (7.4%) |
| 11:00 AM to 11:59 AM | 0 (0.0%) | 0 (0.0%) |
| 12:00 PM to 3:59 PM | 22 (5.6%) | 89 (16.2%) |
| 4:00 PM to 11:59 PM | 40 (10.1%) | 0 (0.0%) |
| Total | 395 (100.0%) | 550 (100.0%) |
Housing Occupancy in Bunkie
Occupancy by Ownership in Bunkie
Of the total 1,563 dwellings in Bunkie, owner-occupied units account for 892 (57.1%), while renter-occupied units make up 671 (42.9%).
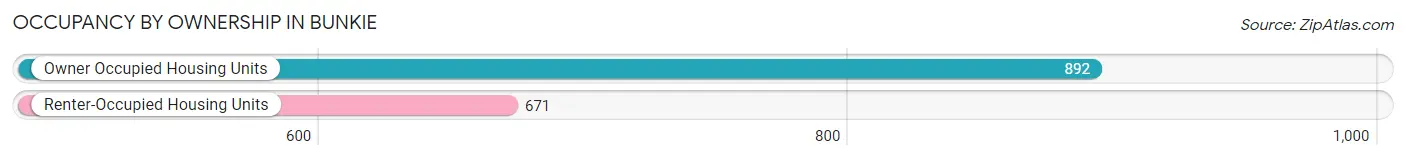
| Occupancy | # Housing Units | % Housing Units |
| Owner Occupied Housing Units | 892 | 57.1% |
| Renter-Occupied Housing Units | 671 | 42.9% |
| Total Occupied Housing Units | 1,563 | 100.0% |
Occupancy by Household Size in Bunkie
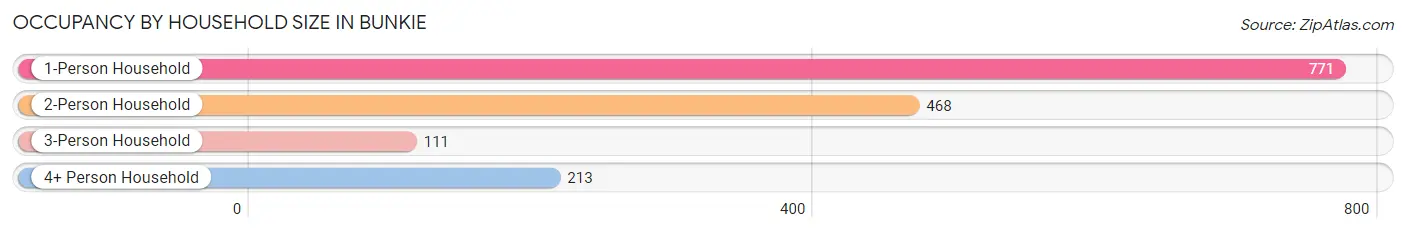
| Household Size | # Housing Units | % Housing Units |
| 1-Person Household | 771 | 49.3% |
| 2-Person Household | 468 | 29.9% |
| 3-Person Household | 111 | 7.1% |
| 4+ Person Household | 213 | 13.6% |
| Total Housing Units | 1,563 | 100.0% |
Occupancy by Ownership by Household Size in Bunkie
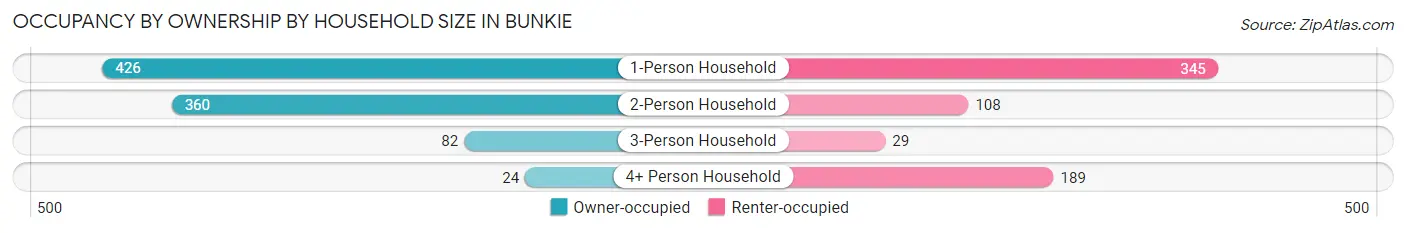
| Household Size | Owner-occupied | Renter-occupied |
| 1-Person Household | 426 (55.2%) | 345 (44.8%) |
| 2-Person Household | 360 (76.9%) | 108 (23.1%) |
| 3-Person Household | 82 (73.9%) | 29 (26.1%) |
| 4+ Person Household | 24 (11.3%) | 189 (88.7%) |
| Total Housing Units | 892 (57.1%) | 671 (42.9%) |
Occupancy by Educational Attainment in Bunkie
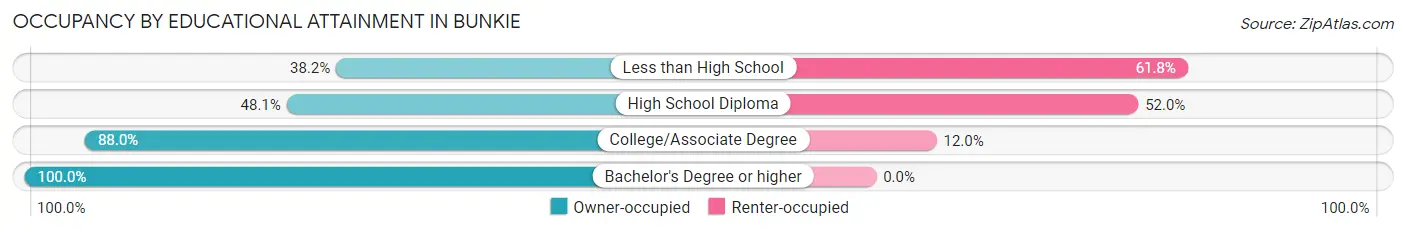
| Household Size | Owner-occupied | Renter-occupied |
| Less than High School | 174 (38.2%) | 281 (61.8%) |
| High School Diploma | 332 (48.0%) | 359 (51.9%) |
| College/Associate Degree | 228 (88.0%) | 31 (12.0%) |
| Bachelor's Degree or higher | 158 (100.0%) | 0 (0.0%) |
Occupancy by Age of Householder in Bunkie
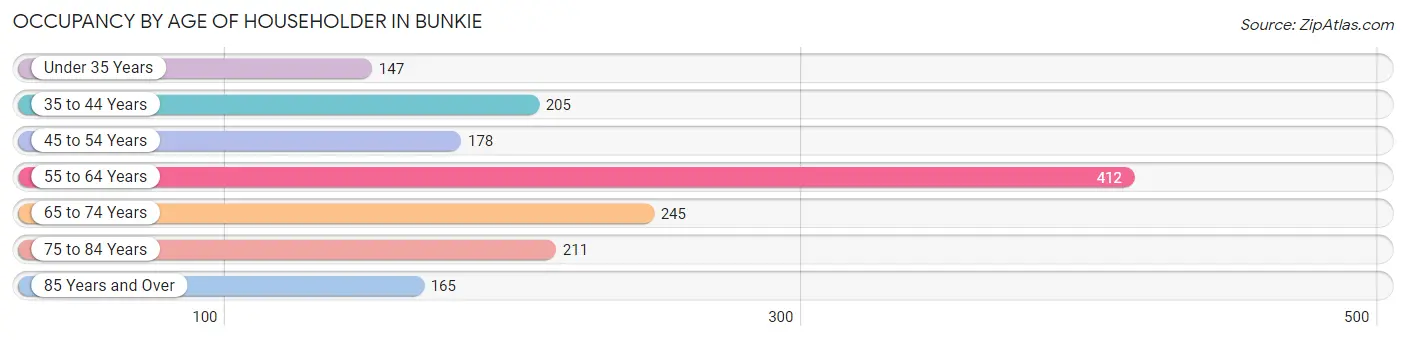
| Age Bracket | # Households | % Households |
| Under 35 Years | 147 | 9.4% |
| 35 to 44 Years | 205 | 13.1% |
| 45 to 54 Years | 178 | 11.4% |
| 55 to 64 Years | 412 | 26.4% |
| 65 to 74 Years | 245 | 15.7% |
| 75 to 84 Years | 211 | 13.5% |
| 85 Years and Over | 165 | 10.6% |
| Total | 1,563 | 100.0% |
Housing Finances in Bunkie
Median Income by Occupancy in Bunkie
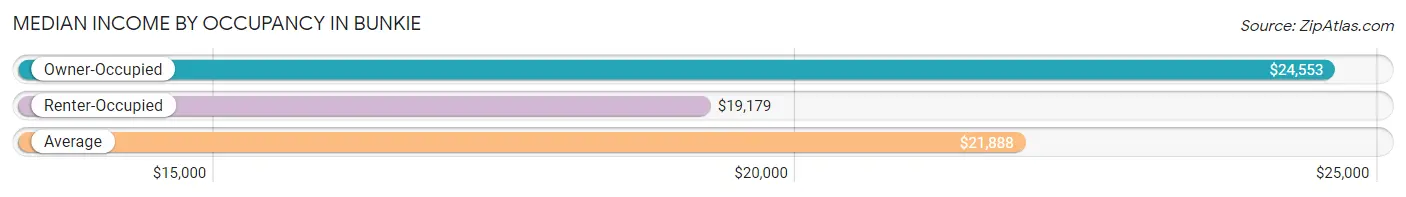
| Occupancy Type | # Households | Median Income |
| Owner-Occupied | 892 (57.1%) | $24,553 |
| Renter-Occupied | 671 (42.9%) | $19,179 |
| Average | 1,563 (100.0%) | $21,888 |
Occupancy by Householder Income Bracket in Bunkie
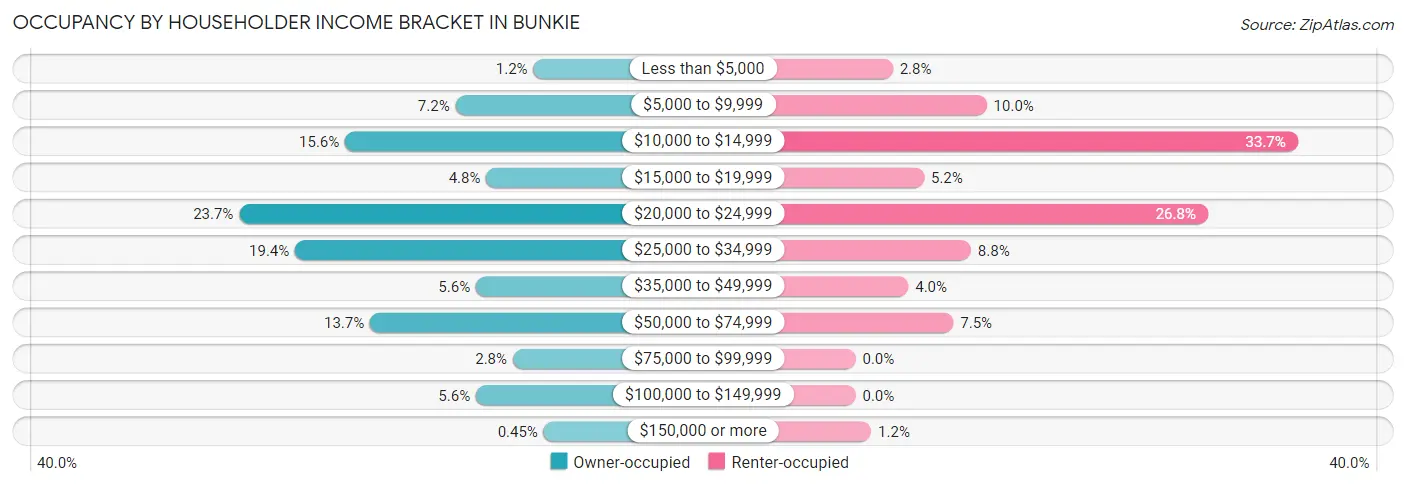
| Income Bracket | Owner-occupied | Renter-occupied |
| Less than $5,000 | 11 (1.2%) | 19 (2.8%) |
| $5,000 to $9,999 | 64 (7.2%) | 67 (10.0%) |
| $10,000 to $14,999 | 139 (15.6%) | 226 (33.7%) |
| $15,000 to $19,999 | 43 (4.8%) | 35 (5.2%) |
| $20,000 to $24,999 | 211 (23.6%) | 180 (26.8%) |
| $25,000 to $34,999 | 173 (19.4%) | 59 (8.8%) |
| $35,000 to $49,999 | 50 (5.6%) | 27 (4.0%) |
| $50,000 to $74,999 | 122 (13.7%) | 50 (7.4%) |
| $75,000 to $99,999 | 25 (2.8%) | 0 (0.0%) |
| $100,000 to $149,999 | 50 (5.6%) | 0 (0.0%) |
| $150,000 or more | 4 (0.4%) | 8 (1.2%) |
| Total | 892 (100.0%) | 671 (100.0%) |
Monthly Housing Cost Tiers in Bunkie
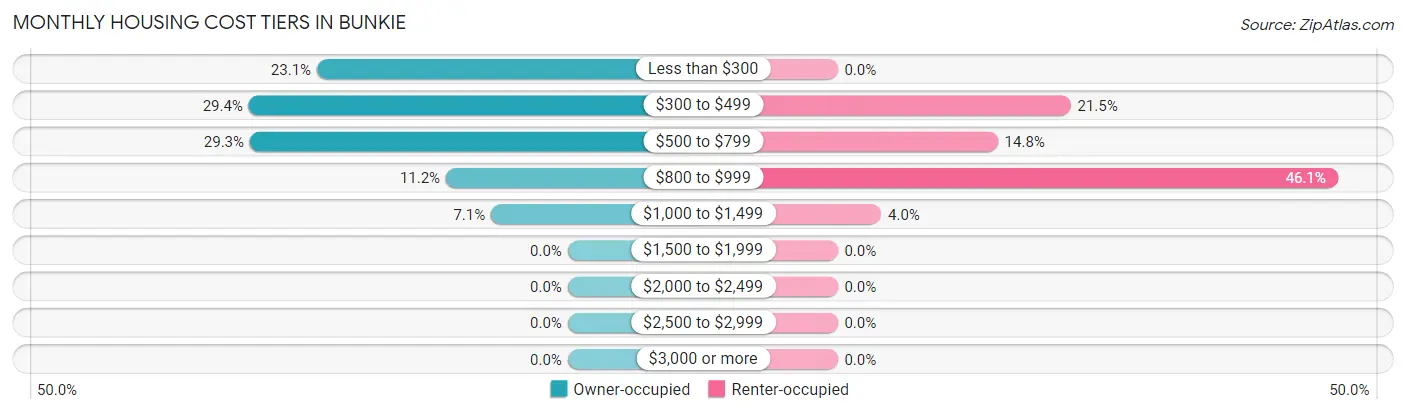
| Monthly Cost | Owner-occupied | Renter-occupied |
| Less than $300 | 206 (23.1%) | 0 (0.0%) |
| $300 to $499 | 262 (29.4%) | 144 (21.5%) |
| $500 to $799 | 261 (29.3%) | 99 (14.7%) |
| $800 to $999 | 100 (11.2%) | 309 (46.1%) |
| $1,000 to $1,499 | 63 (7.1%) | 27 (4.0%) |
| $1,500 to $1,999 | 0 (0.0%) | 0 (0.0%) |
| $2,000 to $2,499 | 0 (0.0%) | 0 (0.0%) |
| $2,500 to $2,999 | 0 (0.0%) | 0 (0.0%) |
| $3,000 or more | 0 (0.0%) | 0 (0.0%) |
| Total | 892 (100.0%) | 671 (100.0%) |
Physical Housing Characteristics in Bunkie
Housing Structures in Bunkie
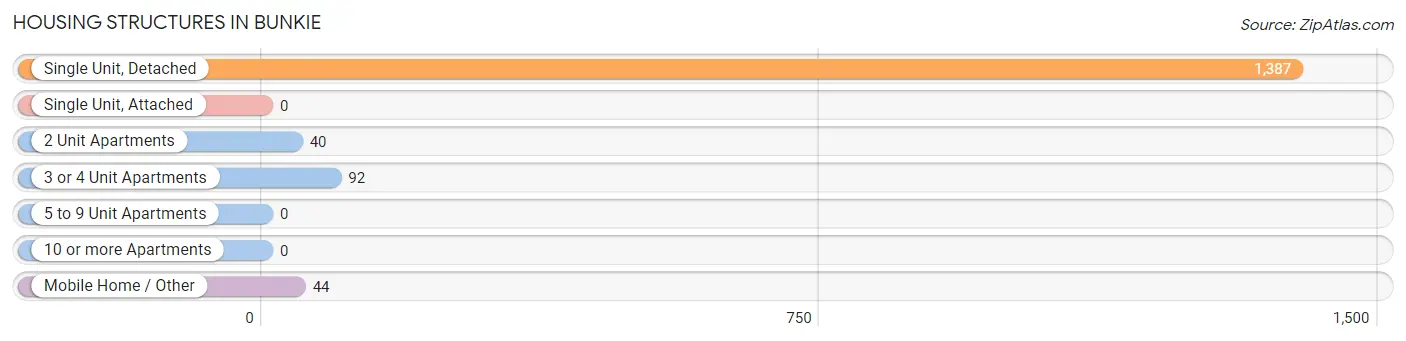
| Structure Type | # Housing Units | % Housing Units |
| Single Unit, Detached | 1,387 | 88.7% |
| Single Unit, Attached | 0 | 0.0% |
| 2 Unit Apartments | 40 | 2.6% |
| 3 or 4 Unit Apartments | 92 | 5.9% |
| 5 to 9 Unit Apartments | 0 | 0.0% |
| 10 or more Apartments | 0 | 0.0% |
| Mobile Home / Other | 44 | 2.8% |
| Total | 1,563 | 100.0% |
Housing Structures by Occupancy in Bunkie
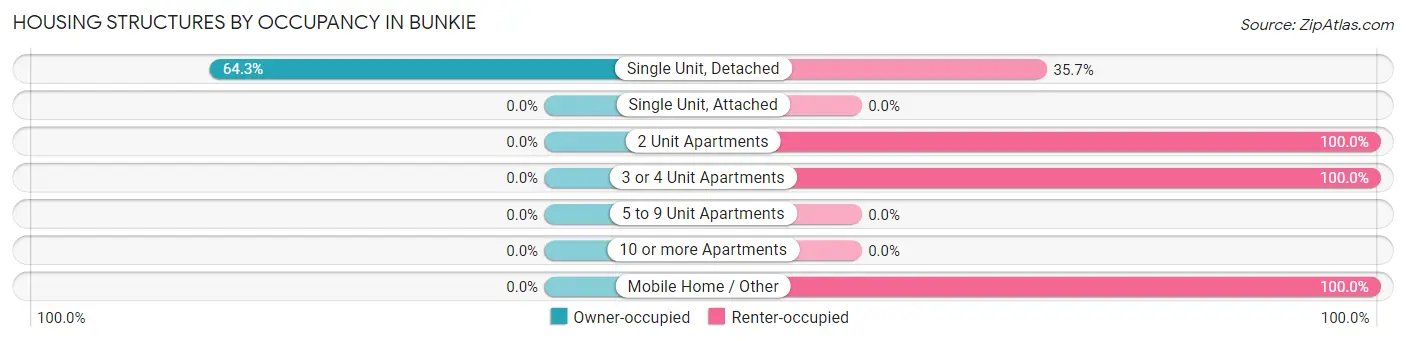
| Structure Type | Owner-occupied | Renter-occupied |
| Single Unit, Detached | 892 (64.3%) | 495 (35.7%) |
| Single Unit, Attached | 0 (0.0%) | 0 (0.0%) |
| 2 Unit Apartments | 0 (0.0%) | 40 (100.0%) |
| 3 or 4 Unit Apartments | 0 (0.0%) | 92 (100.0%) |
| 5 to 9 Unit Apartments | 0 (0.0%) | 0 (0.0%) |
| 10 or more Apartments | 0 (0.0%) | 0 (0.0%) |
| Mobile Home / Other | 0 (0.0%) | 44 (100.0%) |
| Total | 892 (57.1%) | 671 (42.9%) |
Housing Structures by Number of Rooms in Bunkie
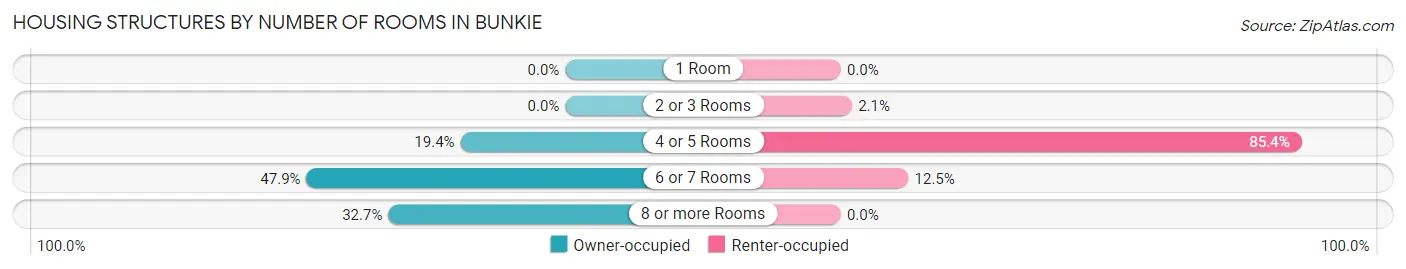
| Number of Rooms | Owner-occupied | Renter-occupied |
| 1 Room | 0 (0.0%) | 0 (0.0%) |
| 2 or 3 Rooms | 0 (0.0%) | 14 (2.1%) |
| 4 or 5 Rooms | 173 (19.4%) | 573 (85.4%) |
| 6 or 7 Rooms | 427 (47.9%) | 84 (12.5%) |
| 8 or more Rooms | 292 (32.7%) | 0 (0.0%) |
| Total | 892 (100.0%) | 671 (100.0%) |
Housing Structure by Heating Type in Bunkie
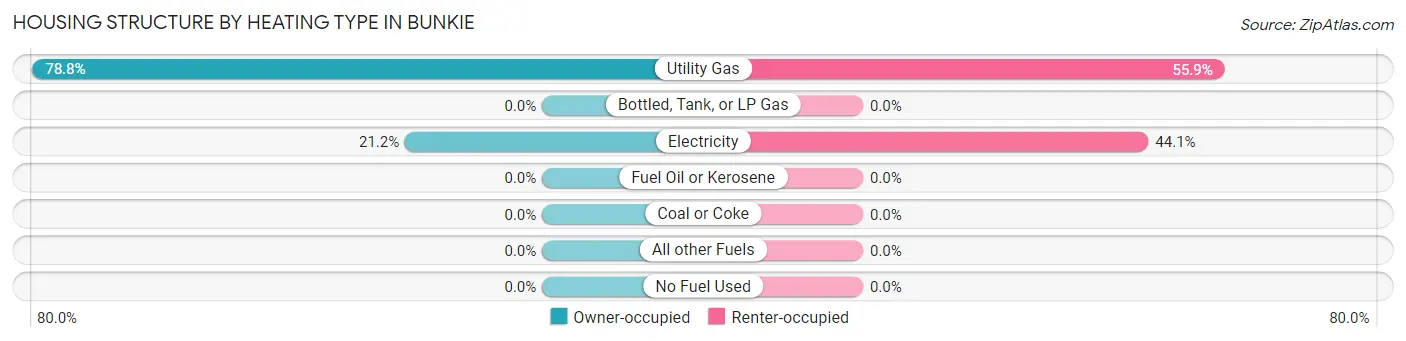
| Heating Type | Owner-occupied | Renter-occupied |
| Utility Gas | 703 (78.8%) | 375 (55.9%) |
| Bottled, Tank, or LP Gas | 0 (0.0%) | 0 (0.0%) |
| Electricity | 189 (21.2%) | 296 (44.1%) |
| Fuel Oil or Kerosene | 0 (0.0%) | 0 (0.0%) |
| Coal or Coke | 0 (0.0%) | 0 (0.0%) |
| All other Fuels | 0 (0.0%) | 0 (0.0%) |
| No Fuel Used | 0 (0.0%) | 0 (0.0%) |
| Total | 892 (100.0%) | 671 (100.0%) |
Household Vehicle Usage in Bunkie
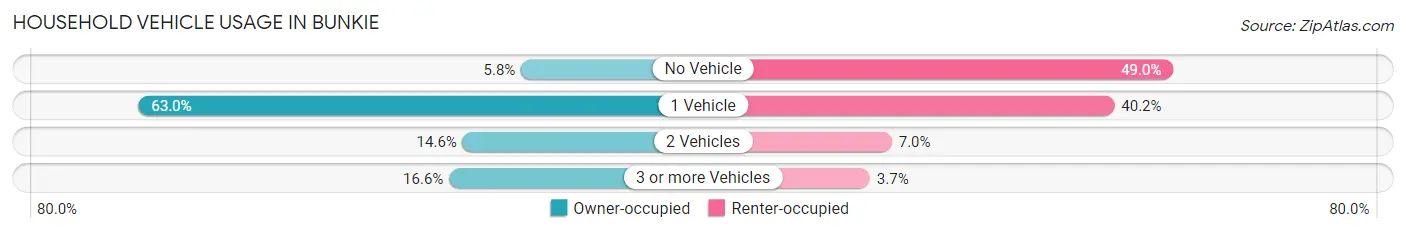
| Vehicles per Household | Owner-occupied | Renter-occupied |
| No Vehicle | 52 (5.8%) | 329 (49.0%) |
| 1 Vehicle | 562 (63.0%) | 270 (40.2%) |
| 2 Vehicles | 130 (14.6%) | 47 (7.0%) |
| 3 or more Vehicles | 148 (16.6%) | 25 (3.7%) |
| Total | 892 (100.0%) | 671 (100.0%) |
Real Estate & Mortgages in Bunkie
Real Estate and Mortgage Overview in Bunkie
| Characteristic | Without Mortgage | With Mortgage |
| Housing Units | 548 | 344 |
| Median Property Value | $83,700 | $99,600 |
| Median Household Income | $24,144 | $4 |
| Monthly Housing Costs | $356 | $0 |
| Real Estate Taxes | $199 | $53 |
Property Value by Mortgage Status in Bunkie
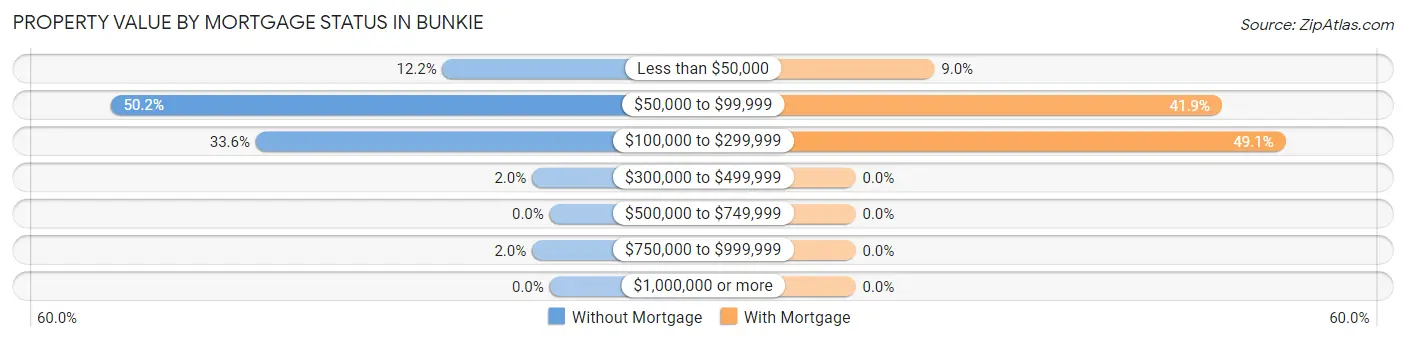
| Property Value | Without Mortgage | With Mortgage |
| Less than $50,000 | 67 (12.2%) | 31 (9.0%) |
| $50,000 to $99,999 | 275 (50.2%) | 144 (41.9%) |
| $100,000 to $299,999 | 184 (33.6%) | 169 (49.1%) |
| $300,000 to $499,999 | 11 (2.0%) | 0 (0.0%) |
| $500,000 to $749,999 | 0 (0.0%) | 0 (0.0%) |
| $750,000 to $999,999 | 11 (2.0%) | 0 (0.0%) |
| $1,000,000 or more | 0 (0.0%) | 0 (0.0%) |
| Total | 548 (100.0%) | 344 (100.0%) |
Household Income by Mortgage Status in Bunkie
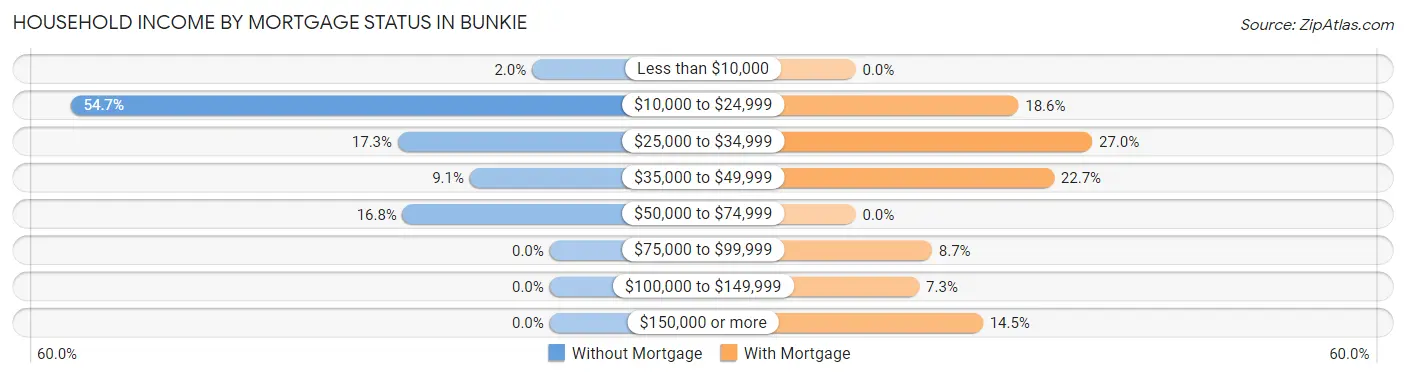
| Household Income | Without Mortgage | With Mortgage |
| Less than $10,000 | 11 (2.0%) | 0 (0.0%) |
| $10,000 to $24,999 | 300 (54.7%) | 64 (18.6%) |
| $25,000 to $34,999 | 95 (17.3%) | 93 (27.0%) |
| $35,000 to $49,999 | 50 (9.1%) | 78 (22.7%) |
| $50,000 to $74,999 | 92 (16.8%) | 0 (0.0%) |
| $75,000 to $99,999 | 0 (0.0%) | 30 (8.7%) |
| $100,000 to $149,999 | 0 (0.0%) | 25 (7.3%) |
| $150,000 or more | 0 (0.0%) | 50 (14.5%) |
| Total | 548 (100.0%) | 344 (100.0%) |
Property Value to Household Income Ratio in Bunkie
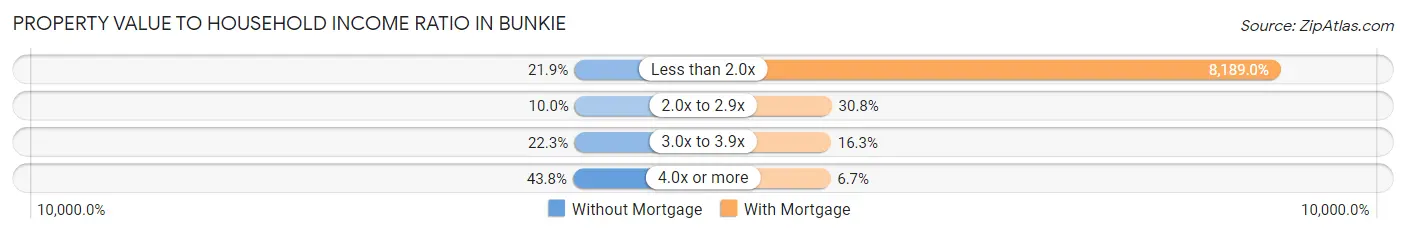
| Value-to-Income Ratio | Without Mortgage | With Mortgage |
| Less than 2.0x | 120 (21.9%) | 28,170 (8,188.9%) |
| 2.0x to 2.9x | 55 (10.0%) | 106 (30.8%) |
| 3.0x to 3.9x | 122 (22.3%) | 56 (16.3%) |
| 4.0x or more | 240 (43.8%) | 23 (6.7%) |
| Total | 548 (100.0%) | 344 (100.0%) |
Real Estate Taxes by Mortgage Status in Bunkie
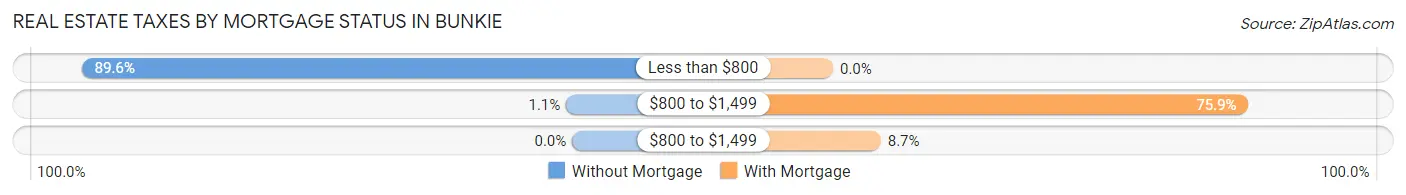
| Property Taxes | Without Mortgage | With Mortgage |
| Less than $800 | 491 (89.6%) | 0 (0.0%) |
| $800 to $1,499 | 6 (1.1%) | 261 (75.9%) |
| $800 to $1,499 | 0 (0.0%) | 30 (8.7%) |
| Total | 548 (100.0%) | 344 (100.0%) |
Health & Disability in Bunkie
Health Insurance Coverage by Age in Bunkie
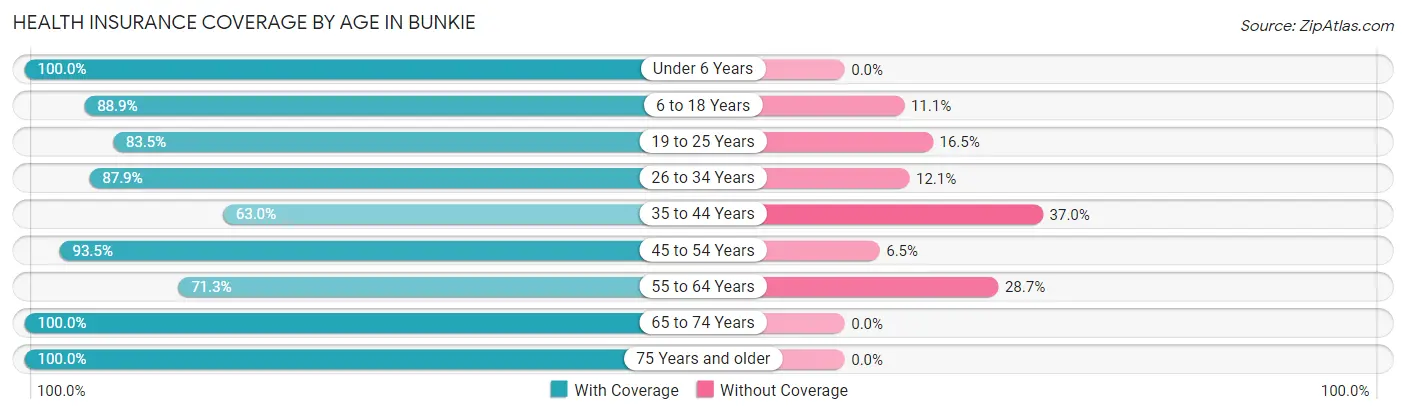
| Age Bracket | With Coverage | Without Coverage |
| Under 6 Years | 197 (100.0%) | 0 (0.0%) |
| 6 to 18 Years | 535 (88.9%) | 67 (11.1%) |
| 19 to 25 Years | 203 (83.5%) | 40 (16.5%) |
| 26 to 34 Years | 131 (87.9%) | 18 (12.1%) |
| 35 to 44 Years | 213 (63.0%) | 125 (37.0%) |
| 45 to 54 Years | 329 (93.5%) | 23 (6.5%) |
| 55 to 64 Years | 346 (71.3%) | 139 (28.7%) |
| 65 to 74 Years | 458 (100.0%) | 0 (0.0%) |
| 75 Years and older | 468 (100.0%) | 0 (0.0%) |
| Total | 2,880 (87.5%) | 412 (12.5%) |
Health Insurance Coverage by Citizenship Status in Bunkie
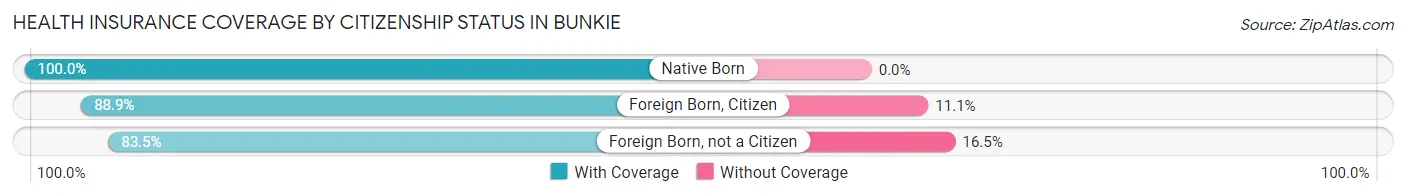
| Citizenship Status | With Coverage | Without Coverage |
| Native Born | 197 (100.0%) | 0 (0.0%) |
| Foreign Born, Citizen | 535 (88.9%) | 67 (11.1%) |
| Foreign Born, not a Citizen | 203 (83.5%) | 40 (16.5%) |
Health Insurance Coverage by Household Income in Bunkie
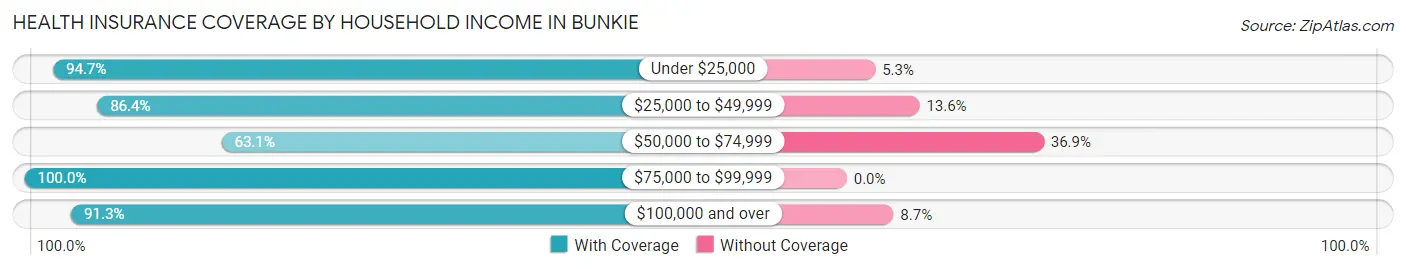
| Household Income | With Coverage | Without Coverage |
| Under $25,000 | 1,670 (94.7%) | 94 (5.3%) |
| $25,000 to $49,999 | 546 (86.4%) | 86 (13.6%) |
| $50,000 to $74,999 | 359 (63.1%) | 210 (36.9%) |
| $75,000 to $99,999 | 75 (100.0%) | 0 (0.0%) |
| $100,000 and over | 230 (91.3%) | 22 (8.7%) |
Public vs Private Health Insurance Coverage by Age in Bunkie
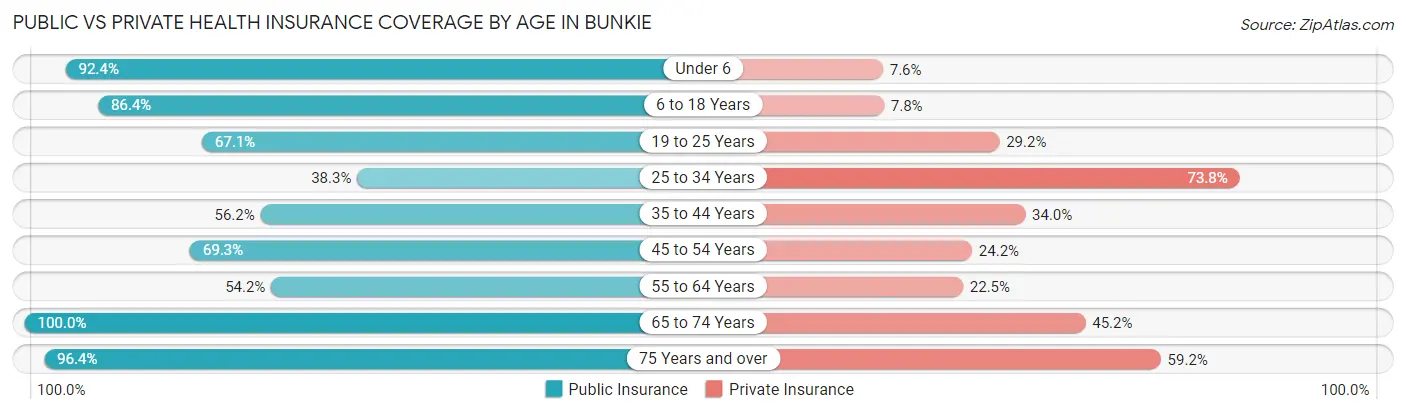
| Age Bracket | Public Insurance | Private Insurance |
| Under 6 | 182 (92.4%) | 15 (7.6%) |
| 6 to 18 Years | 520 (86.4%) | 47 (7.8%) |
| 19 to 25 Years | 163 (67.1%) | 71 (29.2%) |
| 25 to 34 Years | 57 (38.3%) | 110 (73.8%) |
| 35 to 44 Years | 190 (56.2%) | 115 (34.0%) |
| 45 to 54 Years | 244 (69.3%) | 85 (24.1%) |
| 55 to 64 Years | 263 (54.2%) | 109 (22.5%) |
| 65 to 74 Years | 458 (100.0%) | 207 (45.2%) |
| 75 Years and over | 451 (96.4%) | 277 (59.2%) |
| Total | 2,528 (76.8%) | 1,036 (31.5%) |
Disability Status by Sex by Age in Bunkie
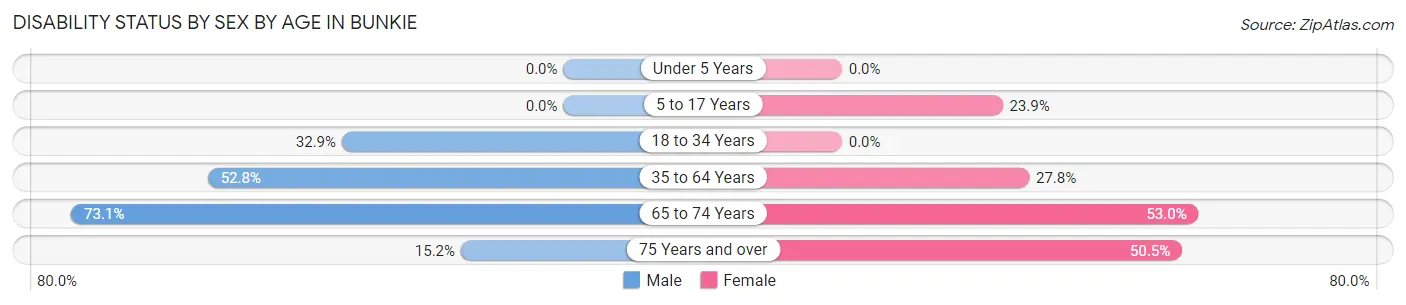
| Age Bracket | Male | Female |
| Under 5 Years | 0 (0.0%) | 0 (0.0%) |
| 5 to 17 Years | 0 (0.0%) | 68 (23.9%) |
| 18 to 34 Years | 99 (32.9%) | 0 (0.0%) |
| 35 to 64 Years | 216 (52.8%) | 213 (27.8%) |
| 65 to 74 Years | 125 (73.1%) | 152 (53.0%) |
| 75 Years and over | 14 (15.2%) | 190 (50.5%) |
Disability Class by Sex by Age in Bunkie
Disability Class: Hearing Difficulty
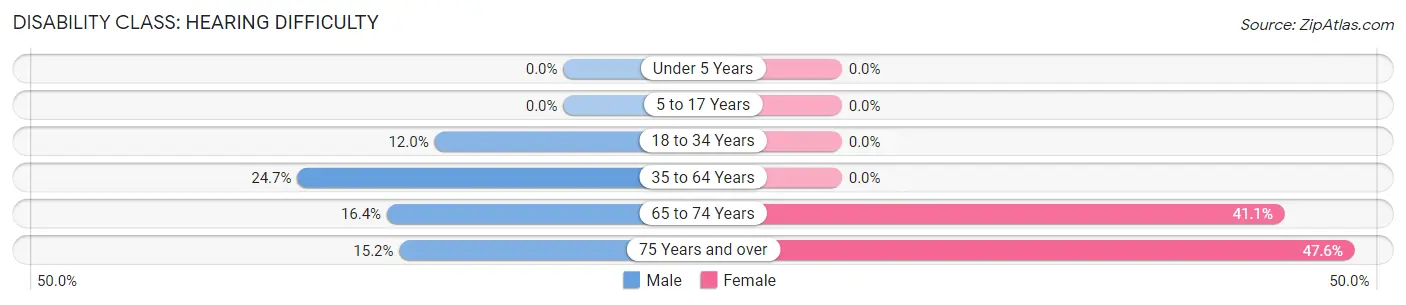
| Age Bracket | Male | Female |
| Under 5 Years | 0 (0.0%) | 0 (0.0%) |
| 5 to 17 Years | 0 (0.0%) | 0 (0.0%) |
| 18 to 34 Years | 36 (12.0%) | 0 (0.0%) |
| 35 to 64 Years | 101 (24.7%) | 0 (0.0%) |
| 65 to 74 Years | 28 (16.4%) | 118 (41.1%) |
| 75 Years and over | 14 (15.2%) | 179 (47.6%) |
Disability Class: Vision Difficulty
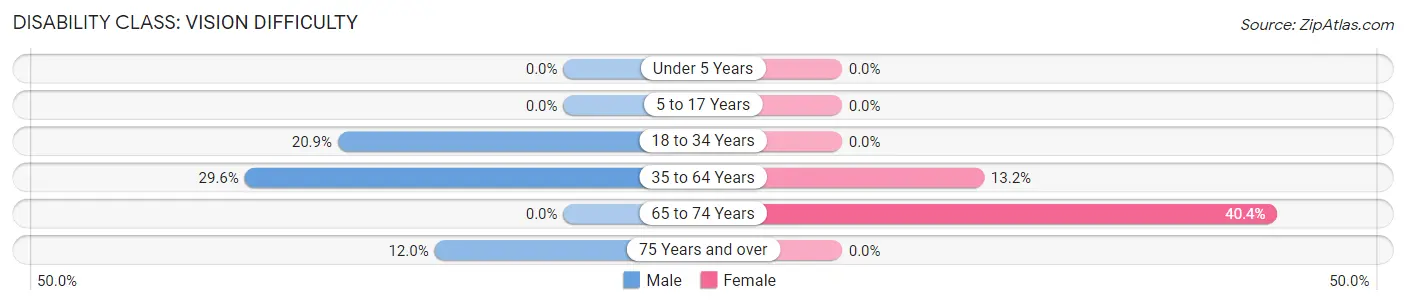
| Age Bracket | Male | Female |
| Under 5 Years | 0 (0.0%) | 0 (0.0%) |
| 5 to 17 Years | 0 (0.0%) | 0 (0.0%) |
| 18 to 34 Years | 63 (20.9%) | 0 (0.0%) |
| 35 to 64 Years | 121 (29.6%) | 101 (13.2%) |
| 65 to 74 Years | 0 (0.0%) | 116 (40.4%) |
| 75 Years and over | 11 (12.0%) | 0 (0.0%) |
Disability Class: Cognitive Difficulty
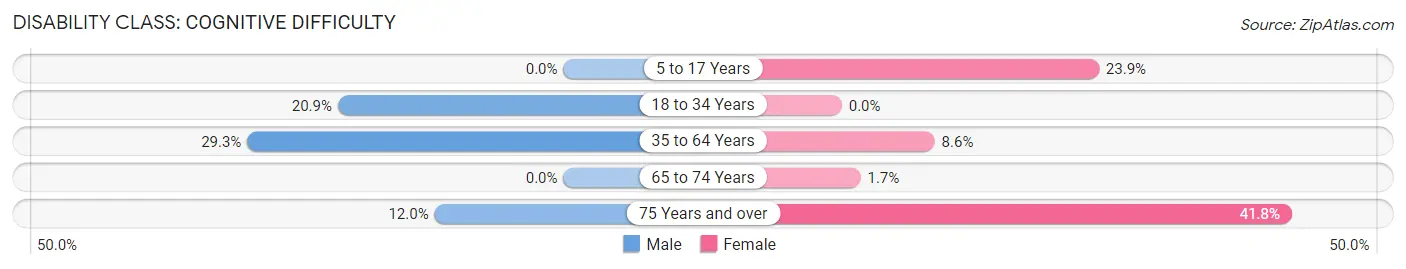
| Age Bracket | Male | Female |
| 5 to 17 Years | 0 (0.0%) | 68 (23.9%) |
| 18 to 34 Years | 63 (20.9%) | 0 (0.0%) |
| 35 to 64 Years | 120 (29.3%) | 66 (8.6%) |
| 65 to 74 Years | 0 (0.0%) | 5 (1.7%) |
| 75 Years and over | 11 (12.0%) | 157 (41.8%) |
Disability Class: Ambulatory Difficulty
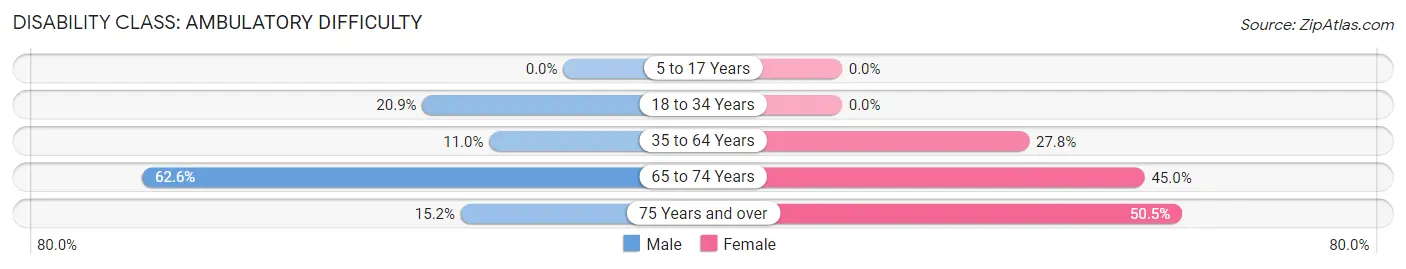
| Age Bracket | Male | Female |
| 5 to 17 Years | 0 (0.0%) | 0 (0.0%) |
| 18 to 34 Years | 63 (20.9%) | 0 (0.0%) |
| 35 to 64 Years | 45 (11.0%) | 213 (27.8%) |
| 65 to 74 Years | 107 (62.6%) | 129 (45.0%) |
| 75 Years and over | 14 (15.2%) | 190 (50.5%) |
Disability Class: Self-Care Difficulty
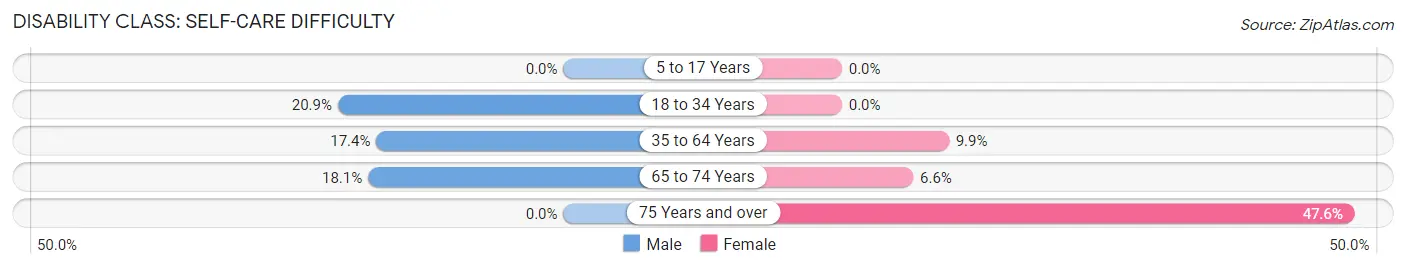
| Age Bracket | Male | Female |
| 5 to 17 Years | 0 (0.0%) | 0 (0.0%) |
| 18 to 34 Years | 63 (20.9%) | 0 (0.0%) |
| 35 to 64 Years | 71 (17.4%) | 76 (9.9%) |
| 65 to 74 Years | 31 (18.1%) | 19 (6.6%) |
| 75 Years and over | 0 (0.0%) | 179 (47.6%) |
Technology Access in Bunkie
Computing Device Access in Bunkie
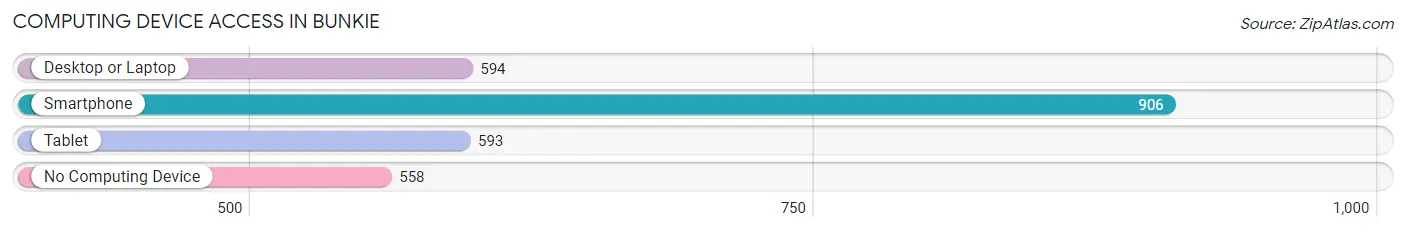
| Device Type | # Households | % Households |
| Desktop or Laptop | 594 | 38.0% |
| Smartphone | 906 | 58.0% |
| Tablet | 593 | 37.9% |
| No Computing Device | 558 | 35.7% |
| Total | 1,563 | 100.0% |
Internet Access in Bunkie
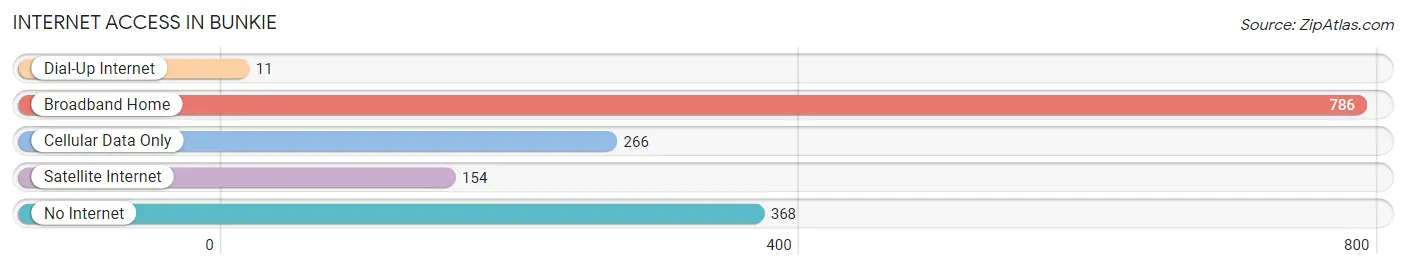
| Internet Type | # Households | % Households |
| Dial-Up Internet | 11 | 0.7% |
| Broadband Home | 786 | 50.3% |
| Cellular Data Only | 266 | 17.0% |
| Satellite Internet | 154 | 9.9% |
| No Internet | 368 | 23.5% |
| Total | 1,563 | 100.0% |
Bunkie Summary
Bunkie is a small town located in Avoyelles Parish, Louisiana. It is situated in the heart of the state, approximately halfway between Alexandria and Lafayette. The town was founded in 1883 and has a population of approximately 5,000 people.
History
Bunkie was founded in 1883 by the Louisiana and Arkansas Railroad. The town was named after the daughter of the railroad's president, William Bunkie. The railroad was built to connect the two states and was a major factor in the development of the town.
The town grew rapidly in the late 19th century and early 20th century. It was a major hub for the lumber industry, and the town was home to several sawmills and lumber yards. The town also had a thriving agricultural industry, with cotton, corn, and sugarcane being the main crops.
In the early 20th century, the town was home to several large businesses, including a cotton gin, a brick factory, and a canning factory. The town also had a thriving entertainment industry, with several movie theaters, dance halls, and other venues.
Geography
Bunkie is located in the heart of Louisiana, approximately halfway between Alexandria and Lafayette. The town is situated on the banks of the Bayou Des Glaises, a tributary of the Red River. The town is surrounded by flat, fertile farmland, and is located in the heart of the state's cotton-growing region.
The climate in Bunkie is humid subtropical, with hot, humid summers and mild winters. The average annual temperature is around 70 degrees Fahrenheit, and the average annual precipitation is around 50 inches.
Economy
The economy of Bunkie is largely based on agriculture. Cotton, corn, and sugarcane are the main crops grown in the area. The town is also home to several small businesses, including restaurants, retail stores, and service providers.
The town is also home to several manufacturing companies, including a furniture factory, a plastics factory, and a metal fabrication plant. The town is also home to several oil and gas companies, as well as a number of trucking companies.
Demographics
As of the 2010 census, the population of Bunkie was 5,039. The racial makeup of the town was 79.3% White, 17.7% African American, 0.3% Native American, 0.3% Asian, 0.1% Pacific Islander, and 2.3% from other races. Hispanic or Latino of any race were 2.7% of the population.
The median household income in Bunkie was $30,938, and the median family income was $37,813. The per capita income was $17,845. About 22.3% of the population was below the poverty line.
The town is served by the Avoyelles Parish School District, which includes two elementary schools, one middle school, and one high school. The town is also home to a branch of the Louisiana State University system.
Common Questions
What is Per Capita Income in Bunkie?
Per Capita income in Bunkie is $20,729.
What is the Median Family Income in Bunkie?
Median Family Income in Bunkie is $29,665.
What is the Median Household income in Bunkie?
Median Household Income in Bunkie is $21,888.
What is Income or Wage Gap in Bunkie?
Income or Wage Gap in Bunkie is 55.1%.
Women in Bunkie earn 44.9 cents for every dollar earned by a man.
What is Family Income Deficit in Bunkie?
Family Income Deficit in Bunkie is $15,626.
Families that are below poverty line in Bunkie earn $15,626 less on average than the poverty threshold level.
What is Inequality or Gini Index in Bunkie?
Inequality or Gini Index in Bunkie is 0.53.
What is the Total Population of Bunkie?
Total Population of Bunkie is 3,362.
What is the Total Male Population of Bunkie?
Total Male Population of Bunkie is 1,362.
What is the Total Female Population of Bunkie?
Total Female Population of Bunkie is 2,000.
What is the Ratio of Males per 100 Females in Bunkie?
There are 68.10 Males per 100 Females in Bunkie.
What is the Ratio of Females per 100 Males in Bunkie?
There are 146.84 Females per 100 Males in Bunkie.
What is the Median Population Age in Bunkie?
Median Population Age in Bunkie is 47.9 Years.
What is the Average Family Size in Bunkie
Average Family Size in Bunkie is 3.1 People.
What is the Average Household Size in Bunkie
Average Household Size in Bunkie is 2.1 People.
How Large is the Labor Force in Bunkie?
There are 1,151 People in the Labor Forcein in Bunkie.
What is the Percentage of People in the Labor Force in Bunkie?
43.8% of People are in the Labor Force in Bunkie.
What is the Unemployment Rate in Bunkie?
Unemployment Rate in Bunkie is 11.2%.