Belle Rose, LA Map & Demographics
Belle Rose Map
Belle Rose Overview
$37,352
PER CAPITA INCOME
0.49
INEQUALITY / GINI INDEX
2,030
TOTAL POPULATION
971
MALE POPULATION
1,059
FEMALE POPULATION
91.69
MALES / 100 FEMALES
109.06
FEMALES / 100 MALES
49.3
MEDIAN AGE
3.1
AVG FAMILY SIZE
2.5
AVG HOUSEHOLD SIZE
1,101
LABOR FORCE [ PEOPLE ]
64.9%
PERCENT IN LABOR FORCE
6.8%
UNEMPLOYMENT RATE
Belle Rose Zip Codes
Belle Rose Area Codes
Income in Belle Rose
Income Overview in Belle Rose
| Characteristic | Number | Measure |
| Per Capita Income | 2,030 | $37,352 |
| Median Family Income | 578 | $0 |
| Mean Family Income | 578 | $141,035 |
| Median Household Income | 807 | $0 |
| Mean Household Income | 807 | $111,136 |
| Income Deficit | 578 | $0 |
| Wage / Income Gap (%) | 2,030 | 0.00% |
| Wage / Income Gap ($) | 2,030 | 100.00¢ per $1 |
| Gini / Inequality Index | 2,030 | 0.49 |
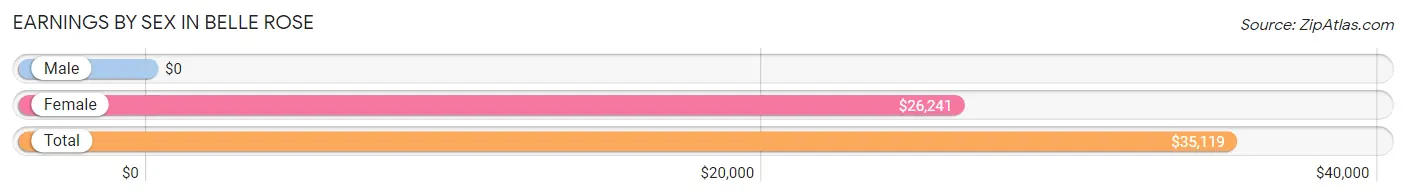
Earnings by Sex in Belle Rose
| Sex | Number | Average Earnings |
| Male | 432 (39.4%) | $0 |
| Female | 664 (60.6%) | $26,241 |
| Total | 1,096 (100.0%) | $35,119 |
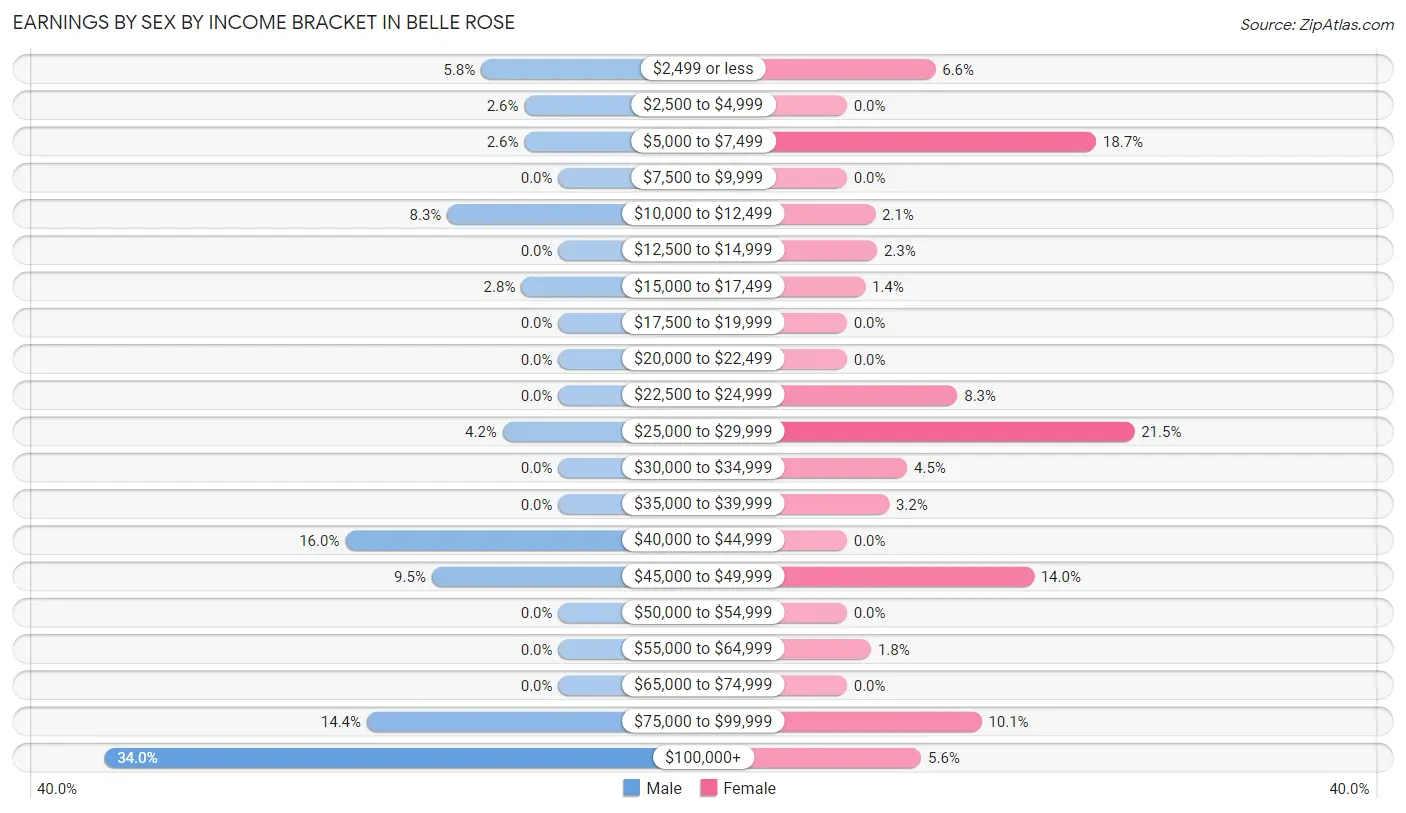
Earnings by Sex by Income Bracket in Belle Rose
The most common earnings brackets in Belle Rose are $100,000+ for men (147 | 34.0%) and $25,000 to $29,999 for women (143 | 21.5%).
| Income | Male | Female |
| $2,499 or less | 25 (5.8%) | 44 (6.6%) |
| $2,500 to $4,999 | 11 (2.5%) | 0 (0.0%) |
| $5,000 to $7,499 | 11 (2.5%) | 124 (18.7%) |
| $7,500 to $9,999 | 0 (0.0%) | 0 (0.0%) |
| $10,000 to $12,499 | 36 (8.3%) | 14 (2.1%) |
| $12,500 to $14,999 | 0 (0.0%) | 15 (2.3%) |
| $15,000 to $17,499 | 12 (2.8%) | 9 (1.4%) |
| $17,500 to $19,999 | 0 (0.0%) | 0 (0.0%) |
| $20,000 to $22,499 | 0 (0.0%) | 0 (0.0%) |
| $22,500 to $24,999 | 0 (0.0%) | 55 (8.3%) |
| $25,000 to $29,999 | 18 (4.2%) | 143 (21.5%) |
| $30,000 to $34,999 | 0 (0.0%) | 30 (4.5%) |
| $35,000 to $39,999 | 0 (0.0%) | 21 (3.2%) |
| $40,000 to $44,999 | 69 (16.0%) | 0 (0.0%) |
| $45,000 to $49,999 | 41 (9.5%) | 93 (14.0%) |
| $50,000 to $54,999 | 0 (0.0%) | 0 (0.0%) |
| $55,000 to $64,999 | 0 (0.0%) | 12 (1.8%) |
| $65,000 to $74,999 | 0 (0.0%) | 0 (0.0%) |
| $75,000 to $99,999 | 62 (14.3%) | 67 (10.1%) |
| $100,000+ | 147 (34.0%) | 37 (5.6%) |
| Total | 432 (100.0%) | 664 (100.0%) |
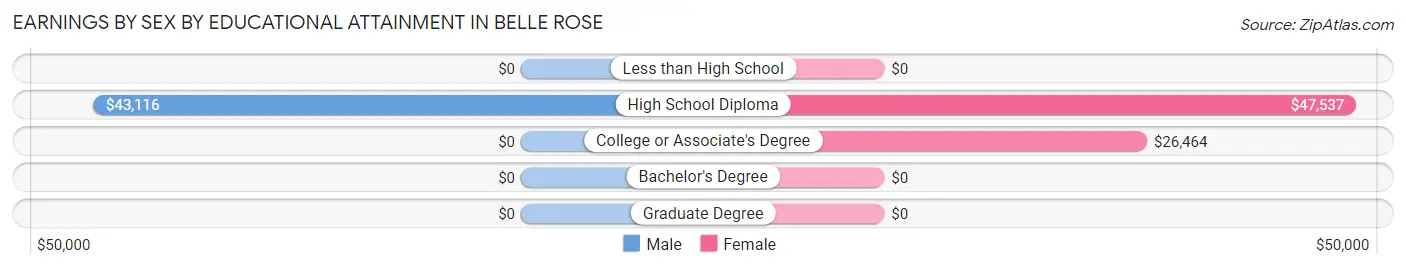
Earnings by Sex by Educational Attainment in Belle Rose
| Educational Attainment | Male Income | Female Income |
| Less than High School | - | - |
| High School Diploma | $43,116 | $47,537 |
| College or Associate's Degree | - | - |
| Bachelor's Degree | - | - |
| Graduate Degree | - | - |
| Total | - | - |
Family Income in Belle Rose
Family Income Brackets in Belle Rose
According to the Belle Rose family income data, there are 229 families falling into the $200,000+ income range, which is the most common income bracket and makes up 39.6% of all families.
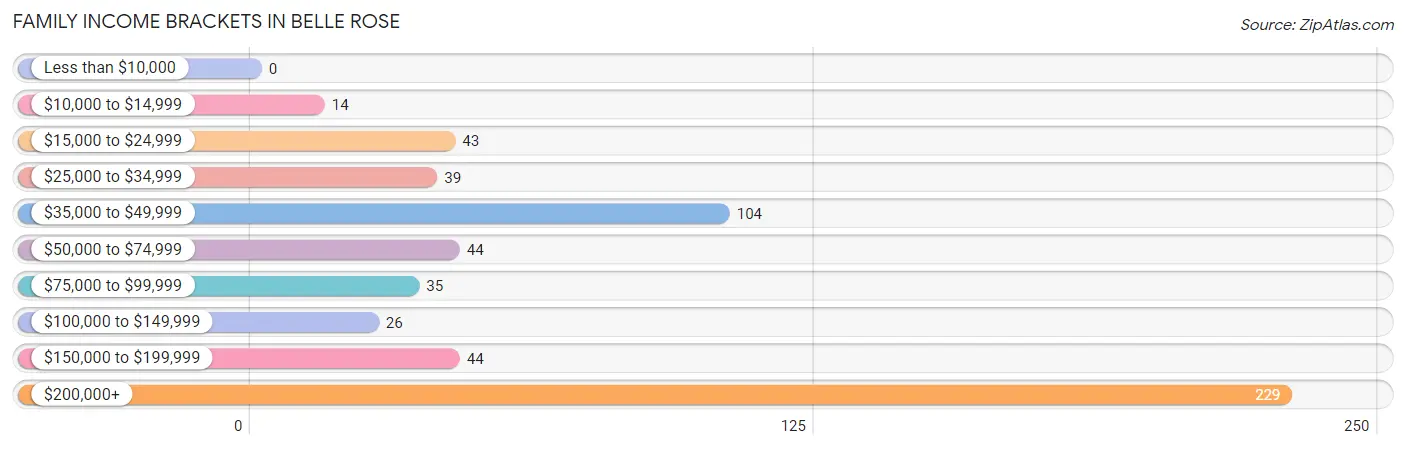
| Income Bracket | # Families | % Families |
| Less than $10,000 | 0 | 0.0% |
| $10,000 to $14,999 | 14 | 2.4% |
| $15,000 to $24,999 | 43 | 7.4% |
| $25,000 to $34,999 | 39 | 6.7% |
| $35,000 to $49,999 | 104 | 18.0% |
| $50,000 to $74,999 | 44 | 7.6% |
| $75,000 to $99,999 | 35 | 6.1% |
| $100,000 to $149,999 | 26 | 4.5% |
| $150,000 to $199,999 | 44 | 7.6% |
| $200,000+ | 229 | 39.6% |
Family Income by Famaliy Size in Belle Rose
3-person families (199 | 34.4%) account for the highest median family income in Belle Rose with $233,166 per family, while 3-person families (199 | 34.4%) have the highest median income of $77,722 per family member.
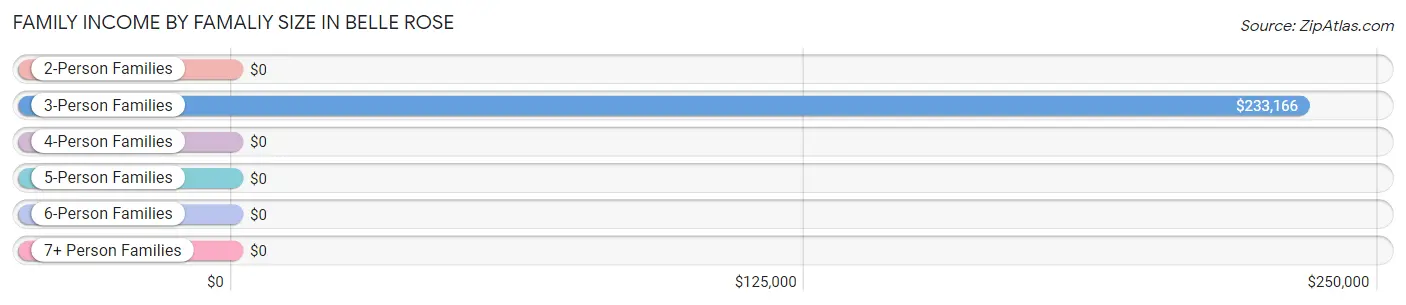
| Income Bracket | # Families | Median Income |
| 2-Person Families | 296 (51.2%) | $0 |
| 3-Person Families | 199 (34.4%) | $233,166 |
| 4-Person Families | 8 (1.4%) | $0 |
| 5-Person Families | 43 (7.4%) | $0 |
| 6-Person Families | 0 (0.0%) | $0 |
| 7+ Person Families | 32 (5.5%) | $0 |
| Total | 578 (100.0%) | $0 |
Family Income by Number of Earners in Belle Rose
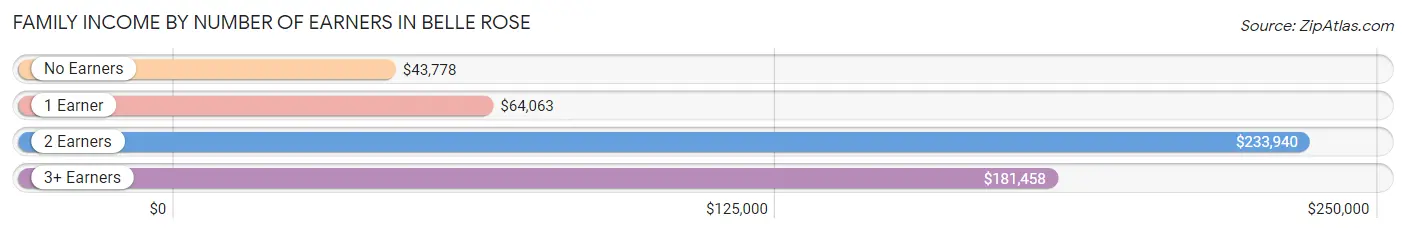
| Number of Earners | # Families | Median Income |
| No Earners | 131 (22.7%) | $43,778 |
| 1 Earner | 80 (13.8%) | $64,063 |
| 2 Earners | 260 (45.0%) | $233,940 |
| 3+ Earners | 107 (18.5%) | $181,458 |
| Total | 578 (100.0%) | $0 |
Household Income in Belle Rose
Household Income Brackets in Belle Rose
With 229 households falling in the category, the $200,000+ income range is the most frequent in Belle Rose, accounting for 28.4% of all households. In contrast, only 14 households (1.7%) fall into the $10,000 to $14,999 income bracket, making it the least populous group.
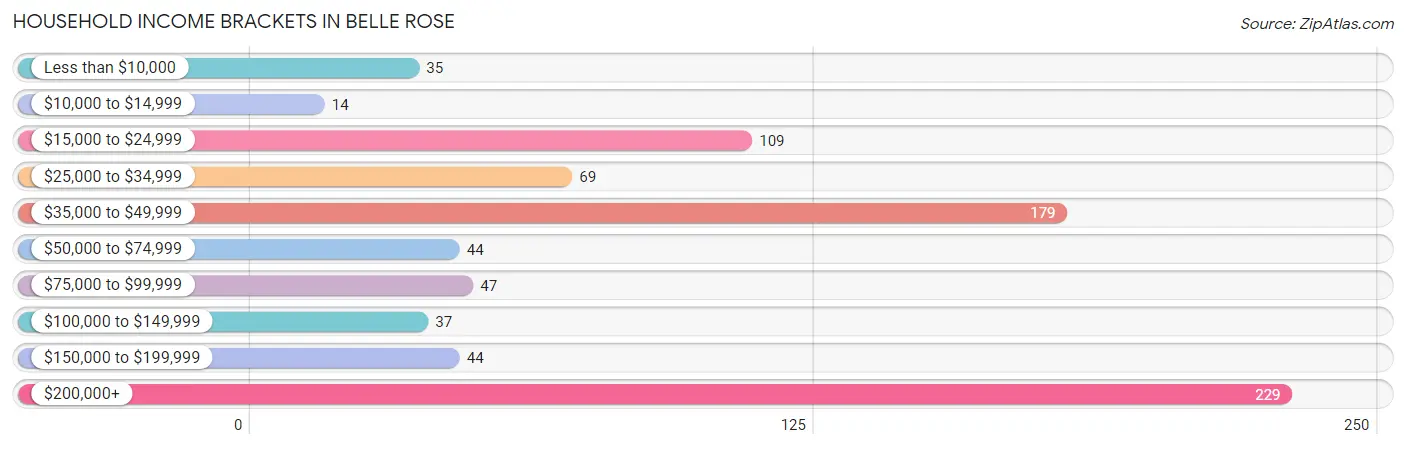
| Income Bracket | # Households | % Households |
| Less than $10,000 | 35 | 4.3% |
| $10,000 to $14,999 | 14 | 1.7% |
| $15,000 to $24,999 | 109 | 13.5% |
| $25,000 to $34,999 | 69 | 8.6% |
| $35,000 to $49,999 | 179 | 22.2% |
| $50,000 to $74,999 | 44 | 5.5% |
| $75,000 to $99,999 | 47 | 5.8% |
| $100,000 to $149,999 | 37 | 4.6% |
| $150,000 to $199,999 | 44 | 5.5% |
| $200,000+ | 229 | 28.4% |
Household Income by Householder Age in Belle Rose
The median household income in Belle Rose is $0, with the highest median household income of $233,125 found in the 25 to 44 years age bracket for the primary householder. A total of 138 households (17.1%) fall into this category.
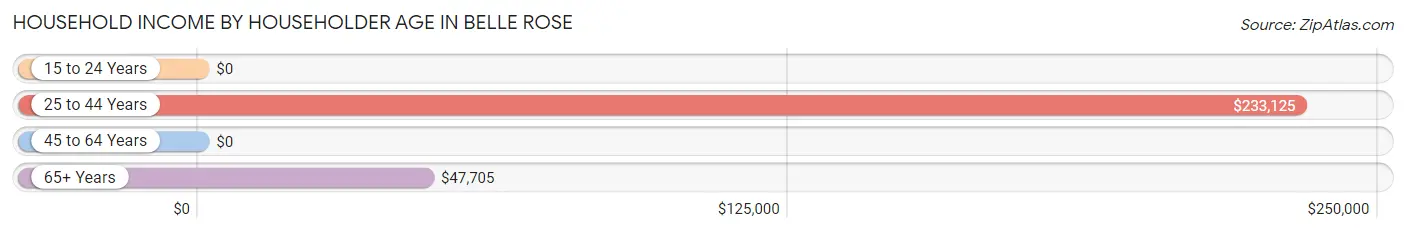
| Income Bracket | # Households | Median Income |
| 15 to 24 Years | 0 (0.0%) | $0 |
| 25 to 44 Years | 138 (17.1%) | $233,125 |
| 45 to 64 Years | 443 (54.9%) | $0 |
| 65+ Years | 226 (28.0%) | $47,705 |
| Total | 807 (100.0%) | $0 |
Poverty in Belle Rose
Income Below Poverty by Sex and Age in Belle Rose
With 9.9% poverty level for males and 10.8% for females among the residents of Belle Rose, 15 year old males and under 5 year old females are the most vulnerable to poverty, with 36 males (100.0%) and 22 females (61.1%) in their respective age groups living below the poverty level.
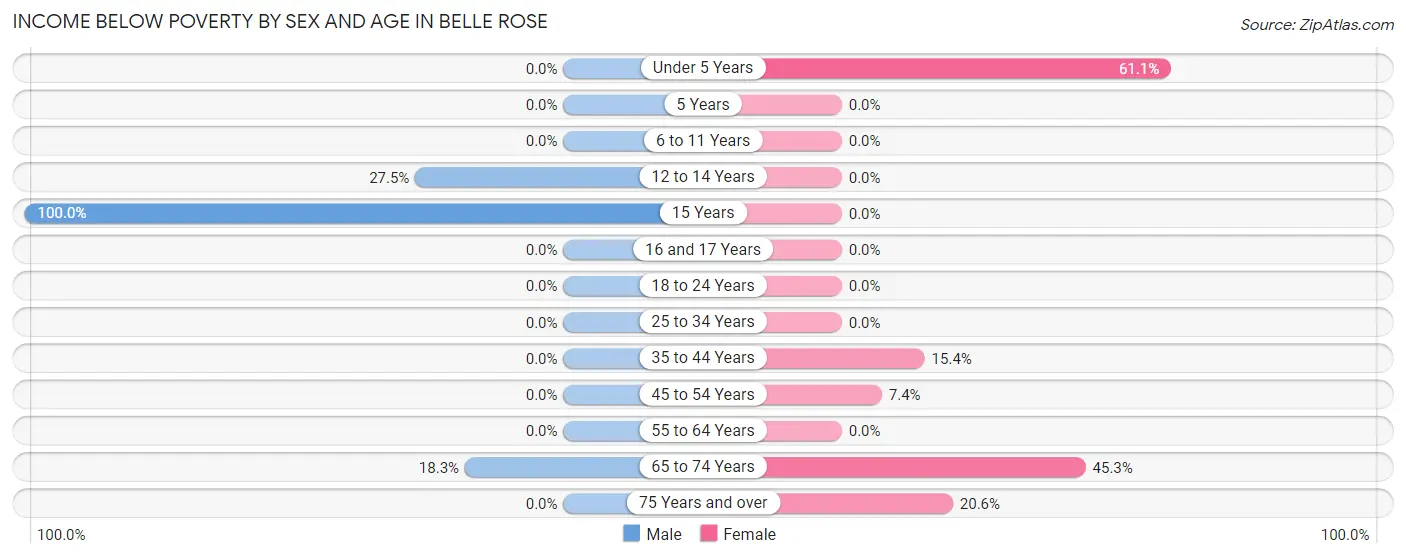
| Age Bracket | Male | Female |
| Under 5 Years | 0 (0.0%) | 22 (61.1%) |
| 5 Years | 0 (0.0%) | 0 (0.0%) |
| 6 to 11 Years | 0 (0.0%) | 0 (0.0%) |
| 12 to 14 Years | 22 (27.5%) | 0 (0.0%) |
| 15 Years | 36 (100.0%) | 0 (0.0%) |
| 16 and 17 Years | 0 (0.0%) | 0 (0.0%) |
| 18 to 24 Years | 0 (0.0%) | 0 (0.0%) |
| 25 to 34 Years | 0 (0.0%) | 0 (0.0%) |
| 35 to 44 Years | 0 (0.0%) | 14 (15.4%) |
| 45 to 54 Years | 0 (0.0%) | 15 (7.4%) |
| 55 to 64 Years | 0 (0.0%) | 0 (0.0%) |
| 65 to 74 Years | 38 (18.3%) | 43 (45.3%) |
| 75 Years and over | 0 (0.0%) | 20 (20.6%) |
| Total | 96 (9.9%) | 114 (10.8%) |
Income Above Poverty by Sex and Age in Belle Rose
According to the poverty statistics in Belle Rose, males aged 6 to 11 years and females aged 6 to 11 years are the age groups that are most secure financially, with 100.0% of males and 100.0% of females in these age groups living above the poverty line.
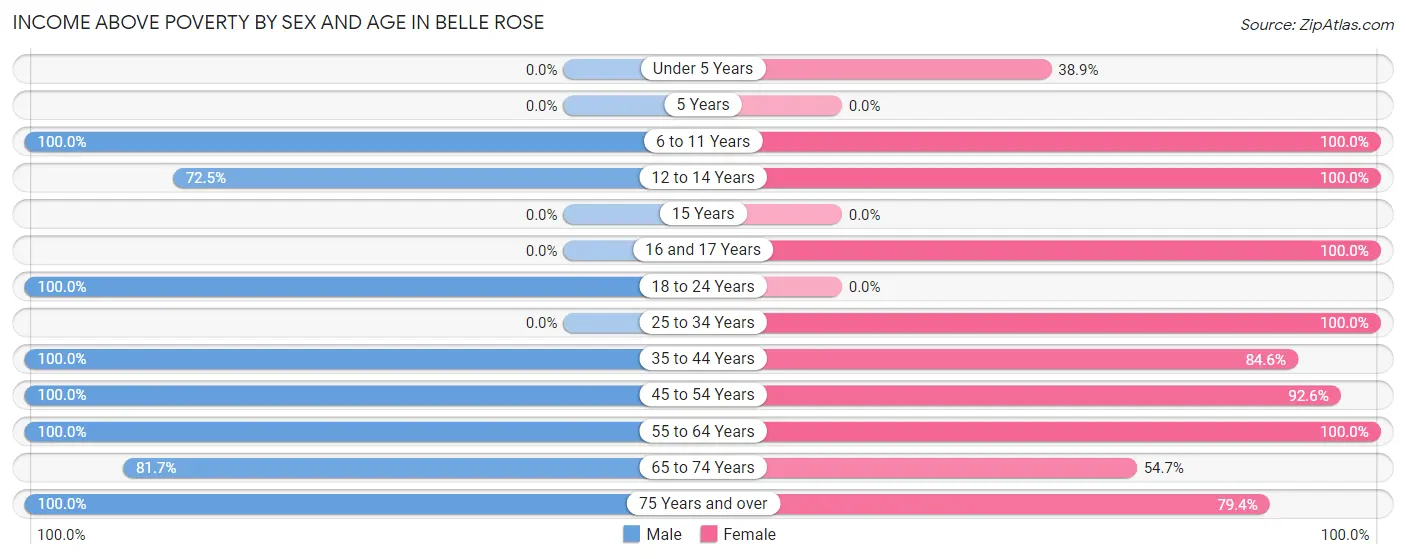
| Age Bracket | Male | Female |
| Under 5 Years | 0 (0.0%) | 14 (38.9%) |
| 5 Years | 0 (0.0%) | 0 (0.0%) |
| 6 to 11 Years | 63 (100.0%) | 63 (100.0%) |
| 12 to 14 Years | 58 (72.5%) | 55 (100.0%) |
| 15 Years | 0 (0.0%) | 0 (0.0%) |
| 16 and 17 Years | 0 (0.0%) | 67 (100.0%) |
| 18 to 24 Years | 22 (100.0%) | 0 (0.0%) |
| 25 to 34 Years | 0 (0.0%) | 171 (100.0%) |
| 35 to 44 Years | 140 (100.0%) | 77 (84.6%) |
| 45 to 54 Years | 292 (100.0%) | 187 (92.6%) |
| 55 to 64 Years | 110 (100.0%) | 182 (100.0%) |
| 65 to 74 Years | 170 (81.7%) | 52 (54.7%) |
| 75 Years and over | 20 (100.0%) | 77 (79.4%) |
| Total | 875 (90.1%) | 945 (89.2%) |
Income Below Poverty Among Married-Couple Families in Belle Rose
The poverty statistics for married-couple families in Belle Rose show that 9.7% or 43 of the total 442 families live below the poverty line. Families with 1 or 2 children have the highest poverty rate of 26.7%, comprising of 43 families. On the other hand, families with no children have the lowest poverty rate of 0.0%, which includes 0 families.
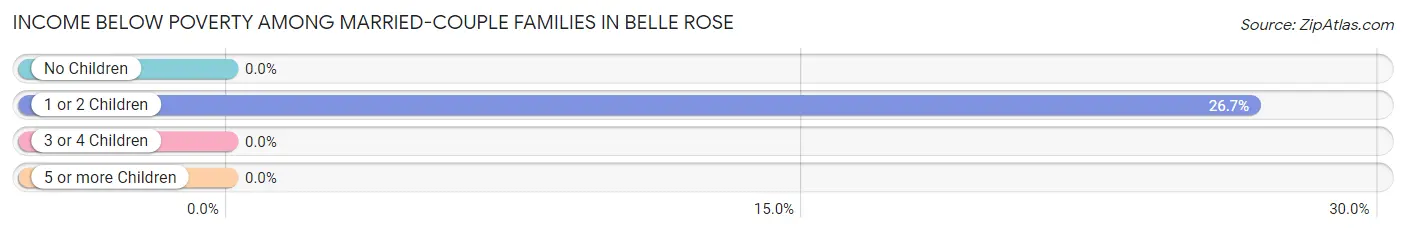
| Children | Above Poverty | Below Poverty |
| No Children | 281 (100.0%) | 0 (0.0%) |
| 1 or 2 Children | 118 (73.3%) | 43 (26.7%) |
| 3 or 4 Children | 0 (0.0%) | 0 (0.0%) |
| 5 or more Children | 0 (0.0%) | 0 (0.0%) |
| Total | 399 (90.3%) | 43 (9.7%) |
Income Below Poverty Among Single-Parent Households in Belle Rose
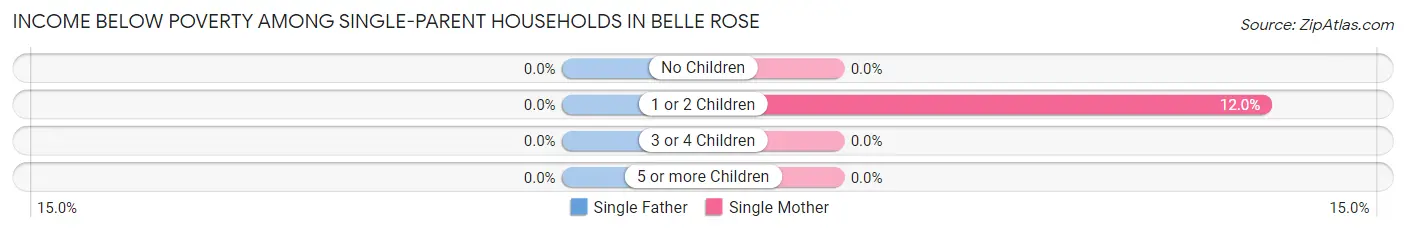
| Children | Single Father | Single Mother |
| No Children | 0 (0.0%) | 0 (0.0%) |
| 1 or 2 Children | 0 (0.0%) | 14 (12.0%) |
| 3 or 4 Children | 0 (0.0%) | 0 (0.0%) |
| 5 or more Children | 0 (0.0%) | 0 (0.0%) |
| Total | 0 (0.0%) | 14 (12.0%) |
Income Below Poverty Among Married-Couple vs Single-Parent Households in Belle Rose
The poverty data for Belle Rose shows that 43 of the married-couple family households (9.7%) and 14 of the single-parent households (10.3%) are living below the poverty level. Within the married-couple family households, those with 1 or 2 children have the highest poverty rate, with 43 households (26.7%) falling below the poverty line. Among the single-parent households, those with 1 or 2 children have the highest poverty rate, with 14 household (12.0%) living below poverty.
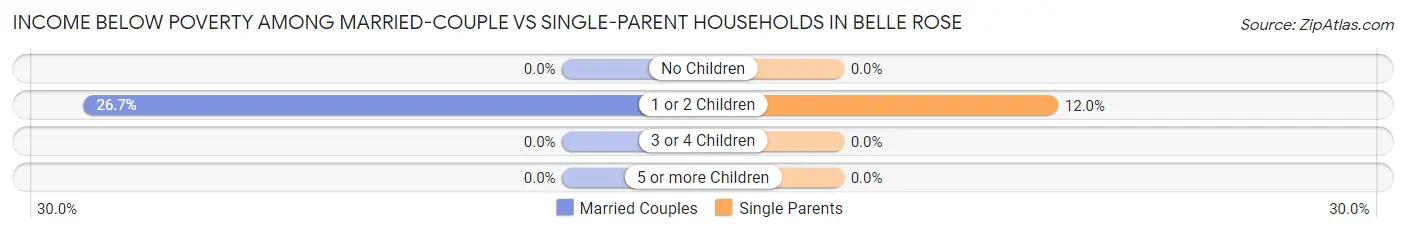
| Children | Married-Couple Families | Single-Parent Households |
| No Children | 0 (0.0%) | 0 (0.0%) |
| 1 or 2 Children | 43 (26.7%) | 14 (12.0%) |
| 3 or 4 Children | 0 (0.0%) | 0 (0.0%) |
| 5 or more Children | 0 (0.0%) | 0 (0.0%) |
| Total | 43 (9.7%) | 14 (10.3%) |
Race in Belle Rose
The most populous races in Belle Rose are Black / African American (1,220 | 60.1%), White / Caucasian (712 | 35.1%), and Two or more Races (98 | 4.8%).
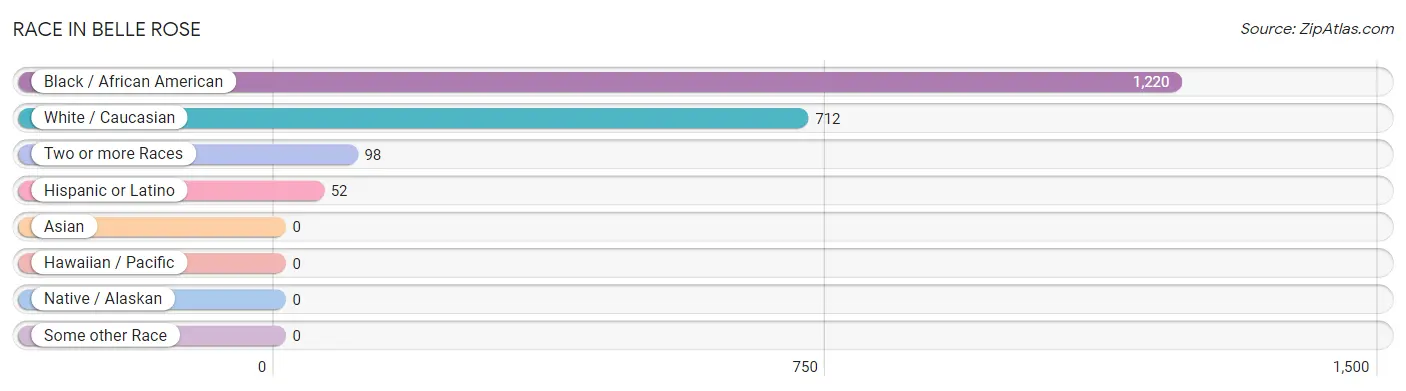
| Race | # Population | % Population |
| Asian | 0 | 0.0% |
| Black / African American | 1,220 | 60.1% |
| Hawaiian / Pacific | 0 | 0.0% |
| Hispanic or Latino | 52 | 2.6% |
| Native / Alaskan | 0 | 0.0% |
| White / Caucasian | 712 | 35.1% |
| Two or more Races | 98 | 4.8% |
| Some other Race | 0 | 0.0% |
| Total | 2,030 | 100.0% |
Ancestry in Belle Rose
The most populous ancestries reported in Belle Rose are French (338 | 16.7%), Irish (110 | 5.4%), German (53 | 2.6%), Italian (53 | 2.6%), and English (48 | 2.4%), together accounting for 29.7% of all Belle Rose residents.
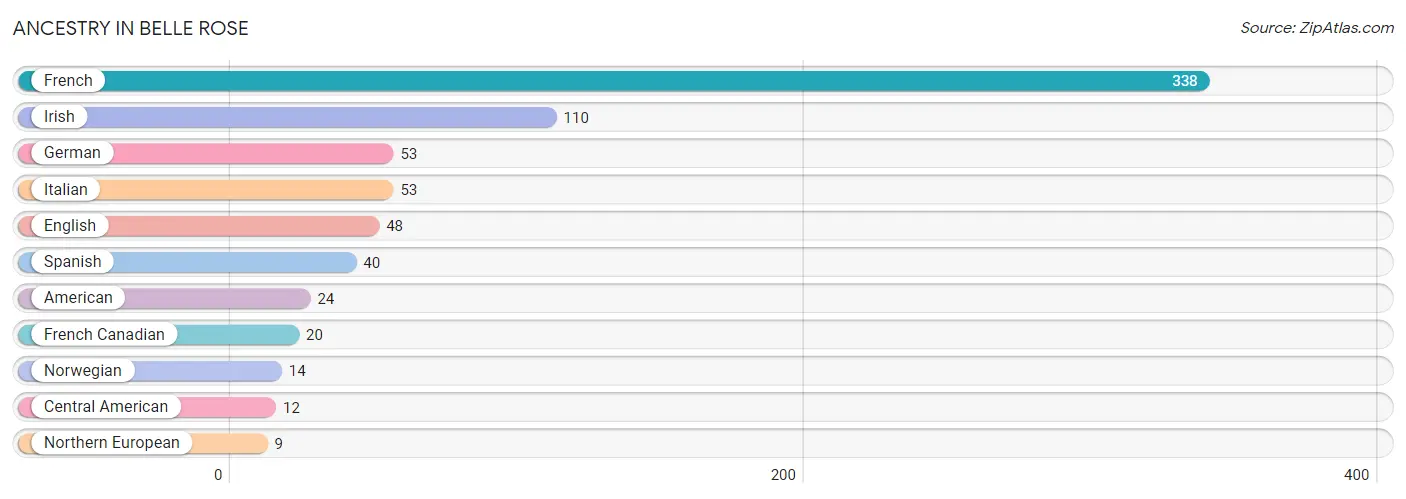
| Ancestry | # Population | % Population |
| American | 24 | 1.2% |
| Central American | 12 | 0.6% |
| English | 48 | 2.4% |
| French | 338 | 16.7% |
| French Canadian | 20 | 1.0% |
| German | 53 | 2.6% |
| Irish | 110 | 5.4% |
| Italian | 53 | 2.6% |
| Northern European | 9 | 0.4% |
| Norwegian | 14 | 0.7% |
| Spanish | 40 | 2.0% | View All 11 Rows |
Immigrants in Belle Rose

| Immigration Origin | # Population | % Population | View All 0 Rows |
Sex and Age in Belle Rose
Sex and Age in Belle Rose
The most populous age groups in Belle Rose are 50 to 54 Years (186 | 19.2%) for men and 30 to 34 Years (171 | 16.2%) for women.
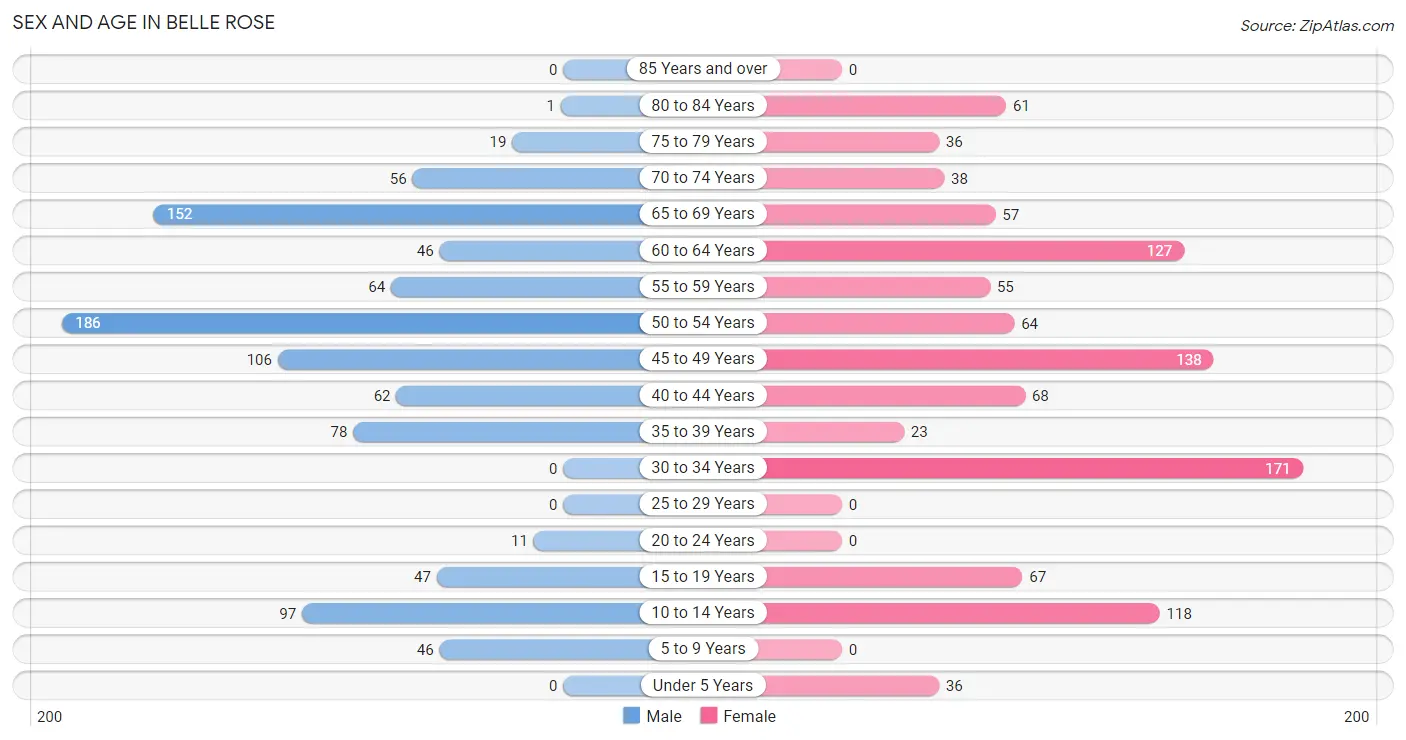
| Age Bracket | Male | Female |
| Under 5 Years | 0 (0.0%) | 36 (3.4%) |
| 5 to 9 Years | 46 (4.7%) | 0 (0.0%) |
| 10 to 14 Years | 97 (10.0%) | 118 (11.1%) |
| 15 to 19 Years | 47 (4.8%) | 67 (6.3%) |
| 20 to 24 Years | 11 (1.1%) | 0 (0.0%) |
| 25 to 29 Years | 0 (0.0%) | 0 (0.0%) |
| 30 to 34 Years | 0 (0.0%) | 171 (16.2%) |
| 35 to 39 Years | 78 (8.0%) | 23 (2.2%) |
| 40 to 44 Years | 62 (6.4%) | 68 (6.4%) |
| 45 to 49 Years | 106 (10.9%) | 138 (13.0%) |
| 50 to 54 Years | 186 (19.2%) | 64 (6.0%) |
| 55 to 59 Years | 64 (6.6%) | 55 (5.2%) |
| 60 to 64 Years | 46 (4.7%) | 127 (12.0%) |
| 65 to 69 Years | 152 (15.7%) | 57 (5.4%) |
| 70 to 74 Years | 56 (5.8%) | 38 (3.6%) |
| 75 to 79 Years | 19 (2.0%) | 36 (3.4%) |
| 80 to 84 Years | 1 (0.1%) | 61 (5.8%) |
| 85 Years and over | 0 (0.0%) | 0 (0.0%) |
| Total | 971 (100.0%) | 1,059 (100.0%) |
Families and Households in Belle Rose
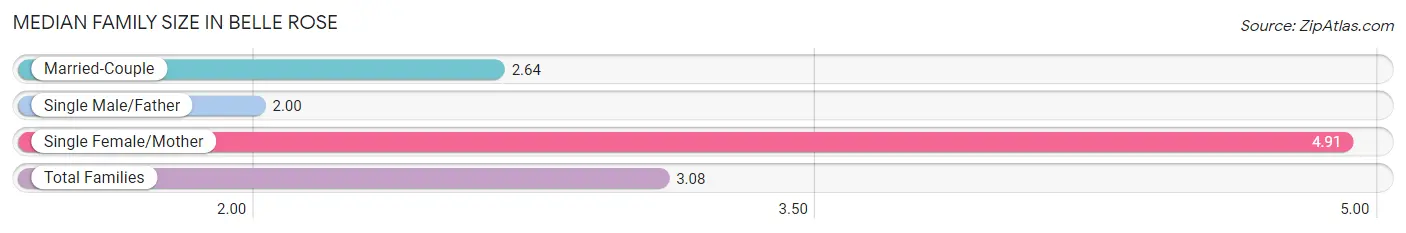
Median Family Size in Belle Rose
The median family size in Belle Rose is 3.08 persons per family, with single female/mother families (117 | 20.2%) accounting for the largest median family size of 4.91 persons per family. On the other hand, single male/father families (19 | 3.3%) represent the smallest median family size with 2.00 persons per family.
| Family Type | # Families | Family Size |
| Married-Couple | 442 (76.5%) | 2.64 |
| Single Male/Father | 19 (3.3%) | 2.00 |
| Single Female/Mother | 117 (20.2%) | 4.91 |
| Total Families | 578 (100.0%) | 3.08 |
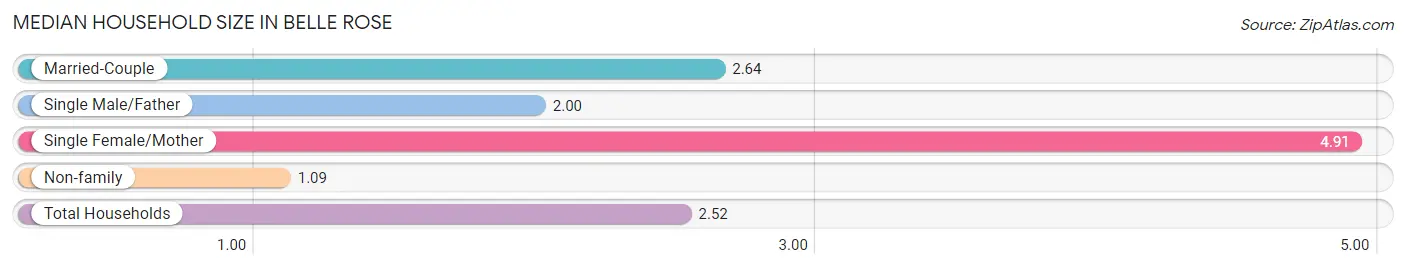
Median Household Size in Belle Rose
The median household size in Belle Rose is 2.52 persons per household, with single female/mother households (117 | 14.5%) accounting for the largest median household size of 4.91 persons per household. non-family households (229 | 28.4%) represent the smallest median household size with 1.09 persons per household.
| Household Type | # Households | Household Size |
| Married-Couple | 442 (54.8%) | 2.64 |
| Single Male/Father | 19 (2.4%) | 2.00 |
| Single Female/Mother | 117 (14.5%) | 4.91 |
| Non-family | 229 (28.4%) | 1.09 |
| Total Households | 807 (100.0%) | 2.52 |
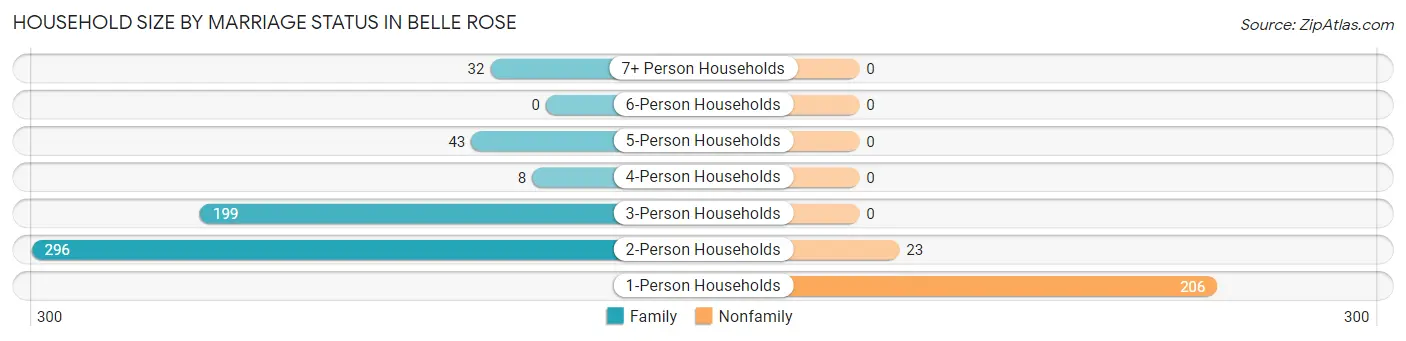
Household Size by Marriage Status in Belle Rose
Out of a total of 807 households in Belle Rose, 578 (71.6%) are family households, while 229 (28.4%) are nonfamily households. The most numerous type of family households are 2-person households, comprising 296, and the most common type of nonfamily households are 1-person households, comprising 206.
| Household Size | Family Households | Nonfamily Households |
| 1-Person Households | - | 206 (25.5%) |
| 2-Person Households | 296 (36.7%) | 23 (2.9%) |
| 3-Person Households | 199 (24.7%) | 0 (0.0%) |
| 4-Person Households | 8 (1.0%) | 0 (0.0%) |
| 5-Person Households | 43 (5.3%) | 0 (0.0%) |
| 6-Person Households | 0 (0.0%) | 0 (0.0%) |
| 7+ Person Households | 32 (4.0%) | 0 (0.0%) |
| Total | 578 (71.6%) | 229 (28.4%) |
Female Fertility in Belle Rose
Fertility by Age in Belle Rose
| Age Bracket | Women with Births | Births / 1,000 Women |
| 15 to 19 years | 0 (0.0%) | 0.0 |
| 20 to 34 years | 0 (0.0%) | 0.0 |
| 35 to 50 years | 0 (0.0%) | 0.0 |
| Total | 0 (0.0%) | 0.0 |
Fertility by Age by Marriage Status in Belle Rose
| Age Bracket | Married | Unmarried |
| 15 to 19 years | 0 (0.0%) | 0 (0.0%) |
| 20 to 34 years | 0 (0.0%) | 0 (0.0%) |
| 35 to 50 years | 0 (0.0%) | 0 (0.0%) |
| Total | 0 (0.0%) | 0 (0.0%) |
Fertility by Education in Belle Rose
| Educational Attainment | Women with Births | Births / 1,000 Women |
| Less than High School | 0 (0.0%) | 0.0 |
| High School Diploma | 0 (0.0%) | 0.0 |
| College or Associate's Degree | 0 (0.0%) | 0.0 |
| Bachelor's Degree | 0 (0.0%) | 0.0 |
| Graduate Degree | 0 (0.0%) | 0.0 |
| Total | 0 (0.0%) | 0.0 |
Fertility by Education by Marriage Status in Belle Rose
| Educational Attainment | Married | Unmarried |
| Less than High School | 0 (0.0%) | 0 (0.0%) |
| High School Diploma | 0 (0.0%) | 0 (0.0%) |
| College or Associate's Degree | 0 (0.0%) | 0 (0.0%) |
| Bachelor's Degree | 0 (0.0%) | 0 (0.0%) |
| Graduate Degree | 0 (0.0%) | 0 (0.0%) |
| Total | 0 (0.0%) | 0 (0.0%) |
Employment Characteristics in Belle Rose
Employment by Class of Employer in Belle Rose
Among the 1,006 employed individuals in Belle Rose, private company employees (621 | 61.7%), local government employees (131 | 13.0%), and self-employed (incorporated) (100 | 9.9%) make up the most common classes of employment.
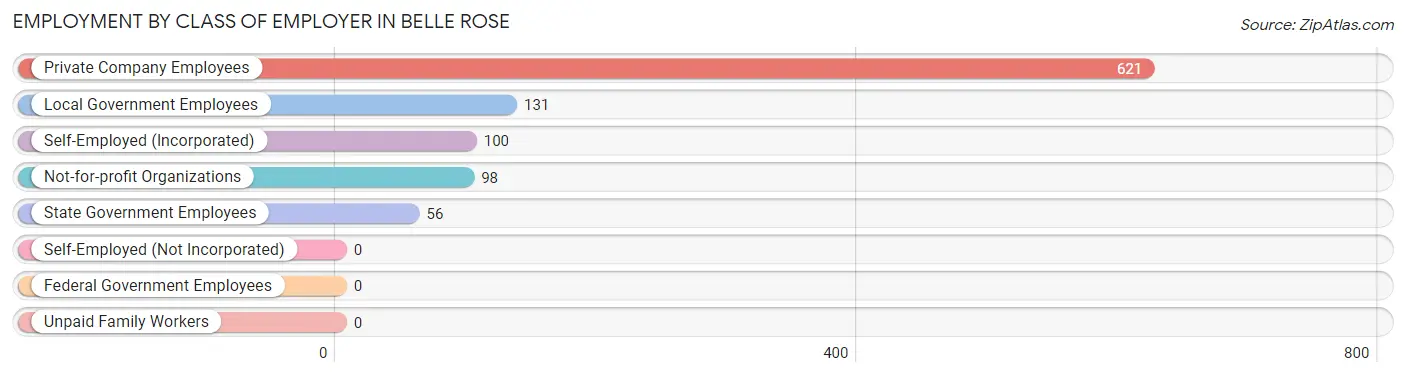
| Employer Class | # Employees | % Employees |
| Private Company Employees | 621 | 61.7% |
| Self-Employed (Incorporated) | 100 | 9.9% |
| Self-Employed (Not Incorporated) | 0 | 0.0% |
| Not-for-profit Organizations | 98 | 9.7% |
| Local Government Employees | 131 | 13.0% |
| State Government Employees | 56 | 5.6% |
| Federal Government Employees | 0 | 0.0% |
| Unpaid Family Workers | 0 | 0.0% |
| Total | 1,006 | 100.0% |
Employment Status by Age in Belle Rose
According to the labor force statistics for Belle Rose, out of the total population over 16 years of age (1,697), 64.9% or 1,101 individuals are in the labor force, with 6.8% or 75 of them unemployed. The age group with the highest labor force participation rate is 20 to 24 years, with 100.0% or 11 individuals in the labor force. Within the labor force, the 45 to 54 years age range has the highest percentage of unemployed individuals, with 14.7% or 50 of them being unemployed.
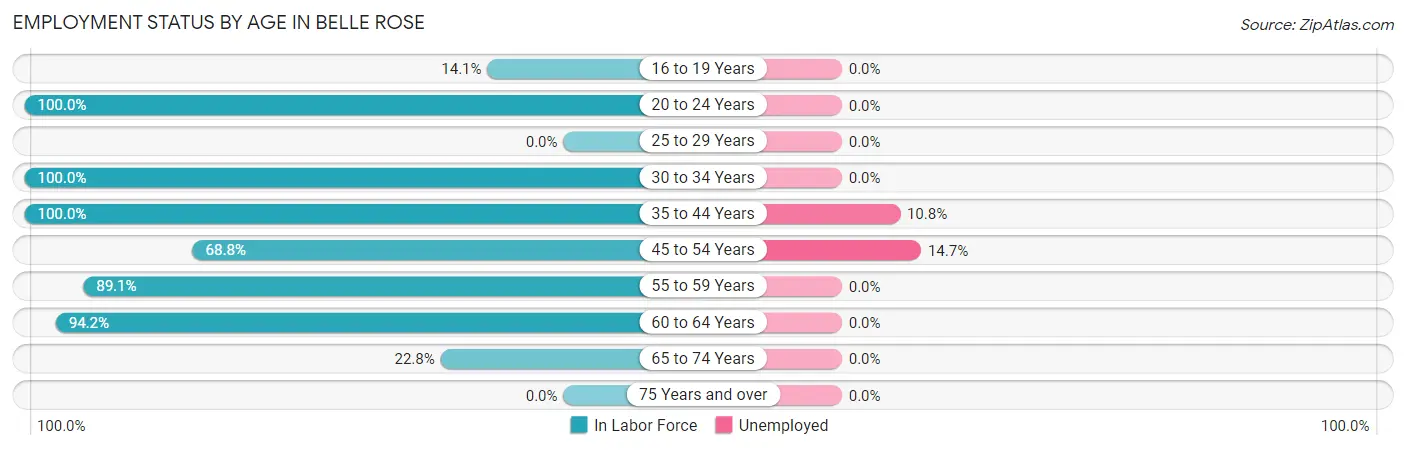
| Age Bracket | In Labor Force | Unemployed |
| 16 to 19 Years | 11 (14.1%) | 0 (0.0%) |
| 20 to 24 Years | 11 (100.0%) | 0 (0.0%) |
| 25 to 29 Years | 0 (0.0%) | 0 (0.0%) |
| 30 to 34 Years | 171 (100.0%) | 0 (0.0%) |
| 35 to 44 Years | 231 (100.0%) | 25 (10.8%) |
| 45 to 54 Years | 340 (68.8%) | 50 (14.7%) |
| 55 to 59 Years | 106 (89.1%) | 0 (0.0%) |
| 60 to 64 Years | 163 (94.2%) | 0 (0.0%) |
| 65 to 74 Years | 69 (22.8%) | 0 (0.0%) |
| 75 Years and over | 0 (0.0%) | 0 (0.0%) |
| Total | 1,101 (64.9%) | 75 (6.8%) |
Employment Status by Educational Attainment in Belle Rose
According to labor force statistics for Belle Rose, 85.1% of individuals (1,011) out of the total population between 25 and 64 years of age (1,188) are in the labor force, with 7.4% or 75 of them being unemployed. The group with the highest labor force participation rate are those with the educational attainment of bachelor's degree or higher, with 100.0% or 255 individuals in the labor force. Within the labor force, individuals with college / associate degree education have the highest percentage of unemployment, with 14.2% or 50 of them being unemployed.
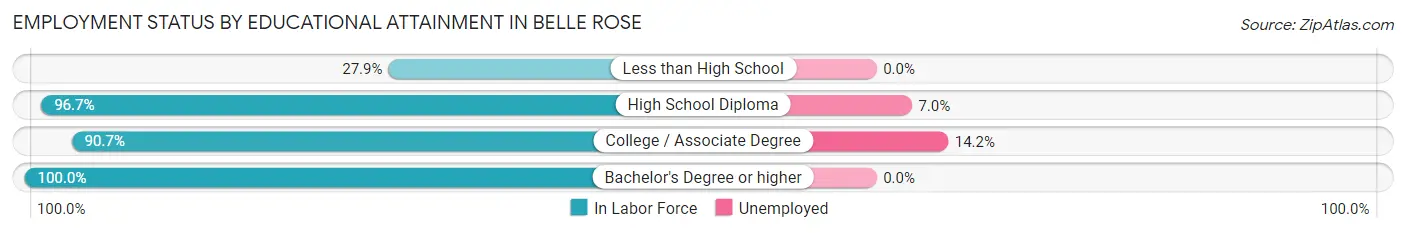
| Educational Attainment | In Labor Force | Unemployed |
| Less than High School | 50 (27.9%) | 0 (0.0%) |
| High School Diploma | 355 (96.7%) | 26 (7.0%) |
| College / Associate Degree | 351 (90.7%) | 55 (14.2%) |
| Bachelor's Degree or higher | 255 (100.0%) | 0 (0.0%) |
| Total | 1,011 (85.1%) | 88 (7.4%) |
Employment Occupations by Sex in Belle Rose
Management, Business, Science and Arts Occupations
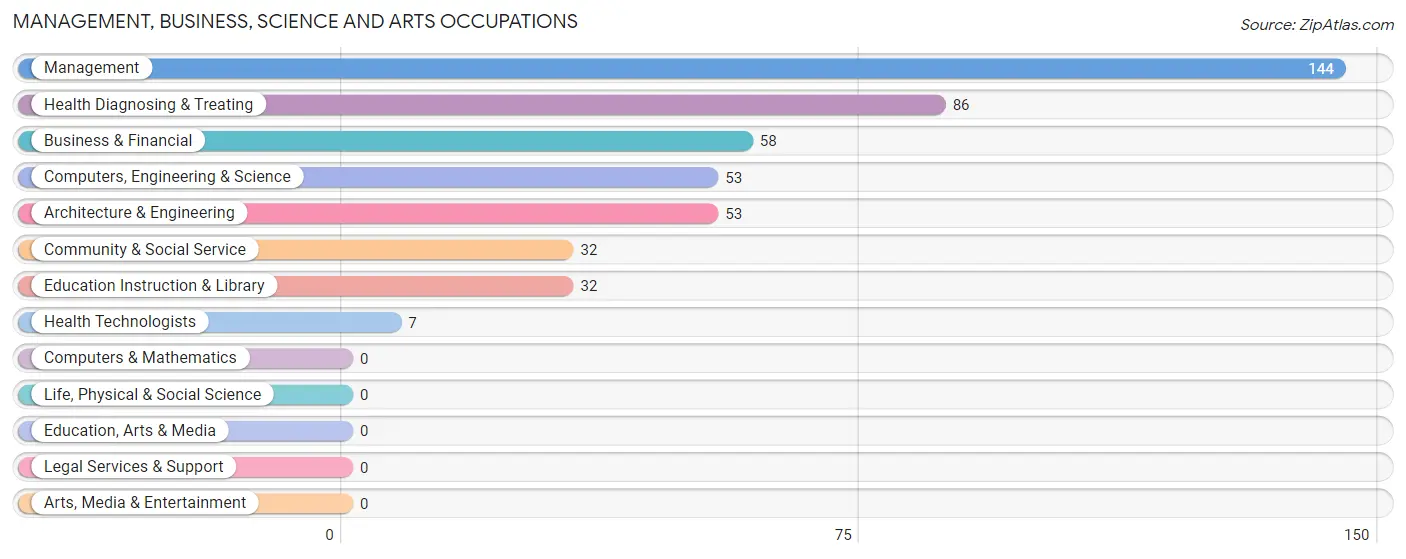
The most common Management, Business, Science and Arts occupations in Belle Rose are Management (144 | 14.0%), Health Diagnosing & Treating (86 | 8.4%), Business & Financial (58 | 5.7%), Computers, Engineering & Science (53 | 5.2%), and Architecture & Engineering (53 | 5.2%).
Management, Business, Science and Arts Occupations by Sex
Within the Management, Business, Science and Arts occupations in Belle Rose, the most male-oriented occupations are Computers, Engineering & Science (100.0%), Architecture & Engineering (100.0%), and Business & Financial (86.2%), while the most female-oriented occupations are Community & Social Service (100.0%), Education Instruction & Library (100.0%), and Health Diagnosing & Treating (100.0%).
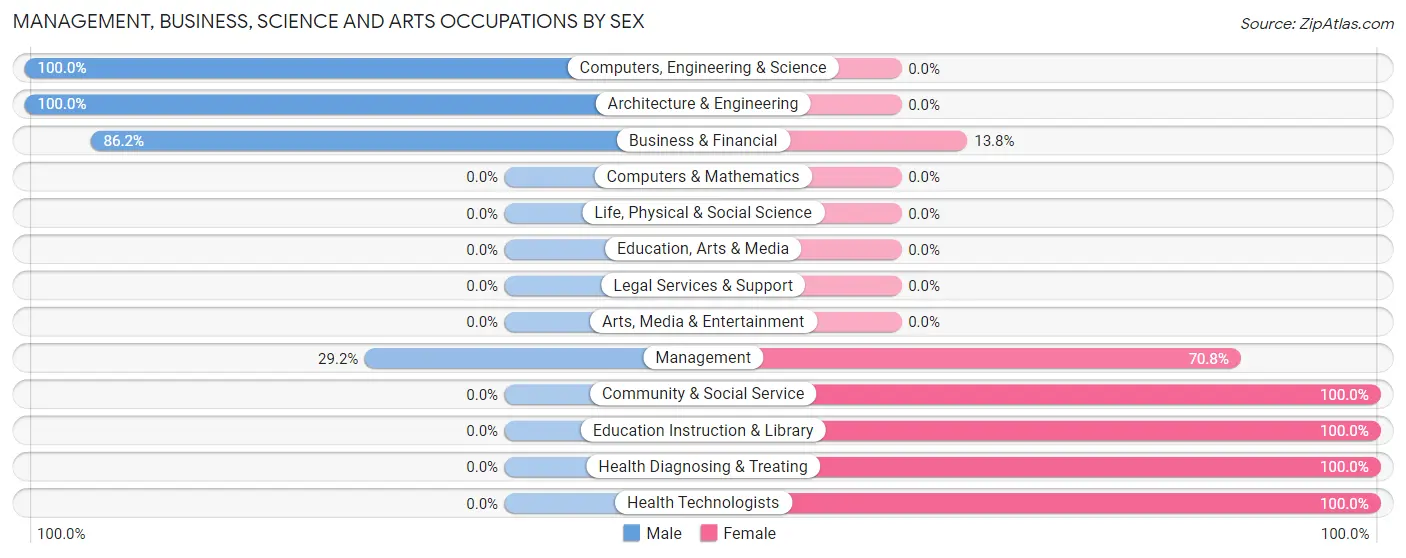
| Occupation | Male | Female |
| Management | 42 (29.2%) | 102 (70.8%) |
| Business & Financial | 50 (86.2%) | 8 (13.8%) |
| Computers, Engineering & Science | 53 (100.0%) | 0 (0.0%) |
| Computers & Mathematics | 0 (0.0%) | 0 (0.0%) |
| Architecture & Engineering | 53 (100.0%) | 0 (0.0%) |
| Life, Physical & Social Science | 0 (0.0%) | 0 (0.0%) |
| Community & Social Service | 0 (0.0%) | 32 (100.0%) |
| Education, Arts & Media | 0 (0.0%) | 0 (0.0%) |
| Legal Services & Support | 0 (0.0%) | 0 (0.0%) |
| Education Instruction & Library | 0 (0.0%) | 32 (100.0%) |
| Arts, Media & Entertainment | 0 (0.0%) | 0 (0.0%) |
| Health Diagnosing & Treating | 0 (0.0%) | 86 (100.0%) |
| Health Technologists | 0 (0.0%) | 7 (100.0%) |
| Total (Category) | 145 (38.9%) | 228 (61.1%) |
| Total (Overall) | 407 (39.6%) | 620 (60.4%) |
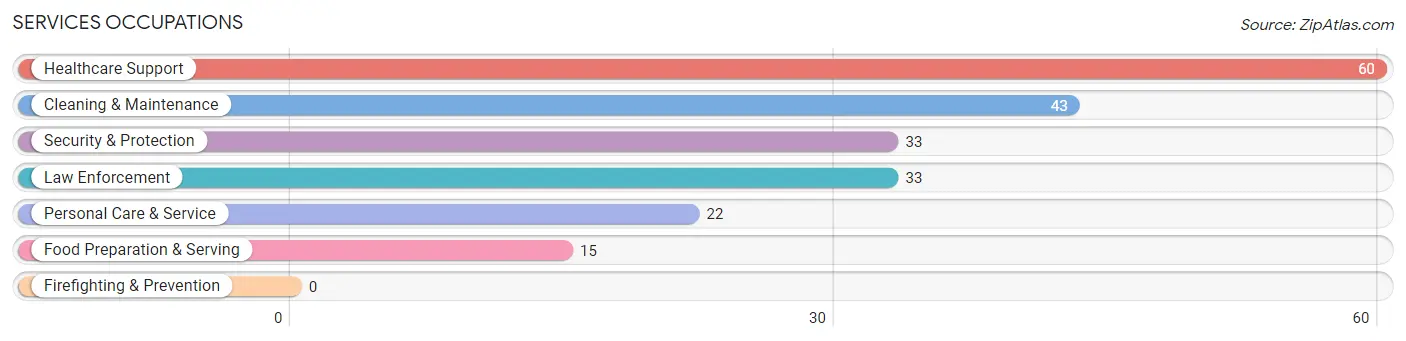
Services Occupations
The most common Services occupations in Belle Rose are Healthcare Support (60 | 5.8%), Cleaning & Maintenance (43 | 4.2%), Security & Protection (33 | 3.2%), Law Enforcement (33 | 3.2%), and Personal Care & Service (22 | 2.1%).
Services Occupations by Sex
Within the Services occupations in Belle Rose, the most male-oriented occupations are Security & Protection (100.0%), Law Enforcement (100.0%), and Cleaning & Maintenance (25.6%), while the most female-oriented occupations are Healthcare Support (100.0%), Food Preparation & Serving (100.0%), and Personal Care & Service (100.0%).
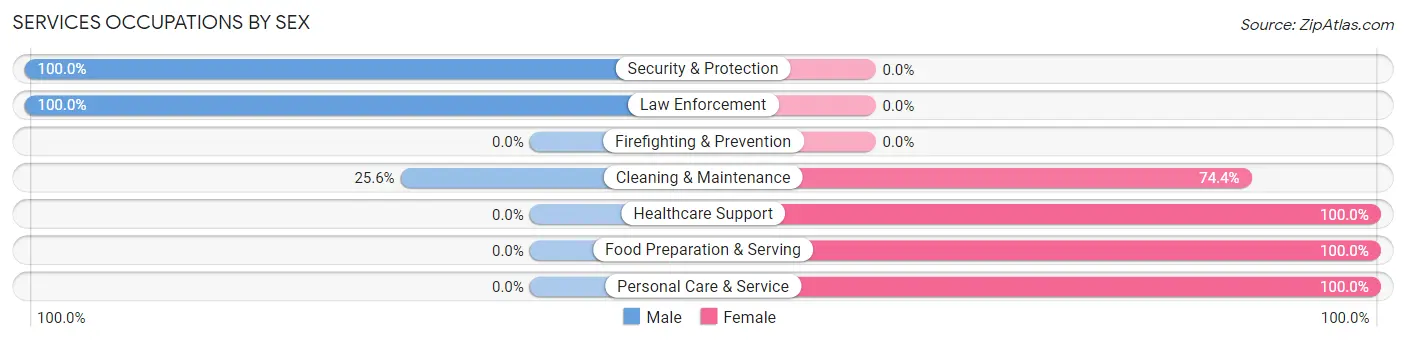
| Occupation | Male | Female |
| Healthcare Support | 0 (0.0%) | 60 (100.0%) |
| Security & Protection | 33 (100.0%) | 0 (0.0%) |
| Firefighting & Prevention | 0 (0.0%) | 0 (0.0%) |
| Law Enforcement | 33 (100.0%) | 0 (0.0%) |
| Food Preparation & Serving | 0 (0.0%) | 15 (100.0%) |
| Cleaning & Maintenance | 11 (25.6%) | 32 (74.4%) |
| Personal Care & Service | 0 (0.0%) | 22 (100.0%) |
| Total (Category) | 44 (25.4%) | 129 (74.6%) |
| Total (Overall) | 407 (39.6%) | 620 (60.4%) |
Sales and Office Occupations
The most common Sales and Office occupations in Belle Rose are Office & Administration (256 | 24.9%), and Sales & Related (33 | 3.2%).

Sales and Office Occupations by Sex

| Occupation | Male | Female |
| Sales & Related | 12 (36.4%) | 21 (63.6%) |
| Office & Administration | 40 (15.6%) | 216 (84.4%) |
| Total (Category) | 52 (18.0%) | 237 (82.0%) |
| Total (Overall) | 407 (39.6%) | 620 (60.4%) |
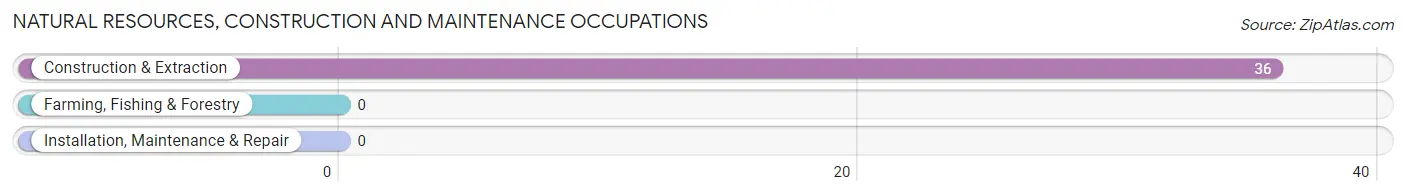
Natural Resources, Construction and Maintenance Occupations
The most common Natural Resources, Construction and Maintenance occupations in Belle Rose are , and Construction & Extraction (36 | 3.5%).
Natural Resources, Construction and Maintenance Occupations by Sex

| Occupation | Male | Female |
| Farming, Fishing & Forestry | 0 (0.0%) | 0 (0.0%) |
| Construction & Extraction | 36 (100.0%) | 0 (0.0%) |
| Installation, Maintenance & Repair | 0 (0.0%) | 0 (0.0%) |
| Total (Category) | 36 (100.0%) | 0 (0.0%) |
| Total (Overall) | 407 (39.6%) | 620 (60.4%) |
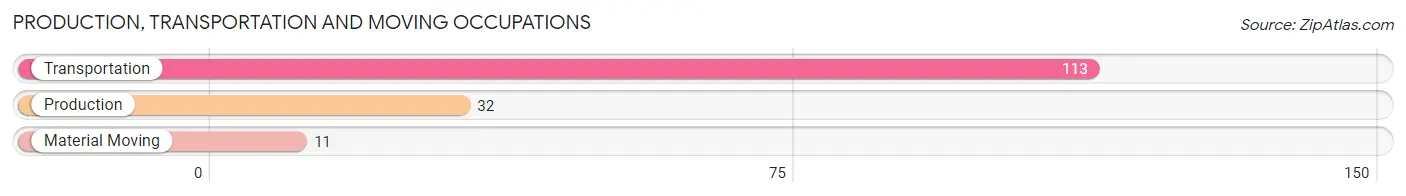
Production, Transportation and Moving Occupations
The most common Production, Transportation and Moving occupations in Belle Rose are Transportation (113 | 11.0%), Production (32 | 3.1%), and Material Moving (11 | 1.1%).
Production, Transportation and Moving Occupations by Sex
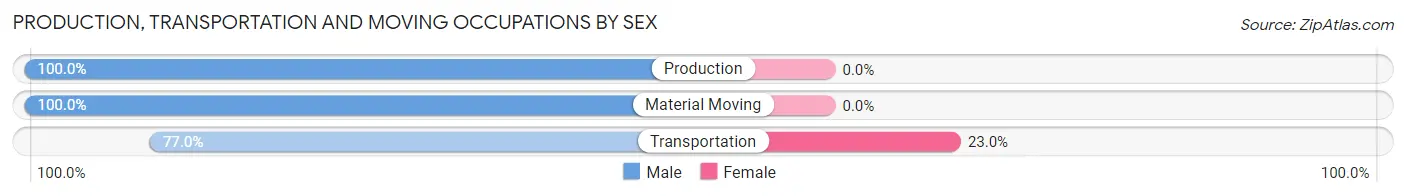
| Occupation | Male | Female |
| Production | 32 (100.0%) | 0 (0.0%) |
| Transportation | 87 (77.0%) | 26 (23.0%) |
| Material Moving | 11 (100.0%) | 0 (0.0%) |
| Total (Category) | 130 (83.3%) | 26 (16.7%) |
| Total (Overall) | 407 (39.6%) | 620 (60.4%) |
Employment Industries by Sex in Belle Rose
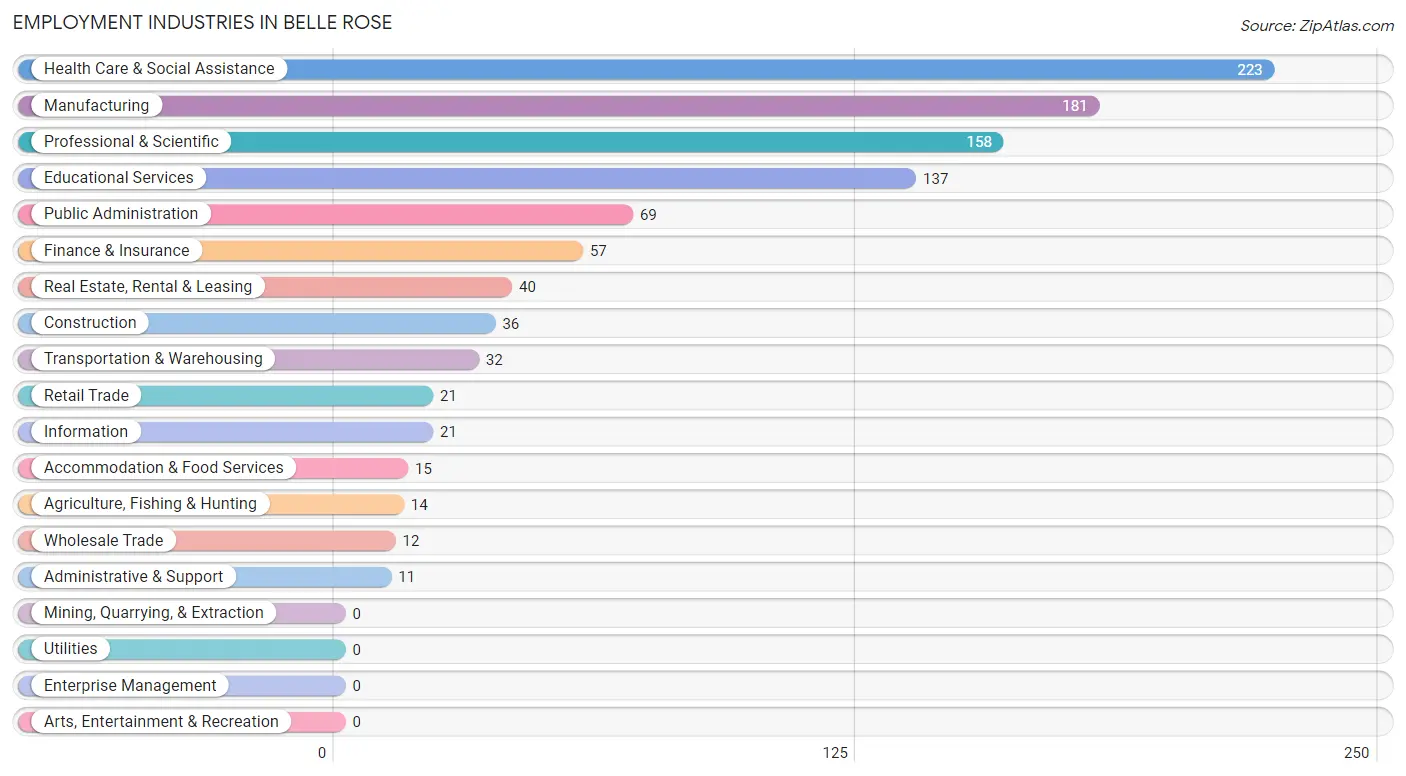
Employment Industries in Belle Rose
The major employment industries in Belle Rose include Health Care & Social Assistance (223 | 21.7%), Manufacturing (181 | 17.6%), Professional & Scientific (158 | 15.4%), Educational Services (137 | 13.3%), and Public Administration (69 | 6.7%).
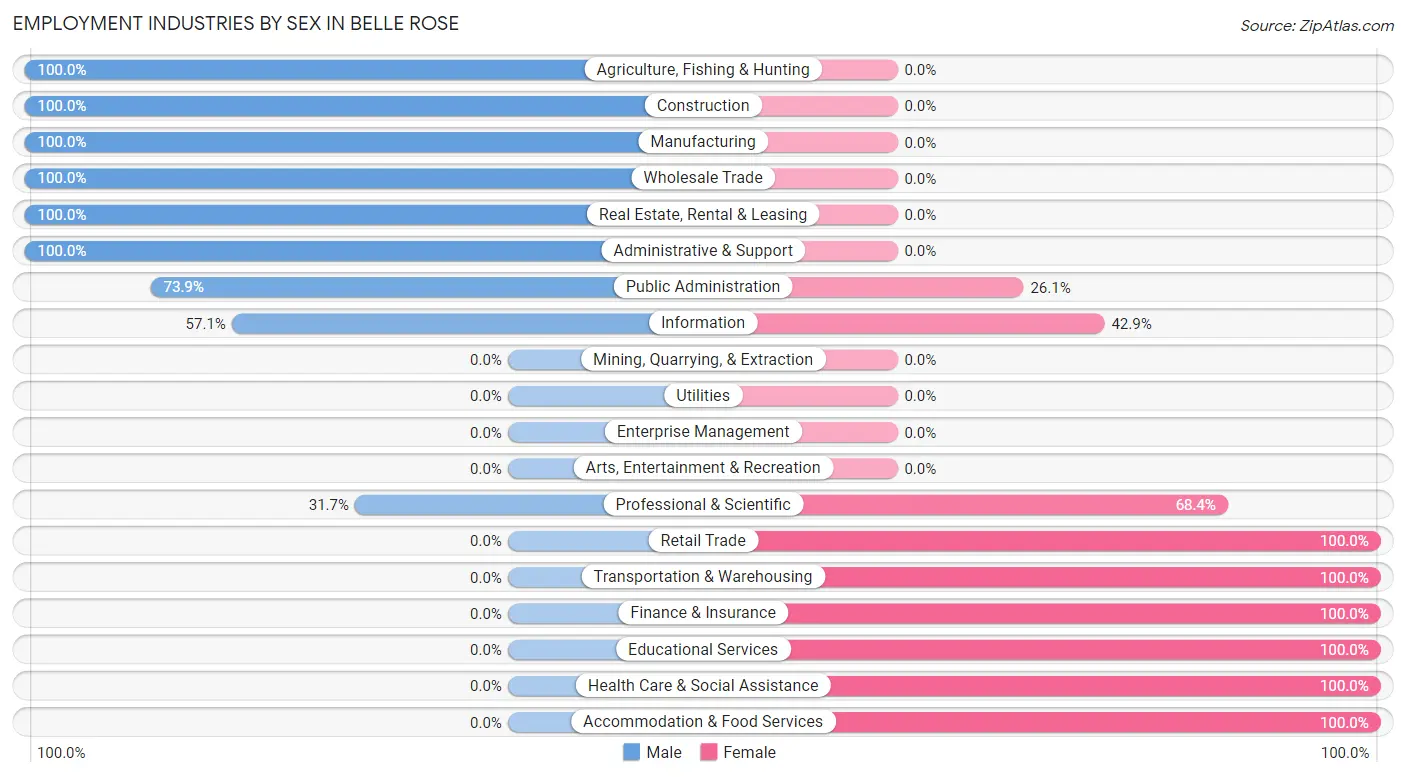
Employment Industries by Sex in Belle Rose
The Belle Rose industries that see more men than women are Agriculture, Fishing & Hunting (100.0%), Construction (100.0%), and Manufacturing (100.0%), whereas the industries that tend to have a higher number of women are Retail Trade (100.0%), Transportation & Warehousing (100.0%), and Finance & Insurance (100.0%).
| Industry | Male | Female |
| Agriculture, Fishing & Hunting | 14 (100.0%) | 0 (0.0%) |
| Mining, Quarrying, & Extraction | 0 (0.0%) | 0 (0.0%) |
| Construction | 36 (100.0%) | 0 (0.0%) |
| Manufacturing | 181 (100.0%) | 0 (0.0%) |
| Wholesale Trade | 12 (100.0%) | 0 (0.0%) |
| Retail Trade | 0 (0.0%) | 21 (100.0%) |
| Transportation & Warehousing | 0 (0.0%) | 32 (100.0%) |
| Utilities | 0 (0.0%) | 0 (0.0%) |
| Information | 12 (57.1%) | 9 (42.9%) |
| Finance & Insurance | 0 (0.0%) | 57 (100.0%) |
| Real Estate, Rental & Leasing | 40 (100.0%) | 0 (0.0%) |
| Professional & Scientific | 50 (31.7%) | 108 (68.3%) |
| Enterprise Management | 0 (0.0%) | 0 (0.0%) |
| Administrative & Support | 11 (100.0%) | 0 (0.0%) |
| Educational Services | 0 (0.0%) | 137 (100.0%) |
| Health Care & Social Assistance | 0 (0.0%) | 223 (100.0%) |
| Arts, Entertainment & Recreation | 0 (0.0%) | 0 (0.0%) |
| Accommodation & Food Services | 0 (0.0%) | 15 (100.0%) |
| Public Administration | 51 (73.9%) | 18 (26.1%) |
| Total | 407 (39.6%) | 620 (60.4%) |
Education in Belle Rose
School Enrollment in Belle Rose
The most common levels of schooling among the 394 students in Belle Rose are middle school (143 | 36.3%), high school (125 | 31.7%), and elementary school (63 | 16.0%).
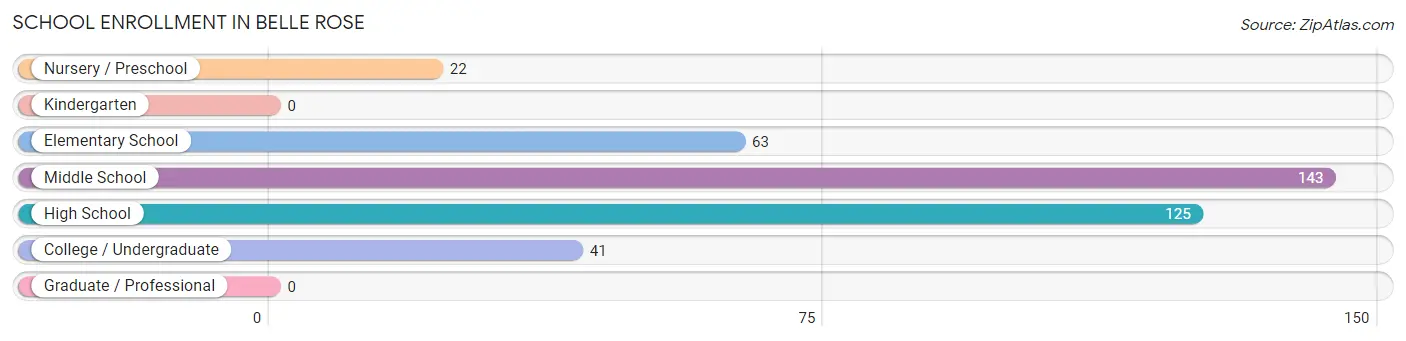
| School Level | # Students | % Students |
| Nursery / Preschool | 22 | 5.6% |
| Kindergarten | 0 | 0.0% |
| Elementary School | 63 | 16.0% |
| Middle School | 143 | 36.3% |
| High School | 125 | 31.7% |
| College / Undergraduate | 41 | 10.4% |
| Graduate / Professional | 0 | 0.0% |
| Total | 394 | 100.0% |
School Enrollment by Age by Funding Source in Belle Rose
Out of a total of 394 students who are enrolled in schools in Belle Rose, 65 (16.5%) attend a private institution, while the remaining 329 (83.5%) are enrolled in public schools. The age group of 15 to 17 year olds has the highest likelihood of being enrolled in private schools, with 36 (61.0% in the age bracket) enrolled. Conversely, the age group of 3 to 4 year olds has the lowest likelihood of being enrolled in a private school, with 22 (100.0% in the age bracket) attending a public institution.
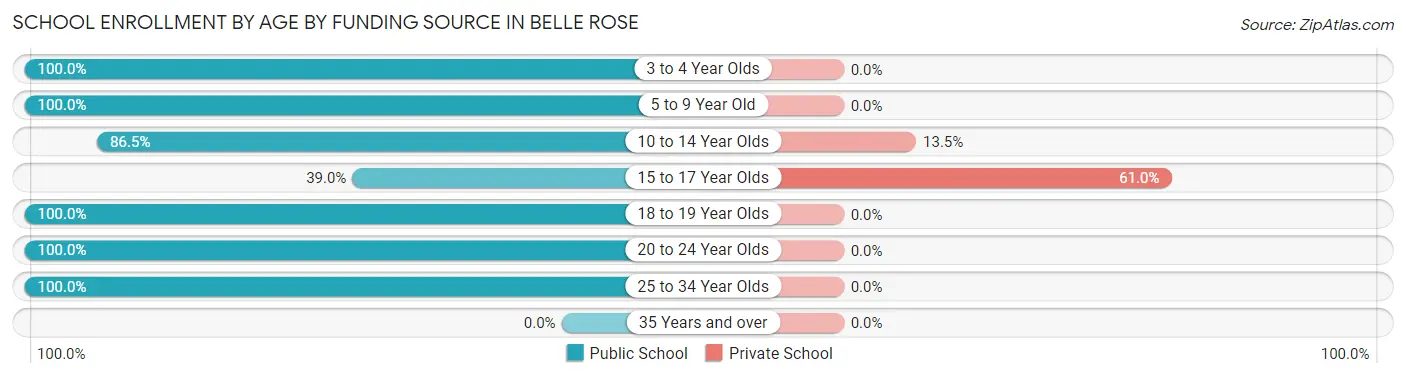
| Age Bracket | Public School | Private School |
| 3 to 4 Year Olds | 22 (100.0%) | 0 (0.0%) |
| 5 to 9 Year Old | 46 (100.0%) | 0 (0.0%) |
| 10 to 14 Year Olds | 186 (86.5%) | 29 (13.5%) |
| 15 to 17 Year Olds | 23 (39.0%) | 36 (61.0%) |
| 18 to 19 Year Olds | 11 (100.0%) | 0 (0.0%) |
| 20 to 24 Year Olds | 11 (100.0%) | 0 (0.0%) |
| 25 to 34 Year Olds | 30 (100.0%) | 0 (0.0%) |
| 35 Years and over | 0 (0.0%) | 0 (0.0%) |
| Total | 329 (83.5%) | 65 (16.5%) |
Educational Attainment by Field of Study in Belle Rose
Arts & humanities (101 | 32.0%), education (98 | 31.0%), business (66 | 20.9%), engineering (28 | 8.9%), and psychology (12 | 3.8%) are the most common fields of study among 316 individuals in Belle Rose who have obtained a bachelor's degree or higher.
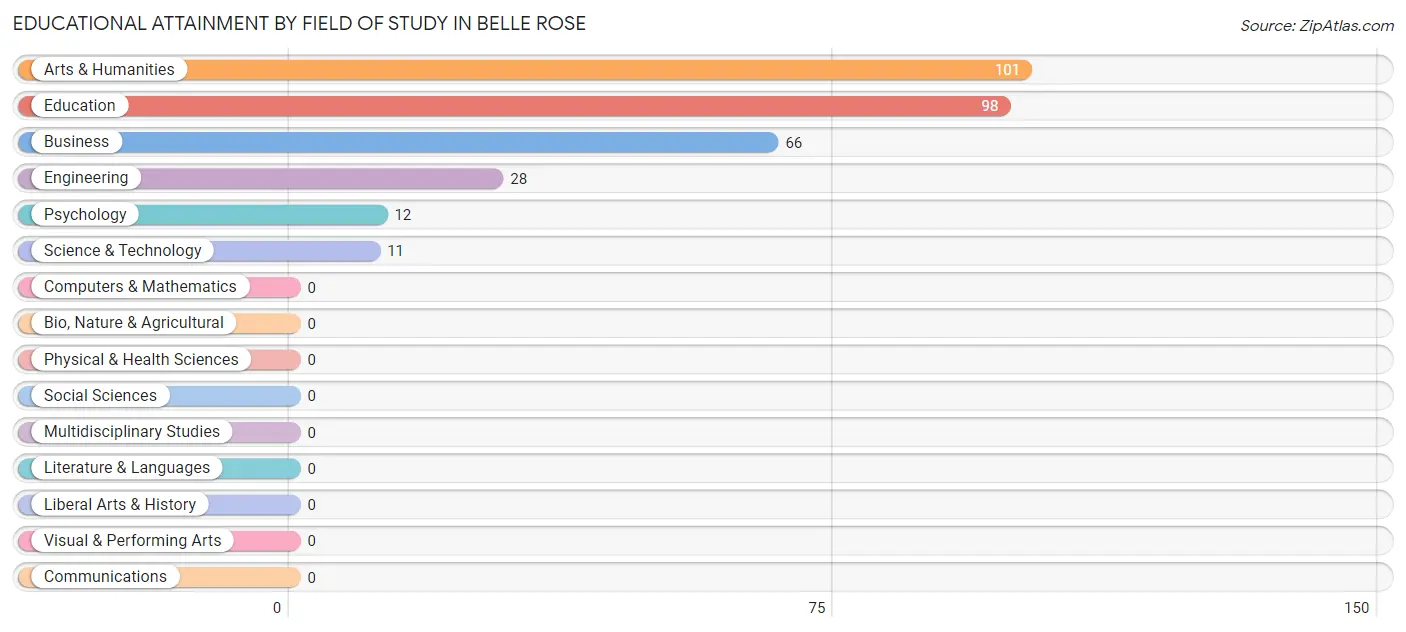
| Field of Study | # Graduates | % Graduates |
| Computers & Mathematics | 0 | 0.0% |
| Bio, Nature & Agricultural | 0 | 0.0% |
| Physical & Health Sciences | 0 | 0.0% |
| Psychology | 12 | 3.8% |
| Social Sciences | 0 | 0.0% |
| Engineering | 28 | 8.9% |
| Multidisciplinary Studies | 0 | 0.0% |
| Science & Technology | 11 | 3.5% |
| Business | 66 | 20.9% |
| Education | 98 | 31.0% |
| Literature & Languages | 0 | 0.0% |
| Liberal Arts & History | 0 | 0.0% |
| Visual & Performing Arts | 0 | 0.0% |
| Communications | 0 | 0.0% |
| Arts & Humanities | 101 | 32.0% |
| Total | 316 | 100.0% |
Transportation & Commute in Belle Rose
Vehicle Availability by Sex in Belle Rose
The most prevalent vehicle ownership categories in Belle Rose are males with 4 vehicles (144, accounting for 35.4%) and females with 4 vehicles (170, making up 24.0%).
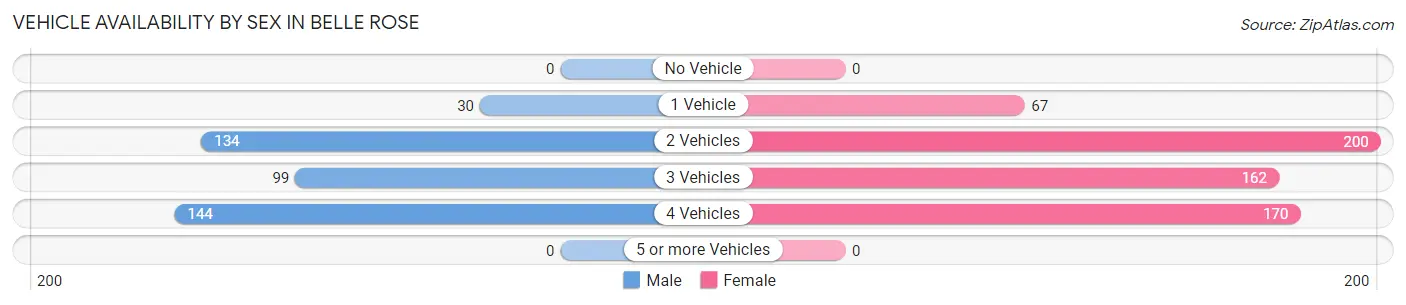
| Vehicles Available | Male | Female |
| No Vehicle | 0 (0.0%) | 0 (0.0%) |
| 1 Vehicle | 30 (7.4%) | 67 (11.2%) |
| 2 Vehicles | 134 (32.9%) | 200 (33.4%) |
| 3 Vehicles | 99 (24.3%) | 162 (27.1%) |
| 4 Vehicles | 144 (35.4%) | 170 (28.4%) |
| 5 or more Vehicles | 0 (0.0%) | 0 (0.0%) |
| Total | 407 (100.0%) | 599 (100.0%) |
Commute Time in Belle Rose
The most frequently occuring commute durations in Belle Rose are 15 to 19 minutes (218 commuters, 21.7%), 30 to 34 minutes (180 commuters, 17.9%), and 5 to 9 minutes (160 commuters, 15.9%).
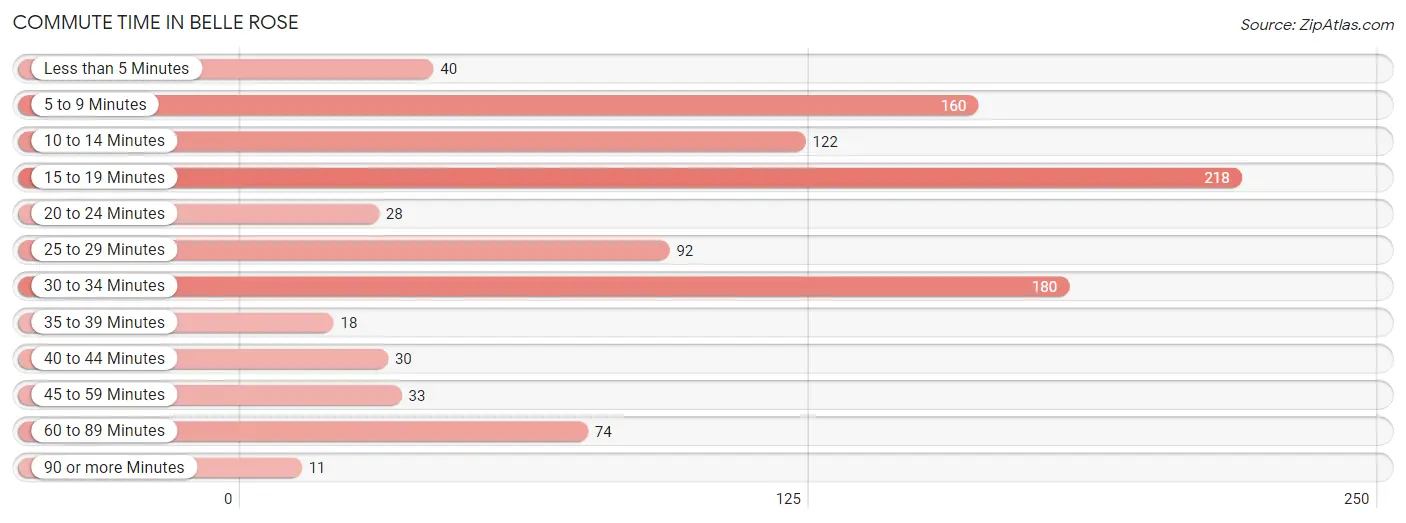
| Commute Time | # Commuters | % Commuters |
| Less than 5 Minutes | 40 | 4.0% |
| 5 to 9 Minutes | 160 | 15.9% |
| 10 to 14 Minutes | 122 | 12.1% |
| 15 to 19 Minutes | 218 | 21.7% |
| 20 to 24 Minutes | 28 | 2.8% |
| 25 to 29 Minutes | 92 | 9.1% |
| 30 to 34 Minutes | 180 | 17.9% |
| 35 to 39 Minutes | 18 | 1.8% |
| 40 to 44 Minutes | 30 | 3.0% |
| 45 to 59 Minutes | 33 | 3.3% |
| 60 to 89 Minutes | 74 | 7.4% |
| 90 or more Minutes | 11 | 1.1% |
Commute Time by Sex in Belle Rose
The most common commute times in Belle Rose are 30 to 34 minutes (119 commuters, 29.2%) for males and 5 to 9 minutes (124 commuters, 20.7%) for females.
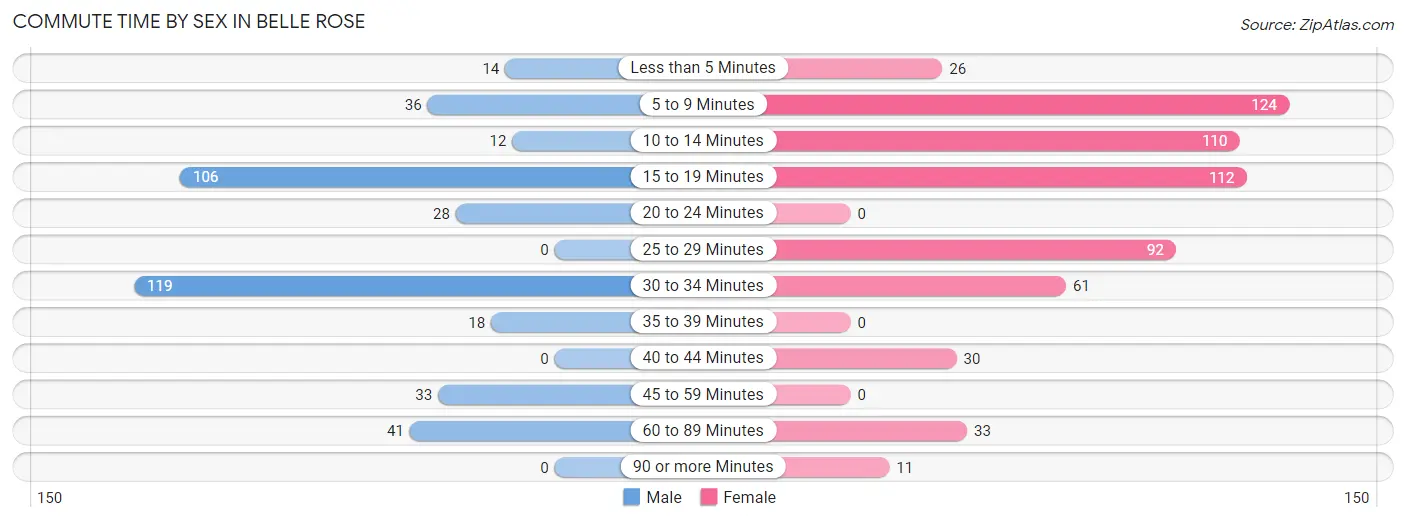
| Commute Time | Male | Female |
| Less than 5 Minutes | 14 (3.4%) | 26 (4.3%) |
| 5 to 9 Minutes | 36 (8.8%) | 124 (20.7%) |
| 10 to 14 Minutes | 12 (2.9%) | 110 (18.4%) |
| 15 to 19 Minutes | 106 (26.0%) | 112 (18.7%) |
| 20 to 24 Minutes | 28 (6.9%) | 0 (0.0%) |
| 25 to 29 Minutes | 0 (0.0%) | 92 (15.4%) |
| 30 to 34 Minutes | 119 (29.2%) | 61 (10.2%) |
| 35 to 39 Minutes | 18 (4.4%) | 0 (0.0%) |
| 40 to 44 Minutes | 0 (0.0%) | 30 (5.0%) |
| 45 to 59 Minutes | 33 (8.1%) | 0 (0.0%) |
| 60 to 89 Minutes | 41 (10.1%) | 33 (5.5%) |
| 90 or more Minutes | 0 (0.0%) | 11 (1.8%) |
Time of Departure to Work by Sex in Belle Rose
The most frequent times of departure to work in Belle Rose are 12:00 AM to 4:59 AM (112, 27.5%) for males and 7:00 AM to 7:29 AM (197, 32.9%) for females.
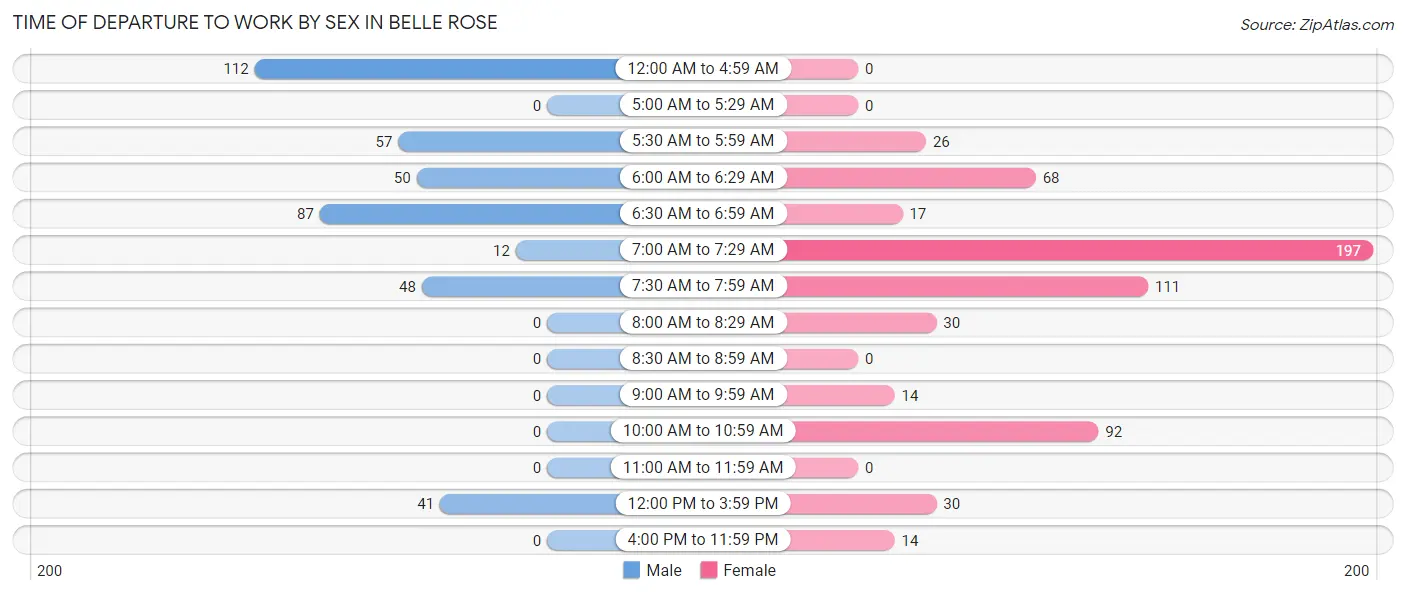
| Time of Departure | Male | Female |
| 12:00 AM to 4:59 AM | 112 (27.5%) | 0 (0.0%) |
| 5:00 AM to 5:29 AM | 0 (0.0%) | 0 (0.0%) |
| 5:30 AM to 5:59 AM | 57 (14.0%) | 26 (4.3%) |
| 6:00 AM to 6:29 AM | 50 (12.3%) | 68 (11.4%) |
| 6:30 AM to 6:59 AM | 87 (21.4%) | 17 (2.8%) |
| 7:00 AM to 7:29 AM | 12 (2.9%) | 197 (32.9%) |
| 7:30 AM to 7:59 AM | 48 (11.8%) | 111 (18.5%) |
| 8:00 AM to 8:29 AM | 0 (0.0%) | 30 (5.0%) |
| 8:30 AM to 8:59 AM | 0 (0.0%) | 0 (0.0%) |
| 9:00 AM to 9:59 AM | 0 (0.0%) | 14 (2.3%) |
| 10:00 AM to 10:59 AM | 0 (0.0%) | 92 (15.4%) |
| 11:00 AM to 11:59 AM | 0 (0.0%) | 0 (0.0%) |
| 12:00 PM to 3:59 PM | 41 (10.1%) | 30 (5.0%) |
| 4:00 PM to 11:59 PM | 0 (0.0%) | 14 (2.3%) |
| Total | 407 (100.0%) | 599 (100.0%) |
Housing Occupancy in Belle Rose
Occupancy by Ownership in Belle Rose
Of the total 807 dwellings in Belle Rose, owner-occupied units account for 746 (92.4%), while renter-occupied units make up 61 (7.6%).
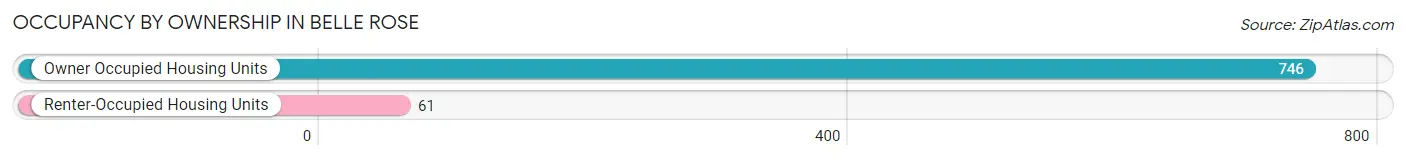
| Occupancy | # Housing Units | % Housing Units |
| Owner Occupied Housing Units | 746 | 92.4% |
| Renter-Occupied Housing Units | 61 | 7.6% |
| Total Occupied Housing Units | 807 | 100.0% |
Occupancy by Household Size in Belle Rose
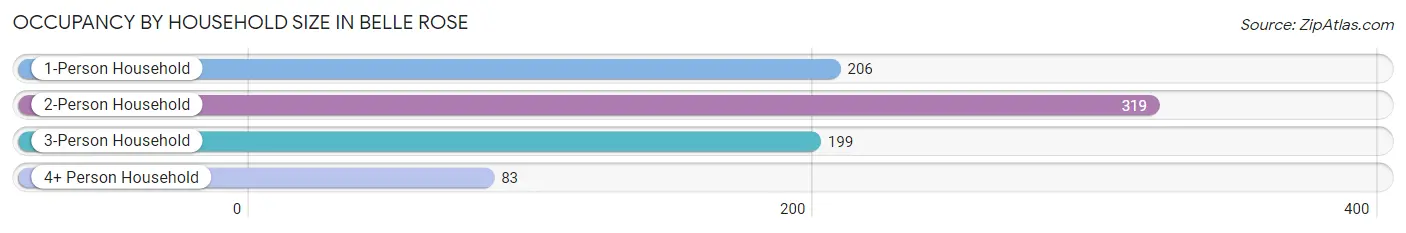
| Household Size | # Housing Units | % Housing Units |
| 1-Person Household | 206 | 25.5% |
| 2-Person Household | 319 | 39.5% |
| 3-Person Household | 199 | 24.7% |
| 4+ Person Household | 83 | 10.3% |
| Total Housing Units | 807 | 100.0% |
Occupancy by Ownership by Household Size in Belle Rose
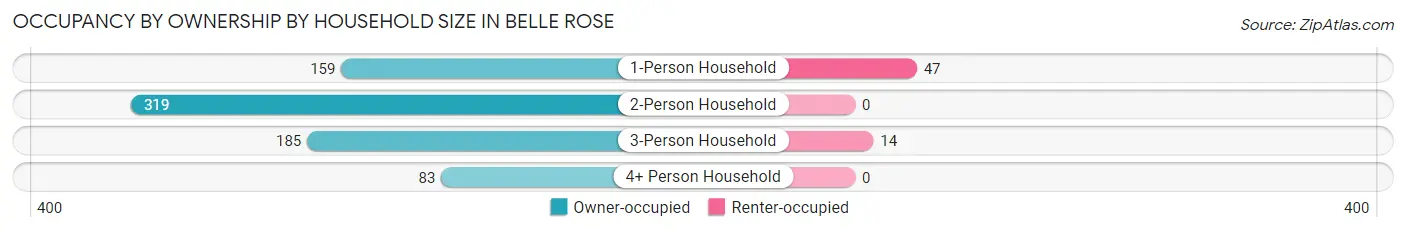
| Household Size | Owner-occupied | Renter-occupied |
| 1-Person Household | 159 (77.2%) | 47 (22.8%) |
| 2-Person Household | 319 (100.0%) | 0 (0.0%) |
| 3-Person Household | 185 (93.0%) | 14 (7.0%) |
| 4+ Person Household | 83 (100.0%) | 0 (0.0%) |
| Total Housing Units | 746 (92.4%) | 61 (7.6%) |
Occupancy by Educational Attainment in Belle Rose
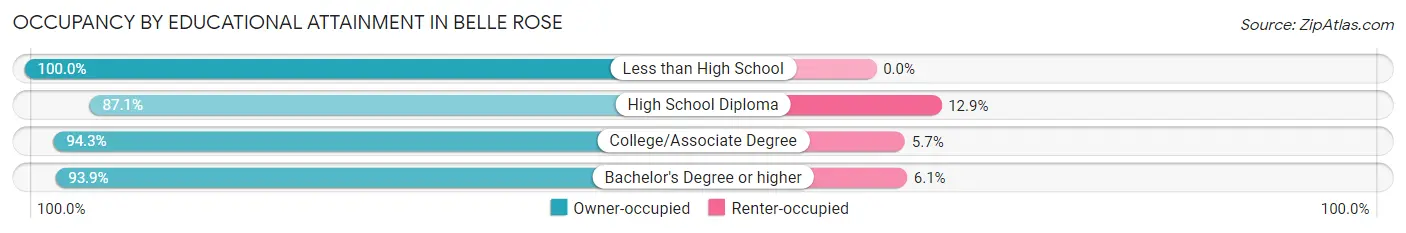
| Household Size | Owner-occupied | Renter-occupied |
| Less than High School | 66 (100.0%) | 0 (0.0%) |
| High School Diploma | 216 (87.1%) | 32 (12.9%) |
| College/Associate Degree | 248 (94.3%) | 15 (5.7%) |
| Bachelor's Degree or higher | 216 (93.9%) | 14 (6.1%) |
Occupancy by Age of Householder in Belle Rose
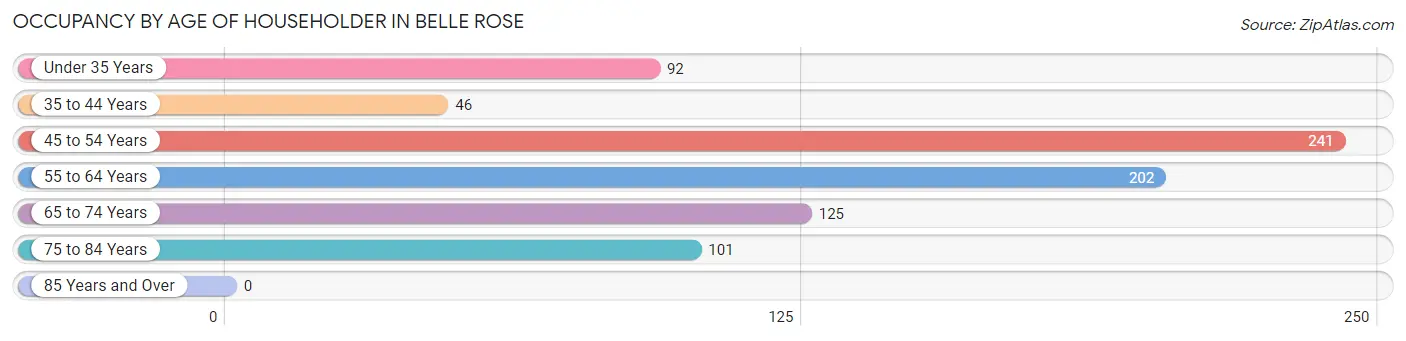
| Age Bracket | # Households | % Households |
| Under 35 Years | 92 | 11.4% |
| 35 to 44 Years | 46 | 5.7% |
| 45 to 54 Years | 241 | 29.9% |
| 55 to 64 Years | 202 | 25.0% |
| 65 to 74 Years | 125 | 15.5% |
| 75 to 84 Years | 101 | 12.5% |
| 85 Years and Over | 0 | 0.0% |
| Total | 807 | 100.0% |
Housing Finances in Belle Rose
Median Income by Occupancy in Belle Rose
| Occupancy Type | # Households | Median Income |
| Owner-Occupied | 746 (92.4%) | $0 |
| Renter-Occupied | 61 (7.6%) | $0 |
| Average | 807 (100.0%) | $0 |
Occupancy by Householder Income Bracket in Belle Rose
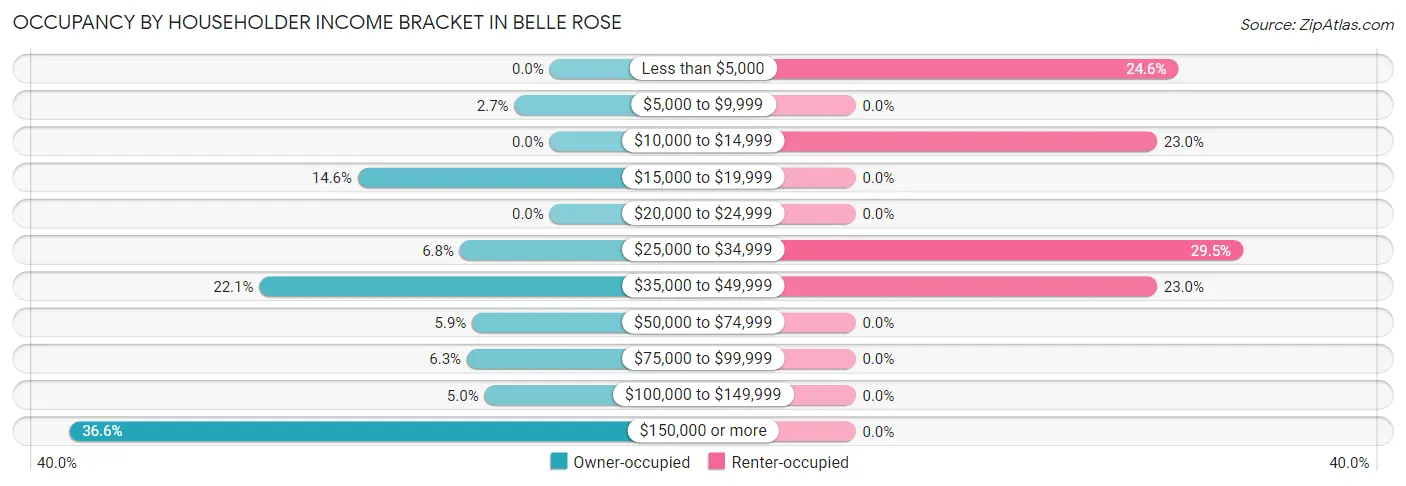
| Income Bracket | Owner-occupied | Renter-occupied |
| Less than $5,000 | 0 (0.0%) | 15 (24.6%) |
| $5,000 to $9,999 | 20 (2.7%) | 0 (0.0%) |
| $10,000 to $14,999 | 0 (0.0%) | 14 (23.0%) |
| $15,000 to $19,999 | 109 (14.6%) | 0 (0.0%) |
| $20,000 to $24,999 | 0 (0.0%) | 0 (0.0%) |
| $25,000 to $34,999 | 51 (6.8%) | 18 (29.5%) |
| $35,000 to $49,999 | 165 (22.1%) | 14 (23.0%) |
| $50,000 to $74,999 | 44 (5.9%) | 0 (0.0%) |
| $75,000 to $99,999 | 47 (6.3%) | 0 (0.0%) |
| $100,000 to $149,999 | 37 (5.0%) | 0 (0.0%) |
| $150,000 or more | 273 (36.6%) | 0 (0.0%) |
| Total | 746 (100.0%) | 61 (100.0%) |
Monthly Housing Cost Tiers in Belle Rose
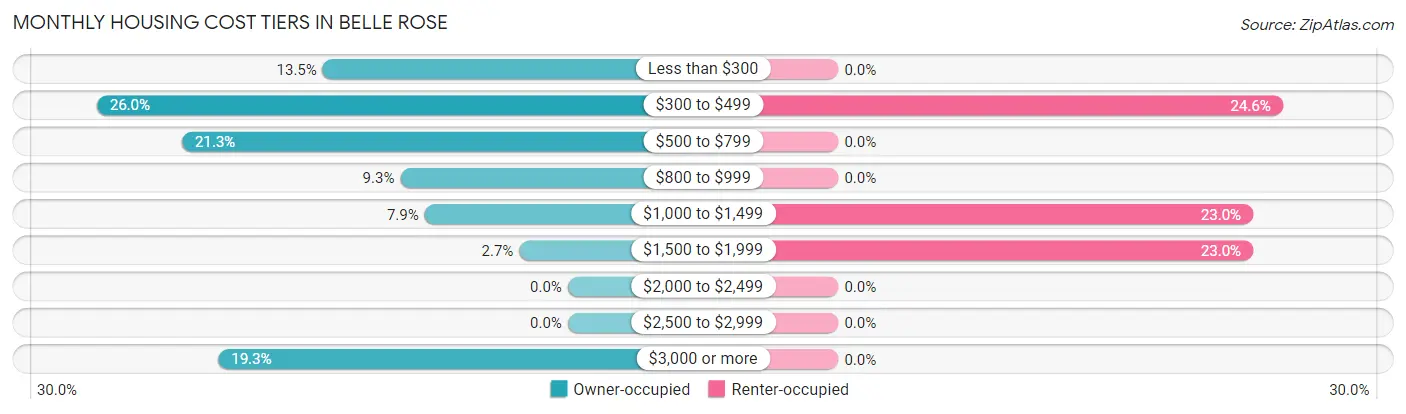
| Monthly Cost | Owner-occupied | Renter-occupied |
| Less than $300 | 101 (13.5%) | 0 (0.0%) |
| $300 to $499 | 194 (26.0%) | 15 (24.6%) |
| $500 to $799 | 159 (21.3%) | 0 (0.0%) |
| $800 to $999 | 69 (9.2%) | 0 (0.0%) |
| $1,000 to $1,499 | 59 (7.9%) | 14 (23.0%) |
| $1,500 to $1,999 | 20 (2.7%) | 14 (23.0%) |
| $2,000 to $2,499 | 0 (0.0%) | 0 (0.0%) |
| $2,500 to $2,999 | 0 (0.0%) | 0 (0.0%) |
| $3,000 or more | 144 (19.3%) | 0 (0.0%) |
| Total | 746 (100.0%) | 61 (100.0%) |
Physical Housing Characteristics in Belle Rose
Housing Structures in Belle Rose
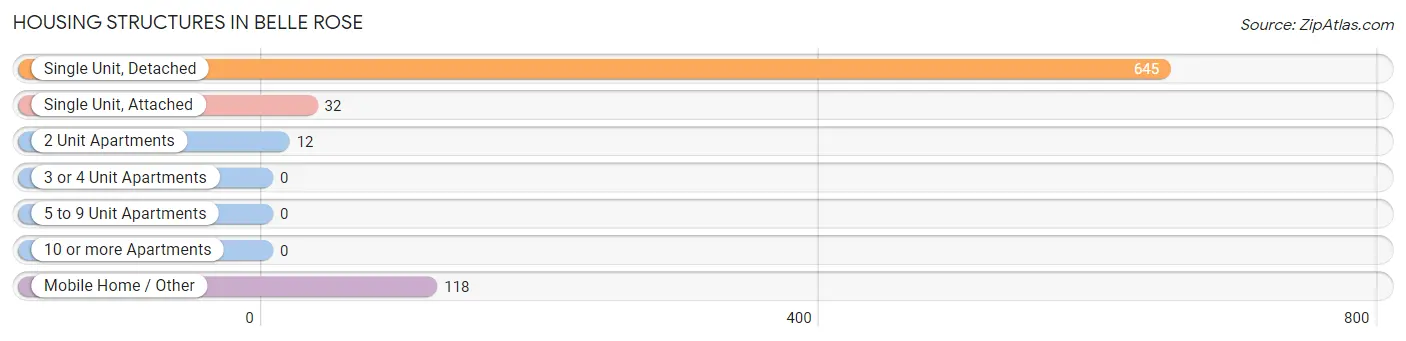
| Structure Type | # Housing Units | % Housing Units |
| Single Unit, Detached | 645 | 79.9% |
| Single Unit, Attached | 32 | 4.0% |
| 2 Unit Apartments | 12 | 1.5% |
| 3 or 4 Unit Apartments | 0 | 0.0% |
| 5 to 9 Unit Apartments | 0 | 0.0% |
| 10 or more Apartments | 0 | 0.0% |
| Mobile Home / Other | 118 | 14.6% |
| Total | 807 | 100.0% |
Housing Structures by Occupancy in Belle Rose
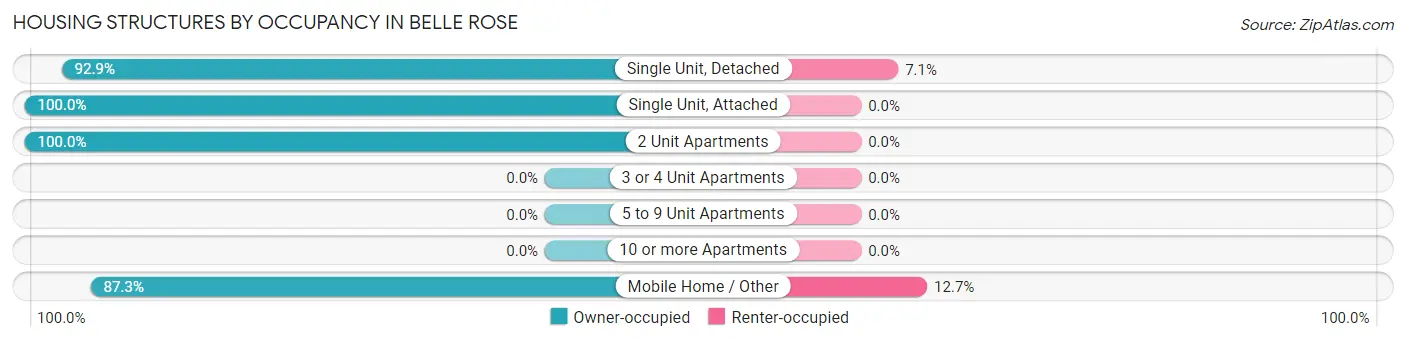
| Structure Type | Owner-occupied | Renter-occupied |
| Single Unit, Detached | 599 (92.9%) | 46 (7.1%) |
| Single Unit, Attached | 32 (100.0%) | 0 (0.0%) |
| 2 Unit Apartments | 12 (100.0%) | 0 (0.0%) |
| 3 or 4 Unit Apartments | 0 (0.0%) | 0 (0.0%) |
| 5 to 9 Unit Apartments | 0 (0.0%) | 0 (0.0%) |
| 10 or more Apartments | 0 (0.0%) | 0 (0.0%) |
| Mobile Home / Other | 103 (87.3%) | 15 (12.7%) |
| Total | 746 (92.4%) | 61 (7.6%) |
Housing Structures by Number of Rooms in Belle Rose
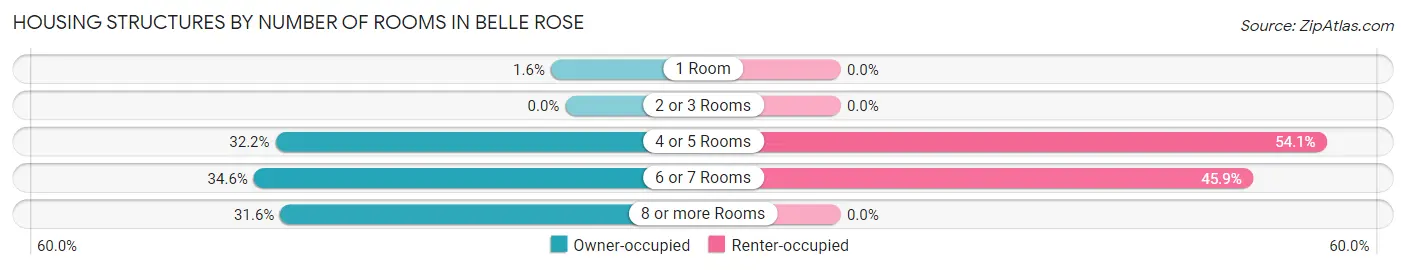
| Number of Rooms | Owner-occupied | Renter-occupied |
| 1 Room | 12 (1.6%) | 0 (0.0%) |
| 2 or 3 Rooms | 0 (0.0%) | 0 (0.0%) |
| 4 or 5 Rooms | 240 (32.2%) | 33 (54.1%) |
| 6 or 7 Rooms | 258 (34.6%) | 28 (45.9%) |
| 8 or more Rooms | 236 (31.6%) | 0 (0.0%) |
| Total | 746 (100.0%) | 61 (100.0%) |
Housing Structure by Heating Type in Belle Rose
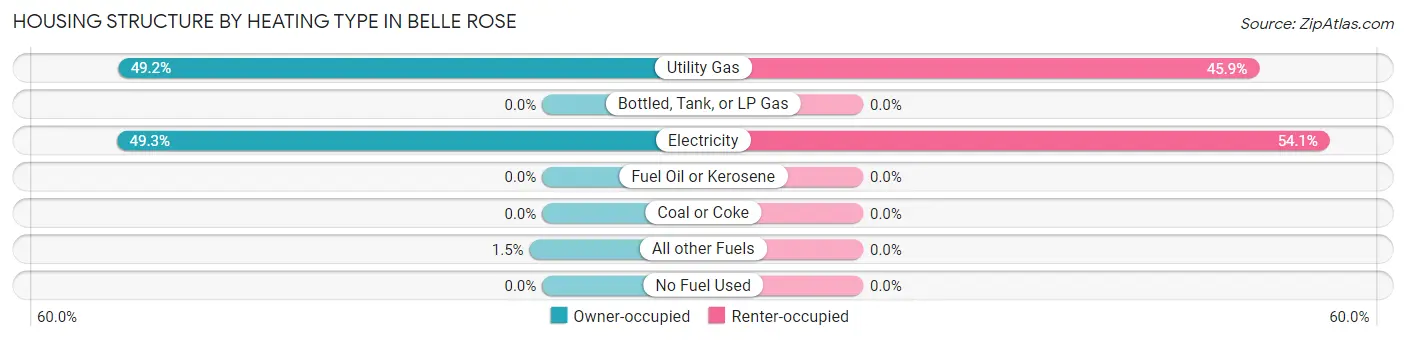
| Heating Type | Owner-occupied | Renter-occupied |
| Utility Gas | 367 (49.2%) | 28 (45.9%) |
| Bottled, Tank, or LP Gas | 0 (0.0%) | 0 (0.0%) |
| Electricity | 368 (49.3%) | 33 (54.1%) |
| Fuel Oil or Kerosene | 0 (0.0%) | 0 (0.0%) |
| Coal or Coke | 0 (0.0%) | 0 (0.0%) |
| All other Fuels | 11 (1.5%) | 0 (0.0%) |
| No Fuel Used | 0 (0.0%) | 0 (0.0%) |
| Total | 746 (100.0%) | 61 (100.0%) |
Household Vehicle Usage in Belle Rose
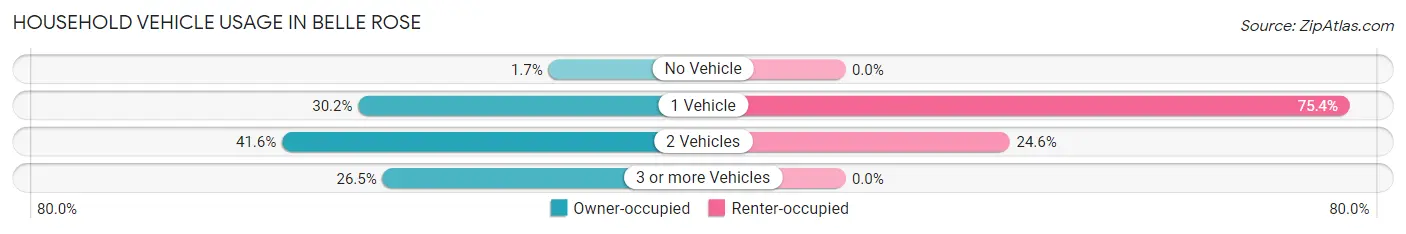
| Vehicles per Household | Owner-occupied | Renter-occupied |
| No Vehicle | 13 (1.7%) | 0 (0.0%) |
| 1 Vehicle | 225 (30.2%) | 46 (75.4%) |
| 2 Vehicles | 310 (41.5%) | 15 (24.6%) |
| 3 or more Vehicles | 198 (26.5%) | 0 (0.0%) |
| Total | 746 (100.0%) | 61 (100.0%) |
Real Estate & Mortgages in Belle Rose
Real Estate and Mortgage Overview in Belle Rose
| Characteristic | Without Mortgage | With Mortgage |
| Housing Units | 502 | 244 |
| Median Property Value | $149,000 | $0 |
| Median Household Income | $48,320 | $146 |
| Monthly Housing Costs | $392 | $144 |
| Real Estate Taxes | - | - |
Property Value by Mortgage Status in Belle Rose
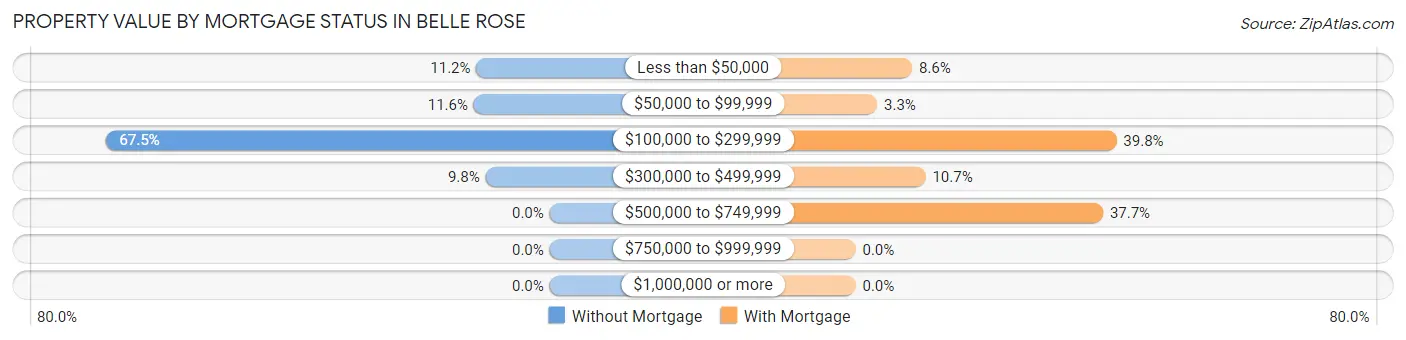
| Property Value | Without Mortgage | With Mortgage |
| Less than $50,000 | 56 (11.2%) | 21 (8.6%) |
| $50,000 to $99,999 | 58 (11.6%) | 8 (3.3%) |
| $100,000 to $299,999 | 339 (67.5%) | 97 (39.8%) |
| $300,000 to $499,999 | 49 (9.8%) | 26 (10.7%) |
| $500,000 to $749,999 | 0 (0.0%) | 92 (37.7%) |
| $750,000 to $999,999 | 0 (0.0%) | 0 (0.0%) |
| $1,000,000 or more | 0 (0.0%) | 0 (0.0%) |
| Total | 502 (100.0%) | 244 (100.0%) |
Household Income by Mortgage Status in Belle Rose
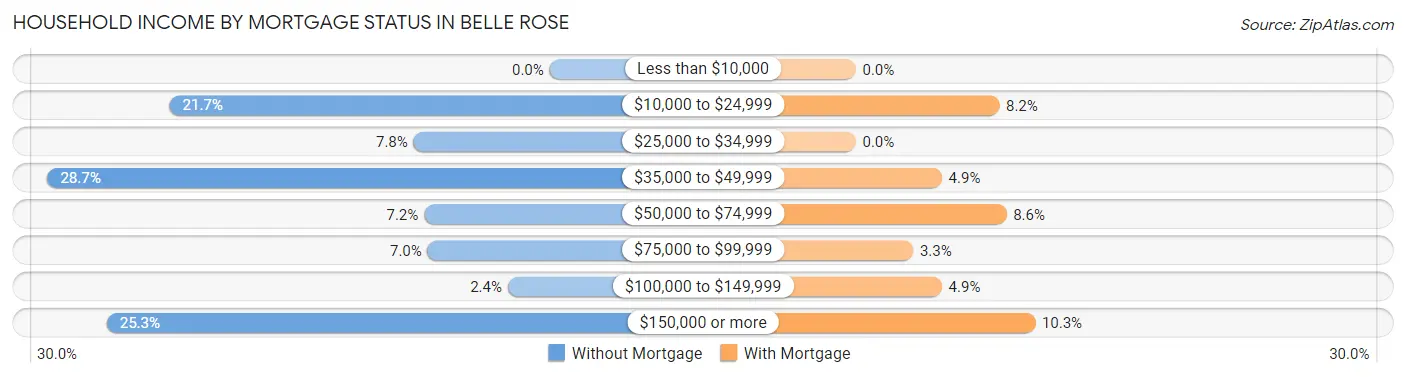
| Household Income | Without Mortgage | With Mortgage |
| Less than $10,000 | 0 (0.0%) | 0 (0.0%) |
| $10,000 to $24,999 | 109 (21.7%) | 20 (8.2%) |
| $25,000 to $34,999 | 39 (7.8%) | 0 (0.0%) |
| $35,000 to $49,999 | 144 (28.7%) | 12 (4.9%) |
| $50,000 to $74,999 | 36 (7.2%) | 21 (8.6%) |
| $75,000 to $99,999 | 35 (7.0%) | 8 (3.3%) |
| $100,000 to $149,999 | 12 (2.4%) | 12 (4.9%) |
| $150,000 or more | 127 (25.3%) | 25 (10.2%) |
| Total | 502 (100.0%) | 244 (100.0%) |
Property Value to Household Income Ratio in Belle Rose
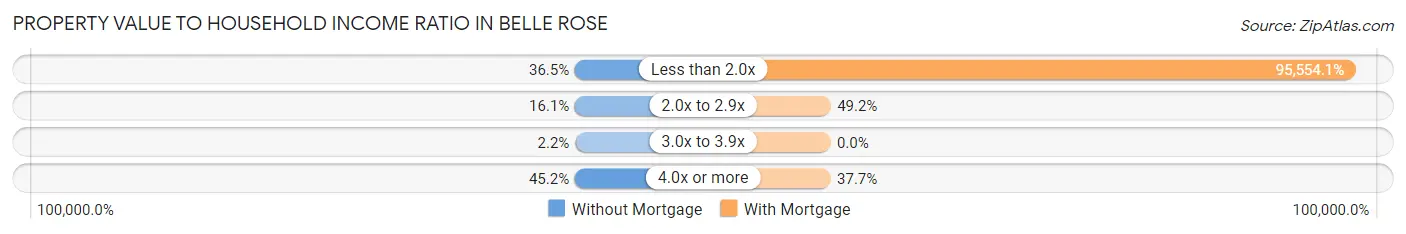
| Value-to-Income Ratio | Without Mortgage | With Mortgage |
| Less than 2.0x | 183 (36.4%) | 233,152 (95,554.1%) |
| 2.0x to 2.9x | 81 (16.1%) | 120 (49.2%) |
| 3.0x to 3.9x | 11 (2.2%) | 0 (0.0%) |
| 4.0x or more | 227 (45.2%) | 92 (37.7%) |
| Total | 502 (100.0%) | 244 (100.0%) |
Real Estate Taxes by Mortgage Status in Belle Rose
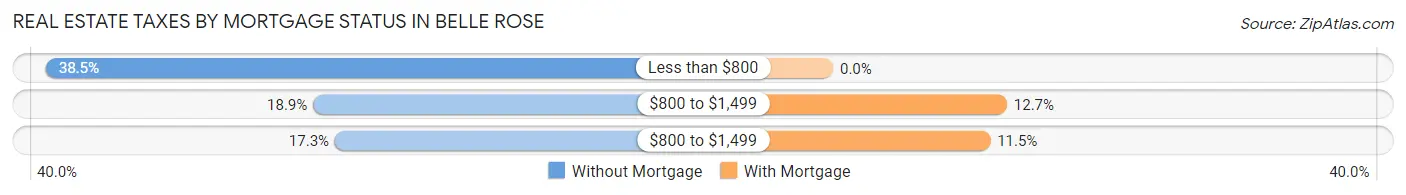
| Property Taxes | Without Mortgage | With Mortgage |
| Less than $800 | 193 (38.5%) | 0 (0.0%) |
| $800 to $1,499 | 95 (18.9%) | 31 (12.7%) |
| $800 to $1,499 | 87 (17.3%) | 28 (11.5%) |
| Total | 502 (100.0%) | 244 (100.0%) |
Health & Disability in Belle Rose
Health Insurance Coverage by Age in Belle Rose
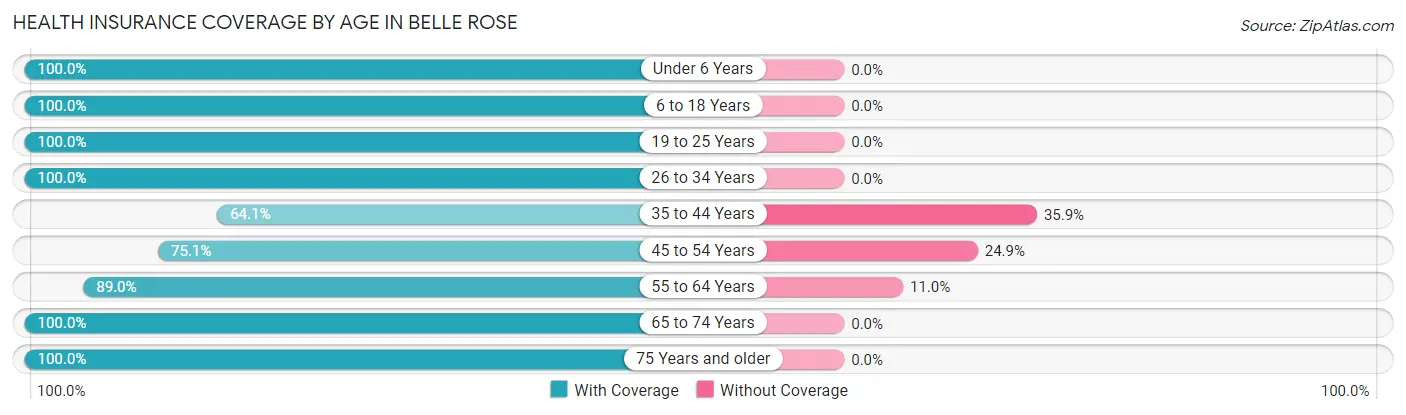
| Age Bracket | With Coverage | Without Coverage |
| Under 6 Years | 36 (100.0%) | 0 (0.0%) |
| 6 to 18 Years | 375 (100.0%) | 0 (0.0%) |
| 19 to 25 Years | 11 (100.0%) | 0 (0.0%) |
| 26 to 34 Years | 171 (100.0%) | 0 (0.0%) |
| 35 to 44 Years | 148 (64.1%) | 83 (35.9%) |
| 45 to 54 Years | 371 (75.1%) | 123 (24.9%) |
| 55 to 64 Years | 260 (89.0%) | 32 (11.0%) |
| 65 to 74 Years | 303 (100.0%) | 0 (0.0%) |
| 75 Years and older | 117 (100.0%) | 0 (0.0%) |
| Total | 1,792 (88.3%) | 238 (11.7%) |
Health Insurance Coverage by Citizenship Status in Belle Rose

| Citizenship Status | With Coverage | Without Coverage |
| Native Born | 36 (100.0%) | 0 (0.0%) |
| Foreign Born, Citizen | 375 (100.0%) | 0 (0.0%) |
| Foreign Born, not a Citizen | 11 (100.0%) | 0 (0.0%) |
Health Insurance Coverage by Household Income in Belle Rose
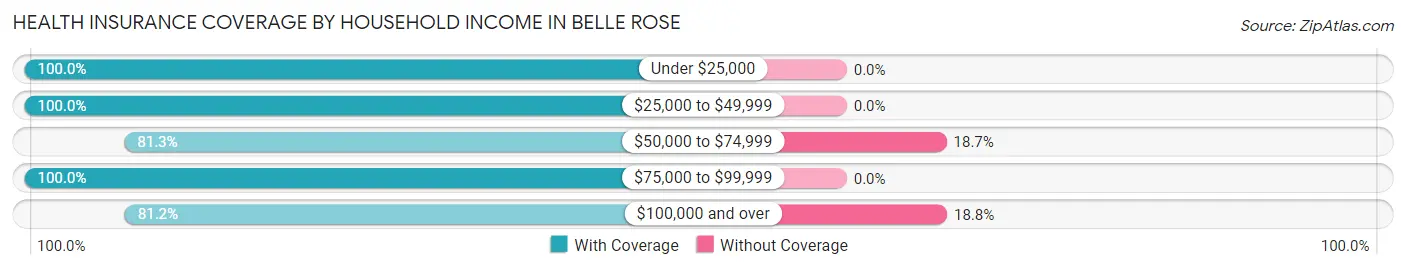
| Household Income | With Coverage | Without Coverage |
| Under $25,000 | 276 (100.0%) | 0 (0.0%) |
| $25,000 to $49,999 | 414 (100.0%) | 0 (0.0%) |
| $50,000 to $74,999 | 200 (81.3%) | 46 (18.7%) |
| $75,000 to $99,999 | 72 (100.0%) | 0 (0.0%) |
| $100,000 and over | 830 (81.2%) | 192 (18.8%) |
Public vs Private Health Insurance Coverage by Age in Belle Rose
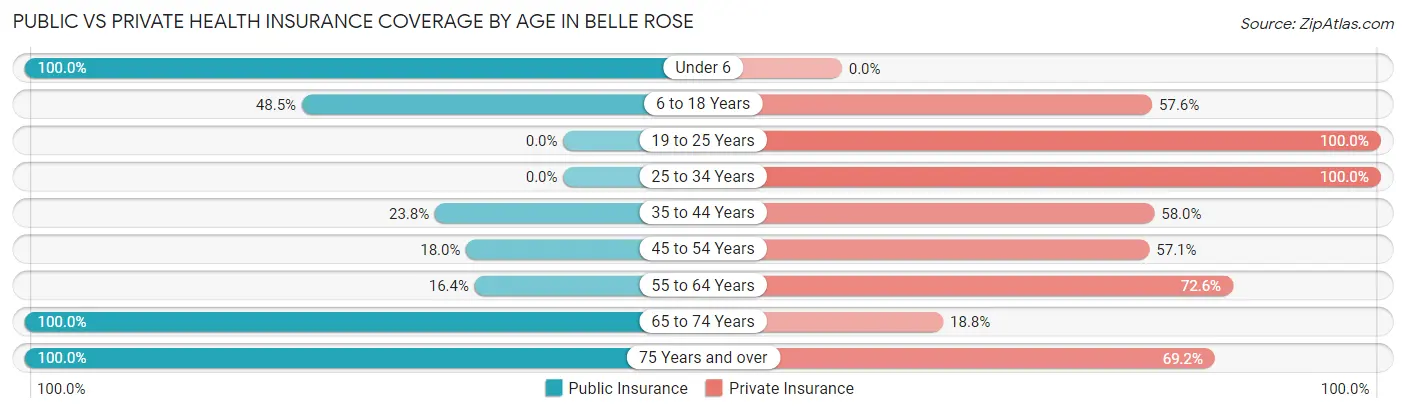
| Age Bracket | Public Insurance | Private Insurance |
| Under 6 | 36 (100.0%) | 0 (0.0%) |
| 6 to 18 Years | 182 (48.5%) | 216 (57.6%) |
| 19 to 25 Years | 0 (0.0%) | 11 (100.0%) |
| 25 to 34 Years | 0 (0.0%) | 171 (100.0%) |
| 35 to 44 Years | 55 (23.8%) | 134 (58.0%) |
| 45 to 54 Years | 89 (18.0%) | 282 (57.1%) |
| 55 to 64 Years | 48 (16.4%) | 212 (72.6%) |
| 65 to 74 Years | 303 (100.0%) | 57 (18.8%) |
| 75 Years and over | 117 (100.0%) | 81 (69.2%) |
| Total | 830 (40.9%) | 1,164 (57.3%) |
Disability Status by Sex by Age in Belle Rose
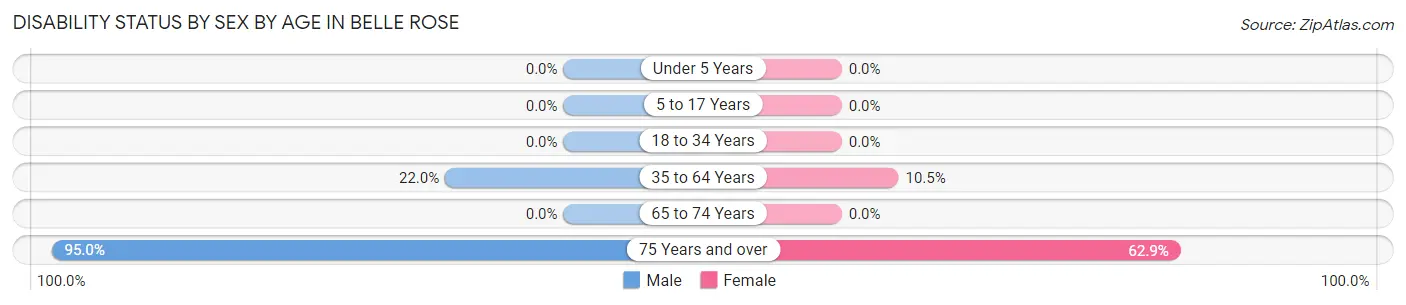
| Age Bracket | Male | Female |
| Under 5 Years | 0 (0.0%) | 0 (0.0%) |
| 5 to 17 Years | 0 (0.0%) | 0 (0.0%) |
| 18 to 34 Years | 0 (0.0%) | 0 (0.0%) |
| 35 to 64 Years | 119 (22.0%) | 50 (10.5%) |
| 65 to 74 Years | 0 (0.0%) | 0 (0.0%) |
| 75 Years and over | 19 (95.0%) | 61 (62.9%) |
Disability Class by Sex by Age in Belle Rose
Disability Class: Hearing Difficulty
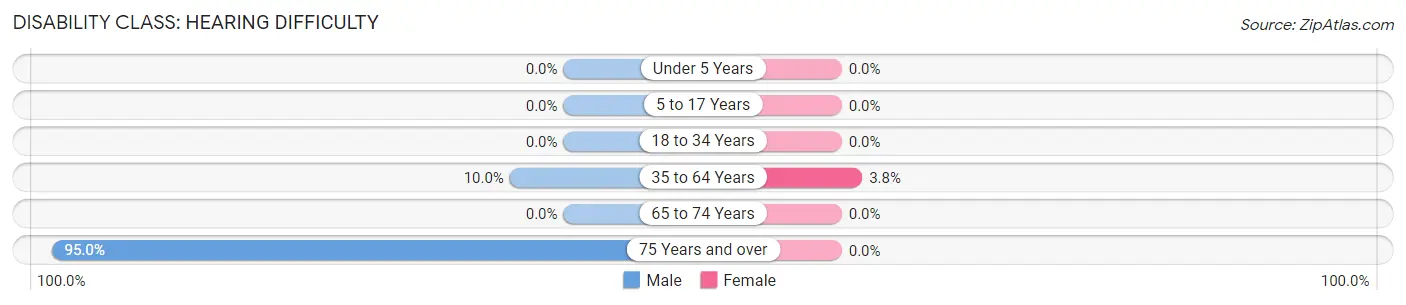
| Age Bracket | Male | Female |
| Under 5 Years | 0 (0.0%) | 0 (0.0%) |
| 5 to 17 Years | 0 (0.0%) | 0 (0.0%) |
| 18 to 34 Years | 0 (0.0%) | 0 (0.0%) |
| 35 to 64 Years | 54 (10.0%) | 18 (3.8%) |
| 65 to 74 Years | 0 (0.0%) | 0 (0.0%) |
| 75 Years and over | 19 (95.0%) | 0 (0.0%) |
Disability Class: Vision Difficulty
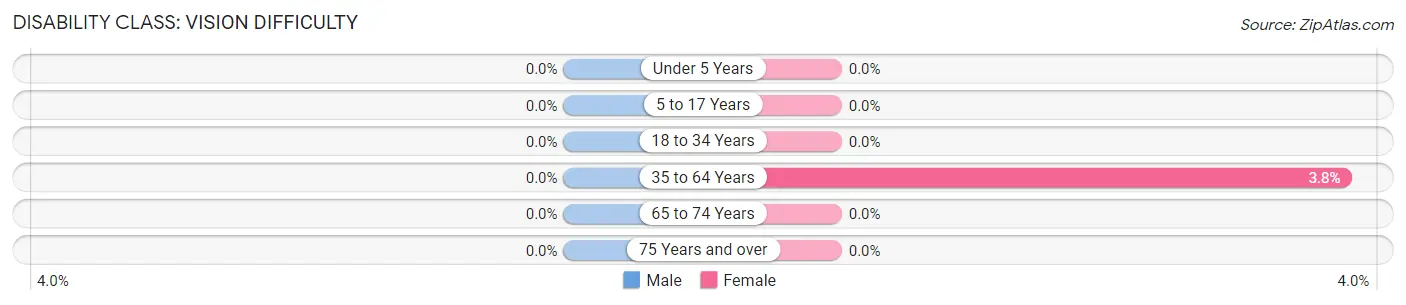
| Age Bracket | Male | Female |
| Under 5 Years | 0 (0.0%) | 0 (0.0%) |
| 5 to 17 Years | 0 (0.0%) | 0 (0.0%) |
| 18 to 34 Years | 0 (0.0%) | 0 (0.0%) |
| 35 to 64 Years | 0 (0.0%) | 18 (3.8%) |
| 65 to 74 Years | 0 (0.0%) | 0 (0.0%) |
| 75 Years and over | 0 (0.0%) | 0 (0.0%) |
Disability Class: Cognitive Difficulty
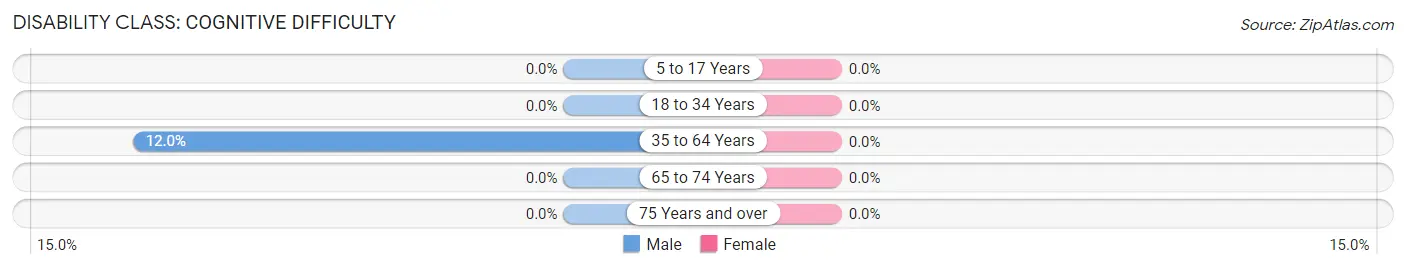
| Age Bracket | Male | Female |
| 5 to 17 Years | 0 (0.0%) | 0 (0.0%) |
| 18 to 34 Years | 0 (0.0%) | 0 (0.0%) |
| 35 to 64 Years | 65 (12.0%) | 0 (0.0%) |
| 65 to 74 Years | 0 (0.0%) | 0 (0.0%) |
| 75 Years and over | 0 (0.0%) | 0 (0.0%) |
Disability Class: Ambulatory Difficulty
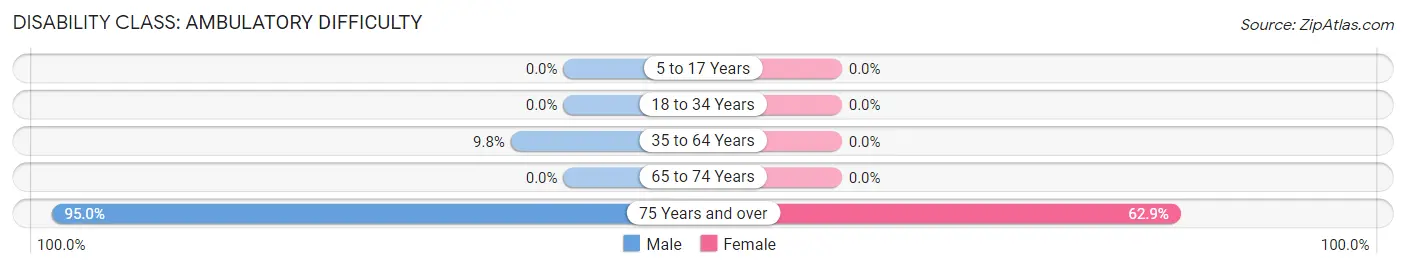
| Age Bracket | Male | Female |
| 5 to 17 Years | 0 (0.0%) | 0 (0.0%) |
| 18 to 34 Years | 0 (0.0%) | 0 (0.0%) |
| 35 to 64 Years | 53 (9.8%) | 0 (0.0%) |
| 65 to 74 Years | 0 (0.0%) | 0 (0.0%) |
| 75 Years and over | 19 (95.0%) | 61 (62.9%) |
Disability Class: Self-Care Difficulty
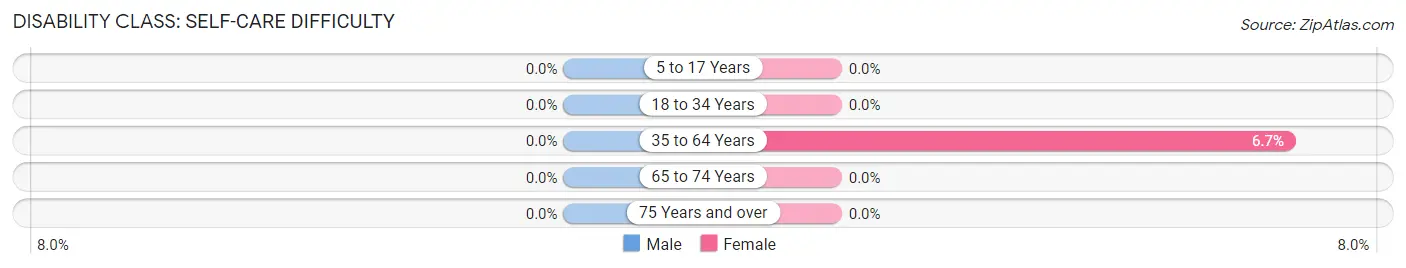
| Age Bracket | Male | Female |
| 5 to 17 Years | 0 (0.0%) | 0 (0.0%) |
| 18 to 34 Years | 0 (0.0%) | 0 (0.0%) |
| 35 to 64 Years | 0 (0.0%) | 32 (6.7%) |
| 65 to 74 Years | 0 (0.0%) | 0 (0.0%) |
| 75 Years and over | 0 (0.0%) | 0 (0.0%) |
Technology Access in Belle Rose
Computing Device Access in Belle Rose
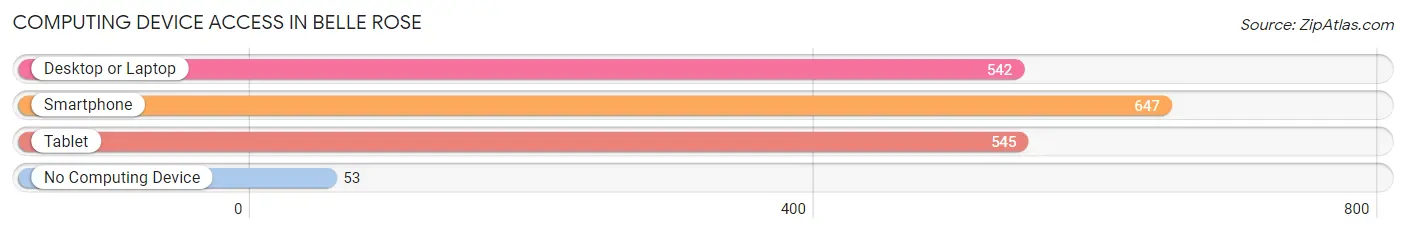
| Device Type | # Households | % Households |
| Desktop or Laptop | 542 | 67.2% |
| Smartphone | 647 | 80.2% |
| Tablet | 545 | 67.5% |
| No Computing Device | 53 | 6.6% |
| Total | 807 | 100.0% |
Internet Access in Belle Rose
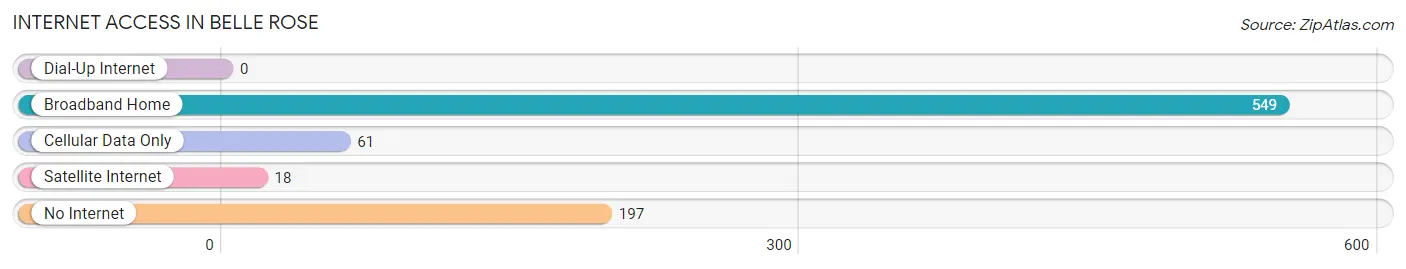
| Internet Type | # Households | % Households |
| Dial-Up Internet | 0 | 0.0% |
| Broadband Home | 549 | 68.0% |
| Cellular Data Only | 61 | 7.6% |
| Satellite Internet | 18 | 2.2% |
| No Internet | 197 | 24.4% |
| Total | 807 | 100.0% |
Belle Rose Summary
Belle Rose is a small unincorporated community located in Assumption Parish, Louisiana. It is situated along the banks of Bayou Lafourche, approximately 25 miles south of Baton Rouge. The population of Belle Rose was 1,845 in the 2010 census.
History
Belle Rose was founded in the early 1800s by French settlers who were attracted to the area by its fertile soil and abundant wildlife. The town was originally known as “La Belle Rose”, which translates to “The Beautiful Rose”. The name was chosen to honor the beauty of the area.
In the late 1800s, the town began to grow and develop. The first post office was established in 1883, and the first school was built in 1885. The town was incorporated in 1895.
In the early 1900s, Belle Rose was a thriving agricultural community. The town was home to several sugar cane plantations, as well as a number of other farms. The town also had a number of stores, churches, and other businesses.
In the mid-1900s, the town began to decline. The sugar cane industry began to decline, and many of the town’s businesses closed. The population of Belle Rose decreased significantly, and the town became a small, rural community.
Geography
Belle Rose is located in Assumption Parish, Louisiana. It is situated along the banks of Bayou Lafourche, approximately 25 miles south of Baton Rouge. The town is located in the southeastern part of the state, near the Gulf of Mexico.
The terrain of Belle Rose is mostly flat, with some rolling hills. The town is surrounded by farmland and wetlands. The climate is humid subtropical, with hot, humid summers and mild winters.
Economy
The economy of Belle Rose is largely based on agriculture. The town is home to several sugar cane plantations, as well as a number of other farms. The town also has a number of stores, churches, and other businesses.
The town is also home to a number of small manufacturing companies. These companies produce a variety of products, including furniture, clothing, and electronics.
Demographics
The population of Belle Rose was 1,845 in the 2010 census. The racial makeup of the town was 79.3% White, 17.2% African American, 0.7% Native American, 0.3% Asian, 0.1% Pacific Islander, and 2.4% from other races.
The median household income in Belle Rose was $31,250 in 2017. The median home value was $90,000 in 2017. The town has a poverty rate of 24.3%.
Conclusion
Belle Rose is a small unincorporated community located in Assumption Parish, Louisiana. It is situated along the banks of Bayou Lafourche, approximately 25 miles south of Baton Rouge. The population of Belle Rose was 1,845 in the 2010 census. The town’s economy is largely based on agriculture, and it is home to a number of small manufacturing companies. The median household income in Belle Rose was $31,250 in 2017, and the median home value was $90,000 in 2017. The town has a poverty rate of 24.3%.
Common Questions
What is Per Capita Income in Belle Rose?
Per Capita income in Belle Rose is $37,352.
What is Inequality or Gini Index in Belle Rose?
Inequality or Gini Index in Belle Rose is 0.49.
What is the Total Population of Belle Rose?
Total Population of Belle Rose is 2,030.
What is the Total Male Population of Belle Rose?
Total Male Population of Belle Rose is 971.
What is the Total Female Population of Belle Rose?
Total Female Population of Belle Rose is 1,059.
What is the Ratio of Males per 100 Females in Belle Rose?
There are 91.69 Males per 100 Females in Belle Rose.
What is the Ratio of Females per 100 Males in Belle Rose?
There are 109.06 Females per 100 Males in Belle Rose.
What is the Median Population Age in Belle Rose?
Median Population Age in Belle Rose is 49.3 Years.
What is the Average Family Size in Belle Rose
Average Family Size in Belle Rose is 3.1 People.
What is the Average Household Size in Belle Rose
Average Household Size in Belle Rose is 2.5 People.
How Large is the Labor Force in Belle Rose?
There are 1,101 People in the Labor Forcein in Belle Rose.
What is the Percentage of People in the Labor Force in Belle Rose?
64.9% of People are in the Labor Force in Belle Rose.
What is the Unemployment Rate in Belle Rose?
Unemployment Rate in Belle Rose is 6.8%.