Athens, LA Map & Demographics
Athens Map
Athens Overview
$19,185
PER CAPITA INCOME
$27,857
AVG HOUSEHOLD INCOME
36.8%
WAGE / INCOME GAP [ % ]
63.2¢/ $1
WAGE / INCOME GAP [ $ ]
0.53
INEQUALITY / GINI INDEX
282
TOTAL POPULATION
135
MALE POPULATION
147
FEMALE POPULATION
91.84
MALES / 100 FEMALES
108.89
FEMALES / 100 MALES
38.3
MEDIAN AGE
3.2
AVG FAMILY SIZE
2.1
AVG HOUSEHOLD SIZE
95
LABOR FORCE [ PEOPLE ]
46.8%
PERCENT IN LABOR FORCE
1.1%
UNEMPLOYMENT RATE
Athens Zip Codes
Athens Area Codes
Income in Athens
Income Overview in Athens
| Characteristic | Number | Measure |
| Per Capita Income | 282 | $19,185 |
| Median Family Income | 67 | $0 |
| Mean Family Income | 67 | $58,788 |
| Median Household Income | 134 | $27,857 |
| Mean Household Income | 134 | $39,799 |
| Income Deficit | 67 | $0 |
| Wage / Income Gap (%) | 282 | 36.84% |
| Wage / Income Gap ($) | 282 | 63.16¢ per $1 |
| Gini / Inequality Index | 282 | 0.53 |
Earnings by Sex in Athens
Average Earnings in Athens are $25,625, $29,688 for men and $18,750 for women, a difference of 36.8%.
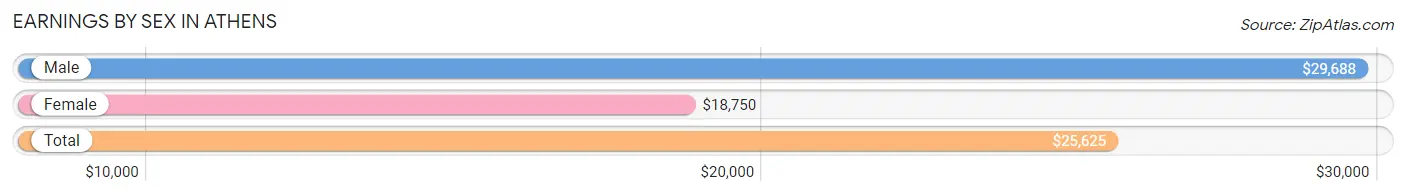
| Sex | Number | Average Earnings |
| Male | 45 (47.4%) | $29,688 |
| Female | 50 (52.6%) | $18,750 |
| Total | 95 (100.0%) | $25,625 |
Earnings by Sex by Income Bracket in Athens
The most common earnings brackets in Athens are $20,000 to $22,499 for men (11 | 24.4%) and $5,000 to $7,499 for women (10 | 20.0%).
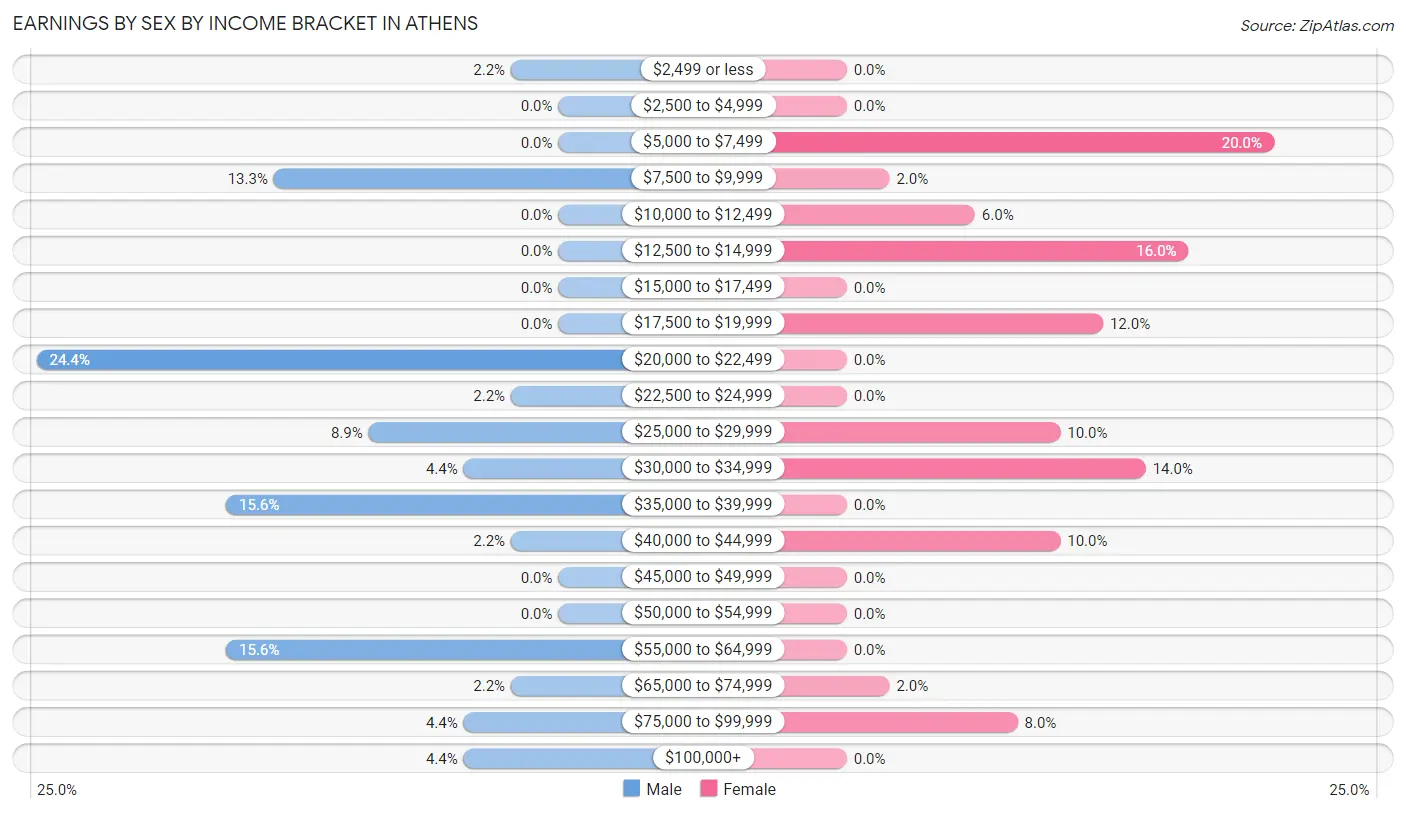
| Income | Male | Female |
| $2,499 or less | 1 (2.2%) | 0 (0.0%) |
| $2,500 to $4,999 | 0 (0.0%) | 0 (0.0%) |
| $5,000 to $7,499 | 0 (0.0%) | 10 (20.0%) |
| $7,500 to $9,999 | 6 (13.3%) | 1 (2.0%) |
| $10,000 to $12,499 | 0 (0.0%) | 3 (6.0%) |
| $12,500 to $14,999 | 0 (0.0%) | 8 (16.0%) |
| $15,000 to $17,499 | 0 (0.0%) | 0 (0.0%) |
| $17,500 to $19,999 | 0 (0.0%) | 6 (12.0%) |
| $20,000 to $22,499 | 11 (24.4%) | 0 (0.0%) |
| $22,500 to $24,999 | 1 (2.2%) | 0 (0.0%) |
| $25,000 to $29,999 | 4 (8.9%) | 5 (10.0%) |
| $30,000 to $34,999 | 2 (4.4%) | 7 (14.0%) |
| $35,000 to $39,999 | 7 (15.6%) | 0 (0.0%) |
| $40,000 to $44,999 | 1 (2.2%) | 5 (10.0%) |
| $45,000 to $49,999 | 0 (0.0%) | 0 (0.0%) |
| $50,000 to $54,999 | 0 (0.0%) | 0 (0.0%) |
| $55,000 to $64,999 | 7 (15.6%) | 0 (0.0%) |
| $65,000 to $74,999 | 1 (2.2%) | 1 (2.0%) |
| $75,000 to $99,999 | 2 (4.4%) | 4 (8.0%) |
| $100,000+ | 2 (4.4%) | 0 (0.0%) |
| Total | 45 (100.0%) | 50 (100.0%) |
Earnings by Sex by Educational Attainment in Athens
Average earnings in Athens are $29,688 for men and $18,750 for women, a difference of 36.8%. Men with an educational attainment of college or associate's degree enjoy the highest average annual earnings of $35,750, while those with high school diploma education earn the least with $27,813. Women with an educational attainment of college or associate's degree earn the most with the average annual earnings of $32,750, while those with high school diploma education have the smallest earnings of $6,563.
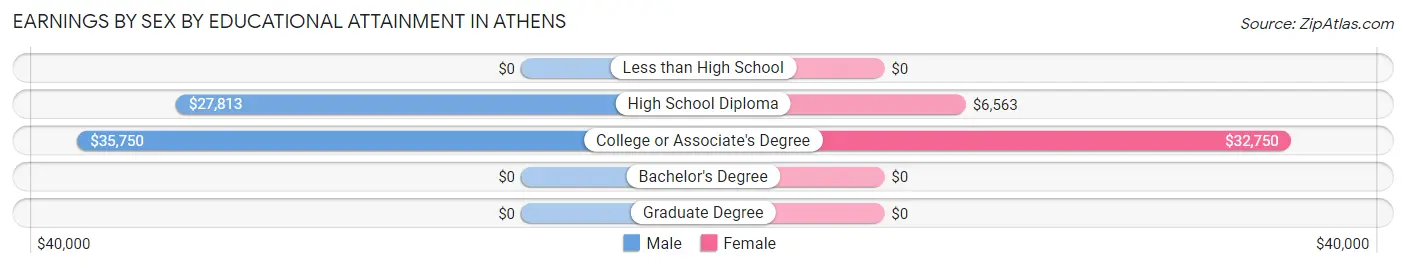
| Educational Attainment | Male Income | Female Income |
| Less than High School | - | - |
| High School Diploma | $27,813 | $6,563 |
| College or Associate's Degree | $35,750 | $32,750 |
| Bachelor's Degree | - | - |
| Graduate Degree | - | - |
| Total | $29,688 | $18,750 |
Family Income in Athens
Family Income Brackets in Athens
According to the Athens family income data, there are 21 families falling into the $50,000 to $74,999 income range, which is the most common income bracket and makes up 31.3% of all families.
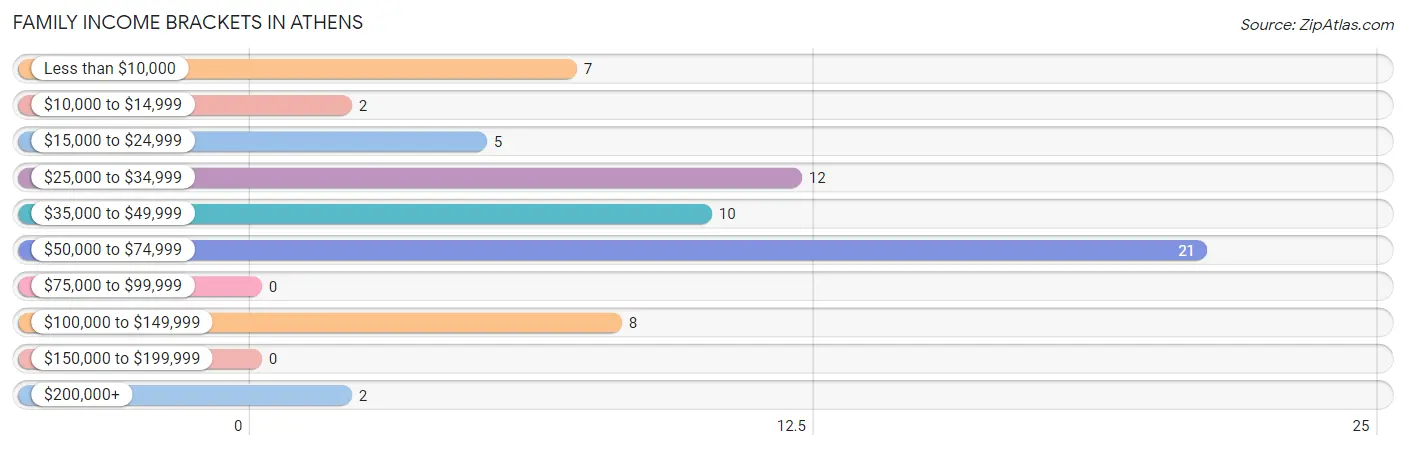
| Income Bracket | # Families | % Families |
| Less than $10,000 | 7 | 10.4% |
| $10,000 to $14,999 | 2 | 3.0% |
| $15,000 to $24,999 | 5 | 7.5% |
| $25,000 to $34,999 | 12 | 17.9% |
| $35,000 to $49,999 | 10 | 14.9% |
| $50,000 to $74,999 | 21 | 31.3% |
| $75,000 to $99,999 | 0 | 0.0% |
| $100,000 to $149,999 | 8 | 11.9% |
| $150,000 to $199,999 | 0 | 0.0% |
| $200,000+ | 2 | 3.0% |
Family Income by Famaliy Size in Athens
2-person families (30 | 44.8%) account for the highest median family income in Athens with $55,000 per family, while 2-person families (30 | 44.8%) have the highest median income of $27,500 per family member.
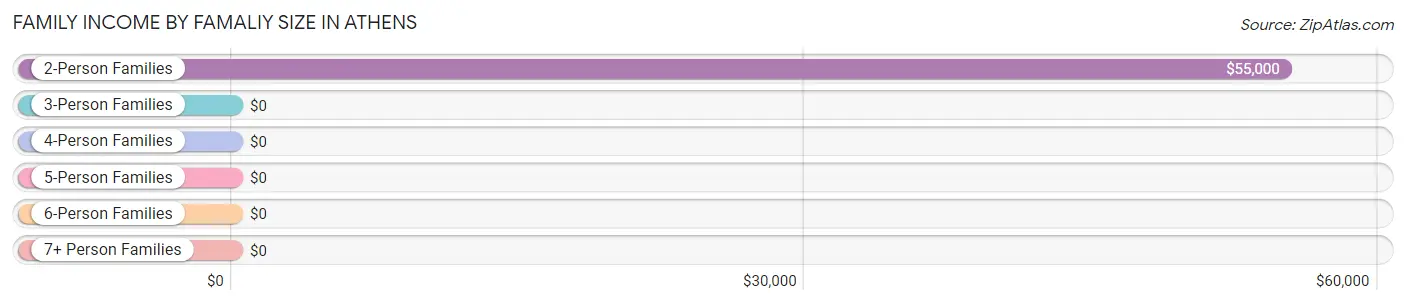
| Income Bracket | # Families | Median Income |
| 2-Person Families | 30 (44.8%) | $55,000 |
| 3-Person Families | 7 (10.4%) | $0 |
| 4-Person Families | 17 (25.4%) | $0 |
| 5-Person Families | 1 (1.5%) | $0 |
| 6-Person Families | 12 (17.9%) | $0 |
| 7+ Person Families | 0 (0.0%) | $0 |
| Total | 67 (100.0%) | $0 |
Family Income by Number of Earners in Athens
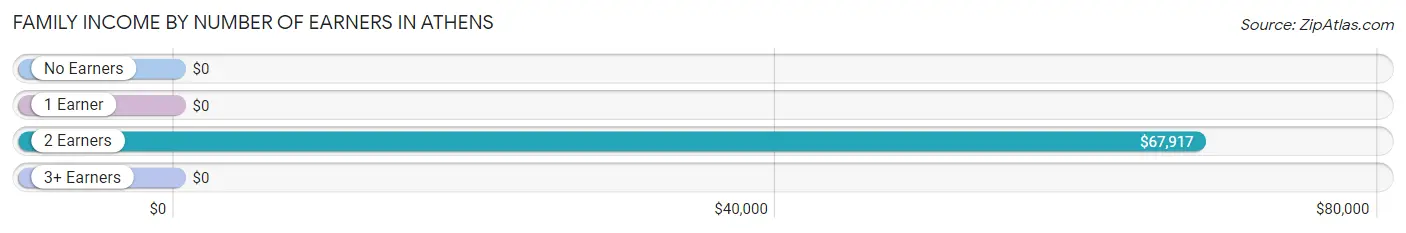
| Number of Earners | # Families | Median Income |
| No Earners | 16 (23.9%) | $0 |
| 1 Earner | 27 (40.3%) | $0 |
| 2 Earners | 22 (32.8%) | $67,917 |
| 3+ Earners | 2 (3.0%) | $0 |
| Total | 67 (100.0%) | $0 |
Household Income in Athens
Household Income Brackets in Athens
With 39 households falling in the category, the less than $10,000 income range is the most frequent in Athens, accounting for 29.1% of all households.
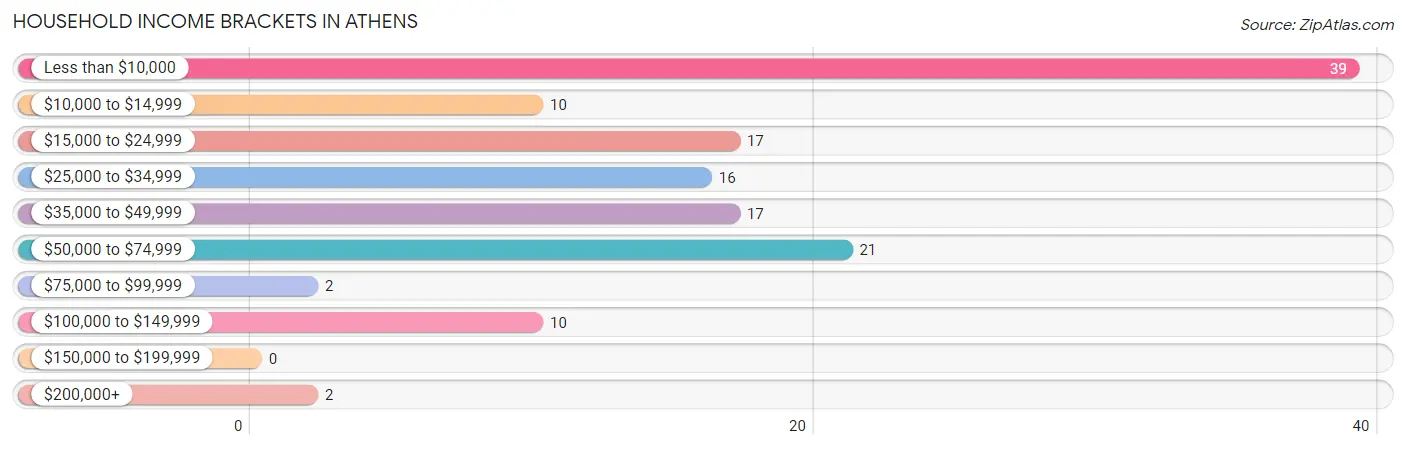
| Income Bracket | # Households | % Households |
| Less than $10,000 | 39 | 29.1% |
| $10,000 to $14,999 | 10 | 7.5% |
| $15,000 to $24,999 | 17 | 12.7% |
| $25,000 to $34,999 | 16 | 11.9% |
| $35,000 to $49,999 | 17 | 12.7% |
| $50,000 to $74,999 | 21 | 15.7% |
| $75,000 to $99,999 | 2 | 1.5% |
| $100,000 to $149,999 | 10 | 7.5% |
| $150,000 to $199,999 | 0 | 0.0% |
| $200,000+ | 2 | 1.5% |
Household Income by Householder Age in Athens
| Income Bracket | # Households | Median Income |
| 15 to 24 Years | 0 (0.0%) | $0 |
| 25 to 44 Years | 50 (37.3%) | $0 |
| 45 to 64 Years | 52 (38.8%) | $0 |
| 65+ Years | 32 (23.9%) | $0 |
| Total | 134 (100.0%) | $27,857 |
Poverty in Athens
Income Below Poverty by Sex and Age in Athens
With 45.2% poverty level for males and 40.8% for females among the residents of Athens, 18 to 24 year old males and under 5 year old females are the most vulnerable to poverty, with 10 males (100.0%) and 9 females (100.0%) in their respective age groups living below the poverty level.
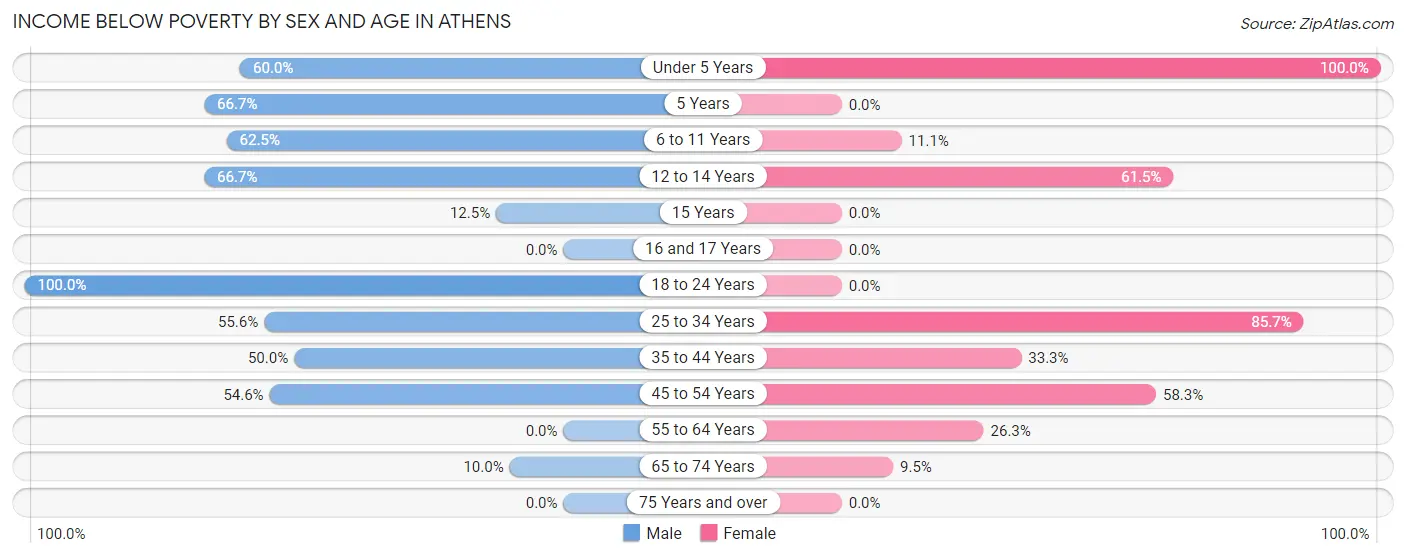
| Age Bracket | Male | Female |
| Under 5 Years | 6 (60.0%) | 9 (100.0%) |
| 5 Years | 4 (66.7%) | 0 (0.0%) |
| 6 to 11 Years | 5 (62.5%) | 2 (11.1%) |
| 12 to 14 Years | 4 (66.7%) | 8 (61.5%) |
| 15 Years | 1 (12.5%) | 0 (0.0%) |
| 16 and 17 Years | 0 (0.0%) | 0 (0.0%) |
| 18 to 24 Years | 10 (100.0%) | 0 (0.0%) |
| 25 to 34 Years | 10 (55.6%) | 12 (85.7%) |
| 35 to 44 Years | 13 (50.0%) | 8 (33.3%) |
| 45 to 54 Years | 6 (54.5%) | 14 (58.3%) |
| 55 to 64 Years | 0 (0.0%) | 5 (26.3%) |
| 65 to 74 Years | 2 (10.0%) | 2 (9.5%) |
| 75 Years and over | 0 (0.0%) | 0 (0.0%) |
| Total | 61 (45.2%) | 60 (40.8%) |
Income Above Poverty by Sex and Age in Athens
According to the poverty statistics in Athens, males aged 55 to 64 years and females aged 5 years are the age groups that are most secure financially, with 100.0% of males and 100.0% of females in these age groups living above the poverty line.
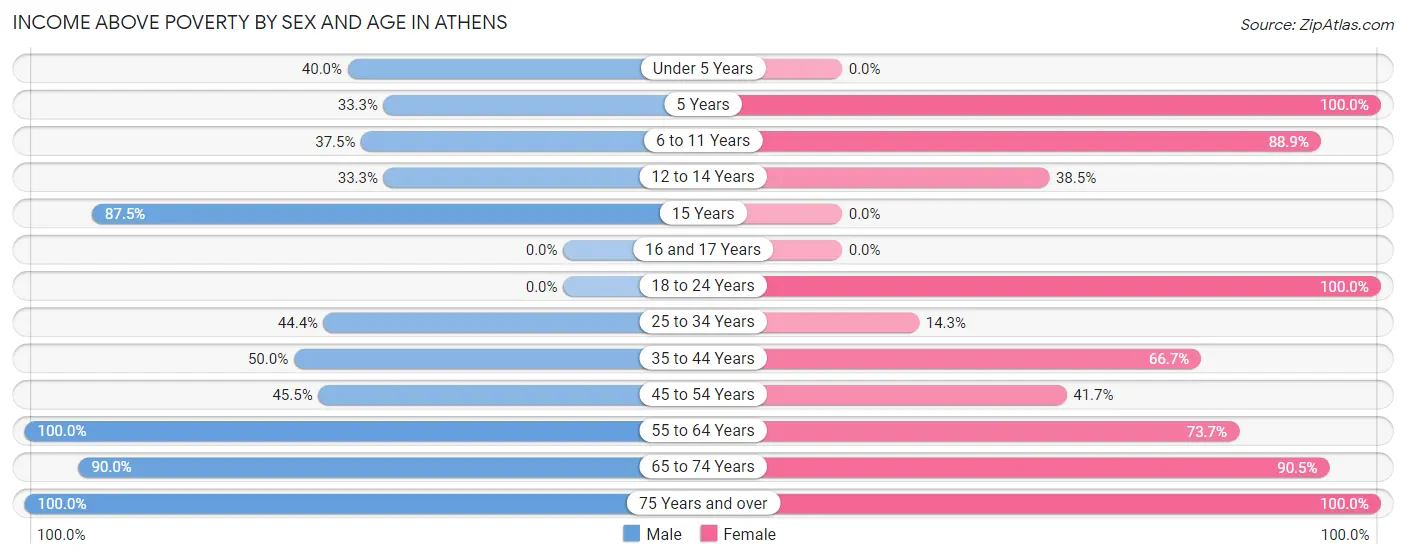
| Age Bracket | Male | Female |
| Under 5 Years | 4 (40.0%) | 0 (0.0%) |
| 5 Years | 2 (33.3%) | 1 (100.0%) |
| 6 to 11 Years | 3 (37.5%) | 16 (88.9%) |
| 12 to 14 Years | 2 (33.3%) | 5 (38.5%) |
| 15 Years | 7 (87.5%) | 0 (0.0%) |
| 16 and 17 Years | 0 (0.0%) | 0 (0.0%) |
| 18 to 24 Years | 0 (0.0%) | 1 (100.0%) |
| 25 to 34 Years | 8 (44.4%) | 2 (14.3%) |
| 35 to 44 Years | 13 (50.0%) | 16 (66.7%) |
| 45 to 54 Years | 5 (45.5%) | 10 (41.7%) |
| 55 to 64 Years | 10 (100.0%) | 14 (73.7%) |
| 65 to 74 Years | 18 (90.0%) | 19 (90.5%) |
| 75 Years and over | 2 (100.0%) | 3 (100.0%) |
| Total | 74 (54.8%) | 87 (59.2%) |
Income Below Poverty Among Married-Couple Families in Athens
The poverty statistics for married-couple families in Athens show that 23.8% or 10 of the total 42 families live below the poverty line. Families with 3 or 4 children have the highest poverty rate of 100.0%, comprising of 10 families. On the other hand, families with no children have the lowest poverty rate of 0.0%, which includes 0 families.
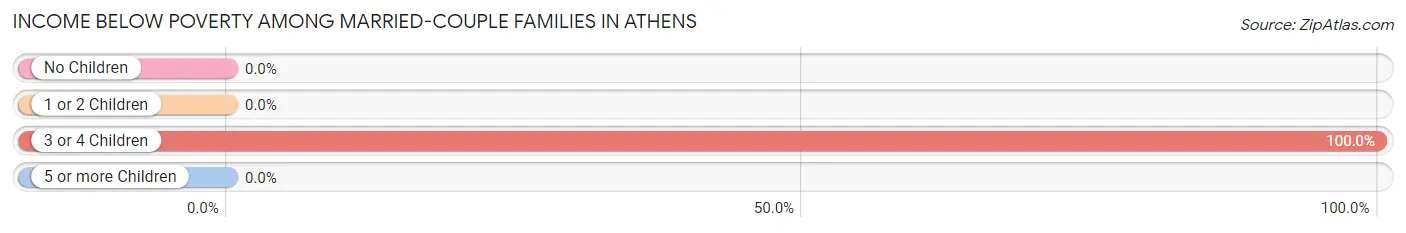
| Children | Above Poverty | Below Poverty |
| No Children | 18 (100.0%) | 0 (0.0%) |
| 1 or 2 Children | 14 (100.0%) | 0 (0.0%) |
| 3 or 4 Children | 0 (0.0%) | 10 (100.0%) |
| 5 or more Children | 0 (0.0%) | 0 (0.0%) |
| Total | 32 (76.2%) | 10 (23.8%) |
Income Below Poverty Among Single-Parent Households in Athens
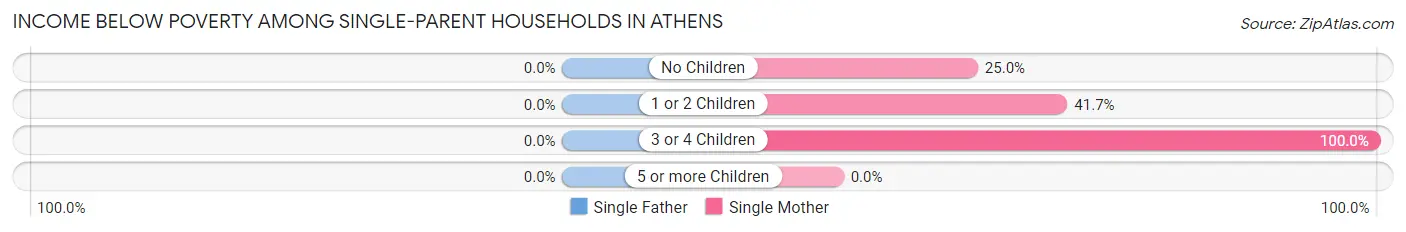
| Children | Single Father | Single Mother |
| No Children | 0 (0.0%) | 1 (25.0%) |
| 1 or 2 Children | 0 (0.0%) | 5 (41.7%) |
| 3 or 4 Children | 0 (0.0%) | 8 (100.0%) |
| 5 or more Children | 0 (0.0%) | 0 (0.0%) |
| Total | 0 (0.0%) | 14 (58.3%) |
Income Below Poverty Among Married-Couple vs Single-Parent Households in Athens
The poverty data for Athens shows that 10 of the married-couple family households (23.8%) and 14 of the single-parent households (56.0%) are living below the poverty level. Within the married-couple family households, those with 3 or 4 children have the highest poverty rate, with 10 households (100.0%) falling below the poverty line. Among the single-parent households, those with 3 or 4 children have the highest poverty rate, with 8 household (100.0%) living below poverty.
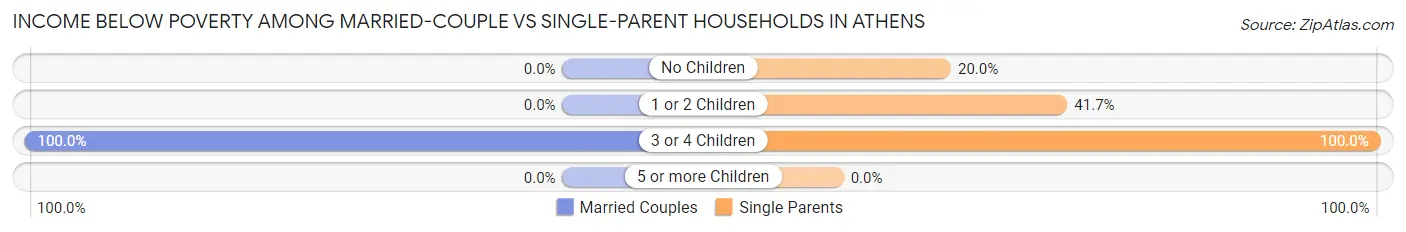
| Children | Married-Couple Families | Single-Parent Households |
| No Children | 0 (0.0%) | 1 (20.0%) |
| 1 or 2 Children | 0 (0.0%) | 5 (41.7%) |
| 3 or 4 Children | 10 (100.0%) | 8 (100.0%) |
| 5 or more Children | 0 (0.0%) | 0 (0.0%) |
| Total | 10 (23.8%) | 14 (56.0%) |
Race in Athens
The most populous races in Athens are White / Caucasian (154 | 54.6%), Black / African American (124 | 44.0%), and Two or more Races (4 | 1.4%).
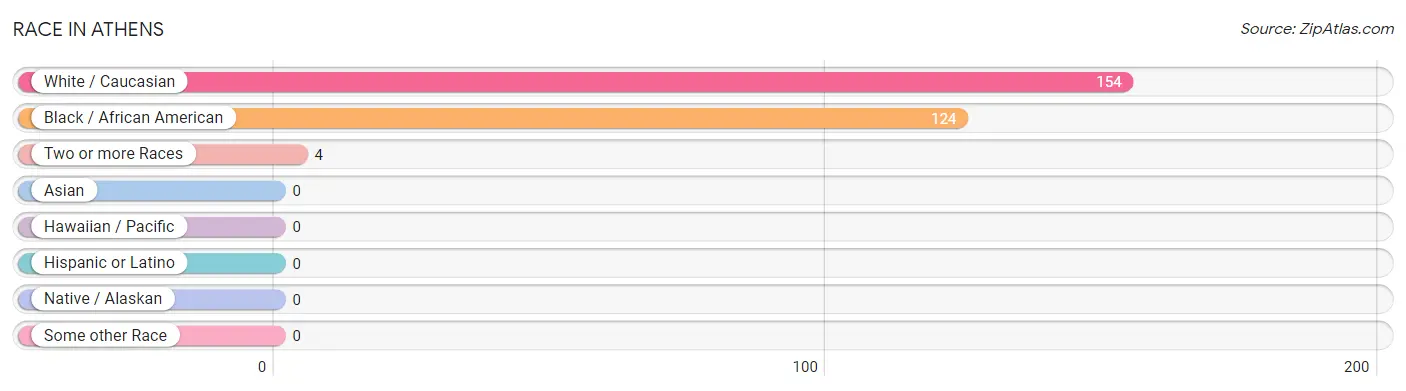
| Race | # Population | % Population |
| Asian | 0 | 0.0% |
| Black / African American | 124 | 44.0% |
| Hawaiian / Pacific | 0 | 0.0% |
| Hispanic or Latino | 0 | 0.0% |
| Native / Alaskan | 0 | 0.0% |
| White / Caucasian | 154 | 54.6% |
| Two or more Races | 4 | 1.4% |
| Some other Race | 0 | 0.0% |
| Total | 282 | 100.0% |
Ancestry in Athens
The most populous ancestries reported in Athens are American (101 | 35.8%), Scotch-Irish (16 | 5.7%), English (13 | 4.6%), Irish (10 | 3.5%), and Belgian (2 | 0.7%), together accounting for 50.4% of all Athens residents.
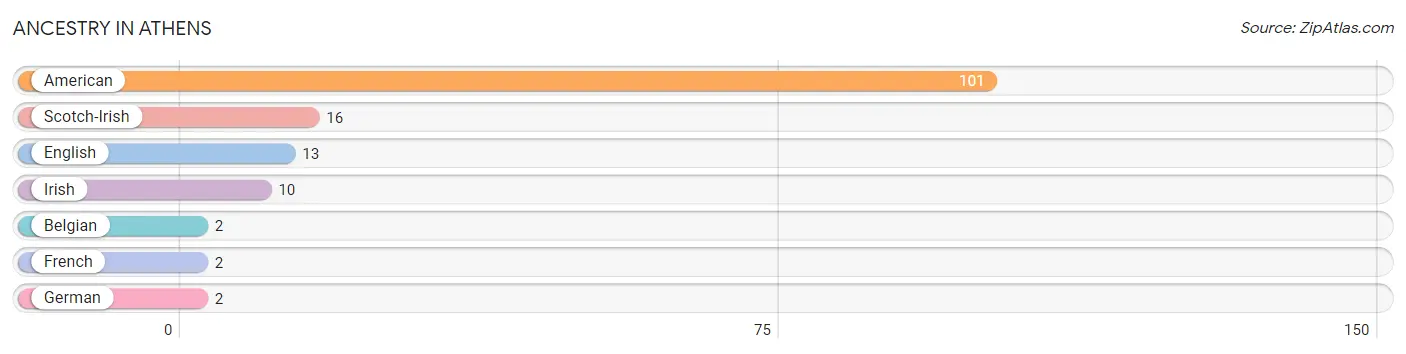
| Ancestry | # Population | % Population |
| American | 101 | 35.8% |
| Belgian | 2 | 0.7% |
| English | 13 | 4.6% |
| French | 2 | 0.7% |
| German | 2 | 0.7% |
| Irish | 10 | 3.5% |
| Scotch-Irish | 16 | 5.7% | View All 7 Rows |
Immigrants in Athens
The most numerous immigrant groups reported in Athens came from Europe (5 | 1.8%), Germany (5 | 1.8%), and Western Europe (5 | 1.8%), together accounting for 5.3% of all Athens residents.
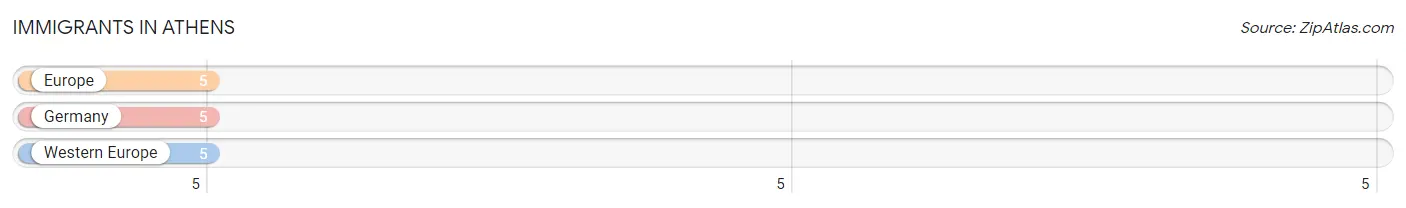
| Immigration Origin | # Population | % Population |
| Europe | 5 | 1.8% |
| Germany | 5 | 1.8% |
| Western Europe | 5 | 1.8% | View All 3 Rows |
Sex and Age in Athens
Sex and Age in Athens
The most populous age groups in Athens are 15 to 19 Years (18 | 13.3%) for men and 10 to 14 Years (21 | 14.3%) for women.
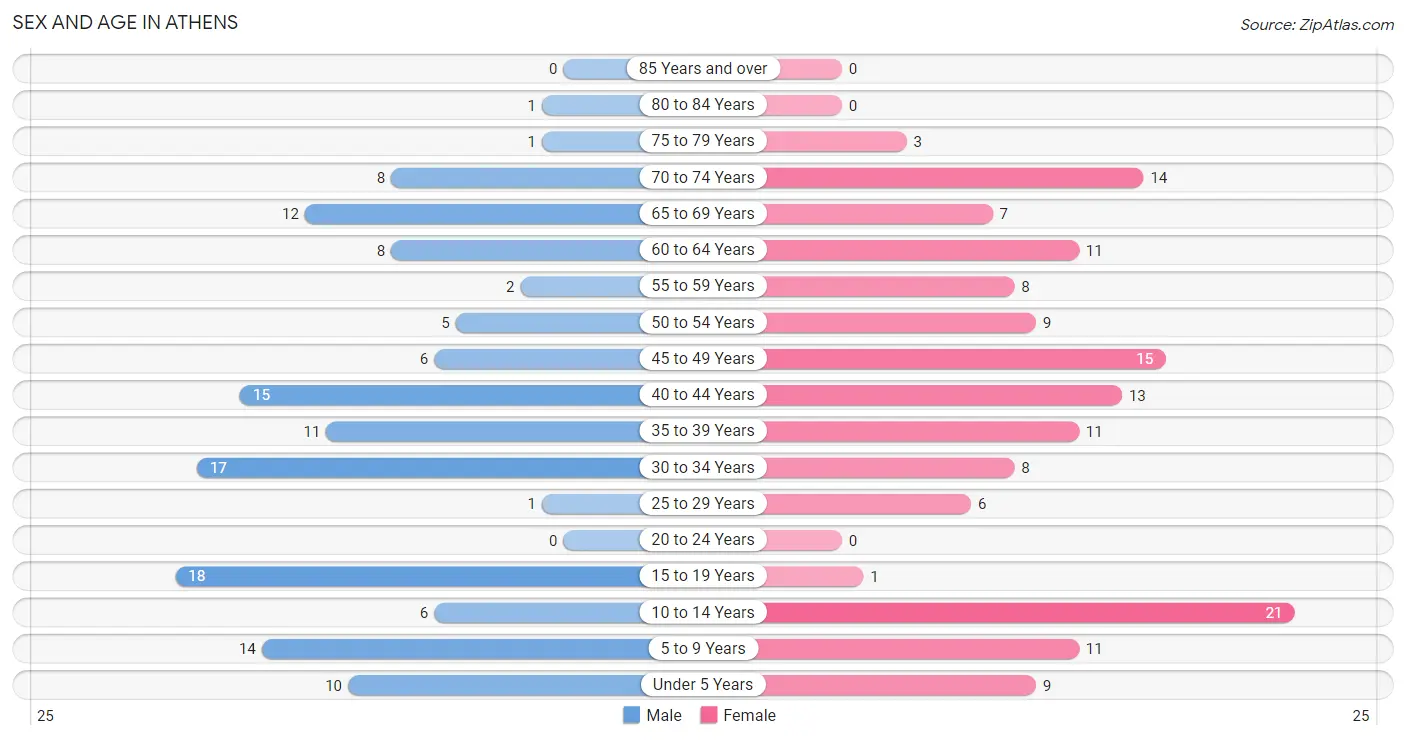
| Age Bracket | Male | Female |
| Under 5 Years | 10 (7.4%) | 9 (6.1%) |
| 5 to 9 Years | 14 (10.4%) | 11 (7.5%) |
| 10 to 14 Years | 6 (4.4%) | 21 (14.3%) |
| 15 to 19 Years | 18 (13.3%) | 1 (0.7%) |
| 20 to 24 Years | 0 (0.0%) | 0 (0.0%) |
| 25 to 29 Years | 1 (0.7%) | 6 (4.1%) |
| 30 to 34 Years | 17 (12.6%) | 8 (5.4%) |
| 35 to 39 Years | 11 (8.2%) | 11 (7.5%) |
| 40 to 44 Years | 15 (11.1%) | 13 (8.8%) |
| 45 to 49 Years | 6 (4.4%) | 15 (10.2%) |
| 50 to 54 Years | 5 (3.7%) | 9 (6.1%) |
| 55 to 59 Years | 2 (1.5%) | 8 (5.4%) |
| 60 to 64 Years | 8 (5.9%) | 11 (7.5%) |
| 65 to 69 Years | 12 (8.9%) | 7 (4.8%) |
| 70 to 74 Years | 8 (5.9%) | 14 (9.5%) |
| 75 to 79 Years | 1 (0.7%) | 3 (2.0%) |
| 80 to 84 Years | 1 (0.7%) | 0 (0.0%) |
| 85 Years and over | 0 (0.0%) | 0 (0.0%) |
| Total | 135 (100.0%) | 147 (100.0%) |
Families and Households in Athens
Median Family Size in Athens
The median family size in Athens is 3.21 persons per family, with single female/mother families (24 | 35.8%) accounting for the largest median family size of 3.25 persons per family. On the other hand, single male/father families (1 | 1.5%) represent the smallest median family size with 3.00 persons per family.
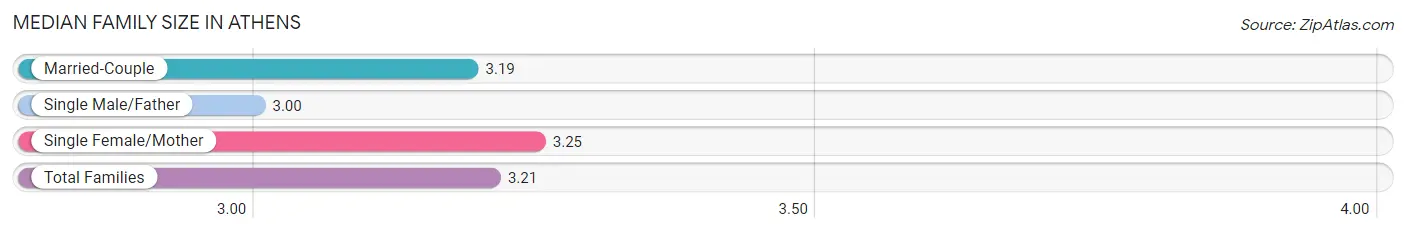
| Family Type | # Families | Family Size |
| Married-Couple | 42 (62.7%) | 3.19 |
| Single Male/Father | 1 (1.5%) | 3.00 |
| Single Female/Mother | 24 (35.8%) | 3.25 |
| Total Families | 67 (100.0%) | 3.21 |
Median Household Size in Athens
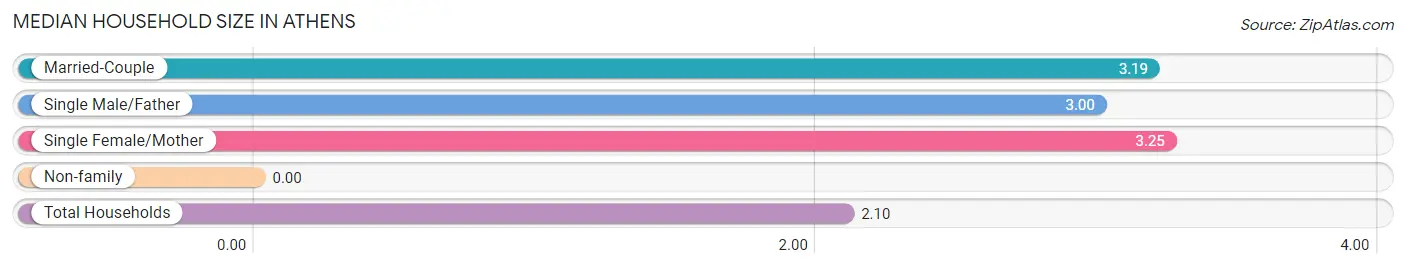
| Household Type | # Households | Household Size |
| Married-Couple | 42 (31.3%) | 3.19 |
| Single Male/Father | 1 (0.7%) | 3.00 |
| Single Female/Mother | 24 (17.9%) | 3.25 |
| Non-family | 67 (50.0%) | - |
| Total Households | 134 (100.0%) | 2.10 |
Household Size by Marriage Status in Athens
Out of a total of 134 households in Athens, 67 (50.0%) are family households, while 67 (50.0%) are nonfamily households. The most numerous type of family households are 2-person households, comprising 30, and the most common type of nonfamily households are 1-person households, comprising 67.
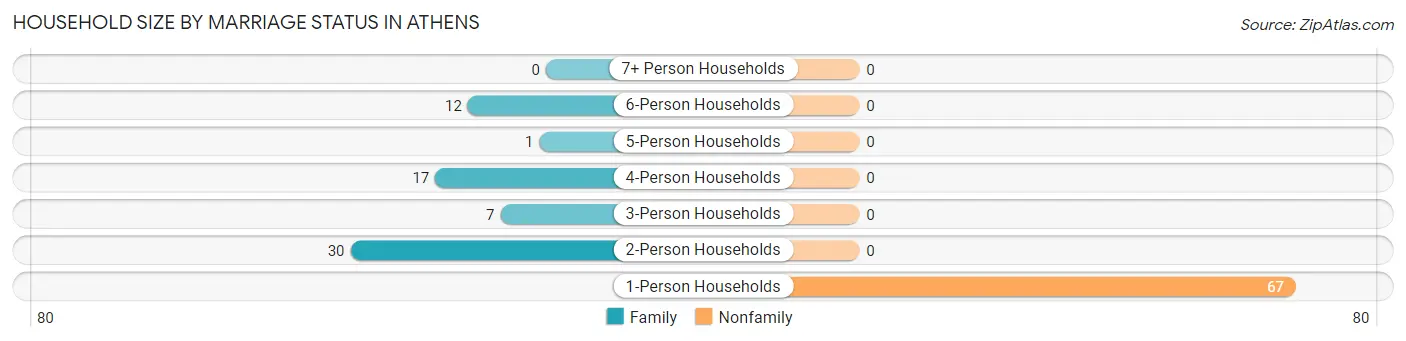
| Household Size | Family Households | Nonfamily Households |
| 1-Person Households | - | 67 (50.0%) |
| 2-Person Households | 30 (22.4%) | 0 (0.0%) |
| 3-Person Households | 7 (5.2%) | 0 (0.0%) |
| 4-Person Households | 17 (12.7%) | 0 (0.0%) |
| 5-Person Households | 1 (0.7%) | 0 (0.0%) |
| 6-Person Households | 12 (9.0%) | 0 (0.0%) |
| 7+ Person Households | 0 (0.0%) | 0 (0.0%) |
| Total | 67 (50.0%) | 67 (50.0%) |
Female Fertility in Athens
Fertility by Age in Athens
Average fertility rate in Athens is 93.0 births per 1,000 women. Women in the age bracket of 20 to 34 years have the highest fertility rate with 357.0 births per 1,000 women. Women in the age bracket of 20 to 34 years acount for 100.0% of all women with births.
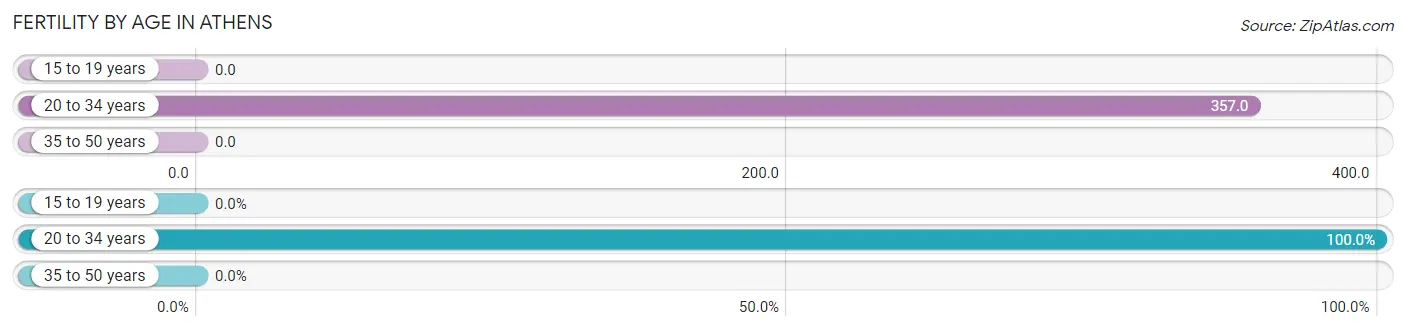
| Age Bracket | Women with Births | Births / 1,000 Women |
| 15 to 19 years | 0 (0.0%) | 0.0 |
| 20 to 34 years | 5 (100.0%) | 357.0 |
| 35 to 50 years | 0 (0.0%) | 0.0 |
| Total | 5 (100.0%) | 93.0 |
Fertility by Age by Marriage Status in Athens
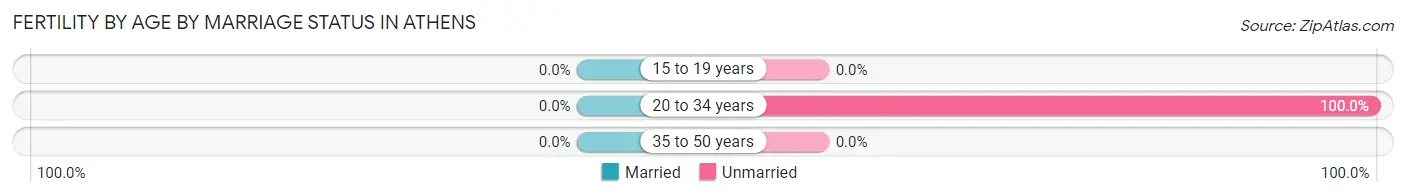
| Age Bracket | Married | Unmarried |
| 15 to 19 years | 0 (0.0%) | 0 (0.0%) |
| 20 to 34 years | 0 (0.0%) | 5 (100.0%) |
| 35 to 50 years | 0 (0.0%) | 0 (0.0%) |
| Total | 0 (0.0%) | 5 (100.0%) |
Fertility by Education in Athens
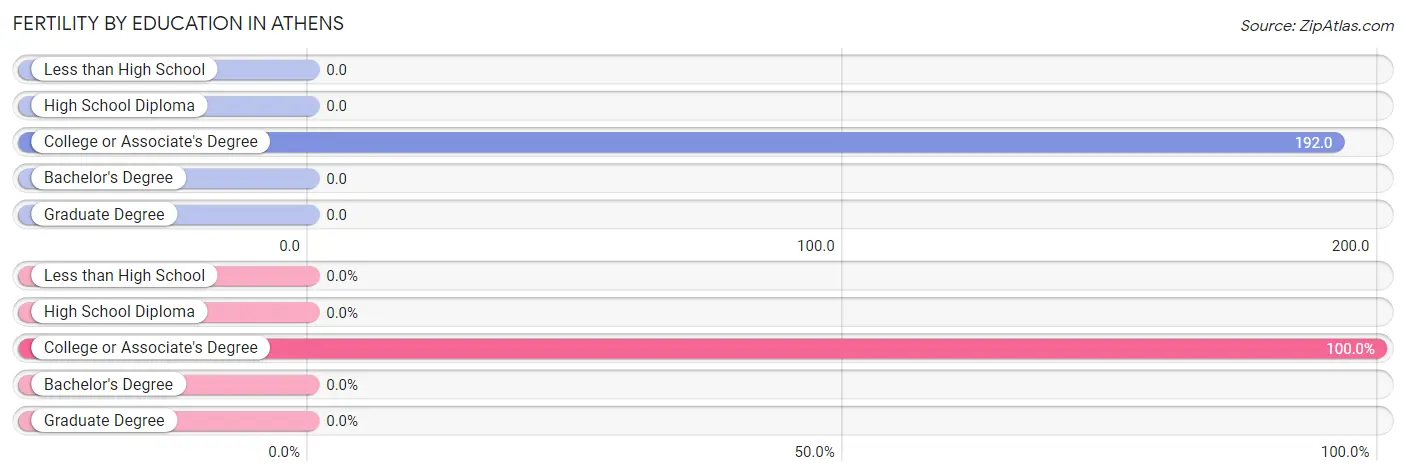
| Educational Attainment | Women with Births | Births / 1,000 Women |
| Less than High School | 0 (0.0%) | 0.0 |
| High School Diploma | 0 (0.0%) | 0.0 |
| College or Associate's Degree | 5 (100.0%) | 192.0 |
| Bachelor's Degree | 0 (0.0%) | 0.0 |
| Graduate Degree | 0 (0.0%) | 0.0 |
| Total | 5 (100.0%) | 93.0 |
Fertility by Education by Marriage Status in Athens
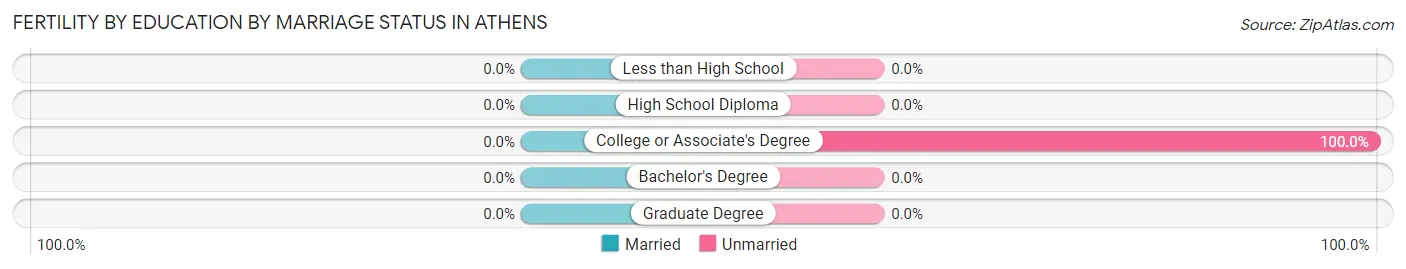
| Educational Attainment | Married | Unmarried |
| Less than High School | 0 (0.0%) | 0 (0.0%) |
| High School Diploma | 0 (0.0%) | 0 (0.0%) |
| College or Associate's Degree | 0 (0.0%) | 5 (100.0%) |
| Bachelor's Degree | 0 (0.0%) | 0 (0.0%) |
| Graduate Degree | 0 (0.0%) | 0 (0.0%) |
| Total | 0 (0.0%) | 5 (100.0%) |
Employment Characteristics in Athens
Employment by Class of Employer in Athens
Among the 93 employed individuals in Athens, private company employees (62 | 66.7%), local government employees (14 | 15.0%), and self-employed (not incorporated) (10 | 10.7%) make up the most common classes of employment.
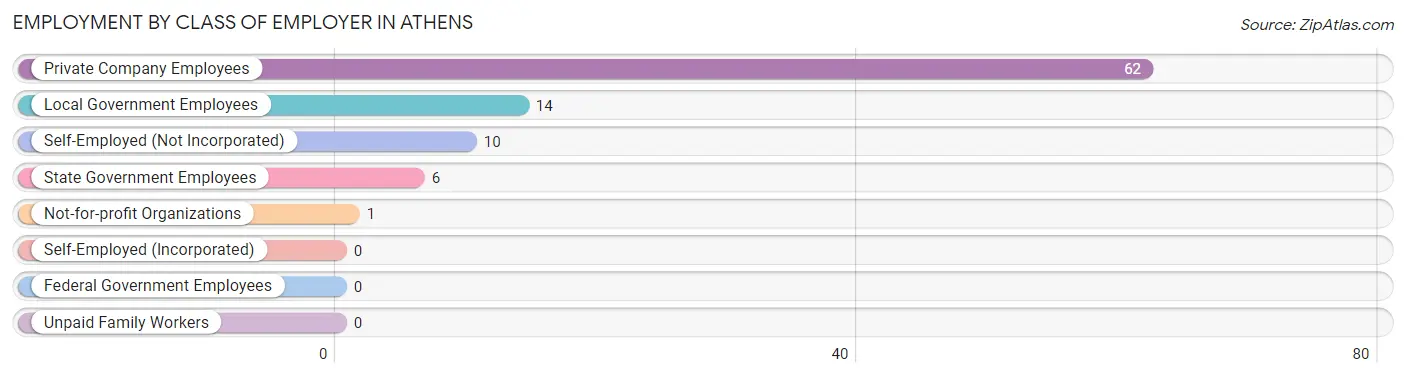
| Employer Class | # Employees | % Employees |
| Private Company Employees | 62 | 66.7% |
| Self-Employed (Incorporated) | 0 | 0.0% |
| Self-Employed (Not Incorporated) | 10 | 10.7% |
| Not-for-profit Organizations | 1 | 1.1% |
| Local Government Employees | 14 | 15.0% |
| State Government Employees | 6 | 6.5% |
| Federal Government Employees | 0 | 0.0% |
| Unpaid Family Workers | 0 | 0.0% |
| Total | 93 | 100.0% |
Employment Status by Age in Athens
According to the labor force statistics for Athens, out of the total population over 16 years of age (203), 46.8% or 95 individuals are in the labor force, with 1.1% or 1 of them unemployed. The age group with the highest labor force participation rate is 45 to 54 years, with 74.3% or 26 individuals in the labor force. Within the labor force, the 35 to 44 years age range has the highest percentage of unemployed individuals, with 3.7% or 1 of them being unemployed.
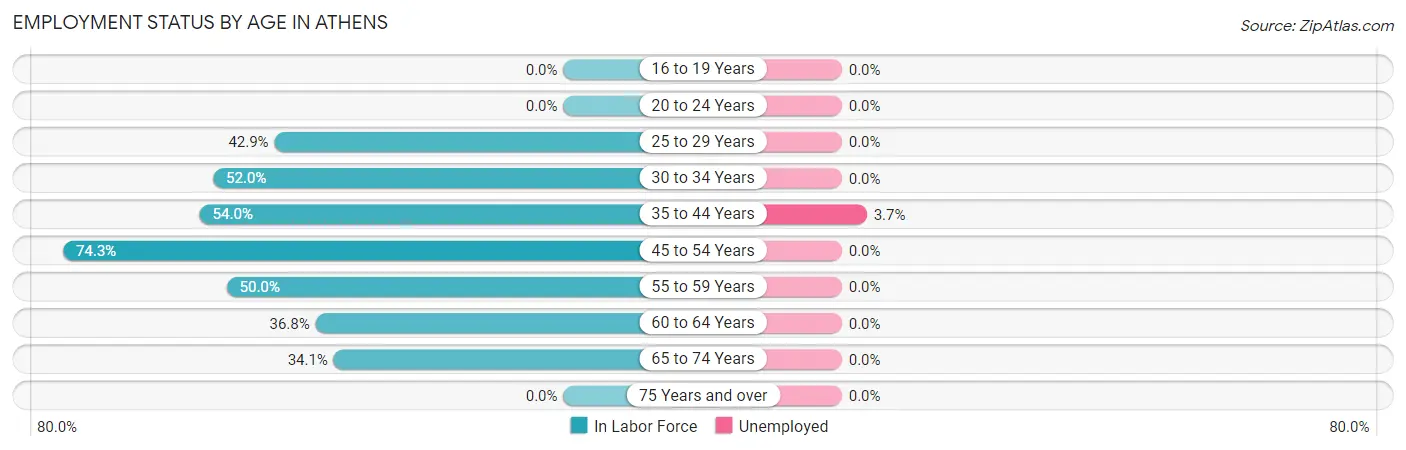
| Age Bracket | In Labor Force | Unemployed |
| 16 to 19 Years | 0 (0.0%) | 0 (0.0%) |
| 20 to 24 Years | 0 (0.0%) | 0 (0.0%) |
| 25 to 29 Years | 3 (42.9%) | 0 (0.0%) |
| 30 to 34 Years | 13 (52.0%) | 0 (0.0%) |
| 35 to 44 Years | 27 (54.0%) | 1 (3.7%) |
| 45 to 54 Years | 26 (74.3%) | 0 (0.0%) |
| 55 to 59 Years | 5 (50.0%) | 0 (0.0%) |
| 60 to 64 Years | 7 (36.8%) | 0 (0.0%) |
| 65 to 74 Years | 14 (34.1%) | 0 (0.0%) |
| 75 Years and over | 0 (0.0%) | 0 (0.0%) |
| Total | 95 (46.8%) | 1 (1.1%) |
Employment Status by Educational Attainment in Athens
According to labor force statistics for Athens, 55.5% of individuals (81) out of the total population between 25 and 64 years of age (146) are in the labor force, with 1.2% or 1 of them being unemployed. The group with the highest labor force participation rate are those with the educational attainment of college / associate degree, with 81.1% or 43 individuals in the labor force. Within the labor force, individuals with college / associate degree education have the highest percentage of unemployment, with 2.3% or 1 of them being unemployed.
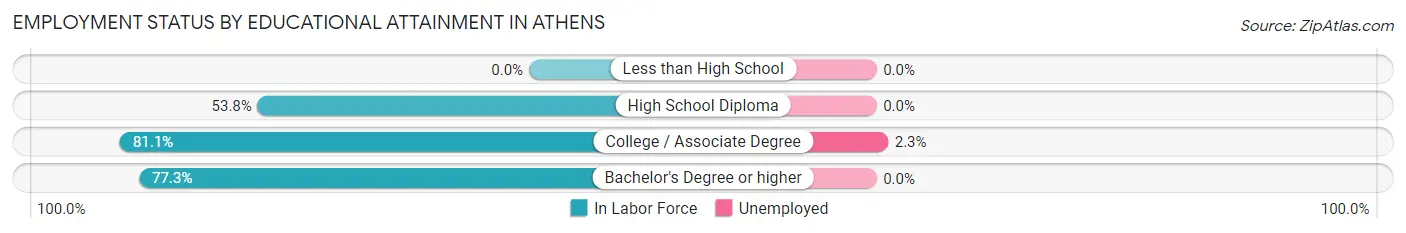
| Educational Attainment | In Labor Force | Unemployed |
| Less than High School | 0 (0.0%) | 0 (0.0%) |
| High School Diploma | 21 (53.8%) | 0 (0.0%) |
| College / Associate Degree | 43 (81.1%) | 1 (2.3%) |
| Bachelor's Degree or higher | 17 (77.3%) | 0 (0.0%) |
| Total | 81 (55.5%) | 2 (1.2%) |
Employment Occupations by Sex in Athens
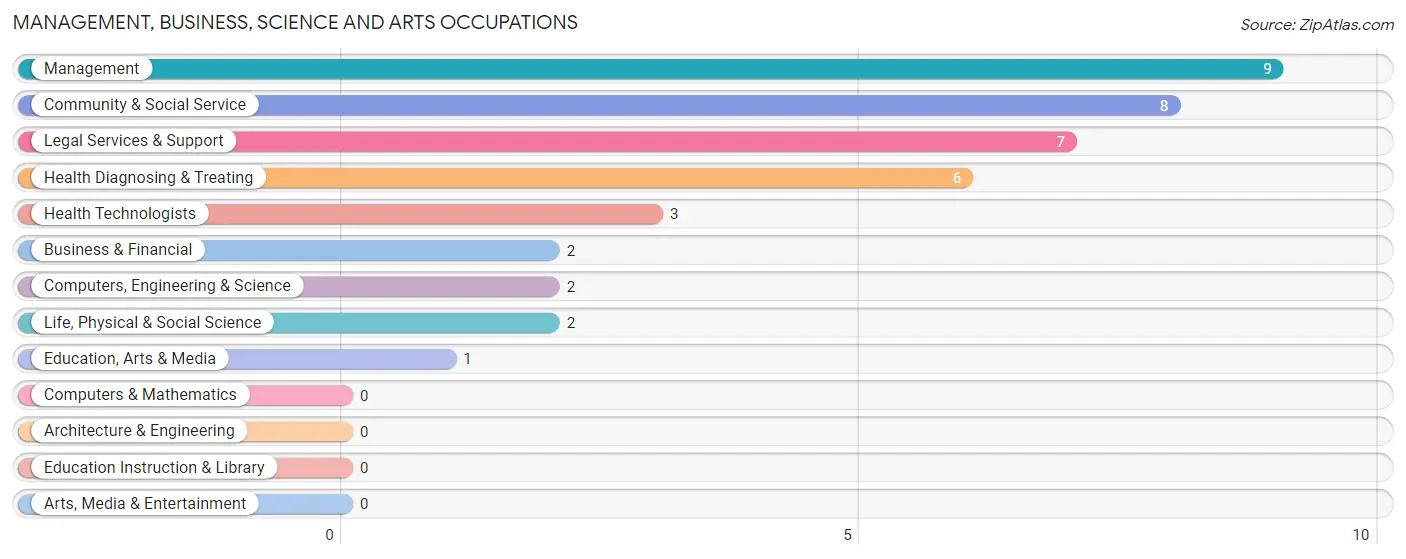
Management, Business, Science and Arts Occupations
The most common Management, Business, Science and Arts occupations in Athens are Management (9 | 9.6%), Community & Social Service (8 | 8.5%), Legal Services & Support (7 | 7.4%), Health Diagnosing & Treating (6 | 6.4%), and Health Technologists (3 | 3.2%).
Management, Business, Science and Arts Occupations by Sex
Within the Management, Business, Science and Arts occupations in Athens, the most male-oriented occupations are Computers, Engineering & Science (100.0%), Life, Physical & Social Science (100.0%), and Health Technologists (33.3%), while the most female-oriented occupations are Business & Financial (100.0%), Education, Arts & Media (100.0%), and Health Diagnosing & Treating (83.3%).
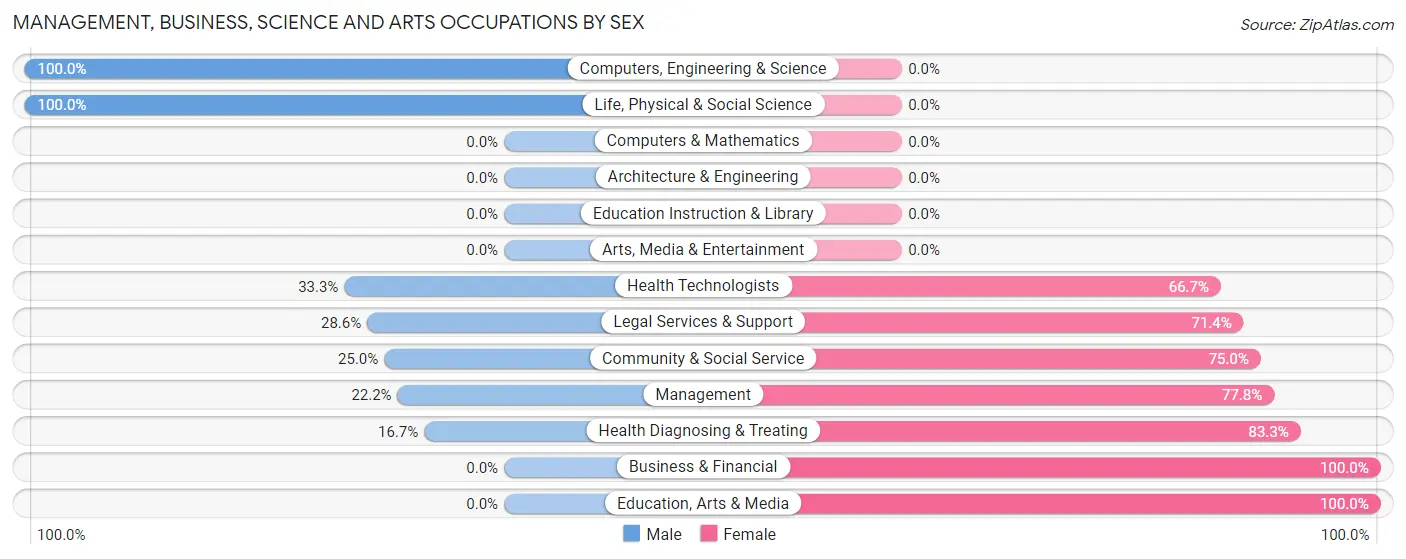
| Occupation | Male | Female |
| Management | 2 (22.2%) | 7 (77.8%) |
| Business & Financial | 0 (0.0%) | 2 (100.0%) |
| Computers, Engineering & Science | 2 (100.0%) | 0 (0.0%) |
| Computers & Mathematics | 0 (0.0%) | 0 (0.0%) |
| Architecture & Engineering | 0 (0.0%) | 0 (0.0%) |
| Life, Physical & Social Science | 2 (100.0%) | 0 (0.0%) |
| Community & Social Service | 2 (25.0%) | 6 (75.0%) |
| Education, Arts & Media | 0 (0.0%) | 1 (100.0%) |
| Legal Services & Support | 2 (28.6%) | 5 (71.4%) |
| Education Instruction & Library | 0 (0.0%) | 0 (0.0%) |
| Arts, Media & Entertainment | 0 (0.0%) | 0 (0.0%) |
| Health Diagnosing & Treating | 1 (16.7%) | 5 (83.3%) |
| Health Technologists | 1 (33.3%) | 2 (66.7%) |
| Total (Category) | 7 (25.9%) | 20 (74.1%) |
| Total (Overall) | 44 (46.8%) | 50 (53.2%) |
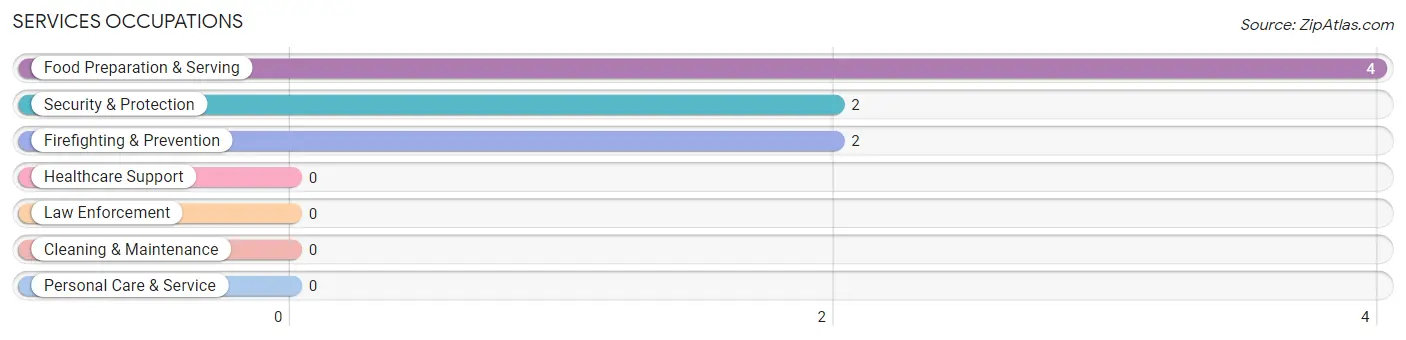
Services Occupations
The most common Services occupations in Athens are Food Preparation & Serving (4 | 4.3%), Security & Protection (2 | 2.1%), and Firefighting & Prevention (2 | 2.1%).
Services Occupations by Sex
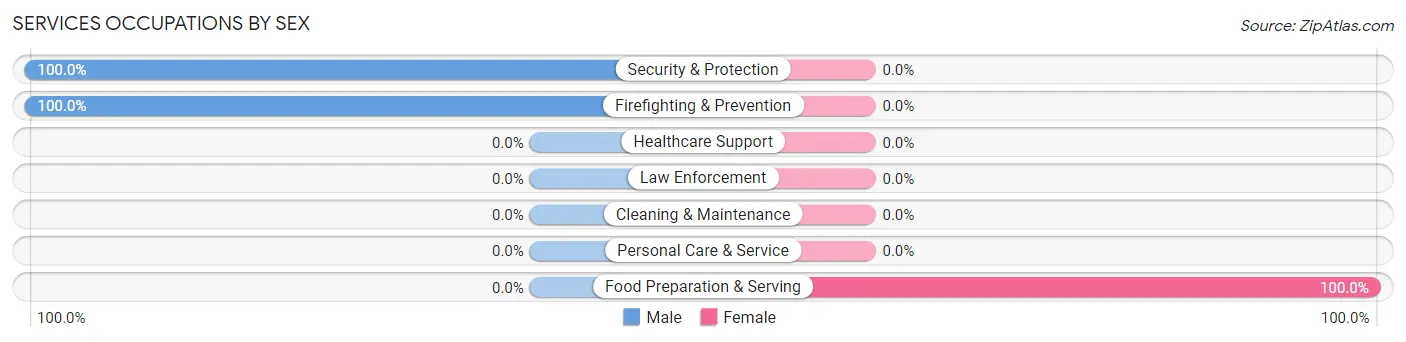
| Occupation | Male | Female |
| Healthcare Support | 0 (0.0%) | 0 (0.0%) |
| Security & Protection | 2 (100.0%) | 0 (0.0%) |
| Firefighting & Prevention | 2 (100.0%) | 0 (0.0%) |
| Law Enforcement | 0 (0.0%) | 0 (0.0%) |
| Food Preparation & Serving | 0 (0.0%) | 4 (100.0%) |
| Cleaning & Maintenance | 0 (0.0%) | 0 (0.0%) |
| Personal Care & Service | 0 (0.0%) | 0 (0.0%) |
| Total (Category) | 2 (33.3%) | 4 (66.7%) |
| Total (Overall) | 44 (46.8%) | 50 (53.2%) |
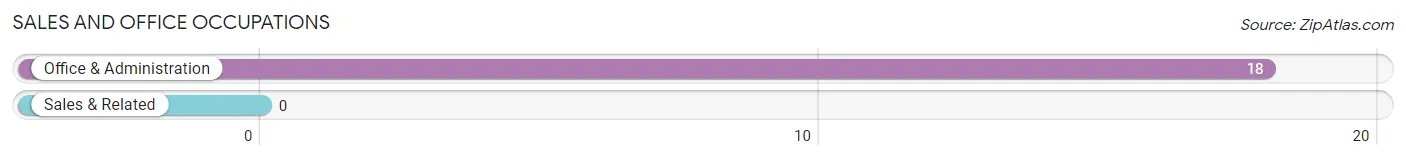
Sales and Office Occupations
The most common Sales and Office occupations in Athens are , and Office & Administration (18 | 19.2%).
Sales and Office Occupations by Sex
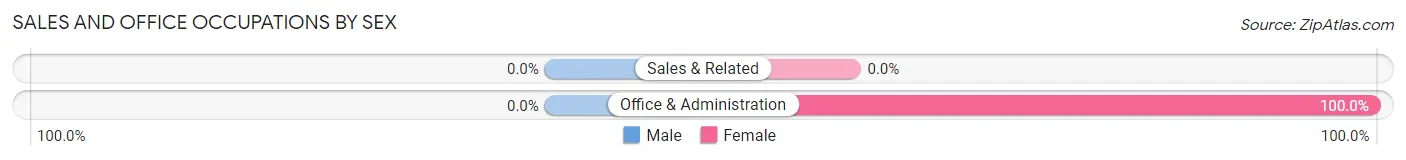
| Occupation | Male | Female |
| Sales & Related | 0 (0.0%) | 0 (0.0%) |
| Office & Administration | 0 (0.0%) | 18 (100.0%) |
| Total (Category) | 0 (0.0%) | 18 (100.0%) |
| Total (Overall) | 44 (46.8%) | 50 (53.2%) |
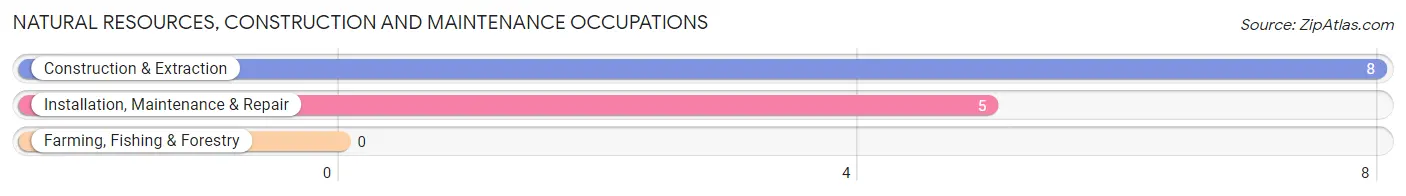
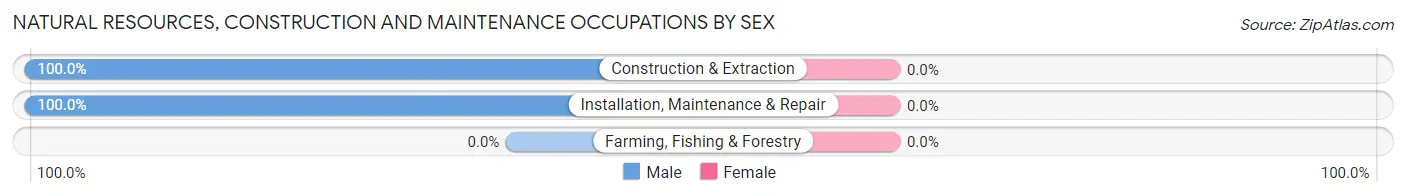
Natural Resources, Construction and Maintenance Occupations
The most common Natural Resources, Construction and Maintenance occupations in Athens are Construction & Extraction (8 | 8.5%), and Installation, Maintenance & Repair (5 | 5.3%).
Natural Resources, Construction and Maintenance Occupations by Sex
| Occupation | Male | Female |
| Farming, Fishing & Forestry | 0 (0.0%) | 0 (0.0%) |
| Construction & Extraction | 8 (100.0%) | 0 (0.0%) |
| Installation, Maintenance & Repair | 5 (100.0%) | 0 (0.0%) |
| Total (Category) | 13 (100.0%) | 0 (0.0%) |
| Total (Overall) | 44 (46.8%) | 50 (53.2%) |
Production, Transportation and Moving Occupations
The most common Production, Transportation and Moving occupations in Athens are Production (16 | 17.0%), and Transportation (14 | 14.9%).
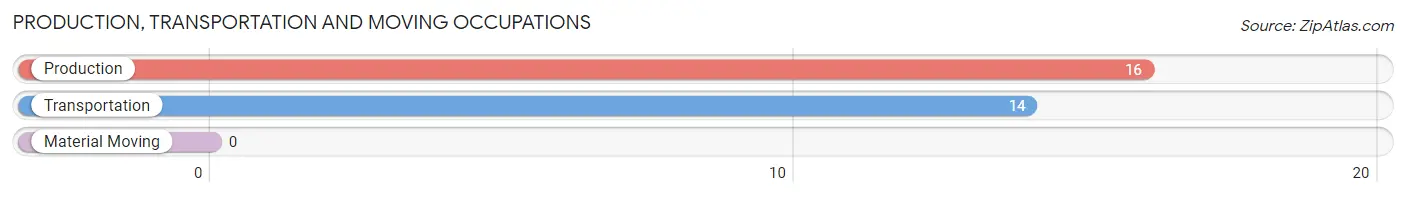
Production, Transportation and Moving Occupations by Sex
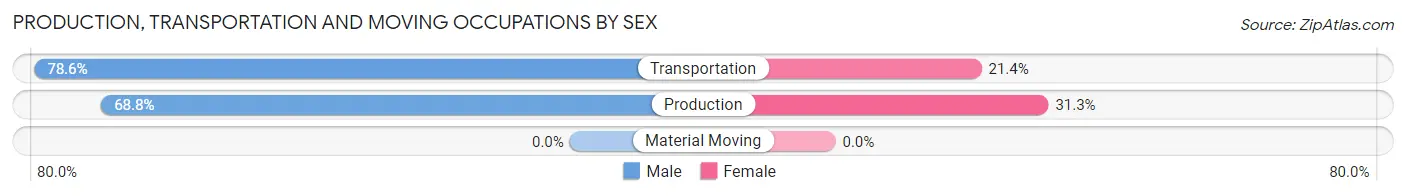
| Occupation | Male | Female |
| Production | 11 (68.8%) | 5 (31.2%) |
| Transportation | 11 (78.6%) | 3 (21.4%) |
| Material Moving | 0 (0.0%) | 0 (0.0%) |
| Total (Category) | 22 (73.3%) | 8 (26.7%) |
| Total (Overall) | 44 (46.8%) | 50 (53.2%) |
Employment Industries by Sex in Athens
Employment Industries in Athens
The major employment industries in Athens include Professional & Scientific (18 | 19.2%), Mining, Quarrying, & Extraction (12 | 12.8%), Construction (11 | 11.7%), Manufacturing (11 | 11.7%), and Public Administration (9 | 9.6%).
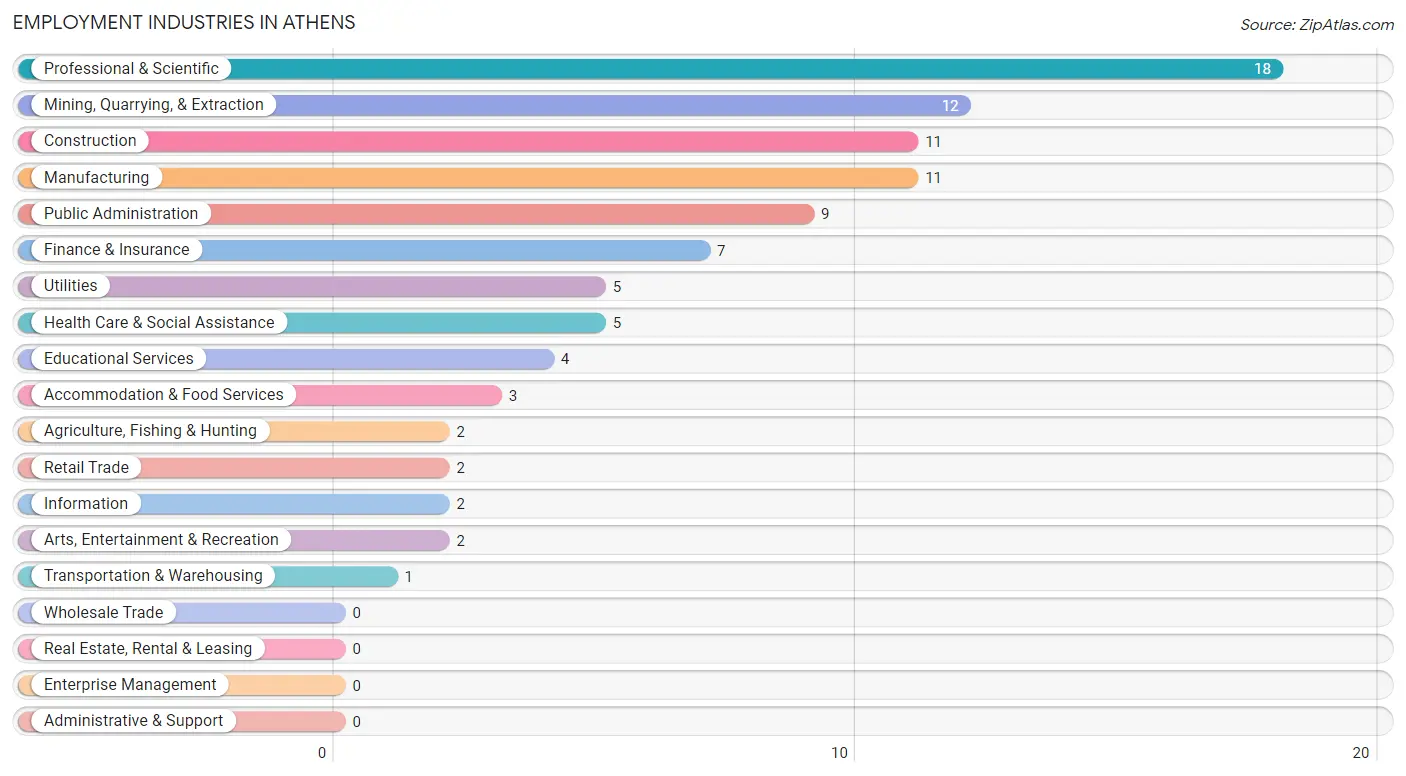
Employment Industries by Sex in Athens
The Athens industries that see more men than women are Agriculture, Fishing & Hunting (100.0%), Mining, Quarrying, & Extraction (100.0%), and Construction (100.0%), whereas the industries that tend to have a higher number of women are Retail Trade (100.0%), Information (100.0%), and Finance & Insurance (100.0%).
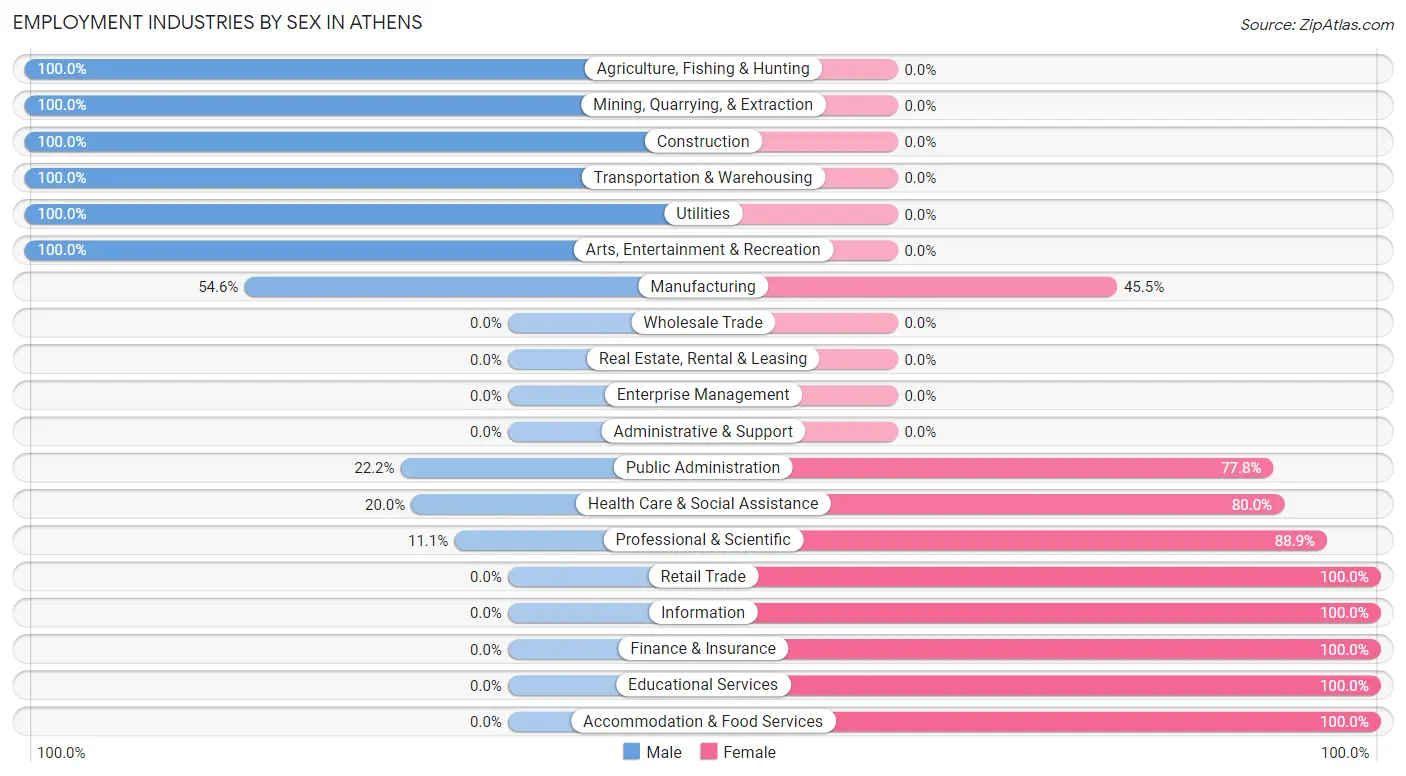
| Industry | Male | Female |
| Agriculture, Fishing & Hunting | 2 (100.0%) | 0 (0.0%) |
| Mining, Quarrying, & Extraction | 12 (100.0%) | 0 (0.0%) |
| Construction | 11 (100.0%) | 0 (0.0%) |
| Manufacturing | 6 (54.5%) | 5 (45.5%) |
| Wholesale Trade | 0 (0.0%) | 0 (0.0%) |
| Retail Trade | 0 (0.0%) | 2 (100.0%) |
| Transportation & Warehousing | 1 (100.0%) | 0 (0.0%) |
| Utilities | 5 (100.0%) | 0 (0.0%) |
| Information | 0 (0.0%) | 2 (100.0%) |
| Finance & Insurance | 0 (0.0%) | 7 (100.0%) |
| Real Estate, Rental & Leasing | 0 (0.0%) | 0 (0.0%) |
| Professional & Scientific | 2 (11.1%) | 16 (88.9%) |
| Enterprise Management | 0 (0.0%) | 0 (0.0%) |
| Administrative & Support | 0 (0.0%) | 0 (0.0%) |
| Educational Services | 0 (0.0%) | 4 (100.0%) |
| Health Care & Social Assistance | 1 (20.0%) | 4 (80.0%) |
| Arts, Entertainment & Recreation | 2 (100.0%) | 0 (0.0%) |
| Accommodation & Food Services | 0 (0.0%) | 3 (100.0%) |
| Public Administration | 2 (22.2%) | 7 (77.8%) |
| Total | 44 (46.8%) | 50 (53.2%) |
Education in Athens
School Enrollment in Athens
The most common levels of schooling among the 81 students in Athens are middle school (27 | 33.3%), high school (24 | 29.6%), and elementary school (18 | 22.2%).
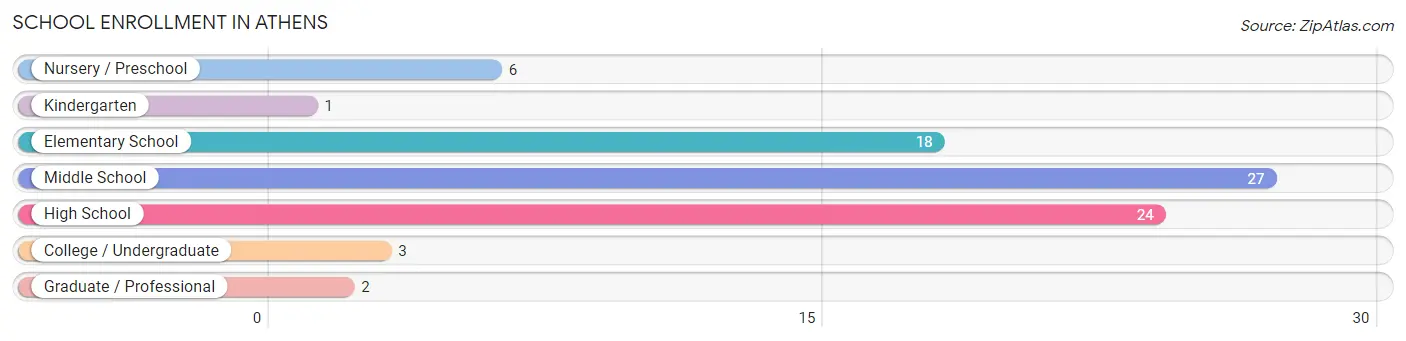
| School Level | # Students | % Students |
| Nursery / Preschool | 6 | 7.4% |
| Kindergarten | 1 | 1.2% |
| Elementary School | 18 | 22.2% |
| Middle School | 27 | 33.3% |
| High School | 24 | 29.6% |
| College / Undergraduate | 3 | 3.7% |
| Graduate / Professional | 2 | 2.5% |
| Total | 81 | 100.0% |
School Enrollment by Age by Funding Source in Athens
Out of a total of 81 students who are enrolled in schools in Athens, 26 (32.1%) attend a private institution, while the remaining 55 (67.9%) are enrolled in public schools. The age group of 15 to 17 year olds has the highest likelihood of being enrolled in private schools, with 7 (87.5% in the age bracket) enrolled. Conversely, the age group of 3 to 4 year olds has the lowest likelihood of being enrolled in a private school, with 4 (100.0% in the age bracket) attending a public institution.

| Age Bracket | Public School | Private School |
| 3 to 4 Year Olds | 4 (100.0%) | 0 (0.0%) |
| 5 to 9 Year Old | 18 (85.7%) | 3 (14.3%) |
| 10 to 14 Year Olds | 17 (63.0%) | 10 (37.0%) |
| 15 to 17 Year Olds | 1 (12.5%) | 7 (87.5%) |
| 18 to 19 Year Olds | 10 (90.9%) | 1 (9.1%) |
| 20 to 24 Year Olds | 0 (0.0%) | 0 (0.0%) |
| 25 to 34 Year Olds | 0 (0.0%) | 0 (0.0%) |
| 35 Years and over | 5 (50.0%) | 5 (50.0%) |
| Total | 55 (67.9%) | 26 (32.1%) |
Educational Attainment by Field of Study in Athens
Science & technology (13 | 48.1%), bio, nature & agricultural (4 | 14.8%), education (3 | 11.1%), business (2 | 7.4%), and arts & humanities (2 | 7.4%) are the most common fields of study among 27 individuals in Athens who have obtained a bachelor's degree or higher.
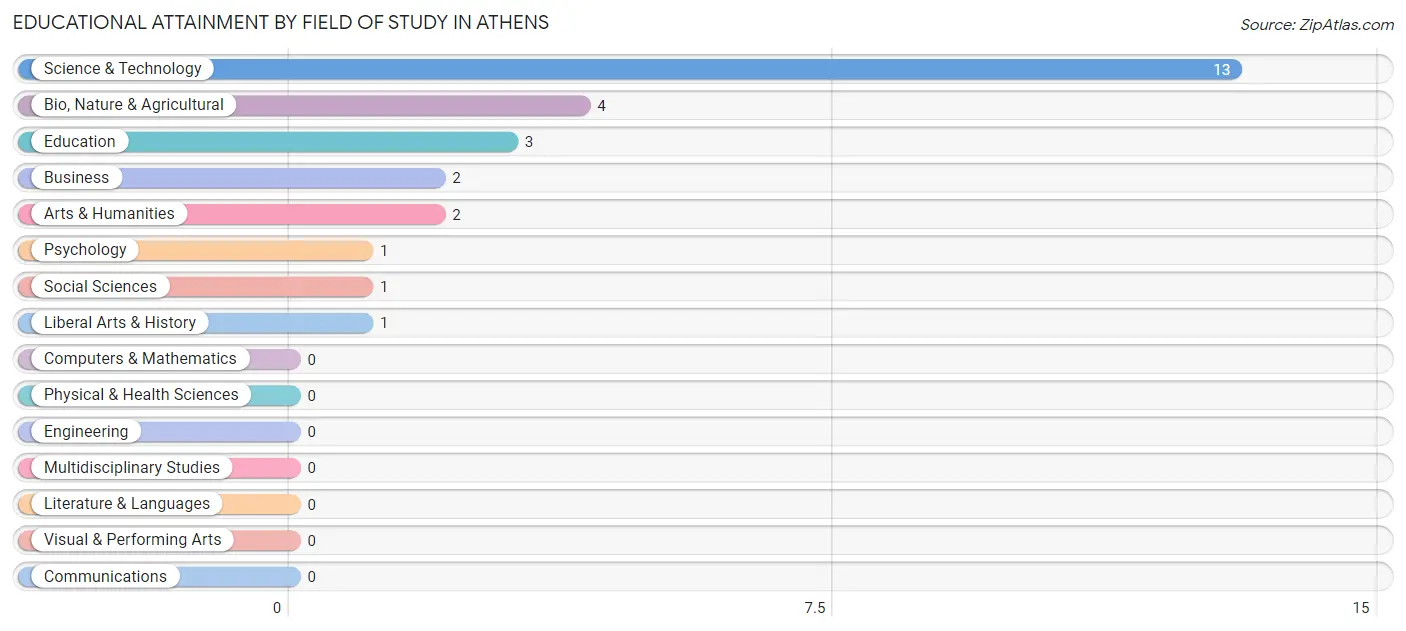
| Field of Study | # Graduates | % Graduates |
| Computers & Mathematics | 0 | 0.0% |
| Bio, Nature & Agricultural | 4 | 14.8% |
| Physical & Health Sciences | 0 | 0.0% |
| Psychology | 1 | 3.7% |
| Social Sciences | 1 | 3.7% |
| Engineering | 0 | 0.0% |
| Multidisciplinary Studies | 0 | 0.0% |
| Science & Technology | 13 | 48.1% |
| Business | 2 | 7.4% |
| Education | 3 | 11.1% |
| Literature & Languages | 0 | 0.0% |
| Liberal Arts & History | 1 | 3.7% |
| Visual & Performing Arts | 0 | 0.0% |
| Communications | 0 | 0.0% |
| Arts & Humanities | 2 | 7.4% |
| Total | 27 | 100.0% |
Transportation & Commute in Athens
Vehicle Availability by Sex in Athens
The most prevalent vehicle ownership categories in Athens are males with 2 vehicles (12, accounting for 27.3%) and females with 2 vehicles (5, making up 24.5%).
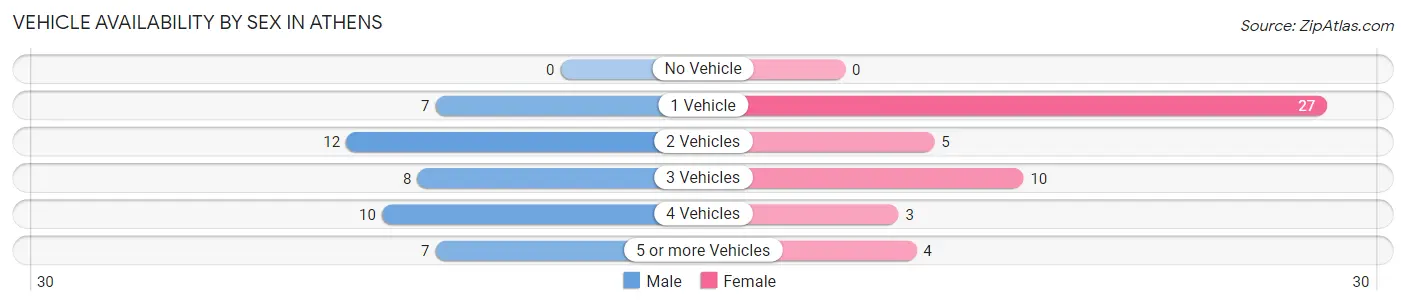
| Vehicles Available | Male | Female |
| No Vehicle | 0 (0.0%) | 0 (0.0%) |
| 1 Vehicle | 7 (15.9%) | 27 (55.1%) |
| 2 Vehicles | 12 (27.3%) | 5 (10.2%) |
| 3 Vehicles | 8 (18.2%) | 10 (20.4%) |
| 4 Vehicles | 10 (22.7%) | 3 (6.1%) |
| 5 or more Vehicles | 7 (15.9%) | 4 (8.2%) |
| Total | 44 (100.0%) | 49 (100.0%) |
Commute Time in Athens
The most frequently occuring commute durations in Athens are 15 to 19 minutes (17 commuters, 20.7%), 20 to 24 minutes (16 commuters, 19.5%), and 30 to 34 minutes (14 commuters, 17.1%).
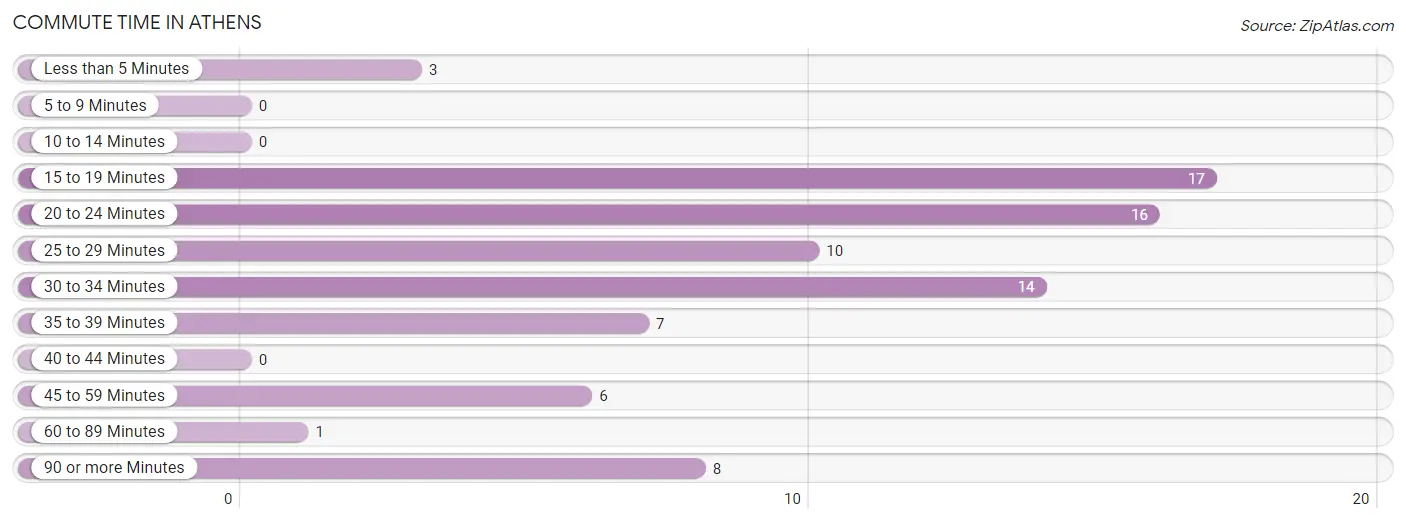
| Commute Time | # Commuters | % Commuters |
| Less than 5 Minutes | 3 | 3.7% |
| 5 to 9 Minutes | 0 | 0.0% |
| 10 to 14 Minutes | 0 | 0.0% |
| 15 to 19 Minutes | 17 | 20.7% |
| 20 to 24 Minutes | 16 | 19.5% |
| 25 to 29 Minutes | 10 | 12.2% |
| 30 to 34 Minutes | 14 | 17.1% |
| 35 to 39 Minutes | 7 | 8.5% |
| 40 to 44 Minutes | 0 | 0.0% |
| 45 to 59 Minutes | 6 | 7.3% |
| 60 to 89 Minutes | 1 | 1.2% |
| 90 or more Minutes | 8 | 9.8% |
Commute Time by Sex in Athens
The most common commute times in Athens are 15 to 19 minutes (16 commuters, 36.4%) for males and 30 to 34 minutes (13 commuters, 34.2%) for females.
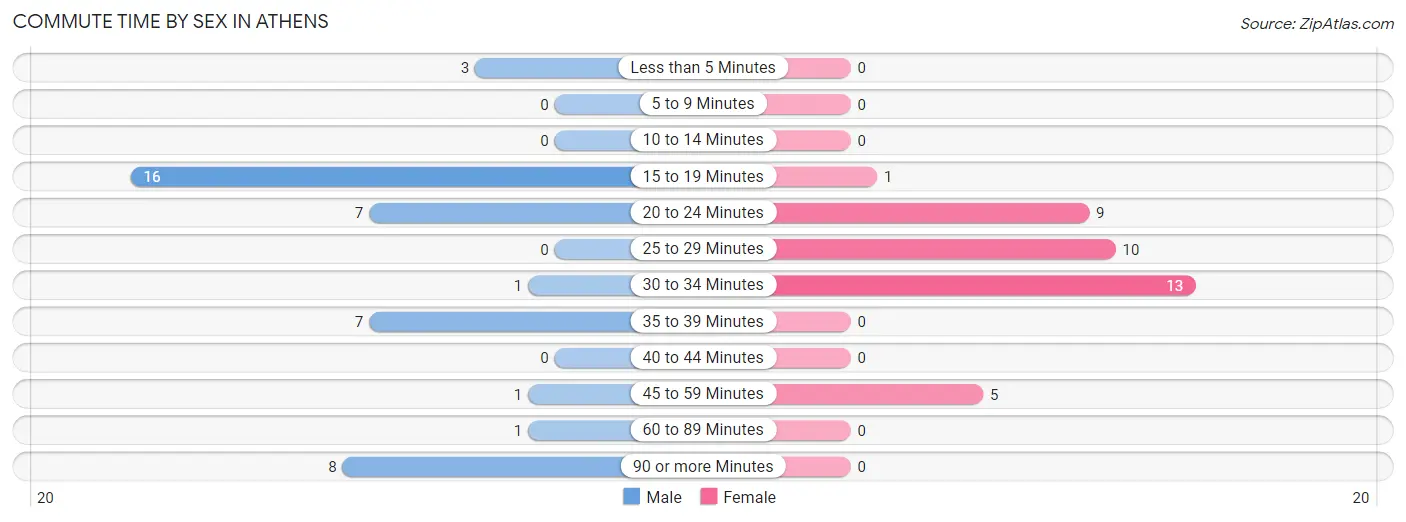
| Commute Time | Male | Female |
| Less than 5 Minutes | 3 (6.8%) | 0 (0.0%) |
| 5 to 9 Minutes | 0 (0.0%) | 0 (0.0%) |
| 10 to 14 Minutes | 0 (0.0%) | 0 (0.0%) |
| 15 to 19 Minutes | 16 (36.4%) | 1 (2.6%) |
| 20 to 24 Minutes | 7 (15.9%) | 9 (23.7%) |
| 25 to 29 Minutes | 0 (0.0%) | 10 (26.3%) |
| 30 to 34 Minutes | 1 (2.3%) | 13 (34.2%) |
| 35 to 39 Minutes | 7 (15.9%) | 0 (0.0%) |
| 40 to 44 Minutes | 0 (0.0%) | 0 (0.0%) |
| 45 to 59 Minutes | 1 (2.3%) | 5 (13.2%) |
| 60 to 89 Minutes | 1 (2.3%) | 0 (0.0%) |
| 90 or more Minutes | 8 (18.2%) | 0 (0.0%) |
Time of Departure to Work by Sex in Athens
The most frequent times of departure to work in Athens are 6:00 AM to 6:29 AM (12, 27.3%) for males and 7:00 AM to 7:29 AM (15, 39.5%) for females.
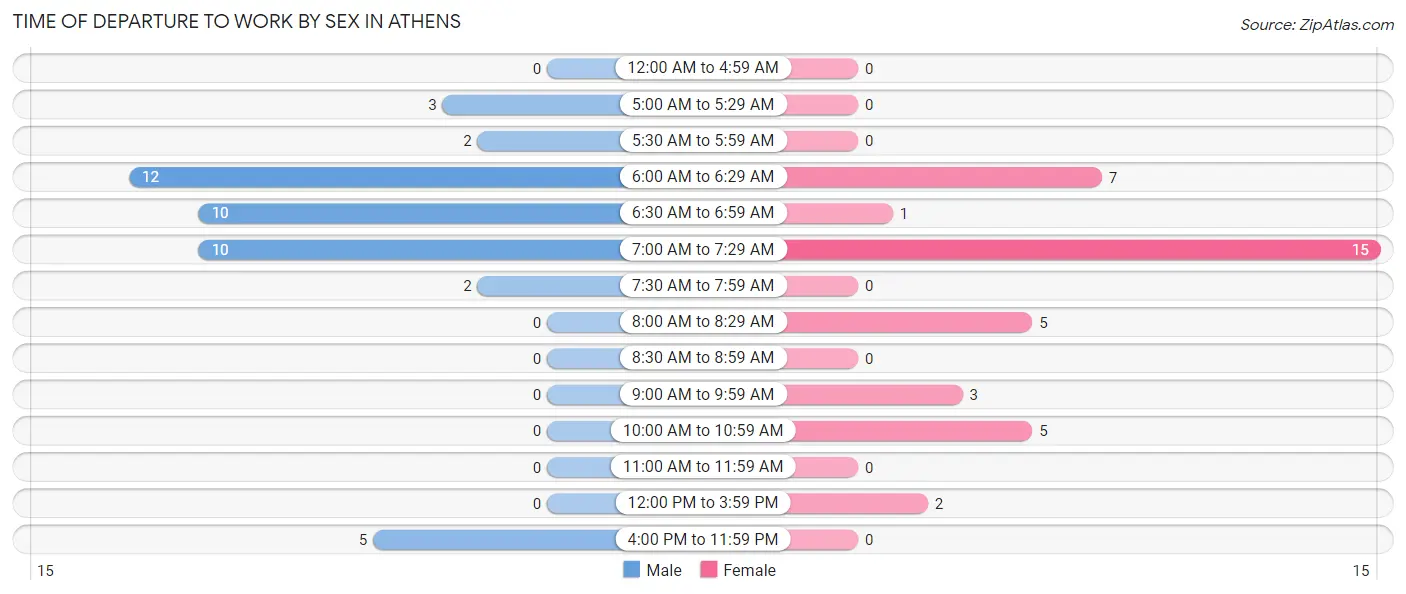
| Time of Departure | Male | Female |
| 12:00 AM to 4:59 AM | 0 (0.0%) | 0 (0.0%) |
| 5:00 AM to 5:29 AM | 3 (6.8%) | 0 (0.0%) |
| 5:30 AM to 5:59 AM | 2 (4.5%) | 0 (0.0%) |
| 6:00 AM to 6:29 AM | 12 (27.3%) | 7 (18.4%) |
| 6:30 AM to 6:59 AM | 10 (22.7%) | 1 (2.6%) |
| 7:00 AM to 7:29 AM | 10 (22.7%) | 15 (39.5%) |
| 7:30 AM to 7:59 AM | 2 (4.5%) | 0 (0.0%) |
| 8:00 AM to 8:29 AM | 0 (0.0%) | 5 (13.2%) |
| 8:30 AM to 8:59 AM | 0 (0.0%) | 0 (0.0%) |
| 9:00 AM to 9:59 AM | 0 (0.0%) | 3 (7.9%) |
| 10:00 AM to 10:59 AM | 0 (0.0%) | 5 (13.2%) |
| 11:00 AM to 11:59 AM | 0 (0.0%) | 0 (0.0%) |
| 12:00 PM to 3:59 PM | 0 (0.0%) | 2 (5.3%) |
| 4:00 PM to 11:59 PM | 5 (11.4%) | 0 (0.0%) |
| Total | 44 (100.0%) | 38 (100.0%) |
Housing Occupancy in Athens
Occupancy by Ownership in Athens
Of the total 134 dwellings in Athens, owner-occupied units account for 101 (75.4%), while renter-occupied units make up 33 (24.6%).
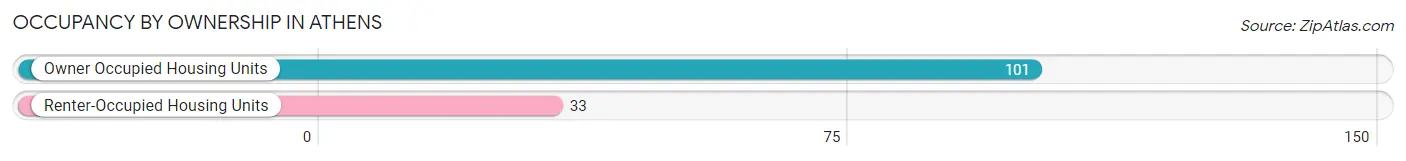
| Occupancy | # Housing Units | % Housing Units |
| Owner Occupied Housing Units | 101 | 75.4% |
| Renter-Occupied Housing Units | 33 | 24.6% |
| Total Occupied Housing Units | 134 | 100.0% |
Occupancy by Household Size in Athens
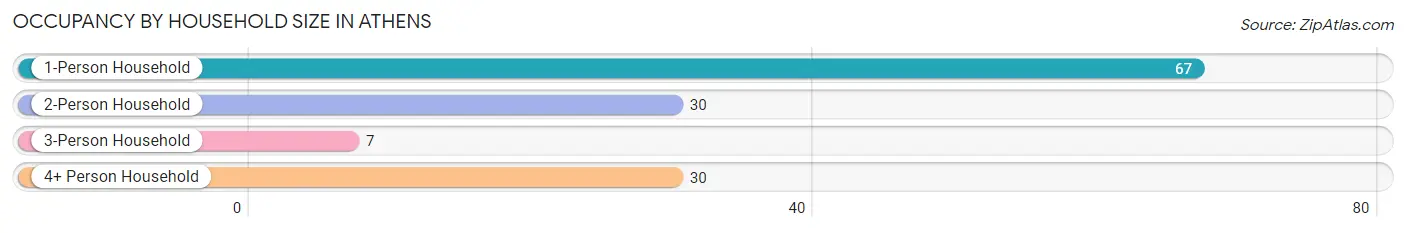
| Household Size | # Housing Units | % Housing Units |
| 1-Person Household | 67 | 50.0% |
| 2-Person Household | 30 | 22.4% |
| 3-Person Household | 7 | 5.2% |
| 4+ Person Household | 30 | 22.4% |
| Total Housing Units | 134 | 100.0% |
Occupancy by Ownership by Household Size in Athens
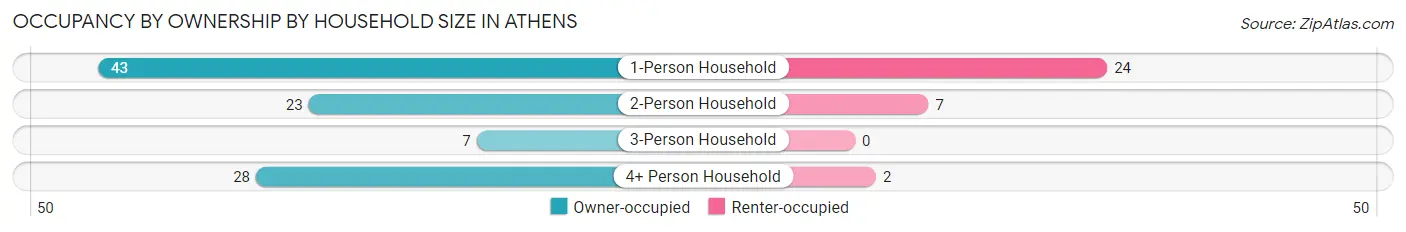
| Household Size | Owner-occupied | Renter-occupied |
| 1-Person Household | 43 (64.2%) | 24 (35.8%) |
| 2-Person Household | 23 (76.7%) | 7 (23.3%) |
| 3-Person Household | 7 (100.0%) | 0 (0.0%) |
| 4+ Person Household | 28 (93.3%) | 2 (6.7%) |
| Total Housing Units | 101 (75.4%) | 33 (24.6%) |
Occupancy by Educational Attainment in Athens
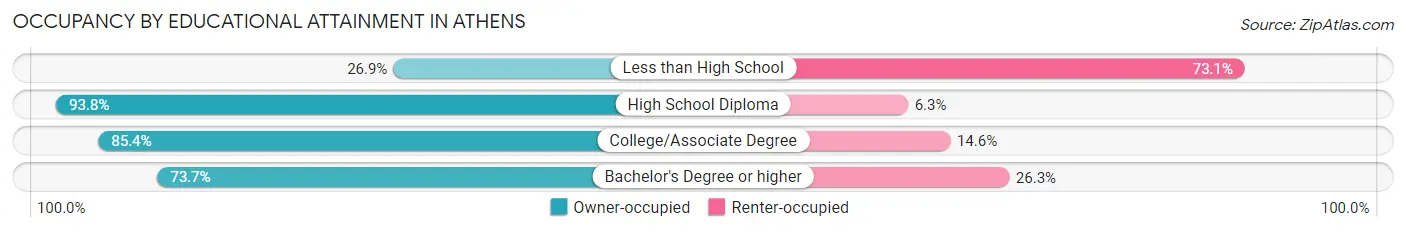
| Household Size | Owner-occupied | Renter-occupied |
| Less than High School | 7 (26.9%) | 19 (73.1%) |
| High School Diploma | 45 (93.8%) | 3 (6.2%) |
| College/Associate Degree | 35 (85.4%) | 6 (14.6%) |
| Bachelor's Degree or higher | 14 (73.7%) | 5 (26.3%) |
Occupancy by Age of Householder in Athens
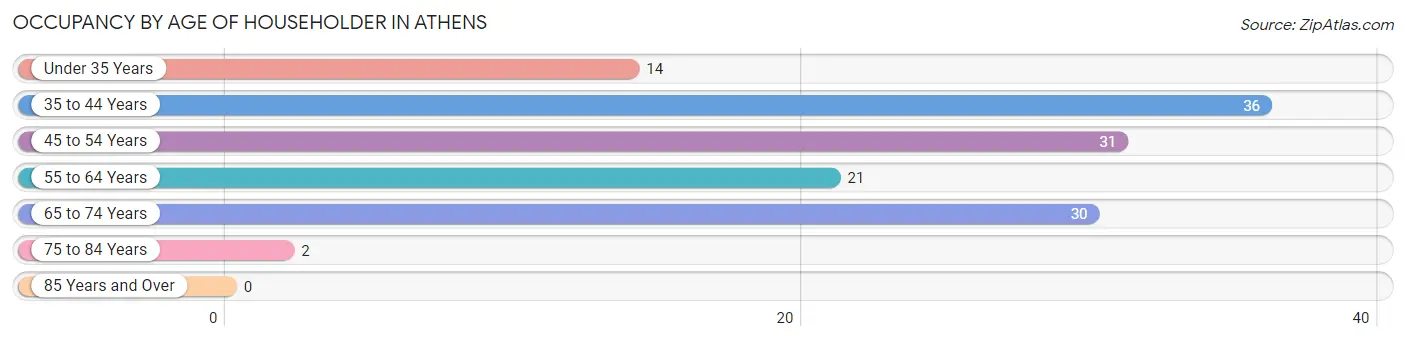
| Age Bracket | # Households | % Households |
| Under 35 Years | 14 | 10.4% |
| 35 to 44 Years | 36 | 26.9% |
| 45 to 54 Years | 31 | 23.1% |
| 55 to 64 Years | 21 | 15.7% |
| 65 to 74 Years | 30 | 22.4% |
| 75 to 84 Years | 2 | 1.5% |
| 85 Years and Over | 0 | 0.0% |
| Total | 134 | 100.0% |
Housing Finances in Athens
Median Income by Occupancy in Athens
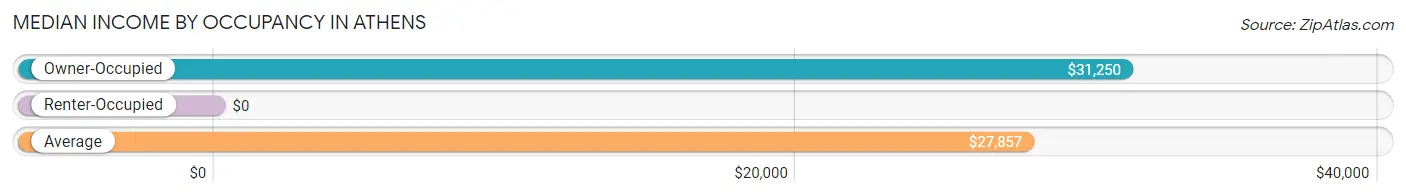
| Occupancy Type | # Households | Median Income |
| Owner-Occupied | 101 (75.4%) | $31,250 |
| Renter-Occupied | 33 (24.6%) | $0 |
| Average | 134 (100.0%) | $27,857 |
Occupancy by Householder Income Bracket in Athens
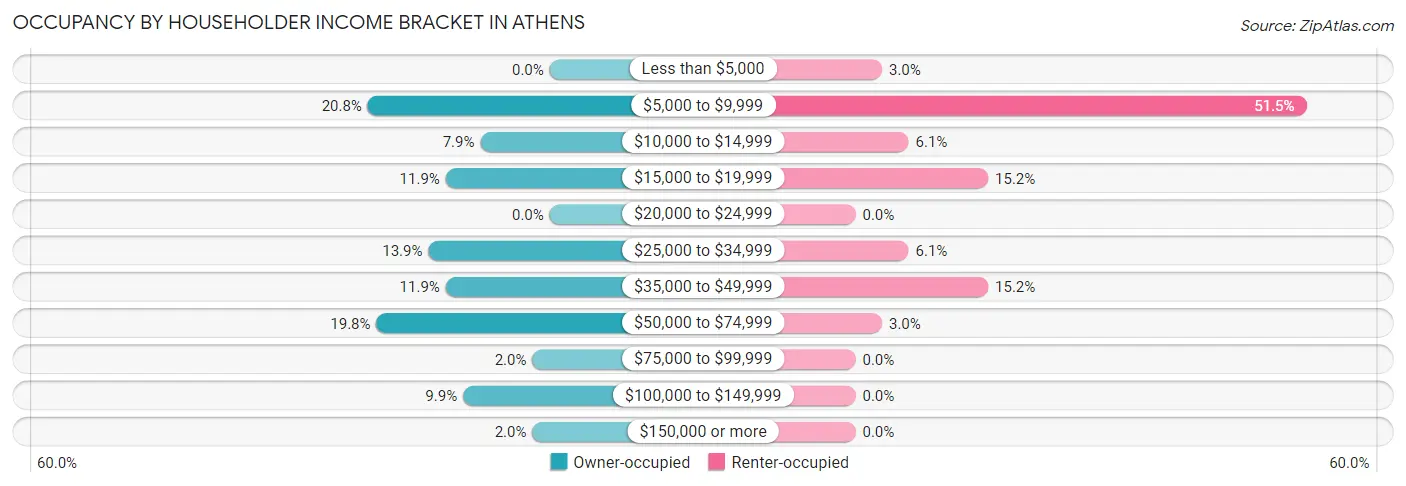
| Income Bracket | Owner-occupied | Renter-occupied |
| Less than $5,000 | 0 (0.0%) | 1 (3.0%) |
| $5,000 to $9,999 | 21 (20.8%) | 17 (51.5%) |
| $10,000 to $14,999 | 8 (7.9%) | 2 (6.1%) |
| $15,000 to $19,999 | 12 (11.9%) | 5 (15.1%) |
| $20,000 to $24,999 | 0 (0.0%) | 0 (0.0%) |
| $25,000 to $34,999 | 14 (13.9%) | 2 (6.1%) |
| $35,000 to $49,999 | 12 (11.9%) | 5 (15.1%) |
| $50,000 to $74,999 | 20 (19.8%) | 1 (3.0%) |
| $75,000 to $99,999 | 2 (2.0%) | 0 (0.0%) |
| $100,000 to $149,999 | 10 (9.9%) | 0 (0.0%) |
| $150,000 or more | 2 (2.0%) | 0 (0.0%) |
| Total | 101 (100.0%) | 33 (100.0%) |
Monthly Housing Cost Tiers in Athens
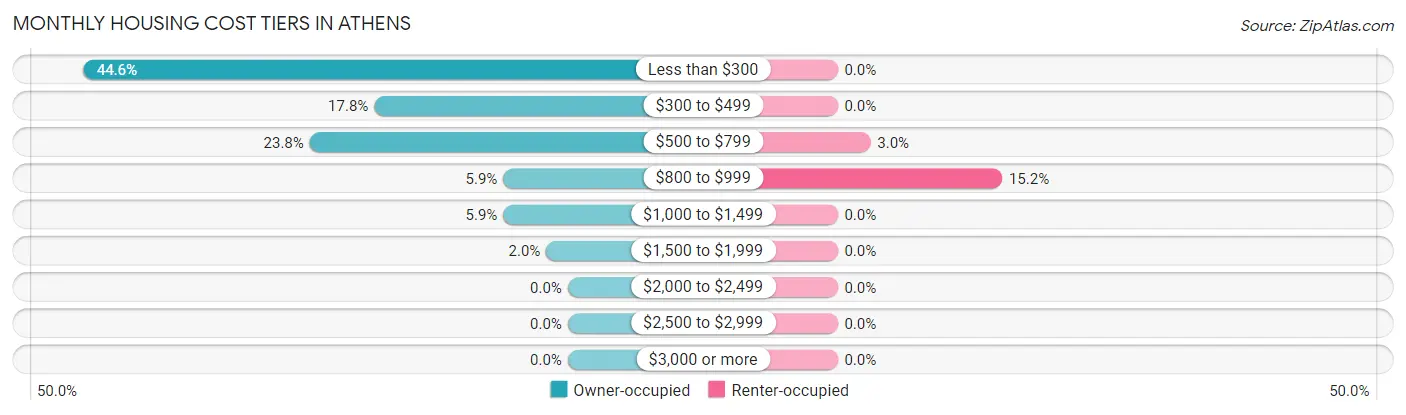
| Monthly Cost | Owner-occupied | Renter-occupied |
| Less than $300 | 45 (44.6%) | 0 (0.0%) |
| $300 to $499 | 18 (17.8%) | 0 (0.0%) |
| $500 to $799 | 24 (23.8%) | 1 (3.0%) |
| $800 to $999 | 6 (5.9%) | 5 (15.1%) |
| $1,000 to $1,499 | 6 (5.9%) | 0 (0.0%) |
| $1,500 to $1,999 | 2 (2.0%) | 0 (0.0%) |
| $2,000 to $2,499 | 0 (0.0%) | 0 (0.0%) |
| $2,500 to $2,999 | 0 (0.0%) | 0 (0.0%) |
| $3,000 or more | 0 (0.0%) | 0 (0.0%) |
| Total | 101 (100.0%) | 33 (100.0%) |
Physical Housing Characteristics in Athens
Housing Structures in Athens
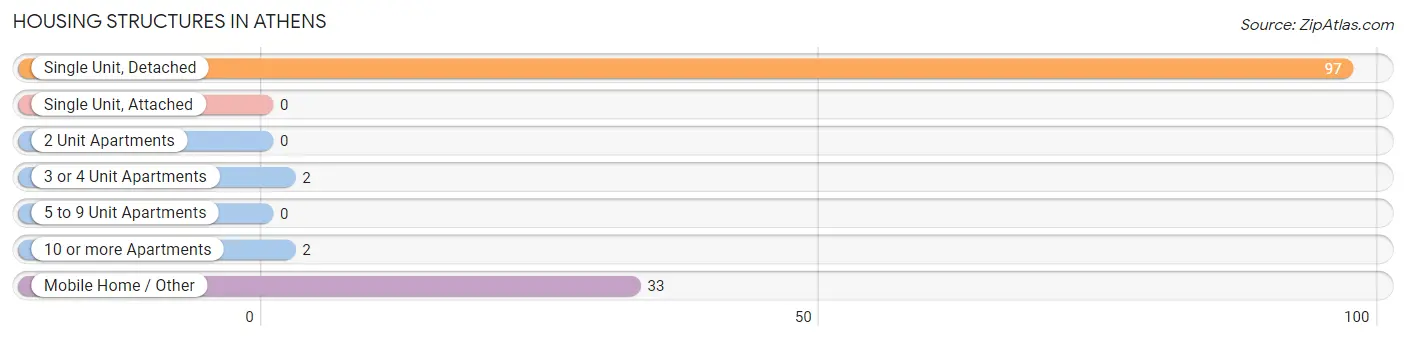
| Structure Type | # Housing Units | % Housing Units |
| Single Unit, Detached | 97 | 72.4% |
| Single Unit, Attached | 0 | 0.0% |
| 2 Unit Apartments | 0 | 0.0% |
| 3 or 4 Unit Apartments | 2 | 1.5% |
| 5 to 9 Unit Apartments | 0 | 0.0% |
| 10 or more Apartments | 2 | 1.5% |
| Mobile Home / Other | 33 | 24.6% |
| Total | 134 | 100.0% |
Housing Structures by Occupancy in Athens
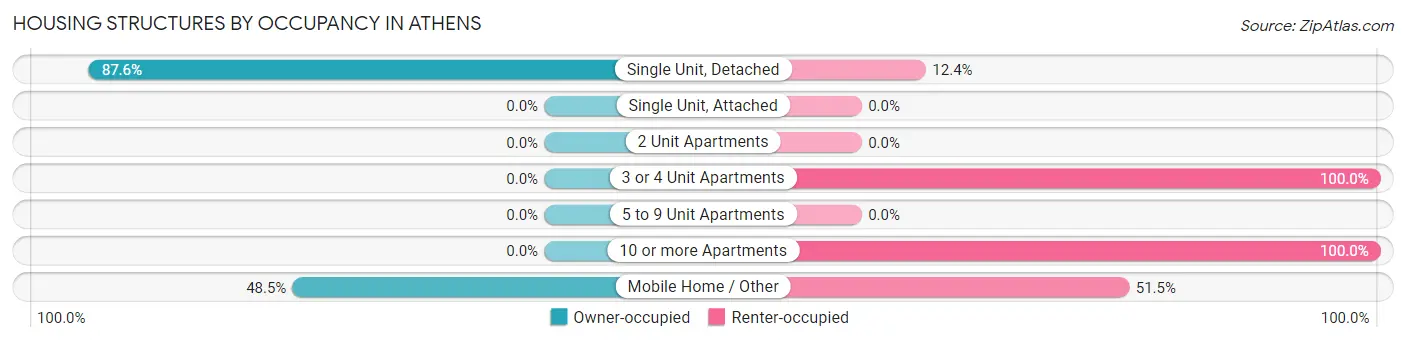
| Structure Type | Owner-occupied | Renter-occupied |
| Single Unit, Detached | 85 (87.6%) | 12 (12.4%) |
| Single Unit, Attached | 0 (0.0%) | 0 (0.0%) |
| 2 Unit Apartments | 0 (0.0%) | 0 (0.0%) |
| 3 or 4 Unit Apartments | 0 (0.0%) | 2 (100.0%) |
| 5 to 9 Unit Apartments | 0 (0.0%) | 0 (0.0%) |
| 10 or more Apartments | 0 (0.0%) | 2 (100.0%) |
| Mobile Home / Other | 16 (48.5%) | 17 (51.5%) |
| Total | 101 (75.4%) | 33 (24.6%) |
Housing Structures by Number of Rooms in Athens
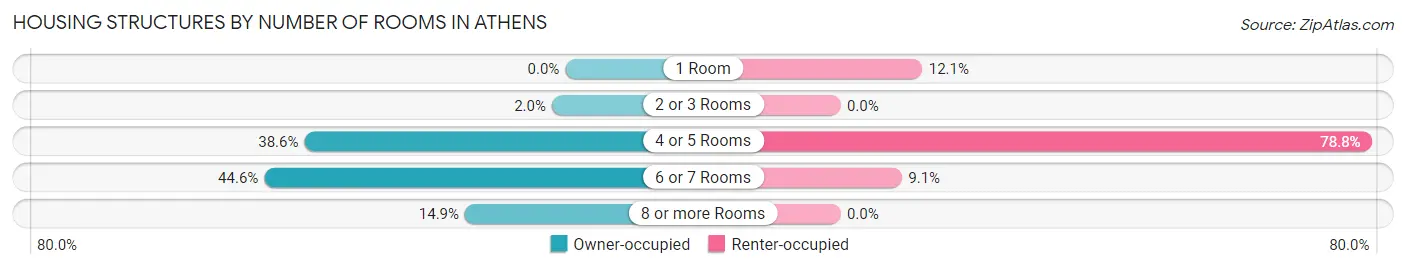
| Number of Rooms | Owner-occupied | Renter-occupied |
| 1 Room | 0 (0.0%) | 4 (12.1%) |
| 2 or 3 Rooms | 2 (2.0%) | 0 (0.0%) |
| 4 or 5 Rooms | 39 (38.6%) | 26 (78.8%) |
| 6 or 7 Rooms | 45 (44.6%) | 3 (9.1%) |
| 8 or more Rooms | 15 (14.8%) | 0 (0.0%) |
| Total | 101 (100.0%) | 33 (100.0%) |
Housing Structure by Heating Type in Athens
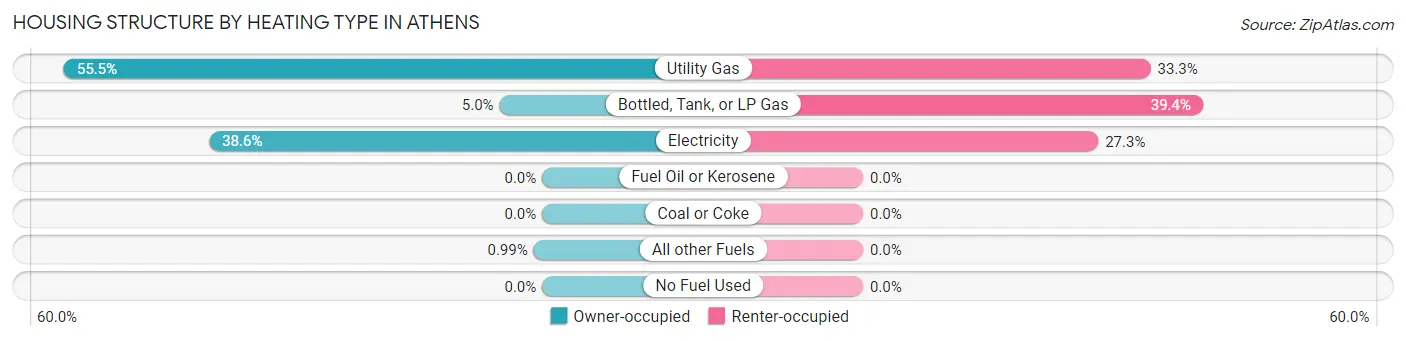
| Heating Type | Owner-occupied | Renter-occupied |
| Utility Gas | 56 (55.4%) | 11 (33.3%) |
| Bottled, Tank, or LP Gas | 5 (5.0%) | 13 (39.4%) |
| Electricity | 39 (38.6%) | 9 (27.3%) |
| Fuel Oil or Kerosene | 0 (0.0%) | 0 (0.0%) |
| Coal or Coke | 0 (0.0%) | 0 (0.0%) |
| All other Fuels | 1 (1.0%) | 0 (0.0%) |
| No Fuel Used | 0 (0.0%) | 0 (0.0%) |
| Total | 101 (100.0%) | 33 (100.0%) |
Household Vehicle Usage in Athens
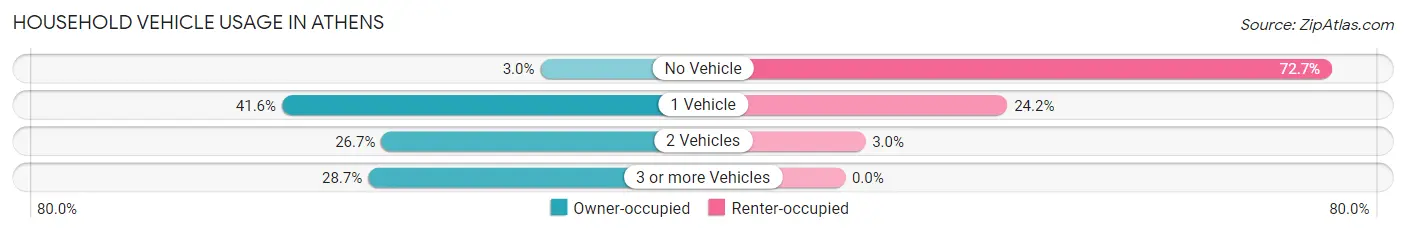
| Vehicles per Household | Owner-occupied | Renter-occupied |
| No Vehicle | 3 (3.0%) | 24 (72.7%) |
| 1 Vehicle | 42 (41.6%) | 8 (24.2%) |
| 2 Vehicles | 27 (26.7%) | 1 (3.0%) |
| 3 or more Vehicles | 29 (28.7%) | 0 (0.0%) |
| Total | 101 (100.0%) | 33 (100.0%) |
Real Estate & Mortgages in Athens
Real Estate and Mortgage Overview in Athens
| Characteristic | Without Mortgage | With Mortgage |
| Housing Units | 76 | 25 |
| Median Property Value | $86,100 | $0 |
| Median Household Income | - | - |
| Monthly Housing Costs | $239 | $0 |
| Real Estate Taxes | $199 | $10 |
Property Value by Mortgage Status in Athens
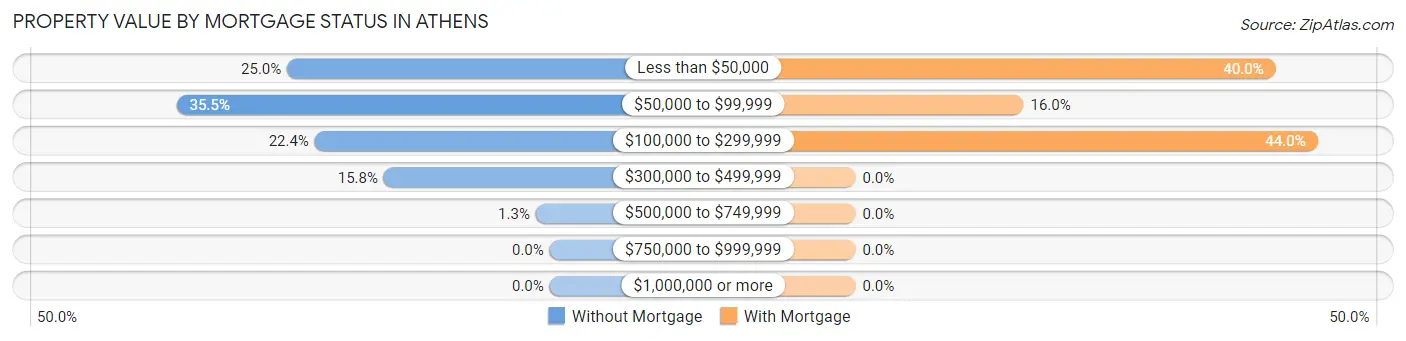
| Property Value | Without Mortgage | With Mortgage |
| Less than $50,000 | 19 (25.0%) | 10 (40.0%) |
| $50,000 to $99,999 | 27 (35.5%) | 4 (16.0%) |
| $100,000 to $299,999 | 17 (22.4%) | 11 (44.0%) |
| $300,000 to $499,999 | 12 (15.8%) | 0 (0.0%) |
| $500,000 to $749,999 | 1 (1.3%) | 0 (0.0%) |
| $750,000 to $999,999 | 0 (0.0%) | 0 (0.0%) |
| $1,000,000 or more | 0 (0.0%) | 0 (0.0%) |
| Total | 76 (100.0%) | 25 (100.0%) |
Household Income by Mortgage Status in Athens
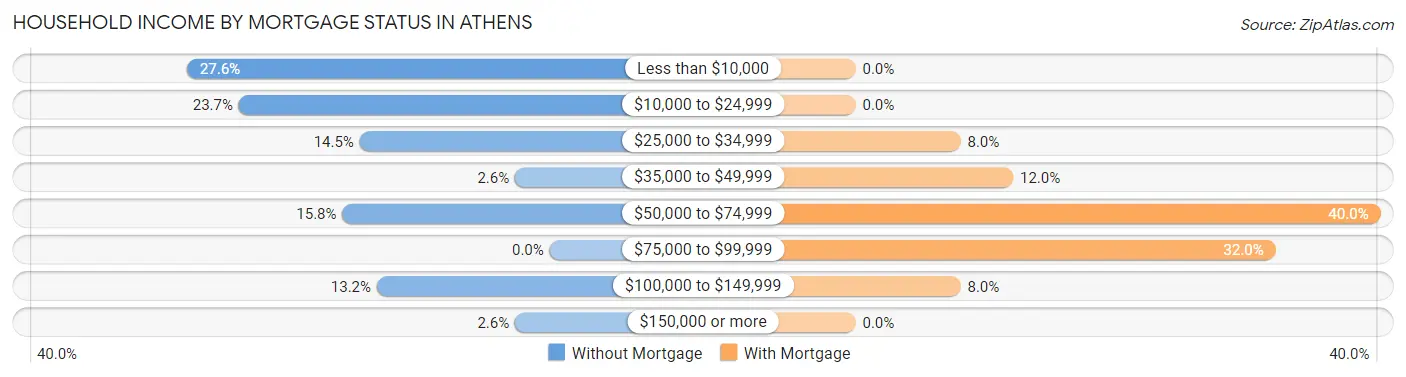
| Household Income | Without Mortgage | With Mortgage |
| Less than $10,000 | 21 (27.6%) | 0 (0.0%) |
| $10,000 to $24,999 | 18 (23.7%) | 0 (0.0%) |
| $25,000 to $34,999 | 11 (14.5%) | 2 (8.0%) |
| $35,000 to $49,999 | 2 (2.6%) | 3 (12.0%) |
| $50,000 to $74,999 | 12 (15.8%) | 10 (40.0%) |
| $75,000 to $99,999 | 0 (0.0%) | 8 (32.0%) |
| $100,000 to $149,999 | 10 (13.2%) | 2 (8.0%) |
| $150,000 or more | 2 (2.6%) | 0 (0.0%) |
| Total | 76 (100.0%) | 25 (100.0%) |
Property Value to Household Income Ratio in Athens
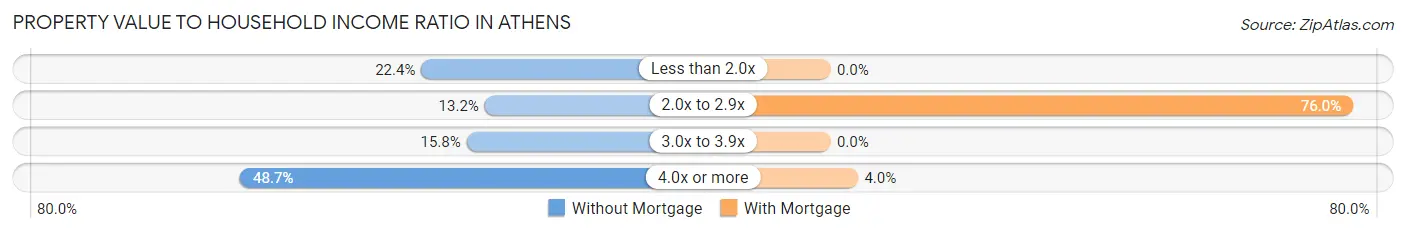
| Value-to-Income Ratio | Without Mortgage | With Mortgage |
| Less than 2.0x | 17 (22.4%) | 0 (0.0%) |
| 2.0x to 2.9x | 10 (13.2%) | 19 (76.0%) |
| 3.0x to 3.9x | 12 (15.8%) | 0 (0.0%) |
| 4.0x or more | 37 (48.7%) | 1 (4.0%) |
| Total | 76 (100.0%) | 25 (100.0%) |
Real Estate Taxes by Mortgage Status in Athens
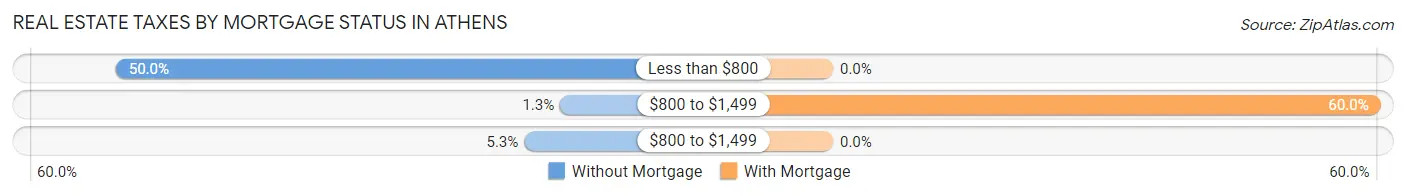
| Property Taxes | Without Mortgage | With Mortgage |
| Less than $800 | 38 (50.0%) | 0 (0.0%) |
| $800 to $1,499 | 1 (1.3%) | 15 (60.0%) |
| $800 to $1,499 | 4 (5.3%) | 0 (0.0%) |
| Total | 76 (100.0%) | 25 (100.0%) |
Health & Disability in Athens
Health Insurance Coverage by Age in Athens
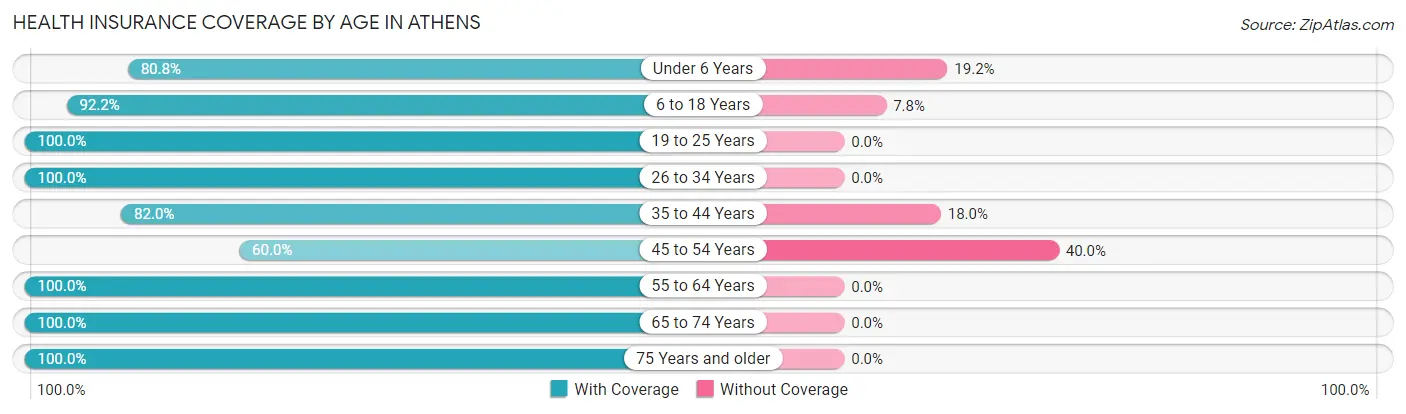
| Age Bracket | With Coverage | Without Coverage |
| Under 6 Years | 21 (80.8%) | 5 (19.2%) |
| 6 to 18 Years | 59 (92.2%) | 5 (7.8%) |
| 19 to 25 Years | 4 (100.0%) | 0 (0.0%) |
| 26 to 34 Years | 28 (100.0%) | 0 (0.0%) |
| 35 to 44 Years | 41 (82.0%) | 9 (18.0%) |
| 45 to 54 Years | 21 (60.0%) | 14 (40.0%) |
| 55 to 64 Years | 29 (100.0%) | 0 (0.0%) |
| 65 to 74 Years | 41 (100.0%) | 0 (0.0%) |
| 75 Years and older | 5 (100.0%) | 0 (0.0%) |
| Total | 249 (88.3%) | 33 (11.7%) |
Health Insurance Coverage by Citizenship Status in Athens
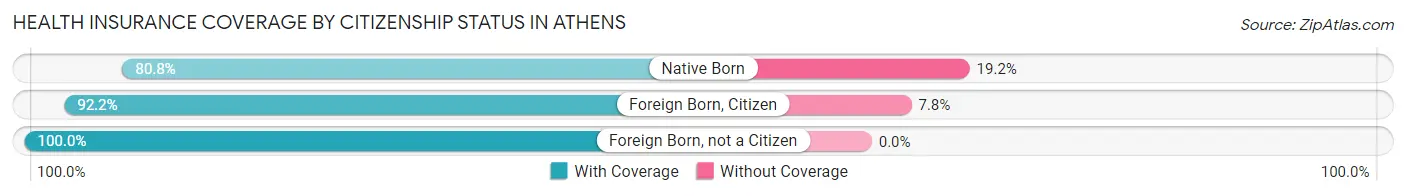
| Citizenship Status | With Coverage | Without Coverage |
| Native Born | 21 (80.8%) | 5 (19.2%) |
| Foreign Born, Citizen | 59 (92.2%) | 5 (7.8%) |
| Foreign Born, not a Citizen | 4 (100.0%) | 0 (0.0%) |
Health Insurance Coverage by Household Income in Athens
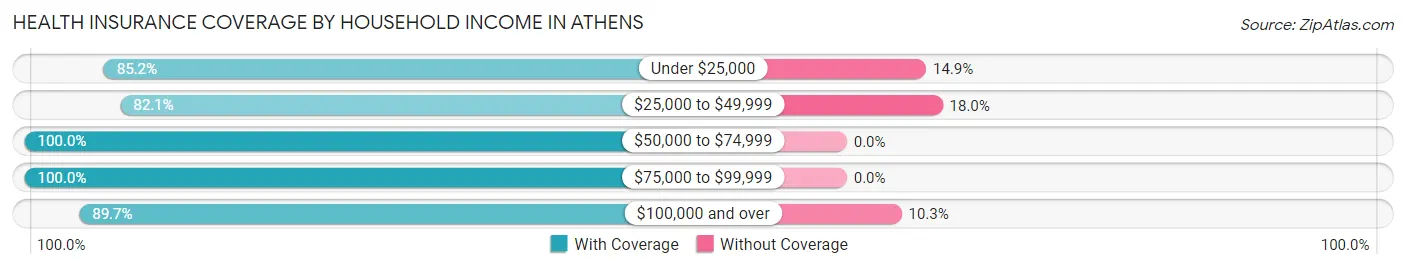
| Household Income | With Coverage | Without Coverage |
| Under $25,000 | 86 (85.2%) | 15 (14.8%) |
| $25,000 to $49,999 | 64 (82.1%) | 14 (17.9%) |
| $50,000 to $74,999 | 62 (100.0%) | 0 (0.0%) |
| $75,000 to $99,999 | 2 (100.0%) | 0 (0.0%) |
| $100,000 and over | 35 (89.7%) | 4 (10.3%) |
Public vs Private Health Insurance Coverage by Age in Athens
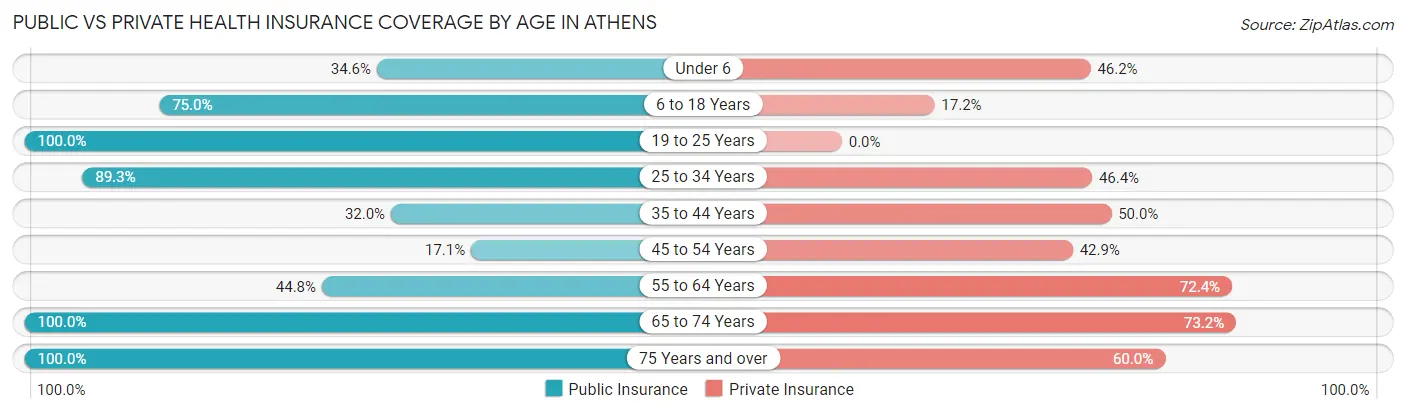
| Age Bracket | Public Insurance | Private Insurance |
| Under 6 | 9 (34.6%) | 12 (46.2%) |
| 6 to 18 Years | 48 (75.0%) | 11 (17.2%) |
| 19 to 25 Years | 4 (100.0%) | 0 (0.0%) |
| 25 to 34 Years | 25 (89.3%) | 13 (46.4%) |
| 35 to 44 Years | 16 (32.0%) | 25 (50.0%) |
| 45 to 54 Years | 6 (17.1%) | 15 (42.9%) |
| 55 to 64 Years | 13 (44.8%) | 21 (72.4%) |
| 65 to 74 Years | 41 (100.0%) | 30 (73.2%) |
| 75 Years and over | 5 (100.0%) | 3 (60.0%) |
| Total | 167 (59.2%) | 130 (46.1%) |
Disability Status by Sex by Age in Athens
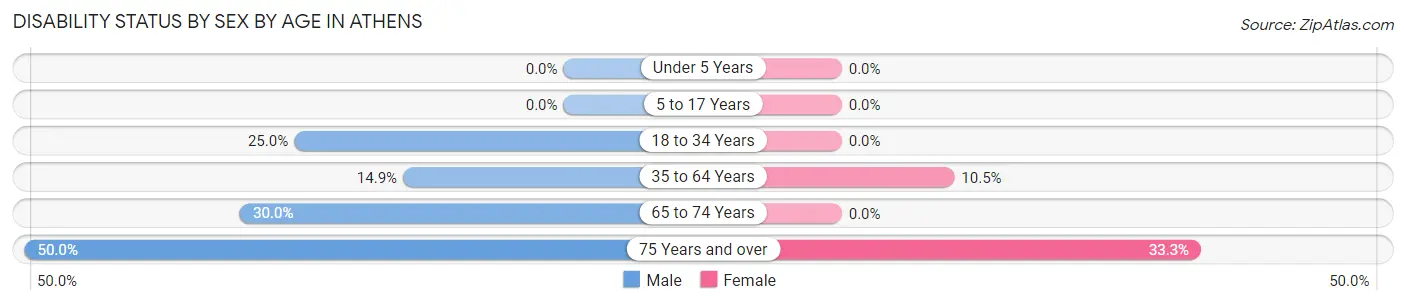
| Age Bracket | Male | Female |
| Under 5 Years | 0 (0.0%) | 0 (0.0%) |
| 5 to 17 Years | 0 (0.0%) | 0 (0.0%) |
| 18 to 34 Years | 7 (25.0%) | 0 (0.0%) |
| 35 to 64 Years | 7 (14.9%) | 7 (10.4%) |
| 65 to 74 Years | 6 (30.0%) | 0 (0.0%) |
| 75 Years and over | 1 (50.0%) | 1 (33.3%) |
Disability Class by Sex by Age in Athens
Disability Class: Hearing Difficulty
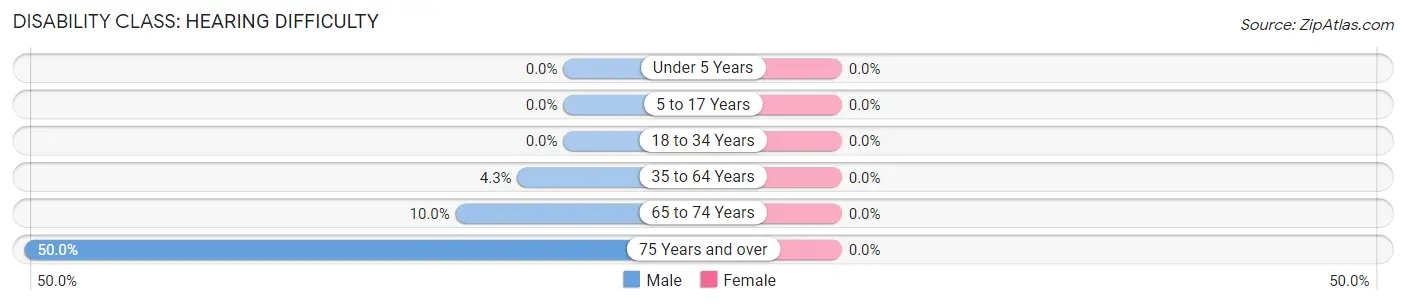
| Age Bracket | Male | Female |
| Under 5 Years | 0 (0.0%) | 0 (0.0%) |
| 5 to 17 Years | 0 (0.0%) | 0 (0.0%) |
| 18 to 34 Years | 0 (0.0%) | 0 (0.0%) |
| 35 to 64 Years | 2 (4.3%) | 0 (0.0%) |
| 65 to 74 Years | 2 (10.0%) | 0 (0.0%) |
| 75 Years and over | 1 (50.0%) | 0 (0.0%) |
Disability Class: Vision Difficulty
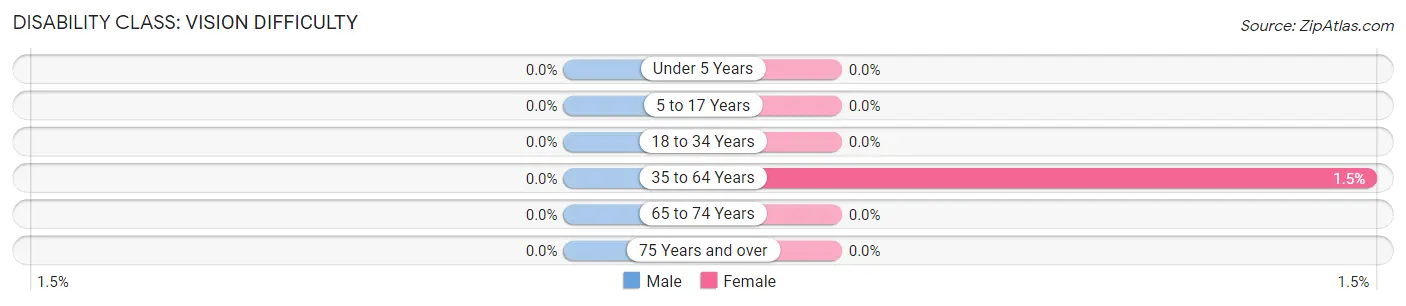
| Age Bracket | Male | Female |
| Under 5 Years | 0 (0.0%) | 0 (0.0%) |
| 5 to 17 Years | 0 (0.0%) | 0 (0.0%) |
| 18 to 34 Years | 0 (0.0%) | 0 (0.0%) |
| 35 to 64 Years | 0 (0.0%) | 1 (1.5%) |
| 65 to 74 Years | 0 (0.0%) | 0 (0.0%) |
| 75 Years and over | 0 (0.0%) | 0 (0.0%) |
Disability Class: Cognitive Difficulty
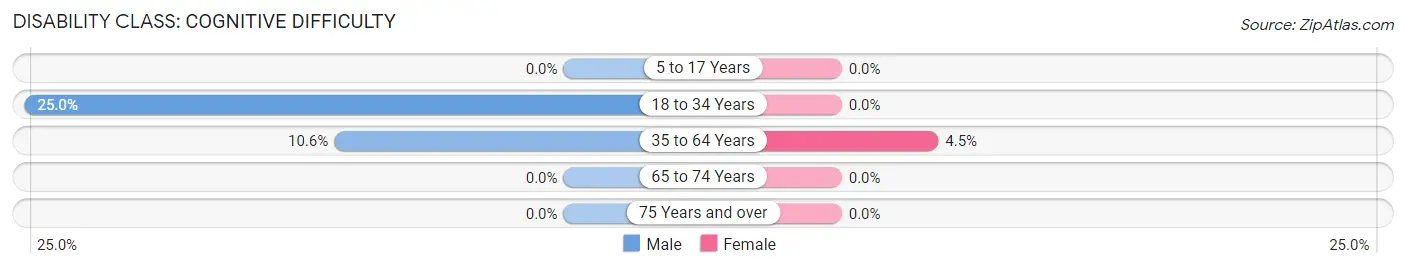
| Age Bracket | Male | Female |
| 5 to 17 Years | 0 (0.0%) | 0 (0.0%) |
| 18 to 34 Years | 7 (25.0%) | 0 (0.0%) |
| 35 to 64 Years | 5 (10.6%) | 3 (4.5%) |
| 65 to 74 Years | 0 (0.0%) | 0 (0.0%) |
| 75 Years and over | 0 (0.0%) | 0 (0.0%) |
Disability Class: Ambulatory Difficulty
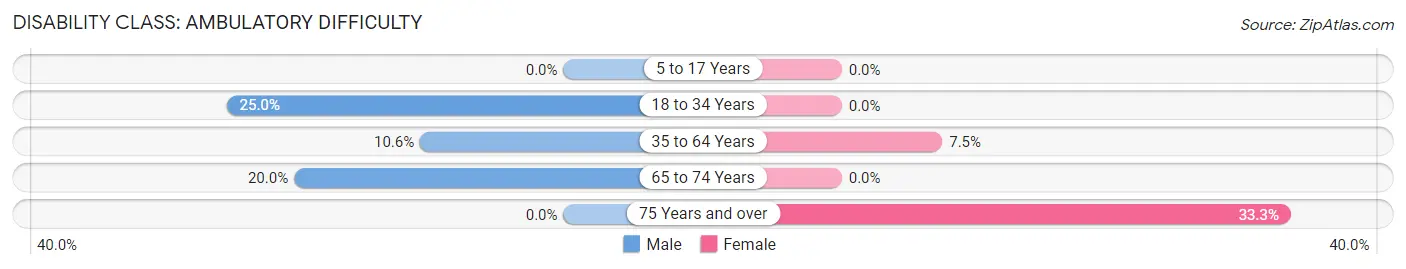
| Age Bracket | Male | Female |
| 5 to 17 Years | 0 (0.0%) | 0 (0.0%) |
| 18 to 34 Years | 7 (25.0%) | 0 (0.0%) |
| 35 to 64 Years | 5 (10.6%) | 5 (7.5%) |
| 65 to 74 Years | 4 (20.0%) | 0 (0.0%) |
| 75 Years and over | 0 (0.0%) | 1 (33.3%) |
Disability Class: Self-Care Difficulty
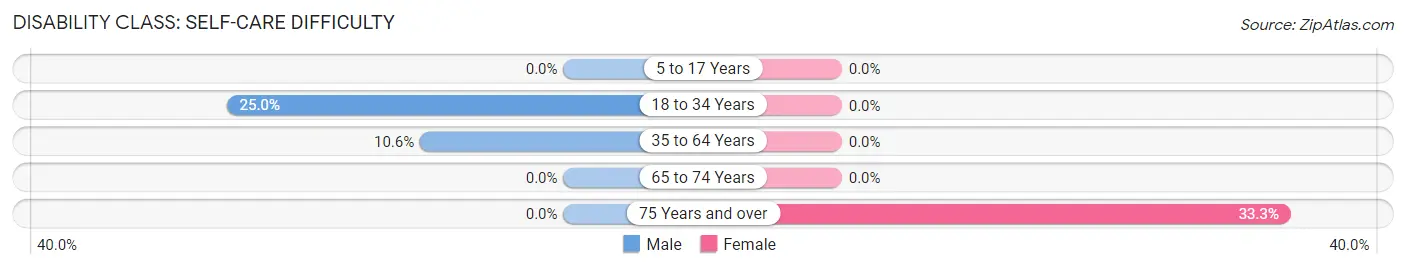
| Age Bracket | Male | Female |
| 5 to 17 Years | 0 (0.0%) | 0 (0.0%) |
| 18 to 34 Years | 7 (25.0%) | 0 (0.0%) |
| 35 to 64 Years | 5 (10.6%) | 0 (0.0%) |
| 65 to 74 Years | 0 (0.0%) | 0 (0.0%) |
| 75 Years and over | 0 (0.0%) | 1 (33.3%) |
Technology Access in Athens
Computing Device Access in Athens
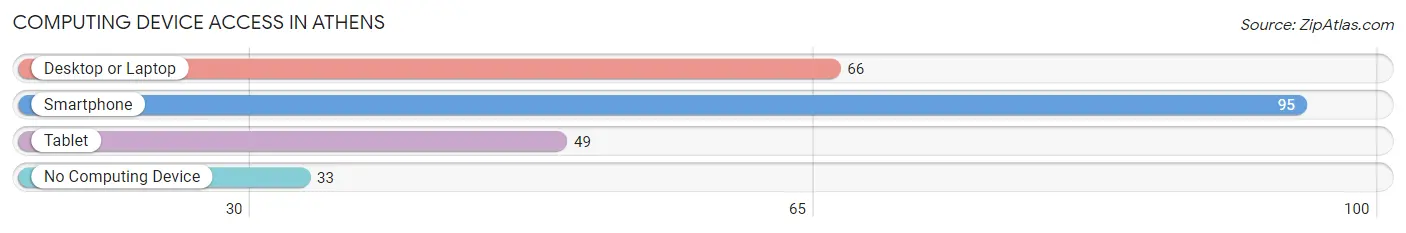
| Device Type | # Households | % Households |
| Desktop or Laptop | 66 | 49.2% |
| Smartphone | 95 | 70.9% |
| Tablet | 49 | 36.6% |
| No Computing Device | 33 | 24.6% |
| Total | 134 | 100.0% |
Internet Access in Athens
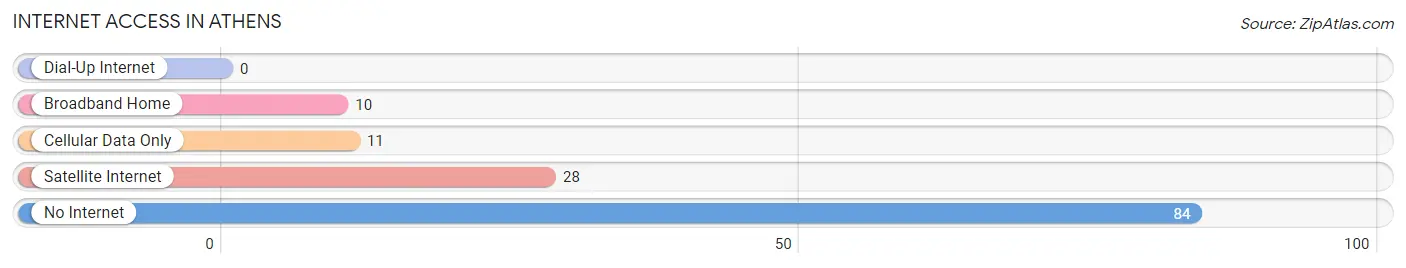
| Internet Type | # Households | % Households |
| Dial-Up Internet | 0 | 0.0% |
| Broadband Home | 10 | 7.5% |
| Cellular Data Only | 11 | 8.2% |
| Satellite Internet | 28 | 20.9% |
| No Internet | 84 | 62.7% |
| Total | 134 | 100.0% |
Athens Summary
Athens is a small town located in the northeast corner of Louisiana, in Claiborne Parish. It is situated on the banks of the Ouachita River, and is part of the Ruston-Grambling Metropolitan Statistical Area. The town has a population of 1,845 people, according to the 2010 census.
History
Athens was founded in 1839 by a group of settlers from Georgia, who named the town after the ancient Greek city of Athens. The town was incorporated in 1845, and the first post office was established in 1846. The town was a major trading center for the surrounding area, and was home to several cotton plantations.
During the Civil War, Athens was the site of a major battle between Union and Confederate forces. The Union forces were victorious, and the town was occupied by Union troops for the remainder of the war.
In the late 19th century, Athens was a major center for the timber industry, and the town was home to several sawmills. The timber industry declined in the early 20th century, and the town's economy shifted to agriculture.
Geography
Athens is located in the northeast corner of Louisiana, in Claiborne Parish. It is situated on the banks of the Ouachita River, and is part of the Ruston-Grambling Metropolitan Statistical Area. The town has a total area of 2.2 square miles, all of which is land.
The town is located in a humid subtropical climate zone, with hot, humid summers and mild winters. The average annual temperature is 64°F, and the average annual precipitation is 48 inches.
Economy
Athens is a small, rural town, and the economy is largely based on agriculture. The town is home to several farms, and the main crops are cotton, soybeans, and corn. The town is also home to several small businesses, including restaurants, retail stores, and service providers.
Demographics
Athens has a population of 1,845 people, according to the 2010 census. The population is predominantly white (90.2%), with small percentages of African American (7.2%), Hispanic (1.2%), and Asian (0.4%) residents. The median household income is $30,938, and the median age is 38.7 years. The town has a poverty rate of 22.3%.
Common Questions
What is Per Capita Income in Athens?
Per Capita income in Athens is $19,185.
What is the Median Household income in Athens?
Median Household Income in Athens is $27,857.
What is Income or Wage Gap in Athens?
Income or Wage Gap in Athens is 36.8%.
Women in Athens earn 63.2 cents for every dollar earned by a man.
What is Inequality or Gini Index in Athens?
Inequality or Gini Index in Athens is 0.53.
What is the Total Population of Athens?
Total Population of Athens is 282.
What is the Total Male Population of Athens?
Total Male Population of Athens is 135.
What is the Total Female Population of Athens?
Total Female Population of Athens is 147.
What is the Ratio of Males per 100 Females in Athens?
There are 91.84 Males per 100 Females in Athens.
What is the Ratio of Females per 100 Males in Athens?
There are 108.89 Females per 100 Males in Athens.
What is the Median Population Age in Athens?
Median Population Age in Athens is 38.3 Years.
What is the Average Family Size in Athens
Average Family Size in Athens is 3.2 People.
What is the Average Household Size in Athens
Average Household Size in Athens is 2.1 People.
How Large is the Labor Force in Athens?
There are 95 People in the Labor Forcein in Athens.
What is the Percentage of People in the Labor Force in Athens?
46.8% of People are in the Labor Force in Athens.
What is the Unemployment Rate in Athens?
Unemployment Rate in Athens is 1.1%.