Arcadia, LA Map & Demographics
Arcadia Map
Arcadia Overview
$21,789
PER CAPITA INCOME
$48,125
AVG FAMILY INCOME
$37,610
AVG HOUSEHOLD INCOME
23.2%
WAGE / INCOME GAP [ % ]
76.8¢/ $1
WAGE / INCOME GAP [ $ ]
0.42
INEQUALITY / GINI INDEX
2,725
TOTAL POPULATION
1,141
MALE POPULATION
1,584
FEMALE POPULATION
72.03
MALES / 100 FEMALES
138.83
FEMALES / 100 MALES
42.1
MEDIAN AGE
2.8
AVG FAMILY SIZE
1.9
AVG HOUSEHOLD SIZE
987
LABOR FORCE [ PEOPLE ]
43.6%
PERCENT IN LABOR FORCE
2.7%
UNEMPLOYMENT RATE
Arcadia Zip Codes
Arcadia Area Codes
Income in Arcadia
Income Overview in Arcadia
Per Capita Income in Arcadia is $21,789, while median incomes of families and households are $48,125 and $37,610 respectively.
| Characteristic | Number | Measure |
| Per Capita Income | 2,725 | $21,789 |
| Median Family Income | 608 | $48,125 |
| Mean Family Income | 608 | $55,617 |
| Median Household Income | 1,290 | $37,610 |
| Mean Household Income | 1,290 | $44,238 |
| Income Deficit | 608 | $0 |
| Wage / Income Gap (%) | 2,725 | 23.17% |
| Wage / Income Gap ($) | 2,725 | 76.83¢ per $1 |
| Gini / Inequality Index | 2,725 | 0.42 |
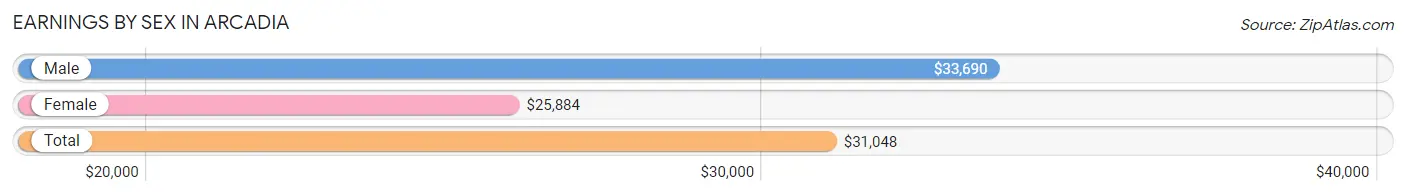
Earnings by Sex in Arcadia
Average Earnings in Arcadia are $31,048, $33,690 for men and $25,884 for women, a difference of 23.2%.
| Sex | Number | Average Earnings |
| Male | 485 (50.3%) | $33,690 |
| Female | 479 (49.7%) | $25,884 |
| Total | 964 (100.0%) | $31,048 |
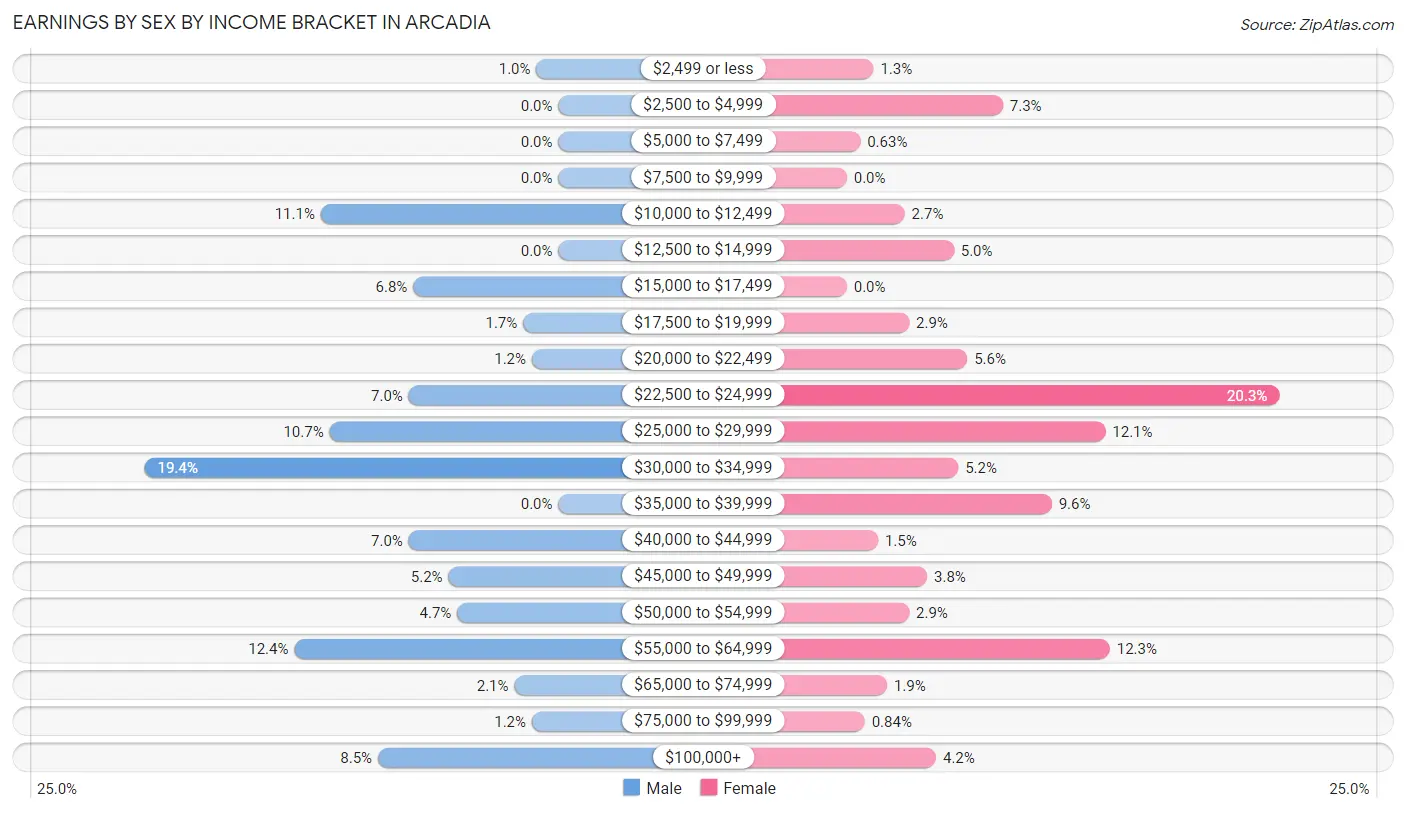
Earnings by Sex by Income Bracket in Arcadia
The most common earnings brackets in Arcadia are $30,000 to $34,999 for men (94 | 19.4%) and $22,500 to $24,999 for women (97 | 20.3%).
| Income | Male | Female |
| $2,499 or less | 5 (1.0%) | 6 (1.3%) |
| $2,500 to $4,999 | 0 (0.0%) | 35 (7.3%) |
| $5,000 to $7,499 | 0 (0.0%) | 3 (0.6%) |
| $7,500 to $9,999 | 0 (0.0%) | 0 (0.0%) |
| $10,000 to $12,499 | 54 (11.1%) | 13 (2.7%) |
| $12,500 to $14,999 | 0 (0.0%) | 24 (5.0%) |
| $15,000 to $17,499 | 33 (6.8%) | 0 (0.0%) |
| $17,500 to $19,999 | 8 (1.7%) | 14 (2.9%) |
| $20,000 to $22,499 | 6 (1.2%) | 27 (5.6%) |
| $22,500 to $24,999 | 34 (7.0%) | 97 (20.3%) |
| $25,000 to $29,999 | 52 (10.7%) | 58 (12.1%) |
| $30,000 to $34,999 | 94 (19.4%) | 25 (5.2%) |
| $35,000 to $39,999 | 0 (0.0%) | 46 (9.6%) |
| $40,000 to $44,999 | 34 (7.0%) | 7 (1.5%) |
| $45,000 to $49,999 | 25 (5.1%) | 18 (3.8%) |
| $50,000 to $54,999 | 23 (4.7%) | 14 (2.9%) |
| $55,000 to $64,999 | 60 (12.4%) | 59 (12.3%) |
| $65,000 to $74,999 | 10 (2.1%) | 9 (1.9%) |
| $75,000 to $99,999 | 6 (1.2%) | 4 (0.8%) |
| $100,000+ | 41 (8.5%) | 20 (4.2%) |
| Total | 485 (100.0%) | 479 (100.0%) |
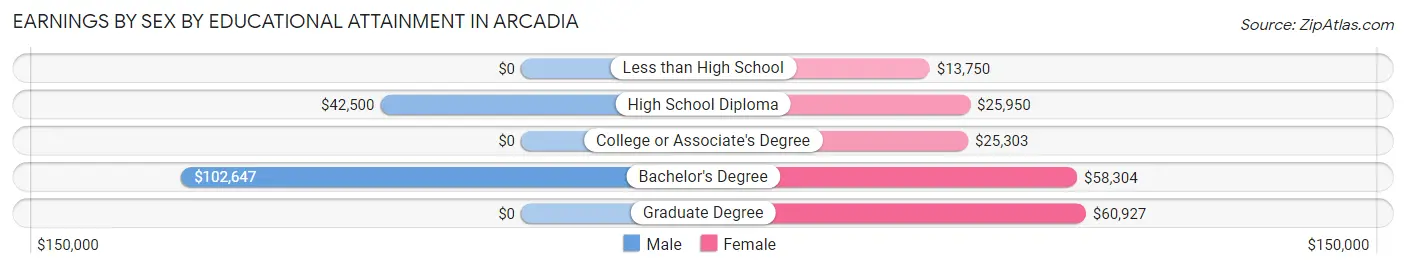
Earnings by Sex by Educational Attainment in Arcadia
Average earnings in Arcadia are $34,819 for men and $27,047 for women, a difference of 22.3%. Men with an educational attainment of bachelor's degree enjoy the highest average annual earnings of $102,647, while those with high school diploma education earn the least with $42,500. Women with an educational attainment of graduate degree earn the most with the average annual earnings of $60,927, while those with less than high school education have the smallest earnings of $13,750.
| Educational Attainment | Male Income | Female Income |
| Less than High School | - | - |
| High School Diploma | $42,500 | $25,950 |
| College or Associate's Degree | - | - |
| Bachelor's Degree | $102,647 | $58,304 |
| Graduate Degree | - | - |
| Total | $34,819 | $27,047 |
Family Income in Arcadia
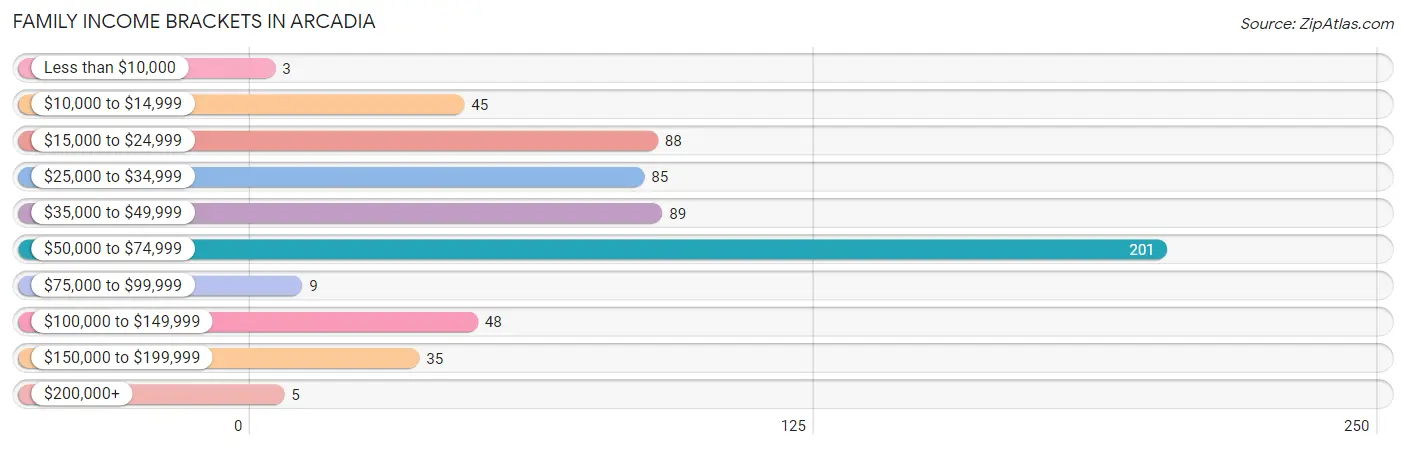
Family Income Brackets in Arcadia
According to the Arcadia family income data, there are 201 families falling into the $50,000 to $74,999 income range, which is the most common income bracket and makes up 33.1% of all families. Conversely, the less than $10,000 income bracket is the least frequent group with only 3 families (0.5%) belonging to this category.
| Income Bracket | # Families | % Families |
| Less than $10,000 | 3 | 0.5% |
| $10,000 to $14,999 | 45 | 7.4% |
| $15,000 to $24,999 | 88 | 14.5% |
| $25,000 to $34,999 | 85 | 14.0% |
| $35,000 to $49,999 | 89 | 14.6% |
| $50,000 to $74,999 | 201 | 33.1% |
| $75,000 to $99,999 | 9 | 1.5% |
| $100,000 to $149,999 | 48 | 7.9% |
| $150,000 to $199,999 | 35 | 5.8% |
| $200,000+ | 5 | 0.8% |
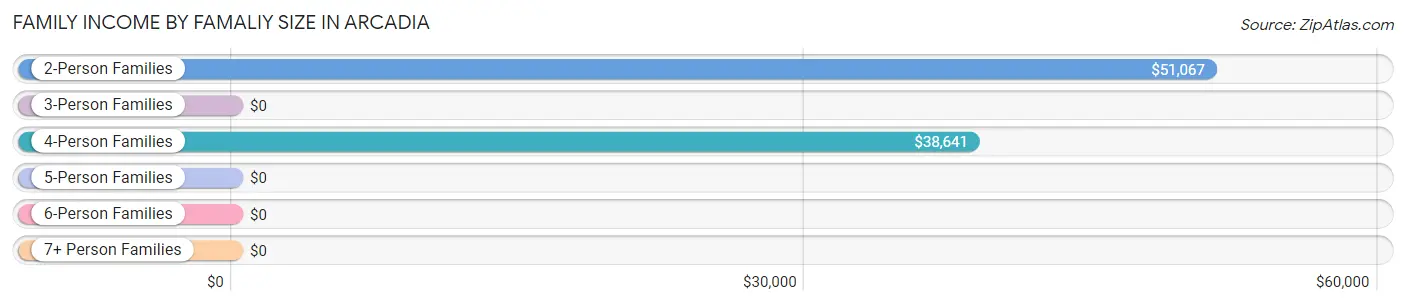
Family Income by Famaliy Size in Arcadia
2-person families (333 | 54.8%) account for the highest median family income in Arcadia with $51,067 per family, while 2-person families (333 | 54.8%) have the highest median income of $25,534 per family member.
| Income Bracket | # Families | Median Income |
| 2-Person Families | 333 (54.8%) | $51,067 |
| 3-Person Families | 126 (20.7%) | $0 |
| 4-Person Families | 100 (16.5%) | $38,641 |
| 5-Person Families | 0 (0.0%) | $0 |
| 6-Person Families | 31 (5.1%) | $0 |
| 7+ Person Families | 18 (3.0%) | $0 |
| Total | 608 (100.0%) | $48,125 |
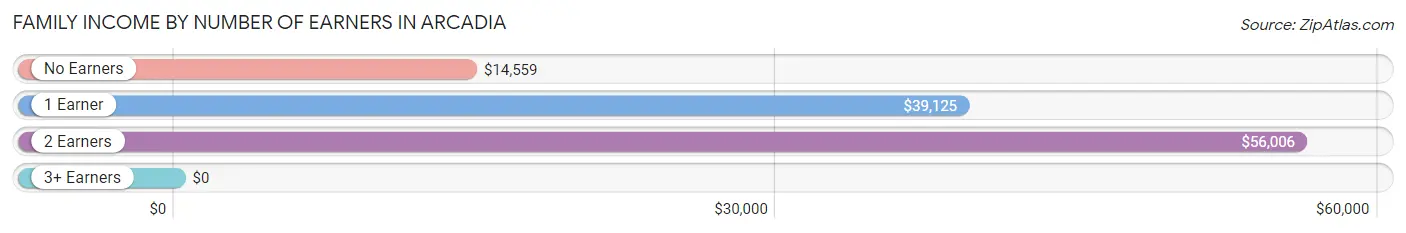
Family Income by Number of Earners in Arcadia
| Number of Earners | # Families | Median Income |
| No Earners | 90 (14.8%) | $14,559 |
| 1 Earner | 276 (45.4%) | $39,125 |
| 2 Earners | 238 (39.1%) | $56,006 |
| 3+ Earners | 4 (0.7%) | $0 |
| Total | 608 (100.0%) | $48,125 |
Household Income in Arcadia
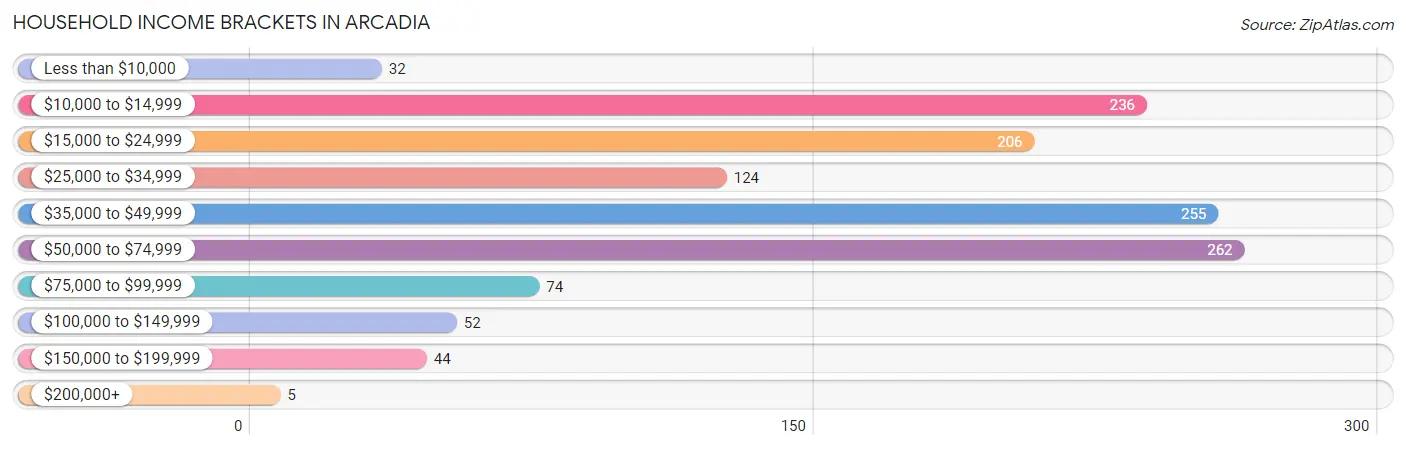
Household Income Brackets in Arcadia
With 262 households falling in the category, the $50,000 to $74,999 income range is the most frequent in Arcadia, accounting for 20.3% of all households. In contrast, only 5 households (0.4%) fall into the $200,000+ income bracket, making it the least populous group.
| Income Bracket | # Households | % Households |
| Less than $10,000 | 32 | 2.5% |
| $10,000 to $14,999 | 236 | 18.3% |
| $15,000 to $24,999 | 206 | 16.0% |
| $25,000 to $34,999 | 124 | 9.6% |
| $35,000 to $49,999 | 255 | 19.8% |
| $50,000 to $74,999 | 262 | 20.3% |
| $75,000 to $99,999 | 74 | 5.7% |
| $100,000 to $149,999 | 52 | 4.0% |
| $150,000 to $199,999 | 44 | 3.4% |
| $200,000+ | 5 | 0.4% |
Household Income by Householder Age in Arcadia
The median household income in Arcadia is $37,610, with the highest median household income of $46,042 found in the 25 to 44 years age bracket for the primary householder. A total of 449 households (34.8%) fall into this category. Meanwhile, the 15 to 24 years age bracket for the primary householder has the lowest median household income of $0, with 38 households (2.9%) in this group.
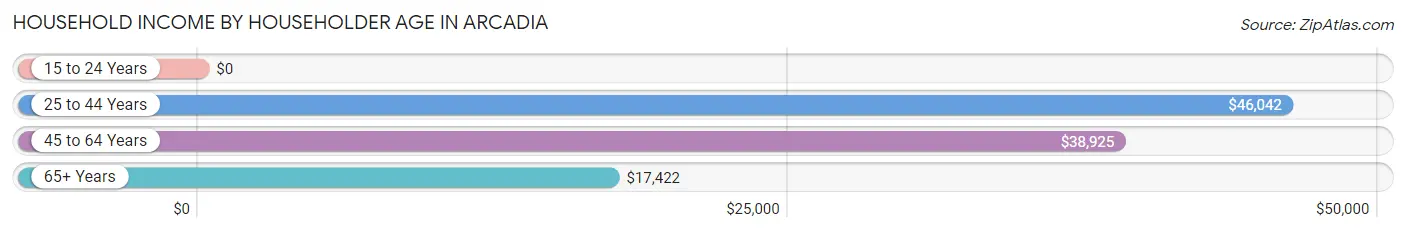
| Income Bracket | # Households | Median Income |
| 15 to 24 Years | 38 (2.9%) | $0 |
| 25 to 44 Years | 449 (34.8%) | $46,042 |
| 45 to 64 Years | 407 (31.6%) | $38,925 |
| 65+ Years | 396 (30.7%) | $17,422 |
| Total | 1,290 (100.0%) | $37,610 |
Poverty in Arcadia
Income Below Poverty by Sex and Age in Arcadia
With 29.0% poverty level for males and 32.0% for females among the residents of Arcadia, under 5 year old males and under 5 year old females are the most vulnerable to poverty, with 48 males (72.7%) and 36 females (100.0%) in their respective age groups living below the poverty level.
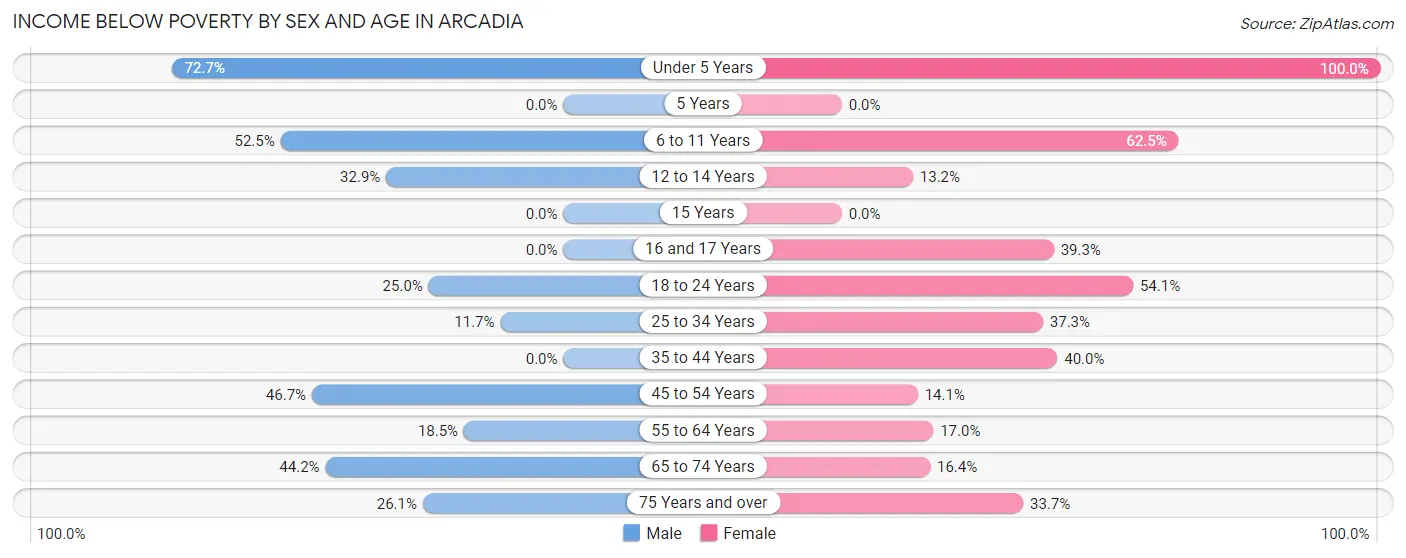
| Age Bracket | Male | Female |
| Under 5 Years | 48 (72.7%) | 36 (100.0%) |
| 5 Years | 0 (0.0%) | 0 (0.0%) |
| 6 to 11 Years | 42 (52.5%) | 65 (62.5%) |
| 12 to 14 Years | 25 (32.9%) | 12 (13.2%) |
| 15 Years | 0 (0.0%) | 0 (0.0%) |
| 16 and 17 Years | 0 (0.0%) | 35 (39.3%) |
| 18 to 24 Years | 36 (25.0%) | 40 (54.0%) |
| 25 to 34 Years | 18 (11.7%) | 53 (37.3%) |
| 35 to 44 Years | 0 (0.0%) | 74 (40.0%) |
| 45 to 54 Years | 42 (46.7%) | 21 (14.1%) |
| 55 to 64 Years | 19 (18.4%) | 46 (17.0%) |
| 65 to 74 Years | 53 (44.2%) | 19 (16.4%) |
| 75 Years and over | 12 (26.1%) | 68 (33.7%) |
| Total | 295 (29.0%) | 469 (32.0%) |
Income Above Poverty by Sex and Age in Arcadia
According to the poverty statistics in Arcadia, males aged 16 and 17 years and females aged 15 years are the age groups that are most secure financially, with 100.0% of males and 100.0% of females in these age groups living above the poverty line.
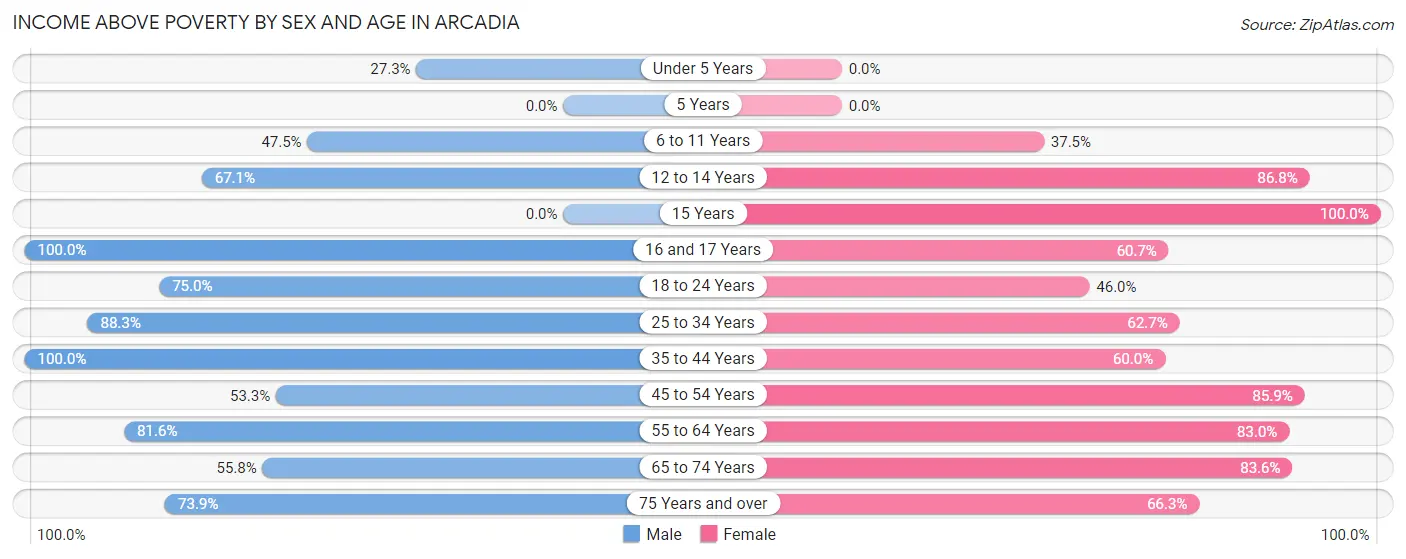
| Age Bracket | Male | Female |
| Under 5 Years | 18 (27.3%) | 0 (0.0%) |
| 5 Years | 0 (0.0%) | 0 (0.0%) |
| 6 to 11 Years | 38 (47.5%) | 39 (37.5%) |
| 12 to 14 Years | 51 (67.1%) | 79 (86.8%) |
| 15 Years | 0 (0.0%) | 8 (100.0%) |
| 16 and 17 Years | 8 (100.0%) | 54 (60.7%) |
| 18 to 24 Years | 108 (75.0%) | 34 (46.0%) |
| 25 to 34 Years | 136 (88.3%) | 89 (62.7%) |
| 35 to 44 Years | 130 (100.0%) | 111 (60.0%) |
| 45 to 54 Years | 48 (53.3%) | 128 (85.9%) |
| 55 to 64 Years | 84 (81.6%) | 225 (83.0%) |
| 65 to 74 Years | 67 (55.8%) | 97 (83.6%) |
| 75 Years and over | 34 (73.9%) | 134 (66.3%) |
| Total | 722 (71.0%) | 998 (68.0%) |
Income Below Poverty Among Married-Couple Families in Arcadia
The poverty statistics for married-couple families in Arcadia show that 7.6% or 22 of the total 289 families live below the poverty line. Families with no children have the highest poverty rate of 8.9%, comprising of 22 families. On the other hand, families with 1 or 2 children have the lowest poverty rate of 0.0%, which includes 0 families.
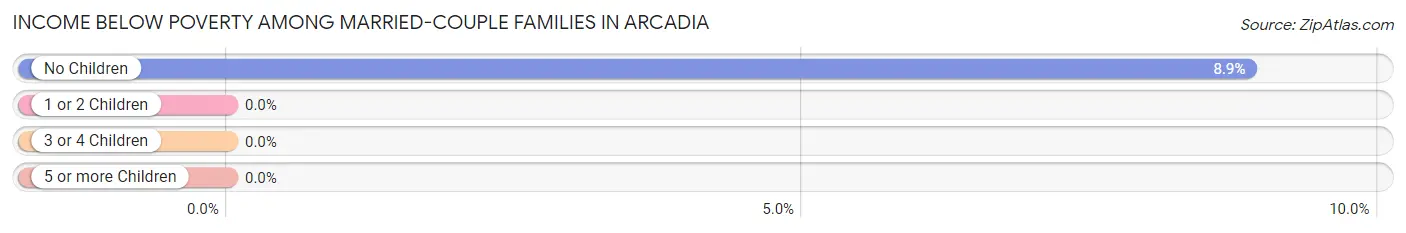
| Children | Above Poverty | Below Poverty |
| No Children | 226 (91.1%) | 22 (8.9%) |
| 1 or 2 Children | 41 (100.0%) | 0 (0.0%) |
| 3 or 4 Children | 0 (0.0%) | 0 (0.0%) |
| 5 or more Children | 0 (0.0%) | 0 (0.0%) |
| Total | 267 (92.4%) | 22 (7.6%) |
Income Below Poverty Among Single-Parent Households in Arcadia
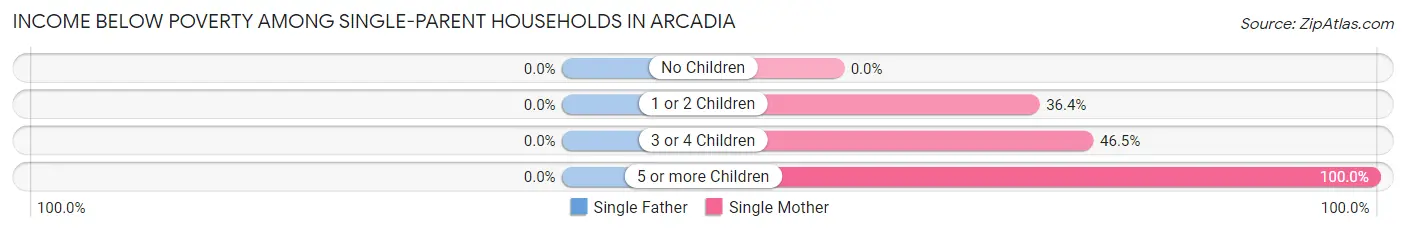
| Children | Single Father | Single Mother |
| No Children | 0 (0.0%) | 0 (0.0%) |
| 1 or 2 Children | 0 (0.0%) | 55 (36.4%) |
| 3 or 4 Children | 0 (0.0%) | 46 (46.5%) |
| 5 or more Children | 0 (0.0%) | 11 (100.0%) |
| Total | 0 (0.0%) | 112 (40.7%) |
Income Below Poverty Among Married-Couple vs Single-Parent Households in Arcadia
The poverty data for Arcadia shows that 22 of the married-couple family households (7.6%) and 112 of the single-parent households (35.1%) are living below the poverty level. Within the married-couple family households, those with no children have the highest poverty rate, with 22 households (8.9%) falling below the poverty line. Among the single-parent households, those with 5 or more children have the highest poverty rate, with 11 household (100.0%) living below poverty.
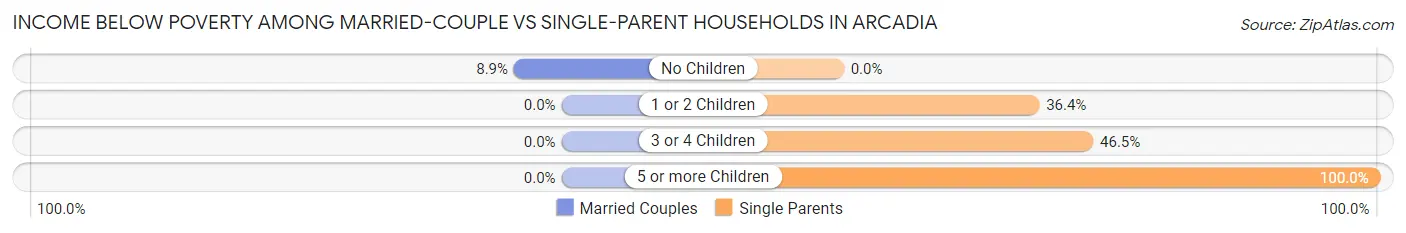
| Children | Married-Couple Families | Single-Parent Households |
| No Children | 22 (8.9%) | 0 (0.0%) |
| 1 or 2 Children | 0 (0.0%) | 55 (36.4%) |
| 3 or 4 Children | 0 (0.0%) | 46 (46.5%) |
| 5 or more Children | 0 (0.0%) | 11 (100.0%) |
| Total | 22 (7.6%) | 112 (35.1%) |
Race in Arcadia
The most populous races in Arcadia are Black / African American (1,814 | 66.6%), White / Caucasian (780 | 28.6%), and Two or more Races (70 | 2.6%).
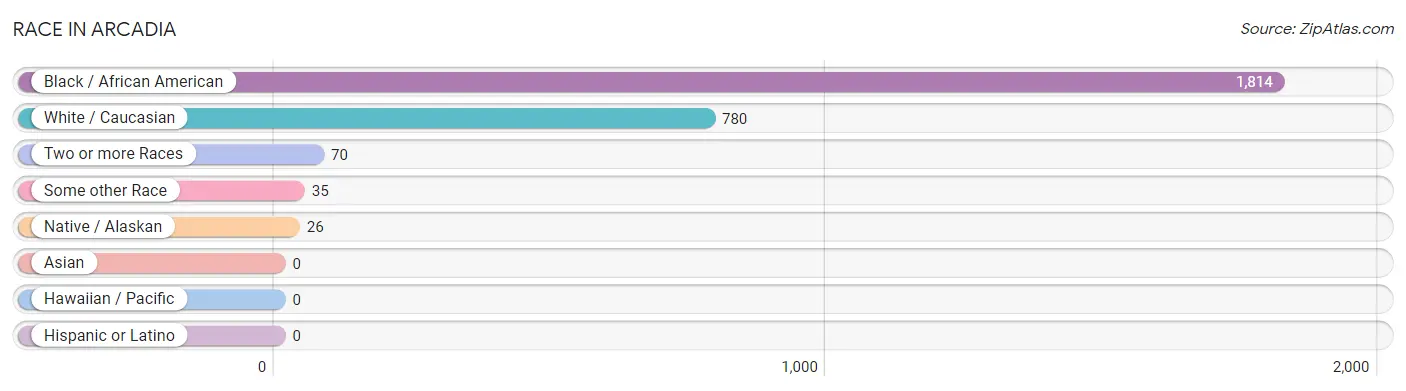
| Race | # Population | % Population |
| Asian | 0 | 0.0% |
| Black / African American | 1,814 | 66.6% |
| Hawaiian / Pacific | 0 | 0.0% |
| Hispanic or Latino | 0 | 0.0% |
| Native / Alaskan | 26 | 0.9% |
| White / Caucasian | 780 | 28.6% |
| Two or more Races | 70 | 2.6% |
| Some other Race | 35 | 1.3% |
| Total | 2,725 | 100.0% |
Ancestry in Arcadia
The most populous ancestries reported in Arcadia are American (286 | 10.5%), Irish (105 | 3.8%), French (80 | 2.9%), Cherokee (76 | 2.8%), and Choctaw (76 | 2.8%), together accounting for 22.9% of all Arcadia residents.
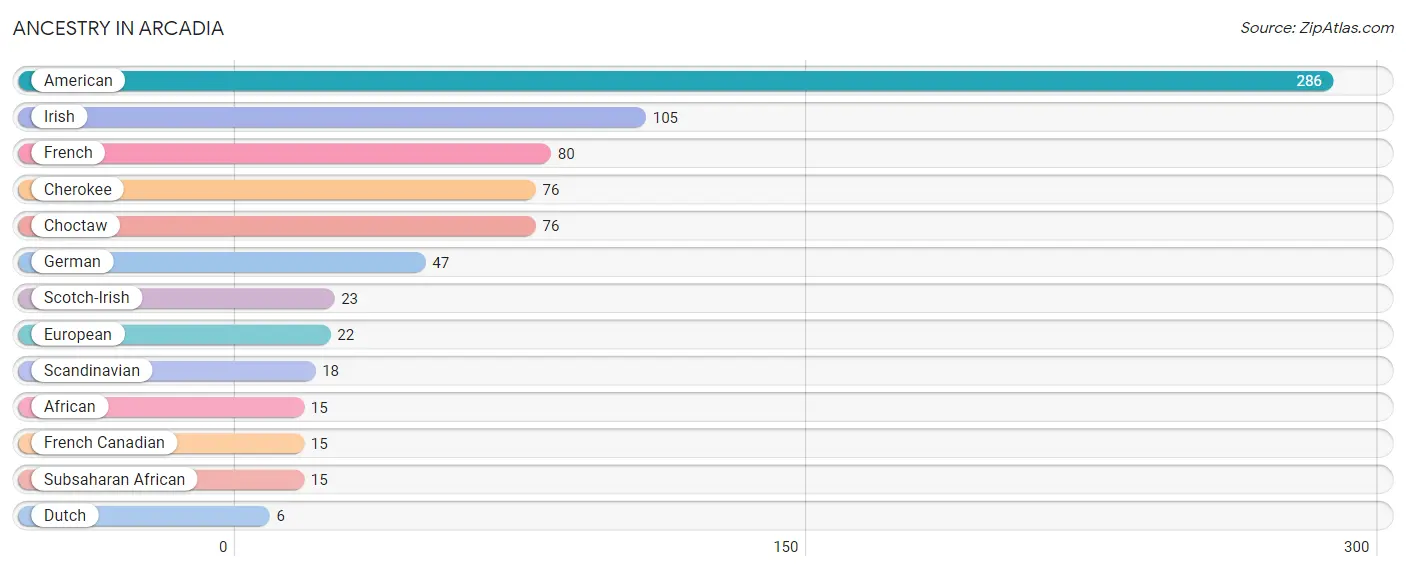
| Ancestry | # Population | % Population |
| African | 15 | 0.5% |
| American | 286 | 10.5% |
| Cherokee | 76 | 2.8% |
| Choctaw | 76 | 2.8% |
| Dutch | 6 | 0.2% |
| European | 22 | 0.8% |
| French | 80 | 2.9% |
| French Canadian | 15 | 0.5% |
| German | 47 | 1.7% |
| Irish | 105 | 3.8% |
| Scandinavian | 18 | 0.7% |
| Scotch-Irish | 23 | 0.8% |
| Subsaharan African | 15 | 0.5% | View All 13 Rows |
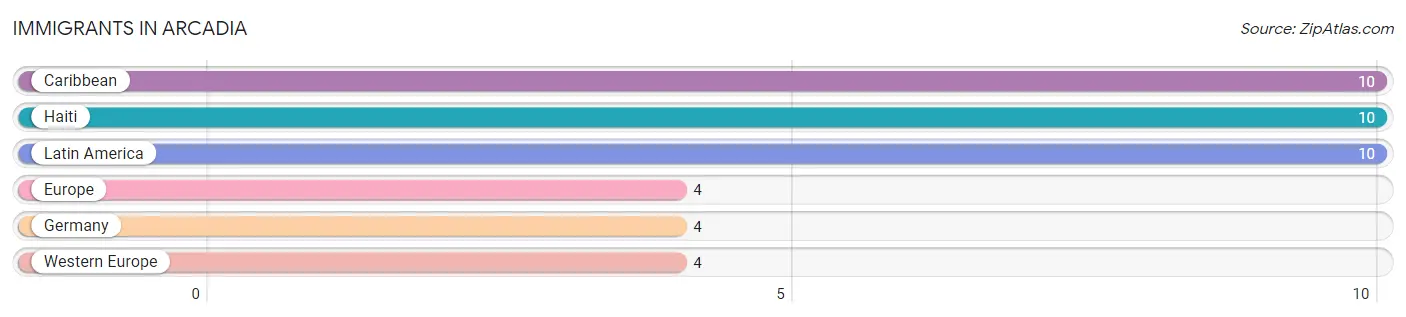
Immigrants in Arcadia
The most numerous immigrant groups reported in Arcadia came from Caribbean (10 | 0.4%), Haiti (10 | 0.4%), Latin America (10 | 0.4%), Europe (4 | 0.2%), and Germany (4 | 0.2%), together accounting for 1.4% of all Arcadia residents.
| Immigration Origin | # Population | % Population |
| Caribbean | 10 | 0.4% |
| Europe | 4 | 0.2% |
| Germany | 4 | 0.2% |
| Haiti | 10 | 0.4% |
| Latin America | 10 | 0.4% |
| Western Europe | 4 | 0.2% | View All 6 Rows |
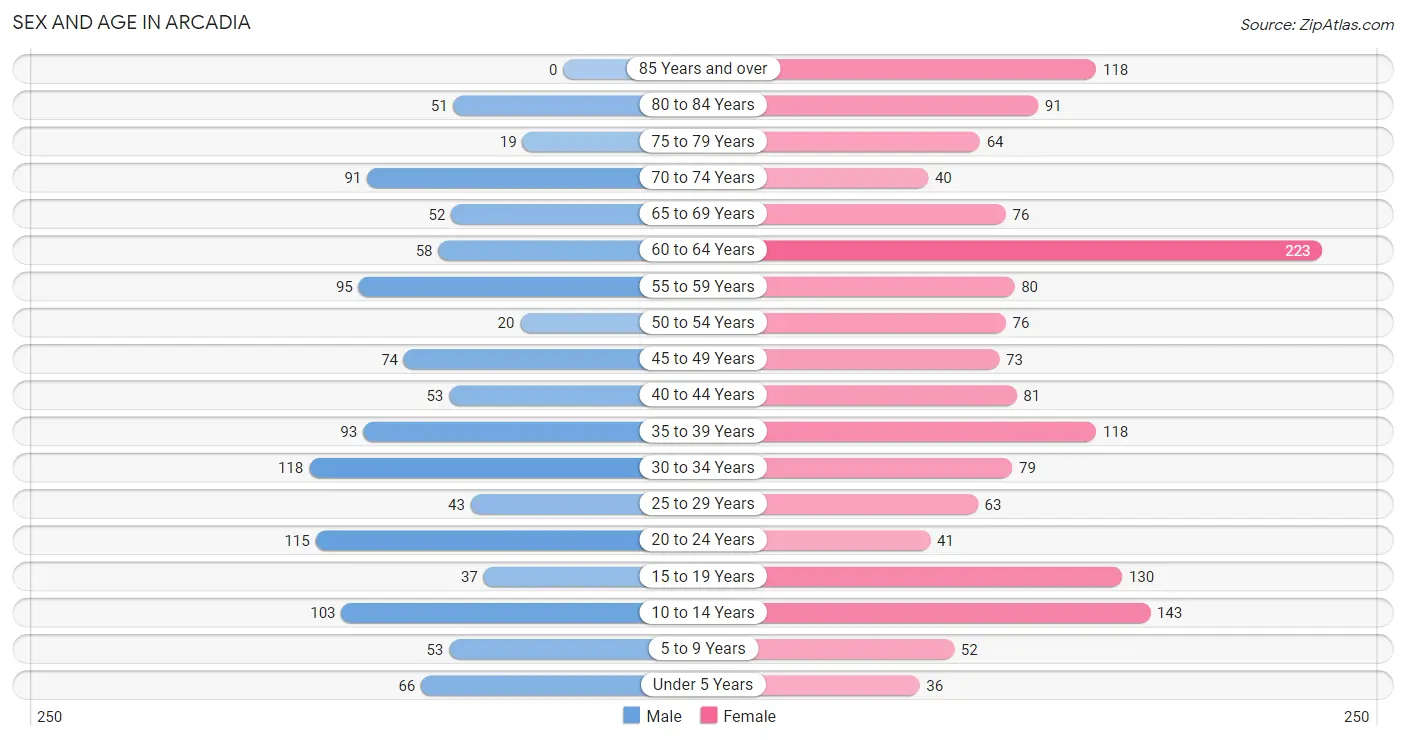
Sex and Age in Arcadia
Sex and Age in Arcadia
The most populous age groups in Arcadia are 30 to 34 Years (118 | 10.3%) for men and 60 to 64 Years (223 | 14.1%) for women.
| Age Bracket | Male | Female |
| Under 5 Years | 66 (5.8%) | 36 (2.3%) |
| 5 to 9 Years | 53 (4.6%) | 52 (3.3%) |
| 10 to 14 Years | 103 (9.0%) | 143 (9.0%) |
| 15 to 19 Years | 37 (3.2%) | 130 (8.2%) |
| 20 to 24 Years | 115 (10.1%) | 41 (2.6%) |
| 25 to 29 Years | 43 (3.8%) | 63 (4.0%) |
| 30 to 34 Years | 118 (10.3%) | 79 (5.0%) |
| 35 to 39 Years | 93 (8.2%) | 118 (7.4%) |
| 40 to 44 Years | 53 (4.6%) | 81 (5.1%) |
| 45 to 49 Years | 74 (6.5%) | 73 (4.6%) |
| 50 to 54 Years | 20 (1.8%) | 76 (4.8%) |
| 55 to 59 Years | 95 (8.3%) | 80 (5.1%) |
| 60 to 64 Years | 58 (5.1%) | 223 (14.1%) |
| 65 to 69 Years | 52 (4.6%) | 76 (4.8%) |
| 70 to 74 Years | 91 (8.0%) | 40 (2.5%) |
| 75 to 79 Years | 19 (1.7%) | 64 (4.0%) |
| 80 to 84 Years | 51 (4.5%) | 91 (5.7%) |
| 85 Years and over | 0 (0.0%) | 118 (7.4%) |
| Total | 1,141 (100.0%) | 1,584 (100.0%) |
Families and Households in Arcadia
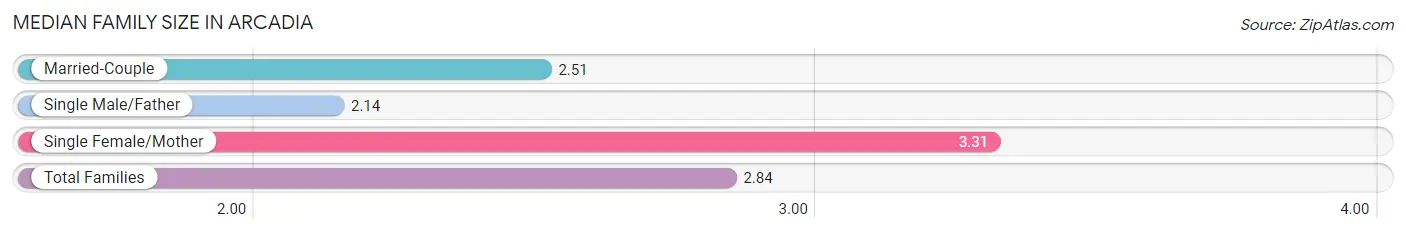
Median Family Size in Arcadia
The median family size in Arcadia is 2.84 persons per family, with single female/mother families (275 | 45.2%) accounting for the largest median family size of 3.31 persons per family. On the other hand, single male/father families (44 | 7.2%) represent the smallest median family size with 2.14 persons per family.
| Family Type | # Families | Family Size |
| Married-Couple | 289 (47.5%) | 2.51 |
| Single Male/Father | 44 (7.2%) | 2.14 |
| Single Female/Mother | 275 (45.2%) | 3.31 |
| Total Families | 608 (100.0%) | 2.84 |
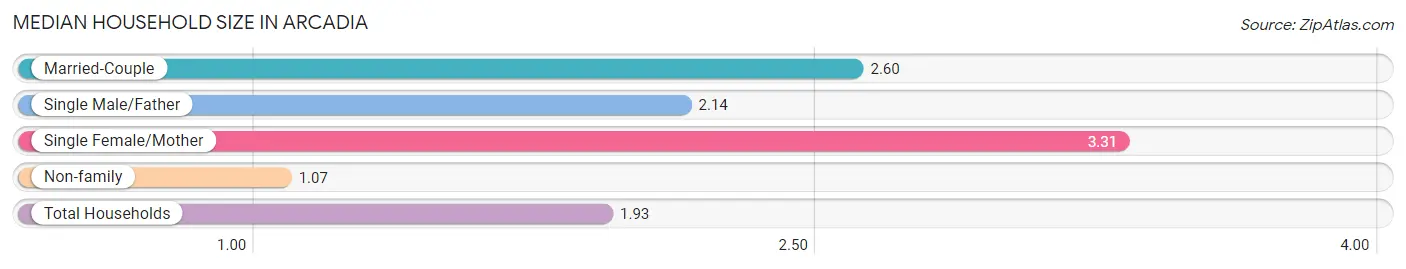
Median Household Size in Arcadia
The median household size in Arcadia is 1.93 persons per household, with single female/mother households (275 | 21.3%) accounting for the largest median household size of 3.31 persons per household. non-family households (682 | 52.9%) represent the smallest median household size with 1.07 persons per household.
| Household Type | # Households | Household Size |
| Married-Couple | 289 (22.4%) | 2.60 |
| Single Male/Father | 44 (3.4%) | 2.14 |
| Single Female/Mother | 275 (21.3%) | 3.31 |
| Non-family | 682 (52.9%) | 1.07 |
| Total Households | 1,290 (100.0%) | 1.93 |
Household Size by Marriage Status in Arcadia
Out of a total of 1,290 households in Arcadia, 608 (47.1%) are family households, while 682 (52.9%) are nonfamily households. The most numerous type of family households are 2-person households, comprising 333, and the most common type of nonfamily households are 1-person households, comprising 640.
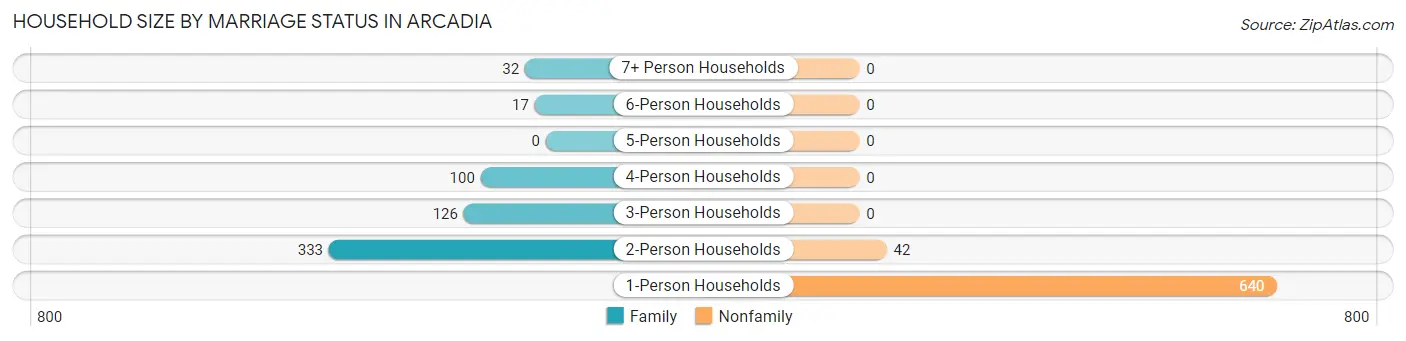
| Household Size | Family Households | Nonfamily Households |
| 1-Person Households | - | 640 (49.6%) |
| 2-Person Households | 333 (25.8%) | 42 (3.3%) |
| 3-Person Households | 126 (9.8%) | 0 (0.0%) |
| 4-Person Households | 100 (7.7%) | 0 (0.0%) |
| 5-Person Households | 0 (0.0%) | 0 (0.0%) |
| 6-Person Households | 17 (1.3%) | 0 (0.0%) |
| 7+ Person Households | 32 (2.5%) | 0 (0.0%) |
| Total | 608 (47.1%) | 682 (52.9%) |
Female Fertility in Arcadia
Fertility by Age in Arcadia
| Age Bracket | Women with Births | Births / 1,000 Women |
| 15 to 19 years | 0 (0.0%) | 0.0 |
| 20 to 34 years | 0 (0.0%) | 0.0 |
| 35 to 50 years | 0 (0.0%) | 0.0 |
| Total | 0 (0.0%) | 0.0 |
Fertility by Age by Marriage Status in Arcadia
| Age Bracket | Married | Unmarried |
| 15 to 19 years | 0 (0.0%) | 0 (0.0%) |
| 20 to 34 years | 0 (0.0%) | 0 (0.0%) |
| 35 to 50 years | 0 (0.0%) | 0 (0.0%) |
| Total | 0 (0.0%) | 0 (0.0%) |
Fertility by Education in Arcadia
| Educational Attainment | Women with Births | Births / 1,000 Women |
| Less than High School | 0 (0.0%) | 0.0 |
| High School Diploma | 0 (0.0%) | 0.0 |
| College or Associate's Degree | 0 (0.0%) | 0.0 |
| Bachelor's Degree | 0 (0.0%) | 0.0 |
| Graduate Degree | 0 (0.0%) | 0.0 |
| Total | 0 (0.0%) | 0.0 |
Fertility by Education by Marriage Status in Arcadia
| Educational Attainment | Married | Unmarried |
| Less than High School | 0 (0.0%) | 0 (0.0%) |
| High School Diploma | 0 (0.0%) | 0 (0.0%) |
| College or Associate's Degree | 0 (0.0%) | 0 (0.0%) |
| Bachelor's Degree | 0 (0.0%) | 0 (0.0%) |
| Graduate Degree | 0 (0.0%) | 0 (0.0%) |
| Total | 0 (0.0%) | 0 (0.0%) |
Employment Characteristics in Arcadia
Employment by Class of Employer in Arcadia
Among the 929 employed individuals in Arcadia, private company employees (610 | 65.7%), state government employees (148 | 15.9%), and local government employees (127 | 13.7%) make up the most common classes of employment.
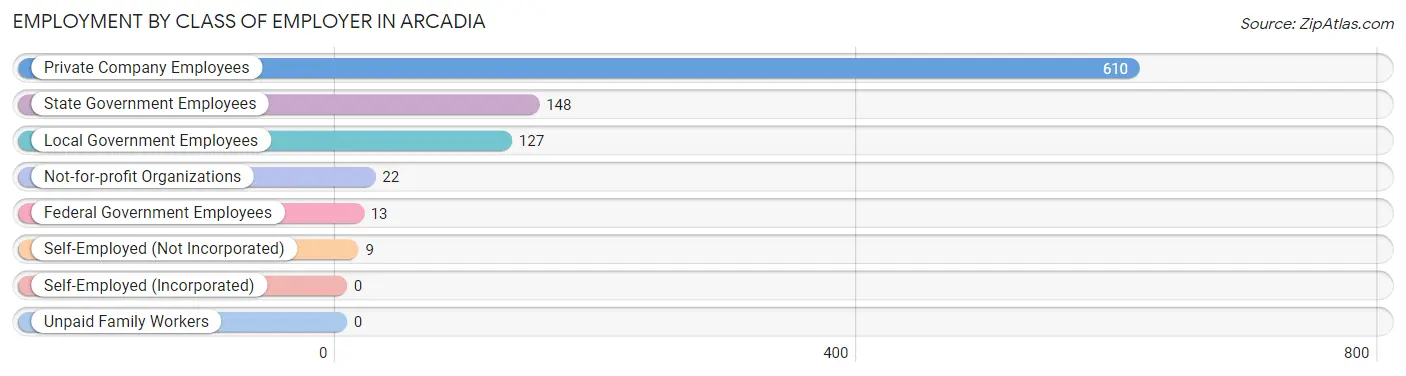
| Employer Class | # Employees | % Employees |
| Private Company Employees | 610 | 65.7% |
| Self-Employed (Incorporated) | 0 | 0.0% |
| Self-Employed (Not Incorporated) | 9 | 1.0% |
| Not-for-profit Organizations | 22 | 2.4% |
| Local Government Employees | 127 | 13.7% |
| State Government Employees | 148 | 15.9% |
| Federal Government Employees | 13 | 1.4% |
| Unpaid Family Workers | 0 | 0.0% |
| Total | 929 | 100.0% |
Employment Status by Age in Arcadia
According to the labor force statistics for Arcadia, out of the total population over 16 years of age (2,264), 43.6% or 987 individuals are in the labor force, with 2.7% or 27 of them unemployed. The age group with the highest labor force participation rate is 30 to 34 years, with 100.0% or 197 individuals in the labor force. Within the labor force, the 30 to 34 years age range has the highest percentage of unemployed individuals, with 13.2% or 26 of them being unemployed.
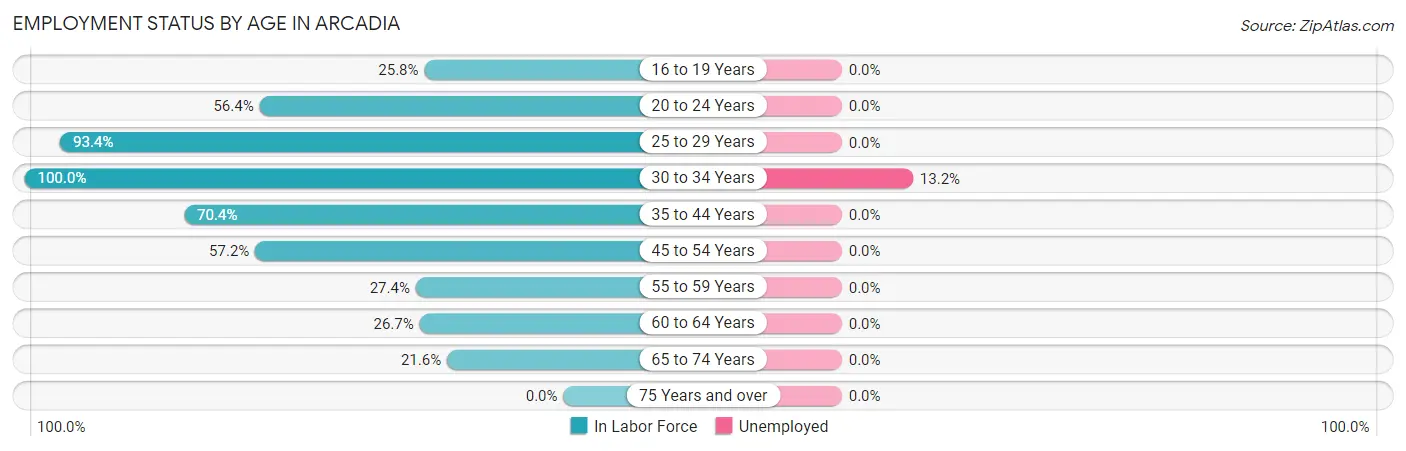
| Age Bracket | In Labor Force | Unemployed |
| 16 to 19 Years | 41 (25.8%) | 0 (0.0%) |
| 20 to 24 Years | 88 (56.4%) | 0 (0.0%) |
| 25 to 29 Years | 99 (93.4%) | 0 (0.0%) |
| 30 to 34 Years | 197 (100.0%) | 26 (13.2%) |
| 35 to 44 Years | 243 (70.4%) | 0 (0.0%) |
| 45 to 54 Years | 139 (57.2%) | 0 (0.0%) |
| 55 to 59 Years | 48 (27.4%) | 0 (0.0%) |
| 60 to 64 Years | 75 (26.7%) | 0 (0.0%) |
| 65 to 74 Years | 56 (21.6%) | 0 (0.0%) |
| 75 Years and over | 0 (0.0%) | 0 (0.0%) |
| Total | 987 (43.6%) | 27 (2.7%) |
Employment Status by Educational Attainment in Arcadia
According to labor force statistics for Arcadia, 59.5% of individuals (801) out of the total population between 25 and 64 years of age (1,347) are in the labor force, with 3.3% or 26 of them being unemployed. The group with the highest labor force participation rate are those with the educational attainment of bachelor's degree or higher, with 80.4% or 135 individuals in the labor force. Within the labor force, individuals with high school diploma education have the highest percentage of unemployment, with 6.1% or 27 of them being unemployed.
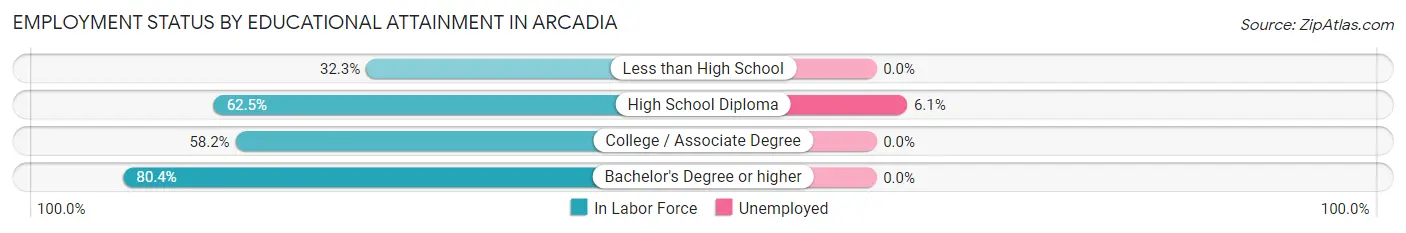
| Educational Attainment | In Labor Force | Unemployed |
| Less than High School | 63 (32.3%) | 0 (0.0%) |
| High School Diploma | 437 (62.5%) | 43 (6.1%) |
| College / Associate Degree | 166 (58.2%) | 0 (0.0%) |
| Bachelor's Degree or higher | 135 (80.4%) | 0 (0.0%) |
| Total | 801 (59.5%) | 44 (3.3%) |
Employment Occupations by Sex in Arcadia
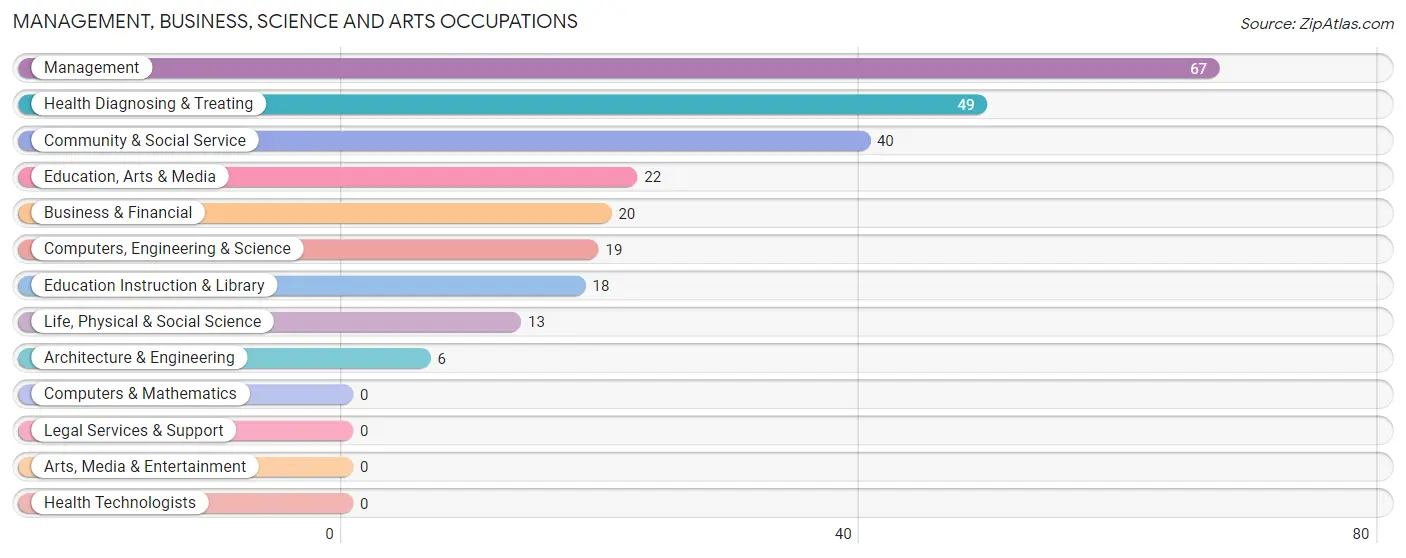
Management, Business, Science and Arts Occupations
The most common Management, Business, Science and Arts occupations in Arcadia are Management (67 | 7.0%), Health Diagnosing & Treating (49 | 5.1%), Community & Social Service (40 | 4.2%), Education, Arts & Media (22 | 2.3%), and Business & Financial (20 | 2.1%).
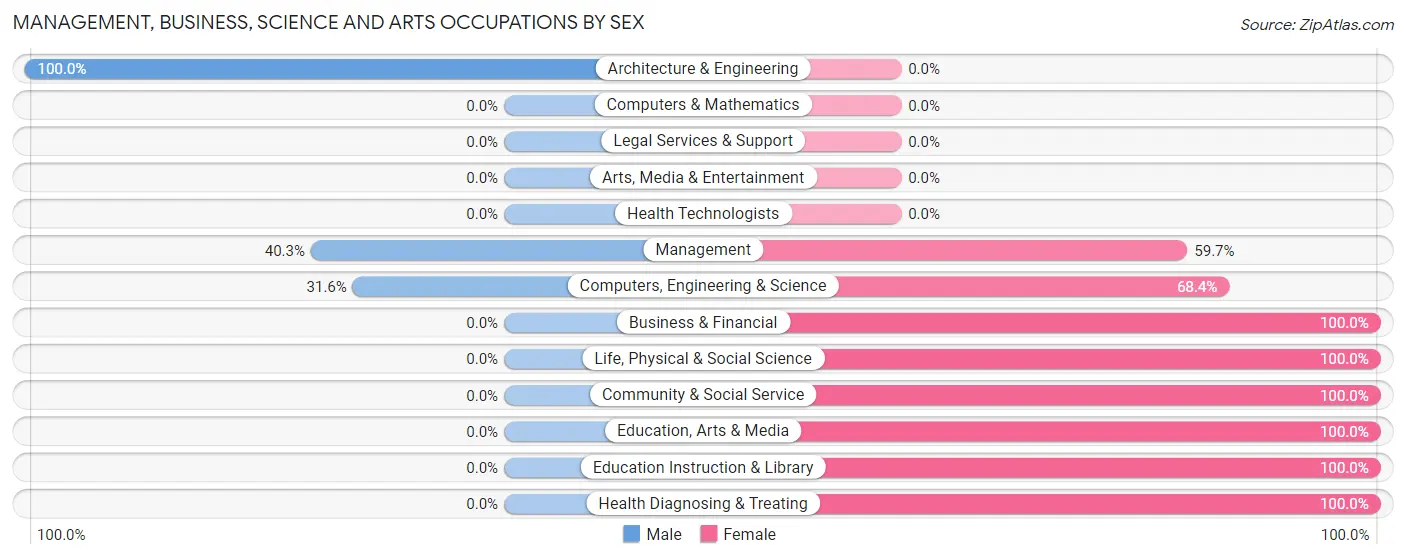
Management, Business, Science and Arts Occupations by Sex
Within the Management, Business, Science and Arts occupations in Arcadia, the most male-oriented occupations are Architecture & Engineering (100.0%), Management (40.3%), and Computers, Engineering & Science (31.6%), while the most female-oriented occupations are Business & Financial (100.0%), Life, Physical & Social Science (100.0%), and Community & Social Service (100.0%).
| Occupation | Male | Female |
| Management | 27 (40.3%) | 40 (59.7%) |
| Business & Financial | 0 (0.0%) | 20 (100.0%) |
| Computers, Engineering & Science | 6 (31.6%) | 13 (68.4%) |
| Computers & Mathematics | 0 (0.0%) | 0 (0.0%) |
| Architecture & Engineering | 6 (100.0%) | 0 (0.0%) |
| Life, Physical & Social Science | 0 (0.0%) | 13 (100.0%) |
| Community & Social Service | 0 (0.0%) | 40 (100.0%) |
| Education, Arts & Media | 0 (0.0%) | 22 (100.0%) |
| Legal Services & Support | 0 (0.0%) | 0 (0.0%) |
| Education Instruction & Library | 0 (0.0%) | 18 (100.0%) |
| Arts, Media & Entertainment | 0 (0.0%) | 0 (0.0%) |
| Health Diagnosing & Treating | 0 (0.0%) | 49 (100.0%) |
| Health Technologists | 0 (0.0%) | 0 (0.0%) |
| Total (Category) | 33 (16.9%) | 162 (83.1%) |
| Total (Overall) | 485 (50.9%) | 467 (49.0%) |
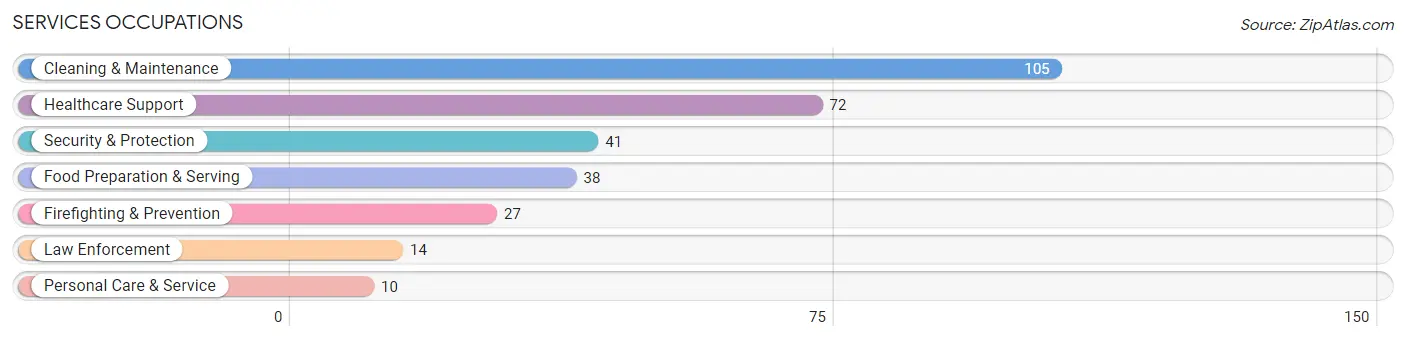
Services Occupations
The most common Services occupations in Arcadia are Cleaning & Maintenance (105 | 11.0%), Healthcare Support (72 | 7.6%), Security & Protection (41 | 4.3%), Food Preparation & Serving (38 | 4.0%), and Firefighting & Prevention (27 | 2.8%).
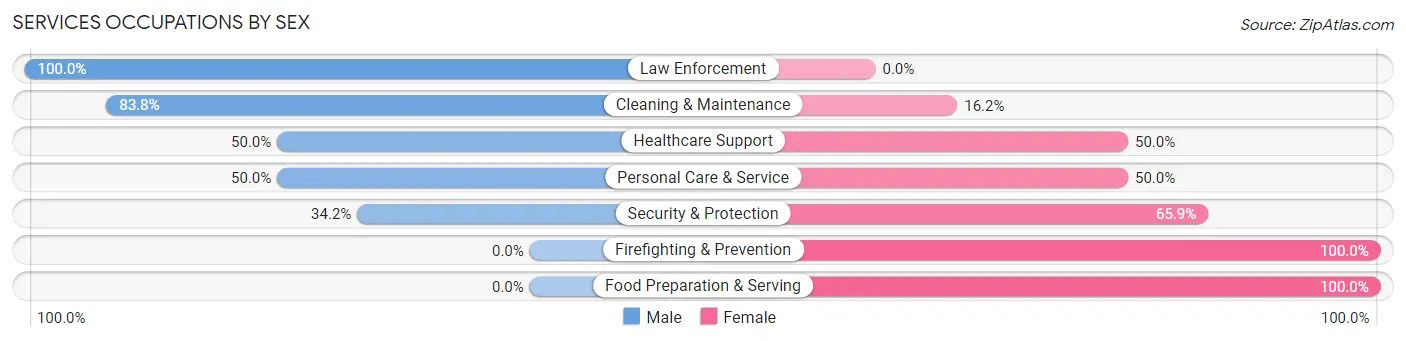
Services Occupations by Sex
Within the Services occupations in Arcadia, the most male-oriented occupations are Law Enforcement (100.0%), Cleaning & Maintenance (83.8%), and Healthcare Support (50.0%), while the most female-oriented occupations are Firefighting & Prevention (100.0%), Food Preparation & Serving (100.0%), and Security & Protection (65.8%).
| Occupation | Male | Female |
| Healthcare Support | 36 (50.0%) | 36 (50.0%) |
| Security & Protection | 14 (34.2%) | 27 (65.8%) |
| Firefighting & Prevention | 0 (0.0%) | 27 (100.0%) |
| Law Enforcement | 14 (100.0%) | 0 (0.0%) |
| Food Preparation & Serving | 0 (0.0%) | 38 (100.0%) |
| Cleaning & Maintenance | 88 (83.8%) | 17 (16.2%) |
| Personal Care & Service | 5 (50.0%) | 5 (50.0%) |
| Total (Category) | 143 (53.8%) | 123 (46.2%) |
| Total (Overall) | 485 (50.9%) | 467 (49.0%) |
Sales and Office Occupations
The most common Sales and Office occupations in Arcadia are Sales & Related (79 | 8.3%), and Office & Administration (21 | 2.2%).

Sales and Office Occupations by Sex

| Occupation | Male | Female |
| Sales & Related | 19 (24.0%) | 60 (75.9%) |
| Office & Administration | 0 (0.0%) | 21 (100.0%) |
| Total (Category) | 19 (19.0%) | 81 (81.0%) |
| Total (Overall) | 485 (50.9%) | 467 (49.0%) |
Natural Resources, Construction and Maintenance Occupations
The most common Natural Resources, Construction and Maintenance occupations in Arcadia are Installation, Maintenance & Repair (71 | 7.5%), and Construction & Extraction (16 | 1.7%).
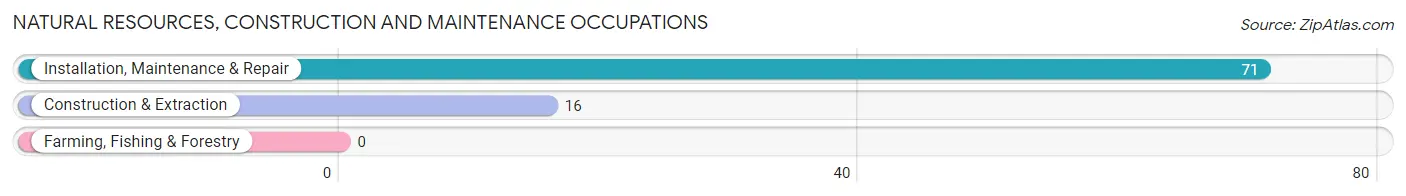
Natural Resources, Construction and Maintenance Occupations by Sex

| Occupation | Male | Female |
| Farming, Fishing & Forestry | 0 (0.0%) | 0 (0.0%) |
| Construction & Extraction | 16 (100.0%) | 0 (0.0%) |
| Installation, Maintenance & Repair | 71 (100.0%) | 0 (0.0%) |
| Total (Category) | 87 (100.0%) | 0 (0.0%) |
| Total (Overall) | 485 (50.9%) | 467 (49.0%) |
Production, Transportation and Moving Occupations
The most common Production, Transportation and Moving occupations in Arcadia are Production (181 | 19.0%), Material Moving (65 | 6.8%), and Transportation (58 | 6.1%).
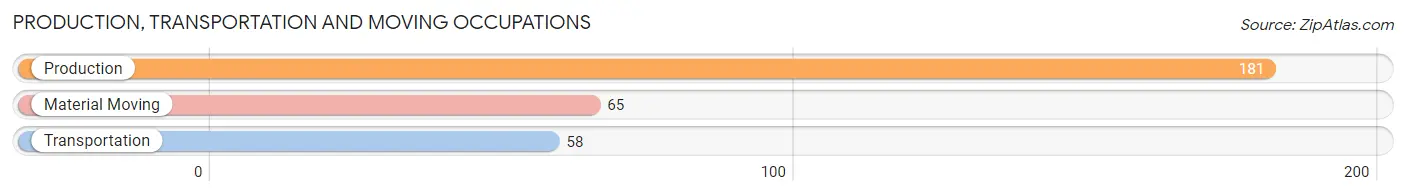
Production, Transportation and Moving Occupations by Sex
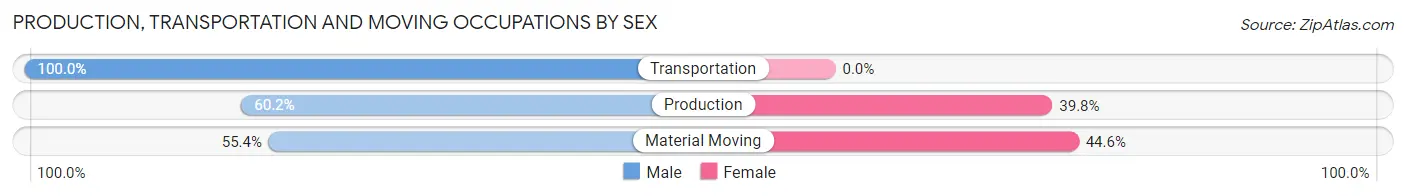
| Occupation | Male | Female |
| Production | 109 (60.2%) | 72 (39.8%) |
| Transportation | 58 (100.0%) | 0 (0.0%) |
| Material Moving | 36 (55.4%) | 29 (44.6%) |
| Total (Category) | 203 (66.8%) | 101 (33.2%) |
| Total (Overall) | 485 (50.9%) | 467 (49.0%) |
Employment Industries by Sex in Arcadia
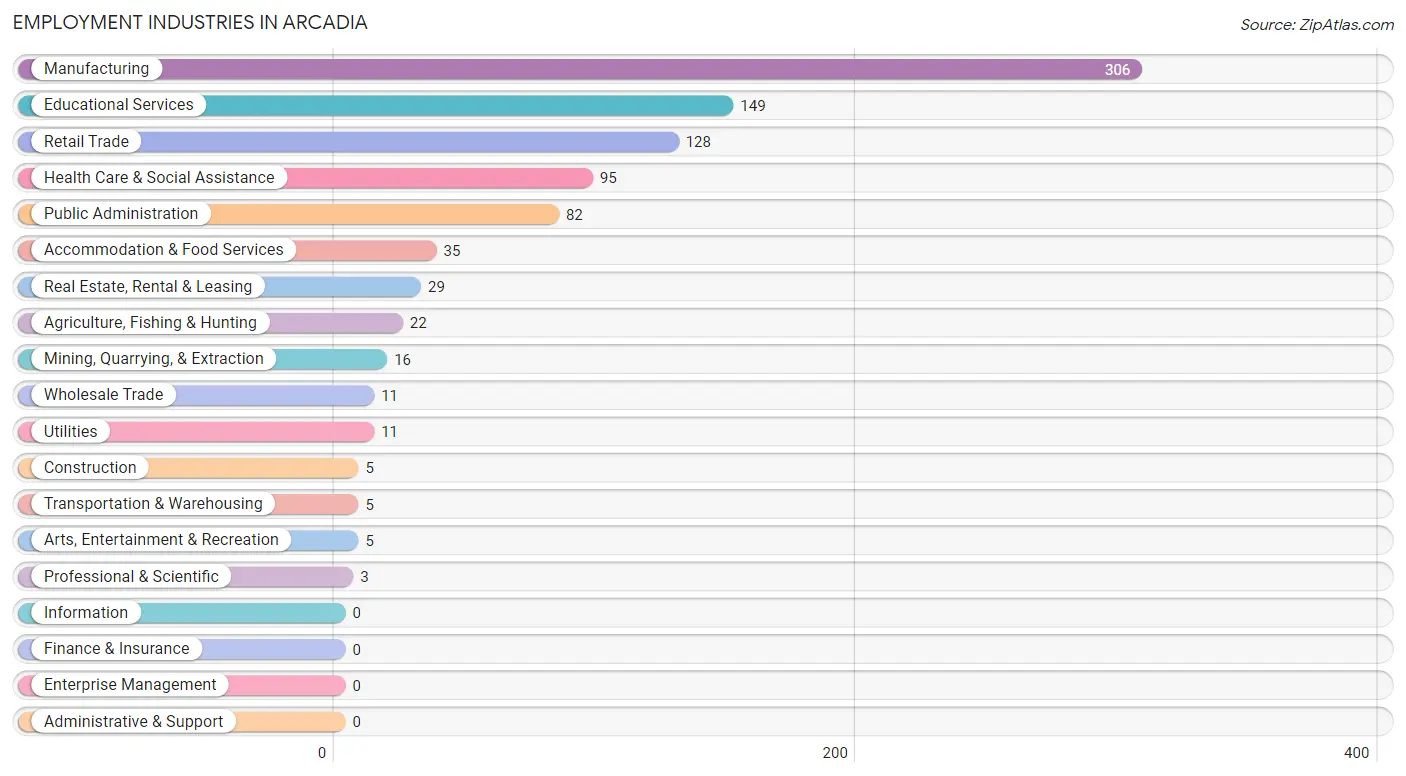
Employment Industries in Arcadia
The major employment industries in Arcadia include Manufacturing (306 | 32.1%), Educational Services (149 | 15.7%), Retail Trade (128 | 13.5%), Health Care & Social Assistance (95 | 10.0%), and Public Administration (82 | 8.6%).
Employment Industries by Sex in Arcadia
The Arcadia industries that see more men than women are Agriculture, Fishing & Hunting (100.0%), Mining, Quarrying, & Extraction (100.0%), and Construction (100.0%), whereas the industries that tend to have a higher number of women are Transportation & Warehousing (100.0%), Professional & Scientific (100.0%), and Accommodation & Food Services (100.0%).
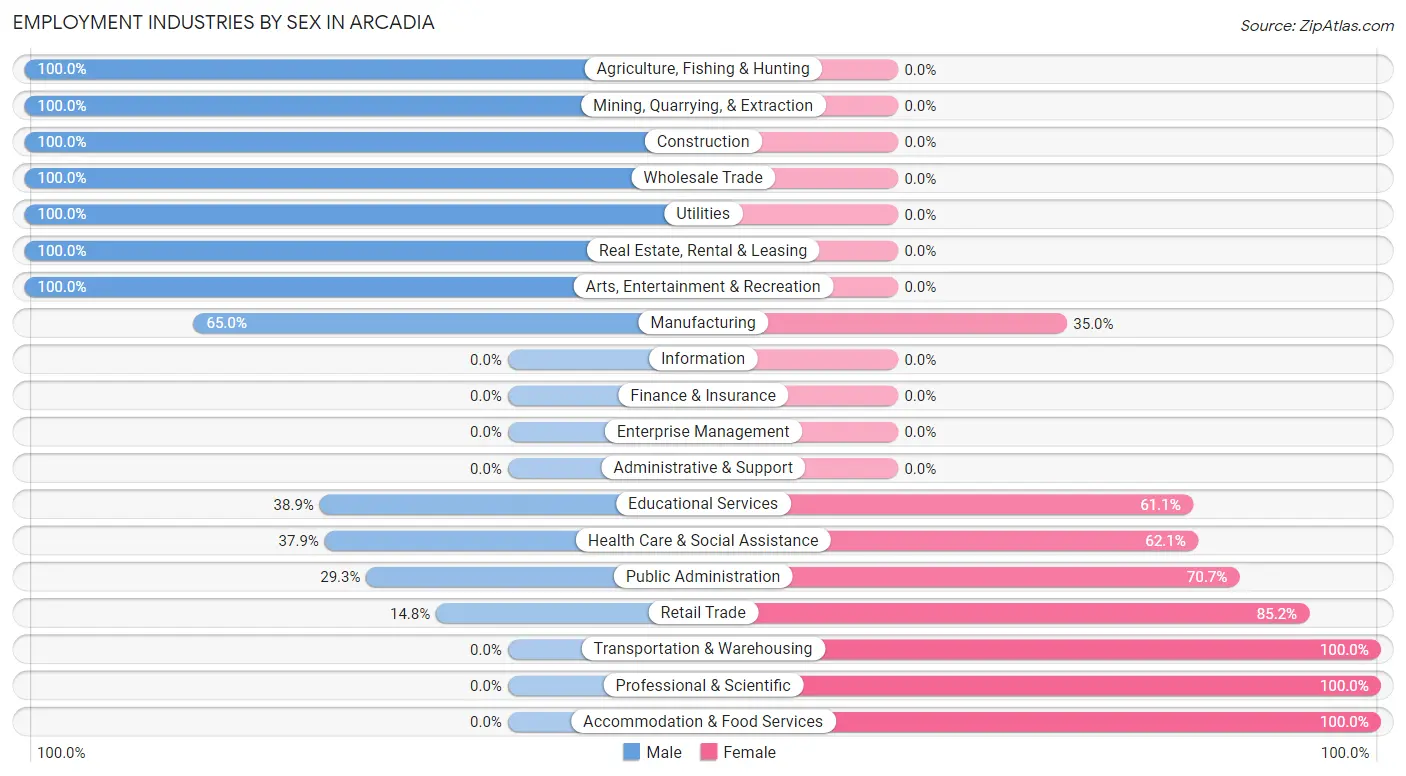
| Industry | Male | Female |
| Agriculture, Fishing & Hunting | 22 (100.0%) | 0 (0.0%) |
| Mining, Quarrying, & Extraction | 16 (100.0%) | 0 (0.0%) |
| Construction | 5 (100.0%) | 0 (0.0%) |
| Manufacturing | 199 (65.0%) | 107 (35.0%) |
| Wholesale Trade | 11 (100.0%) | 0 (0.0%) |
| Retail Trade | 19 (14.8%) | 109 (85.2%) |
| Transportation & Warehousing | 0 (0.0%) | 5 (100.0%) |
| Utilities | 11 (100.0%) | 0 (0.0%) |
| Information | 0 (0.0%) | 0 (0.0%) |
| Finance & Insurance | 0 (0.0%) | 0 (0.0%) |
| Real Estate, Rental & Leasing | 29 (100.0%) | 0 (0.0%) |
| Professional & Scientific | 0 (0.0%) | 3 (100.0%) |
| Enterprise Management | 0 (0.0%) | 0 (0.0%) |
| Administrative & Support | 0 (0.0%) | 0 (0.0%) |
| Educational Services | 58 (38.9%) | 91 (61.1%) |
| Health Care & Social Assistance | 36 (37.9%) | 59 (62.1%) |
| Arts, Entertainment & Recreation | 5 (100.0%) | 0 (0.0%) |
| Accommodation & Food Services | 0 (0.0%) | 35 (100.0%) |
| Public Administration | 24 (29.3%) | 58 (70.7%) |
| Total | 485 (50.9%) | 467 (49.0%) |
Education in Arcadia
School Enrollment in Arcadia
The most common levels of schooling among the 558 students in Arcadia are middle school (191 | 34.2%), high school (160 | 28.7%), and elementary school (88 | 15.8%).
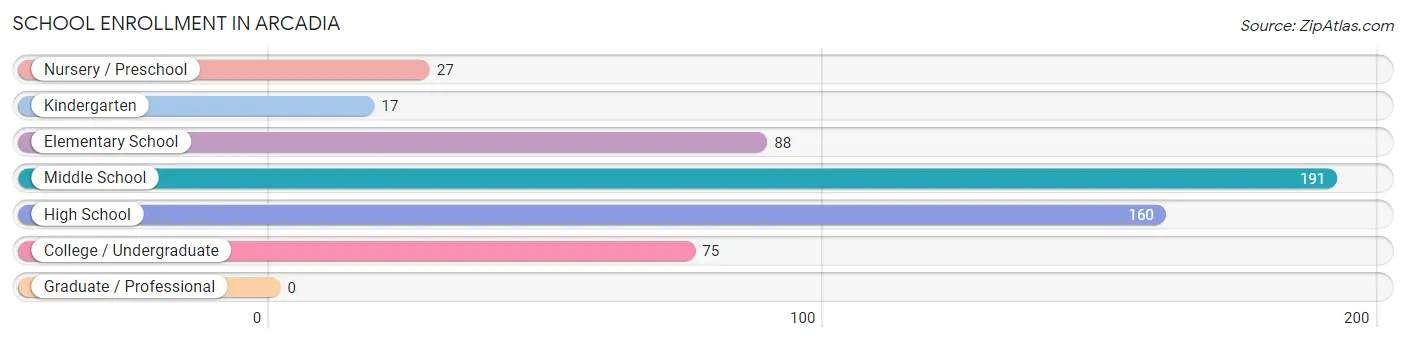
| School Level | # Students | % Students |
| Nursery / Preschool | 27 | 4.8% |
| Kindergarten | 17 | 3.0% |
| Elementary School | 88 | 15.8% |
| Middle School | 191 | 34.2% |
| High School | 160 | 28.7% |
| College / Undergraduate | 75 | 13.4% |
| Graduate / Professional | 0 | 0.0% |
| Total | 558 | 100.0% |
School Enrollment by Age by Funding Source in Arcadia
Out of a total of 558 students who are enrolled in schools in Arcadia, 33 (5.9%) attend a private institution, while the remaining 525 (94.1%) are enrolled in public schools. The age group of 3 to 4 year olds has the highest likelihood of being enrolled in private schools, with 22 (81.5% in the age bracket) enrolled. Conversely, the age group of 5 to 9 year old has the lowest likelihood of being enrolled in a private school, with 105 (100.0% in the age bracket) attending a public institution.
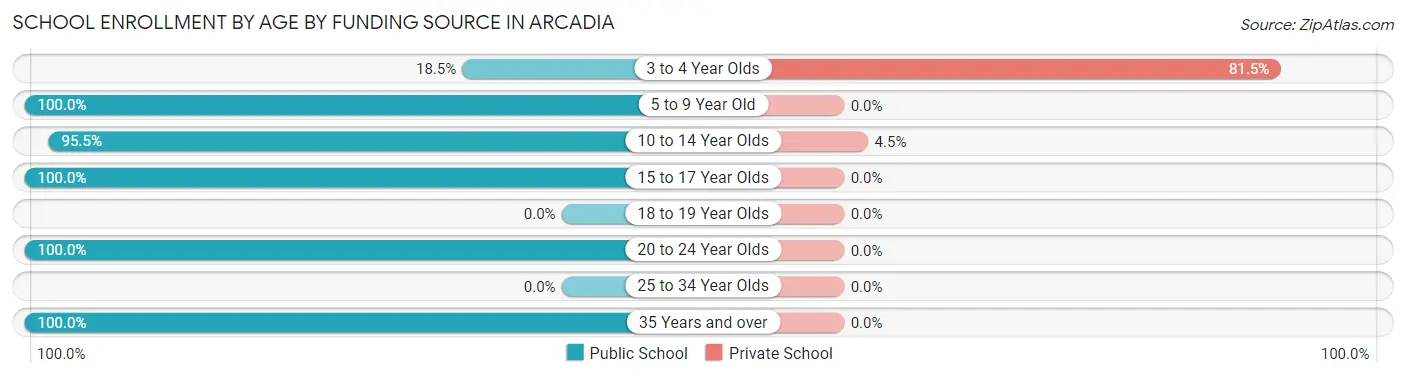
| Age Bracket | Public School | Private School |
| 3 to 4 Year Olds | 5 (18.5%) | 22 (81.5%) |
| 5 to 9 Year Old | 105 (100.0%) | 0 (0.0%) |
| 10 to 14 Year Olds | 235 (95.5%) | 11 (4.5%) |
| 15 to 17 Year Olds | 105 (100.0%) | 0 (0.0%) |
| 18 to 19 Year Olds | 0 (0.0%) | 0 (0.0%) |
| 20 to 24 Year Olds | 36 (100.0%) | 0 (0.0%) |
| 25 to 34 Year Olds | 0 (0.0%) | 0 (0.0%) |
| 35 Years and over | 39 (100.0%) | 0 (0.0%) |
| Total | 525 (94.1%) | 33 (5.9%) |
Educational Attainment by Field of Study in Arcadia
Education (101 | 36.1%), bio, nature & agricultural (46 | 16.4%), science & technology (39 | 13.9%), arts & humanities (22 | 7.9%), and communications (17 | 6.1%) are the most common fields of study among 280 individuals in Arcadia who have obtained a bachelor's degree or higher.
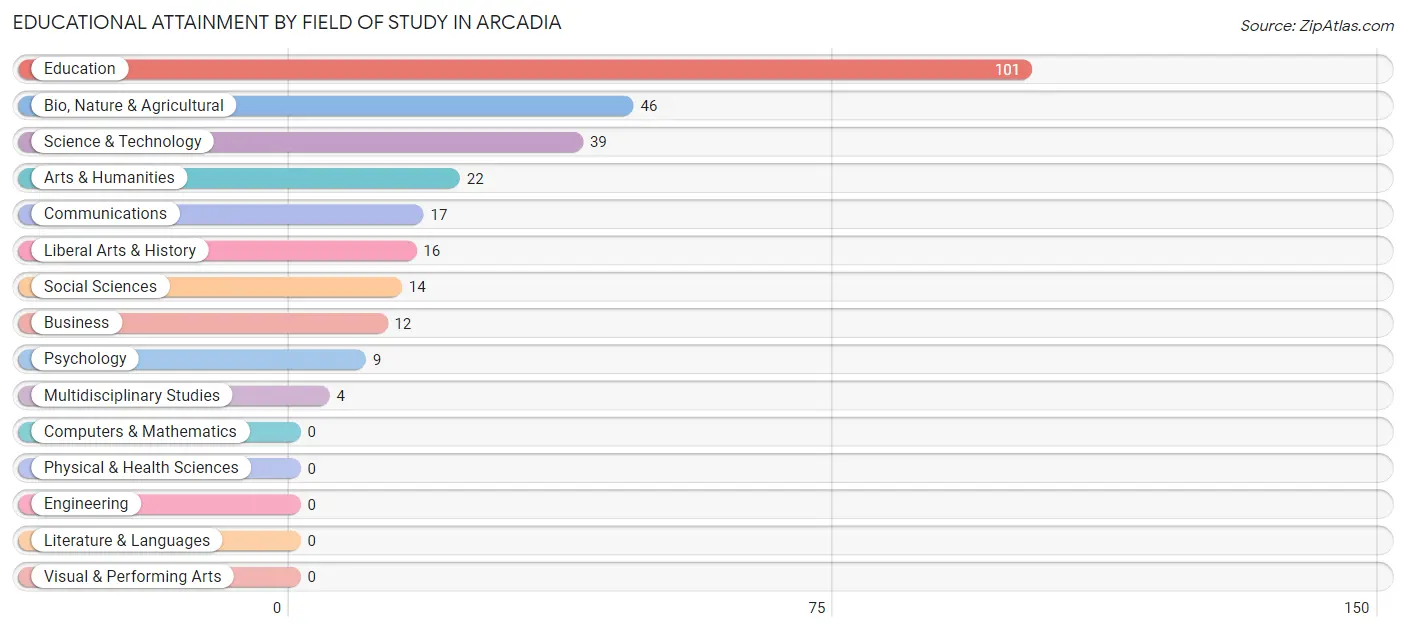
| Field of Study | # Graduates | % Graduates |
| Computers & Mathematics | 0 | 0.0% |
| Bio, Nature & Agricultural | 46 | 16.4% |
| Physical & Health Sciences | 0 | 0.0% |
| Psychology | 9 | 3.2% |
| Social Sciences | 14 | 5.0% |
| Engineering | 0 | 0.0% |
| Multidisciplinary Studies | 4 | 1.4% |
| Science & Technology | 39 | 13.9% |
| Business | 12 | 4.3% |
| Education | 101 | 36.1% |
| Literature & Languages | 0 | 0.0% |
| Liberal Arts & History | 16 | 5.7% |
| Visual & Performing Arts | 0 | 0.0% |
| Communications | 17 | 6.1% |
| Arts & Humanities | 22 | 7.9% |
| Total | 280 | 100.0% |
Transportation & Commute in Arcadia
Vehicle Availability by Sex in Arcadia
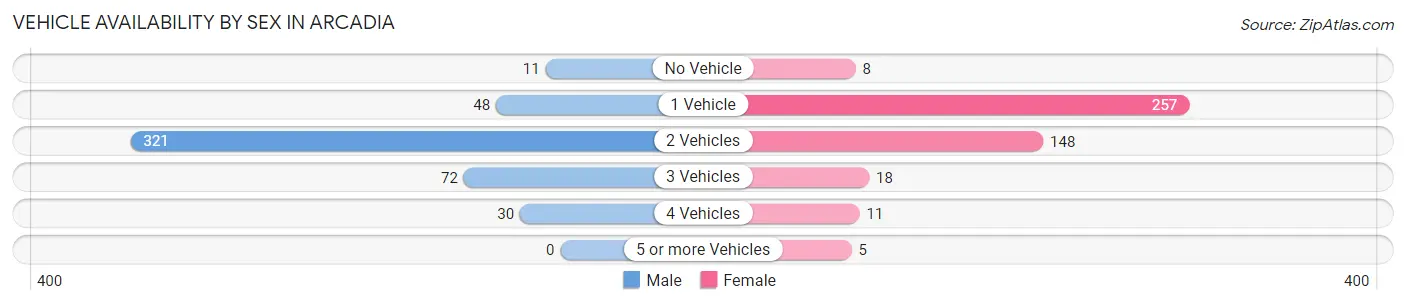
The most prevalent vehicle ownership categories in Arcadia are males with 2 vehicles (321, accounting for 66.6%) and females with 2 vehicles (148, making up 71.8%).
| Vehicles Available | Male | Female |
| No Vehicle | 11 (2.3%) | 8 (1.8%) |
| 1 Vehicle | 48 (10.0%) | 257 (57.5%) |
| 2 Vehicles | 321 (66.6%) | 148 (33.1%) |
| 3 Vehicles | 72 (14.9%) | 18 (4.0%) |
| 4 Vehicles | 30 (6.2%) | 11 (2.5%) |
| 5 or more Vehicles | 0 (0.0%) | 5 (1.1%) |
| Total | 482 (100.0%) | 447 (100.0%) |
Commute Time in Arcadia
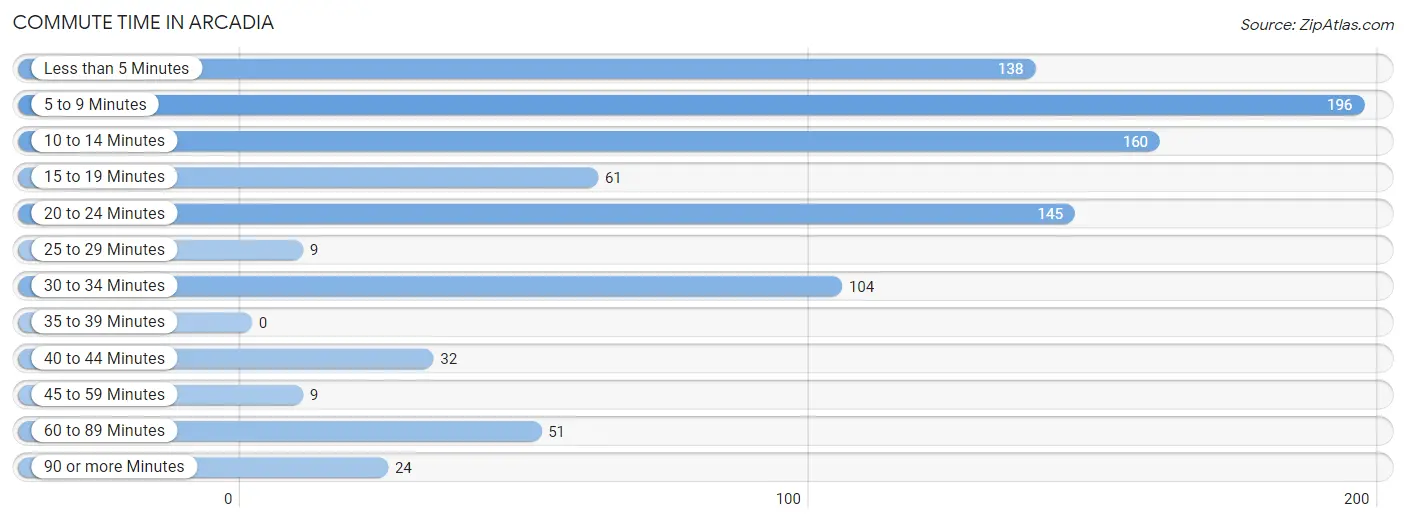
The most frequently occuring commute durations in Arcadia are 5 to 9 minutes (196 commuters, 21.1%), 10 to 14 minutes (160 commuters, 17.2%), and 20 to 24 minutes (145 commuters, 15.6%).
| Commute Time | # Commuters | % Commuters |
| Less than 5 Minutes | 138 | 14.8% |
| 5 to 9 Minutes | 196 | 21.1% |
| 10 to 14 Minutes | 160 | 17.2% |
| 15 to 19 Minutes | 61 | 6.6% |
| 20 to 24 Minutes | 145 | 15.6% |
| 25 to 29 Minutes | 9 | 1.0% |
| 30 to 34 Minutes | 104 | 11.2% |
| 35 to 39 Minutes | 0 | 0.0% |
| 40 to 44 Minutes | 32 | 3.4% |
| 45 to 59 Minutes | 9 | 1.0% |
| 60 to 89 Minutes | 51 | 5.5% |
| 90 or more Minutes | 24 | 2.6% |
Commute Time by Sex in Arcadia
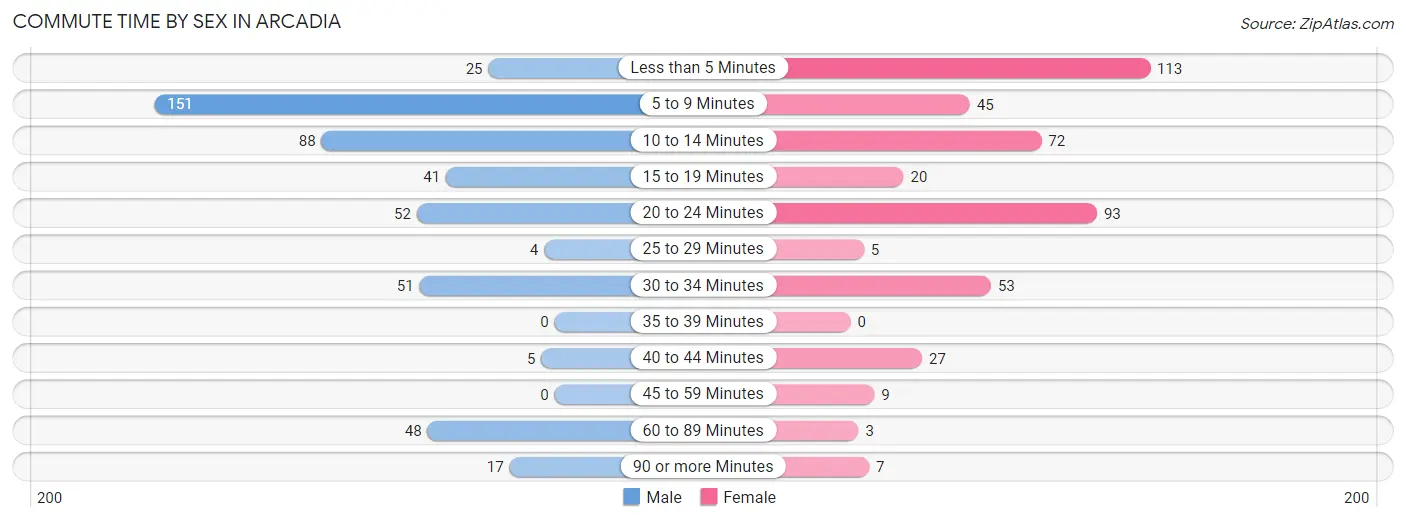
The most common commute times in Arcadia are 5 to 9 minutes (151 commuters, 31.3%) for males and less than 5 minutes (113 commuters, 25.3%) for females.
| Commute Time | Male | Female |
| Less than 5 Minutes | 25 (5.2%) | 113 (25.3%) |
| 5 to 9 Minutes | 151 (31.3%) | 45 (10.1%) |
| 10 to 14 Minutes | 88 (18.3%) | 72 (16.1%) |
| 15 to 19 Minutes | 41 (8.5%) | 20 (4.5%) |
| 20 to 24 Minutes | 52 (10.8%) | 93 (20.8%) |
| 25 to 29 Minutes | 4 (0.8%) | 5 (1.1%) |
| 30 to 34 Minutes | 51 (10.6%) | 53 (11.9%) |
| 35 to 39 Minutes | 0 (0.0%) | 0 (0.0%) |
| 40 to 44 Minutes | 5 (1.0%) | 27 (6.0%) |
| 45 to 59 Minutes | 0 (0.0%) | 9 (2.0%) |
| 60 to 89 Minutes | 48 (10.0%) | 3 (0.7%) |
| 90 or more Minutes | 17 (3.5%) | 7 (1.6%) |
Time of Departure to Work by Sex in Arcadia
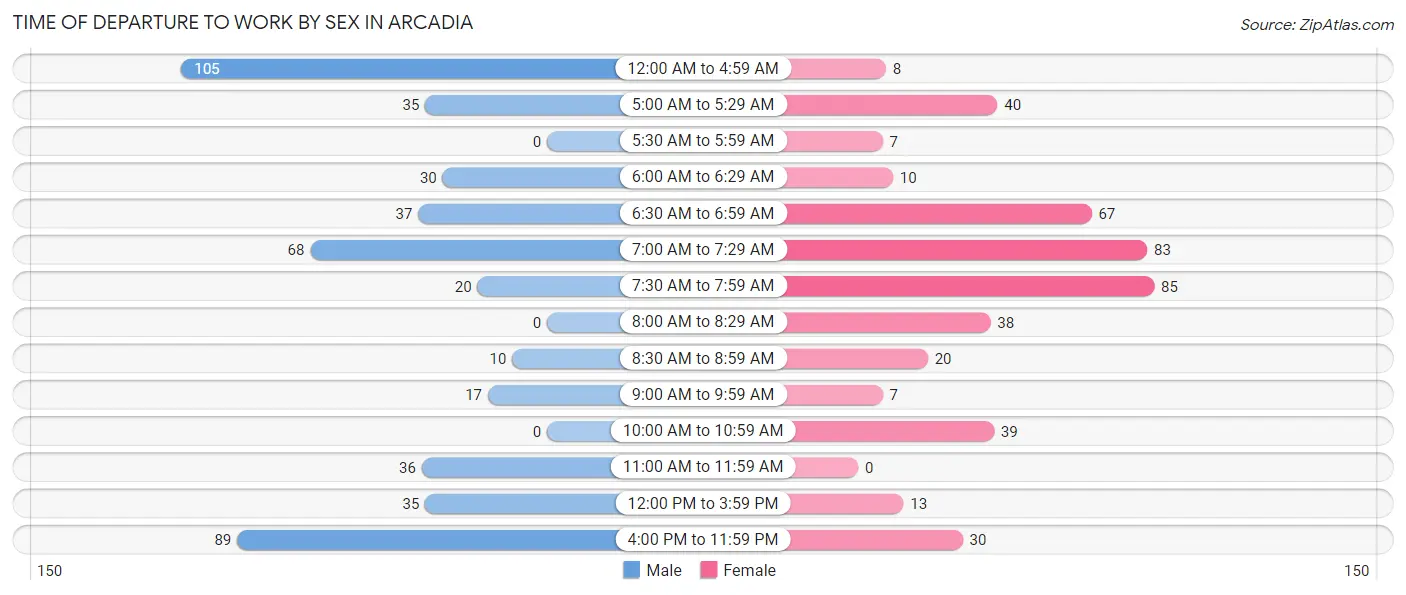
The most frequent times of departure to work in Arcadia are 12:00 AM to 4:59 AM (105, 21.8%) for males and 7:30 AM to 7:59 AM (85, 19.0%) for females.
| Time of Departure | Male | Female |
| 12:00 AM to 4:59 AM | 105 (21.8%) | 8 (1.8%) |
| 5:00 AM to 5:29 AM | 35 (7.3%) | 40 (8.9%) |
| 5:30 AM to 5:59 AM | 0 (0.0%) | 7 (1.6%) |
| 6:00 AM to 6:29 AM | 30 (6.2%) | 10 (2.2%) |
| 6:30 AM to 6:59 AM | 37 (7.7%) | 67 (15.0%) |
| 7:00 AM to 7:29 AM | 68 (14.1%) | 83 (18.6%) |
| 7:30 AM to 7:59 AM | 20 (4.2%) | 85 (19.0%) |
| 8:00 AM to 8:29 AM | 0 (0.0%) | 38 (8.5%) |
| 8:30 AM to 8:59 AM | 10 (2.1%) | 20 (4.5%) |
| 9:00 AM to 9:59 AM | 17 (3.5%) | 7 (1.6%) |
| 10:00 AM to 10:59 AM | 0 (0.0%) | 39 (8.7%) |
| 11:00 AM to 11:59 AM | 36 (7.5%) | 0 (0.0%) |
| 12:00 PM to 3:59 PM | 35 (7.3%) | 13 (2.9%) |
| 4:00 PM to 11:59 PM | 89 (18.5%) | 30 (6.7%) |
| Total | 482 (100.0%) | 447 (100.0%) |
Housing Occupancy in Arcadia
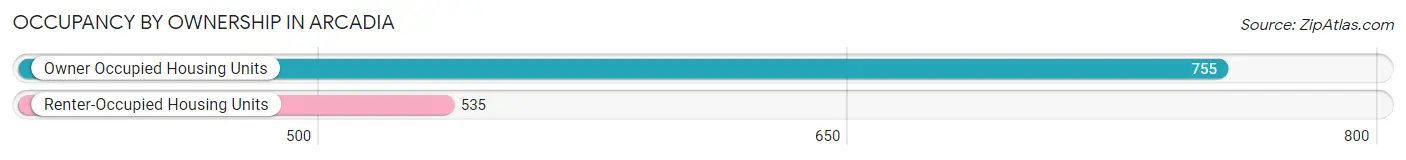
Occupancy by Ownership in Arcadia
Of the total 1,290 dwellings in Arcadia, owner-occupied units account for 755 (58.5%), while renter-occupied units make up 535 (41.5%).
| Occupancy | # Housing Units | % Housing Units |
| Owner Occupied Housing Units | 755 | 58.5% |
| Renter-Occupied Housing Units | 535 | 41.5% |
| Total Occupied Housing Units | 1,290 | 100.0% |
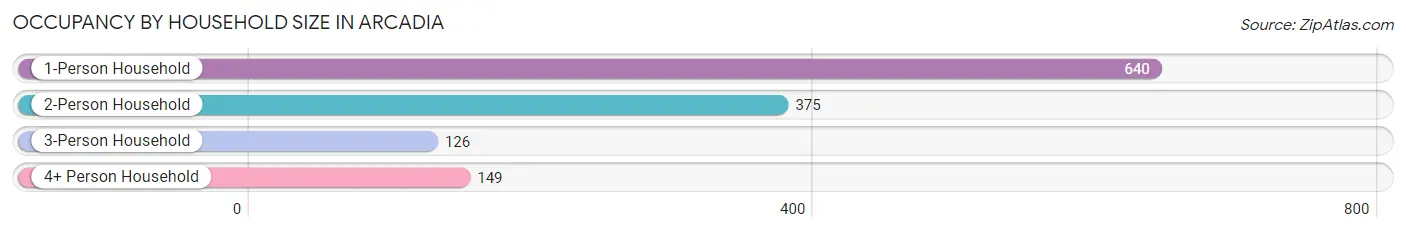
Occupancy by Household Size in Arcadia
| Household Size | # Housing Units | % Housing Units |
| 1-Person Household | 640 | 49.6% |
| 2-Person Household | 375 | 29.1% |
| 3-Person Household | 126 | 9.8% |
| 4+ Person Household | 149 | 11.6% |
| Total Housing Units | 1,290 | 100.0% |
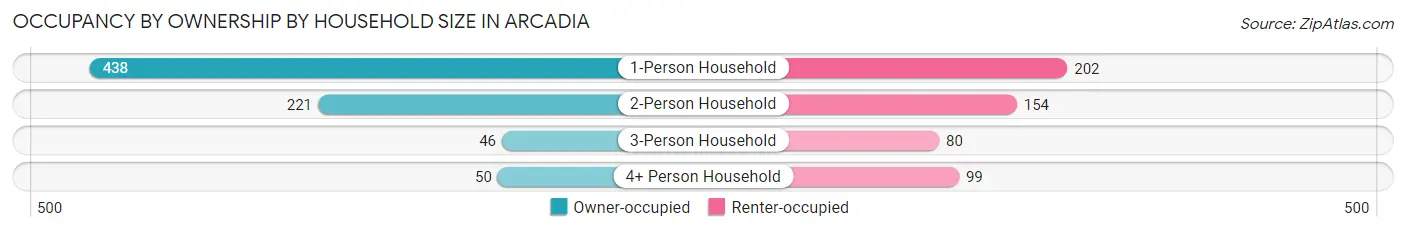
Occupancy by Ownership by Household Size in Arcadia
| Household Size | Owner-occupied | Renter-occupied |
| 1-Person Household | 438 (68.4%) | 202 (31.6%) |
| 2-Person Household | 221 (58.9%) | 154 (41.1%) |
| 3-Person Household | 46 (36.5%) | 80 (63.5%) |
| 4+ Person Household | 50 (33.6%) | 99 (66.4%) |
| Total Housing Units | 755 (58.5%) | 535 (41.5%) |
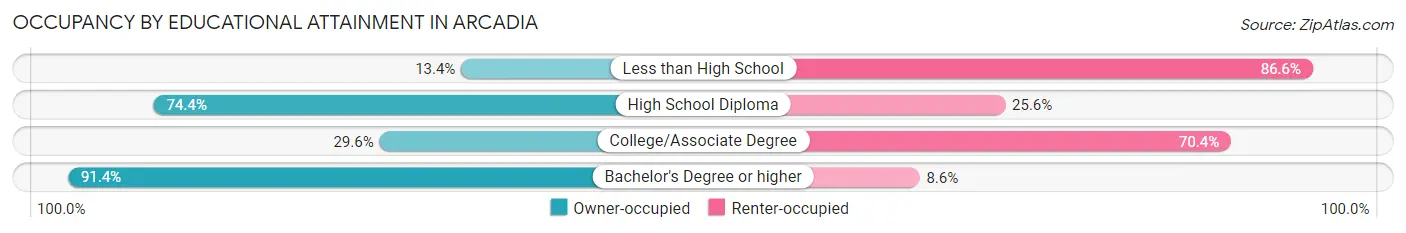
Occupancy by Educational Attainment in Arcadia
| Household Size | Owner-occupied | Renter-occupied |
| Less than High School | 25 (13.4%) | 161 (86.6%) |
| High School Diploma | 466 (74.4%) | 160 (25.6%) |
| College/Associate Degree | 83 (29.6%) | 197 (70.4%) |
| Bachelor's Degree or higher | 181 (91.4%) | 17 (8.6%) |
Occupancy by Age of Householder in Arcadia
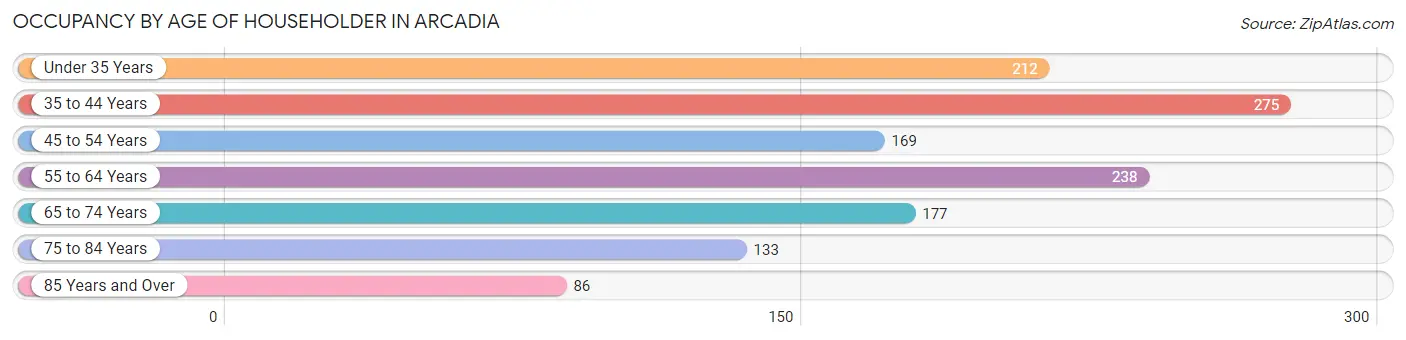
| Age Bracket | # Households | % Households |
| Under 35 Years | 212 | 16.4% |
| 35 to 44 Years | 275 | 21.3% |
| 45 to 54 Years | 169 | 13.1% |
| 55 to 64 Years | 238 | 18.4% |
| 65 to 74 Years | 177 | 13.7% |
| 75 to 84 Years | 133 | 10.3% |
| 85 Years and Over | 86 | 6.7% |
| Total | 1,290 | 100.0% |
Housing Finances in Arcadia
Median Income by Occupancy in Arcadia
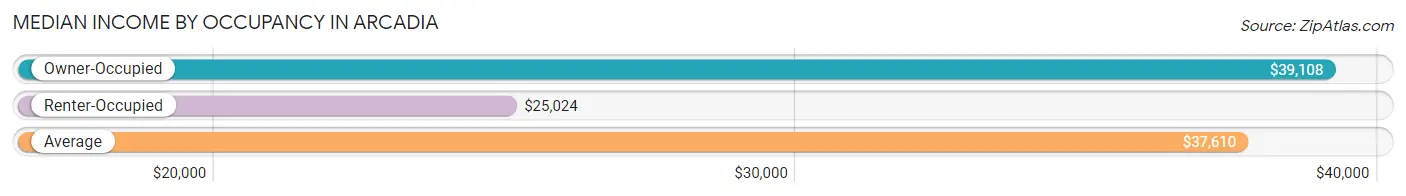
| Occupancy Type | # Households | Median Income |
| Owner-Occupied | 755 (58.5%) | $39,108 |
| Renter-Occupied | 535 (41.5%) | $25,024 |
| Average | 1,290 (100.0%) | $37,610 |
Occupancy by Householder Income Bracket in Arcadia
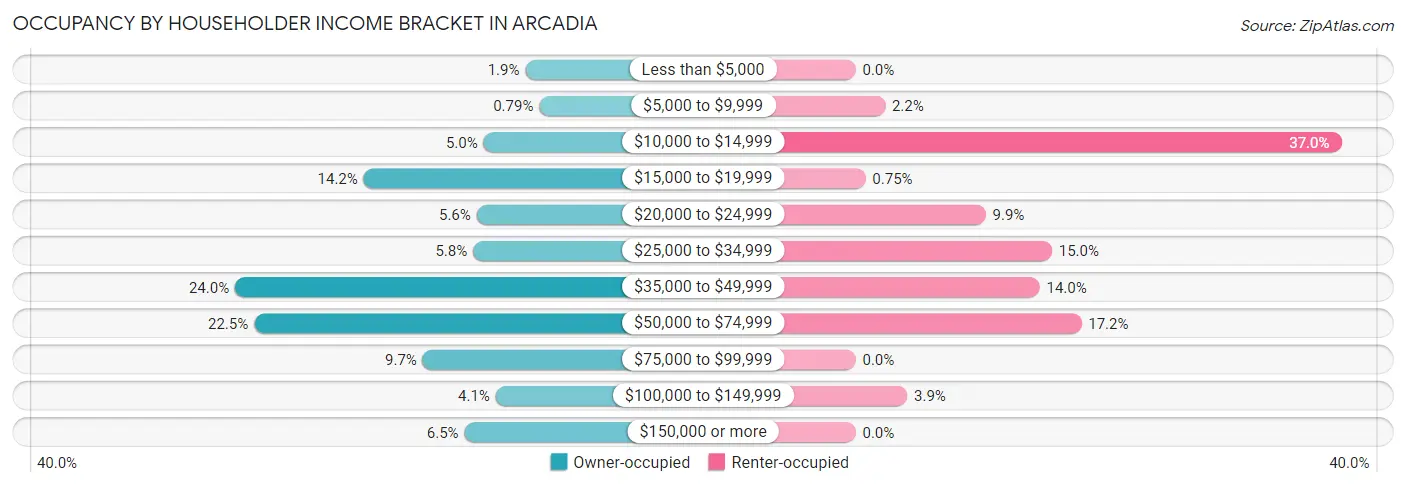
| Income Bracket | Owner-occupied | Renter-occupied |
| Less than $5,000 | 14 (1.8%) | 0 (0.0%) |
| $5,000 to $9,999 | 6 (0.8%) | 12 (2.2%) |
| $10,000 to $14,999 | 38 (5.0%) | 198 (37.0%) |
| $15,000 to $19,999 | 107 (14.2%) | 4 (0.7%) |
| $20,000 to $24,999 | 42 (5.6%) | 53 (9.9%) |
| $25,000 to $34,999 | 44 (5.8%) | 80 (14.9%) |
| $35,000 to $49,999 | 181 (24.0%) | 75 (14.0%) |
| $50,000 to $74,999 | 170 (22.5%) | 92 (17.2%) |
| $75,000 to $99,999 | 73 (9.7%) | 0 (0.0%) |
| $100,000 to $149,999 | 31 (4.1%) | 21 (3.9%) |
| $150,000 or more | 49 (6.5%) | 0 (0.0%) |
| Total | 755 (100.0%) | 535 (100.0%) |
Monthly Housing Cost Tiers in Arcadia
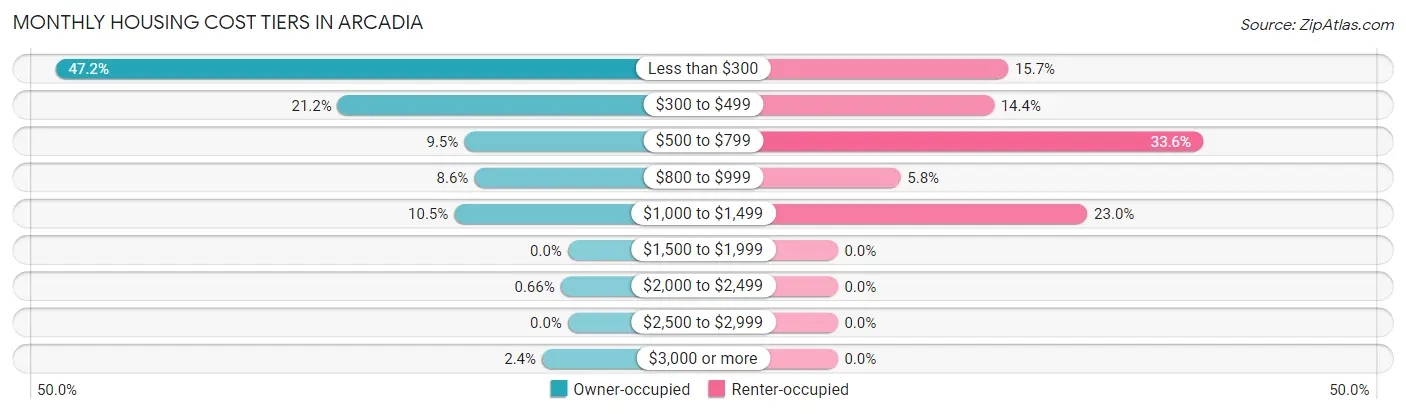
| Monthly Cost | Owner-occupied | Renter-occupied |
| Less than $300 | 356 (47.1%) | 84 (15.7%) |
| $300 to $499 | 160 (21.2%) | 77 (14.4%) |
| $500 to $799 | 72 (9.5%) | 180 (33.6%) |
| $800 to $999 | 65 (8.6%) | 31 (5.8%) |
| $1,000 to $1,499 | 79 (10.5%) | 123 (23.0%) |
| $1,500 to $1,999 | 0 (0.0%) | 0 (0.0%) |
| $2,000 to $2,499 | 5 (0.7%) | 0 (0.0%) |
| $2,500 to $2,999 | 0 (0.0%) | 0 (0.0%) |
| $3,000 or more | 18 (2.4%) | 0 (0.0%) |
| Total | 755 (100.0%) | 535 (100.0%) |
Physical Housing Characteristics in Arcadia
Housing Structures in Arcadia
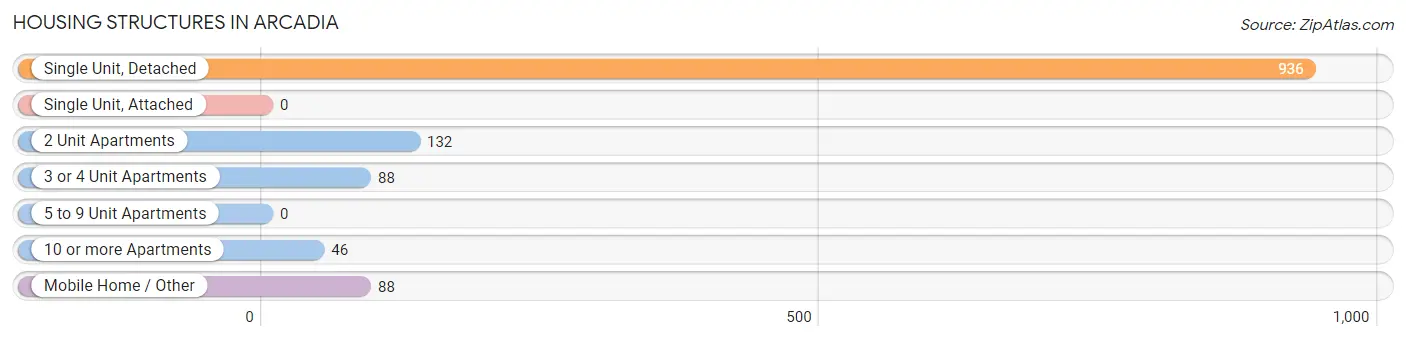
| Structure Type | # Housing Units | % Housing Units |
| Single Unit, Detached | 936 | 72.6% |
| Single Unit, Attached | 0 | 0.0% |
| 2 Unit Apartments | 132 | 10.2% |
| 3 or 4 Unit Apartments | 88 | 6.8% |
| 5 to 9 Unit Apartments | 0 | 0.0% |
| 10 or more Apartments | 46 | 3.6% |
| Mobile Home / Other | 88 | 6.8% |
| Total | 1,290 | 100.0% |
Housing Structures by Occupancy in Arcadia
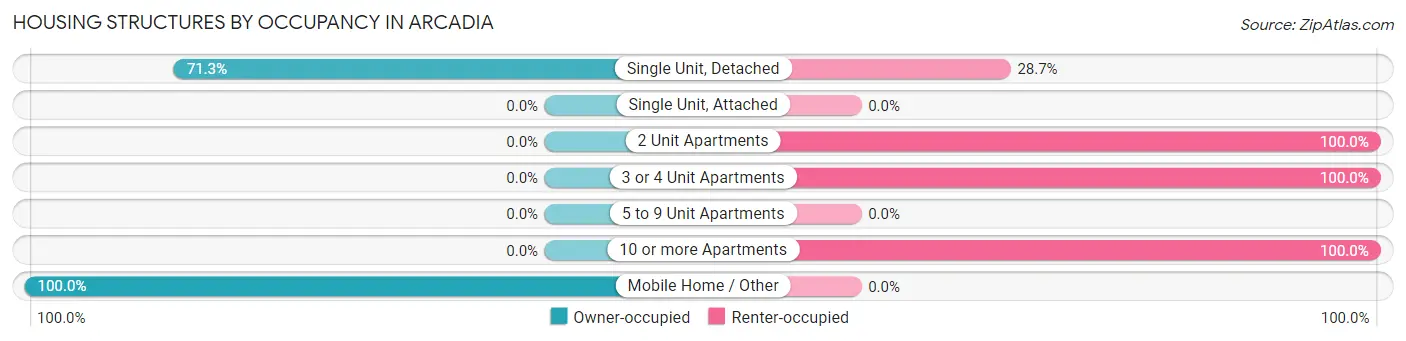
| Structure Type | Owner-occupied | Renter-occupied |
| Single Unit, Detached | 667 (71.3%) | 269 (28.7%) |
| Single Unit, Attached | 0 (0.0%) | 0 (0.0%) |
| 2 Unit Apartments | 0 (0.0%) | 132 (100.0%) |
| 3 or 4 Unit Apartments | 0 (0.0%) | 88 (100.0%) |
| 5 to 9 Unit Apartments | 0 (0.0%) | 0 (0.0%) |
| 10 or more Apartments | 0 (0.0%) | 46 (100.0%) |
| Mobile Home / Other | 88 (100.0%) | 0 (0.0%) |
| Total | 755 (58.5%) | 535 (41.5%) |
Housing Structures by Number of Rooms in Arcadia
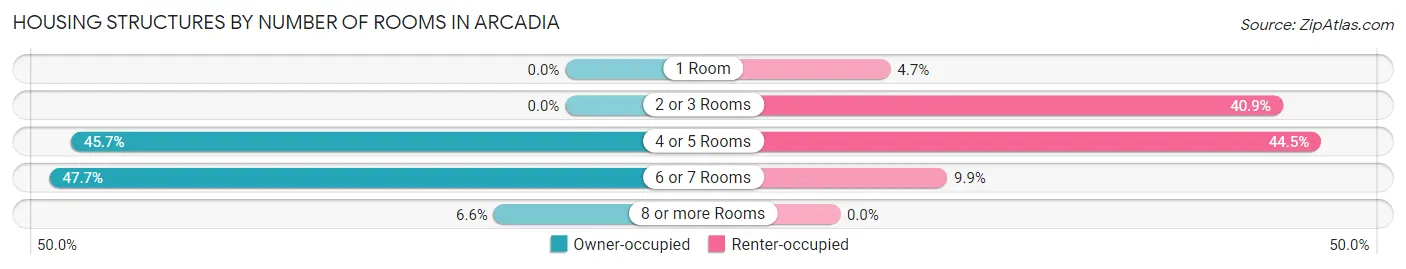
| Number of Rooms | Owner-occupied | Renter-occupied |
| 1 Room | 0 (0.0%) | 25 (4.7%) |
| 2 or 3 Rooms | 0 (0.0%) | 219 (40.9%) |
| 4 or 5 Rooms | 345 (45.7%) | 238 (44.5%) |
| 6 or 7 Rooms | 360 (47.7%) | 53 (9.9%) |
| 8 or more Rooms | 50 (6.6%) | 0 (0.0%) |
| Total | 755 (100.0%) | 535 (100.0%) |
Housing Structure by Heating Type in Arcadia
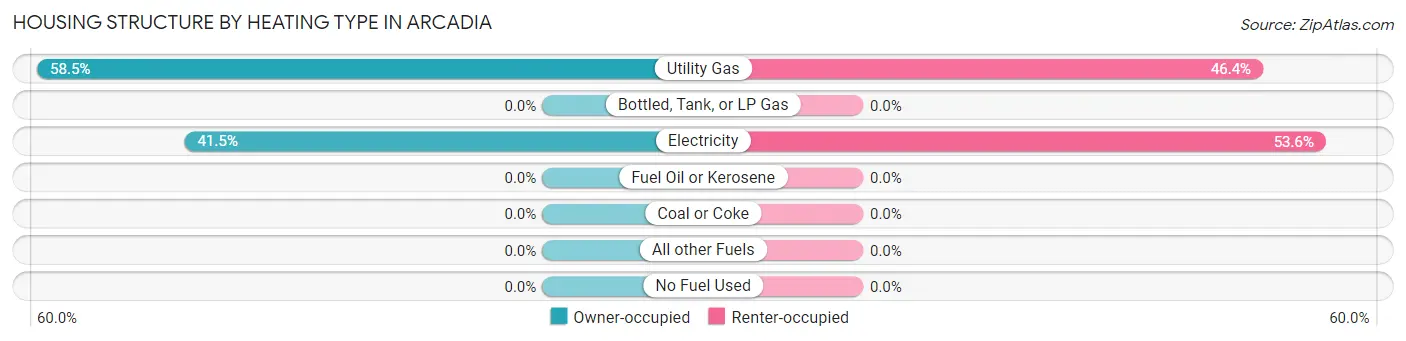
| Heating Type | Owner-occupied | Renter-occupied |
| Utility Gas | 442 (58.5%) | 248 (46.4%) |
| Bottled, Tank, or LP Gas | 0 (0.0%) | 0 (0.0%) |
| Electricity | 313 (41.5%) | 287 (53.6%) |
| Fuel Oil or Kerosene | 0 (0.0%) | 0 (0.0%) |
| Coal or Coke | 0 (0.0%) | 0 (0.0%) |
| All other Fuels | 0 (0.0%) | 0 (0.0%) |
| No Fuel Used | 0 (0.0%) | 0 (0.0%) |
| Total | 755 (100.0%) | 535 (100.0%) |
Household Vehicle Usage in Arcadia
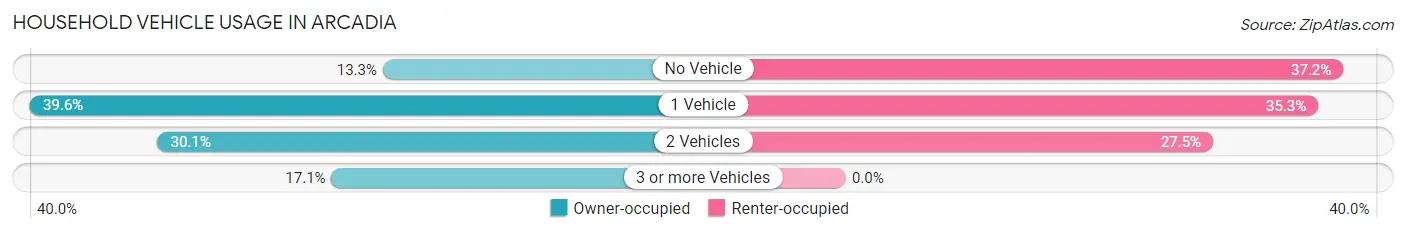
| Vehicles per Household | Owner-occupied | Renter-occupied |
| No Vehicle | 100 (13.3%) | 199 (37.2%) |
| 1 Vehicle | 299 (39.6%) | 189 (35.3%) |
| 2 Vehicles | 227 (30.1%) | 147 (27.5%) |
| 3 or more Vehicles | 129 (17.1%) | 0 (0.0%) |
| Total | 755 (100.0%) | 535 (100.0%) |
Real Estate & Mortgages in Arcadia
Real Estate and Mortgage Overview in Arcadia
| Characteristic | Without Mortgage | With Mortgage |
| Housing Units | 518 | 237 |
| Median Property Value | $58,900 | $97,000 |
| Median Household Income | $38,074 | $40 |
| Monthly Housing Costs | $211 | $18 |
| Real Estate Taxes | $199 | $47 |
Property Value by Mortgage Status in Arcadia
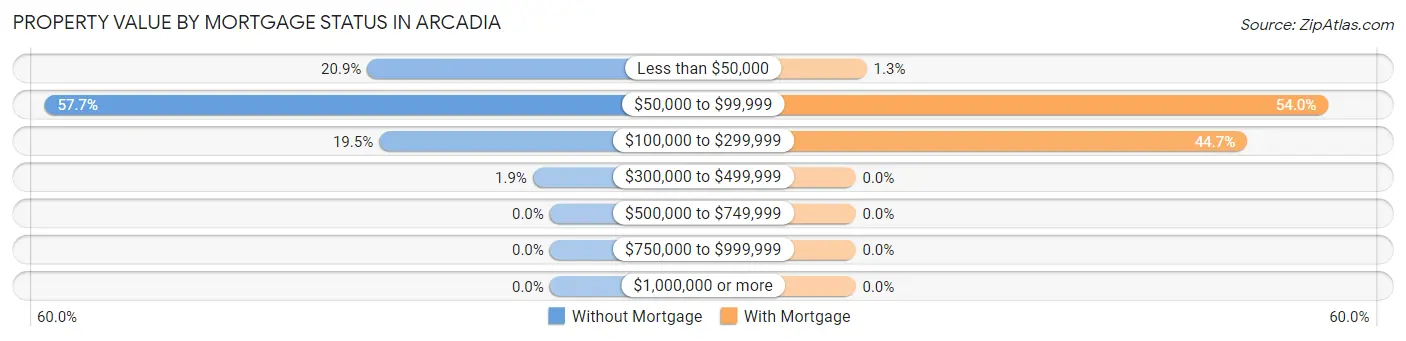
| Property Value | Without Mortgage | With Mortgage |
| Less than $50,000 | 108 (20.8%) | 3 (1.3%) |
| $50,000 to $99,999 | 299 (57.7%) | 128 (54.0%) |
| $100,000 to $299,999 | 101 (19.5%) | 106 (44.7%) |
| $300,000 to $499,999 | 10 (1.9%) | 0 (0.0%) |
| $500,000 to $749,999 | 0 (0.0%) | 0 (0.0%) |
| $750,000 to $999,999 | 0 (0.0%) | 0 (0.0%) |
| $1,000,000 or more | 0 (0.0%) | 0 (0.0%) |
| Total | 518 (100.0%) | 237 (100.0%) |
Household Income by Mortgage Status in Arcadia
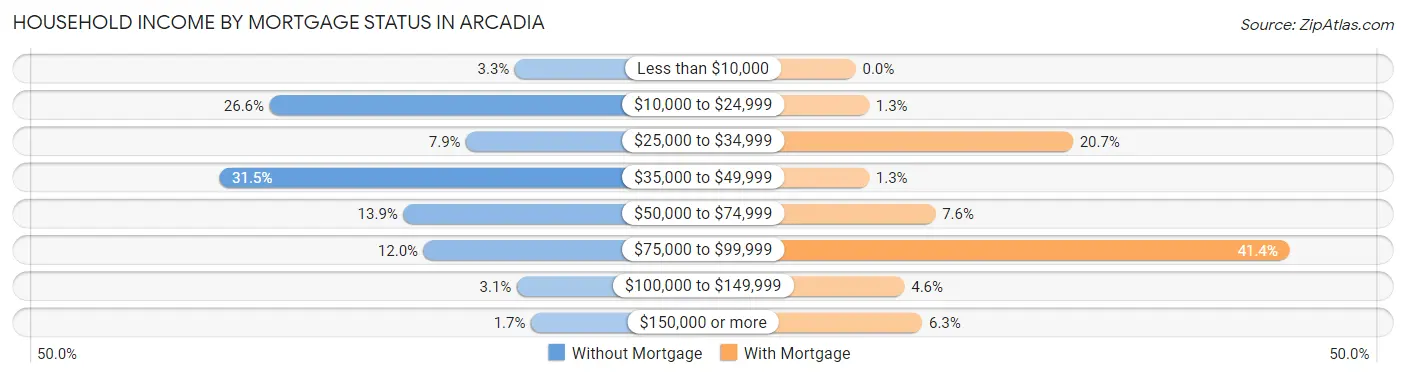
| Household Income | Without Mortgage | With Mortgage |
| Less than $10,000 | 17 (3.3%) | 0 (0.0%) |
| $10,000 to $24,999 | 138 (26.6%) | 3 (1.3%) |
| $25,000 to $34,999 | 41 (7.9%) | 49 (20.7%) |
| $35,000 to $49,999 | 163 (31.5%) | 3 (1.3%) |
| $50,000 to $74,999 | 72 (13.9%) | 18 (7.6%) |
| $75,000 to $99,999 | 62 (12.0%) | 98 (41.3%) |
| $100,000 to $149,999 | 16 (3.1%) | 11 (4.6%) |
| $150,000 or more | 9 (1.7%) | 15 (6.3%) |
| Total | 518 (100.0%) | 237 (100.0%) |
Property Value to Household Income Ratio in Arcadia
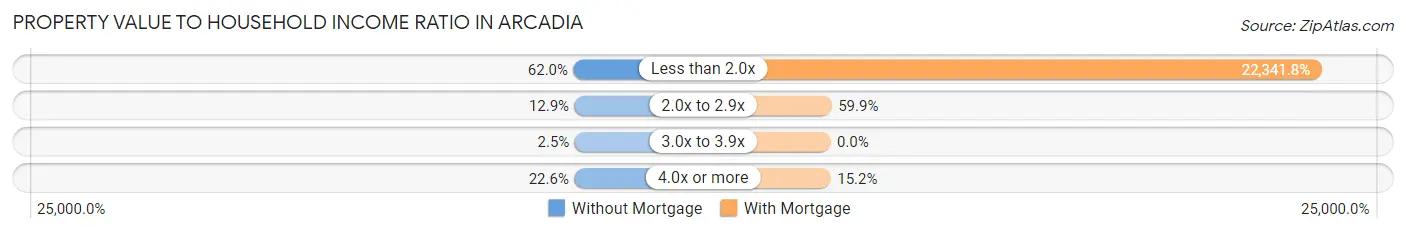
| Value-to-Income Ratio | Without Mortgage | With Mortgage |
| Less than 2.0x | 321 (62.0%) | 52,950 (22,341.8%) |
| 2.0x to 2.9x | 67 (12.9%) | 142 (59.9%) |
| 3.0x to 3.9x | 13 (2.5%) | 0 (0.0%) |
| 4.0x or more | 117 (22.6%) | 36 (15.2%) |
| Total | 518 (100.0%) | 237 (100.0%) |
Real Estate Taxes by Mortgage Status in Arcadia
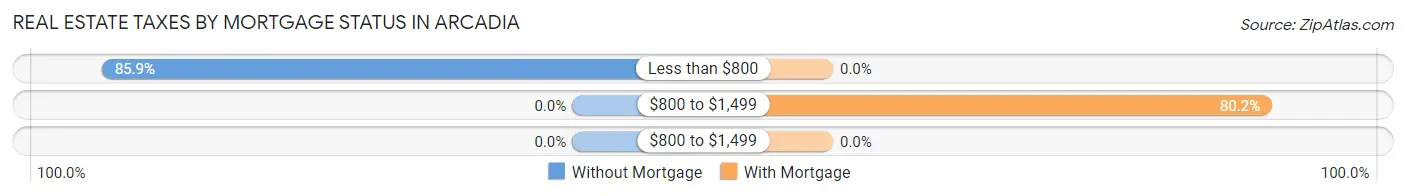
| Property Taxes | Without Mortgage | With Mortgage |
| Less than $800 | 445 (85.9%) | 0 (0.0%) |
| $800 to $1,499 | 0 (0.0%) | 190 (80.2%) |
| $800 to $1,499 | 0 (0.0%) | 0 (0.0%) |
| Total | 518 (100.0%) | 237 (100.0%) |
Health & Disability in Arcadia
Health Insurance Coverage by Age in Arcadia
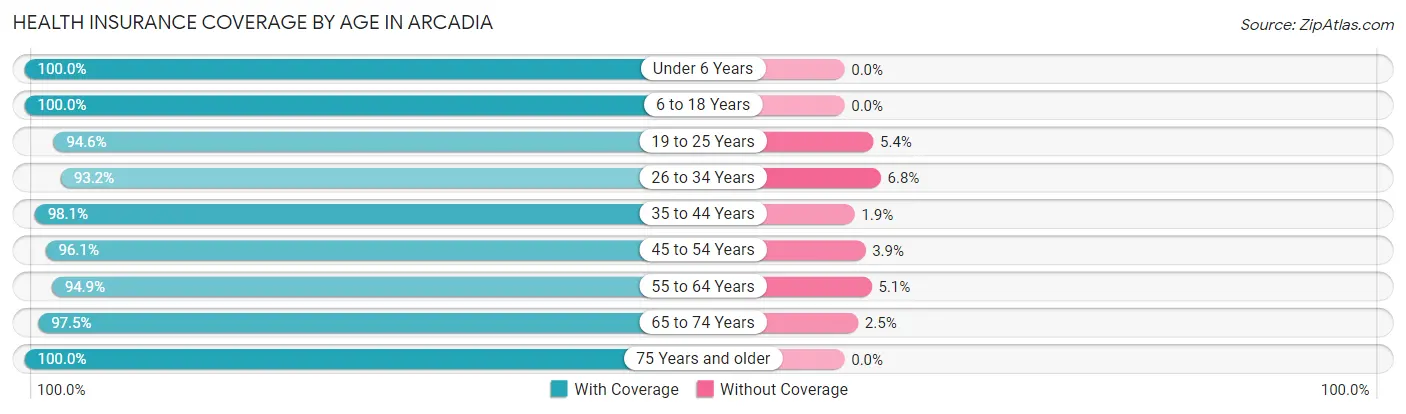
| Age Bracket | With Coverage | Without Coverage |
| Under 6 Years | 102 (100.0%) | 0 (0.0%) |
| 6 to 18 Years | 462 (100.0%) | 0 (0.0%) |
| 19 to 25 Years | 229 (94.6%) | 13 (5.4%) |
| 26 to 34 Years | 248 (93.2%) | 18 (6.8%) |
| 35 to 44 Years | 309 (98.1%) | 6 (1.9%) |
| 45 to 54 Years | 222 (96.1%) | 9 (3.9%) |
| 55 to 64 Years | 355 (94.9%) | 19 (5.1%) |
| 65 to 74 Years | 230 (97.5%) | 6 (2.5%) |
| 75 Years and older | 248 (100.0%) | 0 (0.0%) |
| Total | 2,405 (97.1%) | 71 (2.9%) |
Health Insurance Coverage by Citizenship Status in Arcadia

| Citizenship Status | With Coverage | Without Coverage |
| Native Born | 102 (100.0%) | 0 (0.0%) |
| Foreign Born, Citizen | 462 (100.0%) | 0 (0.0%) |
| Foreign Born, not a Citizen | 229 (94.6%) | 13 (5.4%) |
Health Insurance Coverage by Household Income in Arcadia
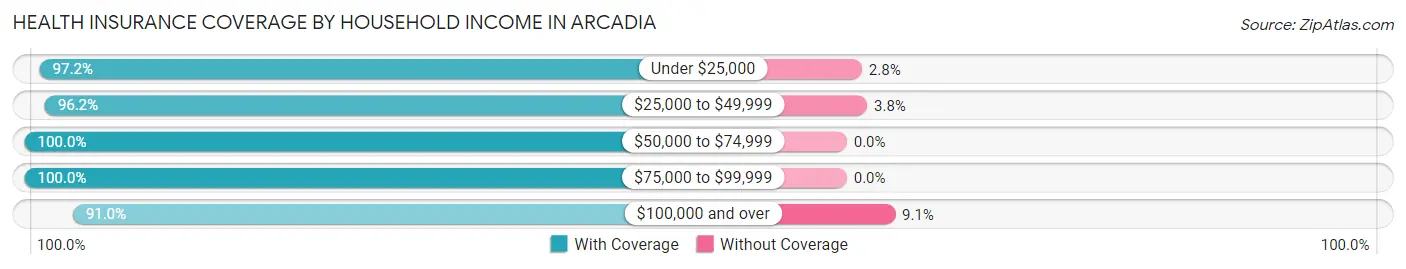
| Household Income | With Coverage | Without Coverage |
| Under $25,000 | 653 (97.2%) | 19 (2.8%) |
| $25,000 to $49,999 | 784 (96.2%) | 31 (3.8%) |
| $50,000 to $74,999 | 650 (100.0%) | 0 (0.0%) |
| $75,000 to $99,999 | 107 (100.0%) | 0 (0.0%) |
| $100,000 and over | 211 (90.9%) | 21 (9.0%) |
Public vs Private Health Insurance Coverage by Age in Arcadia
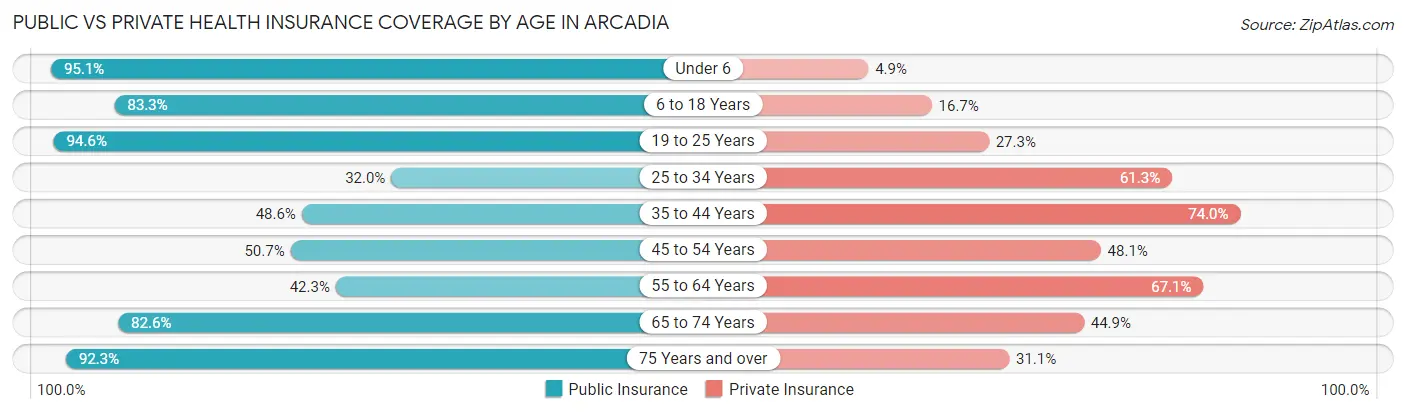
| Age Bracket | Public Insurance | Private Insurance |
| Under 6 | 97 (95.1%) | 5 (4.9%) |
| 6 to 18 Years | 385 (83.3%) | 77 (16.7%) |
| 19 to 25 Years | 229 (94.6%) | 66 (27.3%) |
| 25 to 34 Years | 85 (32.0%) | 163 (61.3%) |
| 35 to 44 Years | 153 (48.6%) | 233 (74.0%) |
| 45 to 54 Years | 117 (50.6%) | 111 (48.0%) |
| 55 to 64 Years | 158 (42.2%) | 251 (67.1%) |
| 65 to 74 Years | 195 (82.6%) | 106 (44.9%) |
| 75 Years and over | 229 (92.3%) | 77 (31.0%) |
| Total | 1,648 (66.6%) | 1,089 (44.0%) |
Disability Status by Sex by Age in Arcadia
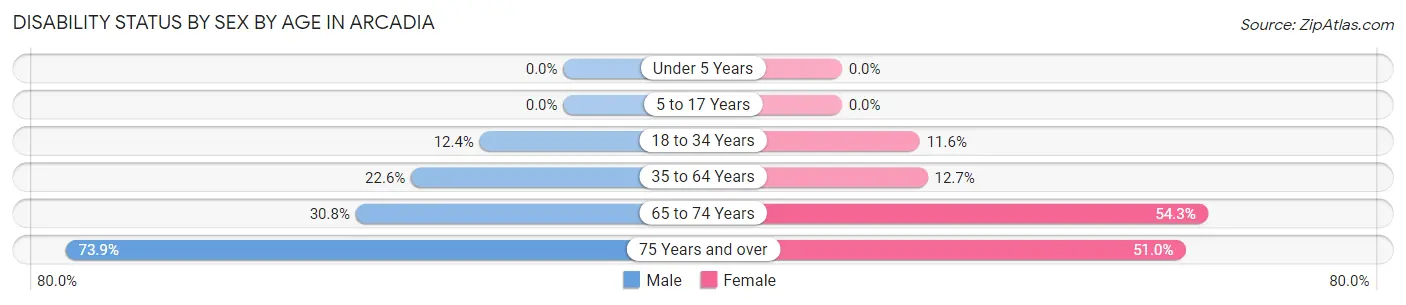
| Age Bracket | Male | Female |
| Under 5 Years | 0 (0.0%) | 0 (0.0%) |
| 5 to 17 Years | 0 (0.0%) | 0 (0.0%) |
| 18 to 34 Years | 37 (12.4%) | 25 (11.6%) |
| 35 to 64 Years | 73 (22.6%) | 76 (12.7%) |
| 65 to 74 Years | 37 (30.8%) | 63 (54.3%) |
| 75 Years and over | 34 (73.9%) | 103 (51.0%) |
Disability Class by Sex by Age in Arcadia
Disability Class: Hearing Difficulty
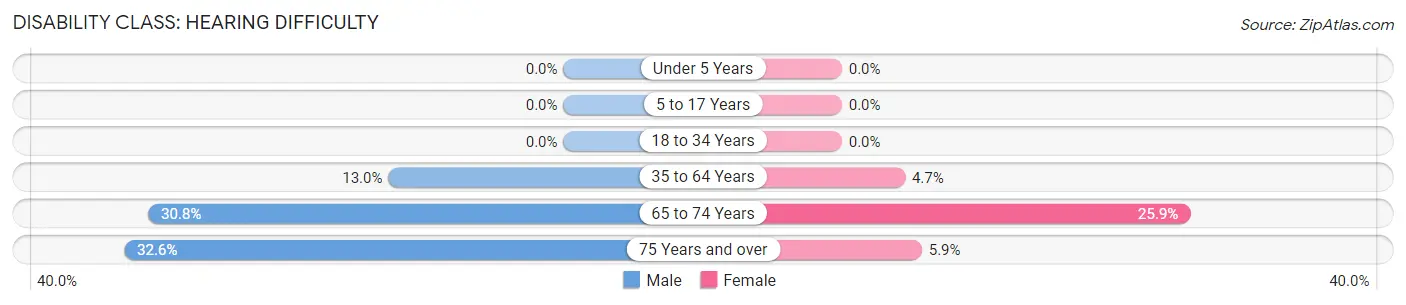
| Age Bracket | Male | Female |
| Under 5 Years | 0 (0.0%) | 0 (0.0%) |
| 5 to 17 Years | 0 (0.0%) | 0 (0.0%) |
| 18 to 34 Years | 0 (0.0%) | 0 (0.0%) |
| 35 to 64 Years | 42 (13.0%) | 28 (4.7%) |
| 65 to 74 Years | 37 (30.8%) | 30 (25.9%) |
| 75 Years and over | 15 (32.6%) | 12 (5.9%) |
Disability Class: Vision Difficulty
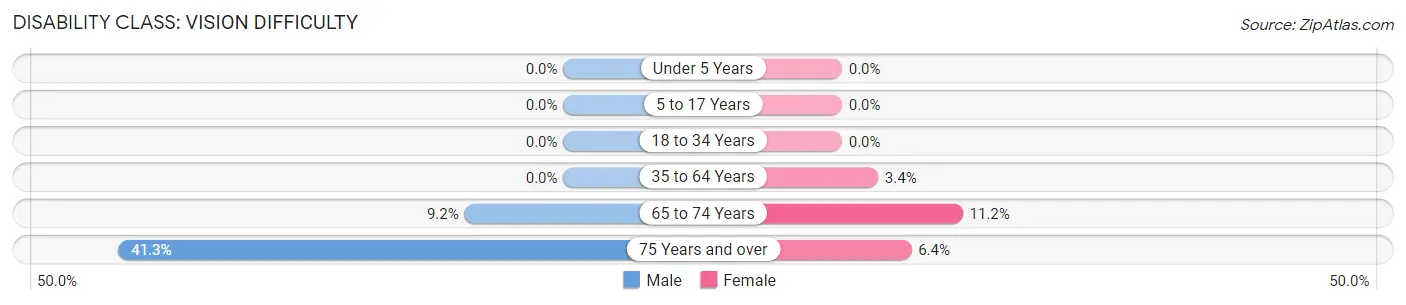
| Age Bracket | Male | Female |
| Under 5 Years | 0 (0.0%) | 0 (0.0%) |
| 5 to 17 Years | 0 (0.0%) | 0 (0.0%) |
| 18 to 34 Years | 0 (0.0%) | 0 (0.0%) |
| 35 to 64 Years | 0 (0.0%) | 20 (3.4%) |
| 65 to 74 Years | 11 (9.2%) | 13 (11.2%) |
| 75 Years and over | 19 (41.3%) | 13 (6.4%) |
Disability Class: Cognitive Difficulty
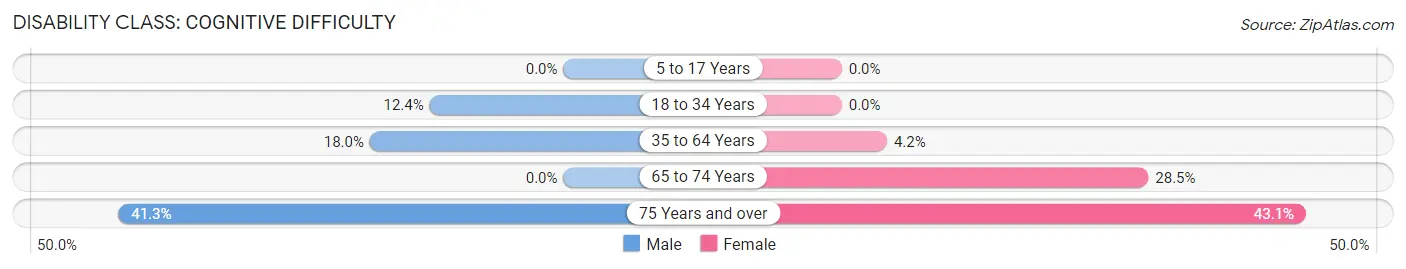
| Age Bracket | Male | Female |
| 5 to 17 Years | 0 (0.0%) | 0 (0.0%) |
| 18 to 34 Years | 37 (12.4%) | 0 (0.0%) |
| 35 to 64 Years | 58 (18.0%) | 25 (4.2%) |
| 65 to 74 Years | 0 (0.0%) | 33 (28.4%) |
| 75 Years and over | 19 (41.3%) | 87 (43.1%) |
Disability Class: Ambulatory Difficulty
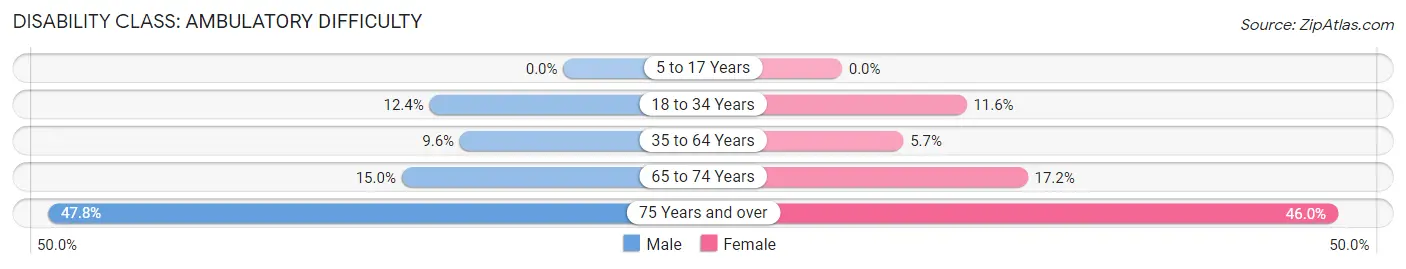
| Age Bracket | Male | Female |
| 5 to 17 Years | 0 (0.0%) | 0 (0.0%) |
| 18 to 34 Years | 37 (12.4%) | 25 (11.6%) |
| 35 to 64 Years | 31 (9.6%) | 34 (5.7%) |
| 65 to 74 Years | 18 (15.0%) | 20 (17.2%) |
| 75 Years and over | 22 (47.8%) | 93 (46.0%) |
Disability Class: Self-Care Difficulty
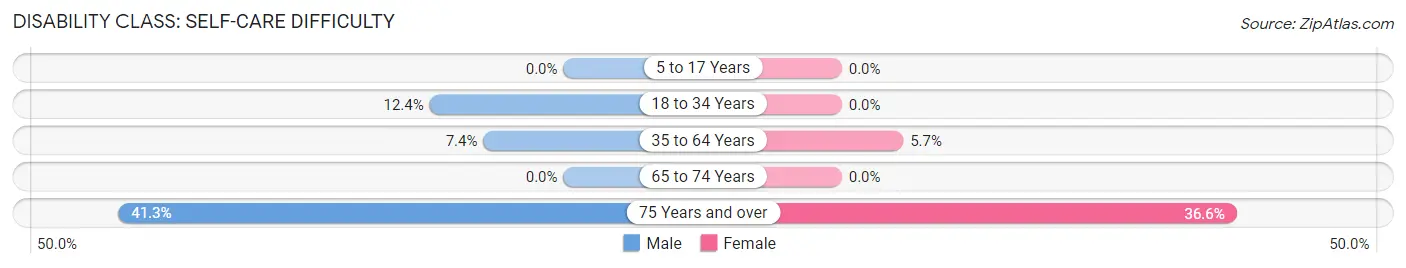
| Age Bracket | Male | Female |
| 5 to 17 Years | 0 (0.0%) | 0 (0.0%) |
| 18 to 34 Years | 37 (12.4%) | 0 (0.0%) |
| 35 to 64 Years | 24 (7.4%) | 34 (5.7%) |
| 65 to 74 Years | 0 (0.0%) | 0 (0.0%) |
| 75 Years and over | 19 (41.3%) | 74 (36.6%) |
Technology Access in Arcadia
Computing Device Access in Arcadia
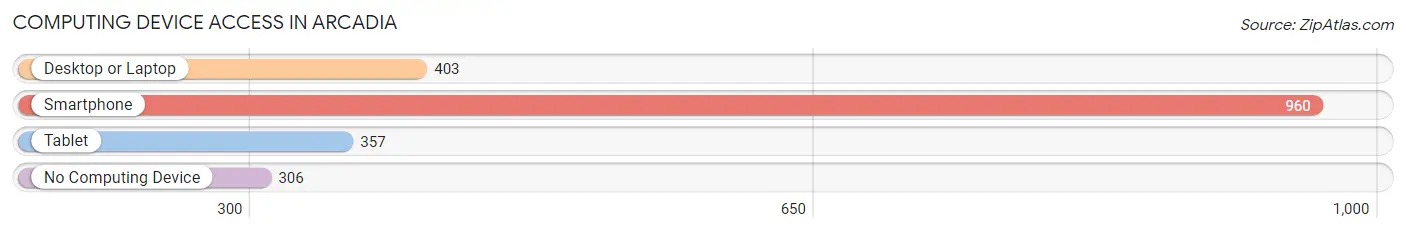
| Device Type | # Households | % Households |
| Desktop or Laptop | 403 | 31.2% |
| Smartphone | 960 | 74.4% |
| Tablet | 357 | 27.7% |
| No Computing Device | 306 | 23.7% |
| Total | 1,290 | 100.0% |
Internet Access in Arcadia
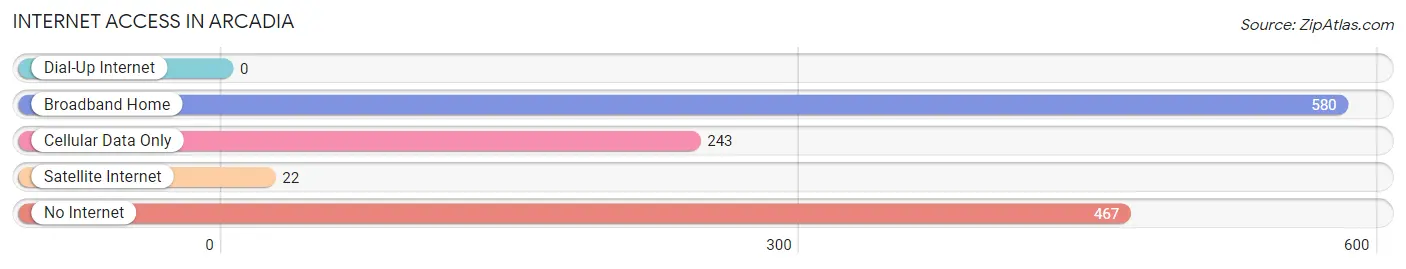
| Internet Type | # Households | % Households |
| Dial-Up Internet | 0 | 0.0% |
| Broadband Home | 580 | 45.0% |
| Cellular Data Only | 243 | 18.8% |
| Satellite Internet | 22 | 1.7% |
| No Internet | 467 | 36.2% |
| Total | 1,290 | 100.0% |
Arcadia Summary
Arcadia is a small town located in Bienville Parish, Louisiana. It is situated in the northwest corner of the state, approximately 80 miles east of Shreveport. The town has a population of approximately 2,500 people and is the parish seat of Bienville Parish.
History
Arcadia was founded in 1839 by a group of settlers from the nearby town of Monroe. The town was named after the Greek city of Arcadia, which was known for its beauty and tranquility. The settlers were attracted to the area due to its abundance of natural resources, including timber, cotton, and other agricultural products.
The town quickly grew and by the late 19th century, it had become a major center for the timber industry. The town was also home to several sawmills, cotton gins, and other businesses.
In the early 20th century, Arcadia experienced a period of economic decline due to the Great Depression and the decline of the timber industry. However, the town was able to recover and by the 1950s, it had become a major center for the oil and gas industry.
Geography
Arcadia is located in the northwest corner of Louisiana, approximately 80 miles east of Shreveport. The town is situated in the Red River Valley, which is a flat, alluvial plain. The town is surrounded by rolling hills and is located near the Sabine River.
The climate in Arcadia is humid subtropical, with hot, humid summers and mild winters. The average annual temperature is around 70 degrees Fahrenheit.
Economy
Arcadia’s economy is largely based on the oil and gas industry. The town is home to several oil and gas companies, as well as several related businesses. The town is also home to several manufacturing companies, including a paper mill and a furniture factory.
The town is also home to several retail stores, restaurants, and other businesses. The town is also home to several churches and schools.
Demographics
As of the 2010 census, the population of Arcadia was 2,500 people. The racial makeup of the town was 79.2% White, 17.2% African American, 0.8% Native American, 0.4% Asian, and 2.4% from other races.
The median household income in Arcadia was $31,250, and the median family income was $37,500. The per capita income was $17,500. Approximately 17.2% of the population was below the poverty line.
Arcadia is a small town with a rich history and a diverse economy. The town is home to several businesses, churches, and schools, and is a great place to live and work.
Common Questions
What is Per Capita Income in Arcadia?
Per Capita income in Arcadia is $21,789.
What is the Median Family Income in Arcadia?
Median Family Income in Arcadia is $48,125.
What is the Median Household income in Arcadia?
Median Household Income in Arcadia is $37,610.
What is Income or Wage Gap in Arcadia?
Income or Wage Gap in Arcadia is 23.2%.
Women in Arcadia earn 76.8 cents for every dollar earned by a man.
What is Inequality or Gini Index in Arcadia?
Inequality or Gini Index in Arcadia is 0.42.
What is the Total Population of Arcadia?
Total Population of Arcadia is 2,725.
What is the Total Male Population of Arcadia?
Total Male Population of Arcadia is 1,141.
What is the Total Female Population of Arcadia?
Total Female Population of Arcadia is 1,584.
What is the Ratio of Males per 100 Females in Arcadia?
There are 72.03 Males per 100 Females in Arcadia.
What is the Ratio of Females per 100 Males in Arcadia?
There are 138.83 Females per 100 Males in Arcadia.
What is the Median Population Age in Arcadia?
Median Population Age in Arcadia is 42.1 Years.
What is the Average Family Size in Arcadia
Average Family Size in Arcadia is 2.8 People.
What is the Average Household Size in Arcadia
Average Household Size in Arcadia is 1.9 People.
How Large is the Labor Force in Arcadia?
There are 987 People in the Labor Forcein in Arcadia.
What is the Percentage of People in the Labor Force in Arcadia?
43.6% of People are in the Labor Force in Arcadia.
What is the Unemployment Rate in Arcadia?
Unemployment Rate in Arcadia is 2.7%.