Albany, LA Map & Demographics
Albany Map
Albany Overview
$28,711
PER CAPITA INCOME
$79,850
AVG FAMILY INCOME
$74,375
AVG HOUSEHOLD INCOME
9.8%
WAGE / INCOME GAP [ % ]
90.2¢/ $1
WAGE / INCOME GAP [ $ ]
0.39
INEQUALITY / GINI INDEX
1,140
TOTAL POPULATION
485
MALE POPULATION
655
FEMALE POPULATION
74.05
MALES / 100 FEMALES
135.05
FEMALES / 100 MALES
29.3
MEDIAN AGE
3.6
AVG FAMILY SIZE
2.9
AVG HOUSEHOLD SIZE
474
LABOR FORCE [ PEOPLE ]
56.0%
PERCENT IN LABOR FORCE
1.1%
UNEMPLOYMENT RATE
Albany Zip Codes
Albany Area Codes
Income in Albany
Income Overview in Albany
Per Capita Income in Albany is $28,711, while median incomes of families and households are $79,850 and $74,375 respectively.
| Characteristic | Number | Measure |
| Per Capita Income | 1,140 | $28,711 |
| Median Family Income | 280 | $79,850 |
| Mean Family Income | 280 | $97,834 |
| Median Household Income | 389 | $74,375 |
| Mean Household Income | 389 | $79,627 |
| Income Deficit | 280 | $0 |
| Wage / Income Gap (%) | 1,140 | 9.84% |
| Wage / Income Gap ($) | 1,140 | 90.16¢ per $1 |
| Gini / Inequality Index | 1,140 | 0.39 |
Earnings by Sex in Albany
Average Earnings in Albany are $46,000, $43,125 for men and $47,832 for women, a difference of 9.8%.
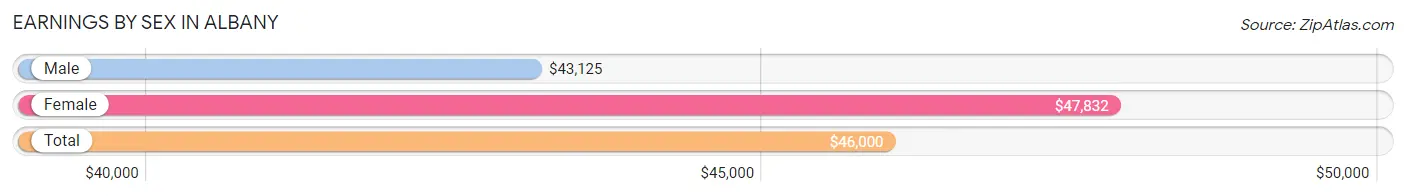
| Sex | Number | Average Earnings |
| Male | 283 (55.9%) | $43,125 |
| Female | 223 (44.1%) | $47,832 |
| Total | 506 (100.0%) | $46,000 |
Earnings by Sex by Income Bracket in Albany
The most common earnings brackets in Albany are $25,000 to $29,999 for men (74 | 26.2%) and $45,000 to $49,999 for women (54 | 24.2%).
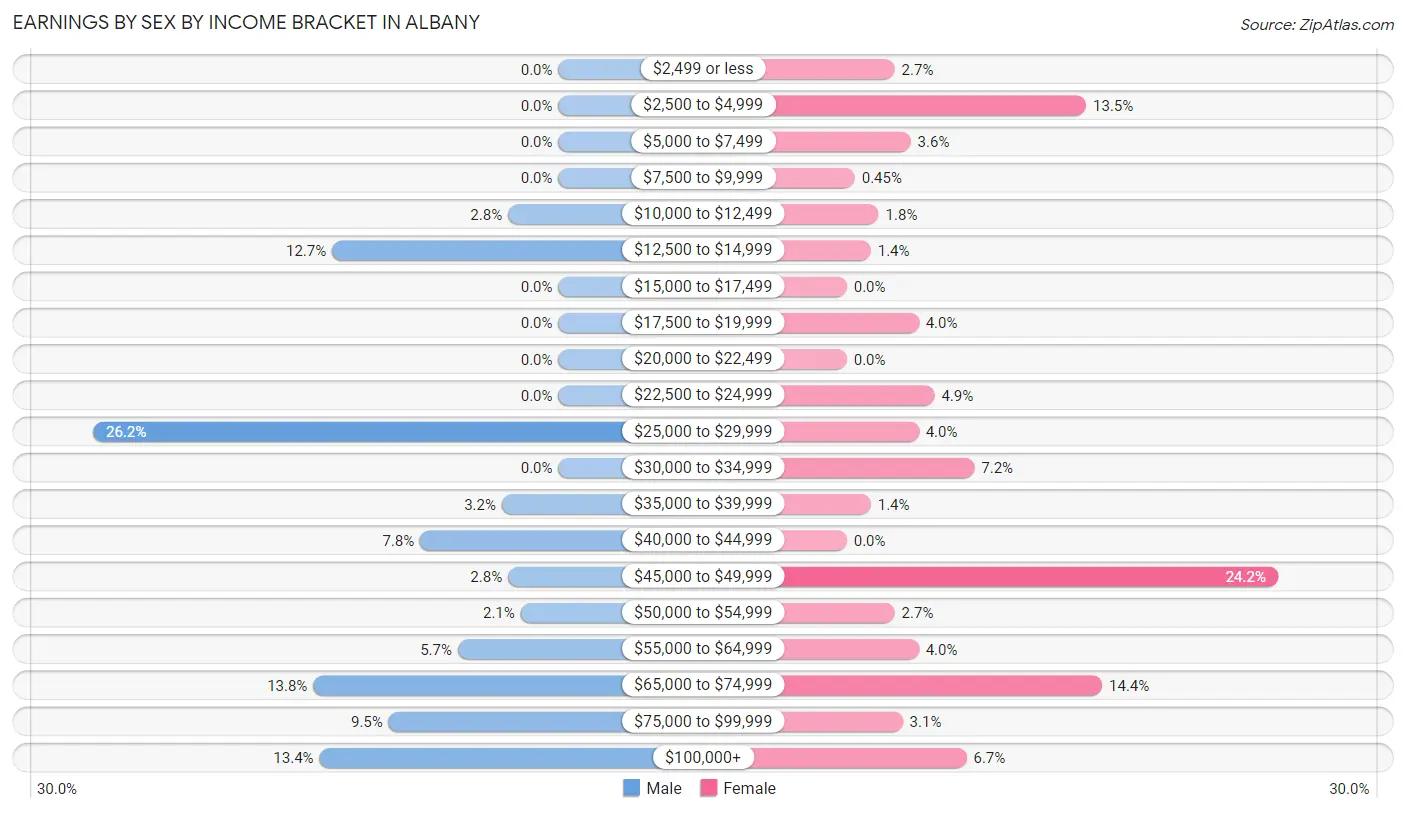
| Income | Male | Female |
| $2,499 or less | 0 (0.0%) | 6 (2.7%) |
| $2,500 to $4,999 | 0 (0.0%) | 30 (13.5%) |
| $5,000 to $7,499 | 0 (0.0%) | 8 (3.6%) |
| $7,500 to $9,999 | 0 (0.0%) | 1 (0.4%) |
| $10,000 to $12,499 | 8 (2.8%) | 4 (1.8%) |
| $12,500 to $14,999 | 36 (12.7%) | 3 (1.3%) |
| $15,000 to $17,499 | 0 (0.0%) | 0 (0.0%) |
| $17,500 to $19,999 | 0 (0.0%) | 9 (4.0%) |
| $20,000 to $22,499 | 0 (0.0%) | 0 (0.0%) |
| $22,500 to $24,999 | 0 (0.0%) | 11 (4.9%) |
| $25,000 to $29,999 | 74 (26.2%) | 9 (4.0%) |
| $30,000 to $34,999 | 0 (0.0%) | 16 (7.2%) |
| $35,000 to $39,999 | 9 (3.2%) | 3 (1.3%) |
| $40,000 to $44,999 | 22 (7.8%) | 0 (0.0%) |
| $45,000 to $49,999 | 8 (2.8%) | 54 (24.2%) |
| $50,000 to $54,999 | 6 (2.1%) | 6 (2.7%) |
| $55,000 to $64,999 | 16 (5.7%) | 9 (4.0%) |
| $65,000 to $74,999 | 39 (13.8%) | 32 (14.3%) |
| $75,000 to $99,999 | 27 (9.5%) | 7 (3.1%) |
| $100,000+ | 38 (13.4%) | 15 (6.7%) |
| Total | 283 (100.0%) | 223 (100.0%) |
Earnings by Sex by Educational Attainment in Albany
Average earnings in Albany are $54,375 for men and $50,000 for women, a difference of 8.1%. Men with an educational attainment of college or associate's degree enjoy the highest average annual earnings of $73,682, while those with bachelor's degree education earn the least with $29,133. Women with an educational attainment of graduate degree earn the most with the average annual earnings of $70,288, while those with college or associate's degree education have the smallest earnings of $24,545.
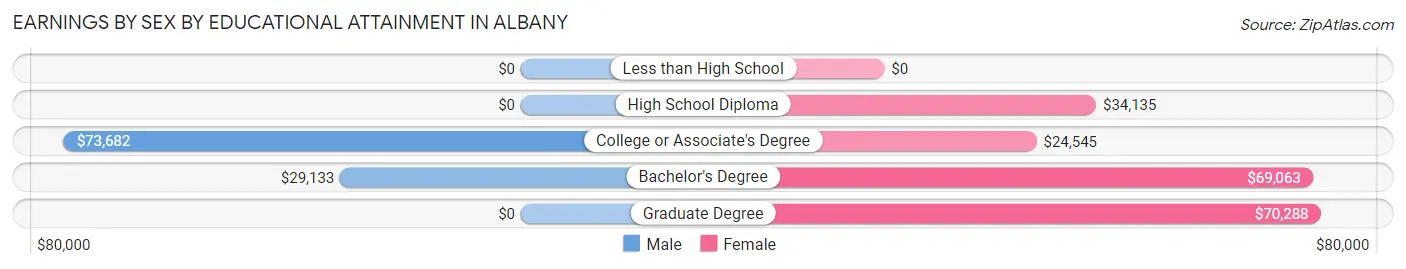
| Educational Attainment | Male Income | Female Income |
| Less than High School | - | - |
| High School Diploma | - | - |
| College or Associate's Degree | $73,682 | $24,545 |
| Bachelor's Degree | $29,133 | $69,063 |
| Graduate Degree | - | - |
| Total | $54,375 | $50,000 |
Family Income in Albany
Family Income Brackets in Albany
According to the Albany family income data, there are 91 families falling into the $75,000 to $99,999 income range, which is the most common income bracket and makes up 32.5% of all families.
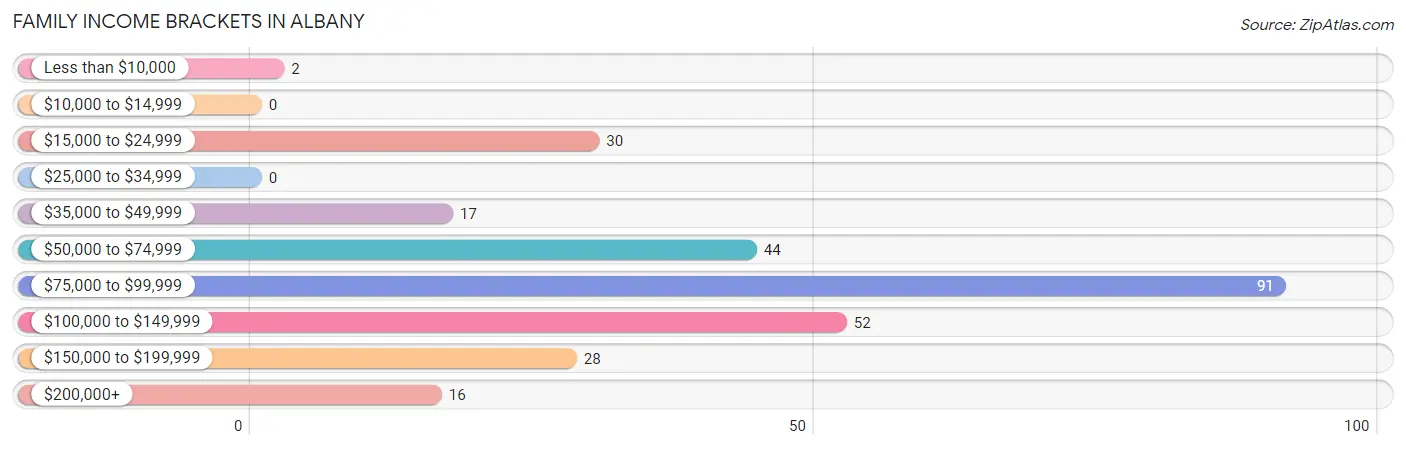
| Income Bracket | # Families | % Families |
| Less than $10,000 | 2 | 0.7% |
| $10,000 to $14,999 | 0 | 0.0% |
| $15,000 to $24,999 | 30 | 10.7% |
| $25,000 to $34,999 | 0 | 0.0% |
| $35,000 to $49,999 | 17 | 6.1% |
| $50,000 to $74,999 | 44 | 15.7% |
| $75,000 to $99,999 | 91 | 32.5% |
| $100,000 to $149,999 | 52 | 18.6% |
| $150,000 to $199,999 | 28 | 10.0% |
| $200,000+ | 16 | 5.7% |
Family Income by Famaliy Size in Albany
3-person families (53 | 18.9%) account for the highest median family income in Albany with $116,875 per family, while 2-person families (143 | 51.1%) have the highest median income of $39,412 per family member.
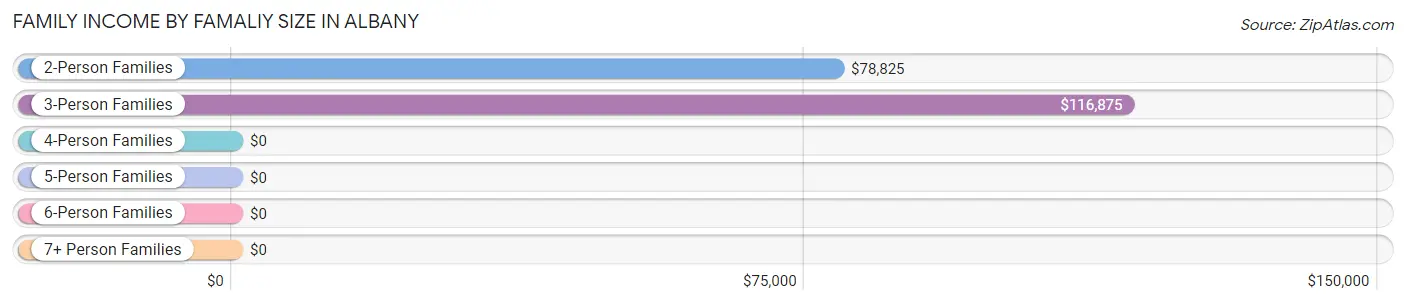
| Income Bracket | # Families | Median Income |
| 2-Person Families | 143 (51.1%) | $78,825 |
| 3-Person Families | 53 (18.9%) | $116,875 |
| 4-Person Families | 27 (9.6%) | $0 |
| 5-Person Families | 36 (12.9%) | $0 |
| 6-Person Families | 7 (2.5%) | $0 |
| 7+ Person Families | 14 (5.0%) | $0 |
| Total | 280 (100.0%) | $79,850 |
Family Income by Number of Earners in Albany
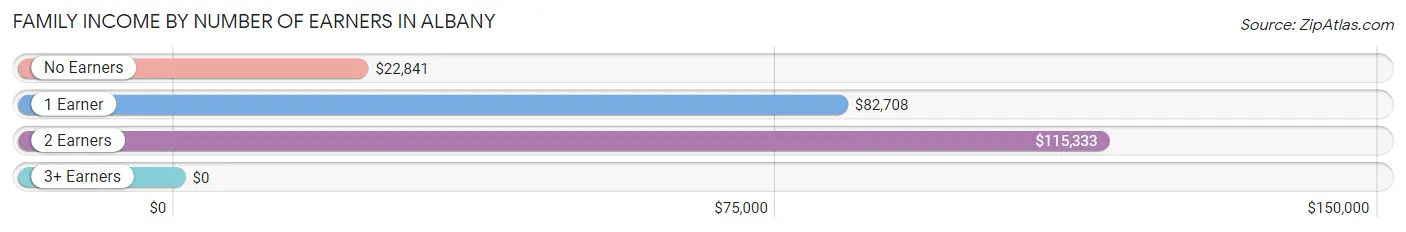
| Number of Earners | # Families | Median Income |
| No Earners | 45 (16.1%) | $22,841 |
| 1 Earner | 72 (25.7%) | $82,708 |
| 2 Earners | 152 (54.3%) | $115,333 |
| 3+ Earners | 11 (3.9%) | $0 |
| Total | 280 (100.0%) | $79,850 |
Household Income in Albany
Household Income Brackets in Albany
With 95 households falling in the category, the $75,000 to $99,999 income range is the most frequent in Albany, accounting for 24.4% of all households. In contrast, only 8 households (2.1%) fall into the less than $10,000 income bracket, making it the least populous group.
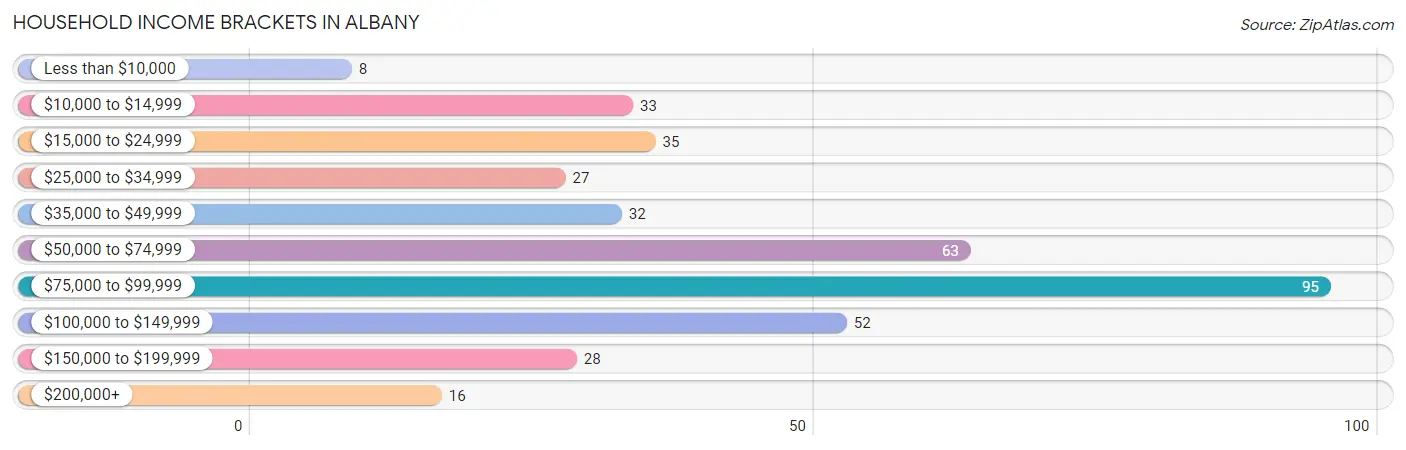
| Income Bracket | # Households | % Households |
| Less than $10,000 | 8 | 2.1% |
| $10,000 to $14,999 | 33 | 8.5% |
| $15,000 to $24,999 | 35 | 9.0% |
| $25,000 to $34,999 | 27 | 6.9% |
| $35,000 to $49,999 | 32 | 8.2% |
| $50,000 to $74,999 | 63 | 16.2% |
| $75,000 to $99,999 | 95 | 24.4% |
| $100,000 to $149,999 | 52 | 13.4% |
| $150,000 to $199,999 | 28 | 7.2% |
| $200,000+ | 16 | 4.1% |
Household Income by Householder Age in Albany
The median household income in Albany is $74,375, with the highest median household income of $84,201 found in the 25 to 44 years age bracket for the primary householder. A total of 115 households (29.6%) fall into this category. Meanwhile, the 65+ years age bracket for the primary householder has the lowest median household income of $35,000, with 86 households (22.1%) in this group.
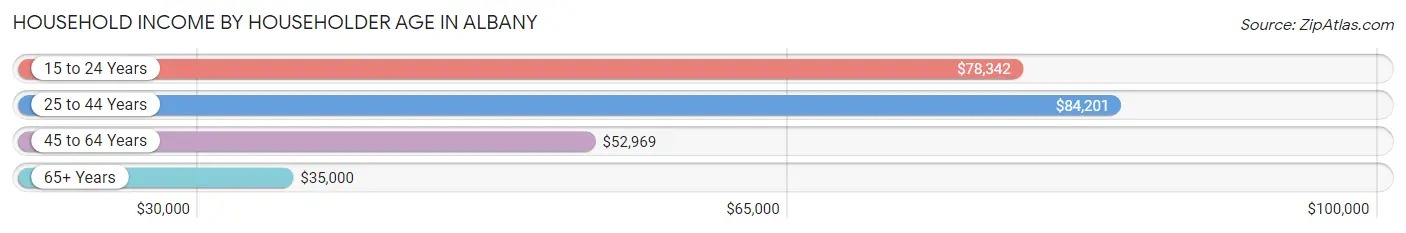
| Income Bracket | # Households | Median Income |
| 15 to 24 Years | 65 (16.7%) | $78,342 |
| 25 to 44 Years | 115 (29.6%) | $84,201 |
| 45 to 64 Years | 123 (31.6%) | $52,969 |
| 65+ Years | 86 (22.1%) | $35,000 |
| Total | 389 (100.0%) | $74,375 |
Poverty in Albany
Income Below Poverty by Sex and Age in Albany
With 3.1% poverty level for males and 5.9% for females among the residents of Albany, 45 to 54 year old males and 55 to 64 year old females are the most vulnerable to poverty, with 5 males (35.7%) and 29 females (42.6%) in their respective age groups living below the poverty level.
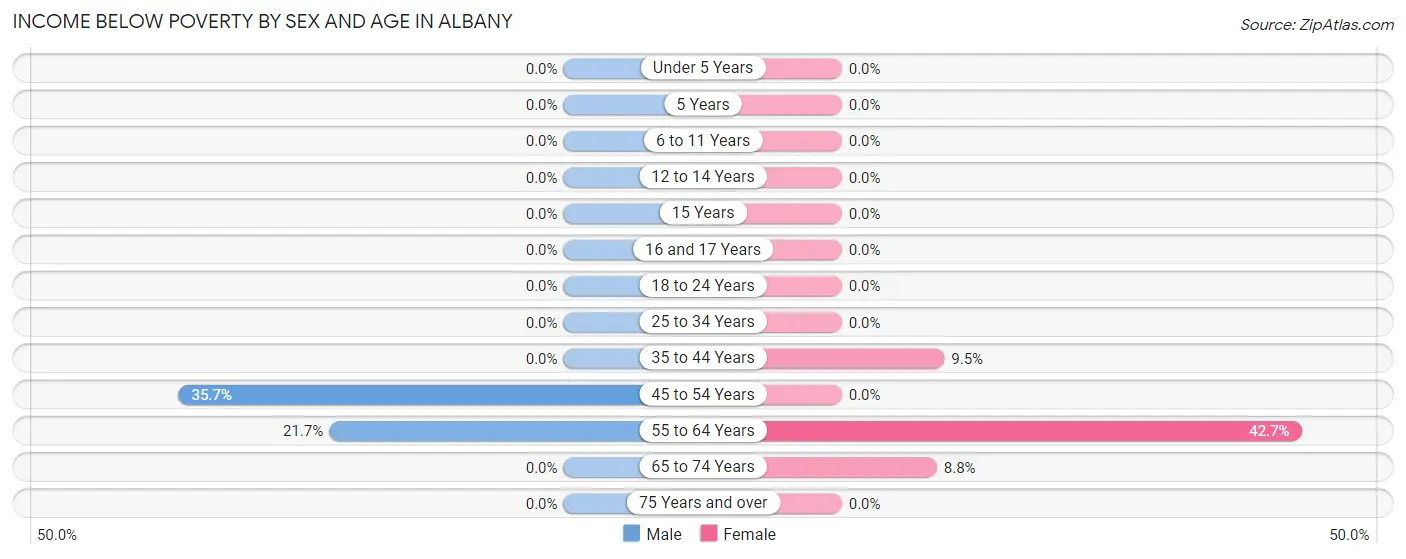
| Age Bracket | Male | Female |
| Under 5 Years | 0 (0.0%) | 0 (0.0%) |
| 5 Years | 0 (0.0%) | 0 (0.0%) |
| 6 to 11 Years | 0 (0.0%) | 0 (0.0%) |
| 12 to 14 Years | 0 (0.0%) | 0 (0.0%) |
| 15 Years | 0 (0.0%) | 0 (0.0%) |
| 16 and 17 Years | 0 (0.0%) | 0 (0.0%) |
| 18 to 24 Years | 0 (0.0%) | 0 (0.0%) |
| 25 to 34 Years | 0 (0.0%) | 0 (0.0%) |
| 35 to 44 Years | 0 (0.0%) | 4 (9.5%) |
| 45 to 54 Years | 5 (35.7%) | 0 (0.0%) |
| 55 to 64 Years | 10 (21.7%) | 29 (42.6%) |
| 65 to 74 Years | 0 (0.0%) | 6 (8.8%) |
| 75 Years and over | 0 (0.0%) | 0 (0.0%) |
| Total | 15 (3.1%) | 39 (5.9%) |
Income Above Poverty by Sex and Age in Albany
According to the poverty statistics in Albany, males aged under 5 years and females aged under 5 years are the age groups that are most secure financially, with 100.0% of males and 100.0% of females in these age groups living above the poverty line.
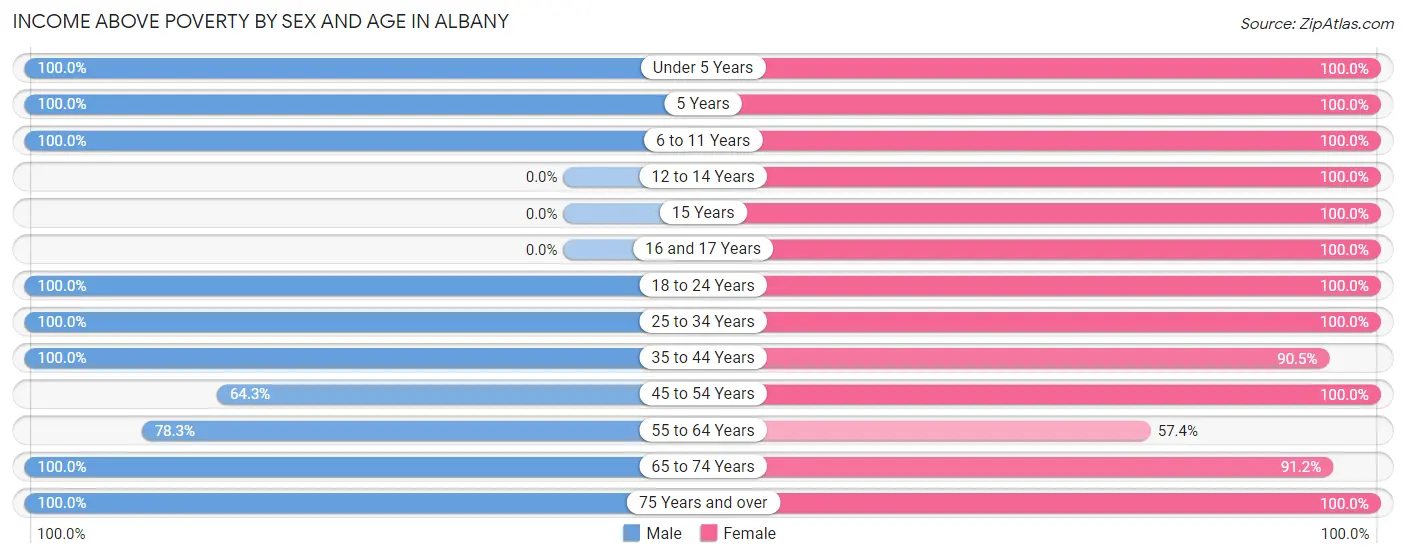
| Age Bracket | Male | Female |
| Under 5 Years | 22 (100.0%) | 62 (100.0%) |
| 5 Years | 39 (100.0%) | 5 (100.0%) |
| 6 to 11 Years | 94 (100.0%) | 51 (100.0%) |
| 12 to 14 Years | 0 (0.0%) | 14 (100.0%) |
| 15 Years | 0 (0.0%) | 7 (100.0%) |
| 16 and 17 Years | 0 (0.0%) | 18 (100.0%) |
| 18 to 24 Years | 40 (100.0%) | 96 (100.0%) |
| 25 to 34 Years | 115 (100.0%) | 141 (100.0%) |
| 35 to 44 Years | 70 (100.0%) | 38 (90.5%) |
| 45 to 54 Years | 9 (64.3%) | 71 (100.0%) |
| 55 to 64 Years | 36 (78.3%) | 39 (57.4%) |
| 65 to 74 Years | 21 (100.0%) | 62 (91.2%) |
| 75 Years and over | 24 (100.0%) | 12 (100.0%) |
| Total | 470 (96.9%) | 616 (94.1%) |
Income Below Poverty Among Married-Couple Families in Albany
The poverty statistics for married-couple families in Albany show that 3.7% or 8 of the total 217 families live below the poverty line. Families with no children have the highest poverty rate of 5.8%, comprising of 8 families. On the other hand, families with 1 or 2 children have the lowest poverty rate of 0.0%, which includes 0 families.
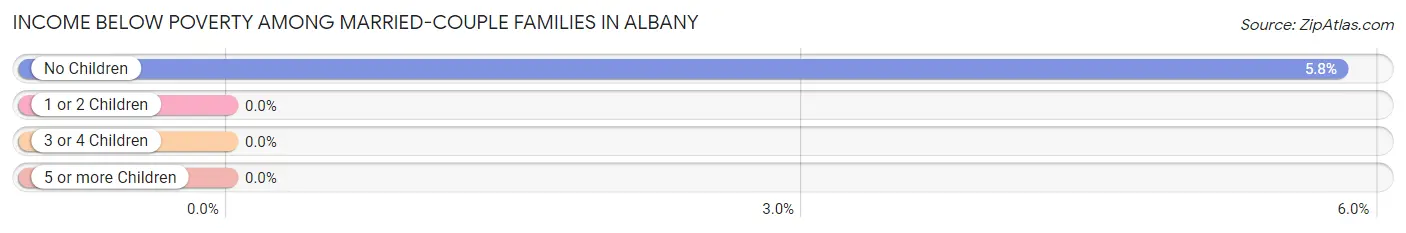
| Children | Above Poverty | Below Poverty |
| No Children | 130 (94.2%) | 8 (5.8%) |
| 1 or 2 Children | 23 (100.0%) | 0 (0.0%) |
| 3 or 4 Children | 56 (100.0%) | 0 (0.0%) |
| 5 or more Children | 0 (0.0%) | 0 (0.0%) |
| Total | 209 (96.3%) | 8 (3.7%) |
Income Below Poverty Among Single-Parent Households in Albany
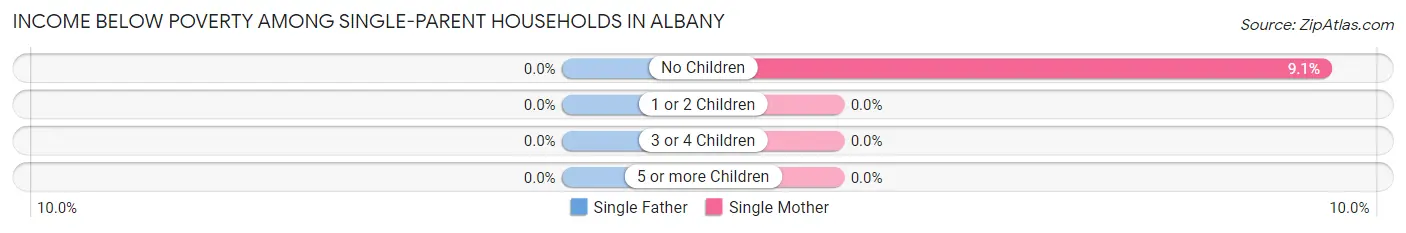
| Children | Single Father | Single Mother |
| No Children | 0 (0.0%) | 2 (9.1%) |
| 1 or 2 Children | 0 (0.0%) | 0 (0.0%) |
| 3 or 4 Children | 0 (0.0%) | 0 (0.0%) |
| 5 or more Children | 0 (0.0%) | 0 (0.0%) |
| Total | 0 (0.0%) | 2 (3.6%) |
Income Below Poverty Among Married-Couple vs Single-Parent Households in Albany
The poverty data for Albany shows that 8 of the married-couple family households (3.7%) and 2 of the single-parent households (3.2%) are living below the poverty level. Within the married-couple family households, those with no children have the highest poverty rate, with 8 households (5.8%) falling below the poverty line. Among the single-parent households, those with no children have the highest poverty rate, with 2 household (6.9%) living below poverty.
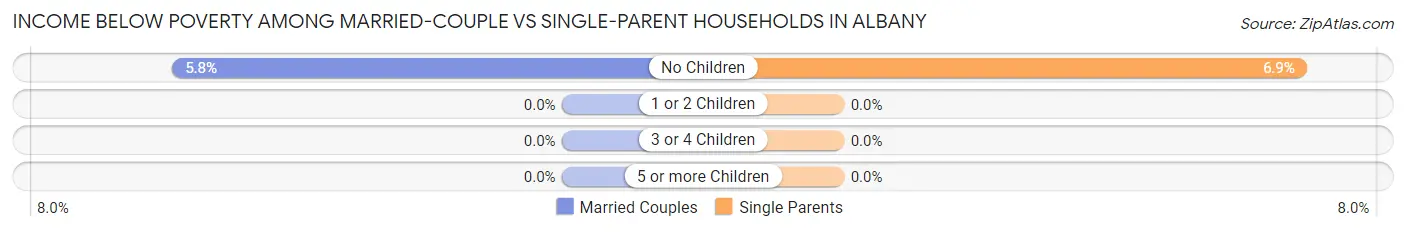
| Children | Married-Couple Families | Single-Parent Households |
| No Children | 8 (5.8%) | 2 (6.9%) |
| 1 or 2 Children | 0 (0.0%) | 0 (0.0%) |
| 3 or 4 Children | 0 (0.0%) | 0 (0.0%) |
| 5 or more Children | 0 (0.0%) | 0 (0.0%) |
| Total | 8 (3.7%) | 2 (3.2%) |
Race in Albany
The most populous races in Albany are White / Caucasian (1,138 | 99.8%), Black / African American (1 | 0.1%), and Two or more Races (1 | 0.1%).
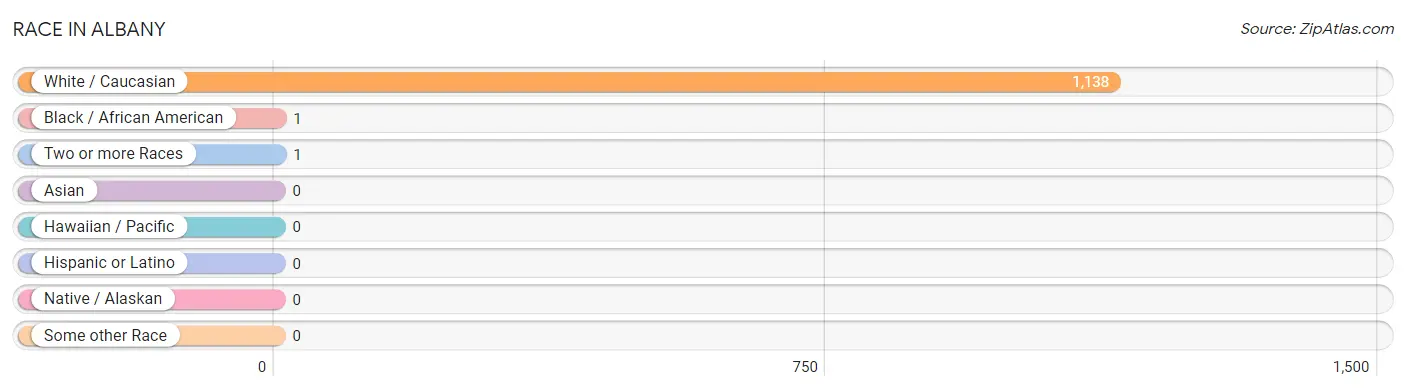
| Race | # Population | % Population |
| Asian | 0 | 0.0% |
| Black / African American | 1 | 0.1% |
| Hawaiian / Pacific | 0 | 0.0% |
| Hispanic or Latino | 0 | 0.0% |
| Native / Alaskan | 0 | 0.0% |
| White / Caucasian | 1,138 | 99.8% |
| Two or more Races | 1 | 0.1% |
| Some other Race | 0 | 0.0% |
| Total | 1,140 | 100.0% |
Ancestry in Albany
The most populous ancestries reported in Albany are Irish (260 | 22.8%), French (224 | 19.7%), Welsh (154 | 13.5%), Italian (137 | 12.0%), and English (125 | 11.0%), together accounting for 78.9% of all Albany residents.
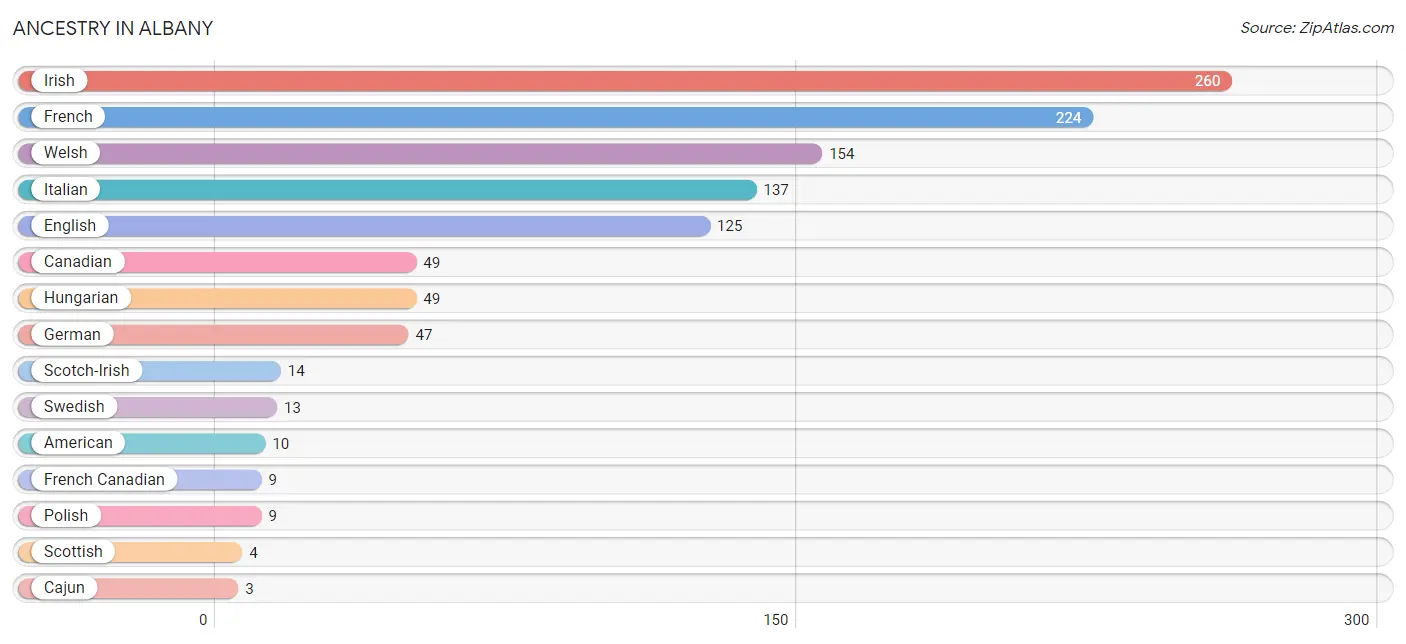
| Ancestry | # Population | % Population |
| American | 10 | 0.9% |
| British | 2 | 0.2% |
| Cajun | 3 | 0.3% |
| Canadian | 49 | 4.3% |
| Cherokee | 1 | 0.1% |
| English | 125 | 11.0% |
| French | 224 | 19.7% |
| French Canadian | 9 | 0.8% |
| German | 47 | 4.1% |
| Hungarian | 49 | 4.3% |
| Irish | 260 | 22.8% |
| Italian | 137 | 12.0% |
| Polish | 9 | 0.8% |
| Scotch-Irish | 14 | 1.2% |
| Scottish | 4 | 0.4% |
| Swedish | 13 | 1.1% |
| Welsh | 154 | 13.5% | View All 17 Rows |
Immigrants in Albany

| Immigration Origin | # Population | % Population | View All 0 Rows |
Sex and Age in Albany
Sex and Age in Albany
The most populous age groups in Albany are 5 to 9 Years (127 | 26.2%) for men and 30 to 34 Years (72 | 11.0%) for women.
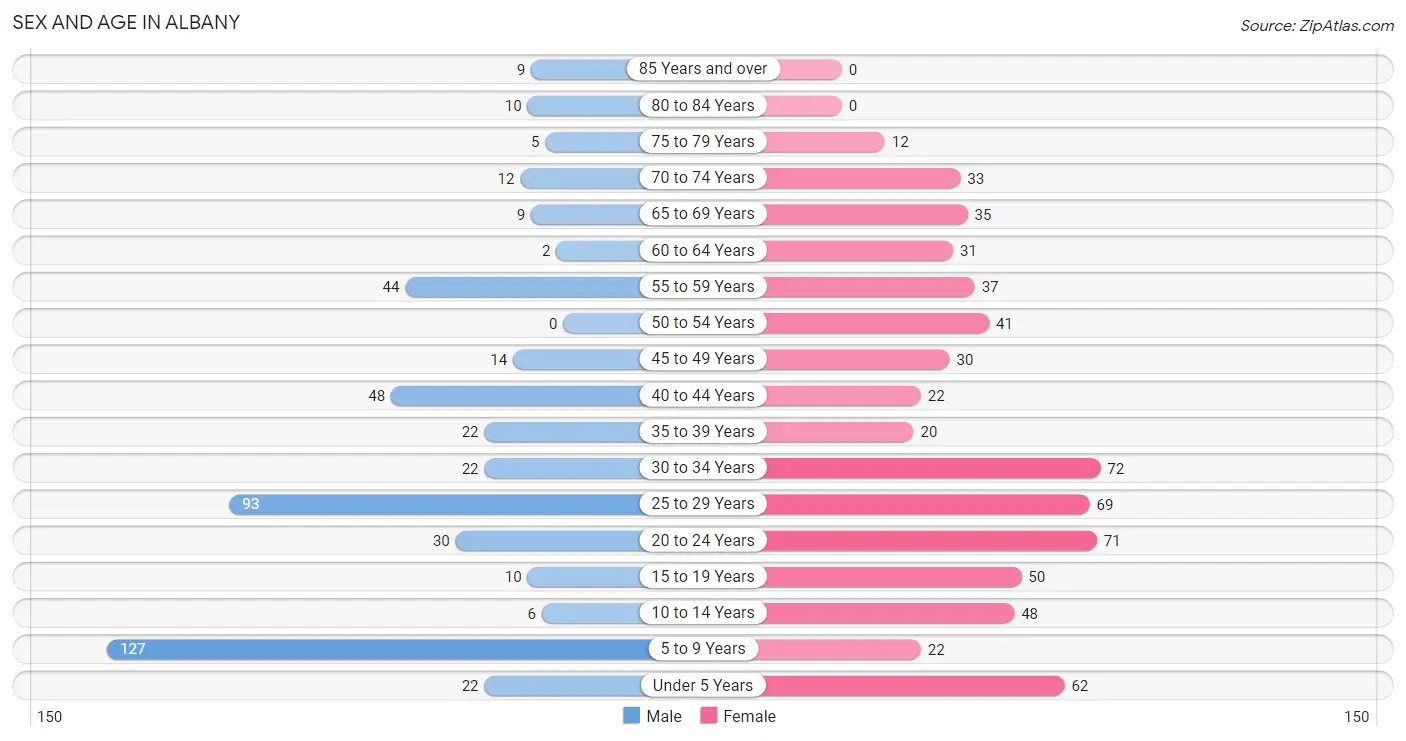
| Age Bracket | Male | Female |
| Under 5 Years | 22 (4.5%) | 62 (9.5%) |
| 5 to 9 Years | 127 (26.2%) | 22 (3.4%) |
| 10 to 14 Years | 6 (1.2%) | 48 (7.3%) |
| 15 to 19 Years | 10 (2.1%) | 50 (7.6%) |
| 20 to 24 Years | 30 (6.2%) | 71 (10.8%) |
| 25 to 29 Years | 93 (19.2%) | 69 (10.5%) |
| 30 to 34 Years | 22 (4.5%) | 72 (11.0%) |
| 35 to 39 Years | 22 (4.5%) | 20 (3.0%) |
| 40 to 44 Years | 48 (9.9%) | 22 (3.4%) |
| 45 to 49 Years | 14 (2.9%) | 30 (4.6%) |
| 50 to 54 Years | 0 (0.0%) | 41 (6.3%) |
| 55 to 59 Years | 44 (9.1%) | 37 (5.7%) |
| 60 to 64 Years | 2 (0.4%) | 31 (4.7%) |
| 65 to 69 Years | 9 (1.9%) | 35 (5.3%) |
| 70 to 74 Years | 12 (2.5%) | 33 (5.0%) |
| 75 to 79 Years | 5 (1.0%) | 12 (1.8%) |
| 80 to 84 Years | 10 (2.1%) | 0 (0.0%) |
| 85 Years and over | 9 (1.9%) | 0 (0.0%) |
| Total | 485 (100.0%) | 655 (100.0%) |
Families and Households in Albany
Median Family Size in Albany
The median family size in Albany is 3.65 persons per family, with single male/father families (7 | 2.5%) accounting for the largest median family size of 4.14 persons per family. On the other hand, single female/mother families (56 | 20.0%) represent the smallest median family size with 3.21 persons per family.
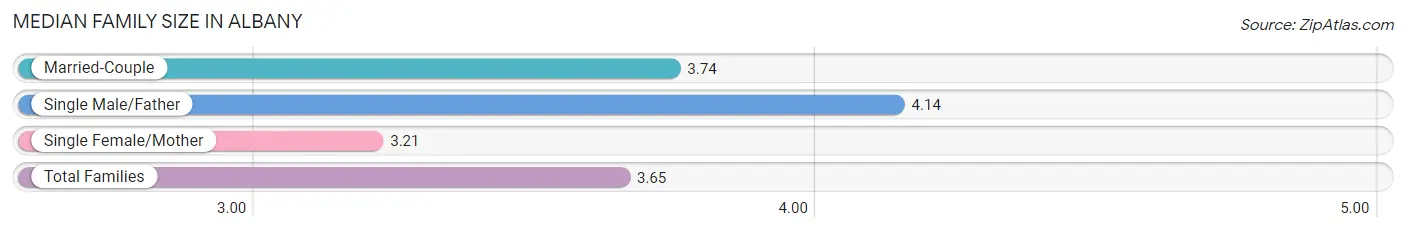
| Family Type | # Families | Family Size |
| Married-Couple | 217 (77.5%) | 3.74 |
| Single Male/Father | 7 (2.5%) | 4.14 |
| Single Female/Mother | 56 (20.0%) | 3.21 |
| Total Families | 280 (100.0%) | 3.65 |
Median Household Size in Albany
The median household size in Albany is 2.93 persons per household, with single male/father households (7 | 1.8%) accounting for the largest median household size of 5.43 persons per household. non-family households (109 | 28.0%) represent the smallest median household size with 1.01 persons per household.
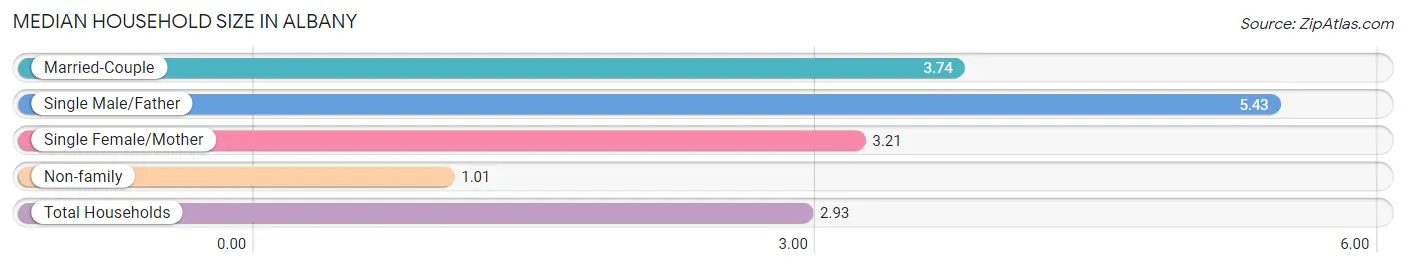
| Household Type | # Households | Household Size |
| Married-Couple | 217 (55.8%) | 3.74 |
| Single Male/Father | 7 (1.8%) | 5.43 |
| Single Female/Mother | 56 (14.4%) | 3.21 |
| Non-family | 109 (28.0%) | 1.01 |
| Total Households | 389 (100.0%) | 2.93 |
Household Size by Marriage Status in Albany
Out of a total of 389 households in Albany, 280 (72.0%) are family households, while 109 (28.0%) are nonfamily households. The most numerous type of family households are 2-person households, comprising 136, and the most common type of nonfamily households are 1-person households, comprising 108.
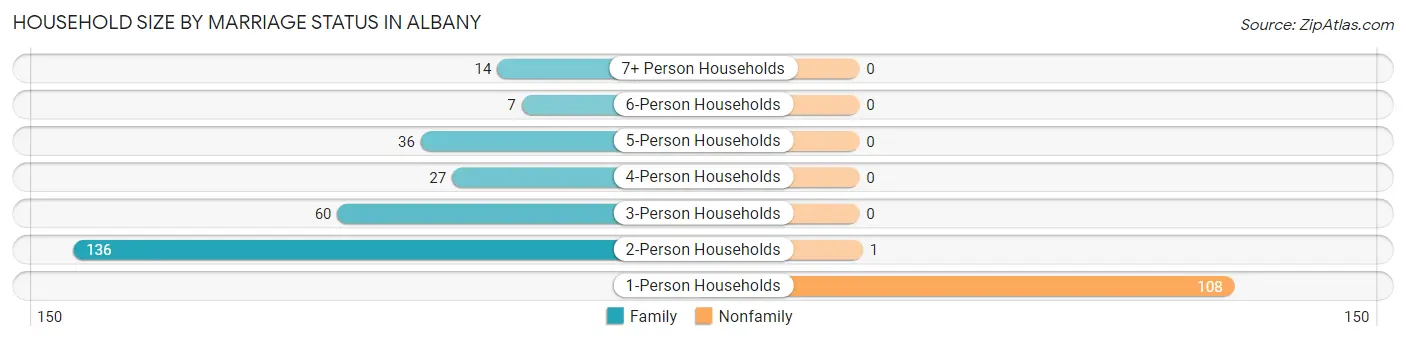
| Household Size | Family Households | Nonfamily Households |
| 1-Person Households | - | 108 (27.8%) |
| 2-Person Households | 136 (35.0%) | 1 (0.3%) |
| 3-Person Households | 60 (15.4%) | 0 (0.0%) |
| 4-Person Households | 27 (6.9%) | 0 (0.0%) |
| 5-Person Households | 36 (9.2%) | 0 (0.0%) |
| 6-Person Households | 7 (1.8%) | 0 (0.0%) |
| 7+ Person Households | 14 (3.6%) | 0 (0.0%) |
| Total | 280 (72.0%) | 109 (28.0%) |
Female Fertility in Albany
Fertility by Age in Albany
Average fertility rate in Albany is 72.0 births per 1,000 women. Women in the age bracket of 20 to 34 years have the highest fertility rate with 118.0 births per 1,000 women. Women in the age bracket of 20 to 34 years acount for 100.0% of all women with births.
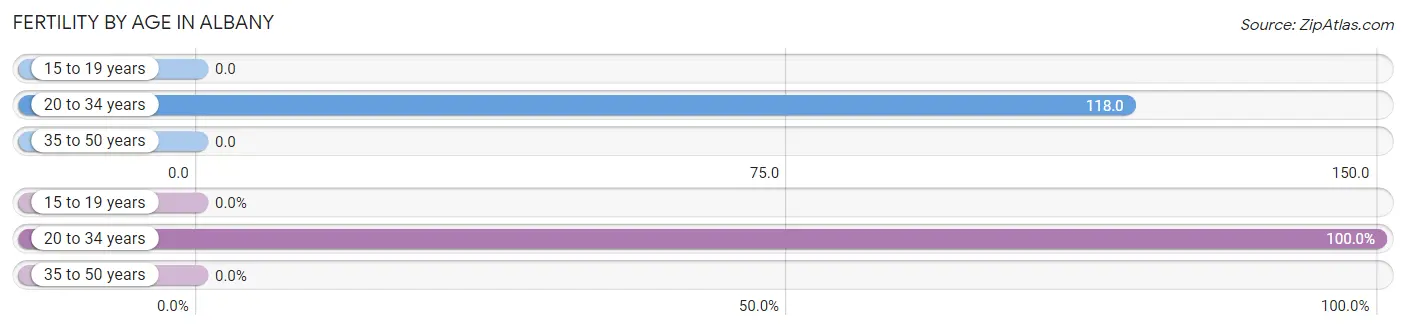
| Age Bracket | Women with Births | Births / 1,000 Women |
| 15 to 19 years | 0 (0.0%) | 0.0 |
| 20 to 34 years | 25 (100.0%) | 118.0 |
| 35 to 50 years | 0 (0.0%) | 0.0 |
| Total | 25 (100.0%) | 72.0 |
Fertility by Age by Marriage Status in Albany
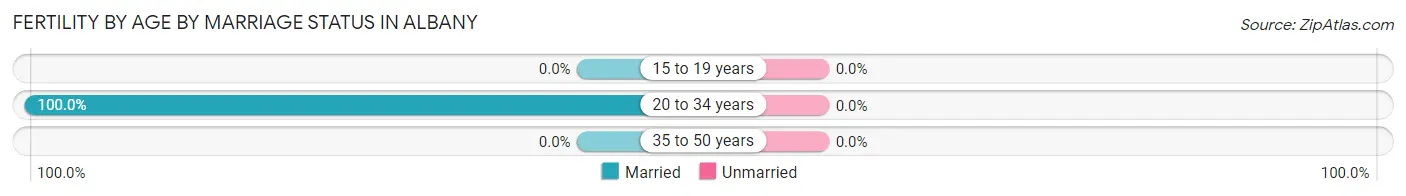
| Age Bracket | Married | Unmarried |
| 15 to 19 years | 0 (0.0%) | 0 (0.0%) |
| 20 to 34 years | 25 (100.0%) | 0 (0.0%) |
| 35 to 50 years | 0 (0.0%) | 0 (0.0%) |
| Total | 25 (100.0%) | 0 (0.0%) |
Fertility by Education in Albany
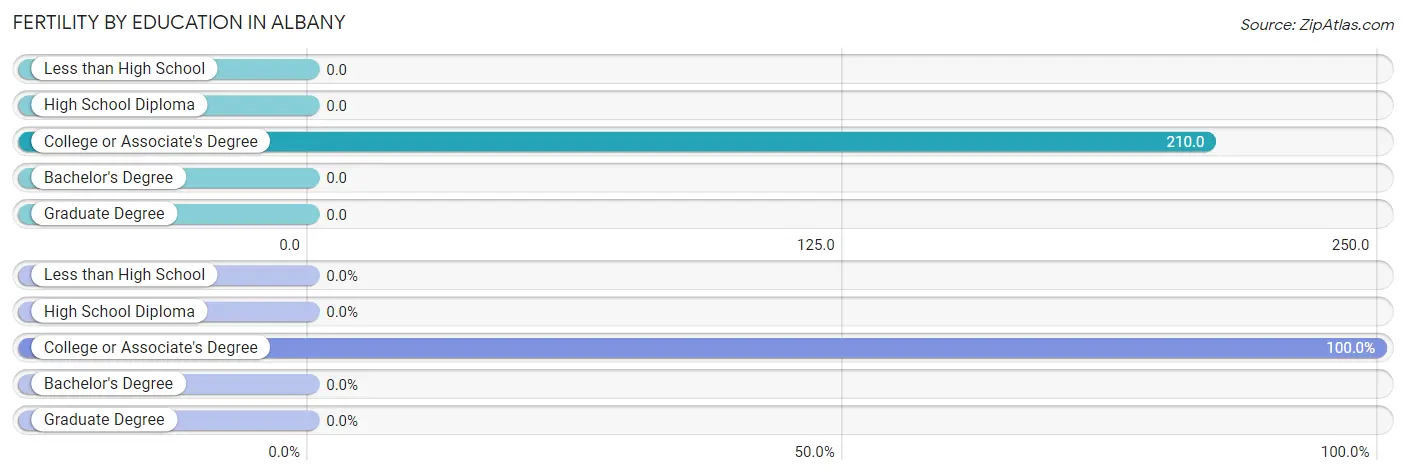
| Educational Attainment | Women with Births | Births / 1,000 Women |
| Less than High School | 0 (0.0%) | 0.0 |
| High School Diploma | 0 (0.0%) | 0.0 |
| College or Associate's Degree | 25 (100.0%) | 210.0 |
| Bachelor's Degree | 0 (0.0%) | 0.0 |
| Graduate Degree | 0 (0.0%) | 0.0 |
| Total | 25 (100.0%) | 72.0 |
Fertility by Education by Marriage Status in Albany
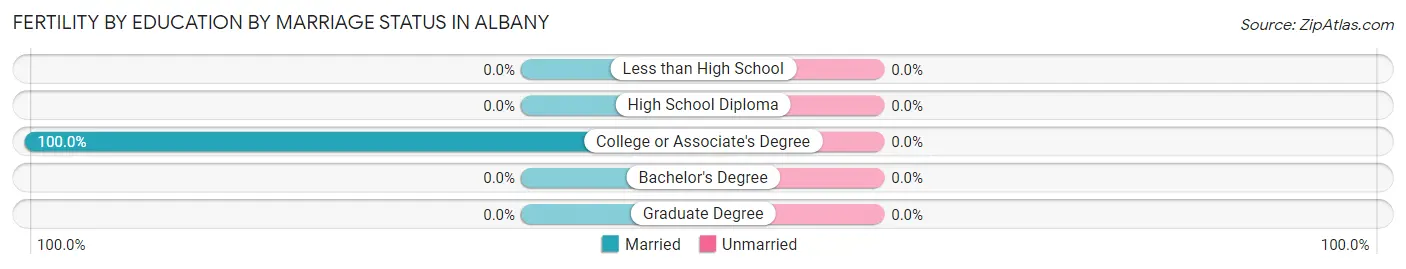
| Educational Attainment | Married | Unmarried |
| Less than High School | 0 (0.0%) | 0 (0.0%) |
| High School Diploma | 0 (0.0%) | 0 (0.0%) |
| College or Associate's Degree | 25 (100.0%) | 0 (0.0%) |
| Bachelor's Degree | 0 (0.0%) | 0 (0.0%) |
| Graduate Degree | 0 (0.0%) | 0 (0.0%) |
| Total | 25 (100.0%) | 0 (0.0%) |
Employment Characteristics in Albany
Employment by Class of Employer in Albany
Among the 469 employed individuals in Albany, private company employees (302 | 64.4%), state government employees (90 | 19.2%), and local government employees (62 | 13.2%) make up the most common classes of employment.
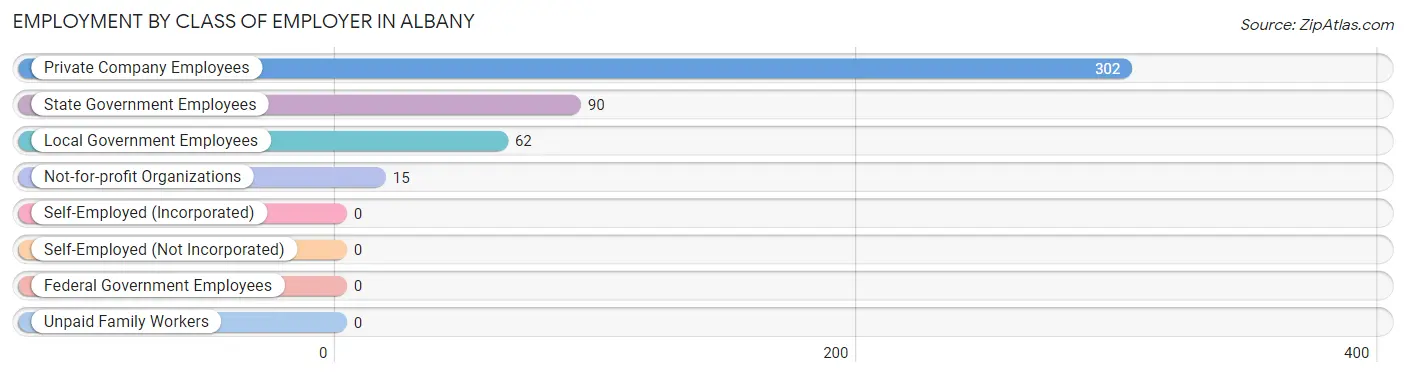
| Employer Class | # Employees | % Employees |
| Private Company Employees | 302 | 64.4% |
| Self-Employed (Incorporated) | 0 | 0.0% |
| Self-Employed (Not Incorporated) | 0 | 0.0% |
| Not-for-profit Organizations | 15 | 3.2% |
| Local Government Employees | 62 | 13.2% |
| State Government Employees | 90 | 19.2% |
| Federal Government Employees | 0 | 0.0% |
| Unpaid Family Workers | 0 | 0.0% |
| Total | 469 | 100.0% |
Employment Status by Age in Albany
According to the labor force statistics for Albany, out of the total population over 16 years of age (846), 56.0% or 474 individuals are in the labor force, with 1.1% or 5 of them unemployed. The age group with the highest labor force participation rate is 20 to 24 years, with 100.0% or 101 individuals in the labor force. Within the labor force, the 20 to 24 years age range has the highest percentage of unemployed individuals, with 5.0% or 5 of them being unemployed.
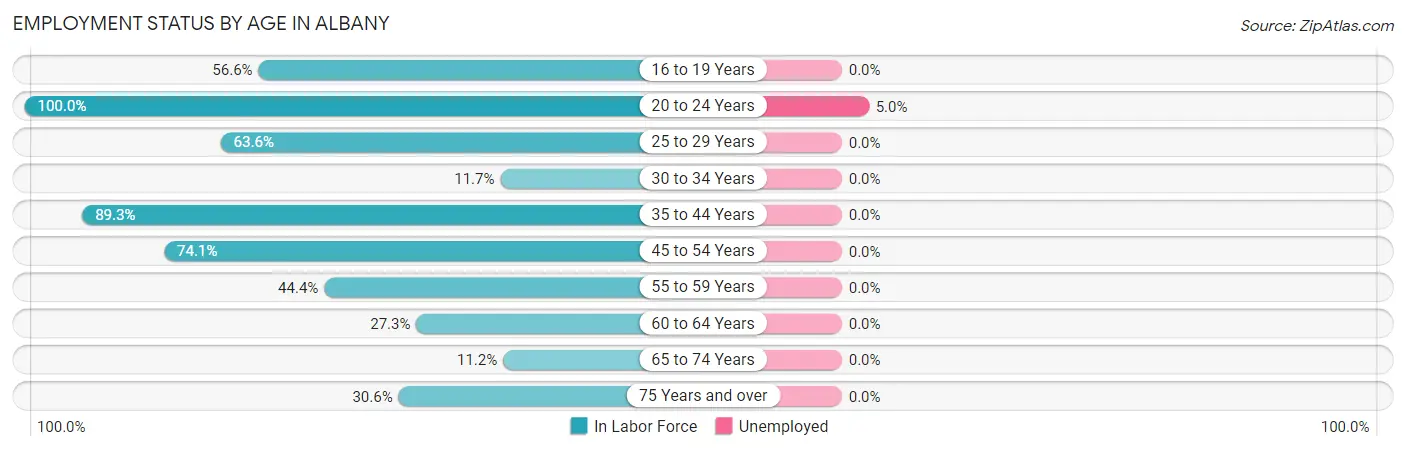
| Age Bracket | In Labor Force | Unemployed |
| 16 to 19 Years | 30 (56.6%) | 0 (0.0%) |
| 20 to 24 Years | 101 (100.0%) | 5 (5.0%) |
| 25 to 29 Years | 103 (63.6%) | 0 (0.0%) |
| 30 to 34 Years | 11 (11.7%) | 0 (0.0%) |
| 35 to 44 Years | 100 (89.3%) | 0 (0.0%) |
| 45 to 54 Years | 63 (74.1%) | 0 (0.0%) |
| 55 to 59 Years | 36 (44.4%) | 0 (0.0%) |
| 60 to 64 Years | 9 (27.3%) | 0 (0.0%) |
| 65 to 74 Years | 10 (11.2%) | 0 (0.0%) |
| 75 Years and over | 11 (30.6%) | 0 (0.0%) |
| Total | 474 (56.0%) | 5 (1.1%) |
Employment Status by Educational Attainment in Albany
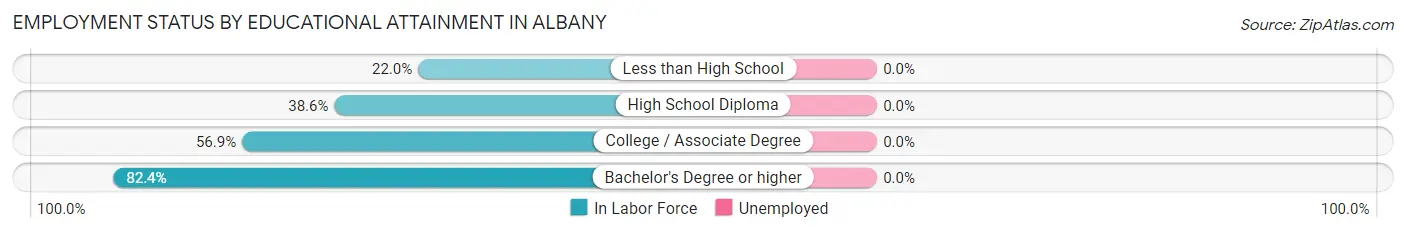
| Educational Attainment | In Labor Force | Unemployed |
| Less than High School | 11 (22.0%) | 0 (0.0%) |
| High School Diploma | 56 (38.6%) | 0 (0.0%) |
| College / Associate Degree | 115 (56.9%) | 0 (0.0%) |
| Bachelor's Degree or higher | 140 (82.4%) | 0 (0.0%) |
| Total | 322 (56.8%) | 0 (0.0%) |
Employment Occupations by Sex in Albany
Management, Business, Science and Arts Occupations
The most common Management, Business, Science and Arts occupations in Albany are Community & Social Service (110 | 23.4%), Education Instruction & Library (103 | 22.0%), Business & Financial (66 | 14.1%), Management (56 | 11.9%), and Health Diagnosing & Treating (15 | 3.2%).
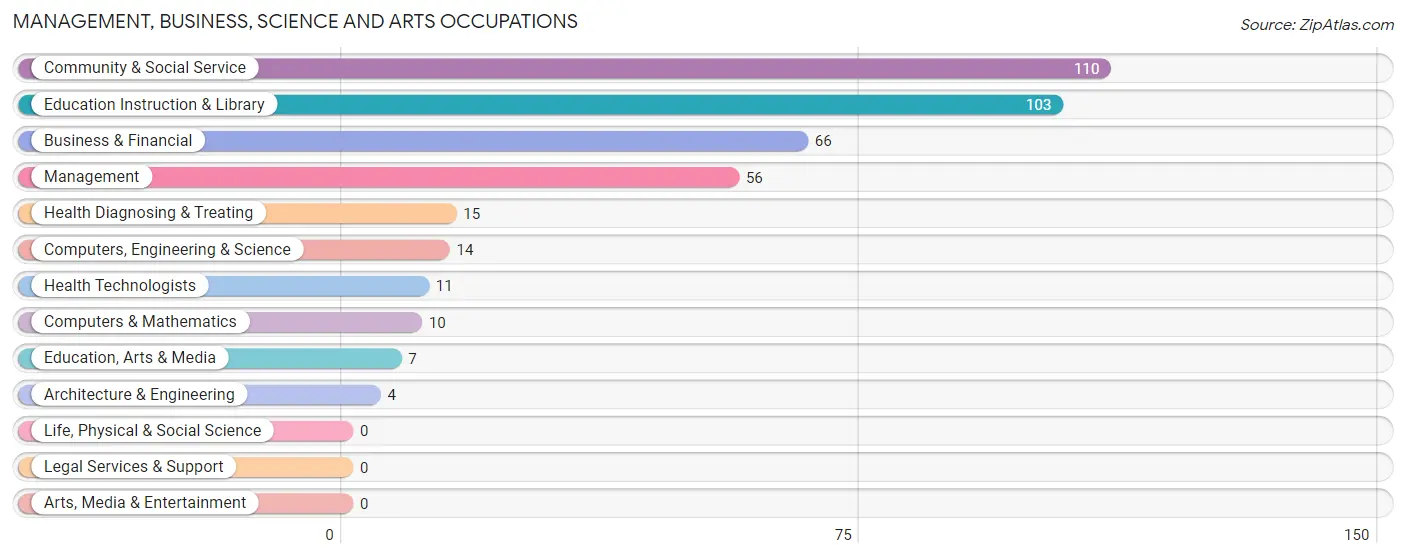
Management, Business, Science and Arts Occupations by Sex
Within the Management, Business, Science and Arts occupations in Albany, the most male-oriented occupations are Business & Financial (100.0%), Management (50.0%), and Computers & Mathematics (50.0%), while the most female-oriented occupations are Architecture & Engineering (100.0%), Education, Arts & Media (100.0%), and Community & Social Service (94.6%).
| Occupation | Male | Female |
| Management | 28 (50.0%) | 28 (50.0%) |
| Business & Financial | 66 (100.0%) | 0 (0.0%) |
| Computers, Engineering & Science | 5 (35.7%) | 9 (64.3%) |
| Computers & Mathematics | 5 (50.0%) | 5 (50.0%) |
| Architecture & Engineering | 0 (0.0%) | 4 (100.0%) |
| Life, Physical & Social Science | 0 (0.0%) | 0 (0.0%) |
| Community & Social Service | 6 (5.4%) | 104 (94.6%) |
| Education, Arts & Media | 0 (0.0%) | 7 (100.0%) |
| Legal Services & Support | 0 (0.0%) | 0 (0.0%) |
| Education Instruction & Library | 6 (5.8%) | 97 (94.2%) |
| Arts, Media & Entertainment | 0 (0.0%) | 0 (0.0%) |
| Health Diagnosing & Treating | 3 (20.0%) | 12 (80.0%) |
| Health Technologists | 3 (27.3%) | 8 (72.7%) |
| Total (Category) | 108 (41.4%) | 153 (58.6%) |
| Total (Overall) | 259 (55.2%) | 210 (44.8%) |
Services Occupations
The most common Services occupations in Albany are Security & Protection (31 | 6.6%), Firefighting & Prevention (31 | 6.6%), Food Preparation & Serving (20 | 4.3%), and Healthcare Support (3 | 0.6%).
Services Occupations by Sex
Within the Services occupations in Albany, the most male-oriented occupations are Security & Protection (100.0%), and Firefighting & Prevention (100.0%), while the most female-oriented occupations are Healthcare Support (100.0%), and Food Preparation & Serving (100.0%).
| Occupation | Male | Female |
| Healthcare Support | 0 (0.0%) | 3 (100.0%) |
| Security & Protection | 31 (100.0%) | 0 (0.0%) |
| Firefighting & Prevention | 31 (100.0%) | 0 (0.0%) |
| Law Enforcement | 0 (0.0%) | 0 (0.0%) |
| Food Preparation & Serving | 0 (0.0%) | 20 (100.0%) |
| Cleaning & Maintenance | 0 (0.0%) | 0 (0.0%) |
| Personal Care & Service | 0 (0.0%) | 0 (0.0%) |
| Total (Category) | 31 (57.4%) | 23 (42.6%) |
| Total (Overall) | 259 (55.2%) | 210 (44.8%) |
Sales and Office Occupations
The most common Sales and Office occupations in Albany are Sales & Related (33 | 7.0%), and Office & Administration (18 | 3.8%).
Sales and Office Occupations by Sex
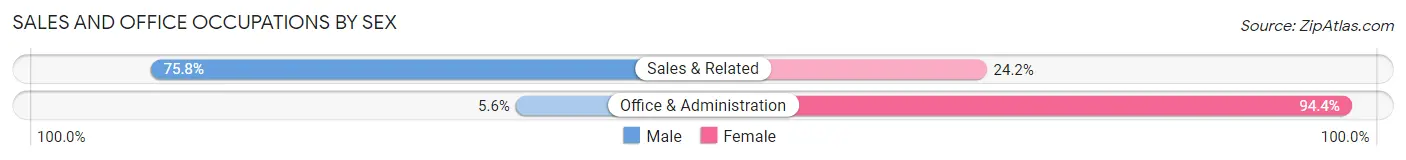
| Occupation | Male | Female |
| Sales & Related | 25 (75.8%) | 8 (24.2%) |
| Office & Administration | 1 (5.6%) | 17 (94.4%) |
| Total (Category) | 26 (51.0%) | 25 (49.0%) |
| Total (Overall) | 259 (55.2%) | 210 (44.8%) |
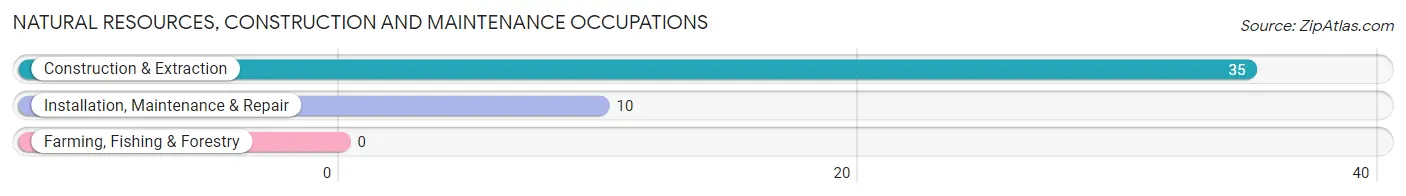
Natural Resources, Construction and Maintenance Occupations
The most common Natural Resources, Construction and Maintenance occupations in Albany are Construction & Extraction (35 | 7.5%), and Installation, Maintenance & Repair (10 | 2.1%).
Natural Resources, Construction and Maintenance Occupations by Sex
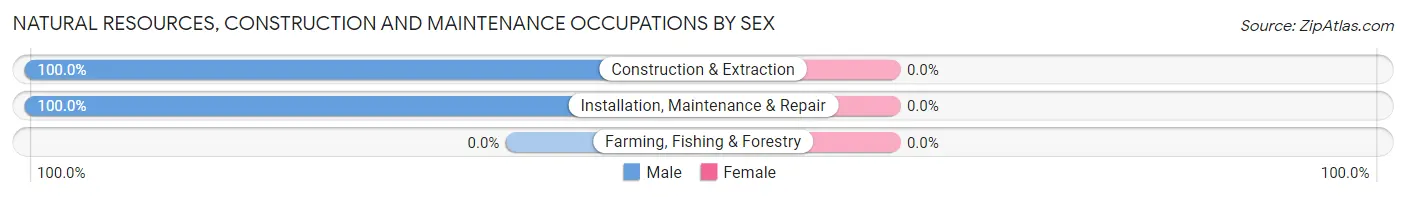
| Occupation | Male | Female |
| Farming, Fishing & Forestry | 0 (0.0%) | 0 (0.0%) |
| Construction & Extraction | 35 (100.0%) | 0 (0.0%) |
| Installation, Maintenance & Repair | 10 (100.0%) | 0 (0.0%) |
| Total (Category) | 45 (100.0%) | 0 (0.0%) |
| Total (Overall) | 259 (55.2%) | 210 (44.8%) |
Production, Transportation and Moving Occupations
The most common Production, Transportation and Moving occupations in Albany are Production (49 | 10.4%), and Transportation (9 | 1.9%).
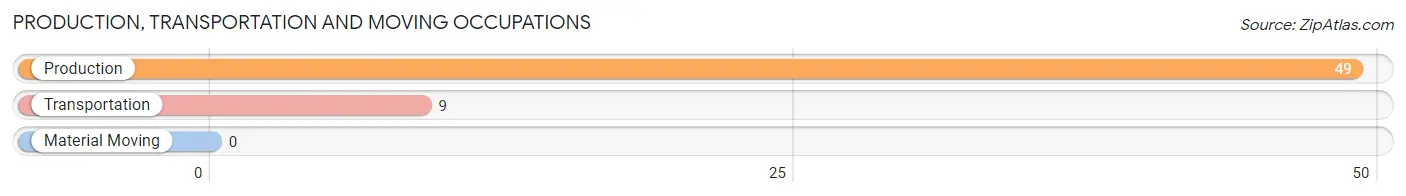
Production, Transportation and Moving Occupations by Sex
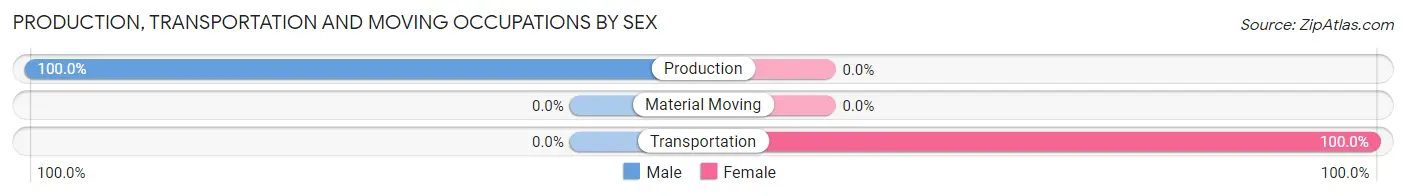
| Occupation | Male | Female |
| Production | 49 (100.0%) | 0 (0.0%) |
| Transportation | 0 (0.0%) | 9 (100.0%) |
| Material Moving | 0 (0.0%) | 0 (0.0%) |
| Total (Category) | 49 (84.5%) | 9 (15.5%) |
| Total (Overall) | 259 (55.2%) | 210 (44.8%) |
Employment Industries by Sex in Albany
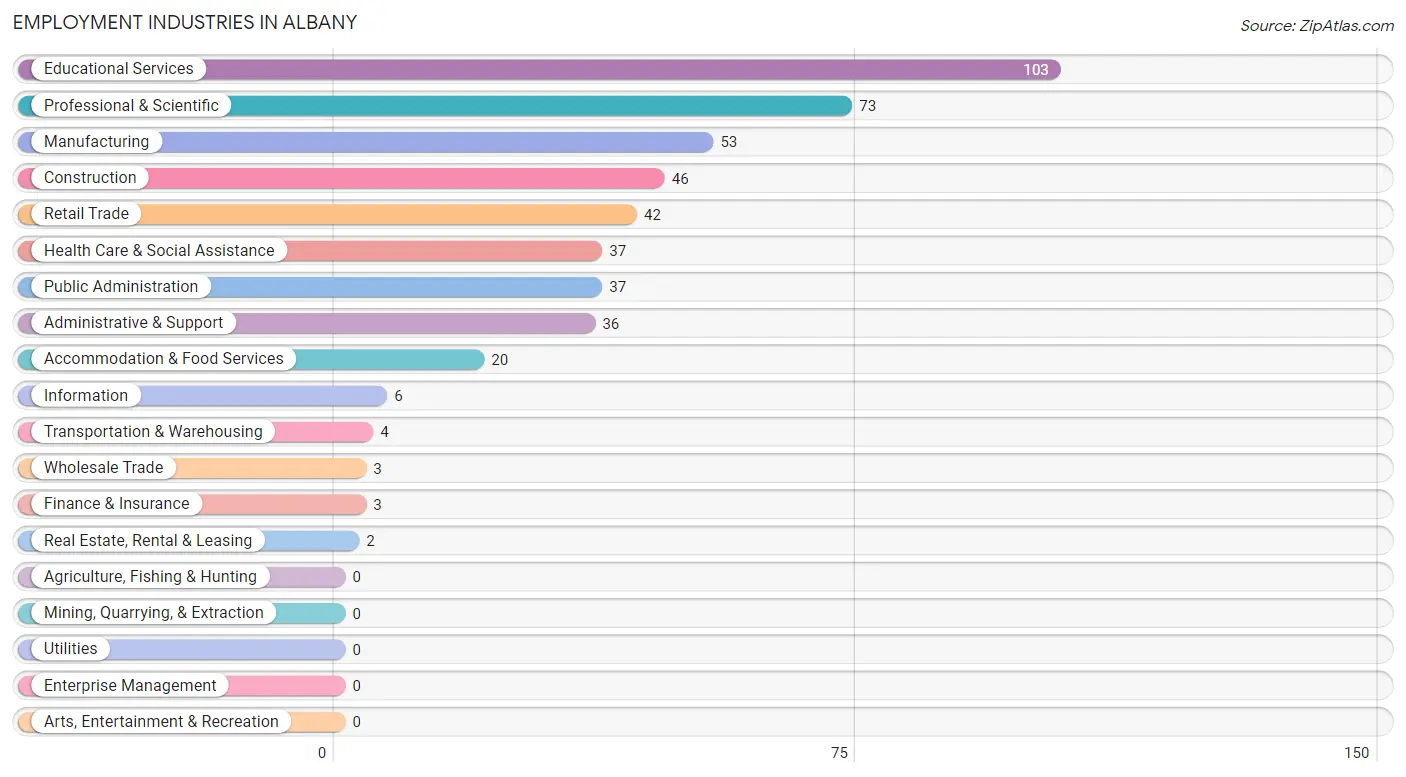
Employment Industries in Albany
The major employment industries in Albany include Educational Services (103 | 22.0%), Professional & Scientific (73 | 15.6%), Manufacturing (53 | 11.3%), Construction (46 | 9.8%), and Retail Trade (42 | 9.0%).
Employment Industries by Sex in Albany
The Albany industries that see more men than women are Wholesale Trade (100.0%), Real Estate, Rental & Leasing (100.0%), and Manufacturing (94.3%), whereas the industries that tend to have a higher number of women are Transportation & Warehousing (100.0%), Finance & Insurance (100.0%), and Accommodation & Food Services (100.0%).
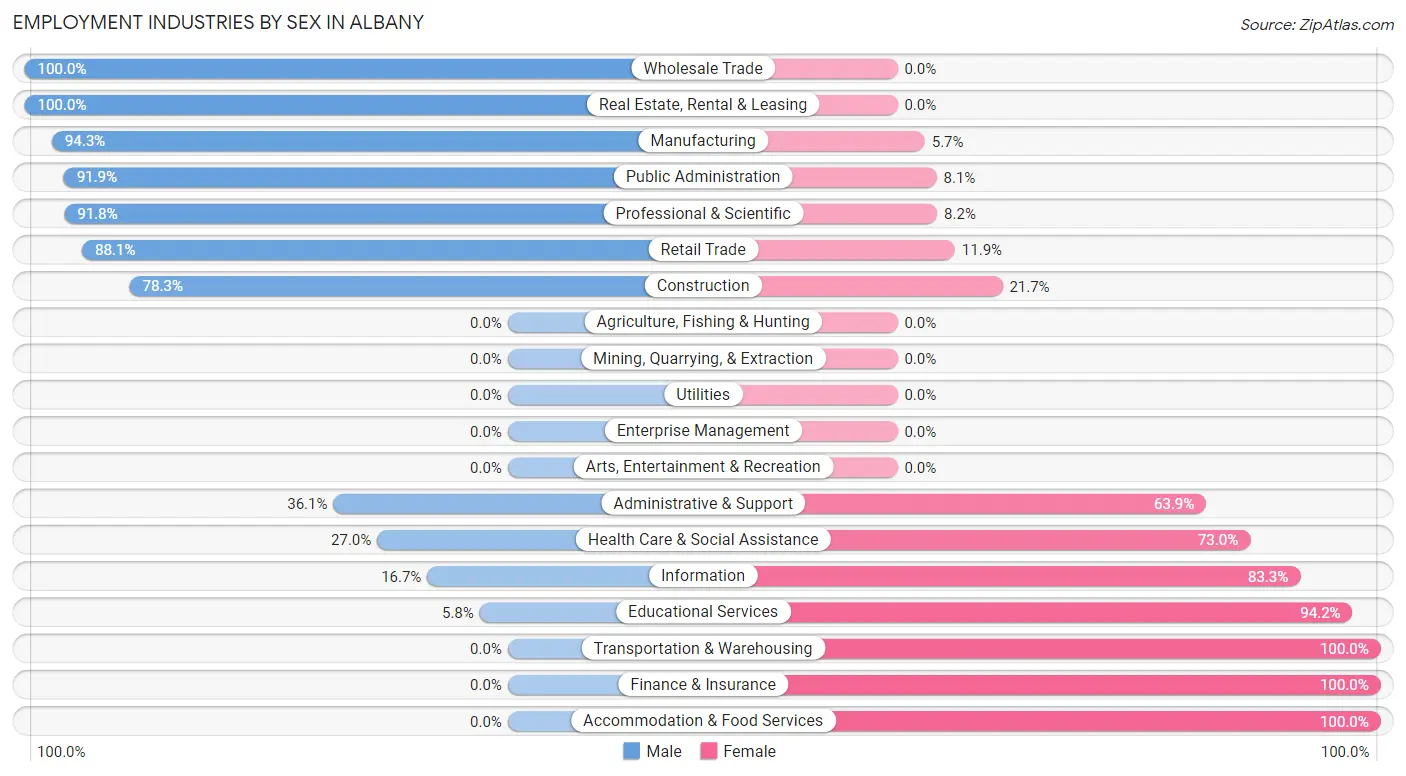
| Industry | Male | Female |
| Agriculture, Fishing & Hunting | 0 (0.0%) | 0 (0.0%) |
| Mining, Quarrying, & Extraction | 0 (0.0%) | 0 (0.0%) |
| Construction | 36 (78.3%) | 10 (21.7%) |
| Manufacturing | 50 (94.3%) | 3 (5.7%) |
| Wholesale Trade | 3 (100.0%) | 0 (0.0%) |
| Retail Trade | 37 (88.1%) | 5 (11.9%) |
| Transportation & Warehousing | 0 (0.0%) | 4 (100.0%) |
| Utilities | 0 (0.0%) | 0 (0.0%) |
| Information | 1 (16.7%) | 5 (83.3%) |
| Finance & Insurance | 0 (0.0%) | 3 (100.0%) |
| Real Estate, Rental & Leasing | 2 (100.0%) | 0 (0.0%) |
| Professional & Scientific | 67 (91.8%) | 6 (8.2%) |
| Enterprise Management | 0 (0.0%) | 0 (0.0%) |
| Administrative & Support | 13 (36.1%) | 23 (63.9%) |
| Educational Services | 6 (5.8%) | 97 (94.2%) |
| Health Care & Social Assistance | 10 (27.0%) | 27 (73.0%) |
| Arts, Entertainment & Recreation | 0 (0.0%) | 0 (0.0%) |
| Accommodation & Food Services | 0 (0.0%) | 20 (100.0%) |
| Public Administration | 34 (91.9%) | 3 (8.1%) |
| Total | 259 (55.2%) | 210 (44.8%) |
Education in Albany
School Enrollment in Albany
The most common levels of schooling among the 287 students in Albany are elementary school (65 | 22.7%), college / undergraduate (49 | 17.1%), and kindergarten (45 | 15.7%).
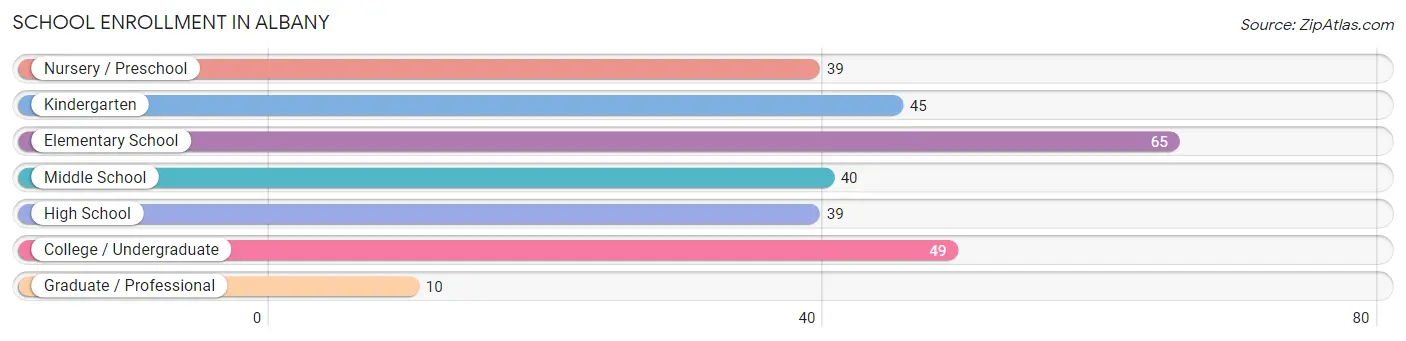
| School Level | # Students | % Students |
| Nursery / Preschool | 39 | 13.6% |
| Kindergarten | 45 | 15.7% |
| Elementary School | 65 | 22.7% |
| Middle School | 40 | 13.9% |
| High School | 39 | 13.6% |
| College / Undergraduate | 49 | 17.1% |
| Graduate / Professional | 10 | 3.5% |
| Total | 287 | 100.0% |
School Enrollment by Age by Funding Source in Albany
Out of a total of 287 students who are enrolled in schools in Albany, 36 (12.5%) attend a private institution, while the remaining 251 (87.5%) are enrolled in public schools. The age group of 18 to 19 year olds has the highest likelihood of being enrolled in private schools, with 25 (100.0% in the age bracket) enrolled. Conversely, the age group of 5 to 9 year old has the lowest likelihood of being enrolled in a private school, with 149 (100.0% in the age bracket) attending a public institution.
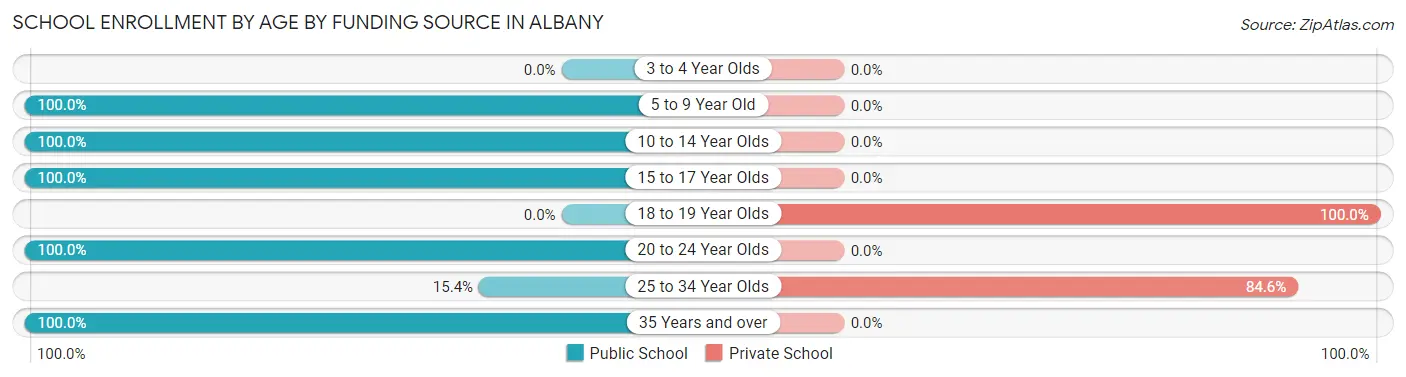
| Age Bracket | Public School | Private School |
| 3 to 4 Year Olds | 0 (0.0%) | 0 (0.0%) |
| 5 to 9 Year Old | 149 (100.0%) | 0 (0.0%) |
| 10 to 14 Year Olds | 54 (100.0%) | 0 (0.0%) |
| 15 to 17 Year Olds | 25 (100.0%) | 0 (0.0%) |
| 18 to 19 Year Olds | 0 (0.0%) | 25 (100.0%) |
| 20 to 24 Year Olds | 5 (100.0%) | 0 (0.0%) |
| 25 to 34 Year Olds | 2 (15.4%) | 11 (84.6%) |
| 35 Years and over | 16 (100.0%) | 0 (0.0%) |
| Total | 251 (87.5%) | 36 (12.5%) |
Educational Attainment by Field of Study in Albany
Arts & humanities (82 | 39.8%), business (48 | 23.3%), education (29 | 14.1%), liberal arts & history (19 | 9.2%), and science & technology (14 | 6.8%) are the most common fields of study among 206 individuals in Albany who have obtained a bachelor's degree or higher.
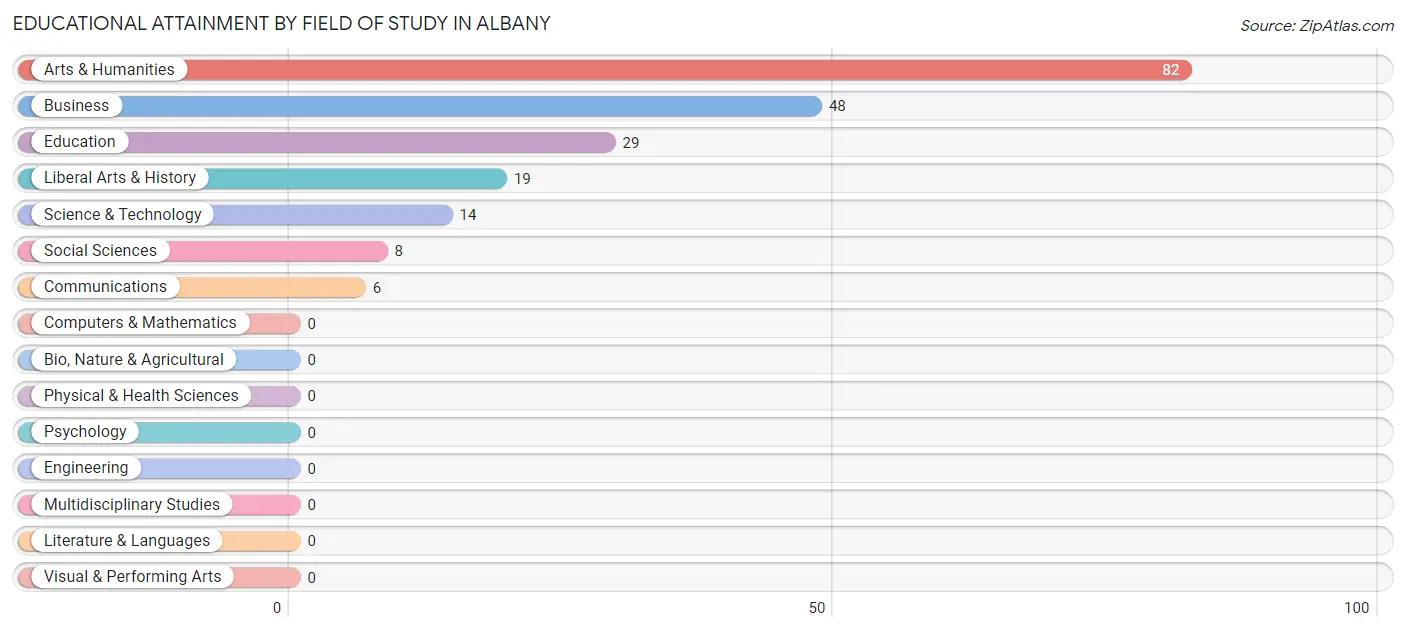
| Field of Study | # Graduates | % Graduates |
| Computers & Mathematics | 0 | 0.0% |
| Bio, Nature & Agricultural | 0 | 0.0% |
| Physical & Health Sciences | 0 | 0.0% |
| Psychology | 0 | 0.0% |
| Social Sciences | 8 | 3.9% |
| Engineering | 0 | 0.0% |
| Multidisciplinary Studies | 0 | 0.0% |
| Science & Technology | 14 | 6.8% |
| Business | 48 | 23.3% |
| Education | 29 | 14.1% |
| Literature & Languages | 0 | 0.0% |
| Liberal Arts & History | 19 | 9.2% |
| Visual & Performing Arts | 0 | 0.0% |
| Communications | 6 | 2.9% |
| Arts & Humanities | 82 | 39.8% |
| Total | 206 | 100.0% |
Transportation & Commute in Albany
Vehicle Availability by Sex in Albany
The most prevalent vehicle ownership categories in Albany are males with 2 vehicles (191, accounting for 73.8%) and females with 2 vehicles (118, making up 90.9%).
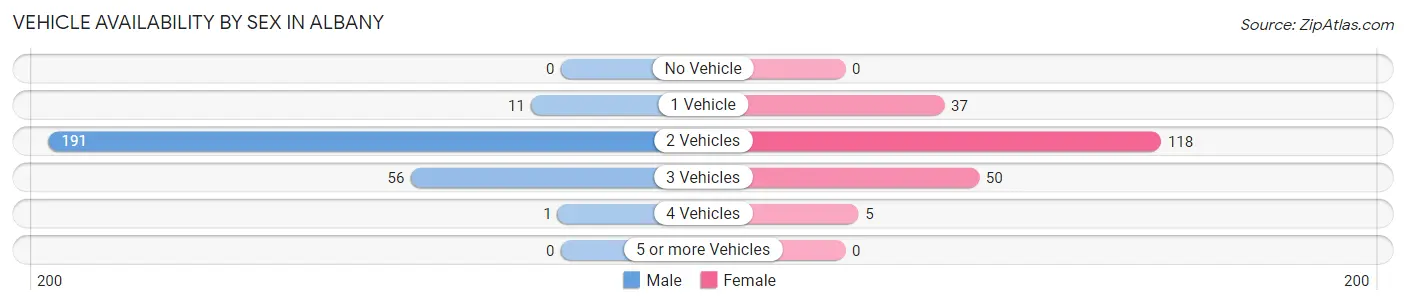
| Vehicles Available | Male | Female |
| No Vehicle | 0 (0.0%) | 0 (0.0%) |
| 1 Vehicle | 11 (4.3%) | 37 (17.6%) |
| 2 Vehicles | 191 (73.8%) | 118 (56.2%) |
| 3 Vehicles | 56 (21.6%) | 50 (23.8%) |
| 4 Vehicles | 1 (0.4%) | 5 (2.4%) |
| 5 or more Vehicles | 0 (0.0%) | 0 (0.0%) |
| Total | 259 (100.0%) | 210 (100.0%) |
Commute Time in Albany
The most frequently occuring commute durations in Albany are 45 to 59 minutes (125 commuters, 27.9%), 5 to 9 minutes (81 commuters, 18.1%), and 15 to 19 minutes (69 commuters, 15.4%).
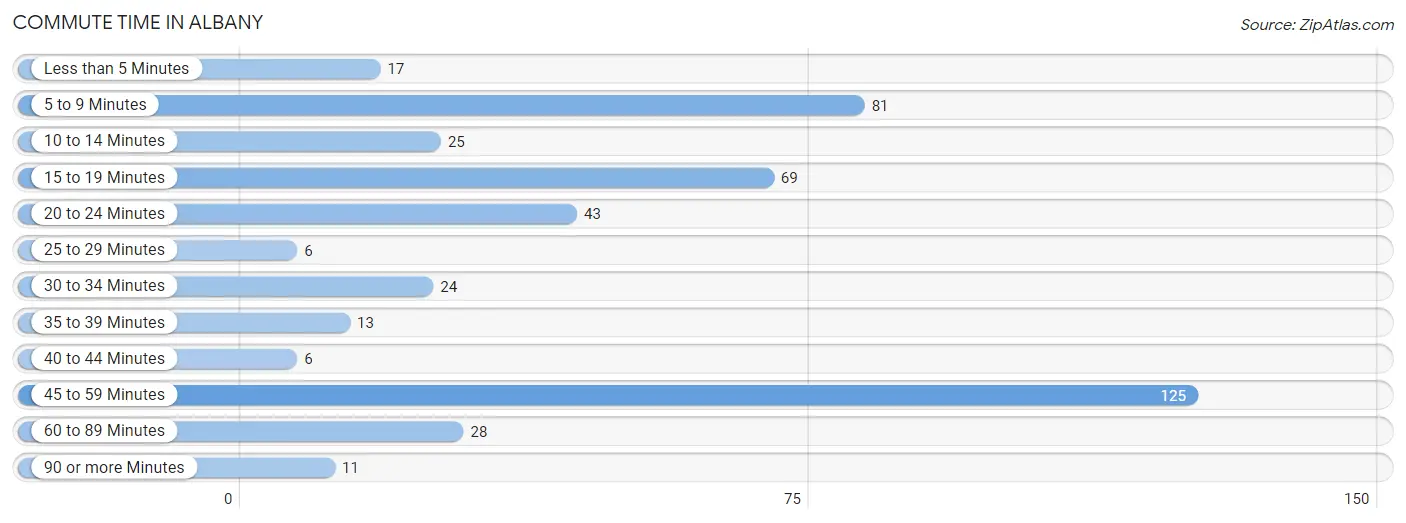
| Commute Time | # Commuters | % Commuters |
| Less than 5 Minutes | 17 | 3.8% |
| 5 to 9 Minutes | 81 | 18.1% |
| 10 to 14 Minutes | 25 | 5.6% |
| 15 to 19 Minutes | 69 | 15.4% |
| 20 to 24 Minutes | 43 | 9.6% |
| 25 to 29 Minutes | 6 | 1.3% |
| 30 to 34 Minutes | 24 | 5.4% |
| 35 to 39 Minutes | 13 | 2.9% |
| 40 to 44 Minutes | 6 | 1.3% |
| 45 to 59 Minutes | 125 | 27.9% |
| 60 to 89 Minutes | 28 | 6.2% |
| 90 or more Minutes | 11 | 2.5% |
Commute Time by Sex in Albany
The most common commute times in Albany are 45 to 59 minutes (115 commuters, 45.6%) for males and 5 to 9 minutes (81 commuters, 41.3%) for females.
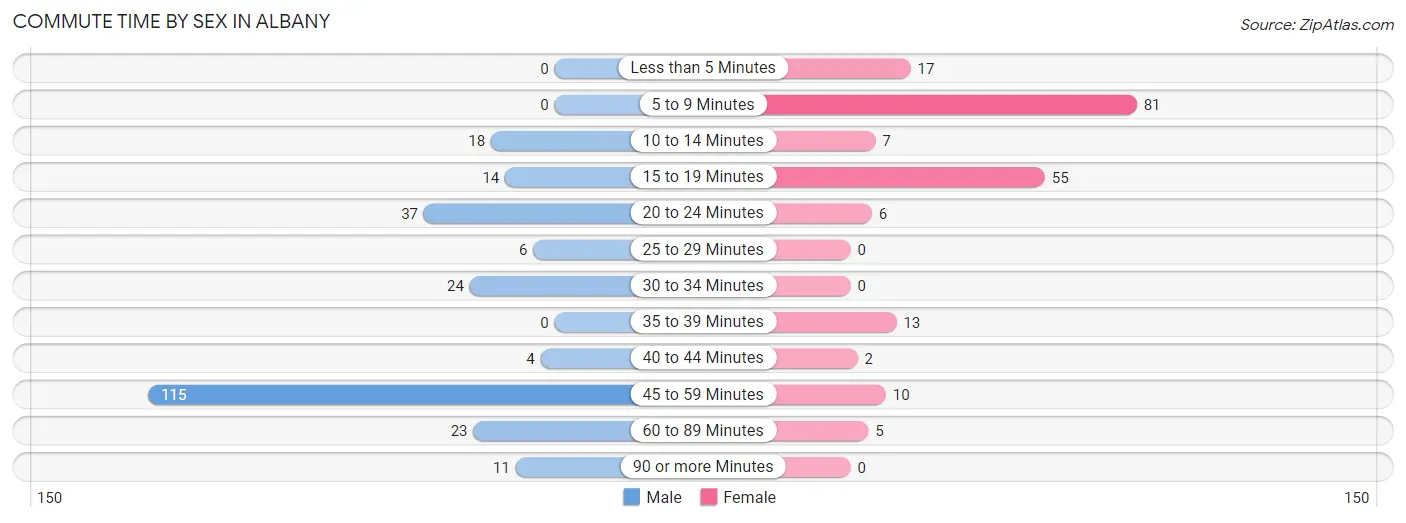
| Commute Time | Male | Female |
| Less than 5 Minutes | 0 (0.0%) | 17 (8.7%) |
| 5 to 9 Minutes | 0 (0.0%) | 81 (41.3%) |
| 10 to 14 Minutes | 18 (7.1%) | 7 (3.6%) |
| 15 to 19 Minutes | 14 (5.6%) | 55 (28.1%) |
| 20 to 24 Minutes | 37 (14.7%) | 6 (3.1%) |
| 25 to 29 Minutes | 6 (2.4%) | 0 (0.0%) |
| 30 to 34 Minutes | 24 (9.5%) | 0 (0.0%) |
| 35 to 39 Minutes | 0 (0.0%) | 13 (6.6%) |
| 40 to 44 Minutes | 4 (1.6%) | 2 (1.0%) |
| 45 to 59 Minutes | 115 (45.6%) | 10 (5.1%) |
| 60 to 89 Minutes | 23 (9.1%) | 5 (2.5%) |
| 90 or more Minutes | 11 (4.4%) | 0 (0.0%) |
Time of Departure to Work by Sex in Albany
The most frequent times of departure to work in Albany are 7:30 AM to 7:59 AM (92, 36.5%) for males and 7:00 AM to 7:29 AM (76, 38.8%) for females.
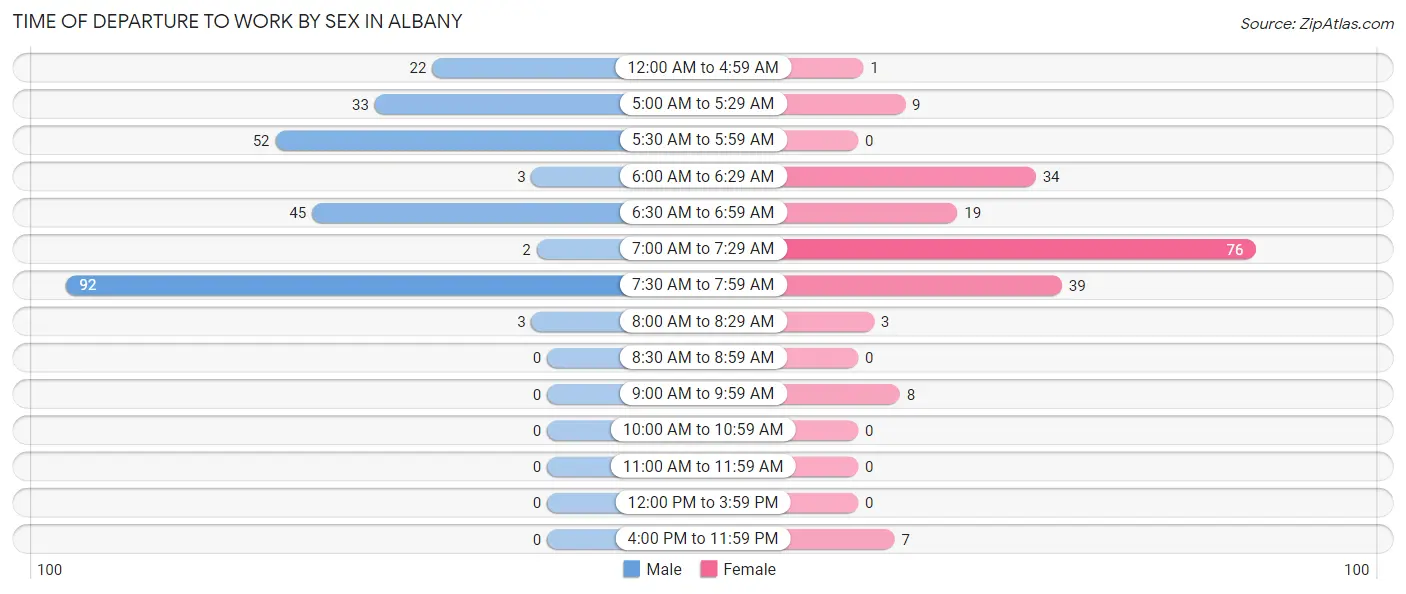
| Time of Departure | Male | Female |
| 12:00 AM to 4:59 AM | 22 (8.7%) | 1 (0.5%) |
| 5:00 AM to 5:29 AM | 33 (13.1%) | 9 (4.6%) |
| 5:30 AM to 5:59 AM | 52 (20.6%) | 0 (0.0%) |
| 6:00 AM to 6:29 AM | 3 (1.2%) | 34 (17.3%) |
| 6:30 AM to 6:59 AM | 45 (17.9%) | 19 (9.7%) |
| 7:00 AM to 7:29 AM | 2 (0.8%) | 76 (38.8%) |
| 7:30 AM to 7:59 AM | 92 (36.5%) | 39 (19.9%) |
| 8:00 AM to 8:29 AM | 3 (1.2%) | 3 (1.5%) |
| 8:30 AM to 8:59 AM | 0 (0.0%) | 0 (0.0%) |
| 9:00 AM to 9:59 AM | 0 (0.0%) | 8 (4.1%) |
| 10:00 AM to 10:59 AM | 0 (0.0%) | 0 (0.0%) |
| 11:00 AM to 11:59 AM | 0 (0.0%) | 0 (0.0%) |
| 12:00 PM to 3:59 PM | 0 (0.0%) | 0 (0.0%) |
| 4:00 PM to 11:59 PM | 0 (0.0%) | 7 (3.6%) |
| Total | 252 (100.0%) | 196 (100.0%) |
Housing Occupancy in Albany
Occupancy by Ownership in Albany
Of the total 389 dwellings in Albany, owner-occupied units account for 248 (63.7%), while renter-occupied units make up 141 (36.2%).
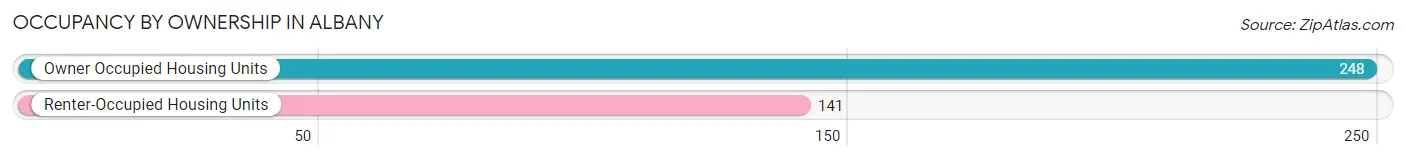
| Occupancy | # Housing Units | % Housing Units |
| Owner Occupied Housing Units | 248 | 63.7% |
| Renter-Occupied Housing Units | 141 | 36.2% |
| Total Occupied Housing Units | 389 | 100.0% |
Occupancy by Household Size in Albany
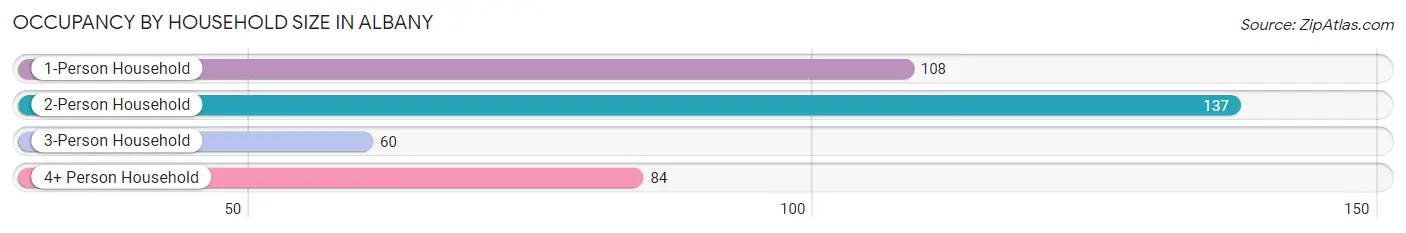
| Household Size | # Housing Units | % Housing Units |
| 1-Person Household | 108 | 27.8% |
| 2-Person Household | 137 | 35.2% |
| 3-Person Household | 60 | 15.4% |
| 4+ Person Household | 84 | 21.6% |
| Total Housing Units | 389 | 100.0% |
Occupancy by Ownership by Household Size in Albany
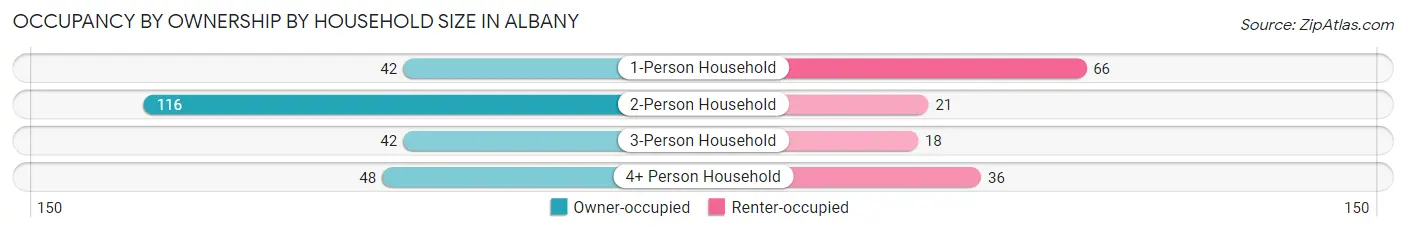
| Household Size | Owner-occupied | Renter-occupied |
| 1-Person Household | 42 (38.9%) | 66 (61.1%) |
| 2-Person Household | 116 (84.7%) | 21 (15.3%) |
| 3-Person Household | 42 (70.0%) | 18 (30.0%) |
| 4+ Person Household | 48 (57.1%) | 36 (42.9%) |
| Total Housing Units | 248 (63.7%) | 141 (36.2%) |
Occupancy by Educational Attainment in Albany
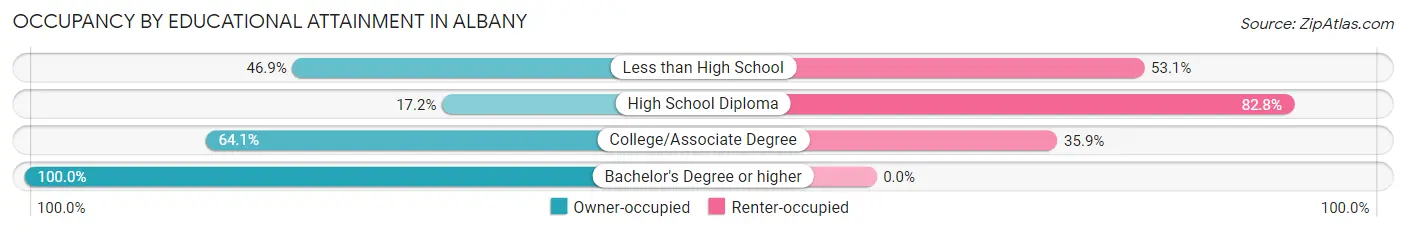
| Household Size | Owner-occupied | Renter-occupied |
| Less than High School | 15 (46.9%) | 17 (53.1%) |
| High School Diploma | 16 (17.2%) | 77 (82.8%) |
| College/Associate Degree | 84 (64.1%) | 47 (35.9%) |
| Bachelor's Degree or higher | 133 (100.0%) | 0 (0.0%) |
Occupancy by Age of Householder in Albany
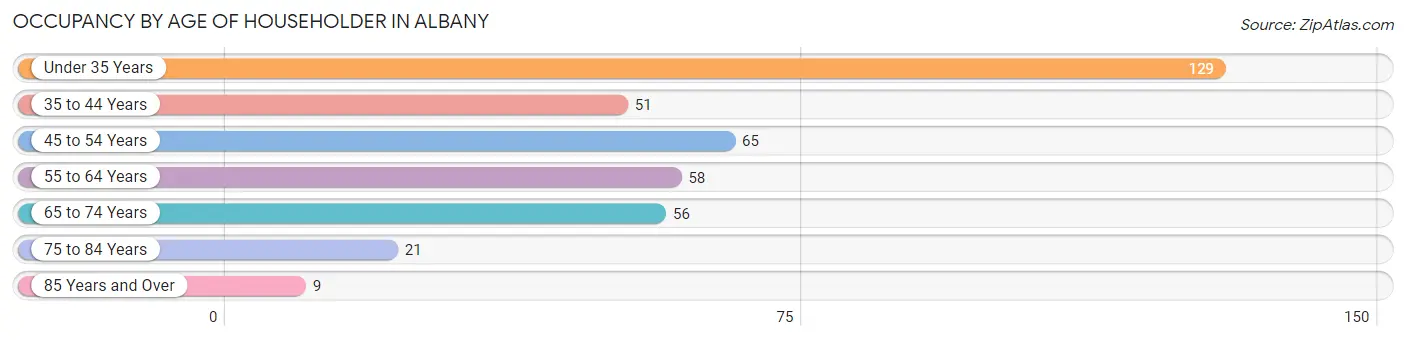
| Age Bracket | # Households | % Households |
| Under 35 Years | 129 | 33.2% |
| 35 to 44 Years | 51 | 13.1% |
| 45 to 54 Years | 65 | 16.7% |
| 55 to 64 Years | 58 | 14.9% |
| 65 to 74 Years | 56 | 14.4% |
| 75 to 84 Years | 21 | 5.4% |
| 85 Years and Over | 9 | 2.3% |
| Total | 389 | 100.0% |
Housing Finances in Albany
Median Income by Occupancy in Albany
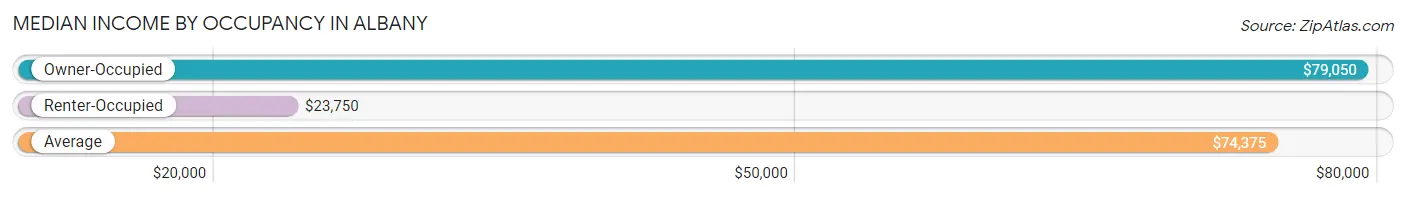
| Occupancy Type | # Households | Median Income |
| Owner-Occupied | 248 (63.7%) | $79,050 |
| Renter-Occupied | 141 (36.2%) | $23,750 |
| Average | 389 (100.0%) | $74,375 |
Occupancy by Householder Income Bracket in Albany
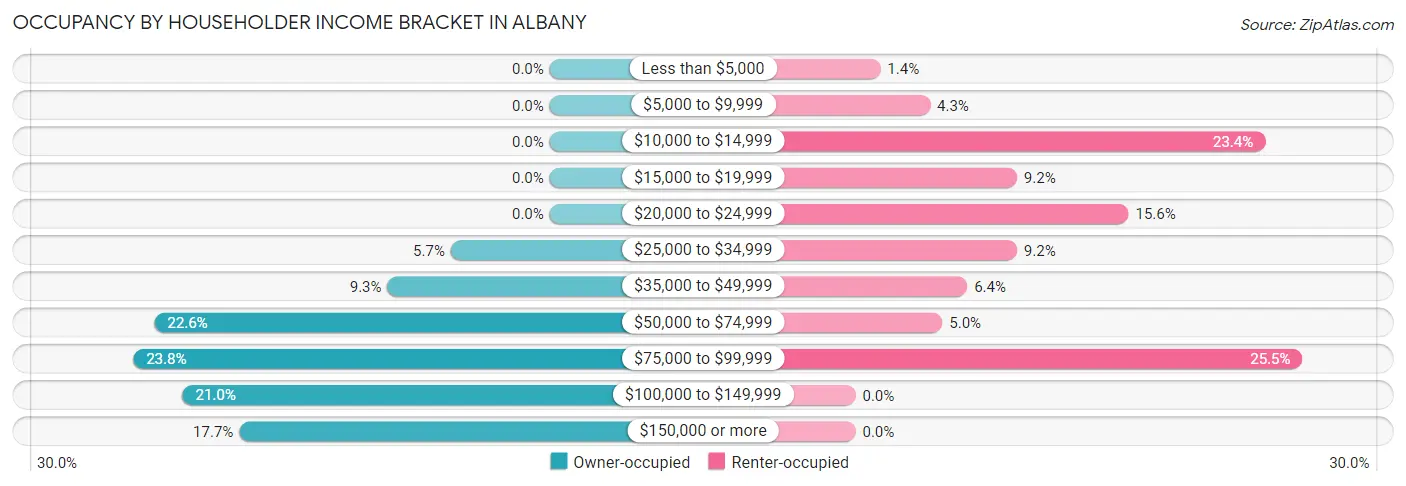
| Income Bracket | Owner-occupied | Renter-occupied |
| Less than $5,000 | 0 (0.0%) | 2 (1.4%) |
| $5,000 to $9,999 | 0 (0.0%) | 6 (4.3%) |
| $10,000 to $14,999 | 0 (0.0%) | 33 (23.4%) |
| $15,000 to $19,999 | 0 (0.0%) | 13 (9.2%) |
| $20,000 to $24,999 | 0 (0.0%) | 22 (15.6%) |
| $25,000 to $34,999 | 14 (5.7%) | 13 (9.2%) |
| $35,000 to $49,999 | 23 (9.3%) | 9 (6.4%) |
| $50,000 to $74,999 | 56 (22.6%) | 7 (5.0%) |
| $75,000 to $99,999 | 59 (23.8%) | 36 (25.5%) |
| $100,000 to $149,999 | 52 (21.0%) | 0 (0.0%) |
| $150,000 or more | 44 (17.7%) | 0 (0.0%) |
| Total | 248 (100.0%) | 141 (100.0%) |
Monthly Housing Cost Tiers in Albany
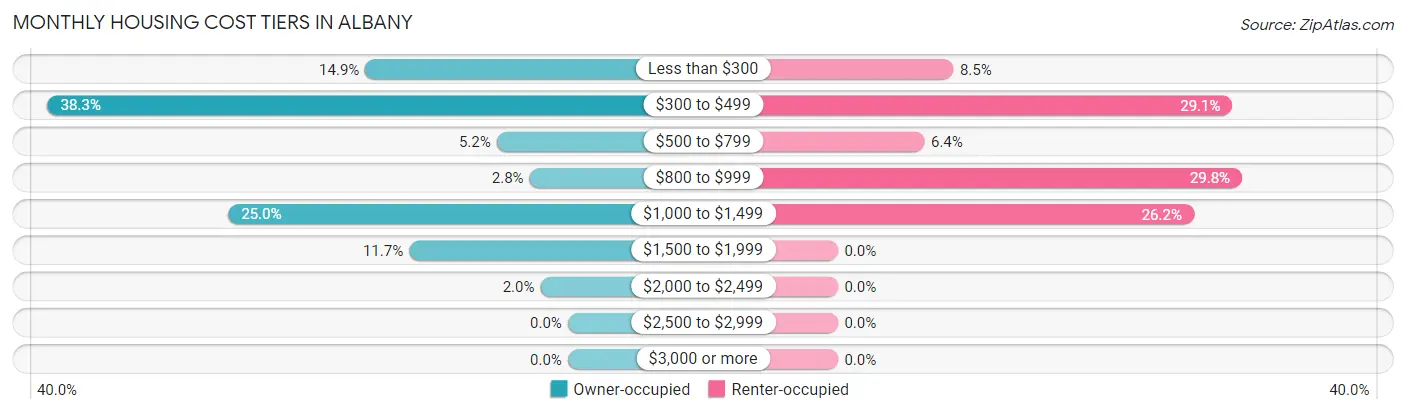
| Monthly Cost | Owner-occupied | Renter-occupied |
| Less than $300 | 37 (14.9%) | 12 (8.5%) |
| $300 to $499 | 95 (38.3%) | 41 (29.1%) |
| $500 to $799 | 13 (5.2%) | 9 (6.4%) |
| $800 to $999 | 7 (2.8%) | 42 (29.8%) |
| $1,000 to $1,499 | 62 (25.0%) | 37 (26.2%) |
| $1,500 to $1,999 | 29 (11.7%) | 0 (0.0%) |
| $2,000 to $2,499 | 5 (2.0%) | 0 (0.0%) |
| $2,500 to $2,999 | 0 (0.0%) | 0 (0.0%) |
| $3,000 or more | 0 (0.0%) | 0 (0.0%) |
| Total | 248 (100.0%) | 141 (100.0%) |
Physical Housing Characteristics in Albany
Housing Structures in Albany
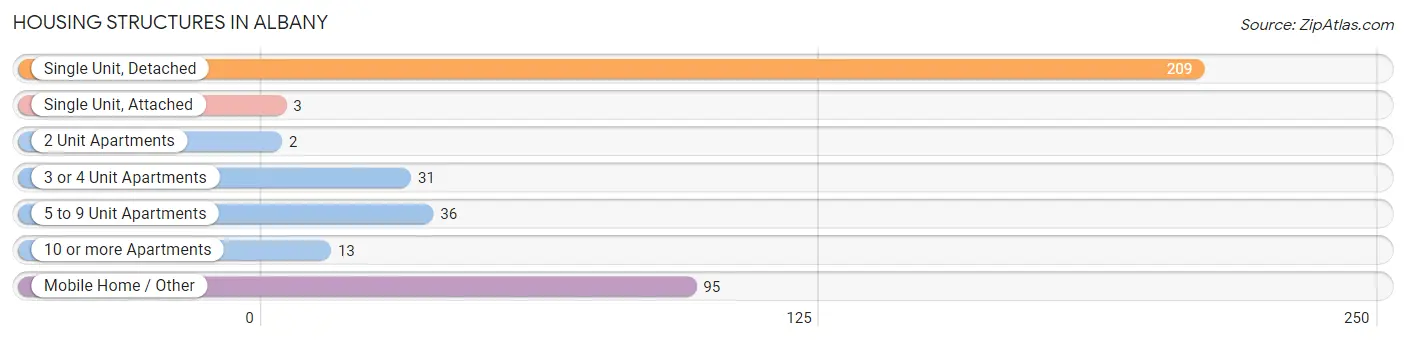
| Structure Type | # Housing Units | % Housing Units |
| Single Unit, Detached | 209 | 53.7% |
| Single Unit, Attached | 3 | 0.8% |
| 2 Unit Apartments | 2 | 0.5% |
| 3 or 4 Unit Apartments | 31 | 8.0% |
| 5 to 9 Unit Apartments | 36 | 9.2% |
| 10 or more Apartments | 13 | 3.3% |
| Mobile Home / Other | 95 | 24.4% |
| Total | 389 | 100.0% |
Housing Structures by Occupancy in Albany
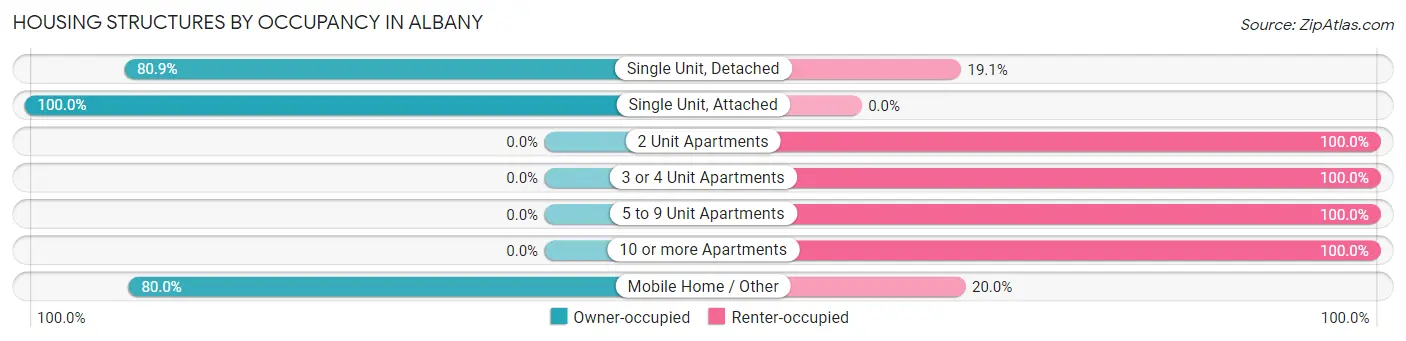
| Structure Type | Owner-occupied | Renter-occupied |
| Single Unit, Detached | 169 (80.9%) | 40 (19.1%) |
| Single Unit, Attached | 3 (100.0%) | 0 (0.0%) |
| 2 Unit Apartments | 0 (0.0%) | 2 (100.0%) |
| 3 or 4 Unit Apartments | 0 (0.0%) | 31 (100.0%) |
| 5 to 9 Unit Apartments | 0 (0.0%) | 36 (100.0%) |
| 10 or more Apartments | 0 (0.0%) | 13 (100.0%) |
| Mobile Home / Other | 76 (80.0%) | 19 (20.0%) |
| Total | 248 (63.7%) | 141 (36.2%) |
Housing Structures by Number of Rooms in Albany
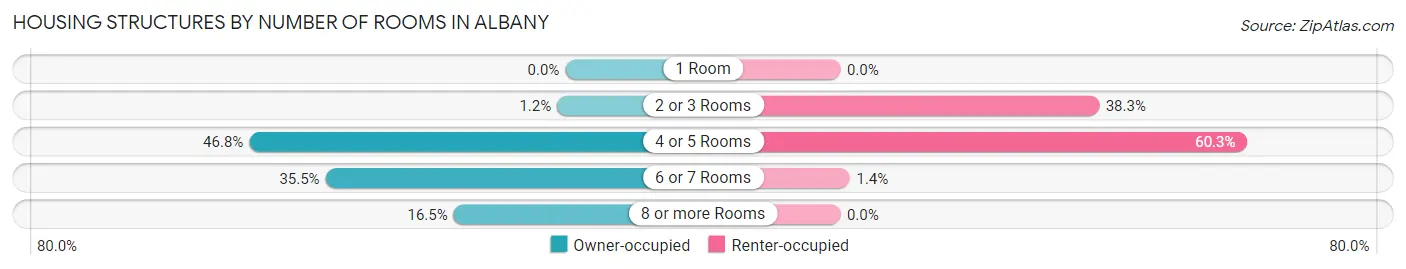
| Number of Rooms | Owner-occupied | Renter-occupied |
| 1 Room | 0 (0.0%) | 0 (0.0%) |
| 2 or 3 Rooms | 3 (1.2%) | 54 (38.3%) |
| 4 or 5 Rooms | 116 (46.8%) | 85 (60.3%) |
| 6 or 7 Rooms | 88 (35.5%) | 2 (1.4%) |
| 8 or more Rooms | 41 (16.5%) | 0 (0.0%) |
| Total | 248 (100.0%) | 141 (100.0%) |
Housing Structure by Heating Type in Albany
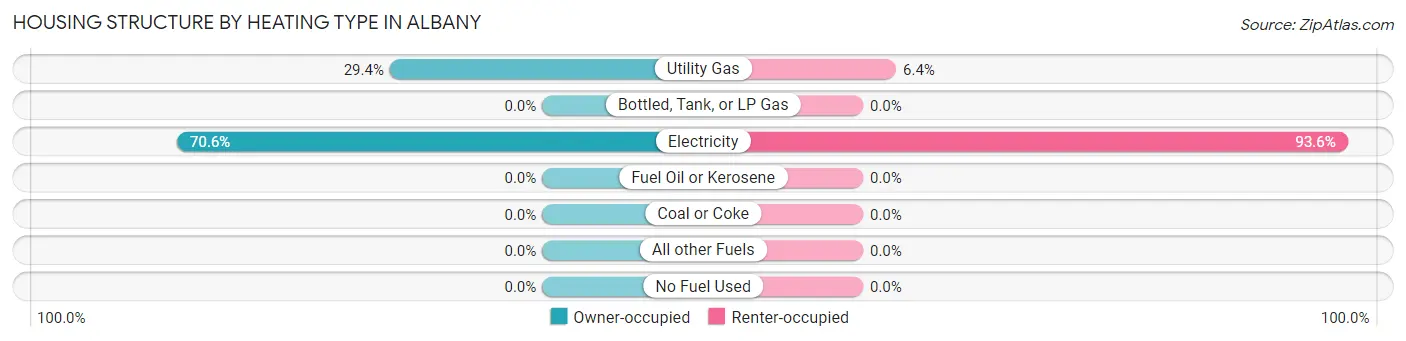
| Heating Type | Owner-occupied | Renter-occupied |
| Utility Gas | 73 (29.4%) | 9 (6.4%) |
| Bottled, Tank, or LP Gas | 0 (0.0%) | 0 (0.0%) |
| Electricity | 175 (70.6%) | 132 (93.6%) |
| Fuel Oil or Kerosene | 0 (0.0%) | 0 (0.0%) |
| Coal or Coke | 0 (0.0%) | 0 (0.0%) |
| All other Fuels | 0 (0.0%) | 0 (0.0%) |
| No Fuel Used | 0 (0.0%) | 0 (0.0%) |
| Total | 248 (100.0%) | 141 (100.0%) |
Household Vehicle Usage in Albany
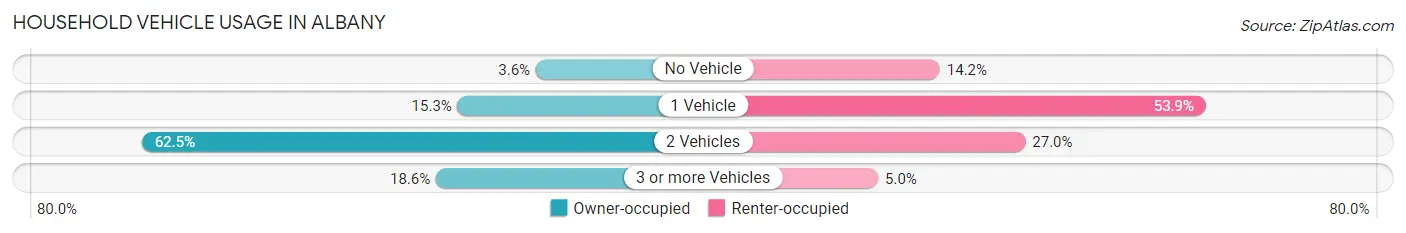
| Vehicles per Household | Owner-occupied | Renter-occupied |
| No Vehicle | 9 (3.6%) | 20 (14.2%) |
| 1 Vehicle | 38 (15.3%) | 76 (53.9%) |
| 2 Vehicles | 155 (62.5%) | 38 (27.0%) |
| 3 or more Vehicles | 46 (18.5%) | 7 (5.0%) |
| Total | 248 (100.0%) | 141 (100.0%) |
Real Estate & Mortgages in Albany
Real Estate and Mortgage Overview in Albany
| Characteristic | Without Mortgage | With Mortgage |
| Housing Units | 137 | 111 |
| Median Property Value | $136,400 | $205,800 |
| Median Household Income | $78,175 | $26 |
| Monthly Housing Costs | $329 | $0 |
| Real Estate Taxes | - | - |
Property Value by Mortgage Status in Albany
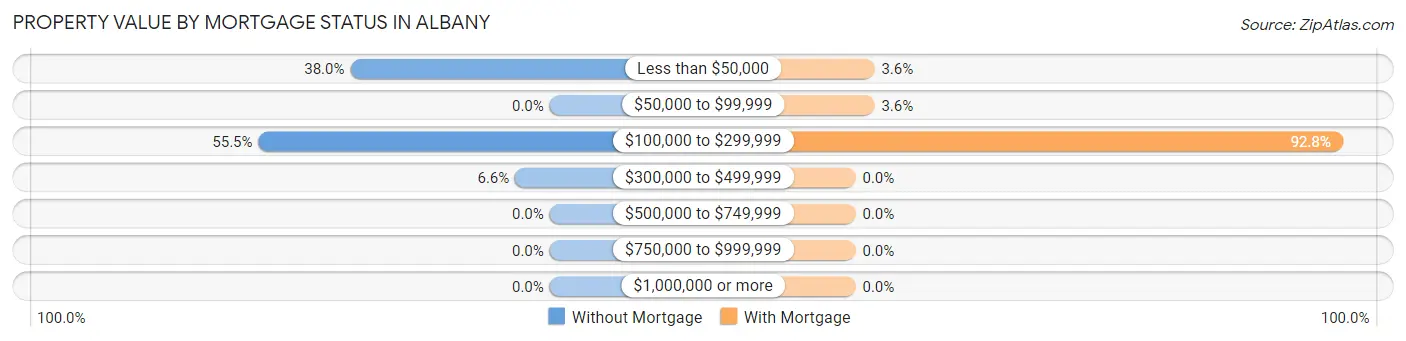
| Property Value | Without Mortgage | With Mortgage |
| Less than $50,000 | 52 (38.0%) | 4 (3.6%) |
| $50,000 to $99,999 | 0 (0.0%) | 4 (3.6%) |
| $100,000 to $299,999 | 76 (55.5%) | 103 (92.8%) |
| $300,000 to $499,999 | 9 (6.6%) | 0 (0.0%) |
| $500,000 to $749,999 | 0 (0.0%) | 0 (0.0%) |
| $750,000 to $999,999 | 0 (0.0%) | 0 (0.0%) |
| $1,000,000 or more | 0 (0.0%) | 0 (0.0%) |
| Total | 137 (100.0%) | 111 (100.0%) |
Household Income by Mortgage Status in Albany
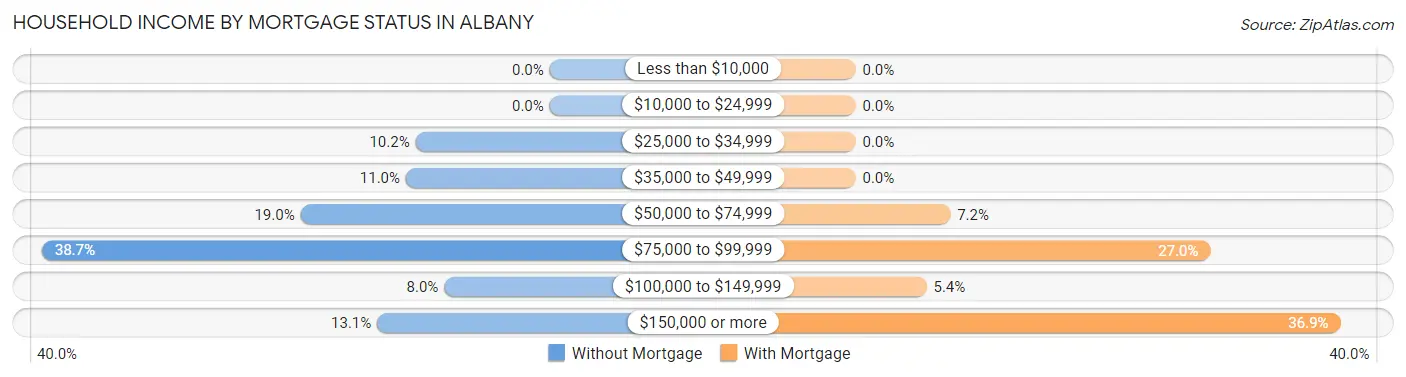
| Household Income | Without Mortgage | With Mortgage |
| Less than $10,000 | 0 (0.0%) | 0 (0.0%) |
| $10,000 to $24,999 | 0 (0.0%) | 0 (0.0%) |
| $25,000 to $34,999 | 14 (10.2%) | 0 (0.0%) |
| $35,000 to $49,999 | 15 (11.0%) | 0 (0.0%) |
| $50,000 to $74,999 | 26 (19.0%) | 8 (7.2%) |
| $75,000 to $99,999 | 53 (38.7%) | 30 (27.0%) |
| $100,000 to $149,999 | 11 (8.0%) | 6 (5.4%) |
| $150,000 or more | 18 (13.1%) | 41 (36.9%) |
| Total | 137 (100.0%) | 111 (100.0%) |
Property Value to Household Income Ratio in Albany
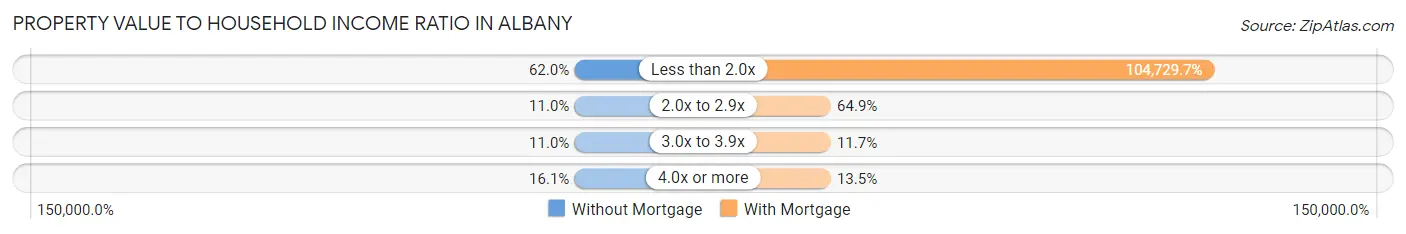
| Value-to-Income Ratio | Without Mortgage | With Mortgage |
| Less than 2.0x | 85 (62.0%) | 116,250 (104,729.7%) |
| 2.0x to 2.9x | 15 (11.0%) | 72 (64.9%) |
| 3.0x to 3.9x | 15 (11.0%) | 13 (11.7%) |
| 4.0x or more | 22 (16.1%) | 15 (13.5%) |
| Total | 137 (100.0%) | 111 (100.0%) |
Real Estate Taxes by Mortgage Status in Albany
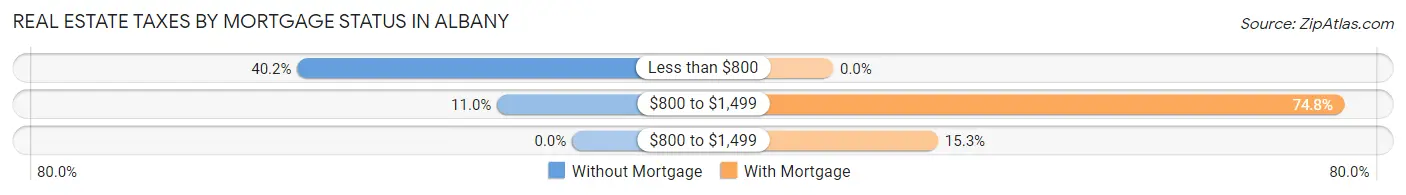
| Property Taxes | Without Mortgage | With Mortgage |
| Less than $800 | 55 (40.2%) | 0 (0.0%) |
| $800 to $1,499 | 15 (11.0%) | 83 (74.8%) |
| $800 to $1,499 | 0 (0.0%) | 17 (15.3%) |
| Total | 137 (100.0%) | 111 (100.0%) |
Health & Disability in Albany
Health Insurance Coverage by Age in Albany
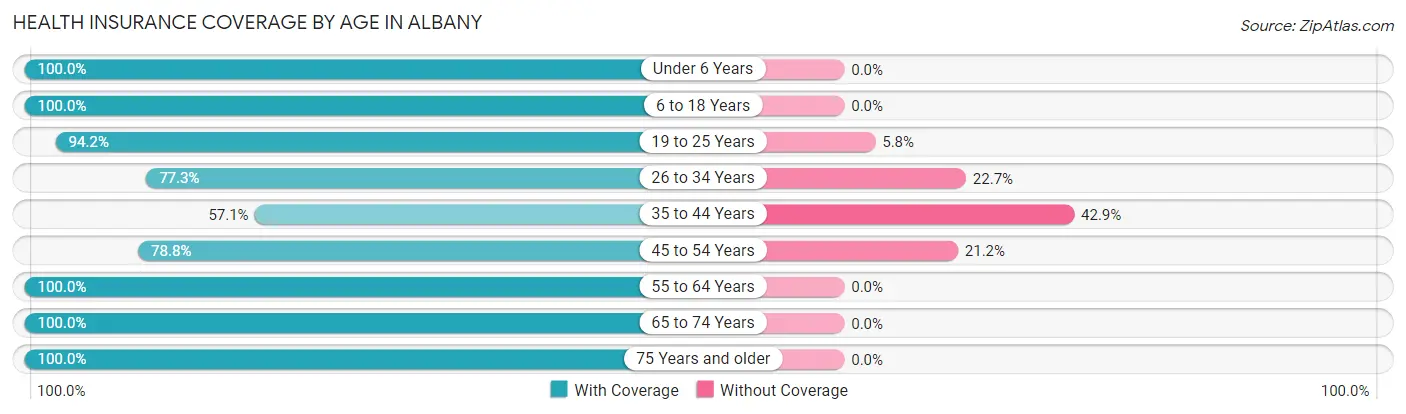
| Age Bracket | With Coverage | Without Coverage |
| Under 6 Years | 128 (100.0%) | 0 (0.0%) |
| 6 to 18 Years | 209 (100.0%) | 0 (0.0%) |
| 19 to 25 Years | 163 (94.2%) | 10 (5.8%) |
| 26 to 34 Years | 150 (77.3%) | 44 (22.7%) |
| 35 to 44 Years | 64 (57.1%) | 48 (42.9%) |
| 45 to 54 Years | 67 (78.8%) | 18 (21.2%) |
| 55 to 64 Years | 114 (100.0%) | 0 (0.0%) |
| 65 to 74 Years | 89 (100.0%) | 0 (0.0%) |
| 75 Years and older | 36 (100.0%) | 0 (0.0%) |
| Total | 1,020 (89.5%) | 120 (10.5%) |
Health Insurance Coverage by Citizenship Status in Albany
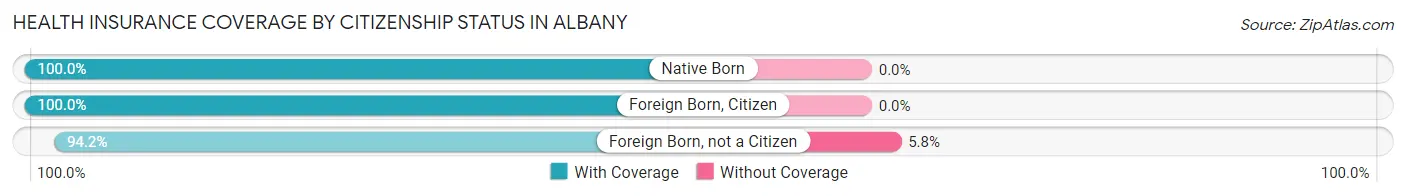
| Citizenship Status | With Coverage | Without Coverage |
| Native Born | 128 (100.0%) | 0 (0.0%) |
| Foreign Born, Citizen | 209 (100.0%) | 0 (0.0%) |
| Foreign Born, not a Citizen | 163 (94.2%) | 10 (5.8%) |
Health Insurance Coverage by Household Income in Albany
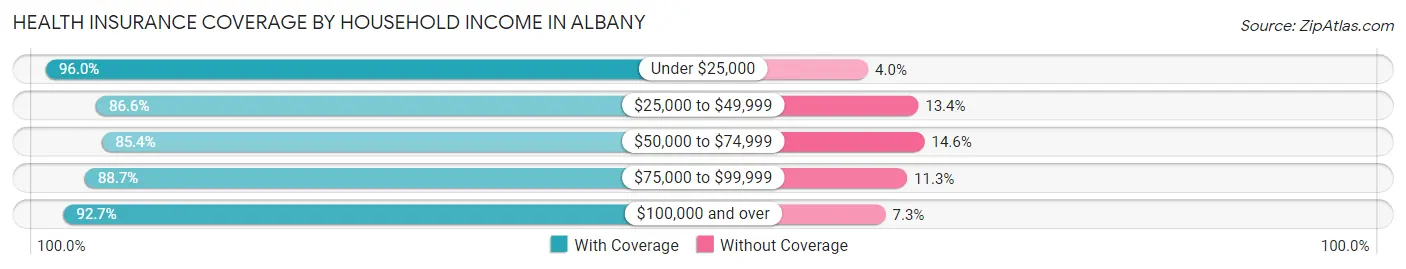
| Household Income | With Coverage | Without Coverage |
| Under $25,000 | 120 (96.0%) | 5 (4.0%) |
| $25,000 to $49,999 | 84 (86.6%) | 13 (13.4%) |
| $50,000 to $74,999 | 258 (85.4%) | 44 (14.6%) |
| $75,000 to $99,999 | 290 (88.7%) | 37 (11.3%) |
| $100,000 and over | 268 (92.7%) | 21 (7.3%) |
Public vs Private Health Insurance Coverage by Age in Albany
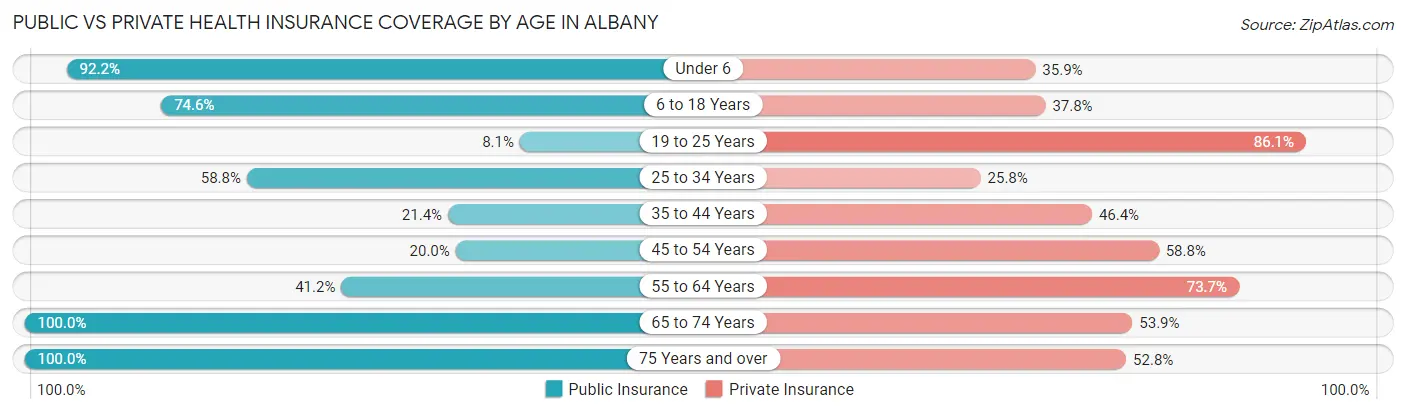
| Age Bracket | Public Insurance | Private Insurance |
| Under 6 | 118 (92.2%) | 46 (35.9%) |
| 6 to 18 Years | 156 (74.6%) | 79 (37.8%) |
| 19 to 25 Years | 14 (8.1%) | 149 (86.1%) |
| 25 to 34 Years | 114 (58.8%) | 50 (25.8%) |
| 35 to 44 Years | 24 (21.4%) | 52 (46.4%) |
| 45 to 54 Years | 17 (20.0%) | 50 (58.8%) |
| 55 to 64 Years | 47 (41.2%) | 84 (73.7%) |
| 65 to 74 Years | 89 (100.0%) | 48 (53.9%) |
| 75 Years and over | 36 (100.0%) | 19 (52.8%) |
| Total | 615 (53.9%) | 577 (50.6%) |
Disability Status by Sex by Age in Albany
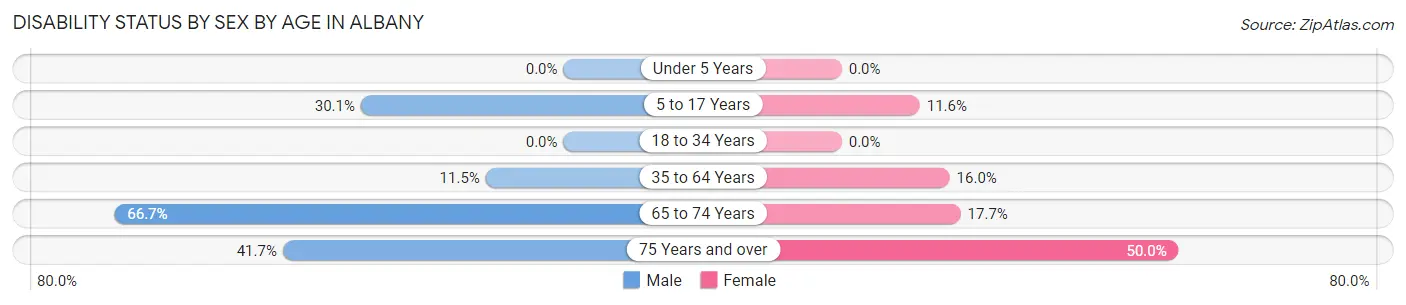
| Age Bracket | Male | Female |
| Under 5 Years | 0 (0.0%) | 0 (0.0%) |
| 5 to 17 Years | 40 (30.1%) | 11 (11.6%) |
| 18 to 34 Years | 0 (0.0%) | 0 (0.0%) |
| 35 to 64 Years | 15 (11.5%) | 29 (16.0%) |
| 65 to 74 Years | 14 (66.7%) | 12 (17.6%) |
| 75 Years and over | 10 (41.7%) | 6 (50.0%) |
Disability Class by Sex by Age in Albany
Disability Class: Hearing Difficulty
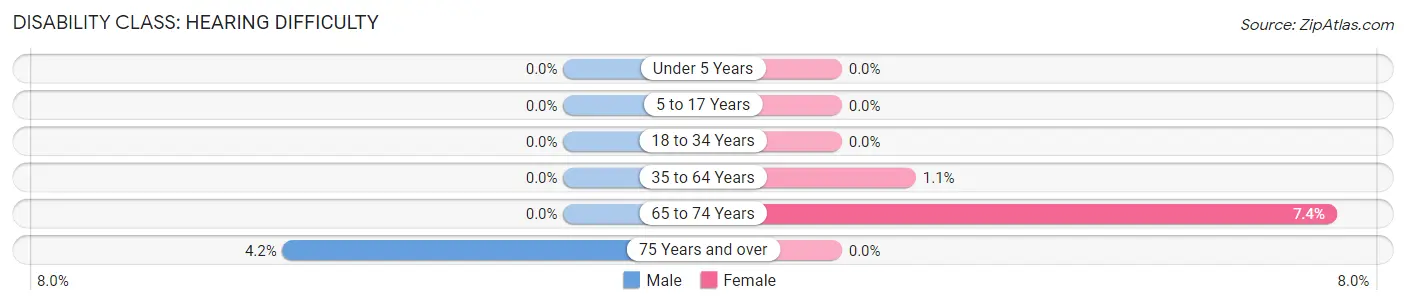
| Age Bracket | Male | Female |
| Under 5 Years | 0 (0.0%) | 0 (0.0%) |
| 5 to 17 Years | 0 (0.0%) | 0 (0.0%) |
| 18 to 34 Years | 0 (0.0%) | 0 (0.0%) |
| 35 to 64 Years | 0 (0.0%) | 2 (1.1%) |
| 65 to 74 Years | 0 (0.0%) | 5 (7.3%) |
| 75 Years and over | 1 (4.2%) | 0 (0.0%) |
Disability Class: Vision Difficulty
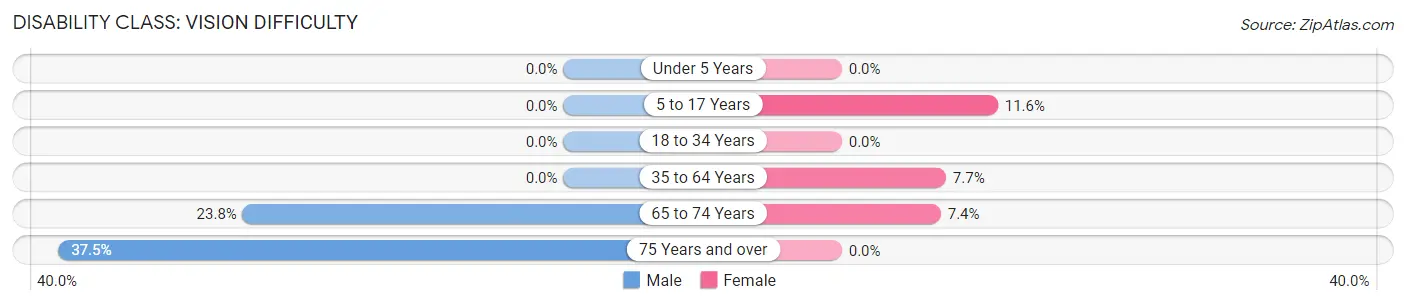
| Age Bracket | Male | Female |
| Under 5 Years | 0 (0.0%) | 0 (0.0%) |
| 5 to 17 Years | 0 (0.0%) | 11 (11.6%) |
| 18 to 34 Years | 0 (0.0%) | 0 (0.0%) |
| 35 to 64 Years | 0 (0.0%) | 14 (7.7%) |
| 65 to 74 Years | 5 (23.8%) | 5 (7.3%) |
| 75 Years and over | 9 (37.5%) | 0 (0.0%) |
Disability Class: Cognitive Difficulty
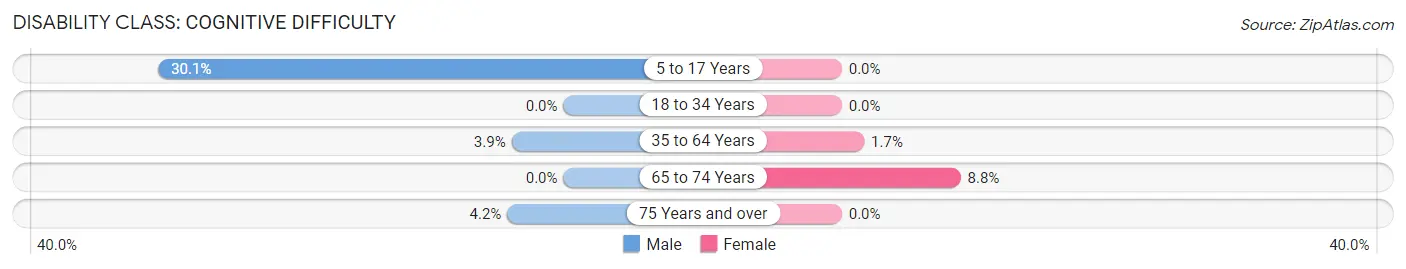
| Age Bracket | Male | Female |
| 5 to 17 Years | 40 (30.1%) | 0 (0.0%) |
| 18 to 34 Years | 0 (0.0%) | 0 (0.0%) |
| 35 to 64 Years | 5 (3.8%) | 3 (1.7%) |
| 65 to 74 Years | 0 (0.0%) | 6 (8.8%) |
| 75 Years and over | 1 (4.2%) | 0 (0.0%) |
Disability Class: Ambulatory Difficulty
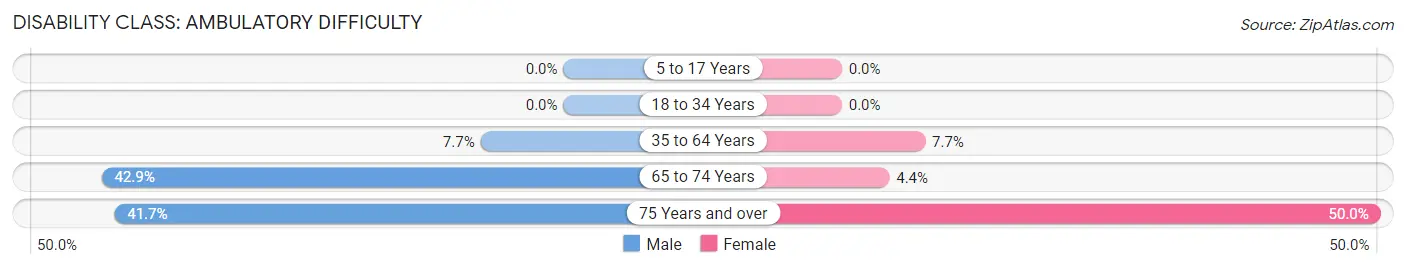
| Age Bracket | Male | Female |
| 5 to 17 Years | 0 (0.0%) | 0 (0.0%) |
| 18 to 34 Years | 0 (0.0%) | 0 (0.0%) |
| 35 to 64 Years | 10 (7.7%) | 14 (7.7%) |
| 65 to 74 Years | 9 (42.9%) | 3 (4.4%) |
| 75 Years and over | 10 (41.7%) | 6 (50.0%) |
Disability Class: Self-Care Difficulty
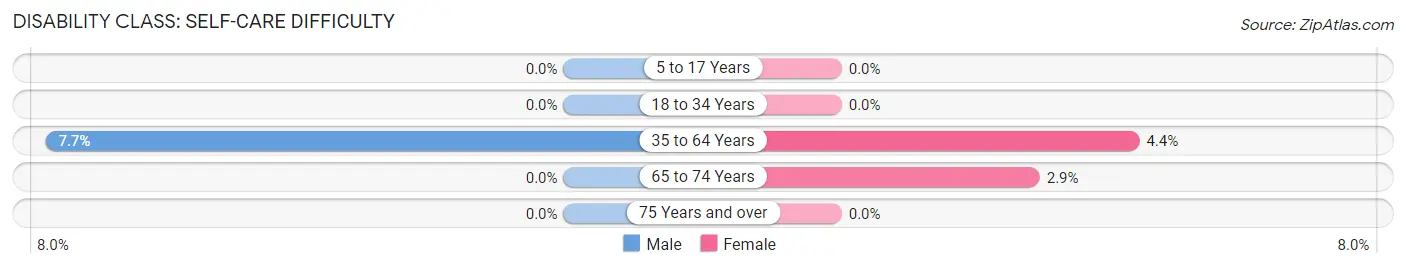
| Age Bracket | Male | Female |
| 5 to 17 Years | 0 (0.0%) | 0 (0.0%) |
| 18 to 34 Years | 0 (0.0%) | 0 (0.0%) |
| 35 to 64 Years | 10 (7.7%) | 8 (4.4%) |
| 65 to 74 Years | 0 (0.0%) | 2 (2.9%) |
| 75 Years and over | 0 (0.0%) | 0 (0.0%) |
Technology Access in Albany
Computing Device Access in Albany
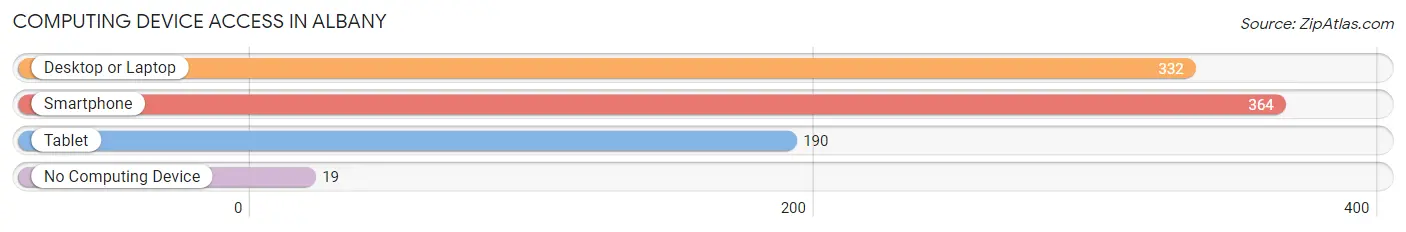
| Device Type | # Households | % Households |
| Desktop or Laptop | 332 | 85.4% |
| Smartphone | 364 | 93.6% |
| Tablet | 190 | 48.8% |
| No Computing Device | 19 | 4.9% |
| Total | 389 | 100.0% |
Internet Access in Albany
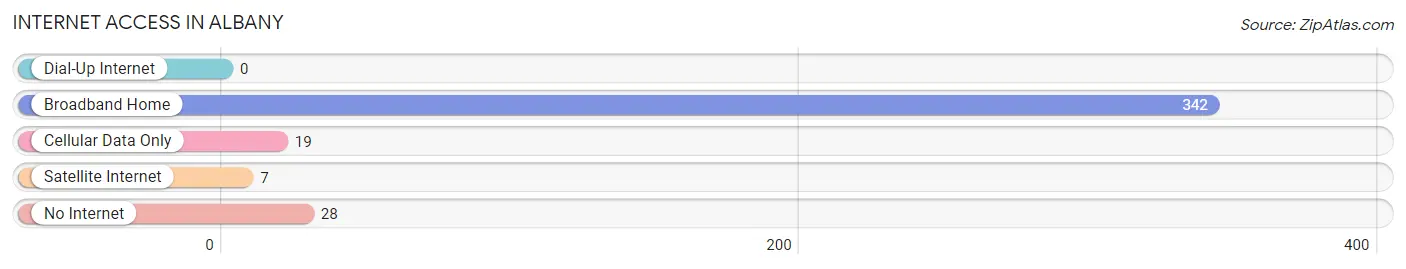
| Internet Type | # Households | % Households |
| Dial-Up Internet | 0 | 0.0% |
| Broadband Home | 342 | 87.9% |
| Cellular Data Only | 19 | 4.9% |
| Satellite Internet | 7 | 1.8% |
| No Internet | 28 | 7.2% |
| Total | 389 | 100.0% |
Albany Summary
Albany is a small town located in the state of Louisiana, United States. It is situated in the northern part of the state, in the parish of Jackson. The town has a population of approximately 1,000 people and is located in a rural area.
Geography
Albany is located in the northern part of Louisiana, in the parish of Jackson. It is situated in a rural area, surrounded by forests and farmland. The town is located on the banks of the Ouachita River, which is a tributary of the Mississippi River. The town is located at an elevation of approximately 200 feet above sea level. The climate in Albany is humid subtropical, with hot summers and mild winters.
Economy
Albany’s economy is largely based on agriculture and forestry. The town is home to several farms, which produce a variety of crops, including corn, soybeans, cotton, and wheat. The town is also home to several timber companies, which harvest timber from the surrounding forests. In addition, Albany is home to several small businesses, including restaurants, convenience stores, and gas stations.
Demographics
As of the 2010 census, Albany had a population of 1,000 people. The racial makeup of the town was 95.2% White, 0.7% African American, 0.3% Native American, 0.2% Asian, 0.1% Pacific Islander, and 3.6% from other races. The median household income in Albany was $30,000, and the median family income was $35,000.
History
Albany was founded in 1845 by a group of settlers from the nearby town of Jackson. The town was named after the city of Albany, New York. The town grew slowly over the years, and by the early 1900s, it had become a thriving agricultural community. In the 1950s, the town began to experience a decline in population, as many of its residents moved away in search of better economic opportunities. In recent years, the town has seen a resurgence in population, as many people have moved back to the area in search of a rural lifestyle.
Albany is a small town with a rich history and a bright future. It is a great place to live, work, and raise a family. The town is home to a variety of businesses, and its residents enjoy a peaceful, rural lifestyle. With its close proximity to the Ouachita River, Albany is a great place to enjoy outdoor activities such as fishing, boating, and camping.
Common Questions
What is Per Capita Income in Albany?
Per Capita income in Albany is $28,711.
What is the Median Family Income in Albany?
Median Family Income in Albany is $79,850.
What is the Median Household income in Albany?
Median Household Income in Albany is $74,375.
What is Income or Wage Gap in Albany?
Income or Wage Gap in Albany is 9.8%.
Women in Albany earn 90.2 cents for every dollar earned by a man.
What is Inequality or Gini Index in Albany?
Inequality or Gini Index in Albany is 0.39.
What is the Total Population of Albany?
Total Population of Albany is 1,140.
What is the Total Male Population of Albany?
Total Male Population of Albany is 485.
What is the Total Female Population of Albany?
Total Female Population of Albany is 655.
What is the Ratio of Males per 100 Females in Albany?
There are 74.05 Males per 100 Females in Albany.
What is the Ratio of Females per 100 Males in Albany?
There are 135.05 Females per 100 Males in Albany.
What is the Median Population Age in Albany?
Median Population Age in Albany is 29.3 Years.
What is the Average Family Size in Albany
Average Family Size in Albany is 3.6 People.
What is the Average Household Size in Albany
Average Household Size in Albany is 2.9 People.
How Large is the Labor Force in Albany?
There are 474 People in the Labor Forcein in Albany.
What is the Percentage of People in the Labor Force in Albany?
56.0% of People are in the Labor Force in Albany.
What is the Unemployment Rate in Albany?
Unemployment Rate in Albany is 1.1%.