Zip Codes with the Highest Percentage of Population Employed in Arts, Entertainment & Recreation in Kansas
RELATED REPORTS & OPTIONS
Arts, Entertainment & Recreation
Kansas
Compare Zip Codes
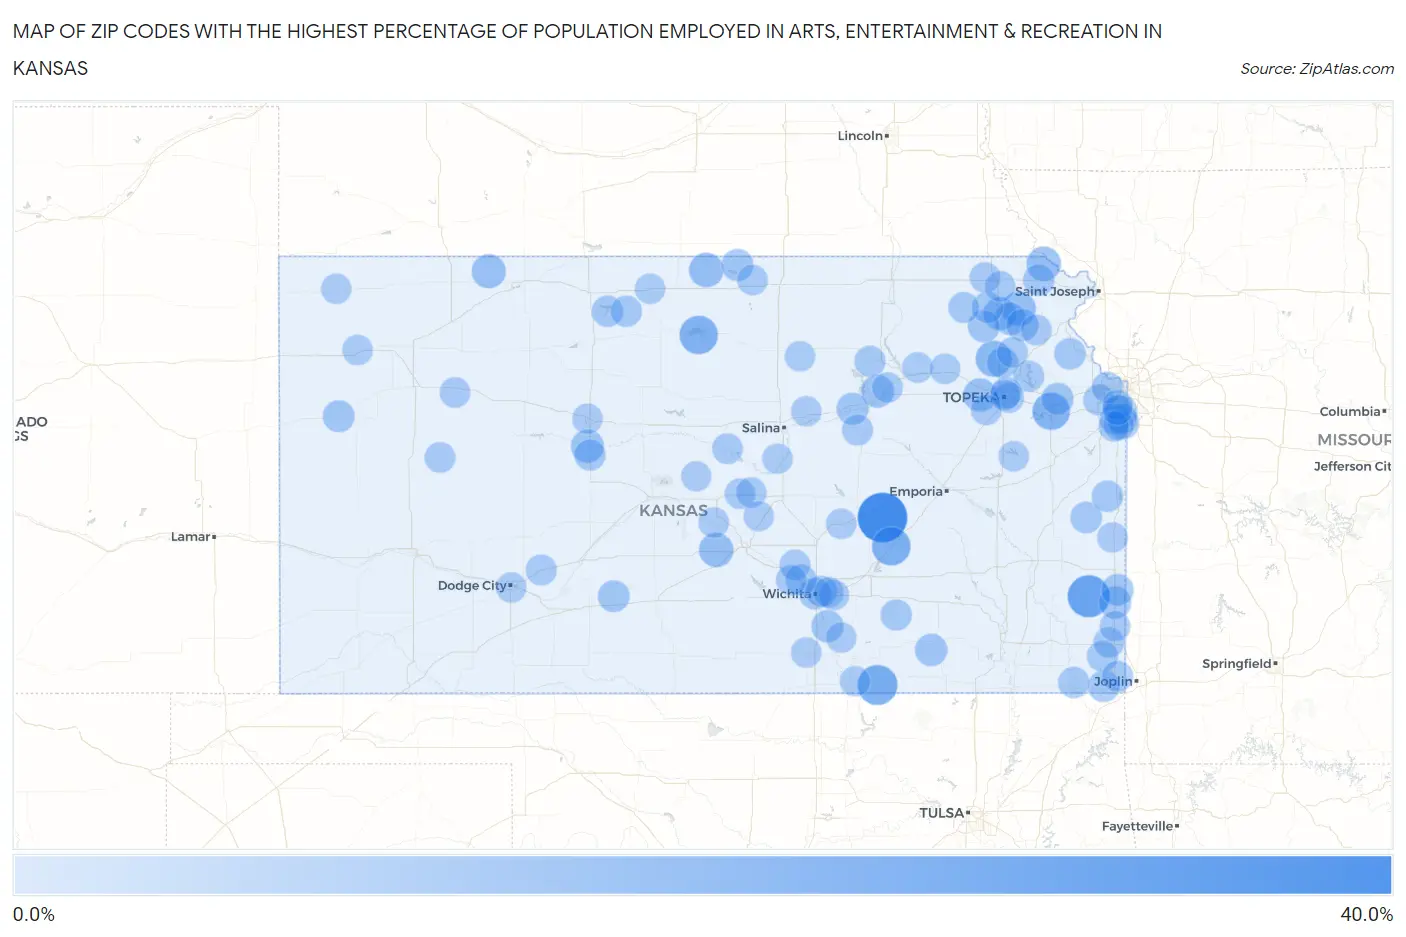
Map of Zip Codes with the Highest Percentage of Population Employed in Arts, Entertainment & Recreation in Kansas
0.0%
40.0%
Zip Codes with the Highest Percentage of Population Employed in Arts, Entertainment & Recreation in Kansas
| Zip Code | % Employed | vs State | vs National | |
| 1. | 66843 | 35.5% | 1.7%(+33.7)#1 | 2.1%(+33.4)#62 |
| 2. | 66746 | 22.6% | 1.7%(+20.8)#2 | 2.1%(+20.5)#142 |
| 3. | 67102 | 18.5% | 1.7%(+16.8)#3 | 2.1%(+16.4)#223 |
| 4. | 66842 | 16.2% | 1.7%(+14.5)#4 | 2.1%(+14.1)#280 |
| 5. | 67446 | 15.8% | 1.7%(+14.1)#5 | 2.1%(+13.7)#301 |
| 6. | 66045 | 14.5% | 1.7%(+12.8)#6 | 2.1%(+12.4)#361 |
| 7. | 66509 | 12.2% | 1.7%(+10.5)#7 | 2.1%(+10.1)#491 |
| 8. | 67510 | 9.3% | 1.7%(+7.56)#8 | 2.1%(+7.22)#807 |
| 9. | 66936 | 9.2% | 1.7%(+7.50)#9 | 2.1%(+7.16)#815 |
| 10. | 66094 | 9.1% | 1.7%(+7.39)#10 | 2.1%(+7.06)#830 |
| 11. | 66439 | 9.0% | 1.7%(+7.29)#11 | 2.1%(+6.95)#851 |
| 12. | 67653 | 8.5% | 1.7%(+6.75)#12 | 2.1%(+6.41)#941 |
| 13. | 66615 | 7.7% | 1.7%(+5.93)#13 | 2.1%(+5.59)#1,140 |
| 14. | 66516 | 7.0% | 1.7%(+5.24)#14 | 2.1%(+4.91)#1,336 |
| 15. | 67667 | 7.0% | 1.7%(+5.23)#15 | 2.1%(+4.89)#1,342 |
| 16. | 66442 | 6.5% | 1.7%(+4.75)#16 | 2.1%(+4.41)#1,507 |
| 17. | 66552 | 6.0% | 1.7%(+4.27)#17 | 2.1%(+3.94)#1,696 |
| 18. | 66711 | 5.8% | 1.7%(+4.09)#18 | 2.1%(+3.75)#1,783 |
| 19. | 67353 | 5.8% | 1.7%(+4.02)#19 | 2.1%(+3.69)#1,822 |
| 20. | 67110 | 5.5% | 1.7%(+3.77)#20 | 2.1%(+3.44)#1,954 |
| 21. | 66058 | 5.4% | 1.7%(+3.66)#21 | 2.1%(+3.32)#2,016 |
| 22. | 66207 | 5.3% | 1.7%(+3.55)#22 | 2.1%(+3.21)#2,083 |
| 23. | 66970 | 5.3% | 1.7%(+3.52)#23 | 2.1%(+3.18)#2,109 |
| 24. | 67431 | 5.2% | 1.7%(+3.48)#24 | 2.1%(+3.14)#2,136 |
| 25. | 66741 | 5.2% | 1.7%(+3.47)#25 | 2.1%(+3.13)#2,145 |
| 26. | 66044 | 5.1% | 1.7%(+3.33)#26 | 2.1%(+3.00)#2,233 |
| 27. | 67761 | 5.0% | 1.7%(+3.30)#27 | 2.1%(+2.96)#2,257 |
| 28. | 66416 | 5.0% | 1.7%(+3.25)#28 | 2.1%(+2.92)#2,287 |
| 29. | 67059 | 4.8% | 1.7%(+3.04)#29 | 2.1%(+2.71)#2,450 |
| 30. | 66713 | 4.6% | 1.7%(+2.90)#30 | 2.1%(+2.56)#2,584 |
| 31. | 66014 | 4.5% | 1.7%(+2.78)#31 | 2.1%(+2.44)#2,710 |
| 32. | 66532 | 4.3% | 1.7%(+2.59)#32 | 2.1%(+2.25)#2,925 |
| 33. | 67202 | 4.2% | 1.7%(+2.48)#33 | 2.1%(+2.15)#3,043 |
| 34. | 66020 | 4.2% | 1.7%(+2.48)#34 | 2.1%(+2.14)#3,053 |
| 35. | 66040 | 4.1% | 1.7%(+2.39)#35 | 2.1%(+2.05)#3,166 |
| 36. | 67644 | 4.1% | 1.7%(+2.31)#36 | 2.1%(+1.97)#3,264 |
| 37. | 66440 | 4.0% | 1.7%(+2.27)#37 | 2.1%(+1.93)#3,315 |
| 38. | 67072 | 4.0% | 1.7%(+2.25)#38 | 2.1%(+1.92)#3,338 |
| 39. | 67553 | 4.0% | 1.7%(+2.25)#39 | 2.1%(+1.92)#3,343 |
| 40. | 67336 | 4.0% | 1.7%(+2.22)#40 | 2.1%(+1.88)#3,384 |
| 41. | 67628 | 3.9% | 1.7%(+2.15)#41 | 2.1%(+1.81)#3,491 |
| 42. | 66550 | 3.8% | 1.7%(+2.08)#42 | 2.1%(+1.75)#3,582 |
| 43. | 66773 | 3.7% | 1.7%(+1.96)#43 | 2.1%(+1.62)#3,769 |
| 44. | 66226 | 3.7% | 1.7%(+1.95)#44 | 2.1%(+1.61)#3,786 |
| 45. | 67208 | 3.6% | 1.7%(+1.89)#45 | 2.1%(+1.56)#3,878 |
| 46. | 66531 | 3.6% | 1.7%(+1.85)#46 | 2.1%(+1.52)#3,954 |
| 47. | 66070 | 3.6% | 1.7%(+1.85)#47 | 2.1%(+1.51)#3,964 |
| 48. | 66112 | 3.5% | 1.7%(+1.72)#48 | 2.1%(+1.38)#4,216 |
| 49. | 67101 | 3.5% | 1.7%(+1.72)#49 | 2.1%(+1.38)#4,217 |
| 50. | 66739 | 3.4% | 1.7%(+1.66)#50 | 2.1%(+1.32)#4,343 |
| 51. | 66608 | 3.4% | 1.7%(+1.65)#51 | 2.1%(+1.32)#4,352 |
| 52. | 66417 | 3.4% | 1.7%(+1.64)#52 | 2.1%(+1.31)#4,381 |
| 53. | 67492 | 3.4% | 1.7%(+1.62)#53 | 2.1%(+1.29)#4,425 |
| 54. | 67876 | 3.3% | 1.7%(+1.57)#54 | 2.1%(+1.23)#4,546 |
| 55. | 66762 | 3.3% | 1.7%(+1.54)#55 | 2.1%(+1.20)#4,600 |
| 56. | 66535 | 3.2% | 1.7%(+1.46)#56 | 2.1%(+1.12)#4,786 |
| 57. | 66607 | 3.2% | 1.7%(+1.41)#57 | 2.1%(+1.07)#4,911 |
| 58. | 67850 | 3.1% | 1.7%(+1.39)#58 | 2.1%(+1.05)#4,966 |
| 59. | 66023 | 3.1% | 1.7%(+1.39)#59 | 2.1%(+1.05)#4,978 |
| 60. | 67016 | 3.1% | 1.7%(+1.31)#60 | 2.1%(+0.979)#5,187 |
| 61. | 67030 | 3.0% | 1.7%(+1.29)#61 | 2.1%(+0.958)#5,241 |
| 62. | 66224 | 3.0% | 1.7%(+1.28)#62 | 2.1%(+0.944)#5,279 |
| 63. | 66534 | 3.0% | 1.7%(+1.27)#63 | 2.1%(+0.938)#5,301 |
| 64. | 66425 | 3.0% | 1.7%(+1.27)#64 | 2.1%(+0.930)#5,324 |
| 65. | 67454 | 3.0% | 1.7%(+1.23)#65 | 2.1%(+0.898)#5,414 |
| 66. | 67230 | 2.9% | 1.7%(+1.20)#66 | 2.1%(+0.867)#5,506 |
| 67. | 66419 | 2.9% | 1.7%(+1.16)#67 | 2.1%(+0.822)#5,634 |
| 68. | 66939 | 2.9% | 1.7%(+1.14)#68 | 2.1%(+0.802)#5,697 |
| 69. | 66763 | 2.9% | 1.7%(+1.11)#69 | 2.1%(+0.775)#5,783 |
| 70. | 66517 | 2.9% | 1.7%(+1.11)#70 | 2.1%(+0.770)#5,811 |
| 71. | 66603 | 2.8% | 1.7%(+1.09)#71 | 2.1%(+0.757)#5,857 |
| 72. | 66213 | 2.8% | 1.7%(+1.09)#72 | 2.1%(+0.757)#5,859 |
| 73. | 66610 | 2.8% | 1.7%(+1.06)#73 | 2.1%(+0.721)#5,984 |
| 74. | 67737 | 2.8% | 1.7%(+1.03)#74 | 2.1%(+0.695)#6,078 |
| 75. | 67457 | 2.8% | 1.7%(+1.01)#75 | 2.1%(+0.676)#6,147 |
| 76. | 67491 | 2.8% | 1.7%(+1.01)#76 | 2.1%(+0.676)#6,149 |
| 77. | 66209 | 2.7% | 1.7%(+0.968)#77 | 2.1%(+0.633)#6,304 |
| 78. | 67206 | 2.7% | 1.7%(+0.965)#78 | 2.1%(+0.630)#6,311 |
| 79. | 67579 | 2.7% | 1.7%(+0.965)#79 | 2.1%(+0.629)#6,313 |
| 80. | 66967 | 2.7% | 1.7%(+0.953)#80 | 2.1%(+0.617)#6,360 |
| 81. | 66866 | 2.7% | 1.7%(+0.933)#81 | 2.1%(+0.597)#6,438 |
| 82. | 67801 | 2.7% | 1.7%(+0.927)#82 | 2.1%(+0.591)#6,465 |
| 83. | 67152 | 2.7% | 1.7%(+0.921)#83 | 2.1%(+0.586)#6,493 |
| 84. | 67466 | 2.7% | 1.7%(+0.915)#84 | 2.1%(+0.579)#6,516 |
| 85. | 66223 | 2.7% | 1.7%(+0.912)#85 | 2.1%(+0.577)#6,526 |
| 86. | 66767 | 2.7% | 1.7%(+0.908)#86 | 2.1%(+0.572)#6,544 |
| 87. | 66407 | 2.6% | 1.7%(+0.857)#87 | 2.1%(+0.522)#6,743 |
| 88. | 66204 | 2.6% | 1.7%(+0.842)#88 | 2.1%(+0.506)#6,801 |
| 89. | 67732 | 2.6% | 1.7%(+0.827)#89 | 2.1%(+0.491)#6,858 |
| 90. | 67146 | 2.6% | 1.7%(+0.817)#90 | 2.1%(+0.482)#6,895 |
| 91. | 66221 | 2.6% | 1.7%(+0.814)#91 | 2.1%(+0.478)#6,910 |
| 92. | 66543 | 2.5% | 1.7%(+0.789)#92 | 2.1%(+0.454)#7,017 |
| 93. | 67601 | 2.5% | 1.7%(+0.769)#93 | 2.1%(+0.433)#7,115 |
| 94. | 67456 | 2.5% | 1.7%(+0.761)#94 | 2.1%(+0.425)#7,143 |
| 95. | 67731 | 2.5% | 1.7%(+0.753)#95 | 2.1%(+0.417)#7,177 |
| 96. | 67480 | 2.4% | 1.7%(+0.692)#96 | 2.1%(+0.356)#7,465 |
| 97. | 67005 | 2.4% | 1.7%(+0.688)#97 | 2.1%(+0.352)#7,487 |
| 98. | 67546 | 2.4% | 1.7%(+0.687)#98 | 2.1%(+0.351)#7,490 |
| 99. | 66212 | 2.4% | 1.7%(+0.664)#99 | 2.1%(+0.328)#7,590 |
| 100. | 67427 | 2.4% | 1.7%(+0.634)#100 | 2.1%(+0.298)#7,736 |
Common Questions
What are the Top 10 Zip Codes with the Highest Percentage of Population Employed in Arts, Entertainment & Recreation in Kansas?
Top 10 Zip Codes with the Highest Percentage of Population Employed in Arts, Entertainment & Recreation in Kansas are:
What zip code has the Highest Percentage of Population Employed in Arts, Entertainment & Recreation in Kansas?
66843 has the Highest Percentage of Population Employed in Arts, Entertainment & Recreation in Kansas with 35.5%.
What is the Percentage of Population Employed in Arts, Entertainment & Recreation in the State of Kansas?
Percentage of Population Employed in Arts, Entertainment & Recreation in Kansas is 1.7%.
What is the Percentage of Population Employed in Arts, Entertainment & Recreation in the United States?
Percentage of Population Employed in Arts, Entertainment & Recreation in the United States is 2.1%.