Zip Codes with the Highest Percentage of Self-Employed / Incorporated in Fishers, IN
RELATED REPORTS & OPTIONS
Self-Employed / Incorporated
Fishers
Compare Zip Codes
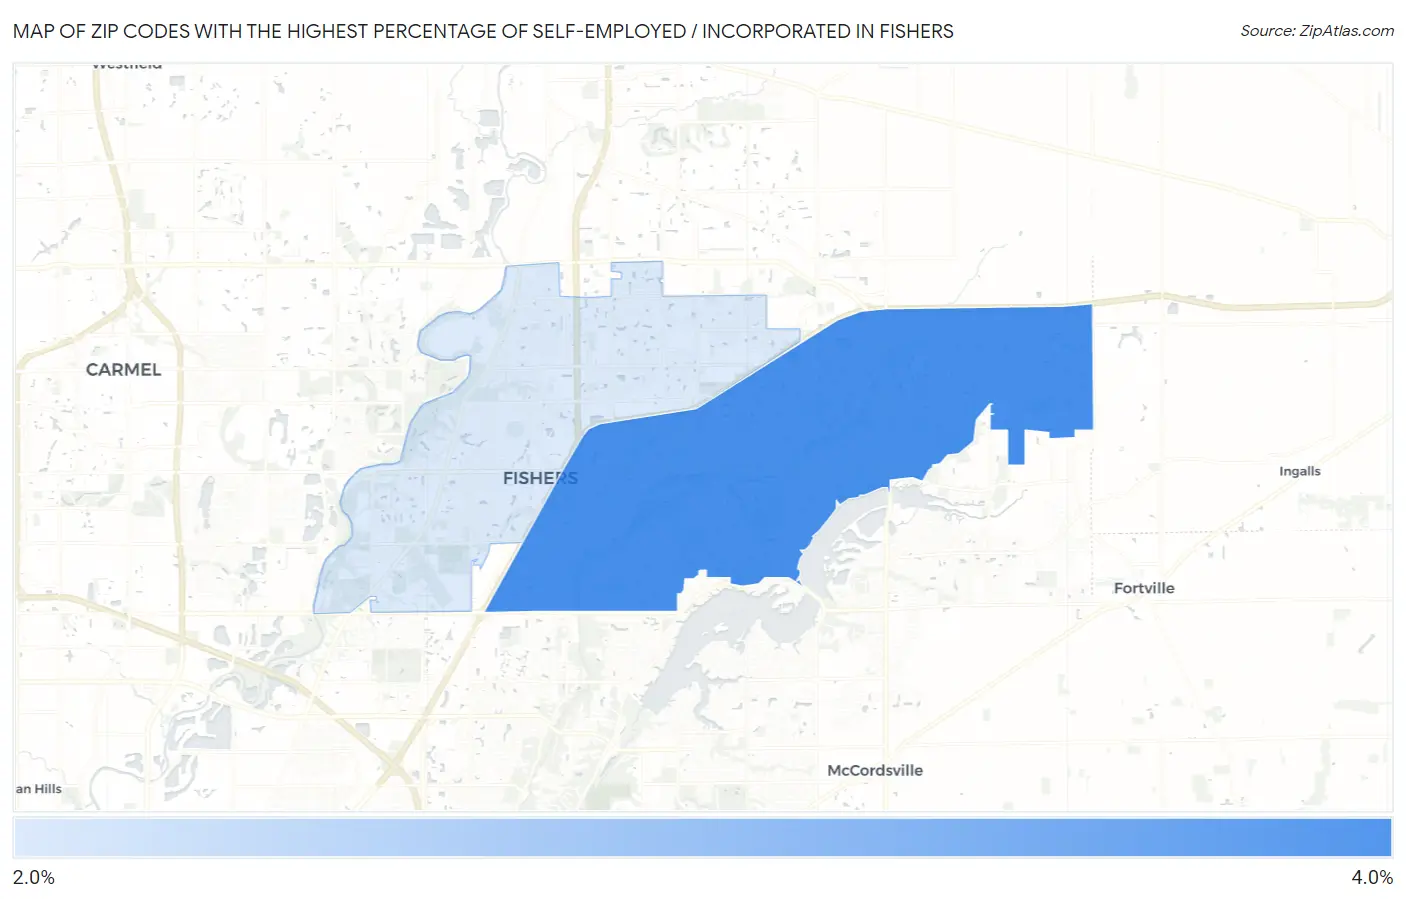
Map of Zip Codes with the Highest Percentage of Self-Employed / Incorporated in Fishers
0.0%
4.0%
Zip Codes with the Highest Percentage of Self-Employed / Incorporated in Fishers, IN
| Zip Code | % Self-Employed / Incorporated | vs State | vs National | |
| 1. | 46037 | 3.5% | 3.2%(+0.248)#288 | 3.8%(-0.349)#14,179 |
| 2. | 46038 | 2.5% | 3.2%(-0.744)#411 | 3.8%(-1.34)#19,018 |
1
Common Questions
What are the Top Zip Codes with the Highest Percentage of Self-Employed / Incorporated in Fishers, IN?
Top Zip Codes with the Highest Percentage of Self-Employed / Incorporated in Fishers, IN are:
What zip code has the Highest Percentage of Self-Employed / Incorporated in Fishers, IN?
46037 has the Highest Percentage of Self-Employed / Incorporated in Fishers, IN with 3.5%.
What is the Percentage of Self-Employed / Incorporated in Fishers, IN?
Percentage of Self-Employed / Incorporated in Fishers is 3.3%.
What is the Percentage of Self-Employed / Incorporated in Indiana?
Percentage of Self-Employed / Incorporated in Indiana is 3.2%.
What is the Percentage of Self-Employed / Incorporated in the United States?
Percentage of Self-Employed / Incorporated in the United States is 3.8%.