Zip Codes with the Highest Percentage of Population Employed in Accommodation & Food Services in Idaho Falls, ID
RELATED REPORTS & OPTIONS
Accommodation & Food Services
Idaho Falls
Compare Zip Codes
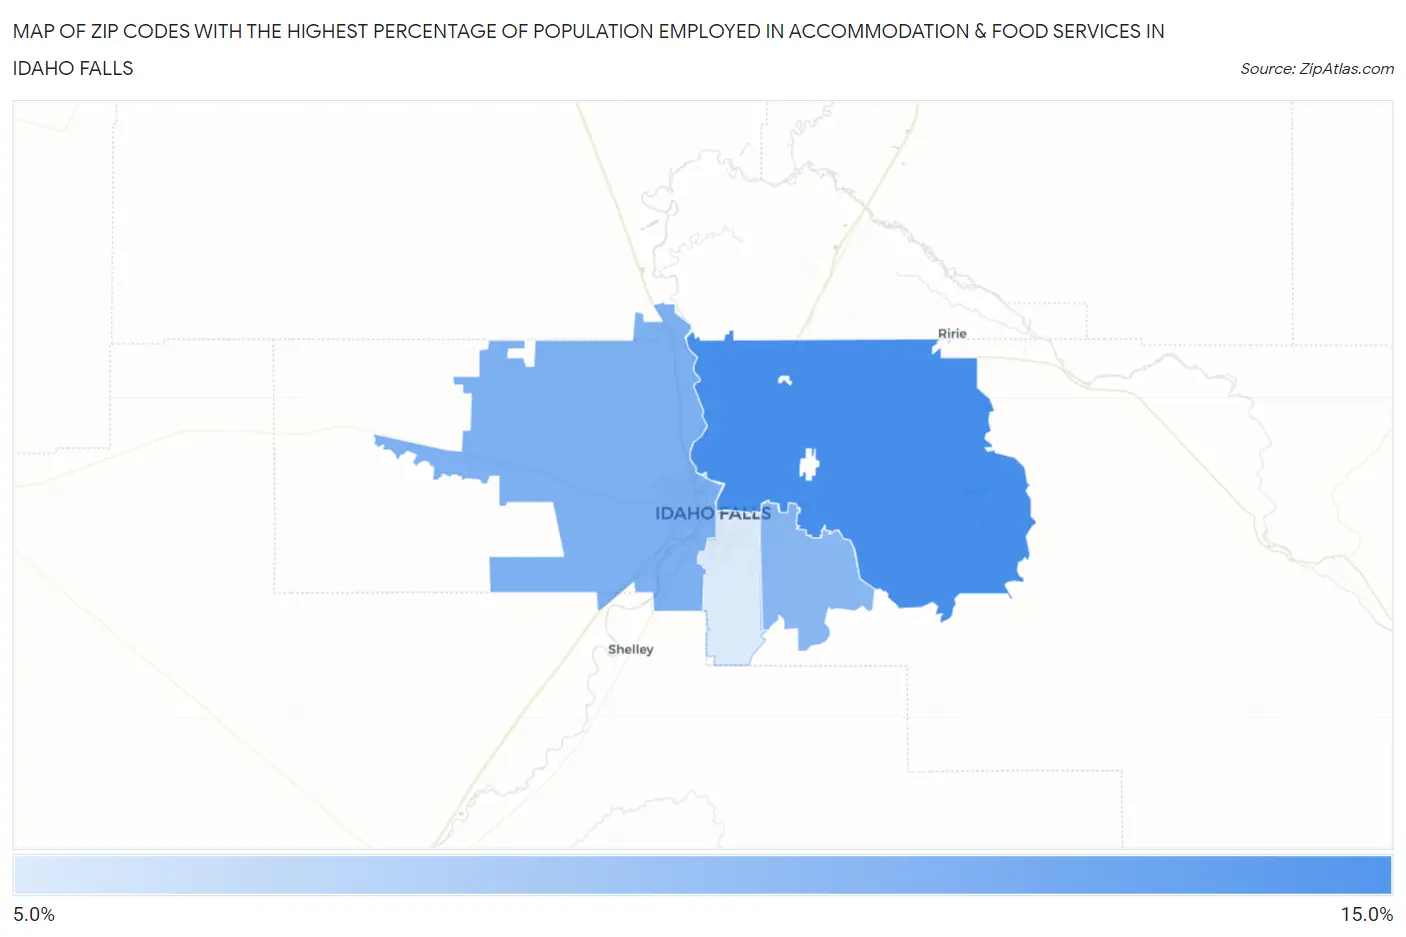
Map of Zip Codes with the Highest Percentage of Population Employed in Accommodation & Food Services in Idaho Falls
5.1%
10.2%
Zip Codes with the Highest Percentage of Population Employed in Accommodation & Food Services in Idaho Falls, ID
| Zip Code | % Employed | vs State | vs National | |
| 1. | 83401 | 10.2% | 7.1%(+3.06)#50 | 6.9%(+3.29)#4,332 |
| 2. | 83402 | 8.4% | 7.1%(+1.24)#73 | 6.9%(+1.47)#7,087 |
| 3. | 83406 | 8.0% | 7.1%(+0.842)#81 | 6.9%(+1.08)#7,901 |
| 4. | 83404 | 5.1% | 7.1%(-2.02)#139 | 6.9%(-1.79)#16,484 |
1
Common Questions
What are the Top 3 Zip Codes with the Highest Percentage of Population Employed in Accommodation & Food Services in Idaho Falls, ID?
Top 3 Zip Codes with the Highest Percentage of Population Employed in Accommodation & Food Services in Idaho Falls, ID are:
What zip code has the Highest Percentage of Population Employed in Accommodation & Food Services in Idaho Falls, ID?
83401 has the Highest Percentage of Population Employed in Accommodation & Food Services in Idaho Falls, ID with 10.2%.
What is the Percentage of Population Employed in Accommodation & Food Services in Idaho Falls, ID?
Percentage of Population Employed in Accommodation & Food Services in Idaho Falls is 7.8%.
What is the Percentage of Population Employed in Accommodation & Food Services in Idaho?
Percentage of Population Employed in Accommodation & Food Services in Idaho is 7.1%.
What is the Percentage of Population Employed in Accommodation & Food Services in the United States?
Percentage of Population Employed in Accommodation & Food Services in the United States is 6.9%.