Zip Codes with the Highest Percentage of Households Heated by Bottled Gas / Liquid Propane in Buford, GA
RELATED REPORTS & OPTIONS
Bottled Gas / LP Heating
Buford
Compare Zip Codes
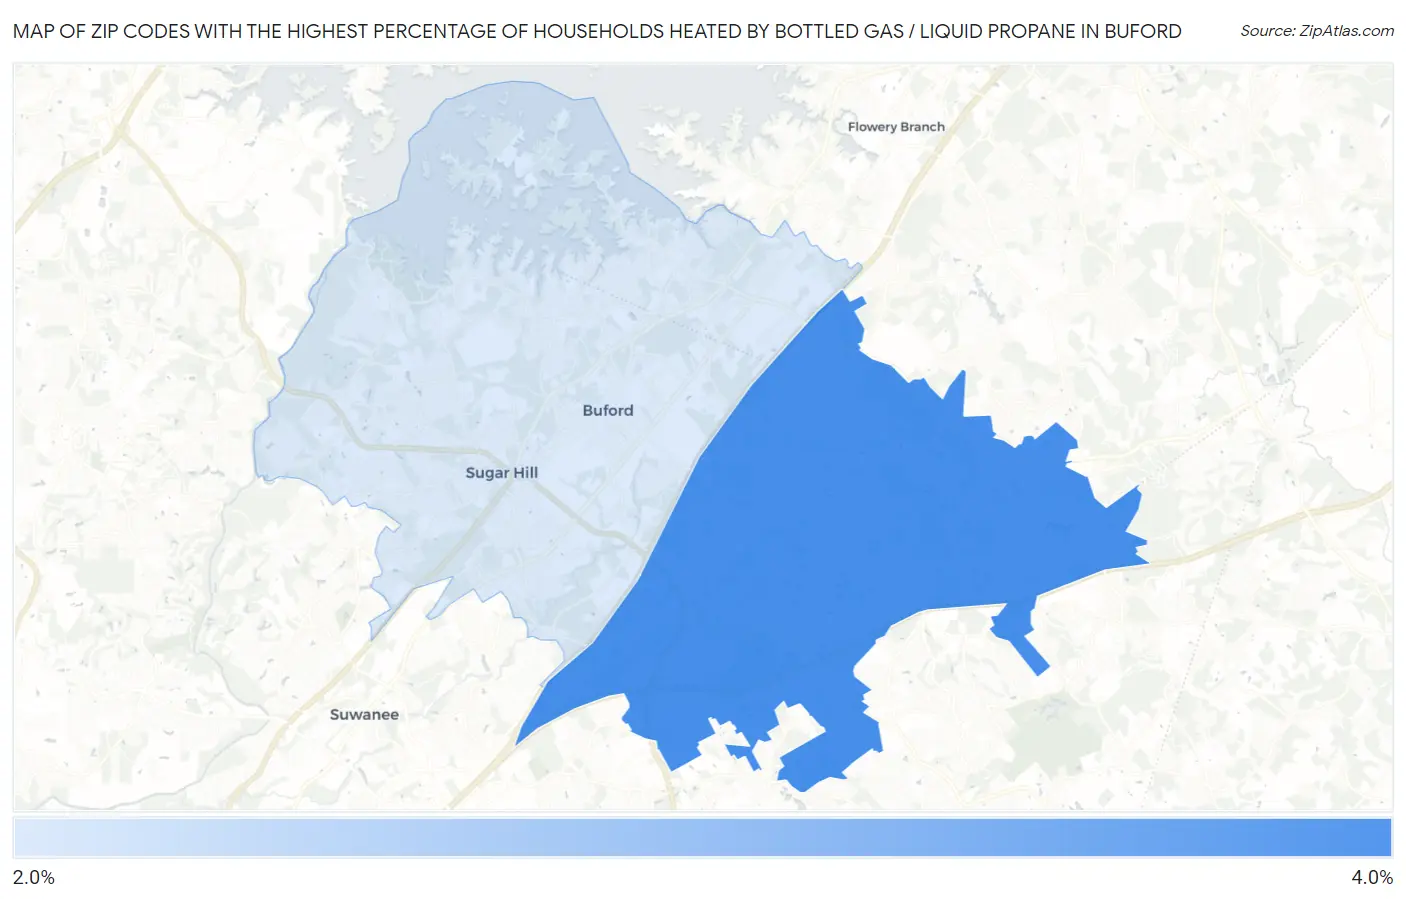
Map of Zip Codes with the Highest Percentage of Households Heated by Bottled Gas / Liquid Propane in Buford
0.0%
4.0%
Zip Codes with the Highest Percentage of Households Heated by Bottled Gas / Liquid Propane in Buford, GA
| Zip Code | Bottled Gas / LP Heating | vs State | vs National | |
| 1. | 30519 | 3.7% | 4.4%(-0.700)#416 | 4.9%(-1.20)#19,953 |
| 2. | 30518 | 2.0% | 4.4%(-2.40)#515 | 4.9%(-2.90)#23,101 |
1
Common Questions
What are the Top Zip Codes with the Highest Percentage of Households Heated by Bottled Gas / Liquid Propane in Buford, GA?
Top Zip Codes with the Highest Percentage of Households Heated by Bottled Gas / Liquid Propane in Buford, GA are:
What zip code has the Highest Percentage of Households Heated by Bottled Gas / Liquid Propane in Buford, GA?
30519 has the Highest Percentage of Households Heated by Bottled Gas / Liquid Propane in Buford, GA with 3.7%.
What is the Percentage of Households Heated by Bottled Gas / Liquid Propane in Buford, GA?
Percentage of Households Heated by Bottled Gas / Liquid Propane in Buford is 2.3%.
What is the Percentage of Households Heated by Bottled Gas / Liquid Propane in Georgia?
Percentage of Households Heated by Bottled Gas / Liquid Propane in Georgia is 4.4%.
What is the Percentage of Households Heated by Bottled Gas / Liquid Propane in the United States?
Percentage of Households Heated by Bottled Gas / Liquid Propane in the United States is 4.9%.