Zip Codes with the Most Immigrants from South America in Bainbridge, GA
RELATED REPORTS & OPTIONS
South America
Bainbridge
Compare Zip Codes
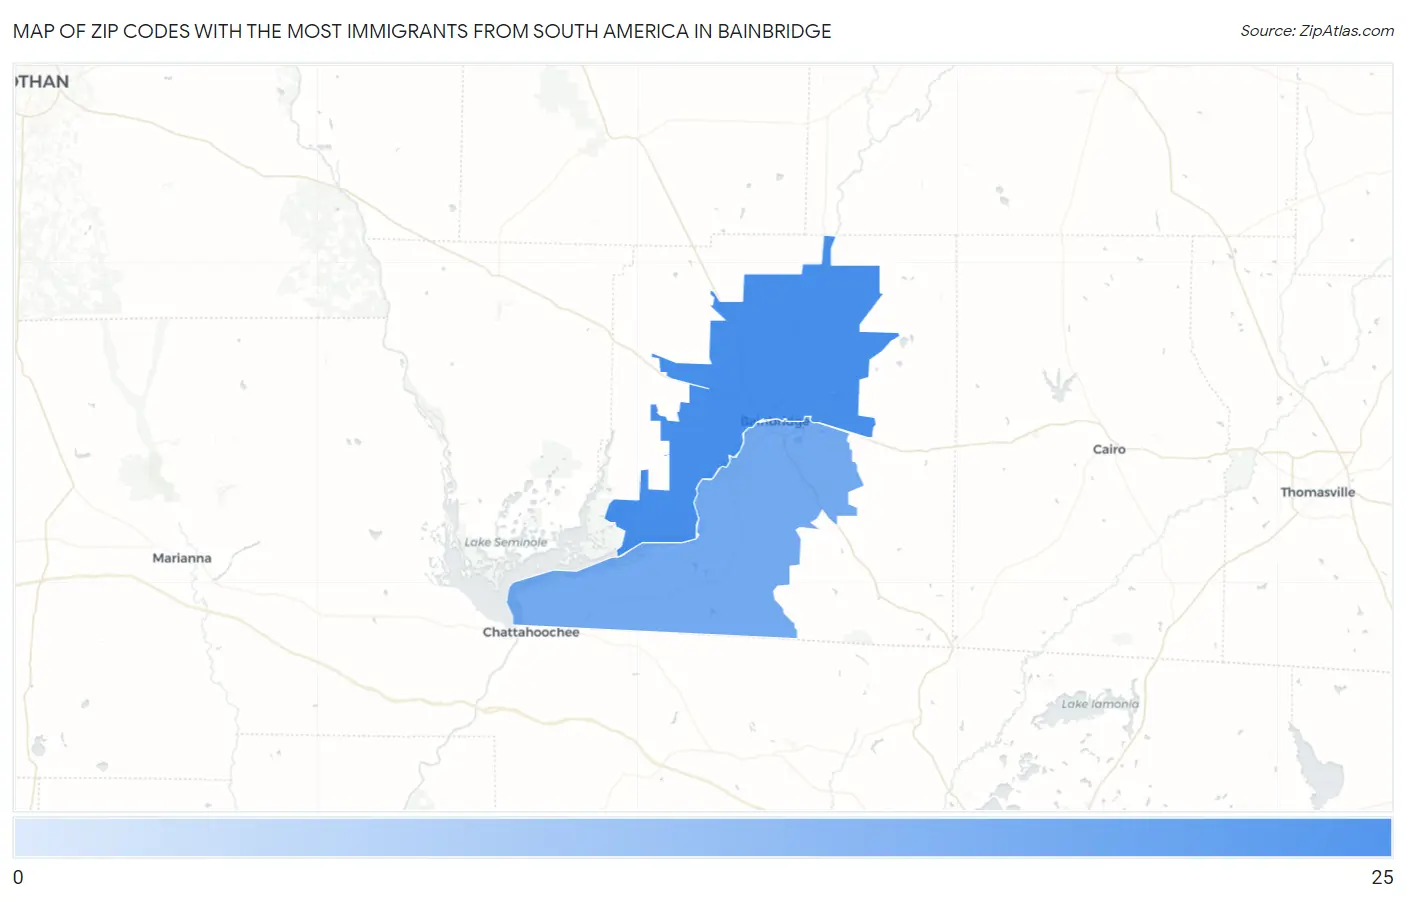
Map of Zip Codes with the Most Immigrants from South America in Bainbridge
9
25
Zip Codes with the Most Immigrants from South America in Bainbridge, GA
| Zip Code | South America | vs State | vs National | |
| 1. | 39817 | 25 | 93,129(0.03%)#263 | 3,636,375(0.00%)#8,417 |
| 2. | 39819 | 9 | 93,129(0.01%)#312 | 3,636,375(0.00%)#10,483 |
1
Common Questions
What are the Top Zip Codes with the Most Immigrants from South America in Bainbridge, GA?
Top Zip Codes with the Most Immigrants from South America in Bainbridge, GA are:
What zip code has the Most Immigrants from South America in Bainbridge, GA?
39817 has the Most Immigrants from South America in Bainbridge, GA with 25.
What is the Total Immigrants from South America in Bainbridge, GA?
Total Immigrants from South America in Bainbridge is 9.
What is the Total Immigrants from South America in Georgia?
Total Immigrants from South America in Georgia is 93,129.
What is the Total Immigrants from South America in the United States?
Total Immigrants from South America in the United States is 3,636,375.