Zip Codes with the Highest Percentage of Population Employed in Agriculture, Fishing & Hunting in Bradenton, FL

RELATED REPORTS & OPTIONS

Agriculture, Fishing & Hunting
Population
Families and Households
Female Fertility
Female Fertility (Unmarried)
Race (Community Size)
Race (Percentage)
Ancestry (Community Size)
AfricanAmericanApacheArabArgentineanArmenianAssyrian / Chaldean / SyriacAustralianAustrianBahamianBarbadianBelgianBelizeanBhutaneseBlackfeetBolivianBrazilianBritishBritish West IndianBulgarianBurmeseCanadianCelticCentral AmericanCentral American IndianCherokeeChileanChippewaChoctawColombianCosta RicanCreekCroatianCubanCzechCzechoslovakianDanishDominicanDutchEastern EuropeanEcuadorianEgyptianEnglishEstonianEuropeanFinnishFrenchFrench CanadianGermanGreekGuamanian / ChamorroGuatemalanGuyaneseHaitianHonduranHungarianIndian (Asian)IrishIroquoisIsraeliItalianJamaicanJapaneseKoreanLatvianLebaneseLithuanianMacedonianMalaysianMexicanMexican American IndianMoroccanNative HawaiianNicaraguanNigerianNorthern EuropeanNorwegianPakistaniPalestinianPanamanianPennsylvania GermanPeruvianPolishPortuguesePuerto RicanRomanianRussianSalvadoranSamoanScandinavianScotch-IrishScottishSeminoleSerbianSiouxSlavicSlovakSloveneSouth AfricanSouth AmericanSpaniardSpanishSri LankanSubsaharan AfricanSwedishSwissThaiTrinidadian and TobagonianTurkishUkrainianUruguayanVenezuelanVietnameseWelshWest IndianYugoslavian
Ancestry (Percentage)
AfricanAmericanApacheArabArgentineanArmenianAssyrian / Chaldean / SyriacAustralianAustrianBahamianBarbadianBelgianBelizeanBhutaneseBlackfeetBolivianBrazilianBritishBritish West IndianBulgarianBurmeseCanadianCelticCentral AmericanCentral American IndianCherokeeChileanChippewaChoctawColombianCosta RicanCreekCroatianCubanCzechCzechoslovakianDanishDominicanDutchEastern EuropeanEcuadorianEgyptianEnglishEstonianEuropeanFinnishFrenchFrench CanadianGermanGreekGuamanian / ChamorroGuatemalanGuyaneseHaitianHonduranHungarianIndian (Asian)IrishIroquoisIsraeliItalianJamaicanJapaneseKoreanLatvianLebaneseLithuanianMacedonianMalaysianMexicanMexican American IndianMoroccanNative HawaiianNicaraguanNigerianNorthern EuropeanNorwegianPakistaniPalestinianPanamanianPennsylvania GermanPeruvianPolishPortuguesePuerto RicanRomanianRussianSalvadoranSamoanScandinavianScotch-IrishScottishSeminoleSerbianSiouxSlavicSlovakSloveneSouth AfricanSouth AmericanSpaniardSpanishSri LankanSubsaharan AfricanSwedishSwissThaiTrinidadian and TobagonianTurkishUkrainianUruguayanVenezuelanVietnameseWelshWest IndianYugoslavian
Immigrant Origin (Total)
Immigrant Origin (Percentage)
Income
Income (Families)
Income (Households)
Poverty
Poverty (Families)
Unemployment
Employment Occupations
Employment Industries
Employer Class
Commute Time
Commute Means
School Enrollment
Education by Degree Field
Occupancy
Finances
Physical Characteristics
Bradenton
Compare Zip Codes
Comparison Subject

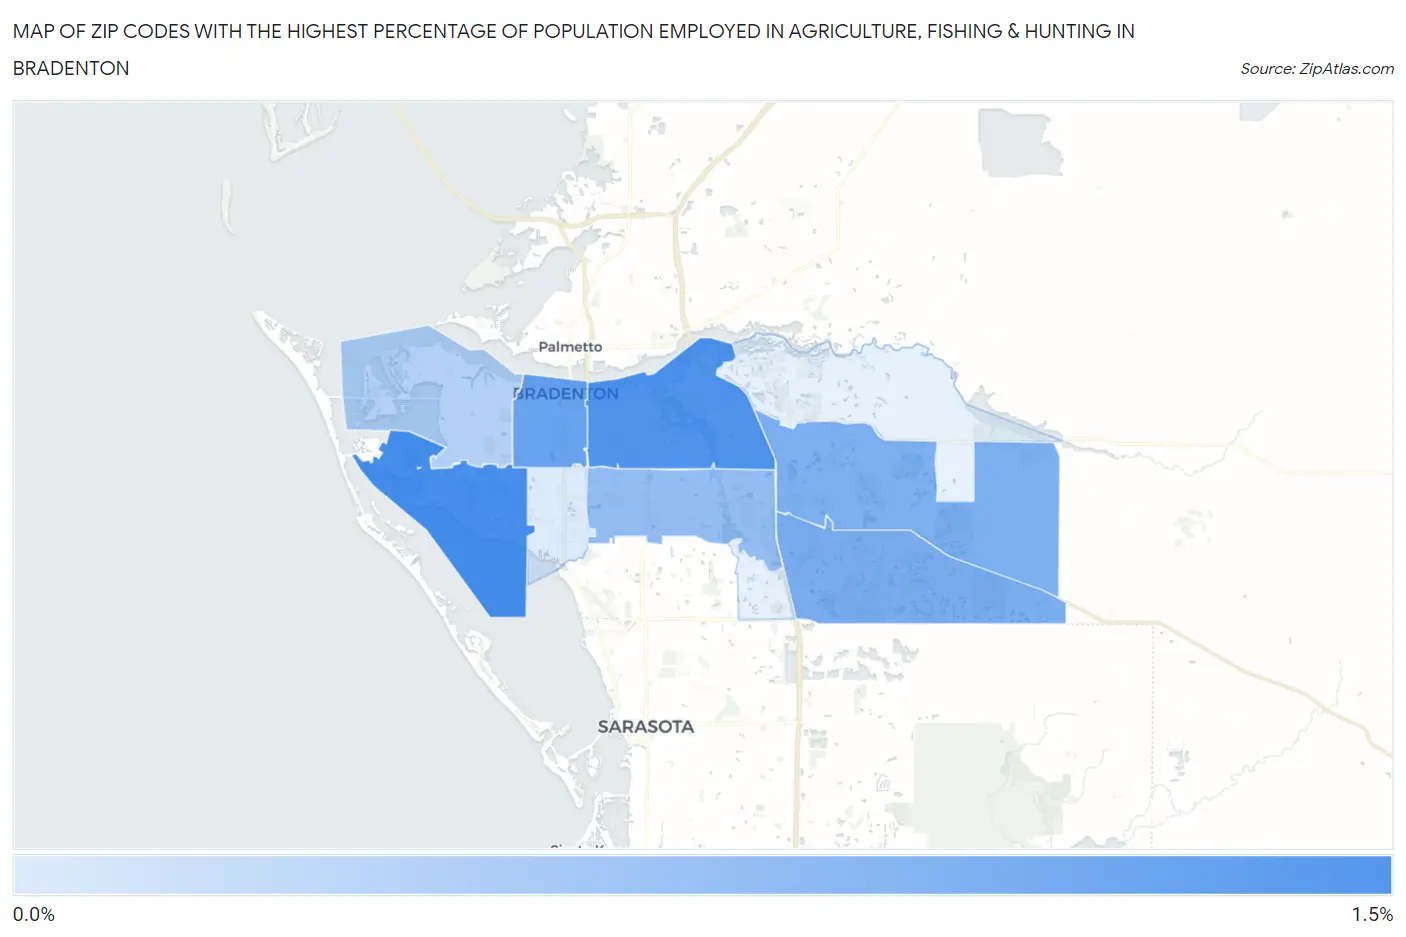
Map of Zip Codes with the Highest Percentage of Population Employed in Agriculture, Fishing & Hunting in Bradenton

0.0%
1.5%
Zip Codes with the Highest Percentage of Population Employed in Agriculture, Fishing & Hunting in Bradenton Map

Zip Codes with the Highest Percentage of Population Employed in Agriculture, Fishing & Hunting in Bradenton, FL

Zip Code % Employed vs State vs National
1.342101.0%0.75%(+0.286)#2721.2%(-0.168)#16,079
2.342081.00%0.75%(+0.250)#2781.2%(-0.204)#16,244
3.342050.84%0.75%(+0.098)#3031.2%(-0.356)#17,003
4.342020.74%0.75%(-0.003)#3311.2%(-0.456)#17,580
5.342110.72%0.75%(-0.026)#3391.2%(-0.480)#17,736
6.342030.59%0.75%(-0.154)#3771.2%(-0.608)#18,542
7.342090.40%0.75%(-0.341)#4751.2%(-0.795)#20,116
8.342070.16%0.75%(-0.584)#6501.2%(-1.04)#22,841

Common Questions

What are the Top 5 Zip Codes with the Highest Percentage of Population Employed in Agriculture, Fishing & Hunting in Bradenton, FL?
Top 5 Zip Codes with the Highest Percentage of Population Employed in Agriculture, Fishing & Hunting in Bradenton, FL are:
#1
1.0%
#2
1.00%
#3
0.84%
#4
0.74%
#5
0.72%
What zip code has the Highest Percentage of Population Employed in Agriculture, Fishing & Hunting in Bradenton, FL?
34210 has the Highest Percentage of Population Employed in Agriculture, Fishing & Hunting in Bradenton, FL with 1.0%.
What is the Percentage of Population Employed in Agriculture, Fishing & Hunting in Bradenton, FL?
Percentage of Population Employed in Agriculture, Fishing & Hunting in Bradenton is 1.2%.
What is the Percentage of Population Employed in Agriculture, Fishing & Hunting in Florida?
Percentage of Population Employed in Agriculture, Fishing & Hunting in Florida is 0.75%.
What is the Percentage of Population Employed in Agriculture, Fishing & Hunting in the United States?
Percentage of Population Employed in Agriculture, Fishing & Hunting in the United States is 1.2%.