Zip Codes with the Highest Percentage of Population Employed in Arts, Entertainment & Recreation in Greenwich, CT
RELATED REPORTS & OPTIONS
Arts, Entertainment & Recreation
Greenwich
Compare Zip Codes
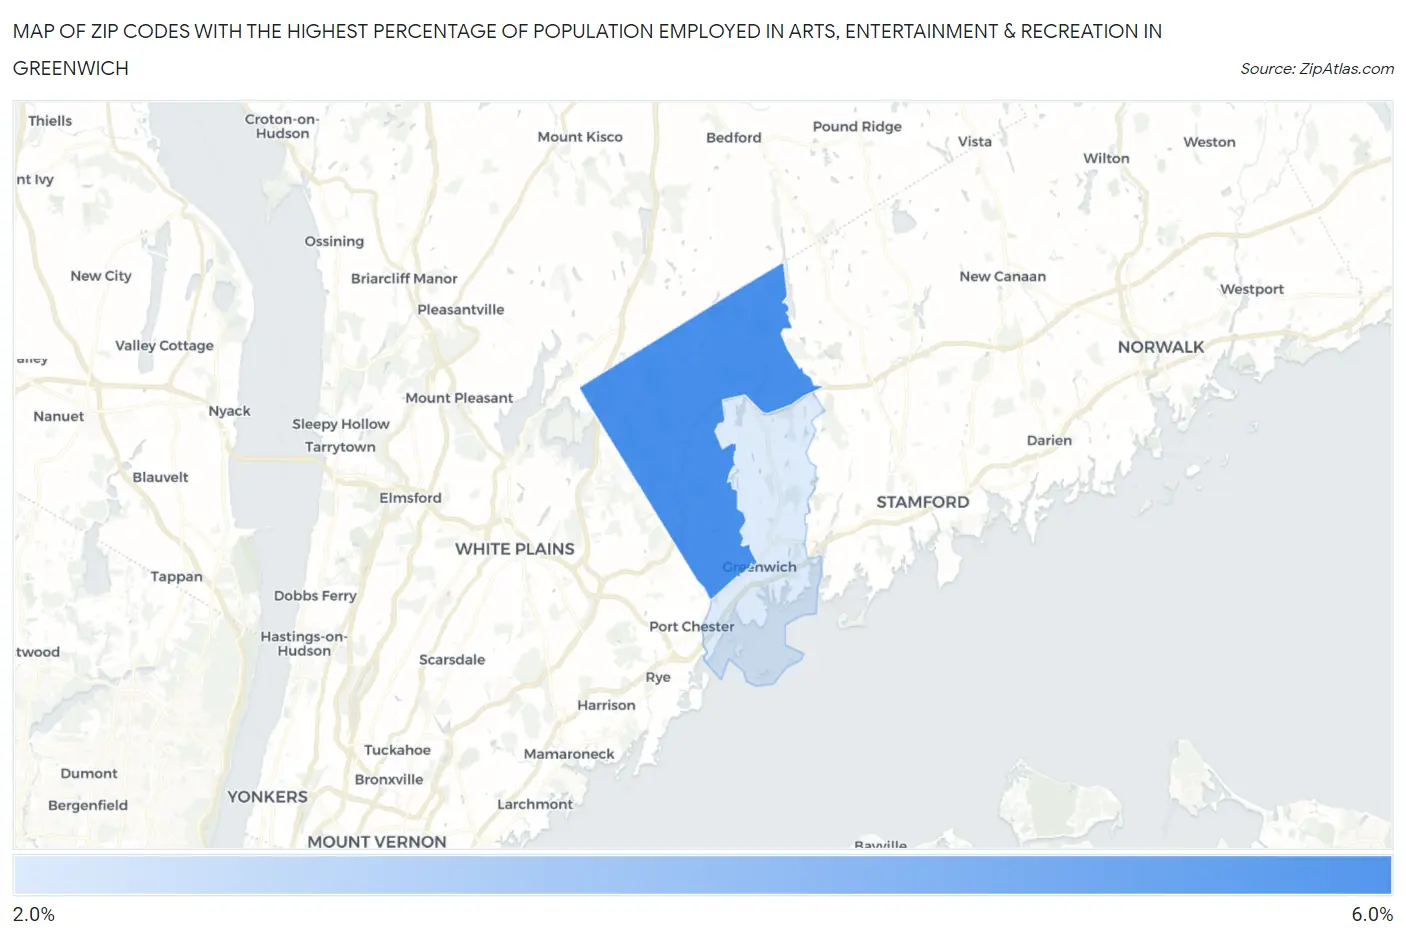
Map of Zip Codes with the Highest Percentage of Population Employed in Arts, Entertainment & Recreation in Greenwich
0.0%
6.0%
Zip Codes with the Highest Percentage of Population Employed in Arts, Entertainment & Recreation in Greenwich, CT
| Zip Code | % Employed | vs State | vs National | |
| 1. | 06831 | 5.2% | 2.5%(+2.72)#27 | 2.1%(+3.11)#2,157 |
| 2. | 06830 | 2.9% | 2.5%(+0.432)#85 | 2.1%(+0.825)#5,626 |
1
Common Questions
What are the Top Zip Codes with the Highest Percentage of Population Employed in Arts, Entertainment & Recreation in Greenwich, CT?
Top Zip Codes with the Highest Percentage of Population Employed in Arts, Entertainment & Recreation in Greenwich, CT are:
What zip code has the Highest Percentage of Population Employed in Arts, Entertainment & Recreation in Greenwich, CT?
06831 has the Highest Percentage of Population Employed in Arts, Entertainment & Recreation in Greenwich, CT with 5.2%.
What is the Percentage of Population Employed in Arts, Entertainment & Recreation in Greenwich, CT?
Percentage of Population Employed in Arts, Entertainment & Recreation in Greenwich is 3.8%.
What is the Percentage of Population Employed in Arts, Entertainment & Recreation in Connecticut?
Percentage of Population Employed in Arts, Entertainment & Recreation in Connecticut is 2.5%.
What is the Percentage of Population Employed in Arts, Entertainment & Recreation in the United States?
Percentage of Population Employed in Arts, Entertainment & Recreation in the United States is 2.1%.