Zip Codes with the Highest Percentage of Population Employed in Transportation & Warehousing in Yuba City, CA
RELATED REPORTS & OPTIONS
Transportation & Warehousing
Yuba City
Compare Zip Codes
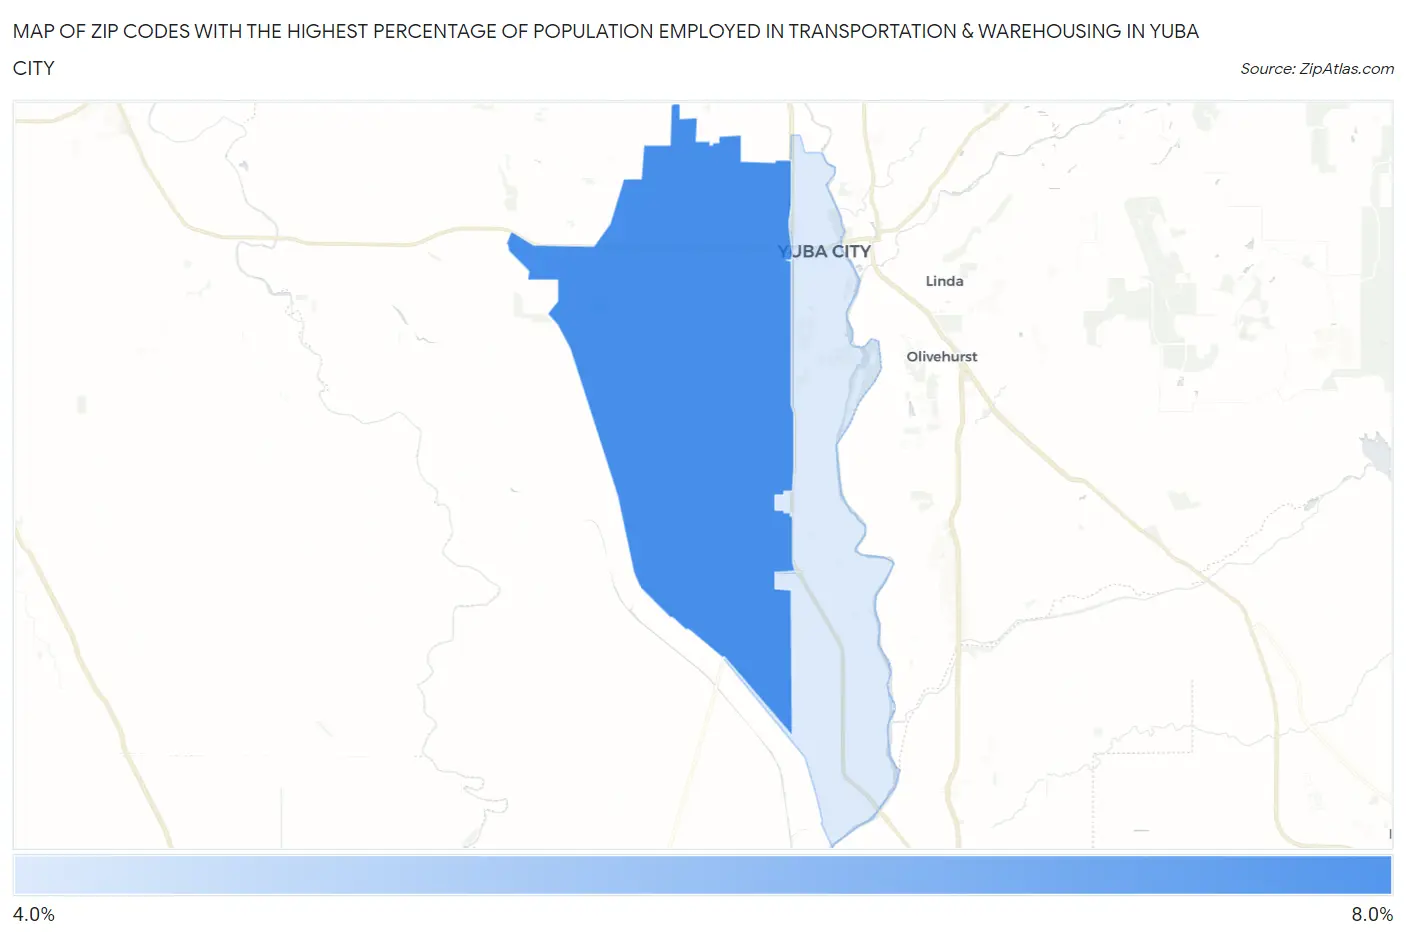
Map of Zip Codes with the Highest Percentage of Population Employed in Transportation & Warehousing in Yuba City
0.0%
8.0%
Zip Codes with the Highest Percentage of Population Employed in Transportation & Warehousing in Yuba City, CA
| Zip Code | % Employed | vs State | vs National | |
| 1. | 95993 | 6.0% | 5.1%(+0.899)#418 | 4.9%(+1.08)#8,717 |
| 2. | 95991 | 4.5% | 5.1%(-0.625)#646 | 4.9%(-0.441)#13,780 |
1
Common Questions
What are the Top Zip Codes with the Highest Percentage of Population Employed in Transportation & Warehousing in Yuba City, CA?
Top Zip Codes with the Highest Percentage of Population Employed in Transportation & Warehousing in Yuba City, CA are:
What zip code has the Highest Percentage of Population Employed in Transportation & Warehousing in Yuba City, CA?
95993 has the Highest Percentage of Population Employed in Transportation & Warehousing in Yuba City, CA with 6.0%.
What is the Percentage of Population Employed in Transportation & Warehousing in Yuba City, CA?
Percentage of Population Employed in Transportation & Warehousing in Yuba City is 5.6%.
What is the Percentage of Population Employed in Transportation & Warehousing in California?
Percentage of Population Employed in Transportation & Warehousing in California is 5.1%.
What is the Percentage of Population Employed in Transportation & Warehousing in the United States?
Percentage of Population Employed in Transportation & Warehousing in the United States is 4.9%.