Zip Codes with the Highest Percentage of Population Employed in Agriculture, Fishing & Hunting in Woodland, CA
RELATED REPORTS & OPTIONS
Agriculture, Fishing & Hunting
Woodland
Compare Zip Codes
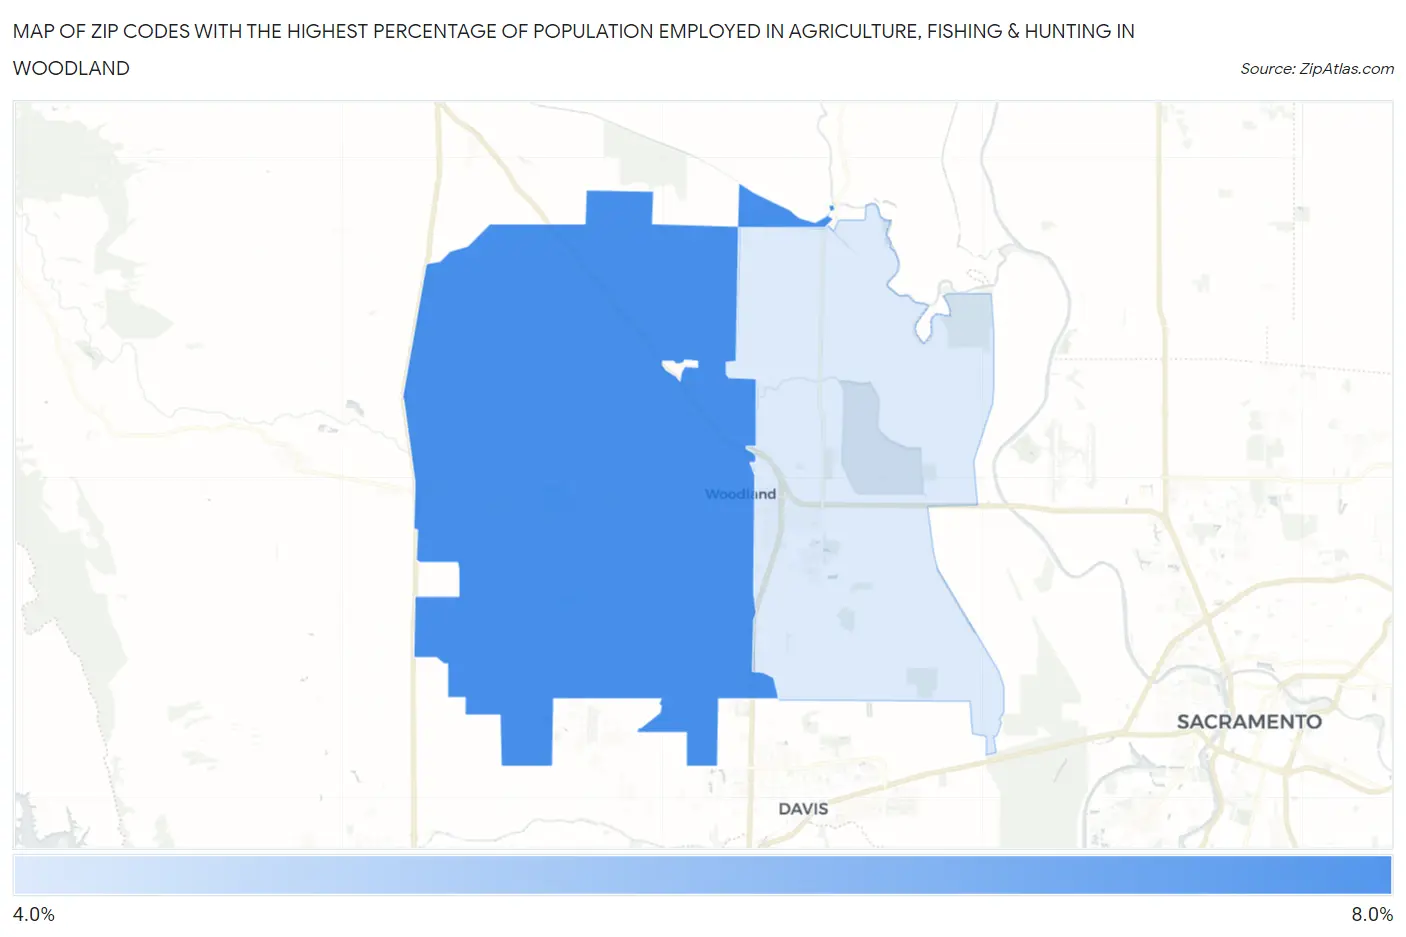
Map of Zip Codes with the Highest Percentage of Population Employed in Agriculture, Fishing & Hunting in Woodland
0.0%
8.0%
Zip Codes with the Highest Percentage of Population Employed in Agriculture, Fishing & Hunting in Woodland, CA
| Zip Code | % Employed | vs State | vs National | |
| 1. | 95695 | 7.5% | 2.0%(+5.52)#312 | 1.2%(+6.30)#5,745 |
| 2. | 95776 | 4.5% | 2.0%(+2.53)#406 | 1.2%(+3.32)#8,389 |
1
Common Questions
What are the Top Zip Codes with the Highest Percentage of Population Employed in Agriculture, Fishing & Hunting in Woodland, CA?
Top Zip Codes with the Highest Percentage of Population Employed in Agriculture, Fishing & Hunting in Woodland, CA are:
What zip code has the Highest Percentage of Population Employed in Agriculture, Fishing & Hunting in Woodland, CA?
95695 has the Highest Percentage of Population Employed in Agriculture, Fishing & Hunting in Woodland, CA with 7.5%.
What is the Percentage of Population Employed in Agriculture, Fishing & Hunting in Woodland, CA?
Percentage of Population Employed in Agriculture, Fishing & Hunting in Woodland is 6.0%.
What is the Percentage of Population Employed in Agriculture, Fishing & Hunting in California?
Percentage of Population Employed in Agriculture, Fishing & Hunting in California is 2.0%.
What is the Percentage of Population Employed in Agriculture, Fishing & Hunting in the United States?
Percentage of Population Employed in Agriculture, Fishing & Hunting in the United States is 1.2%.