Winters, CA Map & Demographics
Winters Map
Winters Overview
$51,244
PER CAPITA INCOME
$150,036
AVG FAMILY INCOME
$128,679
AVG HOUSEHOLD INCOME
16.1%
WAGE / INCOME GAP [ % ]
83.9¢/ $1
WAGE / INCOME GAP [ $ ]
0.46
INEQUALITY / GINI INDEX
7,270
TOTAL POPULATION
3,776
MALE POPULATION
3,494
FEMALE POPULATION
108.07
MALES / 100 FEMALES
92.53
FEMALES / 100 MALES
37.9
MEDIAN AGE
3.5
AVG FAMILY SIZE
3.0
AVG HOUSEHOLD SIZE
4,328
LABOR FORCE [ PEOPLE ]
74.3%
PERCENT IN LABOR FORCE
1.9%
UNEMPLOYMENT RATE
Winters Zip Codes
Winters Area Codes
Income in Winters
Income Overview in Winters
Per Capita Income in Winters is $51,244, while median incomes of families and households are $150,036 and $128,679 respectively.
| Characteristic | Number | Measure |
| Per Capita Income | 7,270 | $51,244 |
| Median Family Income | 1,766 | $150,036 |
| Mean Family Income | 1,766 | $169,319 |
| Median Household Income | 2,439 | $128,679 |
| Mean Household Income | 2,439 | $148,333 |
| Income Deficit | 1,766 | $0 |
| Wage / Income Gap (%) | 7,270 | 16.13% |
| Wage / Income Gap ($) | 7,270 | 83.87¢ per $1 |
| Gini / Inequality Index | 7,270 | 0.46 |
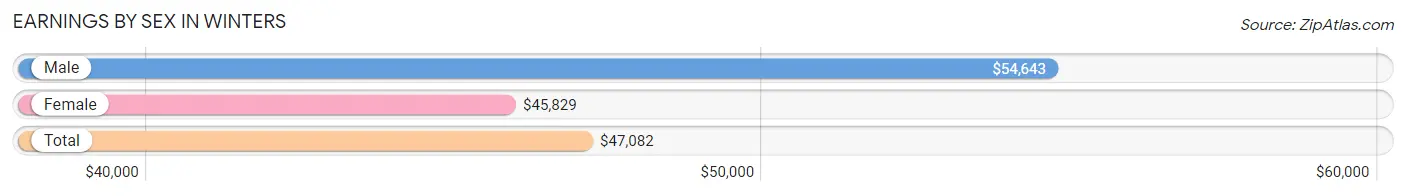
Earnings by Sex in Winters
Average Earnings in Winters are $47,082, $54,643 for men and $45,829 for women, a difference of 16.1%.
| Sex | Number | Average Earnings |
| Male | 2,494 (55.9%) | $54,643 |
| Female | 1,969 (44.1%) | $45,829 |
| Total | 4,463 (100.0%) | $47,082 |
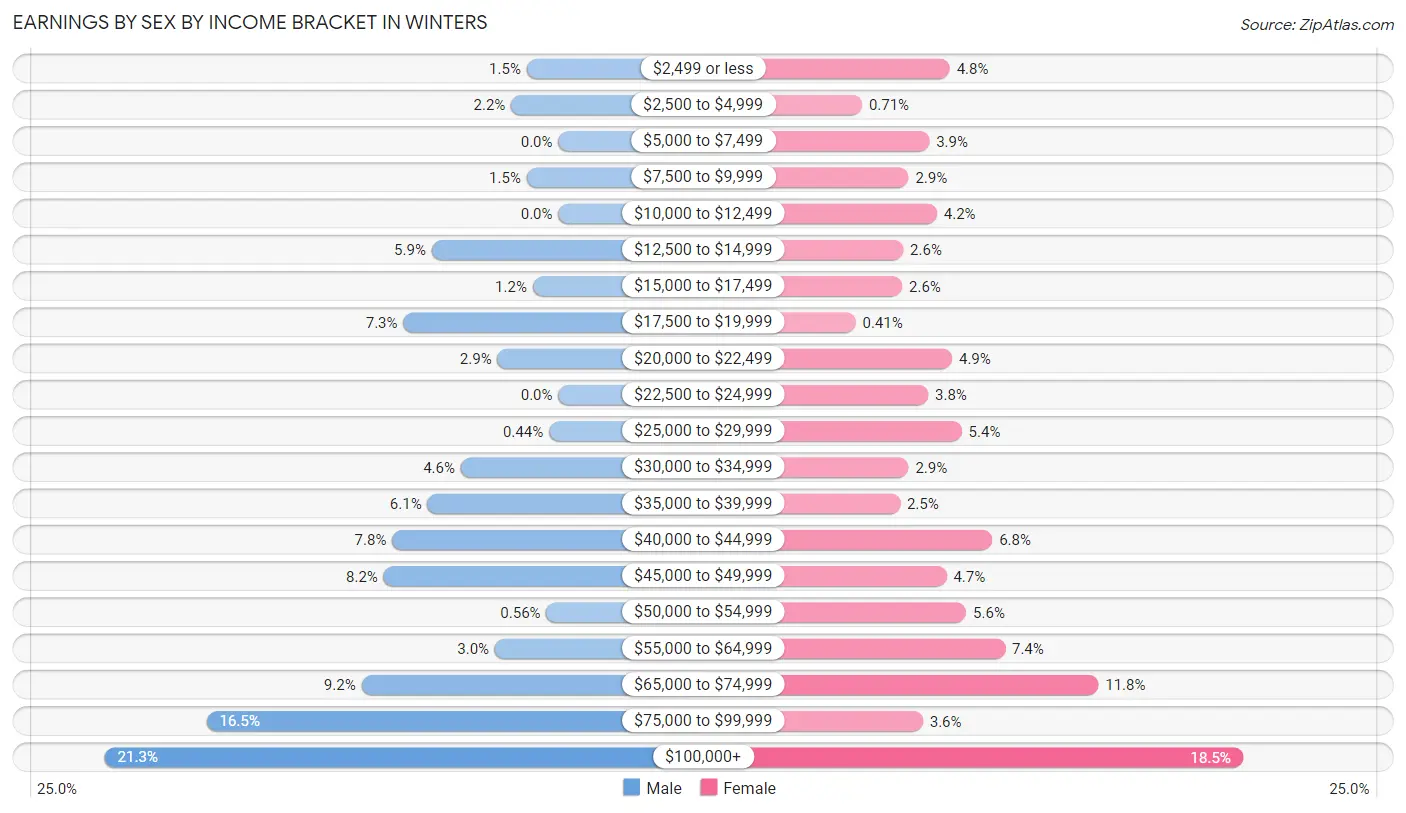
Earnings by Sex by Income Bracket in Winters
The most common earnings brackets in Winters are $100,000+ for men (530 | 21.2%) and $100,000+ for women (365 | 18.5%).
| Income | Male | Female |
| $2,499 or less | 37 (1.5%) | 95 (4.8%) |
| $2,500 to $4,999 | 55 (2.2%) | 14 (0.7%) |
| $5,000 to $7,499 | 0 (0.0%) | 76 (3.9%) |
| $7,500 to $9,999 | 37 (1.5%) | 57 (2.9%) |
| $10,000 to $12,499 | 0 (0.0%) | 83 (4.2%) |
| $12,500 to $14,999 | 148 (5.9%) | 52 (2.6%) |
| $15,000 to $17,499 | 30 (1.2%) | 51 (2.6%) |
| $17,500 to $19,999 | 181 (7.3%) | 8 (0.4%) |
| $20,000 to $22,499 | 71 (2.9%) | 97 (4.9%) |
| $22,500 to $24,999 | 0 (0.0%) | 75 (3.8%) |
| $25,000 to $29,999 | 11 (0.4%) | 106 (5.4%) |
| $30,000 to $34,999 | 114 (4.6%) | 57 (2.9%) |
| $35,000 to $39,999 | 153 (6.1%) | 49 (2.5%) |
| $40,000 to $44,999 | 194 (7.8%) | 134 (6.8%) |
| $45,000 to $49,999 | 204 (8.2%) | 92 (4.7%) |
| $50,000 to $54,999 | 14 (0.6%) | 110 (5.6%) |
| $55,000 to $64,999 | 74 (3.0%) | 146 (7.4%) |
| $65,000 to $74,999 | 230 (9.2%) | 232 (11.8%) |
| $75,000 to $99,999 | 411 (16.5%) | 70 (3.6%) |
| $100,000+ | 530 (21.2%) | 365 (18.5%) |
| Total | 2,494 (100.0%) | 1,969 (100.0%) |
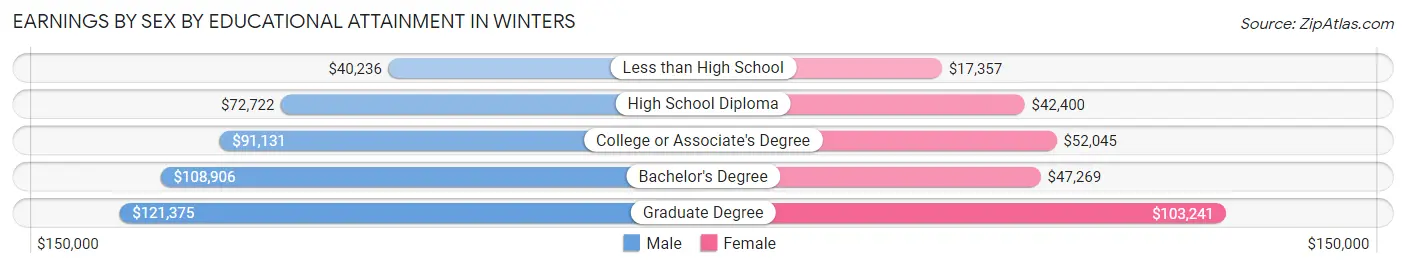
Earnings by Sex by Educational Attainment in Winters
Average earnings in Winters are $73,265 for men and $51,910 for women, a difference of 29.1%. Men with an educational attainment of graduate degree enjoy the highest average annual earnings of $121,375, while those with less than high school education earn the least with $40,236. Women with an educational attainment of graduate degree earn the most with the average annual earnings of $103,241, while those with less than high school education have the smallest earnings of $17,357.
| Educational Attainment | Male Income | Female Income |
| Less than High School | $40,236 | $17,357 |
| High School Diploma | $72,722 | $42,400 |
| College or Associate's Degree | $91,131 | $52,045 |
| Bachelor's Degree | $108,906 | $47,269 |
| Graduate Degree | $121,375 | $103,241 |
| Total | $73,265 | $51,910 |
Family Income in Winters
Family Income Brackets in Winters
According to the Winters family income data, there are 583 families falling into the $150,000 to $199,999 income range, which is the most common income bracket and makes up 33.0% of all families.
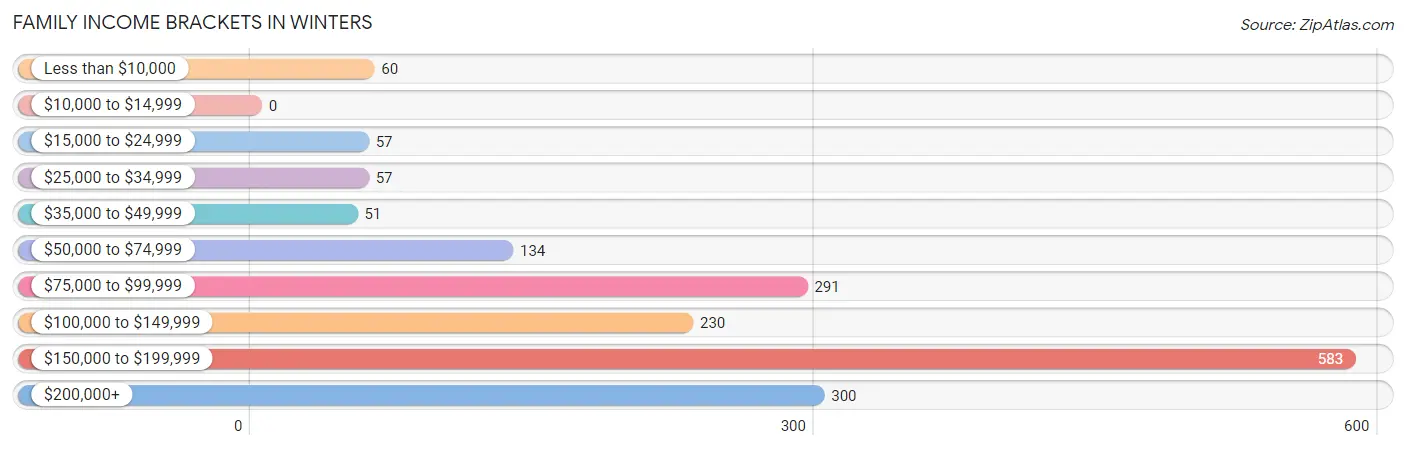
| Income Bracket | # Families | % Families |
| Less than $10,000 | 60 | 3.4% |
| $10,000 to $14,999 | 0 | 0.0% |
| $15,000 to $24,999 | 57 | 3.2% |
| $25,000 to $34,999 | 57 | 3.2% |
| $35,000 to $49,999 | 51 | 2.9% |
| $50,000 to $74,999 | 134 | 7.6% |
| $75,000 to $99,999 | 291 | 16.5% |
| $100,000 to $149,999 | 230 | 13.0% |
| $150,000 to $199,999 | 583 | 33.0% |
| $200,000+ | 300 | 17.0% |
Family Income by Famaliy Size in Winters
3-person families (461 | 26.1%) account for the highest median family income in Winters with $161,875 per family, while 3-person families (461 | 26.1%) have the highest median income of $53,958 per family member.
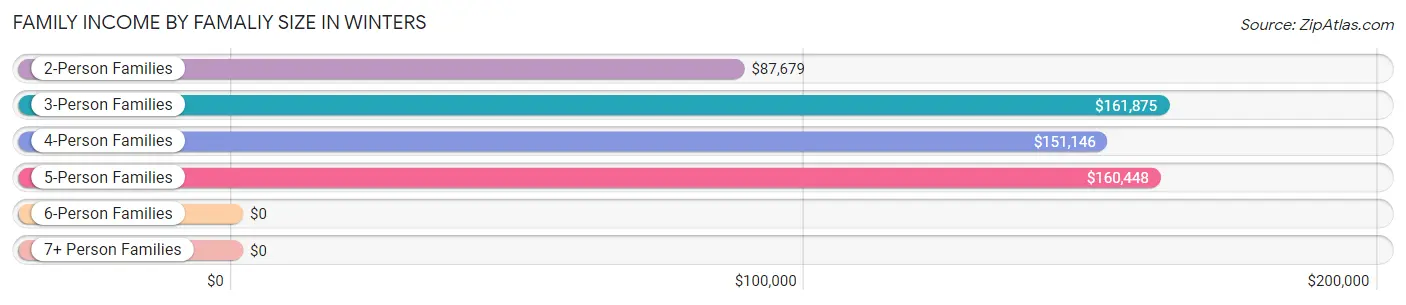
| Income Bracket | # Families | Median Income |
| 2-Person Families | 559 (31.7%) | $87,679 |
| 3-Person Families | 461 (26.1%) | $161,875 |
| 4-Person Families | 370 (20.9%) | $151,146 |
| 5-Person Families | 345 (19.5%) | $160,448 |
| 6-Person Families | 11 (0.6%) | $0 |
| 7+ Person Families | 20 (1.1%) | $0 |
| Total | 1,766 (100.0%) | $150,036 |
Family Income by Number of Earners in Winters
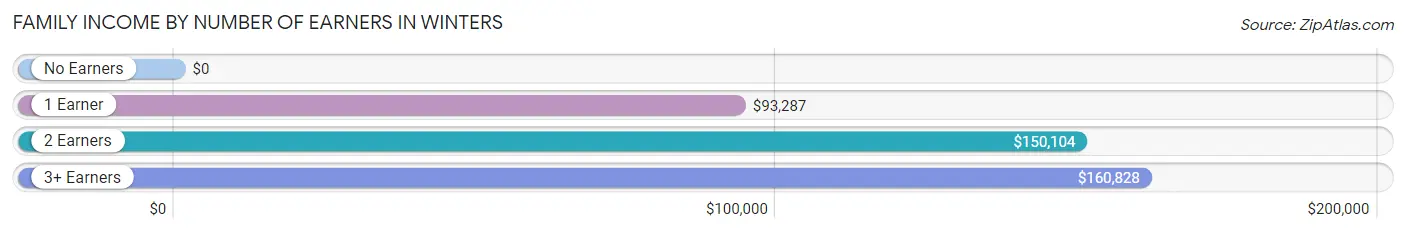
| Number of Earners | # Families | Median Income |
| No Earners | 153 (8.7%) | $0 |
| 1 Earner | 335 (19.0%) | $93,287 |
| 2 Earners | 834 (47.2%) | $150,104 |
| 3+ Earners | 444 (25.1%) | $160,828 |
| Total | 1,766 (100.0%) | $150,036 |
Household Income in Winters
Household Income Brackets in Winters
With 588 households falling in the category, the $150,000 to $199,999 income range is the most frequent in Winters, accounting for 24.1% of all households. In contrast, only 22 households (0.9%) fall into the $10,000 to $14,999 income bracket, making it the least populous group.
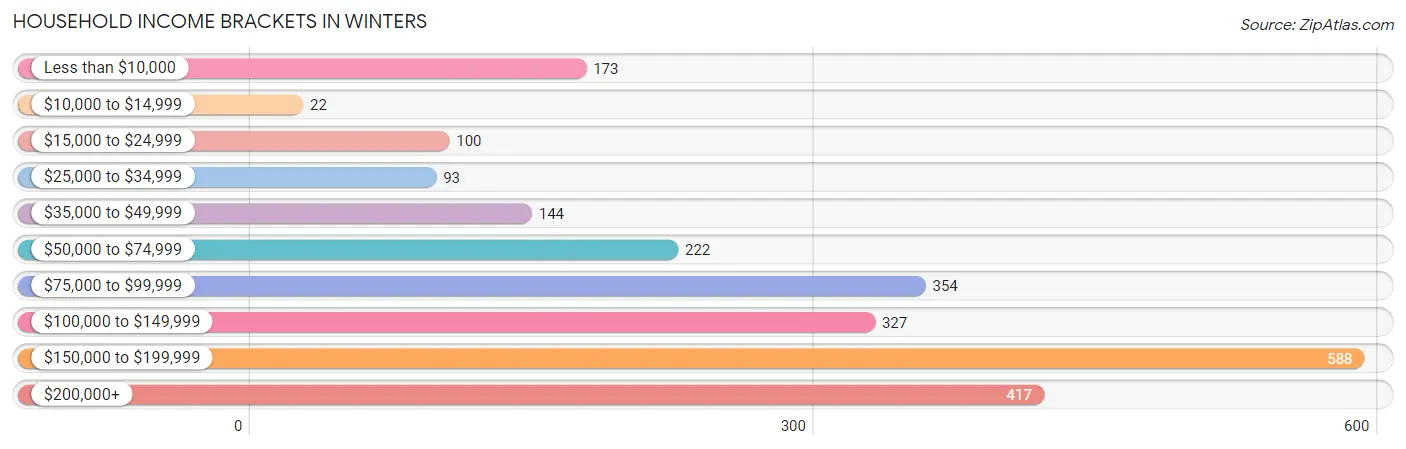
| Income Bracket | # Households | % Households |
| Less than $10,000 | 173 | 7.1% |
| $10,000 to $14,999 | 22 | 0.9% |
| $15,000 to $24,999 | 100 | 4.1% |
| $25,000 to $34,999 | 93 | 3.8% |
| $35,000 to $49,999 | 144 | 5.9% |
| $50,000 to $74,999 | 222 | 9.1% |
| $75,000 to $99,999 | 354 | 14.5% |
| $100,000 to $149,999 | 327 | 13.4% |
| $150,000 to $199,999 | 588 | 24.1% |
| $200,000+ | 417 | 17.1% |
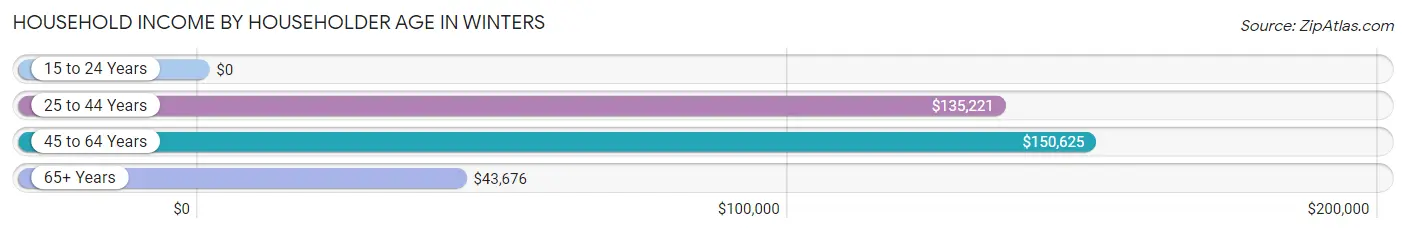
Household Income by Householder Age in Winters
The median household income in Winters is $128,679, with the highest median household income of $150,625 found in the 45 to 64 years age bracket for the primary householder. A total of 1,327 households (54.4%) fall into this category. Meanwhile, the 15 to 24 years age bracket for the primary householder has the lowest median household income of $0, with 17 households (0.7%) in this group.
| Income Bracket | # Households | Median Income |
| 15 to 24 Years | 17 (0.7%) | $0 |
| 25 to 44 Years | 707 (29.0%) | $135,221 |
| 45 to 64 Years | 1,327 (54.4%) | $150,625 |
| 65+ Years | 388 (15.9%) | $43,676 |
| Total | 2,439 (100.0%) | $128,679 |
Poverty in Winters
Income Below Poverty by Sex and Age in Winters
With 5.1% poverty level for males and 8.1% for females among the residents of Winters, 16 and 17 year old males and 75 year old and over females are the most vulnerable to poverty, with 50 males (31.1%) and 43 females (30.1%) in their respective age groups living below the poverty level.
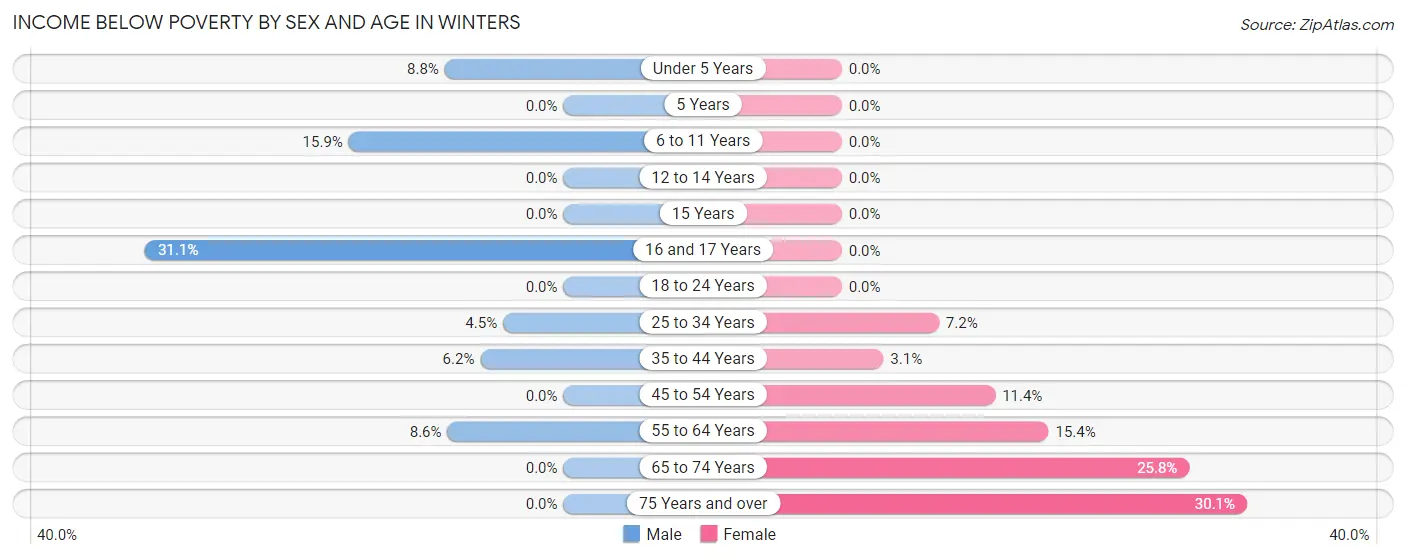
| Age Bracket | Male | Female |
| Under 5 Years | 14 (8.8%) | 0 (0.0%) |
| 5 Years | 0 (0.0%) | 0 (0.0%) |
| 6 to 11 Years | 22 (15.9%) | 0 (0.0%) |
| 12 to 14 Years | 0 (0.0%) | 0 (0.0%) |
| 15 Years | 0 (0.0%) | 0 (0.0%) |
| 16 and 17 Years | 50 (31.1%) | 0 (0.0%) |
| 18 to 24 Years | 0 (0.0%) | 0 (0.0%) |
| 25 to 34 Years | 25 (4.5%) | 29 (7.2%) |
| 35 to 44 Years | 36 (6.2%) | 12 (3.1%) |
| 45 to 54 Years | 0 (0.0%) | 86 (11.4%) |
| 55 to 64 Years | 46 (8.6%) | 64 (15.3%) |
| 65 to 74 Years | 0 (0.0%) | 49 (25.8%) |
| 75 Years and over | 0 (0.0%) | 43 (30.1%) |
| Total | 193 (5.1%) | 283 (8.1%) |
Income Above Poverty by Sex and Age in Winters
According to the poverty statistics in Winters, males aged 5 years and females aged under 5 years are the age groups that are most secure financially, with 100.0% of males and 100.0% of females in these age groups living above the poverty line.
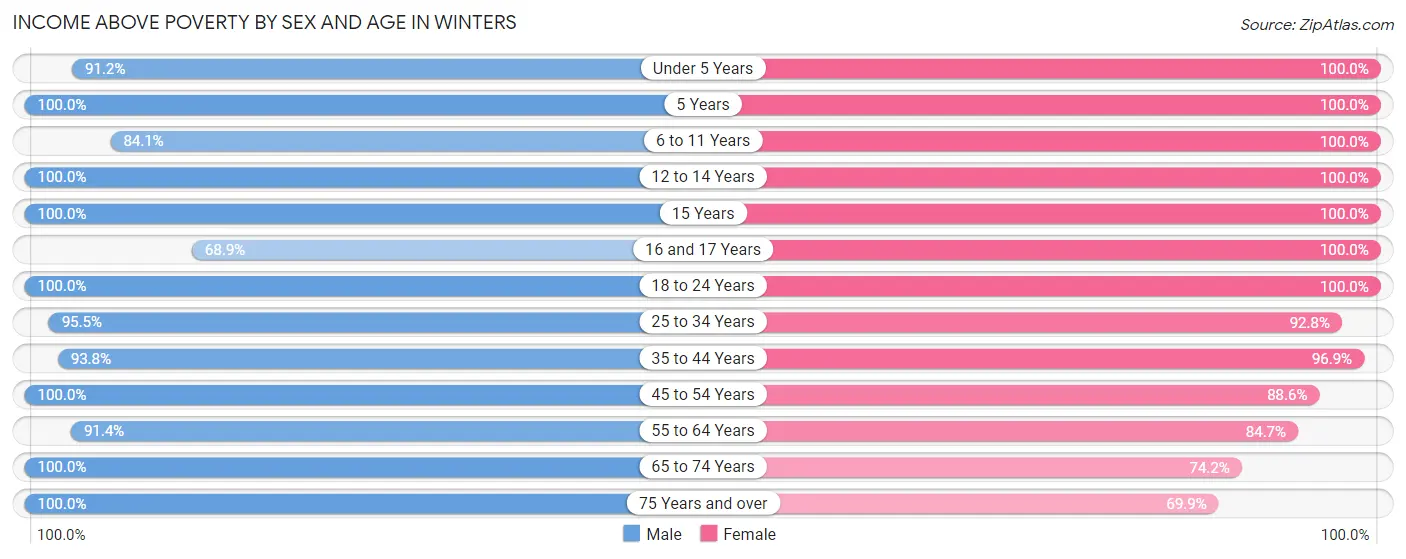
| Age Bracket | Male | Female |
| Under 5 Years | 145 (91.2%) | 258 (100.0%) |
| 5 Years | 72 (100.0%) | 16 (100.0%) |
| 6 to 11 Years | 116 (84.1%) | 211 (100.0%) |
| 12 to 14 Years | 32 (100.0%) | 249 (100.0%) |
| 15 Years | 168 (100.0%) | 142 (100.0%) |
| 16 and 17 Years | 111 (68.9%) | 46 (100.0%) |
| 18 to 24 Years | 436 (100.0%) | 277 (100.0%) |
| 25 to 34 Years | 533 (95.5%) | 373 (92.8%) |
| 35 to 44 Years | 547 (93.8%) | 376 (96.9%) |
| 45 to 54 Years | 650 (100.0%) | 669 (88.6%) |
| 55 to 64 Years | 488 (91.4%) | 353 (84.7%) |
| 65 to 74 Years | 154 (100.0%) | 141 (74.2%) |
| 75 Years and over | 131 (100.0%) | 100 (69.9%) |
| Total | 3,583 (94.9%) | 3,211 (91.9%) |
Income Below Poverty Among Married-Couple Families in Winters
The poverty statistics for married-couple families in Winters show that 4.0% or 55 of the total 1,364 families live below the poverty line. Families with no children have the highest poverty rate of 5.5%, comprising of 34 families. On the other hand, families with 3 or 4 children have the lowest poverty rate of 0.0%, which includes 0 families.
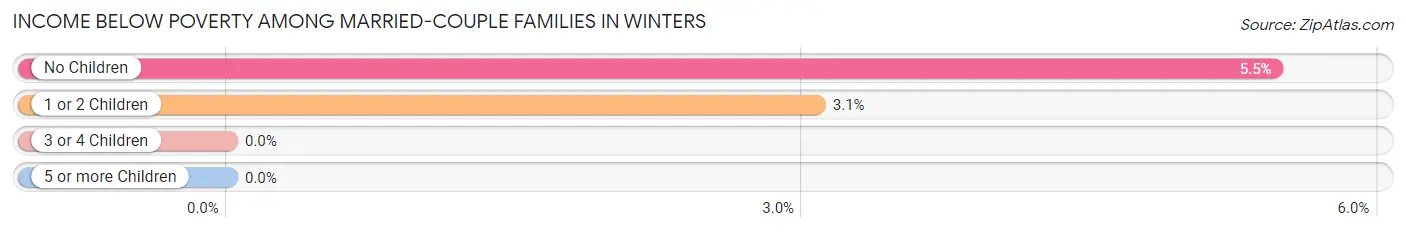
| Children | Above Poverty | Below Poverty |
| No Children | 589 (94.5%) | 34 (5.5%) |
| 1 or 2 Children | 662 (96.9%) | 21 (3.1%) |
| 3 or 4 Children | 58 (100.0%) | 0 (0.0%) |
| 5 or more Children | 0 (0.0%) | 0 (0.0%) |
| Total | 1,309 (96.0%) | 55 (4.0%) |
Income Below Poverty Among Single-Parent Households in Winters
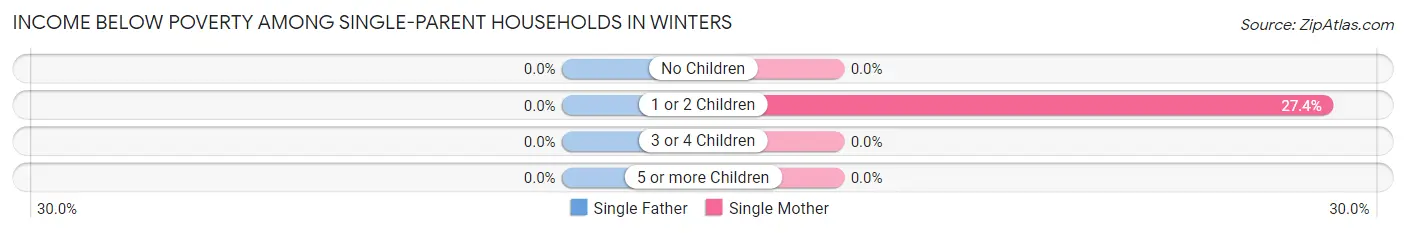
| Children | Single Father | Single Mother |
| No Children | 0 (0.0%) | 0 (0.0%) |
| 1 or 2 Children | 0 (0.0%) | 26 (27.4%) |
| 3 or 4 Children | 0 (0.0%) | 0 (0.0%) |
| 5 or more Children | 0 (0.0%) | 0 (0.0%) |
| Total | 0 (0.0%) | 26 (14.7%) |
Income Below Poverty Among Married-Couple vs Single-Parent Households in Winters
The poverty data for Winters shows that 55 of the married-couple family households (4.0%) and 26 of the single-parent households (6.5%) are living below the poverty level. Within the married-couple family households, those with no children have the highest poverty rate, with 34 households (5.5%) falling below the poverty line. Among the single-parent households, those with 1 or 2 children have the highest poverty rate, with 26 household (11.1%) living below poverty.
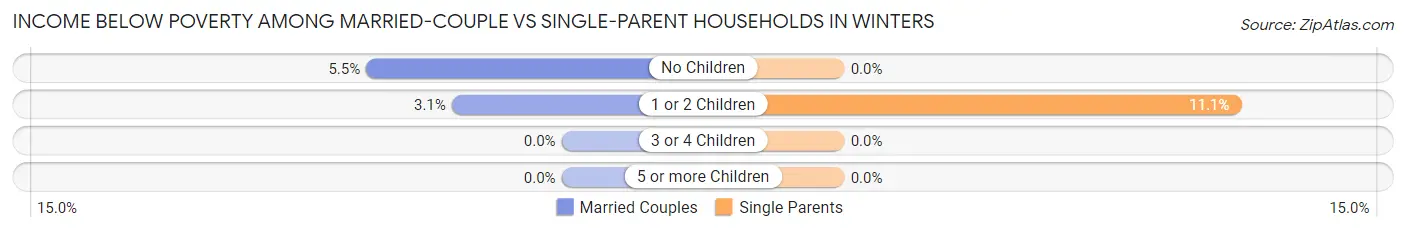
| Children | Married-Couple Families | Single-Parent Households |
| No Children | 34 (5.5%) | 0 (0.0%) |
| 1 or 2 Children | 21 (3.1%) | 26 (11.1%) |
| 3 or 4 Children | 0 (0.0%) | 0 (0.0%) |
| 5 or more Children | 0 (0.0%) | 0 (0.0%) |
| Total | 55 (4.0%) | 26 (6.5%) |
Race in Winters
The most populous races in Winters are White / Caucasian (4,789 | 65.9%), Hispanic or Latino (3,558 | 48.9%), and Two or more Races (1,302 | 17.9%).
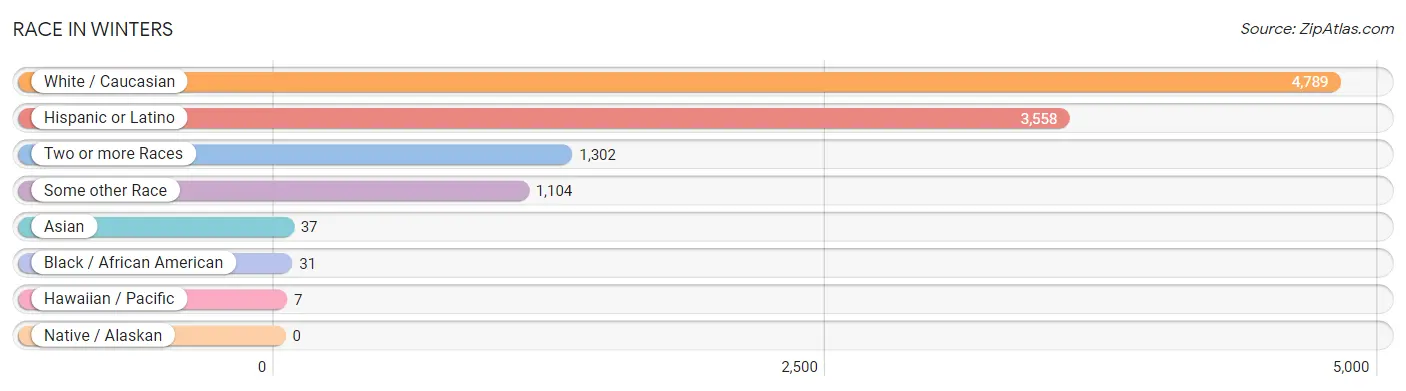
| Race | # Population | % Population |
| Asian | 37 | 0.5% |
| Black / African American | 31 | 0.4% |
| Hawaiian / Pacific | 7 | 0.1% |
| Hispanic or Latino | 3,558 | 48.9% |
| Native / Alaskan | 0 | 0.0% |
| White / Caucasian | 4,789 | 65.9% |
| Two or more Races | 1,302 | 17.9% |
| Some other Race | 1,104 | 15.2% |
| Total | 7,270 | 100.0% |
Ancestry in Winters
The most populous ancestries reported in Winters are Mexican (3,100 | 42.6%), German (846 | 11.6%), Irish (592 | 8.1%), American (519 | 7.1%), and Italian (374 | 5.1%), together accounting for 74.7% of all Winters residents.
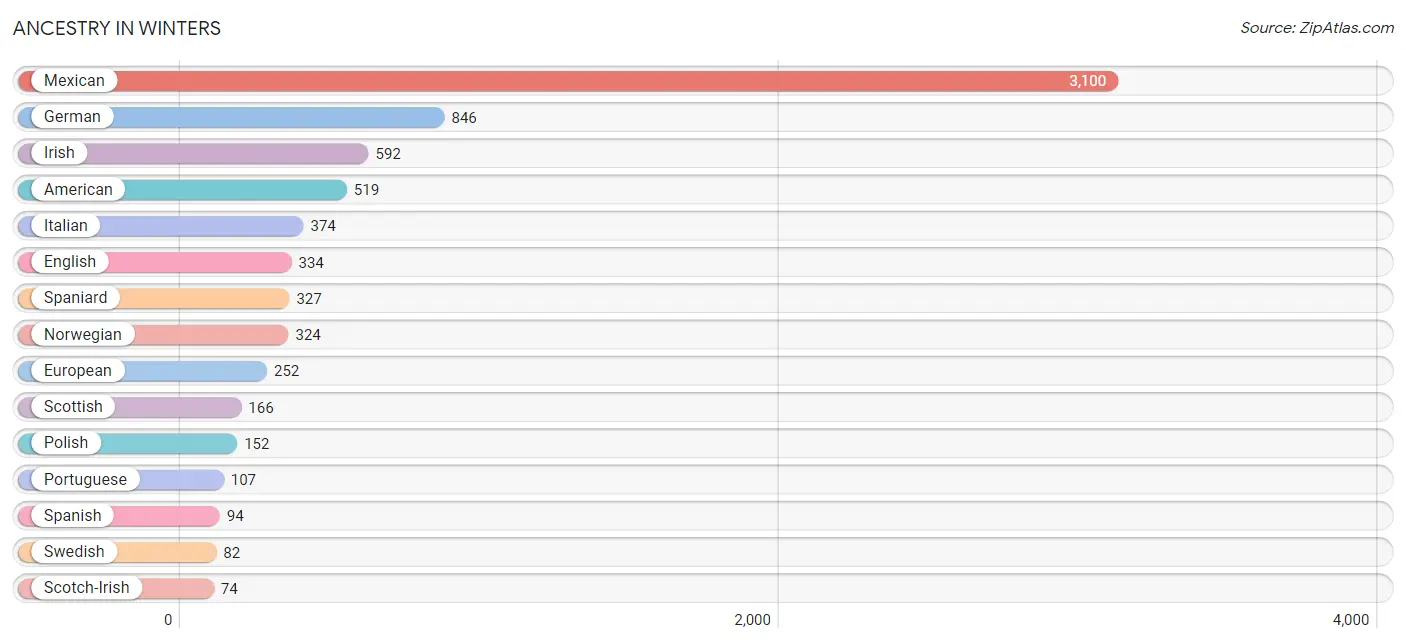
| Ancestry | # Population | % Population |
| African | 31 | 0.4% |
| American | 519 | 7.1% |
| Argentinean | 14 | 0.2% |
| Austrian | 6 | 0.1% |
| Basque | 12 | 0.2% |
| Belgian | 11 | 0.2% |
| Bhutanese | 3 | 0.0% |
| Blackfeet | 16 | 0.2% |
| Burmese | 2 | 0.0% |
| Cherokee | 27 | 0.4% |
| Cree | 7 | 0.1% |
| Crow | 24 | 0.3% |
| Cuban | 8 | 0.1% |
| Czech | 17 | 0.2% |
| Danish | 16 | 0.2% |
| Dutch | 29 | 0.4% |
| English | 334 | 4.6% |
| European | 252 | 3.5% |
| French | 42 | 0.6% |
| German | 846 | 11.6% |
| Greek | 18 | 0.3% |
| Indian (Asian) | 32 | 0.4% |
| Irish | 592 | 8.1% |
| Italian | 374 | 5.1% |
| Lithuanian | 9 | 0.1% |
| Luxembourger | 7 | 0.1% |
| Mexican | 3,100 | 42.6% |
| Norwegian | 324 | 4.5% |
| Polish | 152 | 2.1% |
| Portuguese | 107 | 1.5% |
| Russian | 9 | 0.1% |
| Scandinavian | 37 | 0.5% |
| Scotch-Irish | 74 | 1.0% |
| Scottish | 166 | 2.3% |
| Slovak | 13 | 0.2% |
| South American | 14 | 0.2% |
| Spaniard | 327 | 4.5% |
| Spanish | 94 | 1.3% |
| Sri Lankan | 9 | 0.1% |
| Subsaharan African | 31 | 0.4% |
| Swedish | 82 | 1.1% |
| Swiss | 24 | 0.3% |
| Welsh | 11 | 0.2% | View All 43 Rows |
Immigrants in Winters
The most numerous immigrant groups reported in Winters came from Central America (1,213 | 16.7%), Latin America (1,213 | 16.7%), Mexico (1,213 | 16.7%), Asia (37 | 0.5%), and Europe (37 | 0.5%), together accounting for 51.1% of all Winters residents.
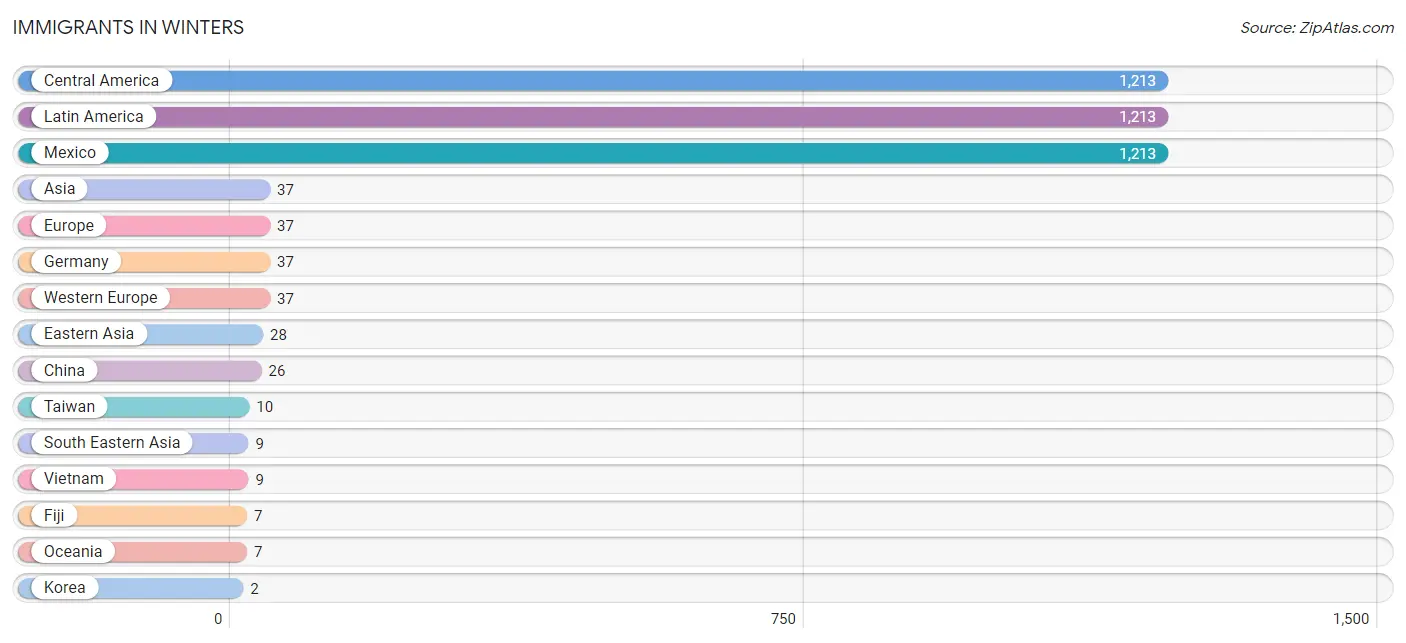
| Immigration Origin | # Population | % Population |
| Asia | 37 | 0.5% |
| Central America | 1,213 | 16.7% |
| China | 26 | 0.4% |
| Eastern Asia | 28 | 0.4% |
| Europe | 37 | 0.5% |
| Fiji | 7 | 0.1% |
| Germany | 37 | 0.5% |
| Korea | 2 | 0.0% |
| Latin America | 1,213 | 16.7% |
| Mexico | 1,213 | 16.7% |
| Oceania | 7 | 0.1% |
| South Eastern Asia | 9 | 0.1% |
| Taiwan | 10 | 0.1% |
| Vietnam | 9 | 0.1% |
| Western Europe | 37 | 0.5% | View All 15 Rows |
Sex and Age in Winters
Sex and Age in Winters
The most populous age groups in Winters are 25 to 29 Years (435 | 11.5%) for men and 50 to 54 Years (445 | 12.7%) for women.
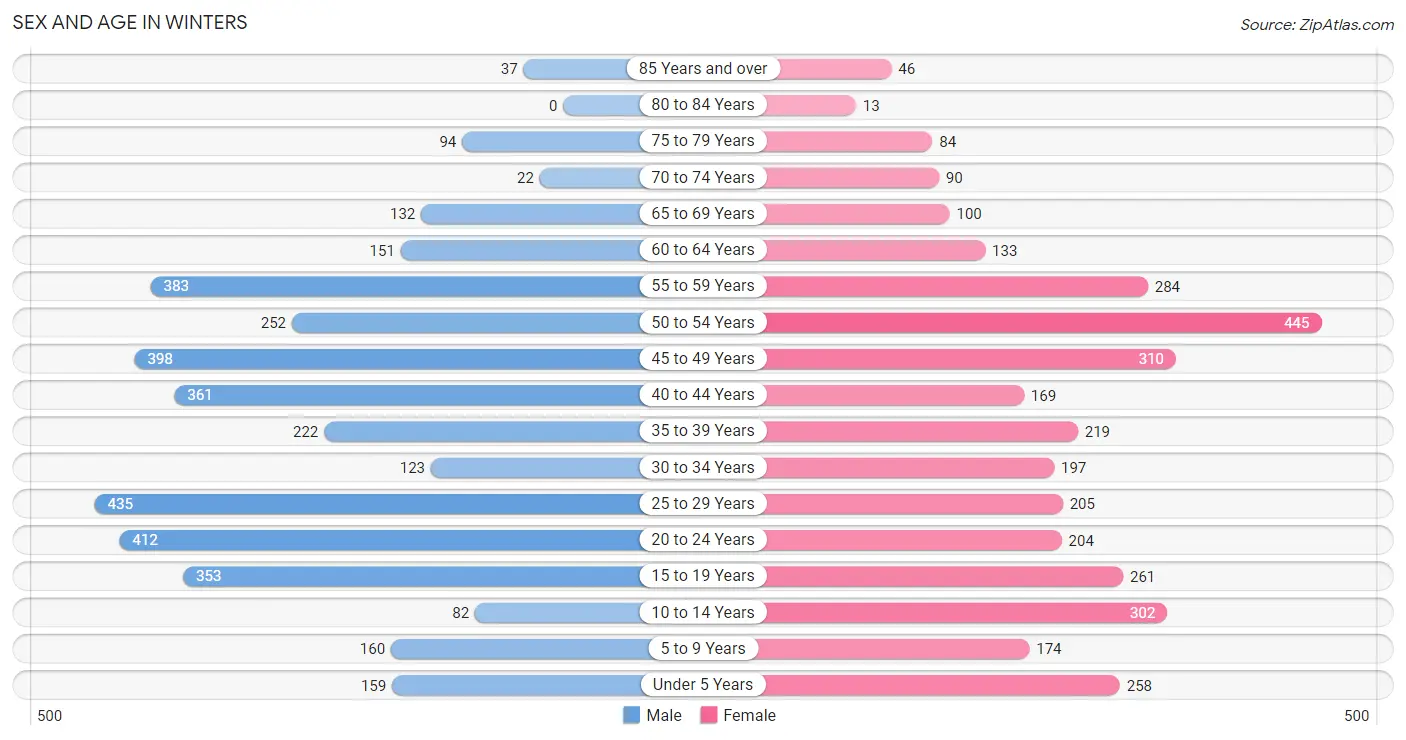
| Age Bracket | Male | Female |
| Under 5 Years | 159 (4.2%) | 258 (7.4%) |
| 5 to 9 Years | 160 (4.2%) | 174 (5.0%) |
| 10 to 14 Years | 82 (2.2%) | 302 (8.6%) |
| 15 to 19 Years | 353 (9.3%) | 261 (7.5%) |
| 20 to 24 Years | 412 (10.9%) | 204 (5.8%) |
| 25 to 29 Years | 435 (11.5%) | 205 (5.9%) |
| 30 to 34 Years | 123 (3.3%) | 197 (5.6%) |
| 35 to 39 Years | 222 (5.9%) | 219 (6.3%) |
| 40 to 44 Years | 361 (9.6%) | 169 (4.8%) |
| 45 to 49 Years | 398 (10.5%) | 310 (8.9%) |
| 50 to 54 Years | 252 (6.7%) | 445 (12.7%) |
| 55 to 59 Years | 383 (10.1%) | 284 (8.1%) |
| 60 to 64 Years | 151 (4.0%) | 133 (3.8%) |
| 65 to 69 Years | 132 (3.5%) | 100 (2.9%) |
| 70 to 74 Years | 22 (0.6%) | 90 (2.6%) |
| 75 to 79 Years | 94 (2.5%) | 84 (2.4%) |
| 80 to 84 Years | 0 (0.0%) | 13 (0.4%) |
| 85 Years and over | 37 (1.0%) | 46 (1.3%) |
| Total | 3,776 (100.0%) | 3,494 (100.0%) |
Families and Households in Winters
Median Family Size in Winters
The median family size in Winters is 3.49 persons per family, with single male/father families (225 | 12.7%) accounting for the largest median family size of 3.86 persons per family. On the other hand, single female/mother families (177 | 10.0%) represent the smallest median family size with 3.24 persons per family.
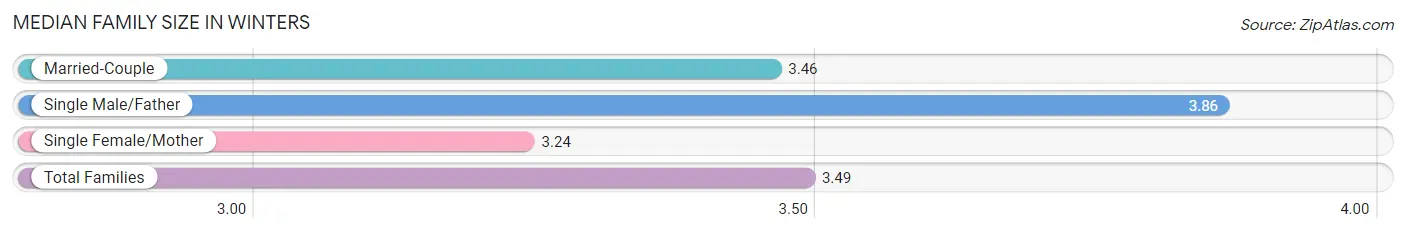
| Family Type | # Families | Family Size |
| Married-Couple | 1,364 (77.2%) | 3.46 |
| Single Male/Father | 225 (12.7%) | 3.86 |
| Single Female/Mother | 177 (10.0%) | 3.24 |
| Total Families | 1,766 (100.0%) | 3.49 |
Median Household Size in Winters
The median household size in Winters is 2.97 persons per household, with single male/father households (225 | 9.2%) accounting for the largest median household size of 4.48 persons per household. non-family households (673 | 27.6%) represent the smallest median household size with 1.28 persons per household.
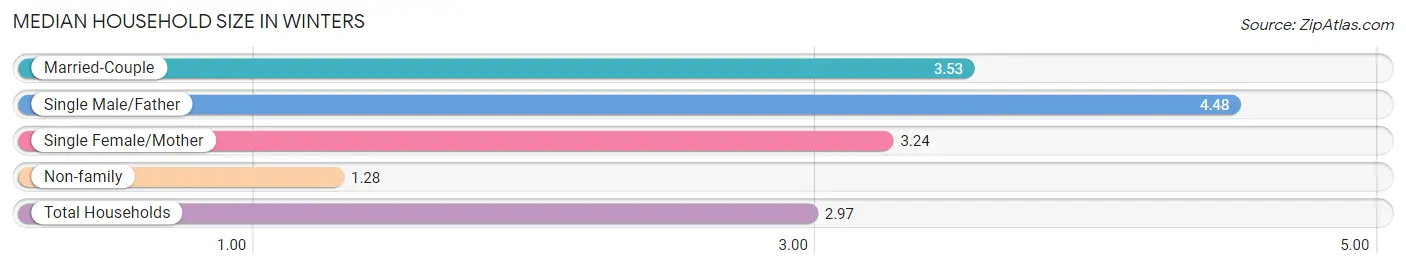
| Household Type | # Households | Household Size |
| Married-Couple | 1,364 (55.9%) | 3.53 |
| Single Male/Father | 225 (9.2%) | 4.48 |
| Single Female/Mother | 177 (7.3%) | 3.24 |
| Non-family | 673 (27.6%) | 1.28 |
| Total Households | 2,439 (100.0%) | 2.97 |
Household Size by Marriage Status in Winters
Out of a total of 2,439 households in Winters, 1,766 (72.4%) are family households, while 673 (27.6%) are nonfamily households. The most numerous type of family households are 2-person households, comprising 559, and the most common type of nonfamily households are 1-person households, comprising 455.
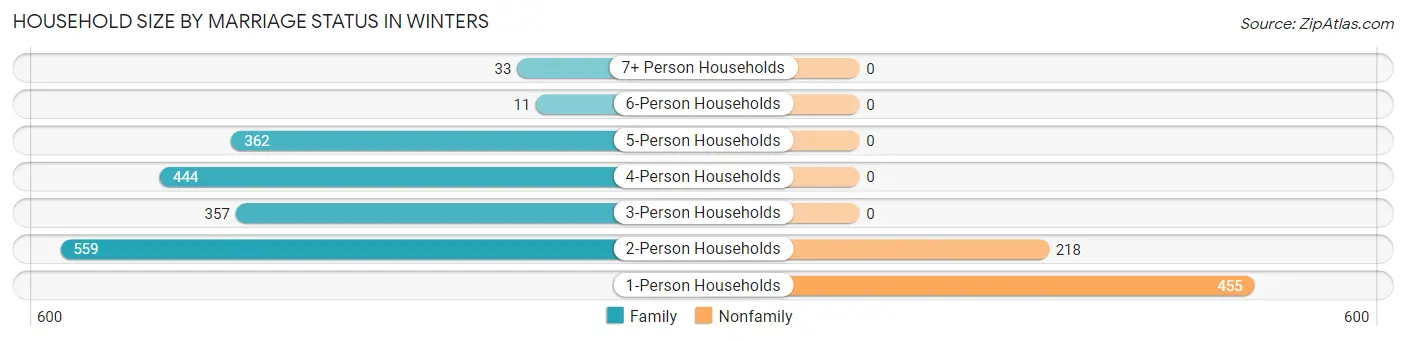
| Household Size | Family Households | Nonfamily Households |
| 1-Person Households | - | 455 (18.7%) |
| 2-Person Households | 559 (22.9%) | 218 (8.9%) |
| 3-Person Households | 357 (14.6%) | 0 (0.0%) |
| 4-Person Households | 444 (18.2%) | 0 (0.0%) |
| 5-Person Households | 362 (14.8%) | 0 (0.0%) |
| 6-Person Households | 11 (0.4%) | 0 (0.0%) |
| 7+ Person Households | 33 (1.3%) | 0 (0.0%) |
| Total | 1,766 (72.4%) | 673 (27.6%) |
Female Fertility in Winters
Fertility by Age in Winters
Average fertility rate in Winters is 40.0 births per 1,000 women. Women in the age bracket of 20 to 34 years have the highest fertility rate with 89.0 births per 1,000 women. Women in the age bracket of 20 to 34 years acount for 78.3% of all women with births.
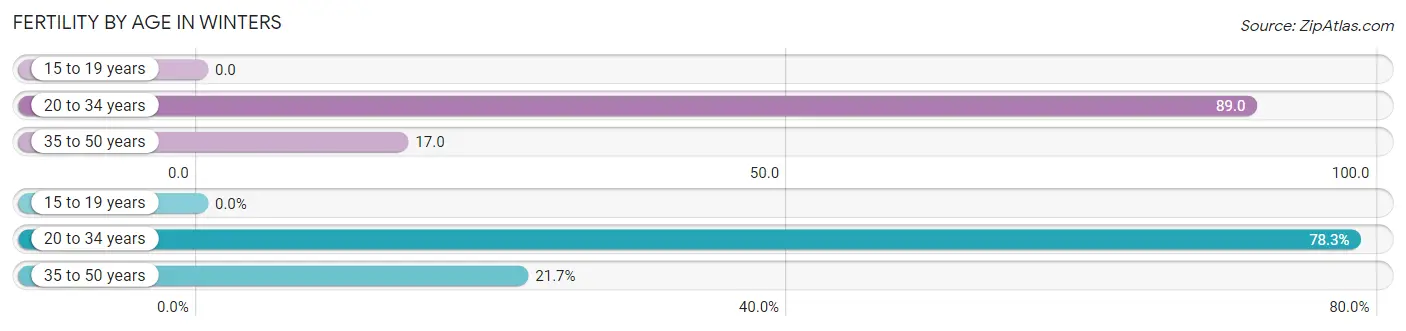
| Age Bracket | Women with Births | Births / 1,000 Women |
| 15 to 19 years | 0 (0.0%) | 0.0 |
| 20 to 34 years | 54 (78.3%) | 89.0 |
| 35 to 50 years | 15 (21.7%) | 17.0 |
| Total | 69 (100.0%) | 40.0 |
Fertility by Age by Marriage Status in Winters
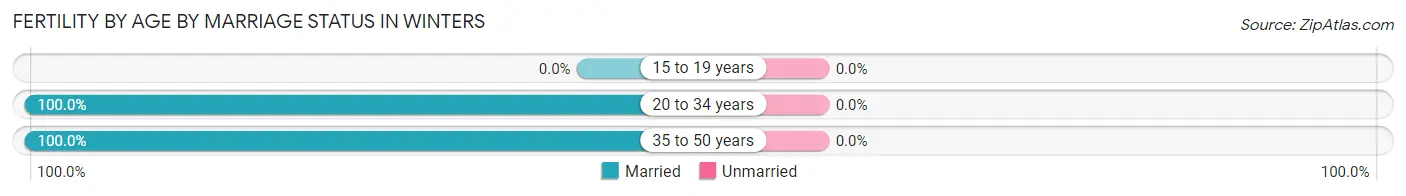
| Age Bracket | Married | Unmarried |
| 15 to 19 years | 0 (0.0%) | 0 (0.0%) |
| 20 to 34 years | 54 (100.0%) | 0 (0.0%) |
| 35 to 50 years | 15 (100.0%) | 0 (0.0%) |
| Total | 69 (100.0%) | 0 (0.0%) |
Fertility by Education in Winters
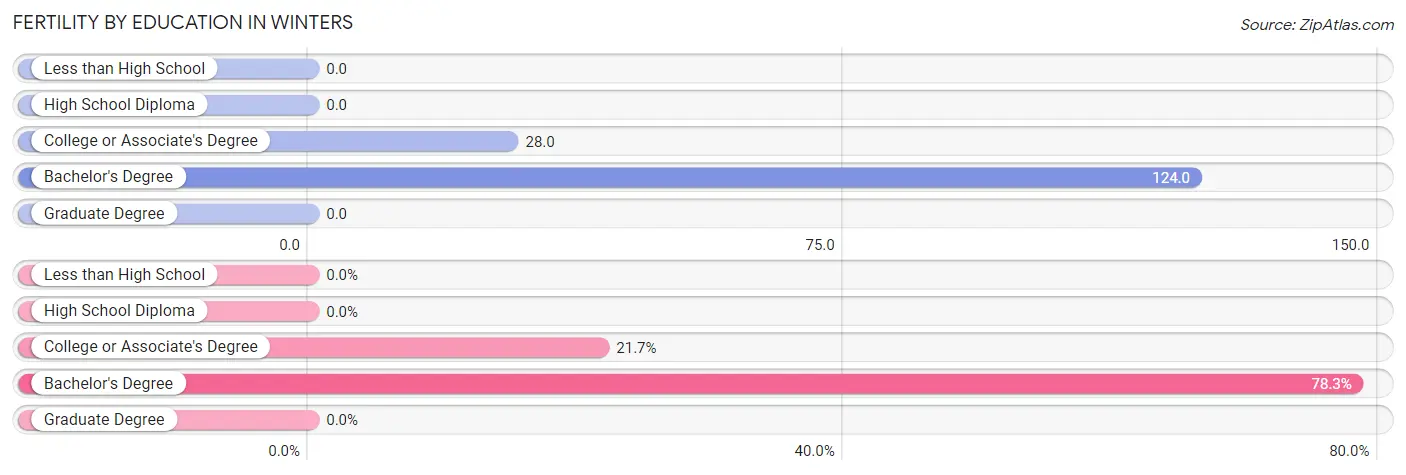
| Educational Attainment | Women with Births | Births / 1,000 Women |
| Less than High School | 0 (0.0%) | 0.0 |
| High School Diploma | 0 (0.0%) | 0.0 |
| College or Associate's Degree | 15 (21.7%) | 28.0 |
| Bachelor's Degree | 54 (78.3%) | 124.0 |
| Graduate Degree | 0 (0.0%) | 0.0 |
| Total | 69 (100.0%) | 40.0 |
Fertility by Education by Marriage Status in Winters
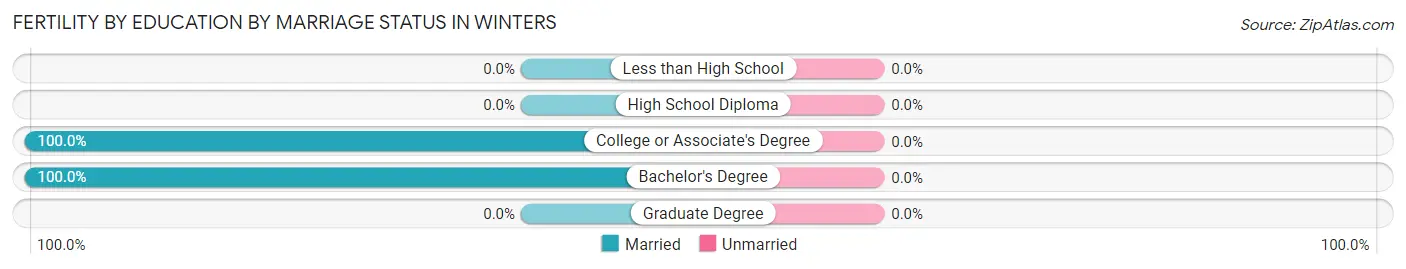
| Educational Attainment | Married | Unmarried |
| Less than High School | 0 (0.0%) | 0 (0.0%) |
| High School Diploma | 0 (0.0%) | 0 (0.0%) |
| College or Associate's Degree | 15 (100.0%) | 0 (0.0%) |
| Bachelor's Degree | 54 (100.0%) | 0 (0.0%) |
| Graduate Degree | 0 (0.0%) | 0 (0.0%) |
| Total | 69 (100.0%) | 0 (0.0%) |
Employment Characteristics in Winters
Employment by Class of Employer in Winters
Among the 4,115 employed individuals in Winters, private company employees (2,879 | 70.0%), local government employees (384 | 9.3%), and state government employees (283 | 6.9%) make up the most common classes of employment.
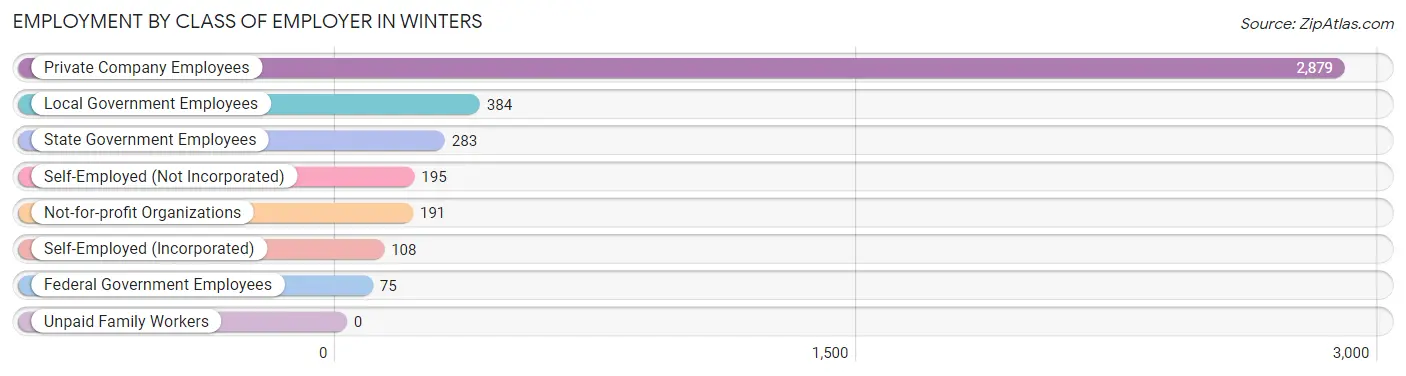
| Employer Class | # Employees | % Employees |
| Private Company Employees | 2,879 | 70.0% |
| Self-Employed (Incorporated) | 108 | 2.6% |
| Self-Employed (Not Incorporated) | 195 | 4.7% |
| Not-for-profit Organizations | 191 | 4.6% |
| Local Government Employees | 384 | 9.3% |
| State Government Employees | 283 | 6.9% |
| Federal Government Employees | 75 | 1.8% |
| Unpaid Family Workers | 0 | 0.0% |
| Total | 4,115 | 100.0% |
Employment Status by Age in Winters
According to the labor force statistics for Winters, out of the total population over 16 years of age (5,825), 74.3% or 4,328 individuals are in the labor force, with 1.9% or 82 of them unemployed. The age group with the highest labor force participation rate is 35 to 44 years, with 92.3% or 896 individuals in the labor force. Within the labor force, the 16 to 19 years age range has the highest percentage of unemployed individuals, with 22.3% or 25 of them being unemployed.
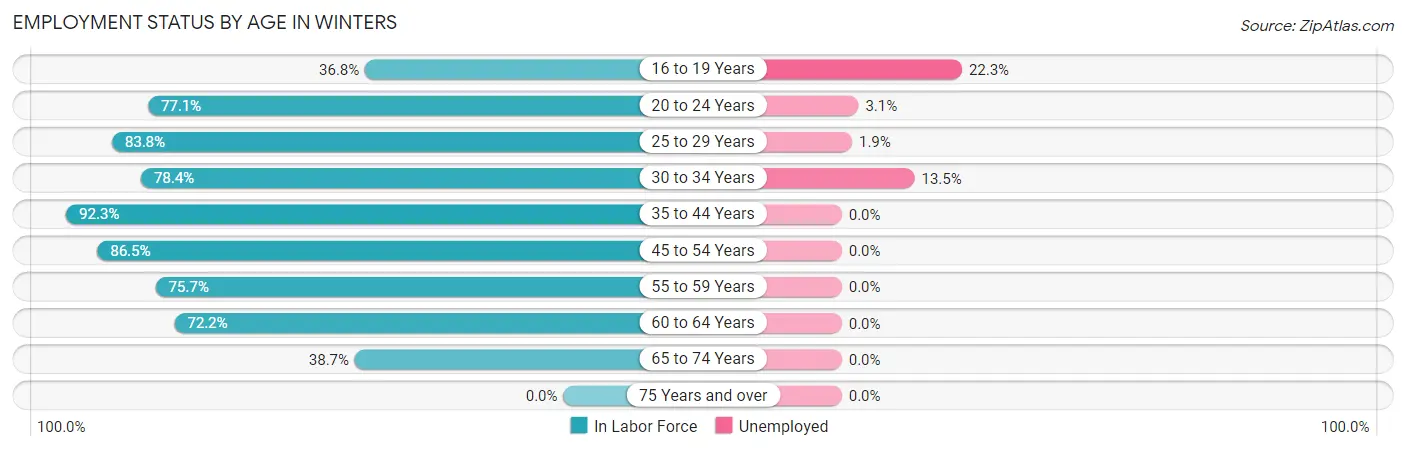
| Age Bracket | In Labor Force | Unemployed |
| 16 to 19 Years | 112 (36.8%) | 25 (22.3%) |
| 20 to 24 Years | 475 (77.1%) | 15 (3.1%) |
| 25 to 29 Years | 536 (83.8%) | 10 (1.9%) |
| 30 to 34 Years | 251 (78.4%) | 34 (13.5%) |
| 35 to 44 Years | 896 (92.3%) | 0 (0.0%) |
| 45 to 54 Years | 1,215 (86.5%) | 0 (0.0%) |
| 55 to 59 Years | 505 (75.7%) | 0 (0.0%) |
| 60 to 64 Years | 205 (72.2%) | 0 (0.0%) |
| 65 to 74 Years | 133 (38.7%) | 0 (0.0%) |
| 75 Years and over | 0 (0.0%) | 0 (0.0%) |
| Total | 4,328 (74.3%) | 82 (1.9%) |
Employment Status by Educational Attainment in Winters
According to labor force statistics for Winters, 84.2% of individuals (3,610) out of the total population between 25 and 64 years of age (4,287) are in the labor force, with 1.2% or 43 of them being unemployed. The group with the highest labor force participation rate are those with the educational attainment of bachelor's degree or higher, with 91.8% or 1,187 individuals in the labor force. Within the labor force, individuals with bachelor's degree or higher education have the highest percentage of unemployment, with 2.9% or 34 of them being unemployed.
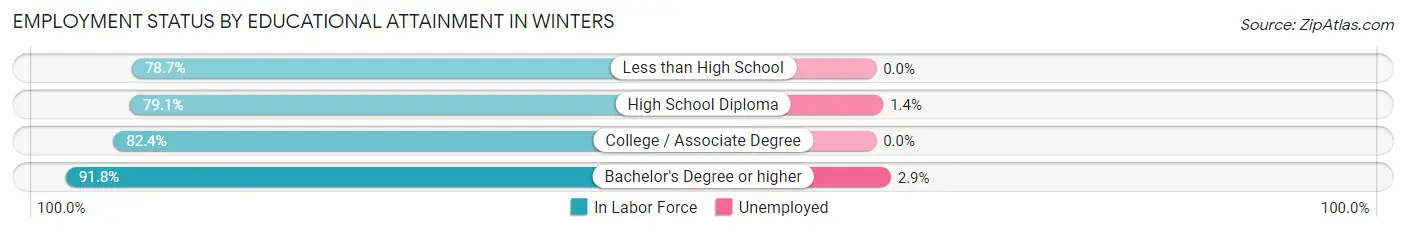
| Educational Attainment | In Labor Force | Unemployed |
| Less than High School | 328 (78.7%) | 0 (0.0%) |
| High School Diploma | 727 (79.1%) | 13 (1.4%) |
| College / Associate Degree | 1,366 (82.4%) | 0 (0.0%) |
| Bachelor's Degree or higher | 1,187 (91.8%) | 37 (2.9%) |
| Total | 3,610 (84.2%) | 51 (1.2%) |
Employment Occupations by Sex in Winters
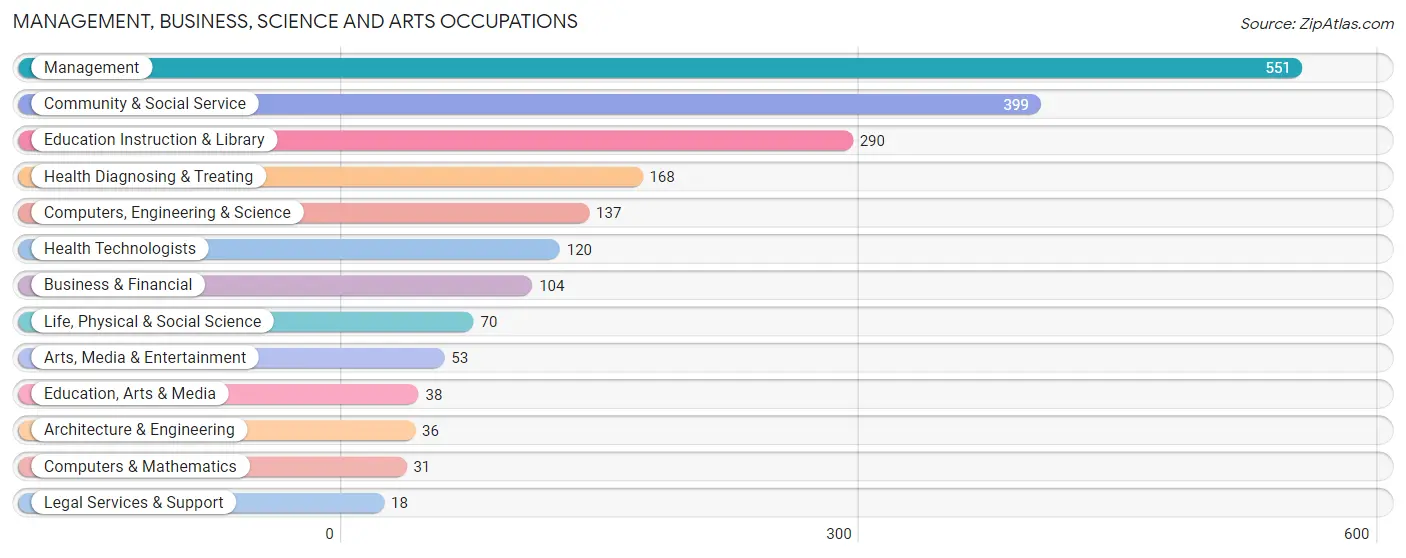
Management, Business, Science and Arts Occupations
The most common Management, Business, Science and Arts occupations in Winters are Management (551 | 13.1%), Community & Social Service (399 | 9.5%), Education Instruction & Library (290 | 6.9%), Health Diagnosing & Treating (168 | 4.0%), and Computers, Engineering & Science (137 | 3.3%).
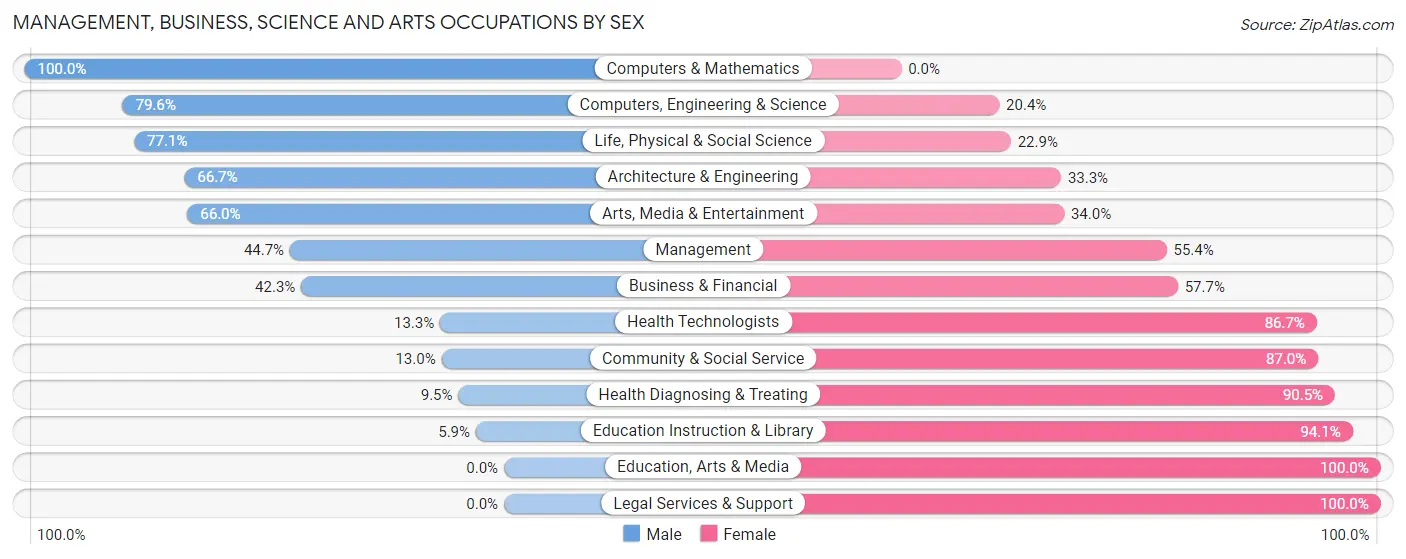
Management, Business, Science and Arts Occupations by Sex
Within the Management, Business, Science and Arts occupations in Winters, the most male-oriented occupations are Computers & Mathematics (100.0%), Computers, Engineering & Science (79.6%), and Life, Physical & Social Science (77.1%), while the most female-oriented occupations are Education, Arts & Media (100.0%), Legal Services & Support (100.0%), and Education Instruction & Library (94.1%).
| Occupation | Male | Female |
| Management | 246 (44.7%) | 305 (55.3%) |
| Business & Financial | 44 (42.3%) | 60 (57.7%) |
| Computers, Engineering & Science | 109 (79.6%) | 28 (20.4%) |
| Computers & Mathematics | 31 (100.0%) | 0 (0.0%) |
| Architecture & Engineering | 24 (66.7%) | 12 (33.3%) |
| Life, Physical & Social Science | 54 (77.1%) | 16 (22.9%) |
| Community & Social Service | 52 (13.0%) | 347 (87.0%) |
| Education, Arts & Media | 0 (0.0%) | 38 (100.0%) |
| Legal Services & Support | 0 (0.0%) | 18 (100.0%) |
| Education Instruction & Library | 17 (5.9%) | 273 (94.1%) |
| Arts, Media & Entertainment | 35 (66.0%) | 18 (34.0%) |
| Health Diagnosing & Treating | 16 (9.5%) | 152 (90.5%) |
| Health Technologists | 16 (13.3%) | 104 (86.7%) |
| Total (Category) | 467 (34.4%) | 892 (65.6%) |
| Total (Overall) | 2,391 (56.8%) | 1,816 (43.2%) |
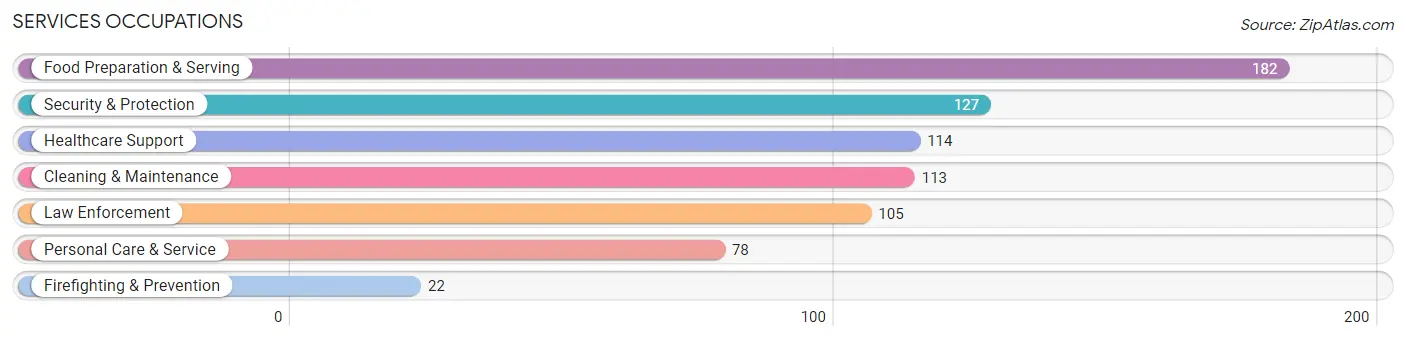
Services Occupations
The most common Services occupations in Winters are Food Preparation & Serving (182 | 4.3%), Security & Protection (127 | 3.0%), Healthcare Support (114 | 2.7%), Cleaning & Maintenance (113 | 2.7%), and Law Enforcement (105 | 2.5%).
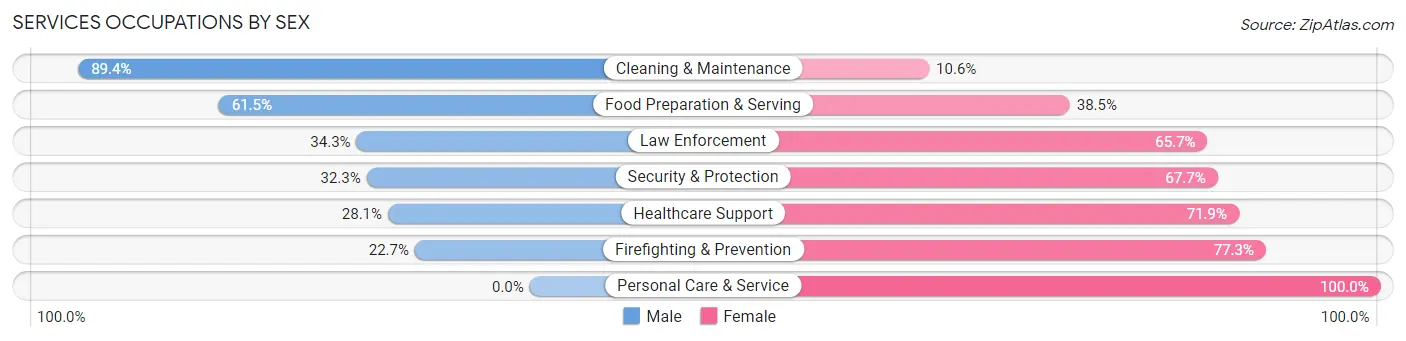
Services Occupations by Sex
Within the Services occupations in Winters, the most male-oriented occupations are Cleaning & Maintenance (89.4%), Food Preparation & Serving (61.5%), and Law Enforcement (34.3%), while the most female-oriented occupations are Personal Care & Service (100.0%), Firefighting & Prevention (77.3%), and Healthcare Support (71.9%).
| Occupation | Male | Female |
| Healthcare Support | 32 (28.1%) | 82 (71.9%) |
| Security & Protection | 41 (32.3%) | 86 (67.7%) |
| Firefighting & Prevention | 5 (22.7%) | 17 (77.3%) |
| Law Enforcement | 36 (34.3%) | 69 (65.7%) |
| Food Preparation & Serving | 112 (61.5%) | 70 (38.5%) |
| Cleaning & Maintenance | 101 (89.4%) | 12 (10.6%) |
| Personal Care & Service | 0 (0.0%) | 78 (100.0%) |
| Total (Category) | 286 (46.6%) | 328 (53.4%) |
| Total (Overall) | 2,391 (56.8%) | 1,816 (43.2%) |
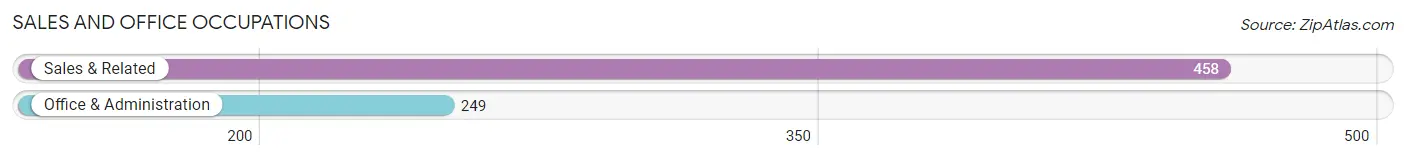
Sales and Office Occupations
The most common Sales and Office occupations in Winters are Sales & Related (458 | 10.9%), and Office & Administration (249 | 5.9%).
Sales and Office Occupations by Sex
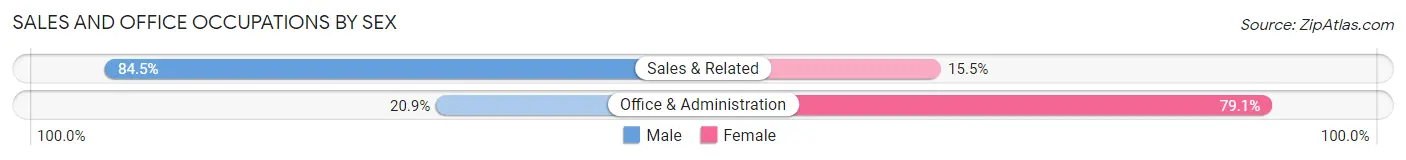
| Occupation | Male | Female |
| Sales & Related | 387 (84.5%) | 71 (15.5%) |
| Office & Administration | 52 (20.9%) | 197 (79.1%) |
| Total (Category) | 439 (62.1%) | 268 (37.9%) |
| Total (Overall) | 2,391 (56.8%) | 1,816 (43.2%) |
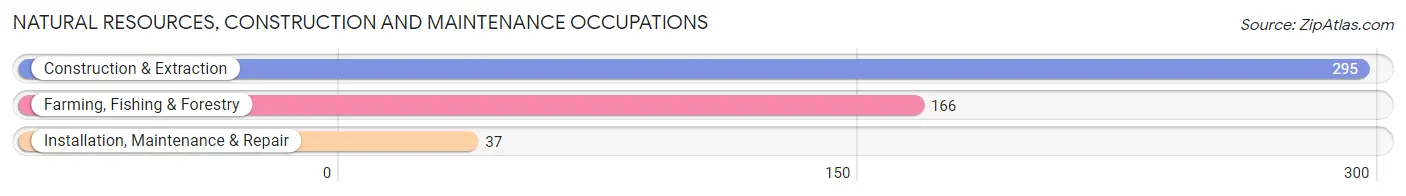
Natural Resources, Construction and Maintenance Occupations
The most common Natural Resources, Construction and Maintenance occupations in Winters are Construction & Extraction (295 | 7.0%), Farming, Fishing & Forestry (166 | 4.0%), and Installation, Maintenance & Repair (37 | 0.9%).
Natural Resources, Construction and Maintenance Occupations by Sex
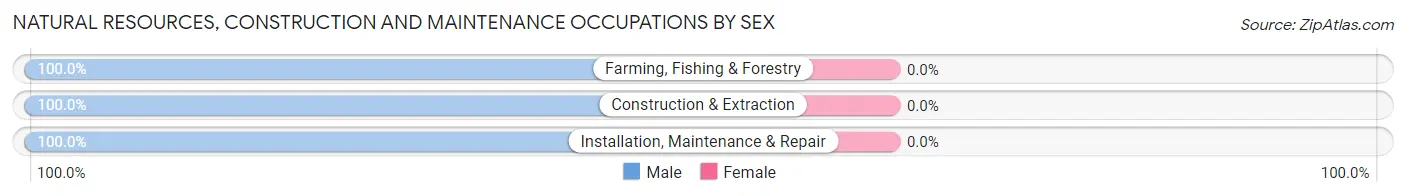
| Occupation | Male | Female |
| Farming, Fishing & Forestry | 166 (100.0%) | 0 (0.0%) |
| Construction & Extraction | 295 (100.0%) | 0 (0.0%) |
| Installation, Maintenance & Repair | 37 (100.0%) | 0 (0.0%) |
| Total (Category) | 498 (100.0%) | 0 (0.0%) |
| Total (Overall) | 2,391 (56.8%) | 1,816 (43.2%) |
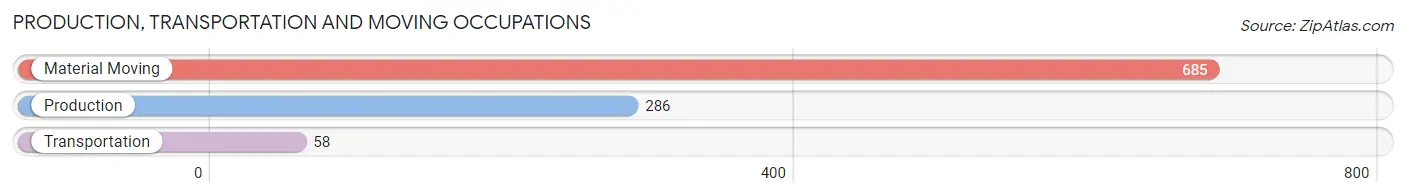
Production, Transportation and Moving Occupations
The most common Production, Transportation and Moving occupations in Winters are Material Moving (685 | 16.3%), Production (286 | 6.8%), and Transportation (58 | 1.4%).
Production, Transportation and Moving Occupations by Sex
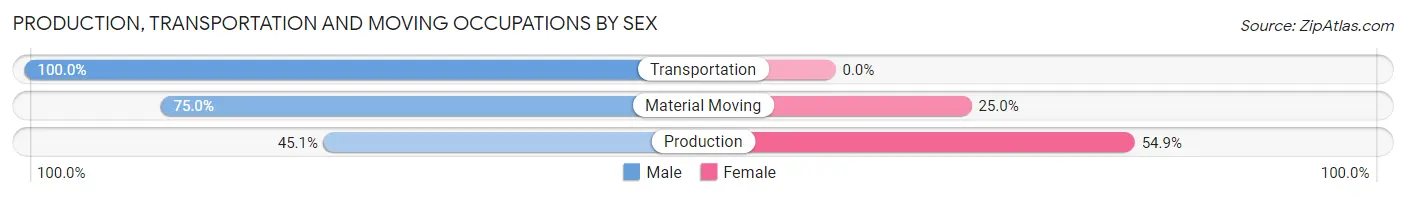
| Occupation | Male | Female |
| Production | 129 (45.1%) | 157 (54.9%) |
| Transportation | 58 (100.0%) | 0 (0.0%) |
| Material Moving | 514 (75.0%) | 171 (25.0%) |
| Total (Category) | 701 (68.1%) | 328 (31.9%) |
| Total (Overall) | 2,391 (56.8%) | 1,816 (43.2%) |
Employment Industries by Sex in Winters
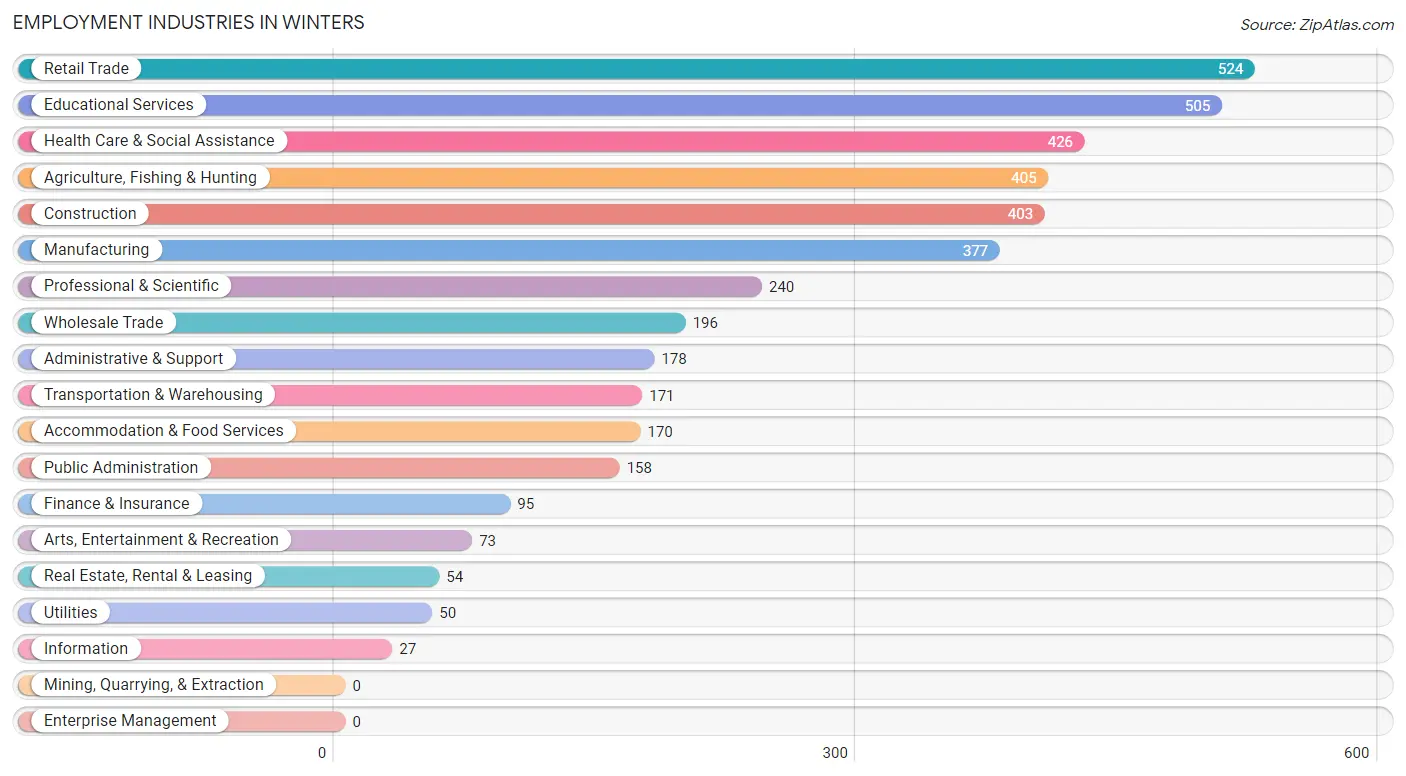
Employment Industries in Winters
The major employment industries in Winters include Retail Trade (524 | 12.5%), Educational Services (505 | 12.0%), Health Care & Social Assistance (426 | 10.1%), Agriculture, Fishing & Hunting (405 | 9.6%), and Construction (403 | 9.6%).
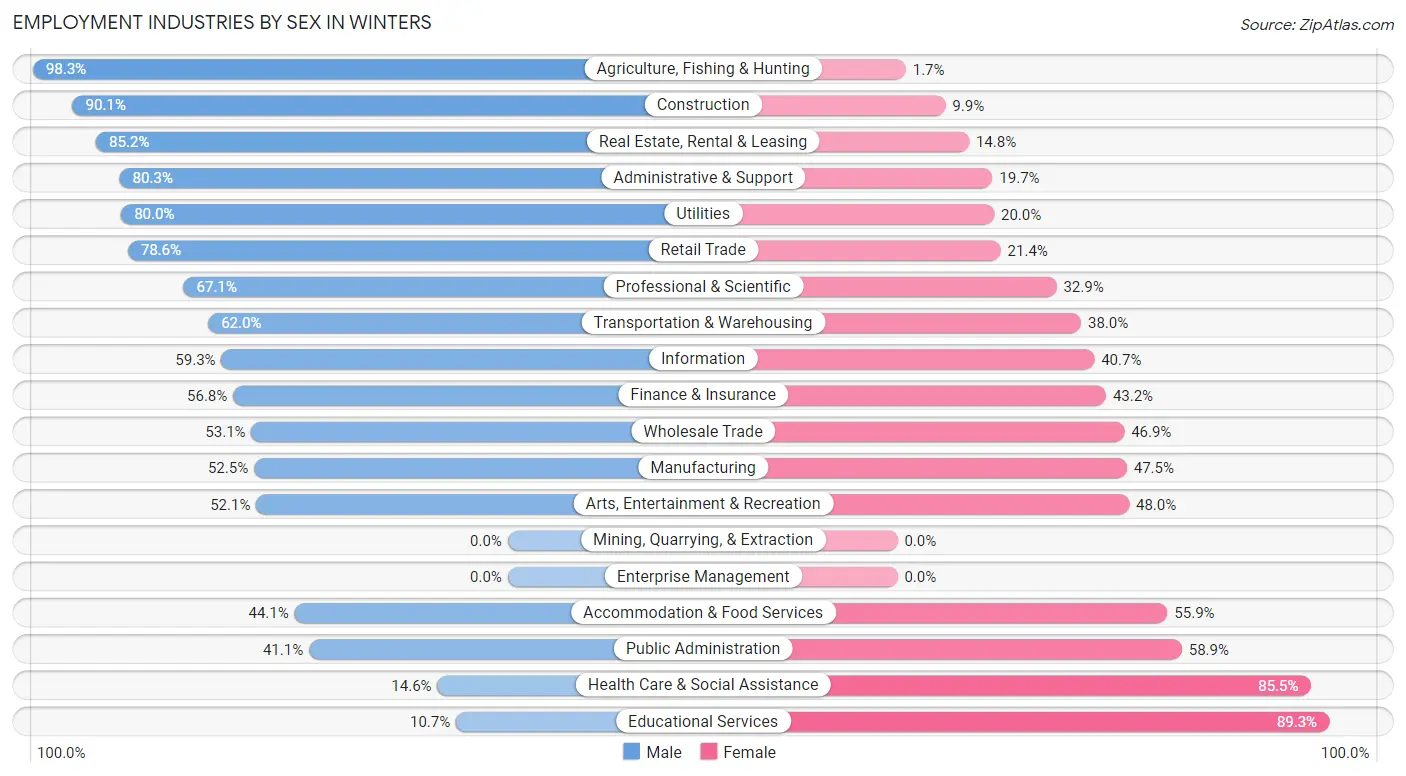
Employment Industries by Sex in Winters
The Winters industries that see more men than women are Agriculture, Fishing & Hunting (98.3%), Construction (90.1%), and Real Estate, Rental & Leasing (85.2%), whereas the industries that tend to have a higher number of women are Educational Services (89.3%), Health Care & Social Assistance (85.5%), and Public Administration (58.9%).
| Industry | Male | Female |
| Agriculture, Fishing & Hunting | 398 (98.3%) | 7 (1.7%) |
| Mining, Quarrying, & Extraction | 0 (0.0%) | 0 (0.0%) |
| Construction | 363 (90.1%) | 40 (9.9%) |
| Manufacturing | 198 (52.5%) | 179 (47.5%) |
| Wholesale Trade | 104 (53.1%) | 92 (46.9%) |
| Retail Trade | 412 (78.6%) | 112 (21.4%) |
| Transportation & Warehousing | 106 (62.0%) | 65 (38.0%) |
| Utilities | 40 (80.0%) | 10 (20.0%) |
| Information | 16 (59.3%) | 11 (40.7%) |
| Finance & Insurance | 54 (56.8%) | 41 (43.2%) |
| Real Estate, Rental & Leasing | 46 (85.2%) | 8 (14.8%) |
| Professional & Scientific | 161 (67.1%) | 79 (32.9%) |
| Enterprise Management | 0 (0.0%) | 0 (0.0%) |
| Administrative & Support | 143 (80.3%) | 35 (19.7%) |
| Educational Services | 54 (10.7%) | 451 (89.3%) |
| Health Care & Social Assistance | 62 (14.5%) | 364 (85.5%) |
| Arts, Entertainment & Recreation | 38 (52.0%) | 35 (47.9%) |
| Accommodation & Food Services | 75 (44.1%) | 95 (55.9%) |
| Public Administration | 65 (41.1%) | 93 (58.9%) |
| Total | 2,391 (56.8%) | 1,816 (43.2%) |
Education in Winters
School Enrollment in Winters
The most common levels of schooling among the 1,809 students in Winters are high school (713 | 39.4%), college / undergraduate (422 | 23.3%), and elementary school (204 | 11.3%).
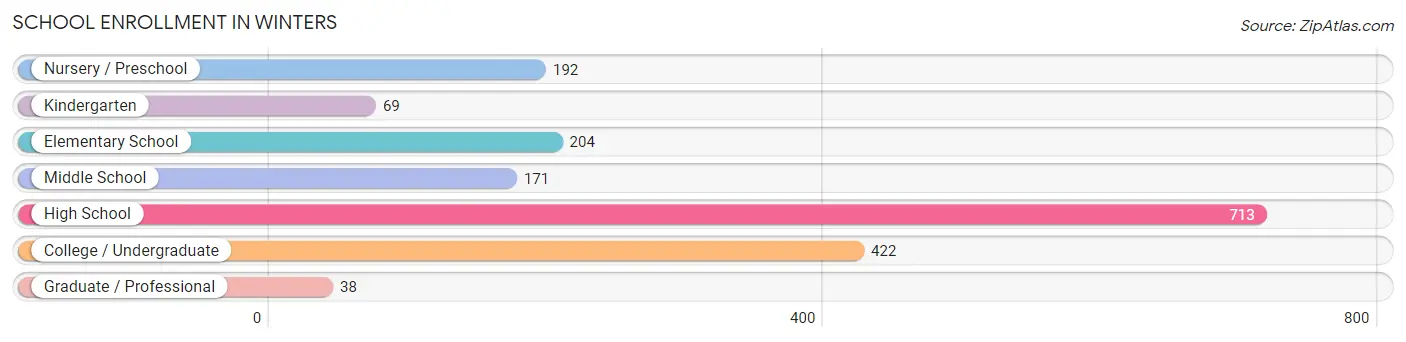
| School Level | # Students | % Students |
| Nursery / Preschool | 192 | 10.6% |
| Kindergarten | 69 | 3.8% |
| Elementary School | 204 | 11.3% |
| Middle School | 171 | 9.5% |
| High School | 713 | 39.4% |
| College / Undergraduate | 422 | 23.3% |
| Graduate / Professional | 38 | 2.1% |
| Total | 1,809 | 100.0% |
School Enrollment by Age by Funding Source in Winters
Out of a total of 1,809 students who are enrolled in schools in Winters, 212 (11.7%) attend a private institution, while the remaining 1,597 (88.3%) are enrolled in public schools. The age group of 3 to 4 year olds has the highest likelihood of being enrolled in private schools, with 84 (59.6% in the age bracket) enrolled. Conversely, the age group of 15 to 17 year olds has the lowest likelihood of being enrolled in a private school, with 517 (100.0% in the age bracket) attending a public institution.
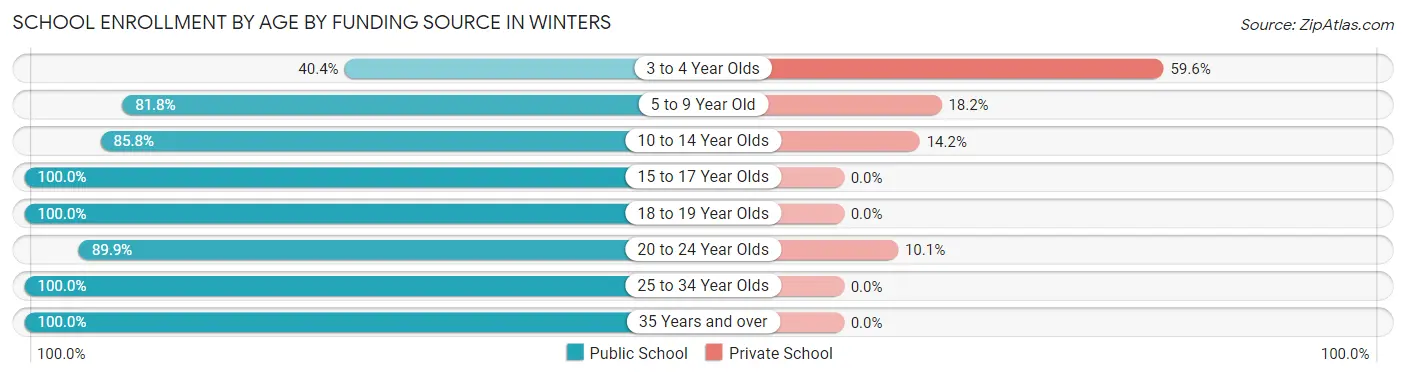
| Age Bracket | Public School | Private School |
| 3 to 4 Year Olds | 57 (40.4%) | 84 (59.6%) |
| 5 to 9 Year Old | 265 (81.8%) | 59 (18.2%) |
| 10 to 14 Year Olds | 315 (85.8%) | 52 (14.2%) |
| 15 to 17 Year Olds | 517 (100.0%) | 0 (0.0%) |
| 18 to 19 Year Olds | 73 (100.0%) | 0 (0.0%) |
| 20 to 24 Year Olds | 151 (89.9%) | 17 (10.1%) |
| 25 to 34 Year Olds | 170 (100.0%) | 0 (0.0%) |
| 35 Years and over | 49 (100.0%) | 0 (0.0%) |
| Total | 1,597 (88.3%) | 212 (11.7%) |
Educational Attainment by Field of Study in Winters
Bio, nature & agricultural (320 | 22.0%), business (250 | 17.2%), liberal arts & history (211 | 14.5%), social sciences (187 | 12.8%), and science & technology (134 | 9.2%) are the most common fields of study among 1,456 individuals in Winters who have obtained a bachelor's degree or higher.
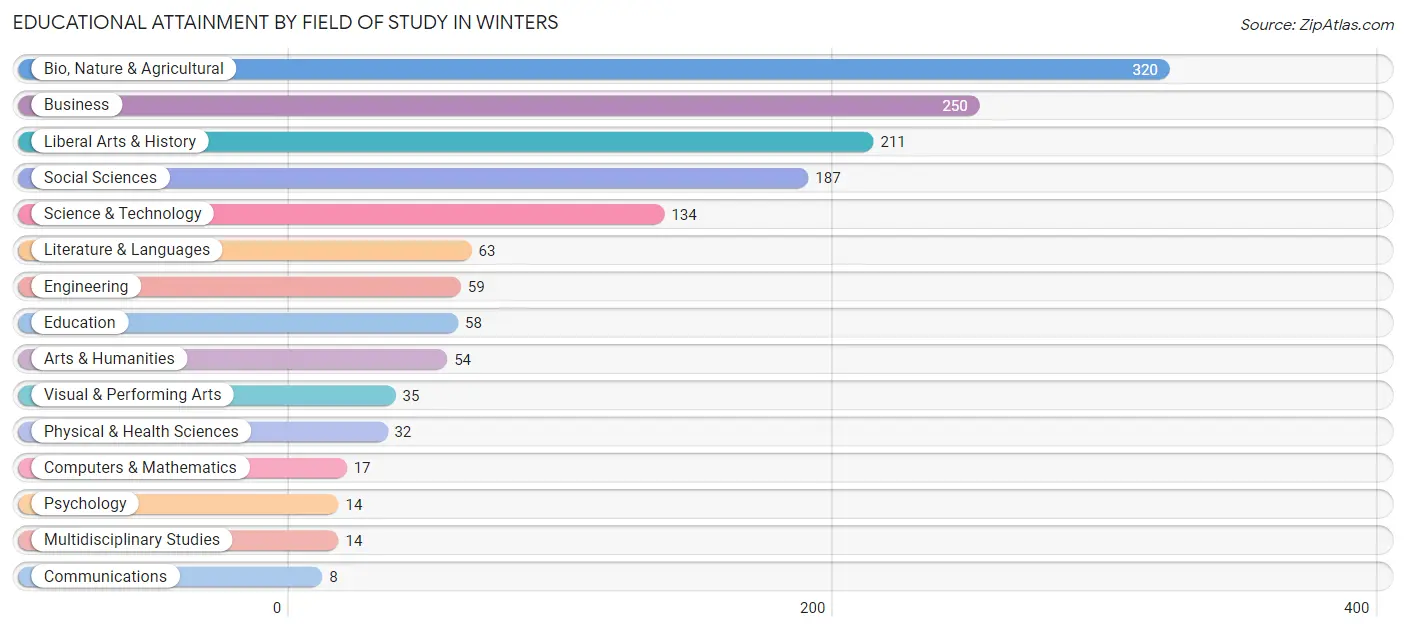
| Field of Study | # Graduates | % Graduates |
| Computers & Mathematics | 17 | 1.2% |
| Bio, Nature & Agricultural | 320 | 22.0% |
| Physical & Health Sciences | 32 | 2.2% |
| Psychology | 14 | 1.0% |
| Social Sciences | 187 | 12.8% |
| Engineering | 59 | 4.1% |
| Multidisciplinary Studies | 14 | 1.0% |
| Science & Technology | 134 | 9.2% |
| Business | 250 | 17.2% |
| Education | 58 | 4.0% |
| Literature & Languages | 63 | 4.3% |
| Liberal Arts & History | 211 | 14.5% |
| Visual & Performing Arts | 35 | 2.4% |
| Communications | 8 | 0.5% |
| Arts & Humanities | 54 | 3.7% |
| Total | 1,456 | 100.0% |
Transportation & Commute in Winters
Vehicle Availability by Sex in Winters
The most prevalent vehicle ownership categories in Winters are males with 2 vehicles (754, accounting for 31.5%) and females with 2 vehicles (573, making up 43.8%).
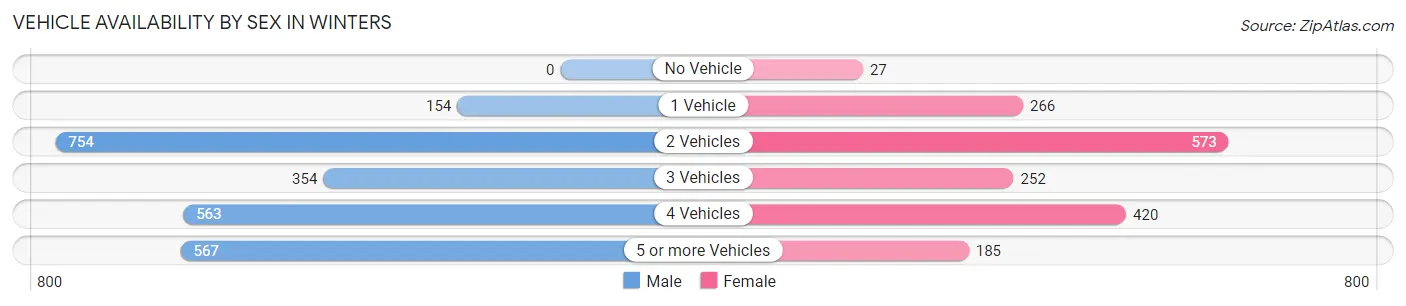
| Vehicles Available | Male | Female |
| No Vehicle | 0 (0.0%) | 27 (1.6%) |
| 1 Vehicle | 154 (6.4%) | 266 (15.4%) |
| 2 Vehicles | 754 (31.5%) | 573 (33.3%) |
| 3 Vehicles | 354 (14.8%) | 252 (14.6%) |
| 4 Vehicles | 563 (23.5%) | 420 (24.4%) |
| 5 or more Vehicles | 567 (23.7%) | 185 (10.7%) |
| Total | 2,392 (100.0%) | 1,723 (100.0%) |
Commute Time in Winters
The most frequently occuring commute durations in Winters are 15 to 19 minutes (710 commuters, 20.3%), 5 to 9 minutes (575 commuters, 16.5%), and 10 to 14 minutes (482 commuters, 13.8%).
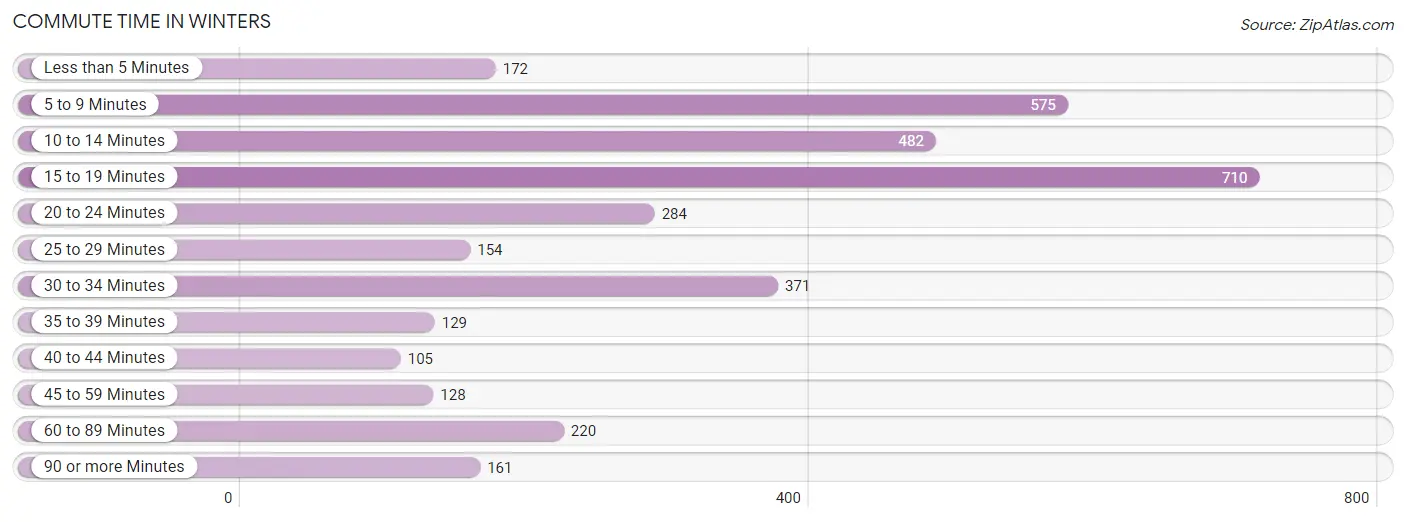
| Commute Time | # Commuters | % Commuters |
| Less than 5 Minutes | 172 | 4.9% |
| 5 to 9 Minutes | 575 | 16.5% |
| 10 to 14 Minutes | 482 | 13.8% |
| 15 to 19 Minutes | 710 | 20.3% |
| 20 to 24 Minutes | 284 | 8.1% |
| 25 to 29 Minutes | 154 | 4.4% |
| 30 to 34 Minutes | 371 | 10.6% |
| 35 to 39 Minutes | 129 | 3.7% |
| 40 to 44 Minutes | 105 | 3.0% |
| 45 to 59 Minutes | 128 | 3.7% |
| 60 to 89 Minutes | 220 | 6.3% |
| 90 or more Minutes | 161 | 4.6% |
Commute Time by Sex in Winters
The most common commute times in Winters are 15 to 19 minutes (509 commuters, 24.6%) for males and 5 to 9 minutes (333 commuters, 23.4%) for females.

| Commute Time | Male | Female |
| Less than 5 Minutes | 86 (4.2%) | 86 (6.0%) |
| 5 to 9 Minutes | 242 (11.7%) | 333 (23.4%) |
| 10 to 14 Minutes | 356 (17.2%) | 126 (8.8%) |
| 15 to 19 Minutes | 509 (24.6%) | 201 (14.1%) |
| 20 to 24 Minutes | 217 (10.5%) | 67 (4.7%) |
| 25 to 29 Minutes | 134 (6.5%) | 20 (1.4%) |
| 30 to 34 Minutes | 220 (10.6%) | 151 (10.6%) |
| 35 to 39 Minutes | 0 (0.0%) | 129 (9.0%) |
| 40 to 44 Minutes | 73 (3.5%) | 32 (2.2%) |
| 45 to 59 Minutes | 70 (3.4%) | 58 (4.1%) |
| 60 to 89 Minutes | 80 (3.9%) | 140 (9.8%) |
| 90 or more Minutes | 78 (3.8%) | 83 (5.8%) |
Time of Departure to Work by Sex in Winters
The most frequent times of departure to work in Winters are 6:00 AM to 6:29 AM (328, 15.9%) for males and 7:30 AM to 7:59 AM (298, 20.9%) for females.
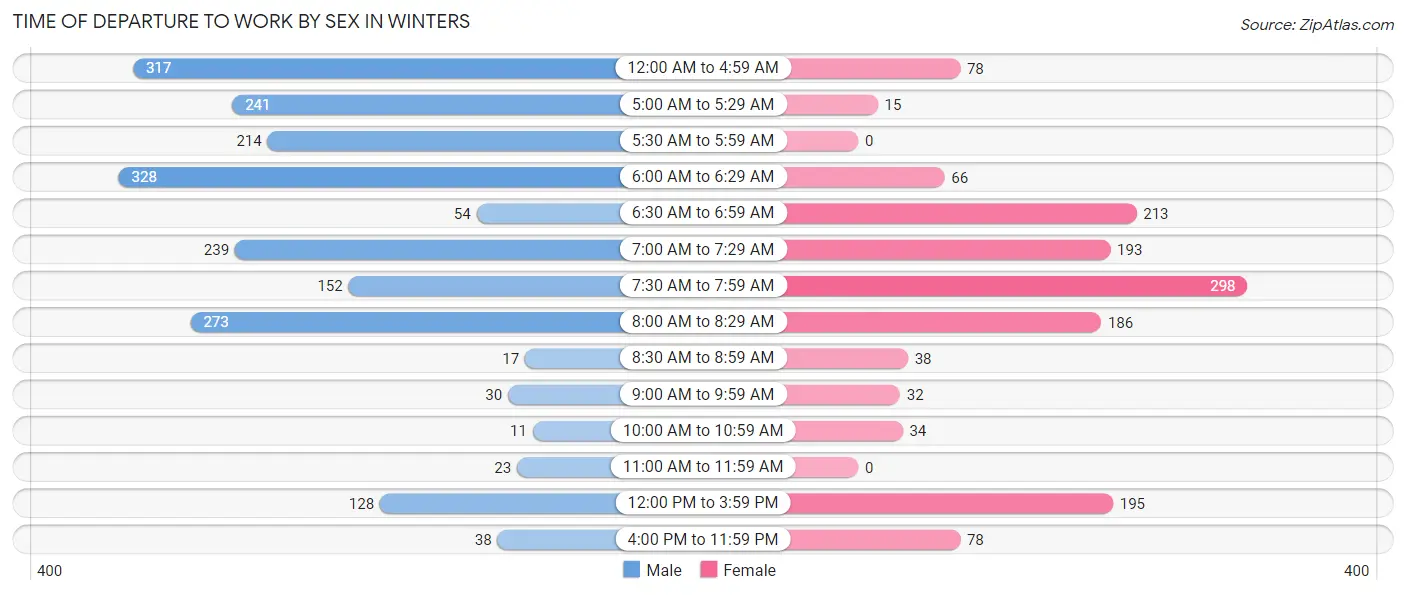
| Time of Departure | Male | Female |
| 12:00 AM to 4:59 AM | 317 (15.3%) | 78 (5.5%) |
| 5:00 AM to 5:29 AM | 241 (11.7%) | 15 (1.1%) |
| 5:30 AM to 5:59 AM | 214 (10.4%) | 0 (0.0%) |
| 6:00 AM to 6:29 AM | 328 (15.9%) | 66 (4.6%) |
| 6:30 AM to 6:59 AM | 54 (2.6%) | 213 (14.9%) |
| 7:00 AM to 7:29 AM | 239 (11.6%) | 193 (13.5%) |
| 7:30 AM to 7:59 AM | 152 (7.4%) | 298 (20.9%) |
| 8:00 AM to 8:29 AM | 273 (13.2%) | 186 (13.0%) |
| 8:30 AM to 8:59 AM | 17 (0.8%) | 38 (2.7%) |
| 9:00 AM to 9:59 AM | 30 (1.5%) | 32 (2.2%) |
| 10:00 AM to 10:59 AM | 11 (0.5%) | 34 (2.4%) |
| 11:00 AM to 11:59 AM | 23 (1.1%) | 0 (0.0%) |
| 12:00 PM to 3:59 PM | 128 (6.2%) | 195 (13.7%) |
| 4:00 PM to 11:59 PM | 38 (1.8%) | 78 (5.5%) |
| Total | 2,065 (100.0%) | 1,426 (100.0%) |
Housing Occupancy in Winters
Occupancy by Ownership in Winters
Of the total 2,439 dwellings in Winters, owner-occupied units account for 1,714 (70.3%), while renter-occupied units make up 725 (29.7%).
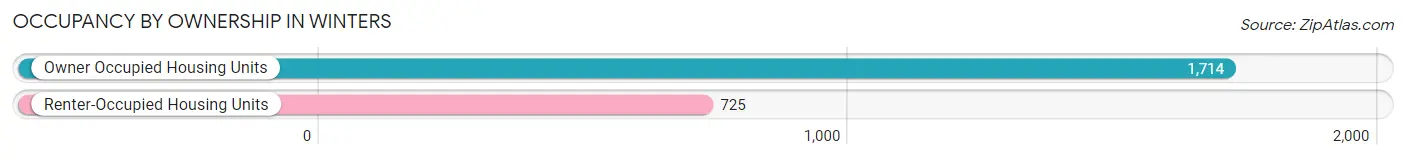
| Occupancy | # Housing Units | % Housing Units |
| Owner Occupied Housing Units | 1,714 | 70.3% |
| Renter-Occupied Housing Units | 725 | 29.7% |
| Total Occupied Housing Units | 2,439 | 100.0% |
Occupancy by Household Size in Winters
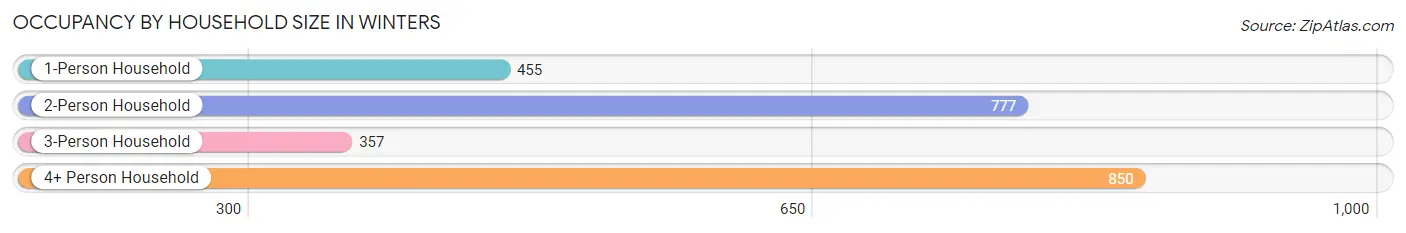
| Household Size | # Housing Units | % Housing Units |
| 1-Person Household | 455 | 18.7% |
| 2-Person Household | 777 | 31.9% |
| 3-Person Household | 357 | 14.6% |
| 4+ Person Household | 850 | 34.8% |
| Total Housing Units | 2,439 | 100.0% |
Occupancy by Ownership by Household Size in Winters
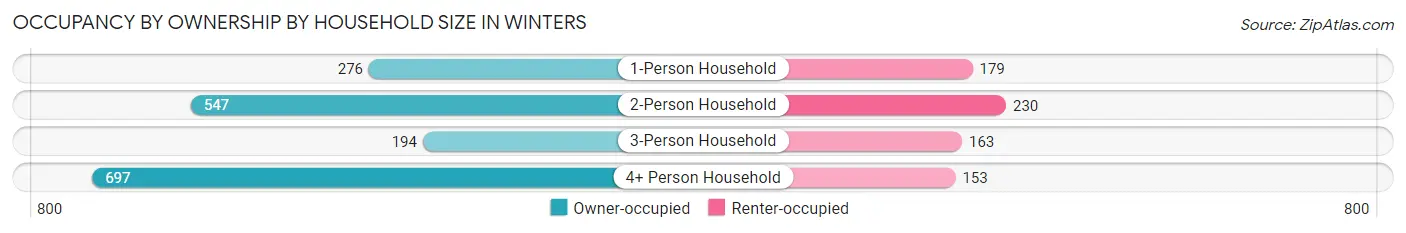
| Household Size | Owner-occupied | Renter-occupied |
| 1-Person Household | 276 (60.7%) | 179 (39.3%) |
| 2-Person Household | 547 (70.4%) | 230 (29.6%) |
| 3-Person Household | 194 (54.3%) | 163 (45.7%) |
| 4+ Person Household | 697 (82.0%) | 153 (18.0%) |
| Total Housing Units | 1,714 (70.3%) | 725 (29.7%) |
Occupancy by Educational Attainment in Winters
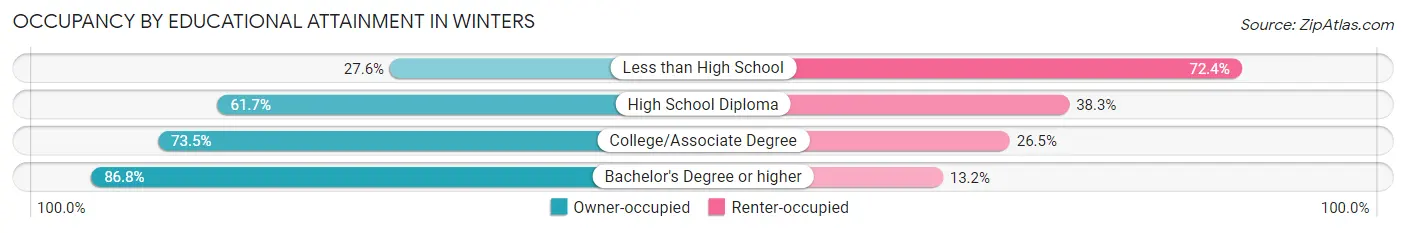
| Household Size | Owner-occupied | Renter-occupied |
| Less than High School | 67 (27.6%) | 176 (72.4%) |
| High School Diploma | 292 (61.7%) | 181 (38.3%) |
| College/Associate Degree | 777 (73.5%) | 280 (26.5%) |
| Bachelor's Degree or higher | 578 (86.8%) | 88 (13.2%) |
Occupancy by Age of Householder in Winters
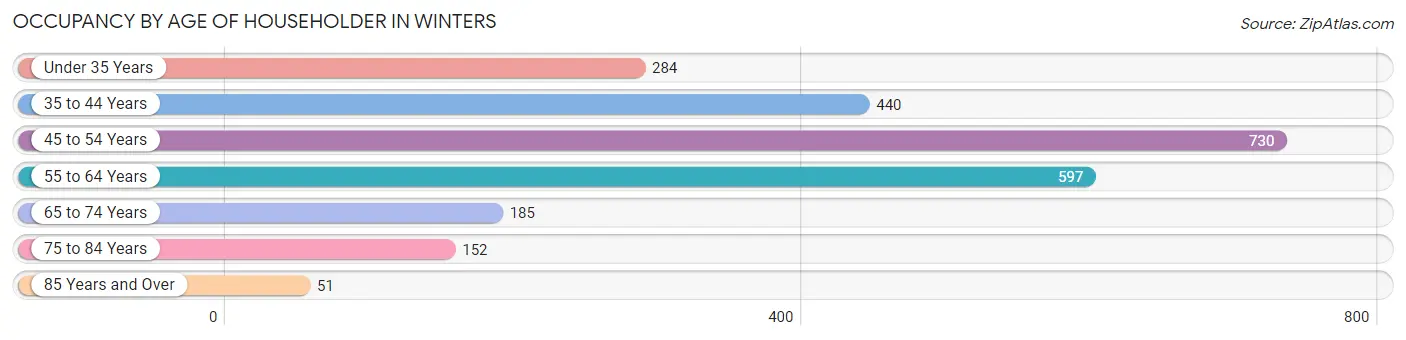
| Age Bracket | # Households | % Households |
| Under 35 Years | 284 | 11.6% |
| 35 to 44 Years | 440 | 18.0% |
| 45 to 54 Years | 730 | 29.9% |
| 55 to 64 Years | 597 | 24.5% |
| 65 to 74 Years | 185 | 7.6% |
| 75 to 84 Years | 152 | 6.2% |
| 85 Years and Over | 51 | 2.1% |
| Total | 2,439 | 100.0% |
Housing Finances in Winters
Median Income by Occupancy in Winters
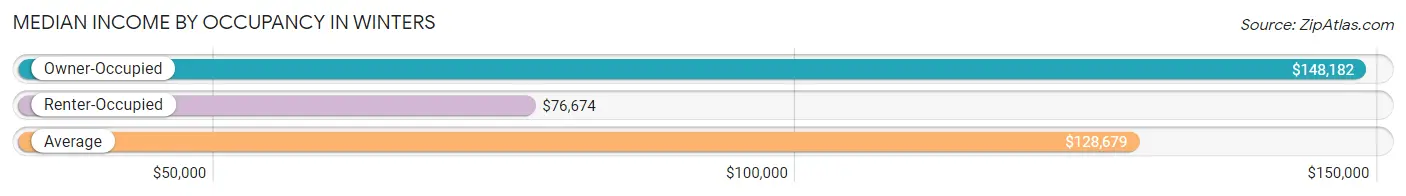
| Occupancy Type | # Households | Median Income |
| Owner-Occupied | 1,714 (70.3%) | $148,182 |
| Renter-Occupied | 725 (29.7%) | $76,674 |
| Average | 2,439 (100.0%) | $128,679 |
Occupancy by Householder Income Bracket in Winters
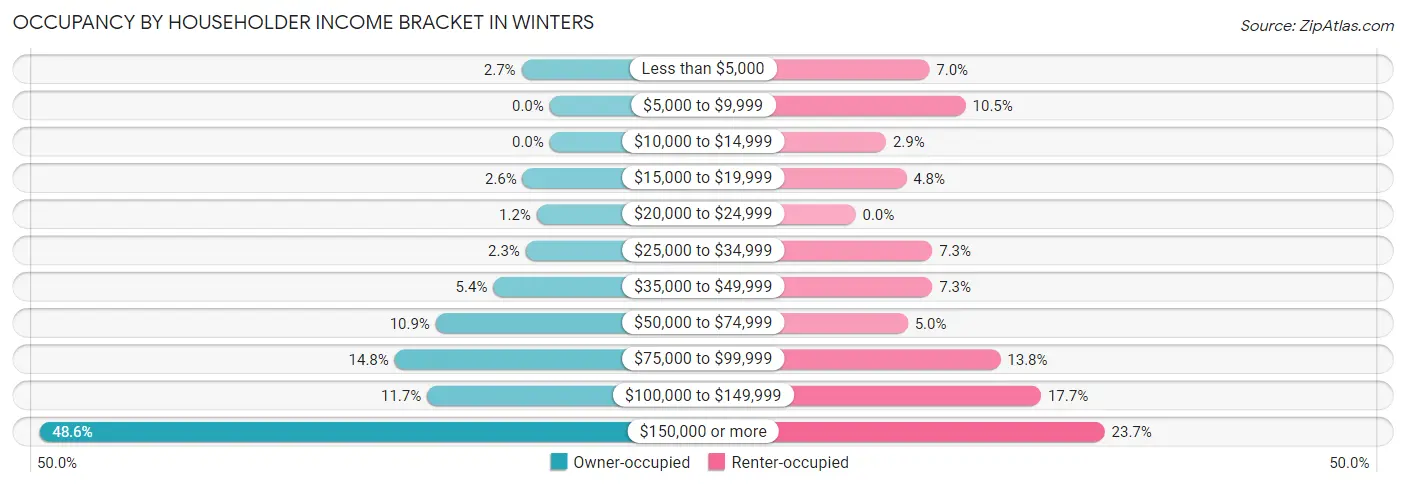
| Income Bracket | Owner-occupied | Renter-occupied |
| Less than $5,000 | 46 (2.7%) | 51 (7.0%) |
| $5,000 to $9,999 | 0 (0.0%) | 76 (10.5%) |
| $10,000 to $14,999 | 0 (0.0%) | 21 (2.9%) |
| $15,000 to $19,999 | 44 (2.6%) | 35 (4.8%) |
| $20,000 to $24,999 | 21 (1.2%) | 0 (0.0%) |
| $25,000 to $34,999 | 39 (2.3%) | 53 (7.3%) |
| $35,000 to $49,999 | 92 (5.4%) | 53 (7.3%) |
| $50,000 to $74,999 | 186 (10.8%) | 36 (5.0%) |
| $75,000 to $99,999 | 253 (14.8%) | 100 (13.8%) |
| $100,000 to $149,999 | 200 (11.7%) | 128 (17.7%) |
| $150,000 or more | 833 (48.6%) | 172 (23.7%) |
| Total | 1,714 (100.0%) | 725 (100.0%) |
Monthly Housing Cost Tiers in Winters
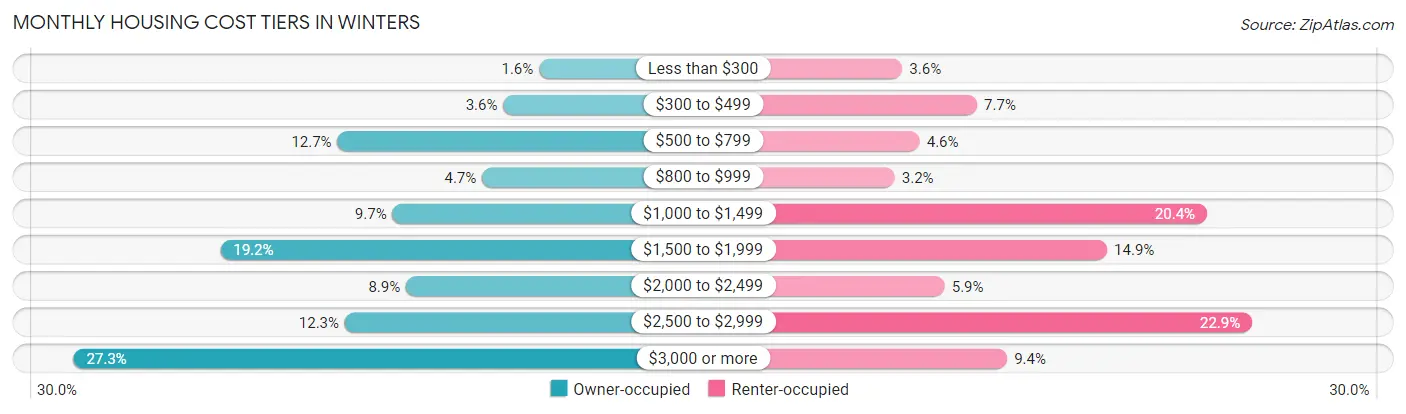
| Monthly Cost | Owner-occupied | Renter-occupied |
| Less than $300 | 27 (1.6%) | 26 (3.6%) |
| $300 to $499 | 61 (3.6%) | 56 (7.7%) |
| $500 to $799 | 218 (12.7%) | 33 (4.5%) |
| $800 to $999 | 81 (4.7%) | 23 (3.2%) |
| $1,000 to $1,499 | 166 (9.7%) | 148 (20.4%) |
| $1,500 to $1,999 | 329 (19.2%) | 108 (14.9%) |
| $2,000 to $2,499 | 153 (8.9%) | 43 (5.9%) |
| $2,500 to $2,999 | 211 (12.3%) | 166 (22.9%) |
| $3,000 or more | 468 (27.3%) | 68 (9.4%) |
| Total | 1,714 (100.0%) | 725 (100.0%) |
Physical Housing Characteristics in Winters
Housing Structures in Winters
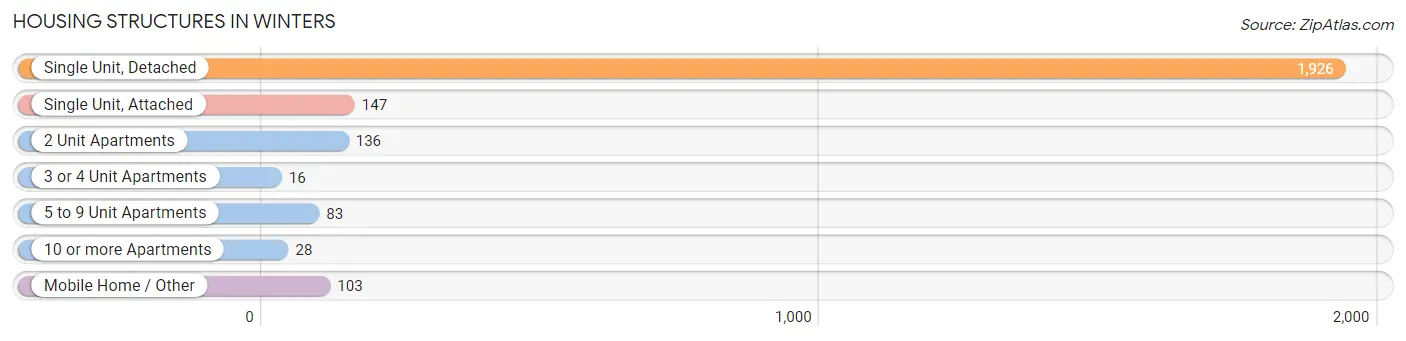
| Structure Type | # Housing Units | % Housing Units |
| Single Unit, Detached | 1,926 | 79.0% |
| Single Unit, Attached | 147 | 6.0% |
| 2 Unit Apartments | 136 | 5.6% |
| 3 or 4 Unit Apartments | 16 | 0.7% |
| 5 to 9 Unit Apartments | 83 | 3.4% |
| 10 or more Apartments | 28 | 1.1% |
| Mobile Home / Other | 103 | 4.2% |
| Total | 2,439 | 100.0% |
Housing Structures by Occupancy in Winters
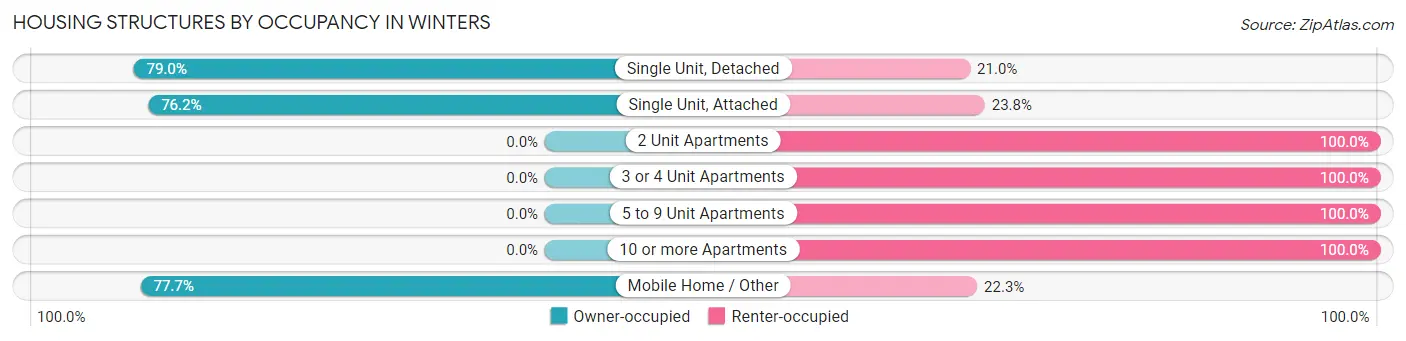
| Structure Type | Owner-occupied | Renter-occupied |
| Single Unit, Detached | 1,522 (79.0%) | 404 (21.0%) |
| Single Unit, Attached | 112 (76.2%) | 35 (23.8%) |
| 2 Unit Apartments | 0 (0.0%) | 136 (100.0%) |
| 3 or 4 Unit Apartments | 0 (0.0%) | 16 (100.0%) |
| 5 to 9 Unit Apartments | 0 (0.0%) | 83 (100.0%) |
| 10 or more Apartments | 0 (0.0%) | 28 (100.0%) |
| Mobile Home / Other | 80 (77.7%) | 23 (22.3%) |
| Total | 1,714 (70.3%) | 725 (29.7%) |
Housing Structures by Number of Rooms in Winters
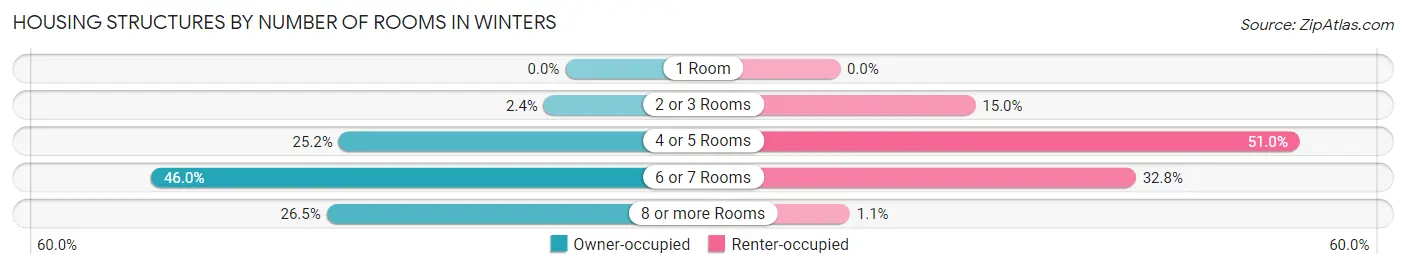
| Number of Rooms | Owner-occupied | Renter-occupied |
| 1 Room | 0 (0.0%) | 0 (0.0%) |
| 2 or 3 Rooms | 41 (2.4%) | 109 (15.0%) |
| 4 or 5 Rooms | 431 (25.2%) | 370 (51.0%) |
| 6 or 7 Rooms | 788 (46.0%) | 238 (32.8%) |
| 8 or more Rooms | 454 (26.5%) | 8 (1.1%) |
| Total | 1,714 (100.0%) | 725 (100.0%) |
Housing Structure by Heating Type in Winters
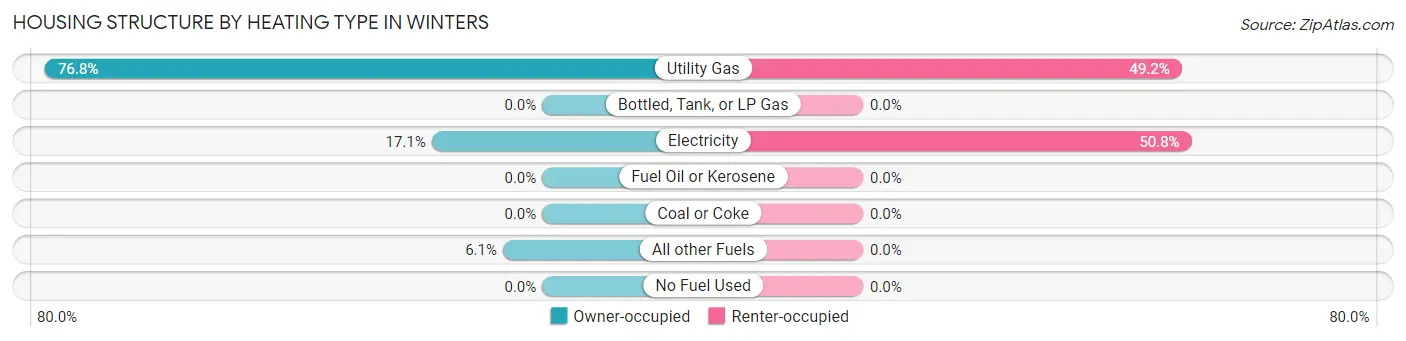
| Heating Type | Owner-occupied | Renter-occupied |
| Utility Gas | 1,317 (76.8%) | 357 (49.2%) |
| Bottled, Tank, or LP Gas | 0 (0.0%) | 0 (0.0%) |
| Electricity | 293 (17.1%) | 368 (50.8%) |
| Fuel Oil or Kerosene | 0 (0.0%) | 0 (0.0%) |
| Coal or Coke | 0 (0.0%) | 0 (0.0%) |
| All other Fuels | 104 (6.1%) | 0 (0.0%) |
| No Fuel Used | 0 (0.0%) | 0 (0.0%) |
| Total | 1,714 (100.0%) | 725 (100.0%) |
Household Vehicle Usage in Winters
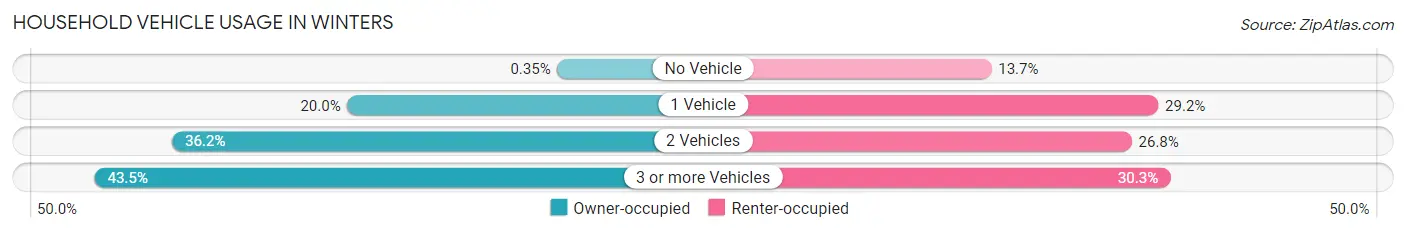
| Vehicles per Household | Owner-occupied | Renter-occupied |
| No Vehicle | 6 (0.4%) | 99 (13.7%) |
| 1 Vehicle | 342 (20.0%) | 212 (29.2%) |
| 2 Vehicles | 621 (36.2%) | 194 (26.8%) |
| 3 or more Vehicles | 745 (43.5%) | 220 (30.3%) |
| Total | 1,714 (100.0%) | 725 (100.0%) |
Real Estate & Mortgages in Winters
Real Estate and Mortgage Overview in Winters
| Characteristic | Without Mortgage | With Mortgage |
| Housing Units | 412 | 1,302 |
| Median Property Value | $450,300 | $560,700 |
| Median Household Income | $115,500 | $646 |
| Monthly Housing Costs | $714 | $468 |
| Real Estate Taxes | $2,487 | $13 |
Property Value by Mortgage Status in Winters
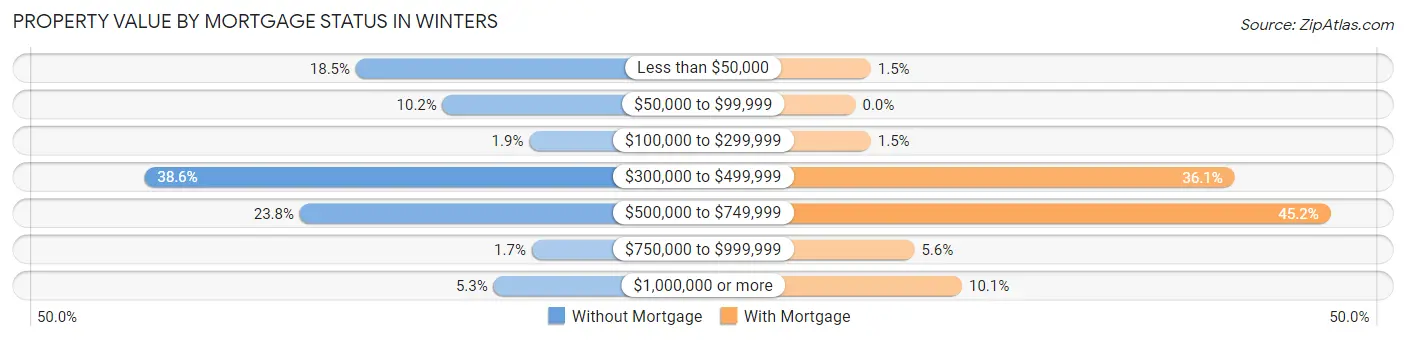
| Property Value | Without Mortgage | With Mortgage |
| Less than $50,000 | 76 (18.4%) | 19 (1.5%) |
| $50,000 to $99,999 | 42 (10.2%) | 0 (0.0%) |
| $100,000 to $299,999 | 8 (1.9%) | 19 (1.5%) |
| $300,000 to $499,999 | 159 (38.6%) | 470 (36.1%) |
| $500,000 to $749,999 | 98 (23.8%) | 589 (45.2%) |
| $750,000 to $999,999 | 7 (1.7%) | 73 (5.6%) |
| $1,000,000 or more | 22 (5.3%) | 132 (10.1%) |
| Total | 412 (100.0%) | 1,302 (100.0%) |
Household Income by Mortgage Status in Winters
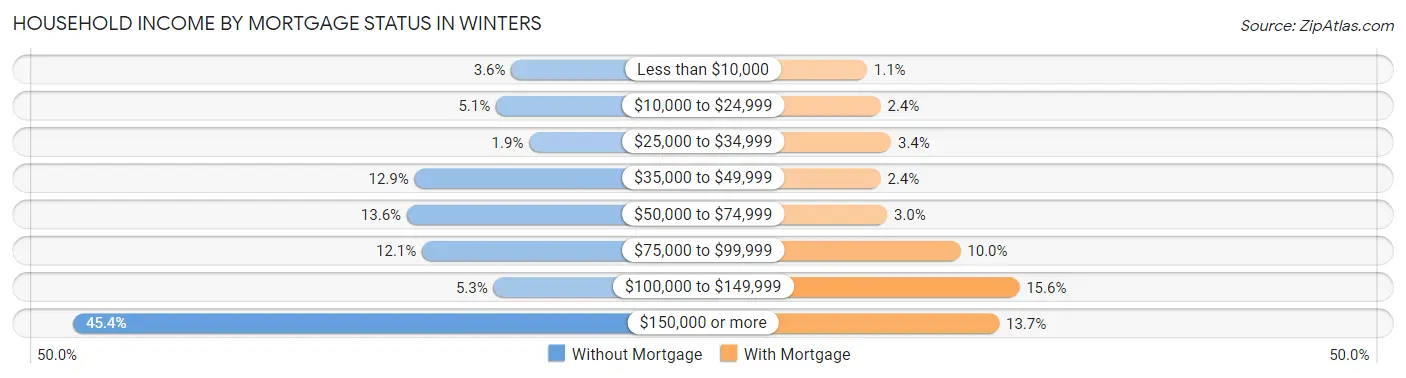
| Household Income | Without Mortgage | With Mortgage |
| Less than $10,000 | 15 (3.6%) | 14 (1.1%) |
| $10,000 to $24,999 | 21 (5.1%) | 31 (2.4%) |
| $25,000 to $34,999 | 8 (1.9%) | 44 (3.4%) |
| $35,000 to $49,999 | 53 (12.9%) | 31 (2.4%) |
| $50,000 to $74,999 | 56 (13.6%) | 39 (3.0%) |
| $75,000 to $99,999 | 50 (12.1%) | 130 (10.0%) |
| $100,000 to $149,999 | 22 (5.3%) | 203 (15.6%) |
| $150,000 or more | 187 (45.4%) | 178 (13.7%) |
| Total | 412 (100.0%) | 1,302 (100.0%) |
Property Value to Household Income Ratio in Winters
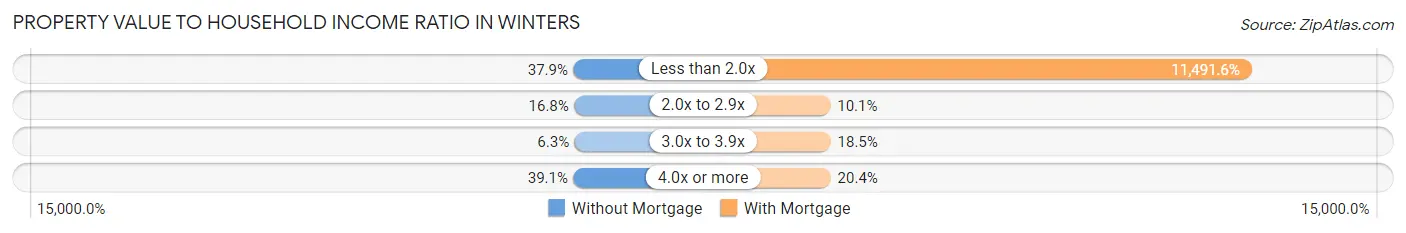
| Value-to-Income Ratio | Without Mortgage | With Mortgage |
| Less than 2.0x | 156 (37.9%) | 149,621 (11,491.6%) |
| 2.0x to 2.9x | 69 (16.8%) | 132 (10.1%) |
| 3.0x to 3.9x | 26 (6.3%) | 241 (18.5%) |
| 4.0x or more | 161 (39.1%) | 266 (20.4%) |
| Total | 412 (100.0%) | 1,302 (100.0%) |
Real Estate Taxes by Mortgage Status in Winters
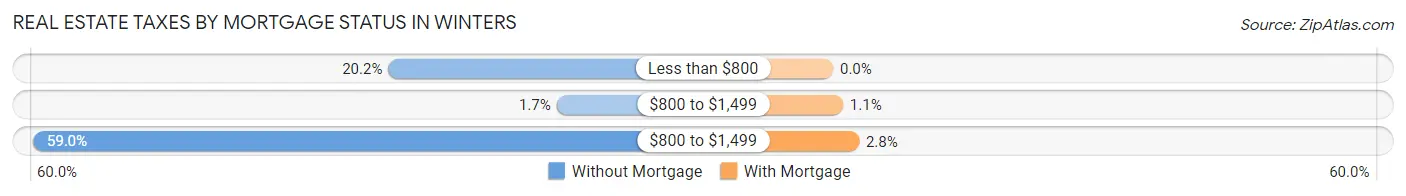
| Property Taxes | Without Mortgage | With Mortgage |
| Less than $800 | 83 (20.2%) | 0 (0.0%) |
| $800 to $1,499 | 7 (1.7%) | 14 (1.1%) |
| $800 to $1,499 | 243 (59.0%) | 37 (2.8%) |
| Total | 412 (100.0%) | 1,302 (100.0%) |
Health & Disability in Winters
Health Insurance Coverage by Age in Winters
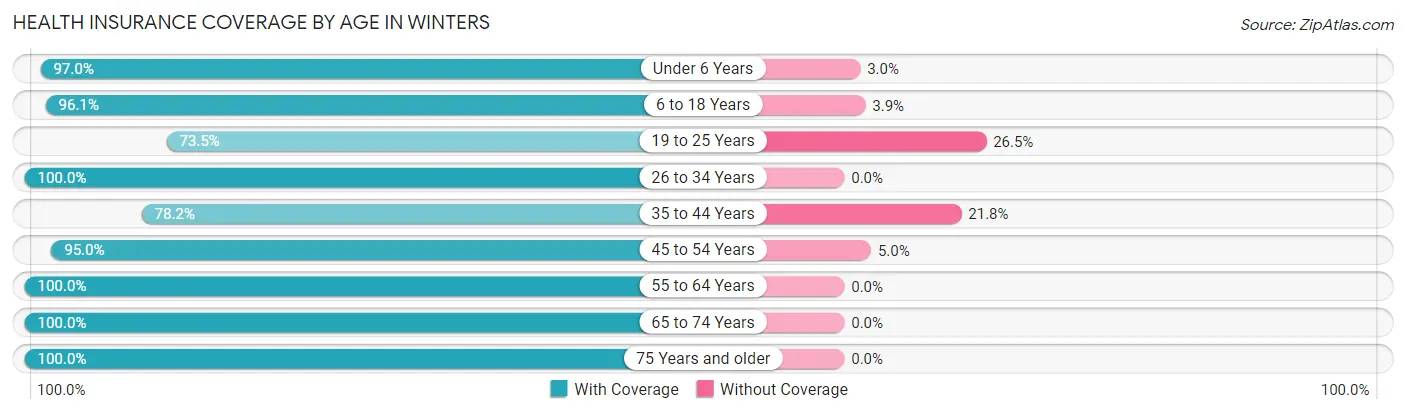
| Age Bracket | With Coverage | Without Coverage |
| Under 6 Years | 490 (97.0%) | 15 (3.0%) |
| 6 to 18 Years | 1,102 (96.1%) | 45 (3.9%) |
| 19 to 25 Years | 706 (73.5%) | 254 (26.5%) |
| 26 to 34 Years | 674 (100.0%) | 0 (0.0%) |
| 35 to 44 Years | 759 (78.2%) | 212 (21.8%) |
| 45 to 54 Years | 1,335 (95.0%) | 70 (5.0%) |
| 55 to 64 Years | 951 (100.0%) | 0 (0.0%) |
| 65 to 74 Years | 344 (100.0%) | 0 (0.0%) |
| 75 Years and older | 274 (100.0%) | 0 (0.0%) |
| Total | 6,635 (91.8%) | 596 (8.2%) |
Health Insurance Coverage by Citizenship Status in Winters
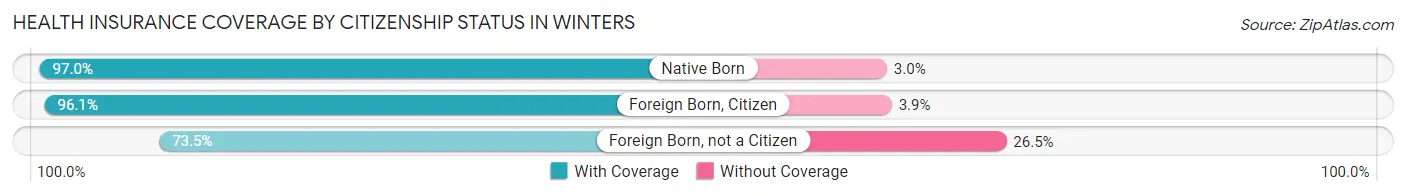
| Citizenship Status | With Coverage | Without Coverage |
| Native Born | 490 (97.0%) | 15 (3.0%) |
| Foreign Born, Citizen | 1,102 (96.1%) | 45 (3.9%) |
| Foreign Born, not a Citizen | 706 (73.5%) | 254 (26.5%) |
Health Insurance Coverage by Household Income in Winters
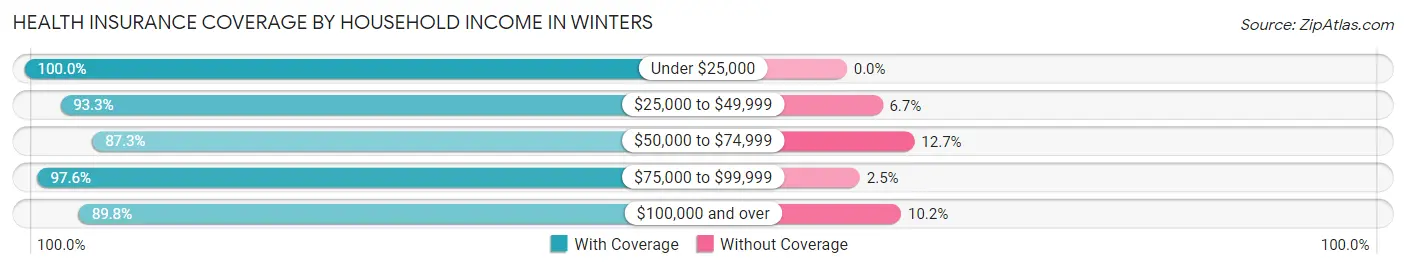
| Household Income | With Coverage | Without Coverage |
| Under $25,000 | 463 (100.0%) | 0 (0.0%) |
| $25,000 to $49,999 | 419 (93.3%) | 30 (6.7%) |
| $50,000 to $74,999 | 379 (87.3%) | 55 (12.7%) |
| $75,000 to $99,999 | 1,077 (97.6%) | 27 (2.5%) |
| $100,000 and over | 4,282 (89.8%) | 484 (10.2%) |
Public vs Private Health Insurance Coverage by Age in Winters
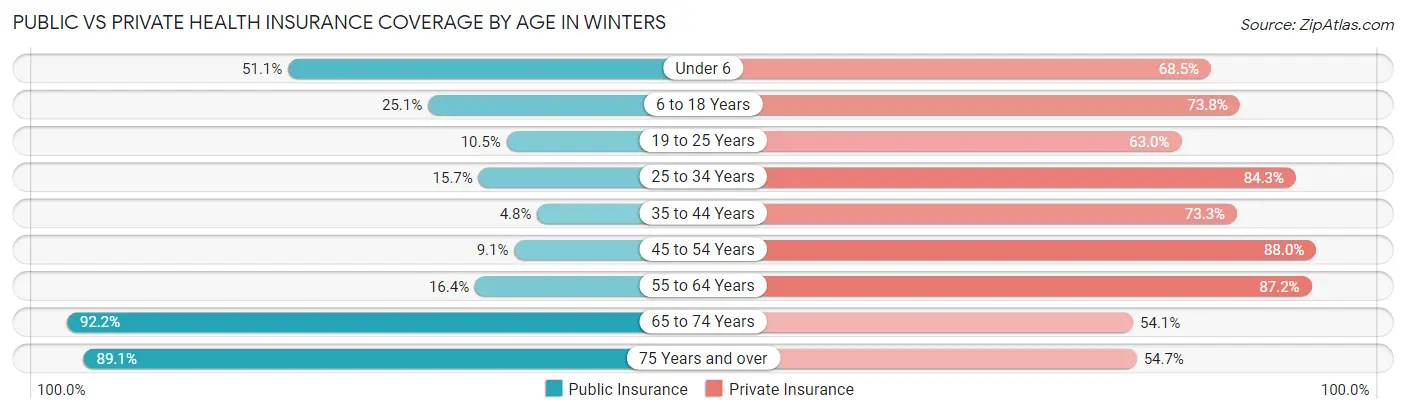
| Age Bracket | Public Insurance | Private Insurance |
| Under 6 | 258 (51.1%) | 346 (68.5%) |
| 6 to 18 Years | 288 (25.1%) | 847 (73.8%) |
| 19 to 25 Years | 101 (10.5%) | 605 (63.0%) |
| 25 to 34 Years | 106 (15.7%) | 568 (84.3%) |
| 35 to 44 Years | 47 (4.8%) | 712 (73.3%) |
| 45 to 54 Years | 128 (9.1%) | 1,237 (88.0%) |
| 55 to 64 Years | 156 (16.4%) | 829 (87.2%) |
| 65 to 74 Years | 317 (92.1%) | 186 (54.1%) |
| 75 Years and over | 244 (89.0%) | 150 (54.7%) |
| Total | 1,645 (22.8%) | 5,480 (75.8%) |
Disability Status by Sex by Age in Winters
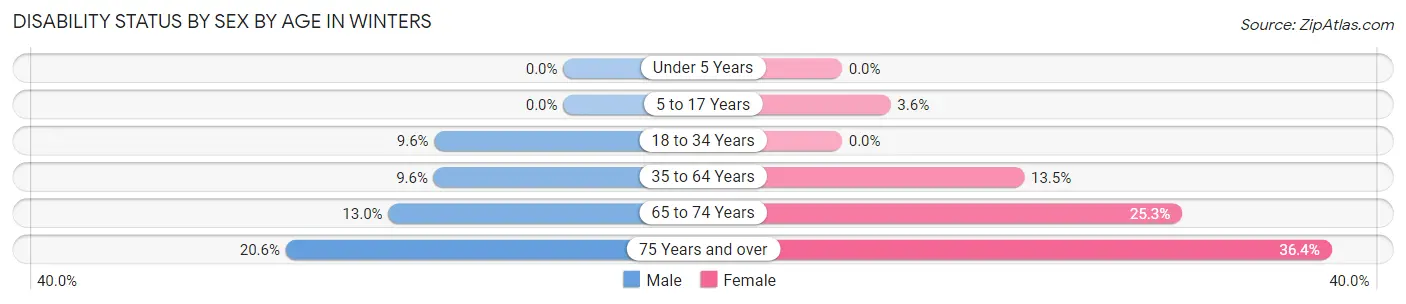
| Age Bracket | Male | Female |
| Under 5 Years | 0 (0.0%) | 0 (0.0%) |
| 5 to 17 Years | 0 (0.0%) | 24 (3.6%) |
| 18 to 34 Years | 93 (9.6%) | 0 (0.0%) |
| 35 to 64 Years | 170 (9.6%) | 211 (13.5%) |
| 65 to 74 Years | 20 (13.0%) | 48 (25.3%) |
| 75 Years and over | 27 (20.6%) | 52 (36.4%) |
Disability Class by Sex by Age in Winters
Disability Class: Hearing Difficulty
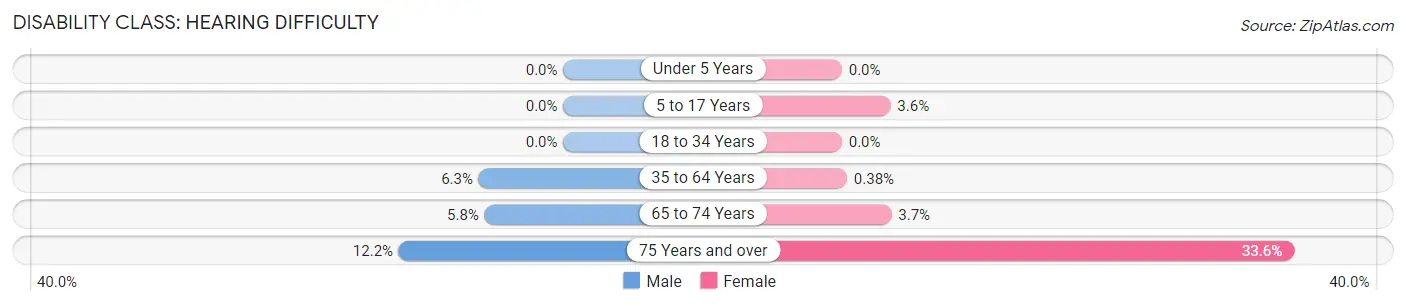
| Age Bracket | Male | Female |
| Under 5 Years | 0 (0.0%) | 0 (0.0%) |
| 5 to 17 Years | 0 (0.0%) | 24 (3.6%) |
| 18 to 34 Years | 0 (0.0%) | 0 (0.0%) |
| 35 to 64 Years | 111 (6.3%) | 6 (0.4%) |
| 65 to 74 Years | 9 (5.8%) | 7 (3.7%) |
| 75 Years and over | 16 (12.2%) | 48 (33.6%) |
Disability Class: Vision Difficulty
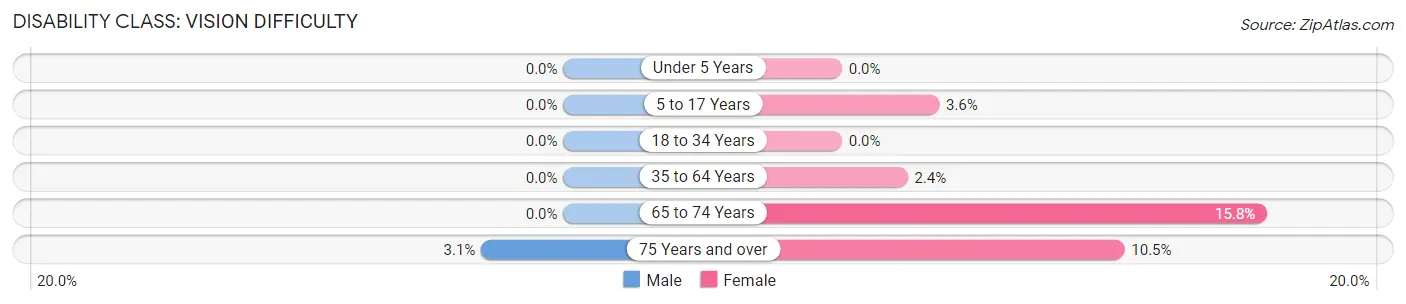
| Age Bracket | Male | Female |
| Under 5 Years | 0 (0.0%) | 0 (0.0%) |
| 5 to 17 Years | 0 (0.0%) | 24 (3.6%) |
| 18 to 34 Years | 0 (0.0%) | 0 (0.0%) |
| 35 to 64 Years | 0 (0.0%) | 38 (2.4%) |
| 65 to 74 Years | 0 (0.0%) | 30 (15.8%) |
| 75 Years and over | 4 (3.0%) | 15 (10.5%) |
Disability Class: Cognitive Difficulty
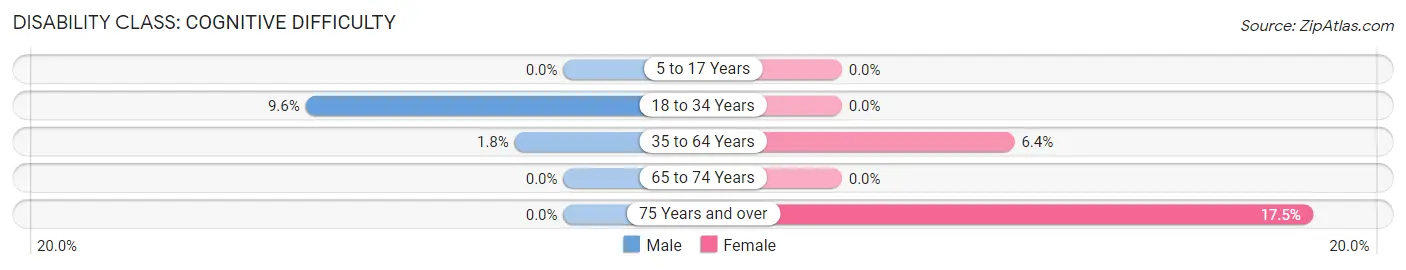
| Age Bracket | Male | Female |
| 5 to 17 Years | 0 (0.0%) | 0 (0.0%) |
| 18 to 34 Years | 93 (9.6%) | 0 (0.0%) |
| 35 to 64 Years | 32 (1.8%) | 100 (6.4%) |
| 65 to 74 Years | 0 (0.0%) | 0 (0.0%) |
| 75 Years and over | 0 (0.0%) | 25 (17.5%) |
Disability Class: Ambulatory Difficulty
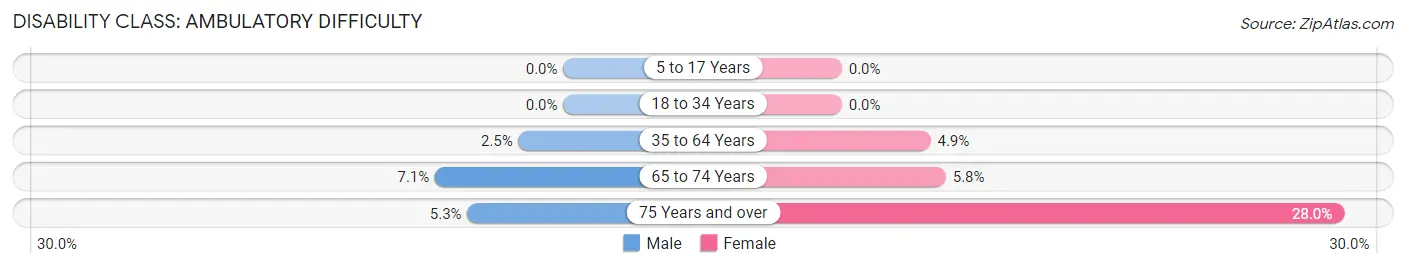
| Age Bracket | Male | Female |
| 5 to 17 Years | 0 (0.0%) | 0 (0.0%) |
| 18 to 34 Years | 0 (0.0%) | 0 (0.0%) |
| 35 to 64 Years | 44 (2.5%) | 77 (4.9%) |
| 65 to 74 Years | 11 (7.1%) | 11 (5.8%) |
| 75 Years and over | 7 (5.3%) | 40 (28.0%) |
Disability Class: Self-Care Difficulty
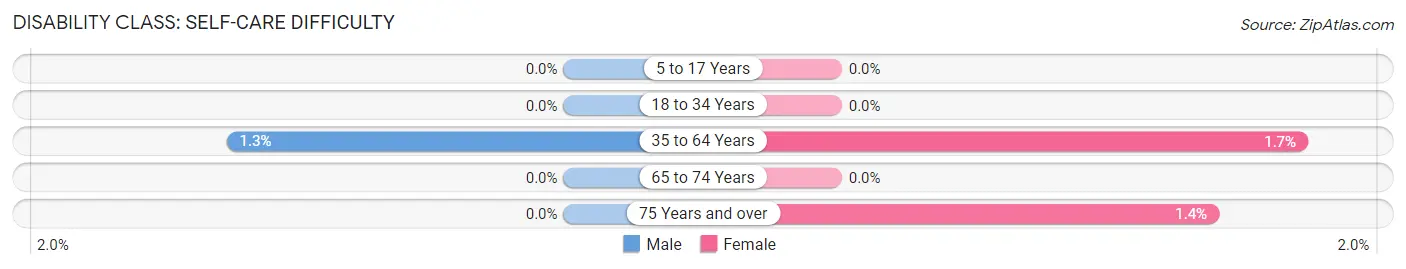
| Age Bracket | Male | Female |
| 5 to 17 Years | 0 (0.0%) | 0 (0.0%) |
| 18 to 34 Years | 0 (0.0%) | 0 (0.0%) |
| 35 to 64 Years | 22 (1.3%) | 27 (1.7%) |
| 65 to 74 Years | 0 (0.0%) | 0 (0.0%) |
| 75 Years and over | 0 (0.0%) | 2 (1.4%) |
Technology Access in Winters
Computing Device Access in Winters
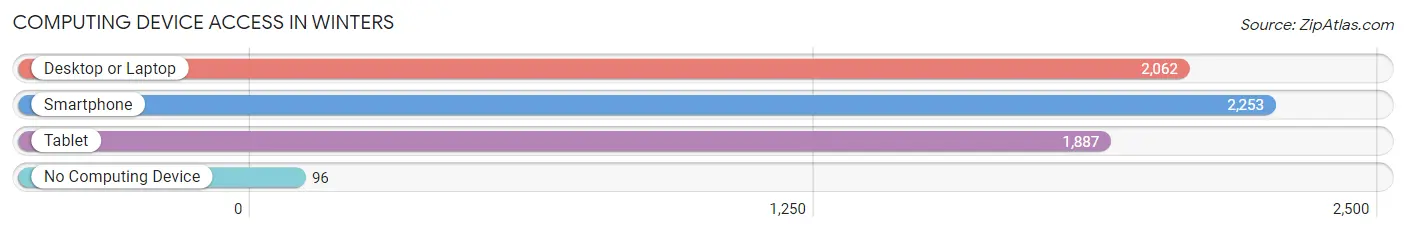
| Device Type | # Households | % Households |
| Desktop or Laptop | 2,062 | 84.5% |
| Smartphone | 2,253 | 92.4% |
| Tablet | 1,887 | 77.4% |
| No Computing Device | 96 | 3.9% |
| Total | 2,439 | 100.0% |
Internet Access in Winters
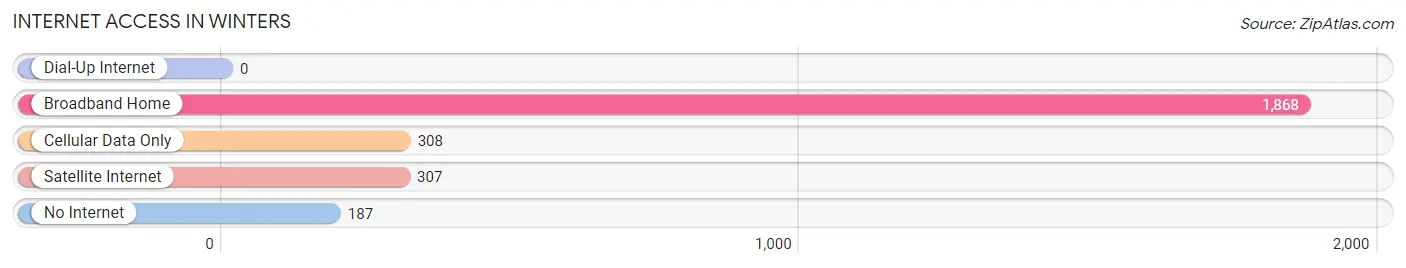
| Internet Type | # Households | % Households |
| Dial-Up Internet | 0 | 0.0% |
| Broadband Home | 1,868 | 76.6% |
| Cellular Data Only | 308 | 12.6% |
| Satellite Internet | 307 | 12.6% |
| No Internet | 187 | 7.7% |
| Total | 2,439 | 100.0% |
Winters Summary
Winters, California is a small city located in Yolo County, California. It is situated in the Central Valley, approximately 30 miles west of Sacramento. The city has a population of approximately 7,000 people and is known for its agricultural heritage and its proximity to the Napa Valley wine country.
Geography
Winters is located in the Central Valley of California, approximately 30 miles west of Sacramento. The city is situated on the eastern side of Putah Creek, which runs through the city. The city is surrounded by rolling hills and is located in the foothills of the Sierra Nevada Mountains. The climate in Winters is mild, with hot summers and cool winters. The average annual temperature is around 60 degrees Fahrenheit.
Economy
The economy of Winters is largely based on agriculture. The city is home to a number of wineries, as well as a variety of other agricultural businesses. Winters is also home to a number of small businesses, including restaurants, retail stores, and professional services. The city is also home to a number of manufacturing companies, including a large food processing plant.
Demographics
As of the 2010 census, the population of Winters was 7,034. The racial makeup of the city was 68.3% White, 0.7% African American, 0.7% Native American, 1.3% Asian, 0.2% Pacific Islander, 25.2% from other races, and 3.7% from two or more races. Hispanic or Latino of any race were 44.2% of the population.
The median income for a household in Winters was $50,945, and the median income for a family was $60,945. The per capita income for the city was $22,945. About 16.2% of families and 19.2% of the population were below the poverty line, including 25.2% of those under age 18 and 8.2% of those age 65 or over.
History
The area that is now Winters was originally inhabited by the Patwin Native American tribe. The first European settlers arrived in the area in the mid-1800s, and the city was officially founded in 1875. The city was named after Theodore Winters, who was a prominent local rancher.
In the early 1900s, Winters was a thriving agricultural community, with a variety of crops being grown in the area. The city was also home to a number of wineries, which helped to make the city a popular tourist destination.
In the 1950s, the city began to experience a decline in its agricultural industry, as many of the farms in the area were replaced by housing developments. However, in recent years, the city has seen a resurgence in its agricultural industry, with a number of wineries and other agricultural businesses opening in the area.
Conclusion
Winters, California is a small city located in Yolo County, California. It is situated in the Central Valley, approximately 30 miles west of Sacramento. The city has a population of approximately 7,000 people and is known for its agricultural heritage and its proximity to the Napa Valley wine country. The economy of Winters is largely based on agriculture, with a variety of wineries and other agricultural businesses located in the city. The city also has a number of small businesses, including restaurants, retail stores, and professional services. The racial makeup of the city is predominantly White, with a significant Hispanic or Latino population. The city has seen a resurgence in its agricultural industry in recent years, with a number of wineries and other agricultural businesses opening in the area.
Common Questions
What is Per Capita Income in Winters?
Per Capita income in Winters is $51,244.
What is the Median Family Income in Winters?
Median Family Income in Winters is $150,036.
What is the Median Household income in Winters?
Median Household Income in Winters is $128,679.
What is Income or Wage Gap in Winters?
Income or Wage Gap in Winters is 16.1%.
Women in Winters earn 83.9 cents for every dollar earned by a man.
What is Inequality or Gini Index in Winters?
Inequality or Gini Index in Winters is 0.46.
What is the Total Population of Winters?
Total Population of Winters is 7,270.
What is the Total Male Population of Winters?
Total Male Population of Winters is 3,776.
What is the Total Female Population of Winters?
Total Female Population of Winters is 3,494.
What is the Ratio of Males per 100 Females in Winters?
There are 108.07 Males per 100 Females in Winters.
What is the Ratio of Females per 100 Males in Winters?
There are 92.53 Females per 100 Males in Winters.
What is the Median Population Age in Winters?
Median Population Age in Winters is 37.9 Years.
What is the Average Family Size in Winters
Average Family Size in Winters is 3.5 People.
What is the Average Household Size in Winters
Average Household Size in Winters is 3.0 People.
How Large is the Labor Force in Winters?
There are 4,328 People in the Labor Forcein in Winters.
What is the Percentage of People in the Labor Force in Winters?
74.3% of People are in the Labor Force in Winters.
What is the Unemployment Rate in Winters?
Unemployment Rate in Winters is 1.9%.