Willow Creek, CA Map & Demographics
Willow Creek Map
Willow Creek Overview
$26,850
PER CAPITA INCOME
$78,109
AVG FAMILY INCOME
$45,451
AVG HOUSEHOLD INCOME
57.2%
WAGE / INCOME GAP [ % ]
42.8¢/ $1
WAGE / INCOME GAP [ $ ]
0.35
INEQUALITY / GINI INDEX
1,371
TOTAL POPULATION
797
MALE POPULATION
574
FEMALE POPULATION
138.85
MALES / 100 FEMALES
72.02
FEMALES / 100 MALES
54.0
MEDIAN AGE
3.3
AVG FAMILY SIZE
2.4
AVG HOUSEHOLD SIZE
564
LABOR FORCE [ PEOPLE ]
47.6%
PERCENT IN LABOR FORCE
5.5%
UNEMPLOYMENT RATE
Willow Creek Zip Codes
Willow Creek Area Codes
Income in Willow Creek
Income Overview in Willow Creek
Per Capita Income in Willow Creek is $26,850, while median incomes of families and households are $78,109 and $45,451 respectively.
| Characteristic | Number | Measure |
| Per Capita Income | 1,371 | $26,850 |
| Median Family Income | 287 | $78,109 |
| Mean Family Income | 287 | $73,278 |
| Median Household Income | 573 | $45,451 |
| Mean Household Income | 573 | $62,770 |
| Income Deficit | 287 | $0 |
| Wage / Income Gap (%) | 1,371 | 57.17% |
| Wage / Income Gap ($) | 1,371 | 42.83¢ per $1 |
| Gini / Inequality Index | 1,371 | 0.35 |
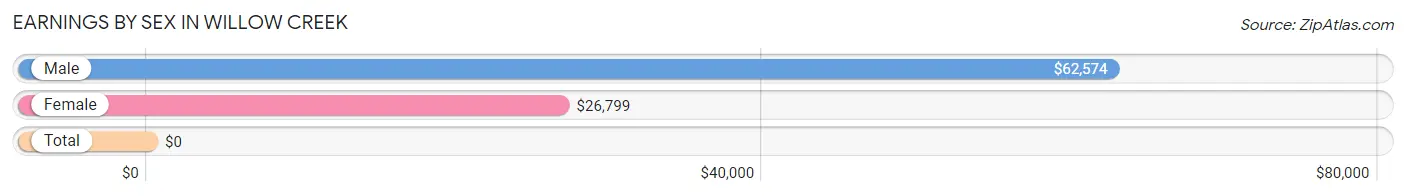
Earnings by Sex in Willow Creek
| Sex | Number | Average Earnings |
| Male | 332 (57.4%) | $62,574 |
| Female | 246 (42.6%) | $26,799 |
| Total | 578 (100.0%) | $0 |
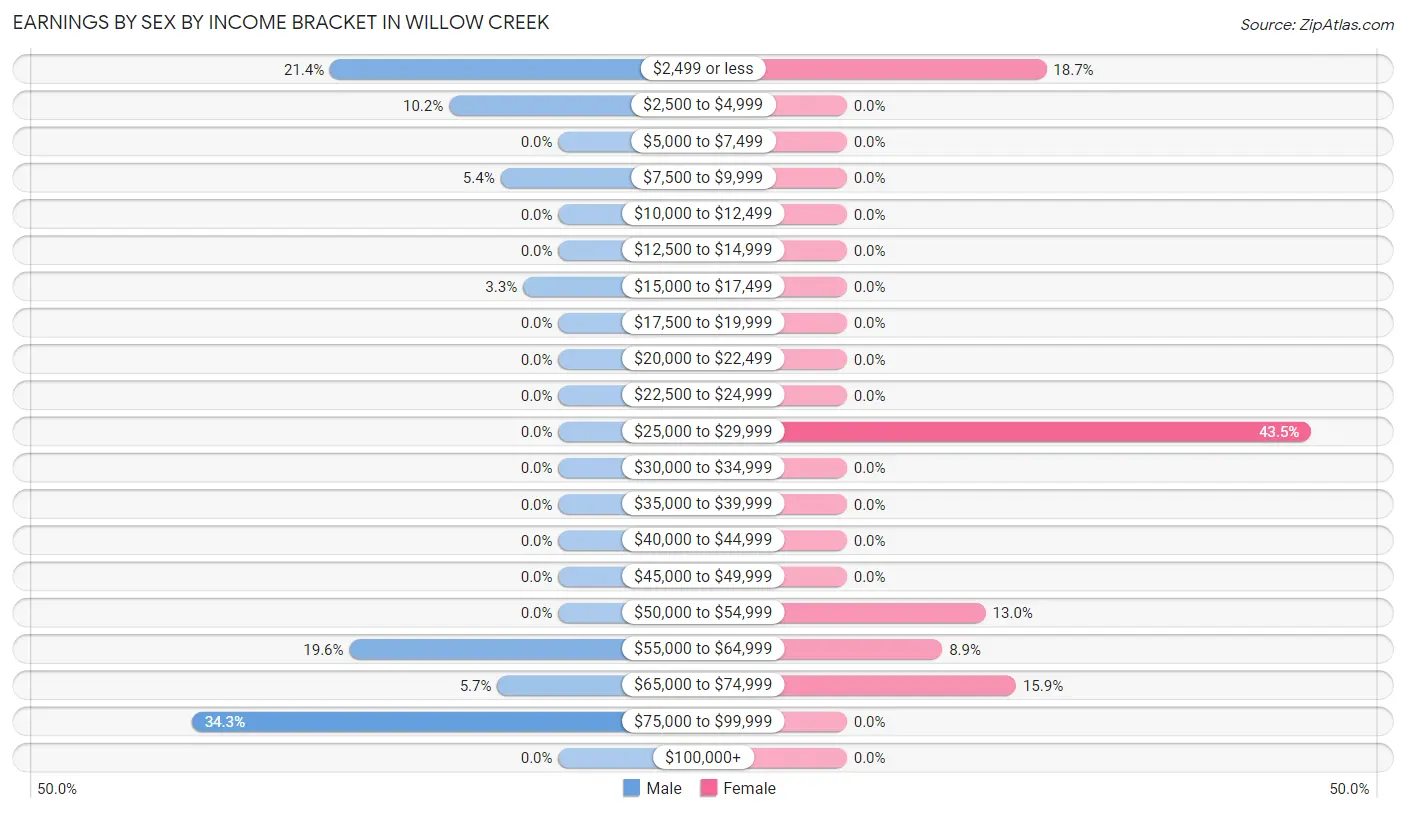
Earnings by Sex by Income Bracket in Willow Creek
The most common earnings brackets in Willow Creek are $75,000 to $99,999 for men (114 | 34.3%) and $25,000 to $29,999 for women (107 | 43.5%).
| Income | Male | Female |
| $2,499 or less | 71 (21.4%) | 46 (18.7%) |
| $2,500 to $4,999 | 34 (10.2%) | 0 (0.0%) |
| $5,000 to $7,499 | 0 (0.0%) | 0 (0.0%) |
| $7,500 to $9,999 | 18 (5.4%) | 0 (0.0%) |
| $10,000 to $12,499 | 0 (0.0%) | 0 (0.0%) |
| $12,500 to $14,999 | 0 (0.0%) | 0 (0.0%) |
| $15,000 to $17,499 | 11 (3.3%) | 0 (0.0%) |
| $17,500 to $19,999 | 0 (0.0%) | 0 (0.0%) |
| $20,000 to $22,499 | 0 (0.0%) | 0 (0.0%) |
| $22,500 to $24,999 | 0 (0.0%) | 0 (0.0%) |
| $25,000 to $29,999 | 0 (0.0%) | 107 (43.5%) |
| $30,000 to $34,999 | 0 (0.0%) | 0 (0.0%) |
| $35,000 to $39,999 | 0 (0.0%) | 0 (0.0%) |
| $40,000 to $44,999 | 0 (0.0%) | 0 (0.0%) |
| $45,000 to $49,999 | 0 (0.0%) | 0 (0.0%) |
| $50,000 to $54,999 | 0 (0.0%) | 32 (13.0%) |
| $55,000 to $64,999 | 65 (19.6%) | 22 (8.9%) |
| $65,000 to $74,999 | 19 (5.7%) | 39 (15.9%) |
| $75,000 to $99,999 | 114 (34.3%) | 0 (0.0%) |
| $100,000+ | 0 (0.0%) | 0 (0.0%) |
| Total | 332 (100.0%) | 246 (100.0%) |
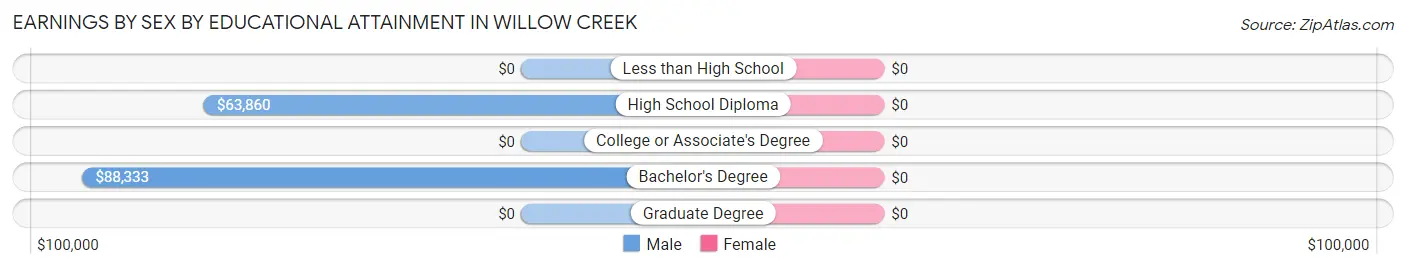
Earnings by Sex by Educational Attainment in Willow Creek
| Educational Attainment | Male Income | Female Income |
| Less than High School | - | - |
| High School Diploma | $63,860 | $0 |
| College or Associate's Degree | - | - |
| Bachelor's Degree | $88,333 | $0 |
| Graduate Degree | - | - |
| Total | $70,329 | $52,773 |
Family Income in Willow Creek
Family Income Brackets in Willow Creek
According to the Willow Creek family income data, there are 100 families falling into the $75,000 to $99,999 income range, which is the most common income bracket and makes up 34.8% of all families.
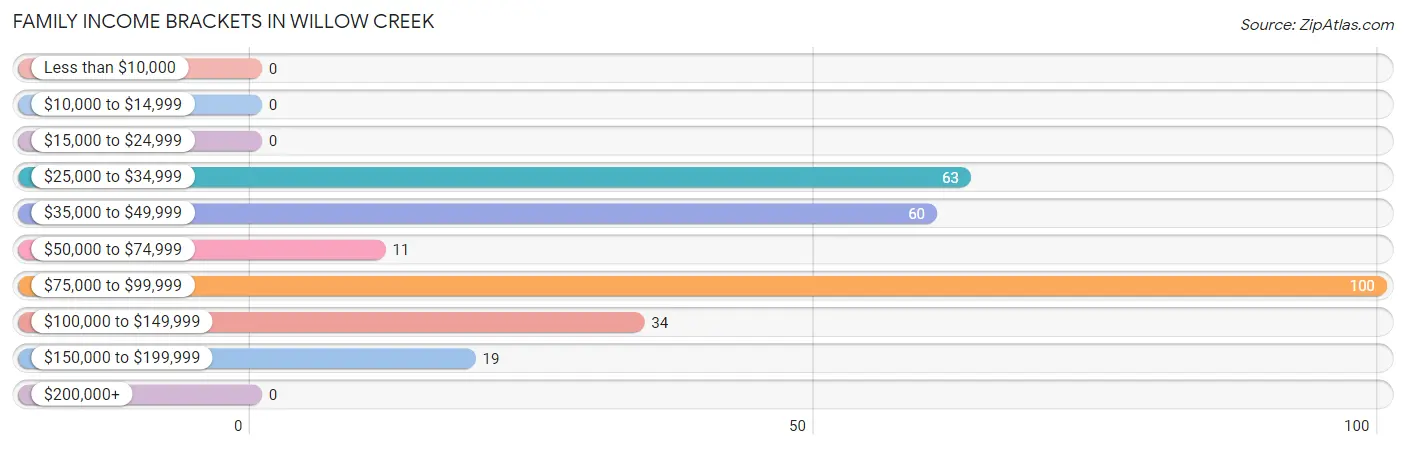
| Income Bracket | # Families | % Families |
| Less than $10,000 | 0 | 0.0% |
| $10,000 to $14,999 | 0 | 0.0% |
| $15,000 to $24,999 | 0 | 0.0% |
| $25,000 to $34,999 | 63 | 22.0% |
| $35,000 to $49,999 | 60 | 20.9% |
| $50,000 to $74,999 | 11 | 3.8% |
| $75,000 to $99,999 | 100 | 34.8% |
| $100,000 to $149,999 | 34 | 11.8% |
| $150,000 to $199,999 | 19 | 6.6% |
| $200,000+ | 0 | 0.0% |
Family Income by Famaliy Size in Willow Creek
2-person families (138 | 48.1%) account for the highest median family income in Willow Creek with $67,045 per family, while 2-person families (138 | 48.1%) have the highest median income of $33,522 per family member.
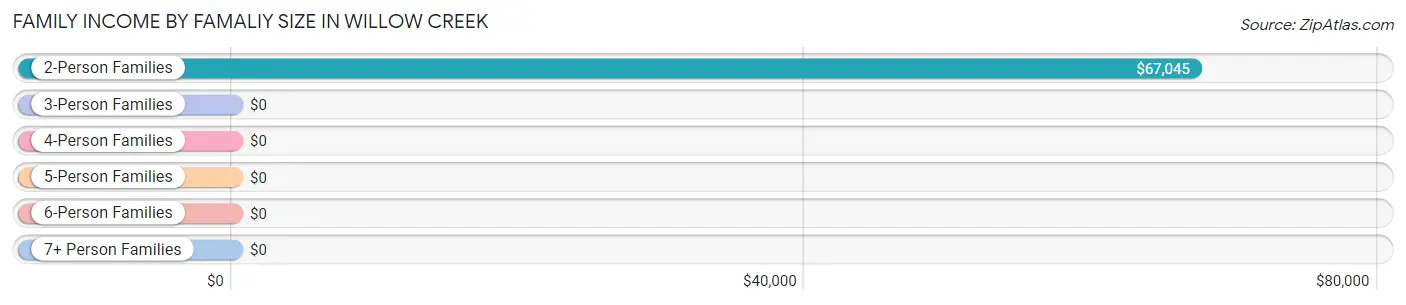
| Income Bracket | # Families | Median Income |
| 2-Person Families | 138 (48.1%) | $67,045 |
| 3-Person Families | 63 (22.0%) | $0 |
| 4-Person Families | 55 (19.2%) | $0 |
| 5-Person Families | 0 (0.0%) | $0 |
| 6-Person Families | 31 (10.8%) | $0 |
| 7+ Person Families | 0 (0.0%) | $0 |
| Total | 287 (100.0%) | $78,109 |
Family Income by Number of Earners in Willow Creek
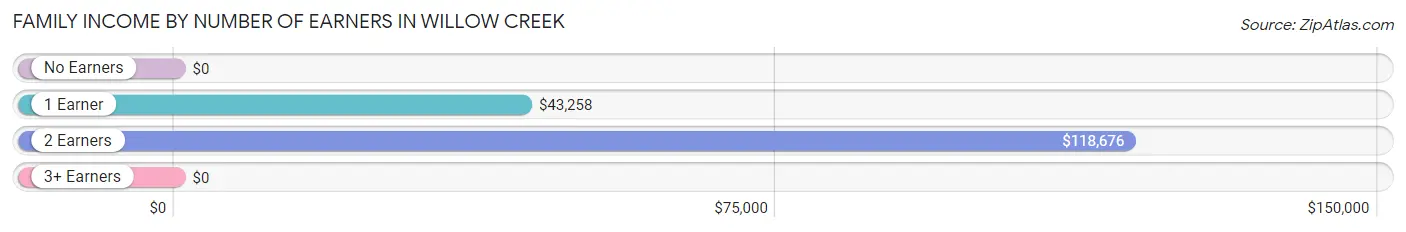
| Number of Earners | # Families | Median Income |
| No Earners | 36 (12.5%) | $0 |
| 1 Earner | 146 (50.9%) | $43,258 |
| 2 Earners | 74 (25.8%) | $118,676 |
| 3+ Earners | 31 (10.8%) | $0 |
| Total | 287 (100.0%) | $78,109 |
Household Income in Willow Creek
Household Income Brackets in Willow Creek
With 165 households falling in the category, the $75,000 to $99,999 income range is the most frequent in Willow Creek, accounting for 28.8% of all households.
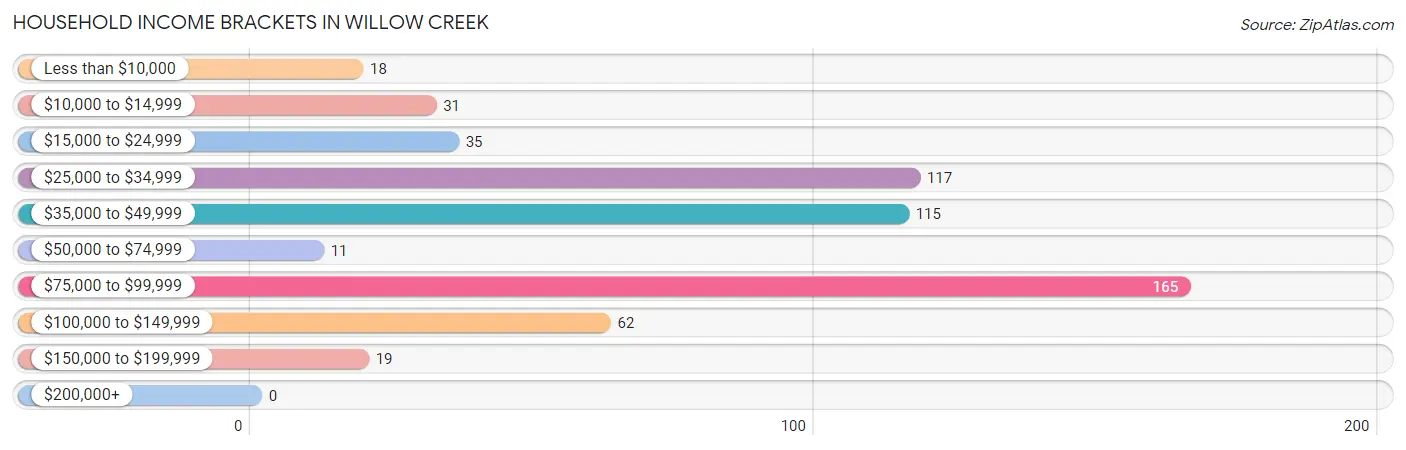
| Income Bracket | # Households | % Households |
| Less than $10,000 | 18 | 3.1% |
| $10,000 to $14,999 | 31 | 5.4% |
| $15,000 to $24,999 | 35 | 6.1% |
| $25,000 to $34,999 | 117 | 20.4% |
| $35,000 to $49,999 | 115 | 20.1% |
| $50,000 to $74,999 | 11 | 1.9% |
| $75,000 to $99,999 | 165 | 28.8% |
| $100,000 to $149,999 | 62 | 10.8% |
| $150,000 to $199,999 | 19 | 3.3% |
| $200,000+ | 0 | 0.0% |
Household Income by Householder Age in Willow Creek
The median household income in Willow Creek is $45,451, with the highest median household income of $98,654 found in the 25 to 44 years age bracket for the primary householder. A total of 138 households (24.1%) fall into this category.
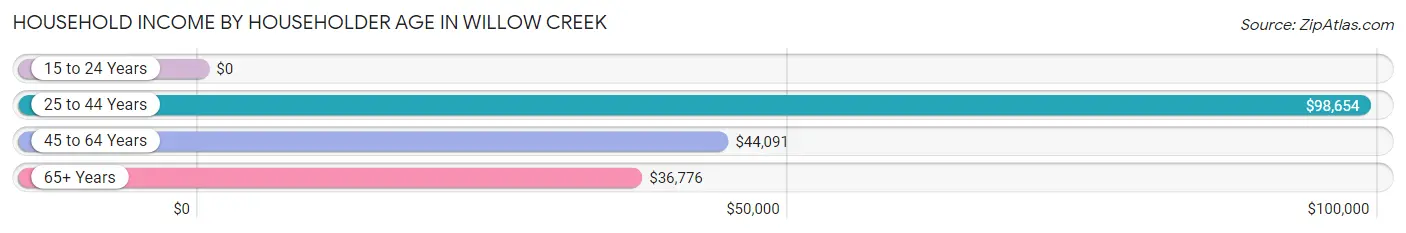
| Income Bracket | # Households | Median Income |
| 15 to 24 Years | 0 (0.0%) | $0 |
| 25 to 44 Years | 138 (24.1%) | $98,654 |
| 45 to 64 Years | 236 (41.2%) | $44,091 |
| 65+ Years | 199 (34.7%) | $36,776 |
| Total | 573 (100.0%) | $45,451 |
Poverty in Willow Creek
Income Below Poverty by Sex and Age in Willow Creek
With 6.4% poverty level for males and 17.9% for females among the residents of Willow Creek, 35 to 44 year old males and 25 to 34 year old females are the most vulnerable to poverty, with 18 males (24.7%) and 54 females (67.5%) in their respective age groups living below the poverty level.
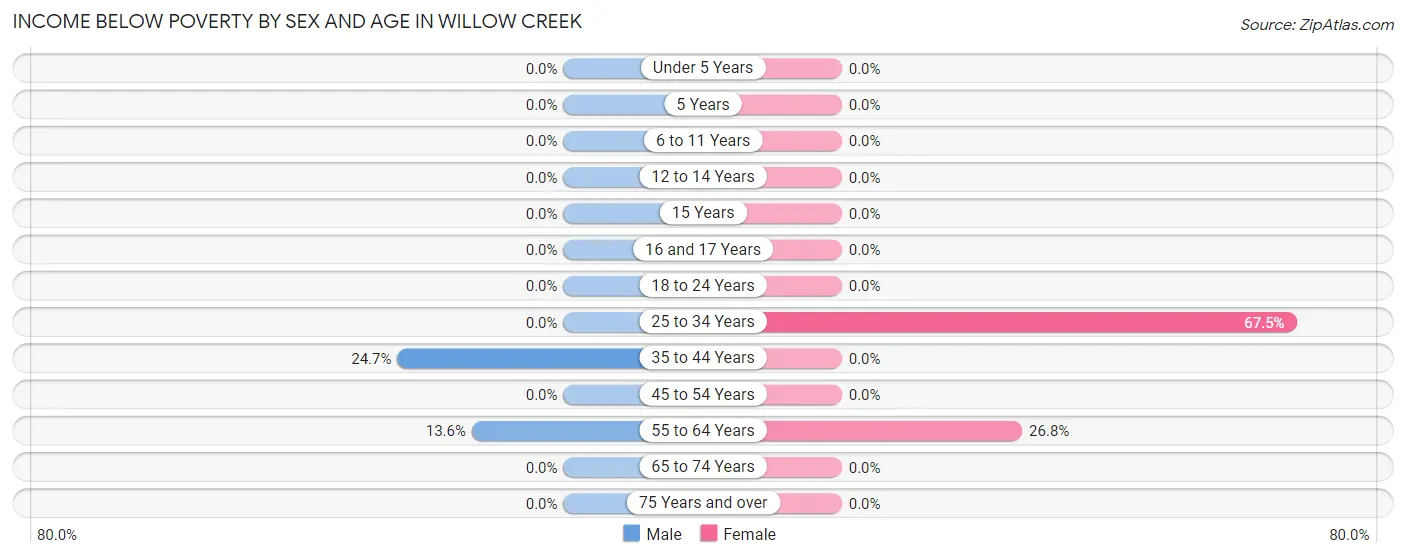
| Age Bracket | Male | Female |
| Under 5 Years | 0 (0.0%) | 0 (0.0%) |
| 5 Years | 0 (0.0%) | 0 (0.0%) |
| 6 to 11 Years | 0 (0.0%) | 0 (0.0%) |
| 12 to 14 Years | 0 (0.0%) | 0 (0.0%) |
| 15 Years | 0 (0.0%) | 0 (0.0%) |
| 16 and 17 Years | 0 (0.0%) | 0 (0.0%) |
| 18 to 24 Years | 0 (0.0%) | 0 (0.0%) |
| 25 to 34 Years | 0 (0.0%) | 54 (67.5%) |
| 35 to 44 Years | 18 (24.7%) | 0 (0.0%) |
| 45 to 54 Years | 0 (0.0%) | 0 (0.0%) |
| 55 to 64 Years | 31 (13.6%) | 49 (26.8%) |
| 65 to 74 Years | 0 (0.0%) | 0 (0.0%) |
| 75 Years and over | 0 (0.0%) | 0 (0.0%) |
| Total | 49 (6.4%) | 103 (17.9%) |
Income Above Poverty by Sex and Age in Willow Creek
According to the poverty statistics in Willow Creek, males aged 5 years and females aged under 5 years are the age groups that are most secure financially, with 100.0% of males and 100.0% of females in these age groups living above the poverty line.
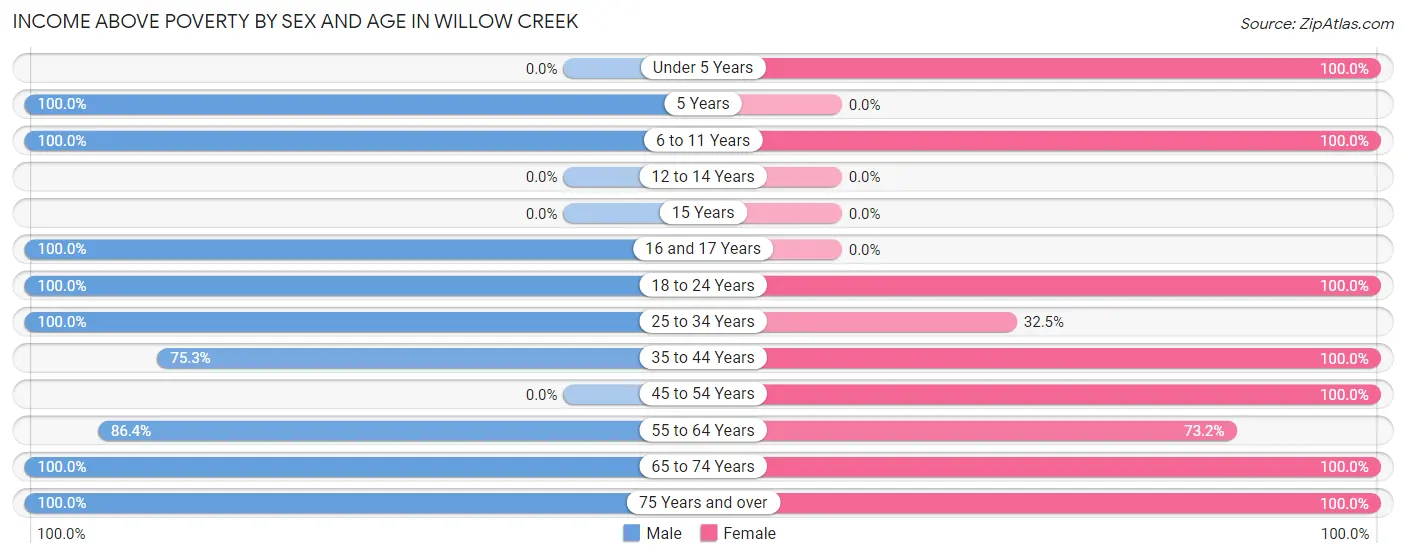
| Age Bracket | Male | Female |
| Under 5 Years | 0 (0.0%) | 43 (100.0%) |
| 5 Years | 26 (100.0%) | 0 (0.0%) |
| 6 to 11 Years | 59 (100.0%) | 29 (100.0%) |
| 12 to 14 Years | 0 (0.0%) | 0 (0.0%) |
| 15 Years | 0 (0.0%) | 0 (0.0%) |
| 16 and 17 Years | 71 (100.0%) | 0 (0.0%) |
| 18 to 24 Years | 39 (100.0%) | 67 (100.0%) |
| 25 to 34 Years | 99 (100.0%) | 26 (32.5%) |
| 35 to 44 Years | 55 (75.3%) | 32 (100.0%) |
| 45 to 54 Years | 0 (0.0%) | 40 (100.0%) |
| 55 to 64 Years | 197 (86.4%) | 134 (73.2%) |
| 65 to 74 Years | 116 (100.0%) | 31 (100.0%) |
| 75 Years and over | 57 (100.0%) | 69 (100.0%) |
| Total | 719 (93.6%) | 471 (82.1%) |
Income Below Poverty Among Married-Couple Families in Willow Creek
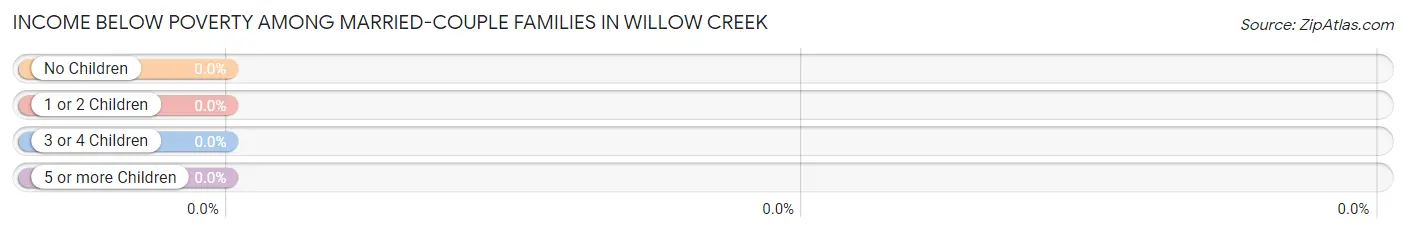
| Children | Above Poverty | Below Poverty |
| No Children | 138 (100.0%) | 0 (0.0%) |
| 1 or 2 Children | 149 (100.0%) | 0 (0.0%) |
| 3 or 4 Children | 0 (0.0%) | 0 (0.0%) |
| 5 or more Children | 0 (0.0%) | 0 (0.0%) |
| Total | 287 (100.0%) | 0 (0.0%) |
Income Below Poverty Among Single-Parent Households in Willow Creek
| Children | Single Father | Single Mother |
| No Children | 0 (0.0%) | 0 (0.0%) |
| 1 or 2 Children | 0 (0.0%) | 0 (0.0%) |
| 3 or 4 Children | 0 (0.0%) | 0 (0.0%) |
| 5 or more Children | 0 (0.0%) | 0 (0.0%) |
| Total | 0 (0.0%) | 0 (0.0%) |
Income Below Poverty Among Married-Couple vs Single-Parent Households in Willow Creek
| Children | Married-Couple Families | Single-Parent Households |
| No Children | 0 (0.0%) | 0 (0.0%) |
| 1 or 2 Children | 0 (0.0%) | 0 (0.0%) |
| 3 or 4 Children | 0 (0.0%) | 0 (0.0%) |
| 5 or more Children | 0 (0.0%) | 0 (0.0%) |
| Total | 0 (0.0%) | 0 (0.0%) |
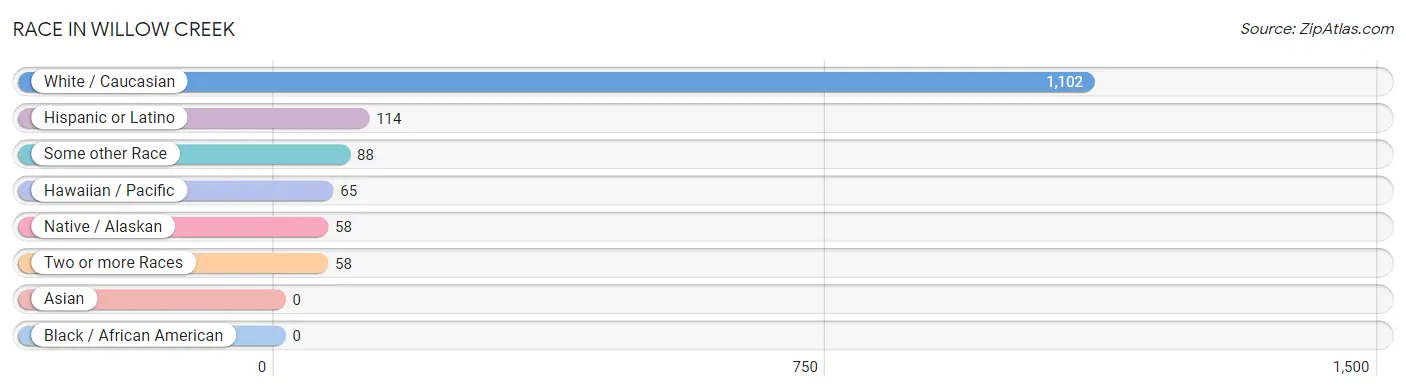
Race in Willow Creek
The most populous races in Willow Creek are White / Caucasian (1,102 | 80.4%), Hispanic or Latino (114 | 8.3%), and Some other Race (88 | 6.4%).
| Race | # Population | % Population |
| Asian | 0 | 0.0% |
| Black / African American | 0 | 0.0% |
| Hawaiian / Pacific | 65 | 4.7% |
| Hispanic or Latino | 114 | 8.3% |
| Native / Alaskan | 58 | 4.2% |
| White / Caucasian | 1,102 | 80.4% |
| Two or more Races | 58 | 4.2% |
| Some other Race | 88 | 6.4% |
| Total | 1,371 | 100.0% |
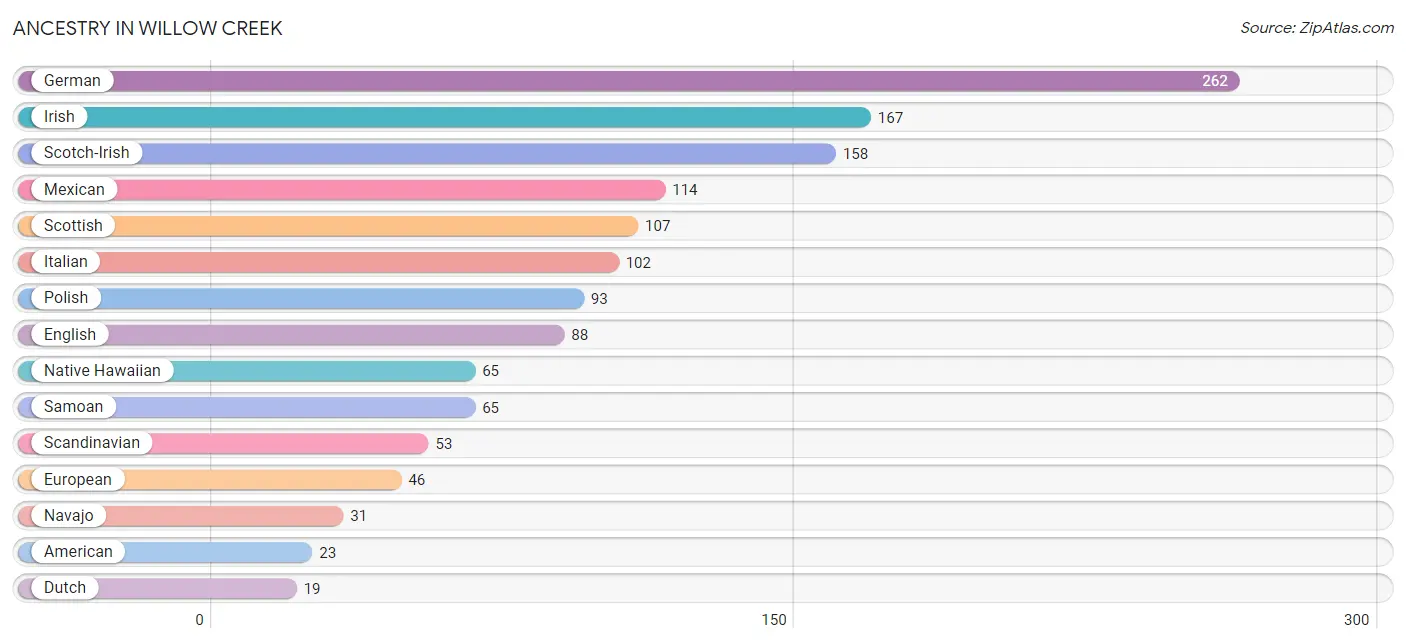
Ancestry in Willow Creek
The most populous ancestries reported in Willow Creek are German (262 | 19.1%), Irish (167 | 12.2%), Scotch-Irish (158 | 11.5%), Mexican (114 | 8.3%), and Scottish (107 | 7.8%), together accounting for 58.9% of all Willow Creek residents.
| Ancestry | # Population | % Population |
| American | 23 | 1.7% |
| Dutch | 19 | 1.4% |
| English | 88 | 6.4% |
| European | 46 | 3.4% |
| German | 262 | 19.1% |
| Irish | 167 | 12.2% |
| Italian | 102 | 7.4% |
| Mexican | 114 | 8.3% |
| Native Hawaiian | 65 | 4.7% |
| Navajo | 31 | 2.3% |
| Polish | 93 | 6.8% |
| Samoan | 65 | 4.7% |
| Scandinavian | 53 | 3.9% |
| Scotch-Irish | 158 | 11.5% |
| Scottish | 107 | 7.8% | View All 15 Rows |
Immigrants in Willow Creek

| Immigration Origin | # Population | % Population | View All 0 Rows |
Sex and Age in Willow Creek
Sex and Age in Willow Creek
The most populous age groups in Willow Creek are 55 to 59 Years (197 | 24.7%) for men and 60 to 64 Years (183 | 31.9%) for women.
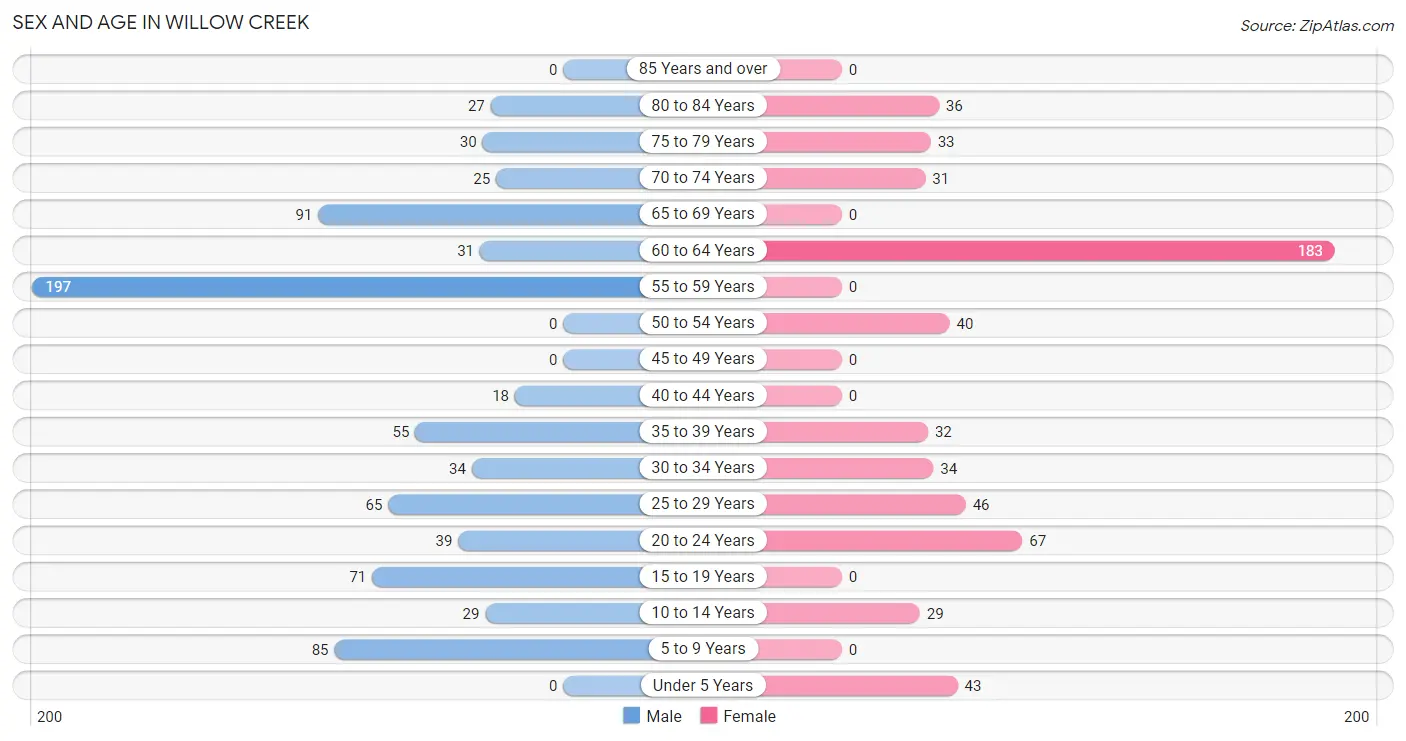
| Age Bracket | Male | Female |
| Under 5 Years | 0 (0.0%) | 43 (7.5%) |
| 5 to 9 Years | 85 (10.7%) | 0 (0.0%) |
| 10 to 14 Years | 29 (3.6%) | 29 (5.1%) |
| 15 to 19 Years | 71 (8.9%) | 0 (0.0%) |
| 20 to 24 Years | 39 (4.9%) | 67 (11.7%) |
| 25 to 29 Years | 65 (8.2%) | 46 (8.0%) |
| 30 to 34 Years | 34 (4.3%) | 34 (5.9%) |
| 35 to 39 Years | 55 (6.9%) | 32 (5.6%) |
| 40 to 44 Years | 18 (2.3%) | 0 (0.0%) |
| 45 to 49 Years | 0 (0.0%) | 0 (0.0%) |
| 50 to 54 Years | 0 (0.0%) | 40 (7.0%) |
| 55 to 59 Years | 197 (24.7%) | 0 (0.0%) |
| 60 to 64 Years | 31 (3.9%) | 183 (31.9%) |
| 65 to 69 Years | 91 (11.4%) | 0 (0.0%) |
| 70 to 74 Years | 25 (3.1%) | 31 (5.4%) |
| 75 to 79 Years | 30 (3.8%) | 33 (5.8%) |
| 80 to 84 Years | 27 (3.4%) | 36 (6.3%) |
| 85 Years and over | 0 (0.0%) | 0 (0.0%) |
| Total | 797 (100.0%) | 574 (100.0%) |
Families and Households in Willow Creek
Median Family Size in Willow Creek
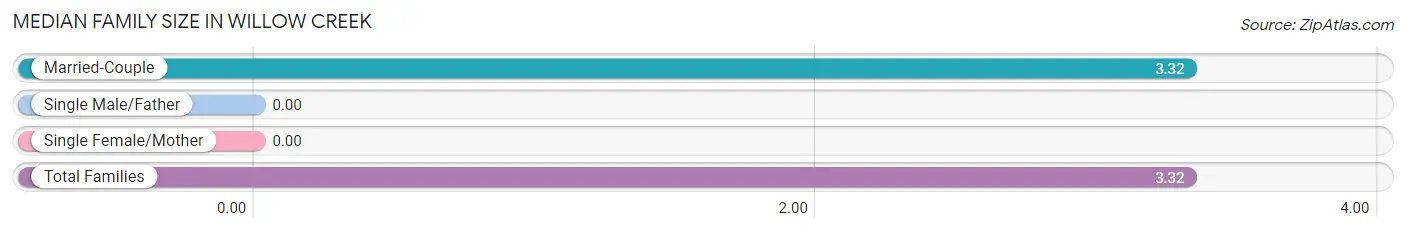
| Family Type | # Families | Family Size |
| Married-Couple | 287 (100.0%) | 3.32 |
| Single Male/Father | 0 (0.0%) | - |
| Single Female/Mother | 0 (0.0%) | - |
| Total Families | 287 (100.0%) | 3.32 |
Median Household Size in Willow Creek
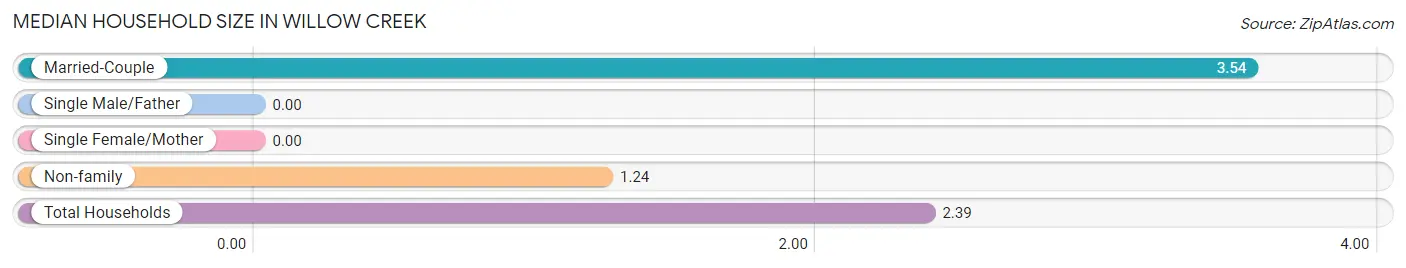
| Household Type | # Households | Household Size |
| Married-Couple | 287 (50.1%) | 3.54 |
| Single Male/Father | 0 (0.0%) | - |
| Single Female/Mother | 0 (0.0%) | - |
| Non-family | 286 (49.9%) | 1.24 |
| Total Households | 573 (100.0%) | 2.39 |
Household Size by Marriage Status in Willow Creek
Out of a total of 573 households in Willow Creek, 287 (50.1%) are family households, while 286 (49.9%) are nonfamily households. The most numerous type of family households are 2-person households, comprising 138, and the most common type of nonfamily households are 1-person households, comprising 185.
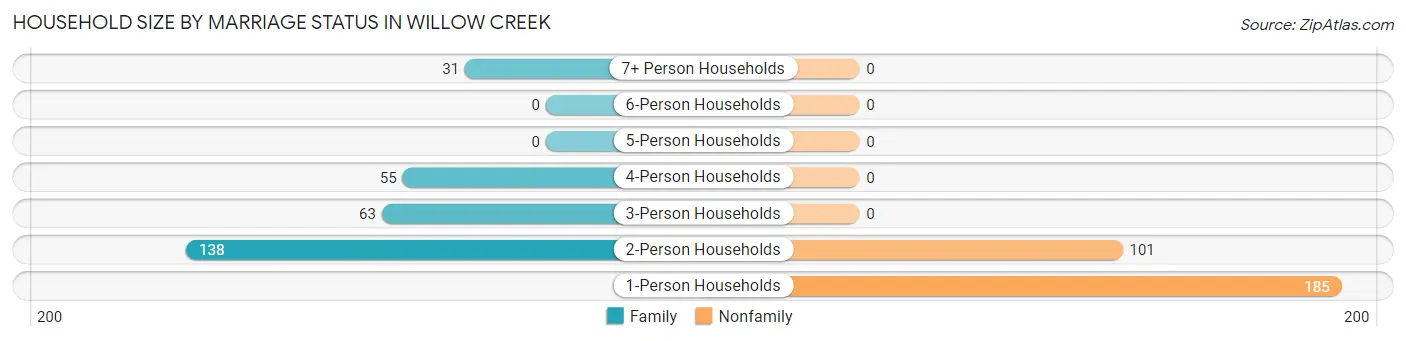
| Household Size | Family Households | Nonfamily Households |
| 1-Person Households | - | 185 (32.3%) |
| 2-Person Households | 138 (24.1%) | 101 (17.6%) |
| 3-Person Households | 63 (11.0%) | 0 (0.0%) |
| 4-Person Households | 55 (9.6%) | 0 (0.0%) |
| 5-Person Households | 0 (0.0%) | 0 (0.0%) |
| 6-Person Households | 0 (0.0%) | 0 (0.0%) |
| 7+ Person Households | 31 (5.4%) | 0 (0.0%) |
| Total | 287 (50.1%) | 286 (49.9%) |
Female Fertility in Willow Creek
Fertility by Age in Willow Creek
| Age Bracket | Women with Births | Births / 1,000 Women |
| 15 to 19 years | 0 (0.0%) | 0.0 |
| 20 to 34 years | 0 (0.0%) | 0.0 |
| 35 to 50 years | 0 (0.0%) | 0.0 |
| Total | 0 (0.0%) | 0.0 |
Fertility by Age by Marriage Status in Willow Creek
| Age Bracket | Married | Unmarried |
| 15 to 19 years | 0 (0.0%) | 0 (0.0%) |
| 20 to 34 years | 0 (0.0%) | 0 (0.0%) |
| 35 to 50 years | 0 (0.0%) | 0 (0.0%) |
| Total | 0 (0.0%) | 0 (0.0%) |
Fertility by Education in Willow Creek
| Educational Attainment | Women with Births | Births / 1,000 Women |
| Less than High School | 0 (0.0%) | 0.0 |
| High School Diploma | 0 (0.0%) | 0.0 |
| College or Associate's Degree | 0 (0.0%) | 0.0 |
| Bachelor's Degree | 0 (0.0%) | 0.0 |
| Graduate Degree | 0 (0.0%) | 0.0 |
| Total | 0 (0.0%) | 0.0 |
Fertility by Education by Marriage Status in Willow Creek
| Educational Attainment | Married | Unmarried |
| Less than High School | 0 (0.0%) | 0 (0.0%) |
| High School Diploma | 0 (0.0%) | 0 (0.0%) |
| College or Associate's Degree | 0 (0.0%) | 0 (0.0%) |
| Bachelor's Degree | 0 (0.0%) | 0 (0.0%) |
| Graduate Degree | 0 (0.0%) | 0 (0.0%) |
| Total | 0 (0.0%) | 0 (0.0%) |
Employment Characteristics in Willow Creek
Employment by Class of Employer in Willow Creek
Among the 533 employed individuals in Willow Creek, self-employed (not incorporated) (243 | 45.6%), private company employees (180 | 33.8%), and local government employees (70 | 13.1%) make up the most common classes of employment.
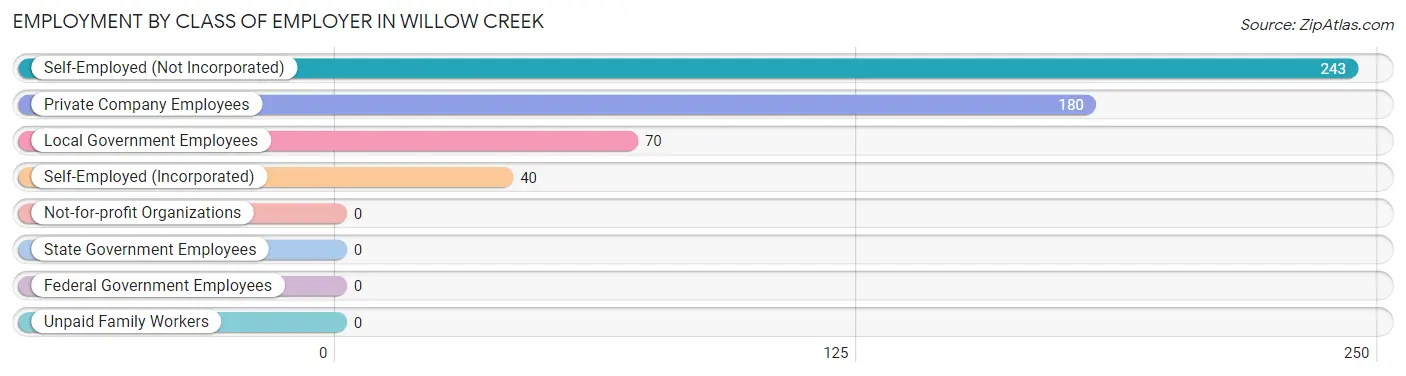
| Employer Class | # Employees | % Employees |
| Private Company Employees | 180 | 33.8% |
| Self-Employed (Incorporated) | 40 | 7.5% |
| Self-Employed (Not Incorporated) | 243 | 45.6% |
| Not-for-profit Organizations | 0 | 0.0% |
| Local Government Employees | 70 | 13.1% |
| State Government Employees | 0 | 0.0% |
| Federal Government Employees | 0 | 0.0% |
| Unpaid Family Workers | 0 | 0.0% |
| Total | 533 | 100.0% |
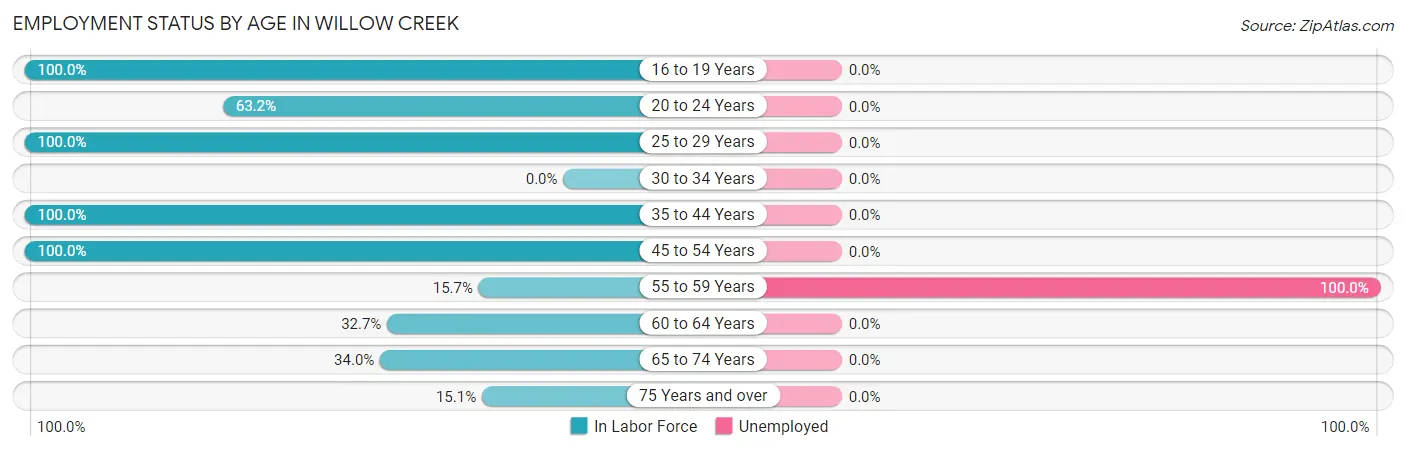
Employment Status by Age in Willow Creek
According to the labor force statistics for Willow Creek, out of the total population over 16 years of age (1,185), 47.6% or 564 individuals are in the labor force, with 5.5% or 31 of them unemployed. The age group with the highest labor force participation rate is 16 to 19 years, with 100.0% or 71 individuals in the labor force. Within the labor force, the 55 to 59 years age range has the highest percentage of unemployed individuals, with 100.0% or 31 of them being unemployed.
| Age Bracket | In Labor Force | Unemployed |
| 16 to 19 Years | 71 (100.0%) | 0 (0.0%) |
| 20 to 24 Years | 67 (63.2%) | 0 (0.0%) |
| 25 to 29 Years | 111 (100.0%) | 0 (0.0%) |
| 30 to 34 Years | 0 (0.0%) | 0 (0.0%) |
| 35 to 44 Years | 105 (100.0%) | 0 (0.0%) |
| 45 to 54 Years | 40 (100.0%) | 0 (0.0%) |
| 55 to 59 Years | 31 (15.7%) | 31 (100.0%) |
| 60 to 64 Years | 70 (32.7%) | 0 (0.0%) |
| 65 to 74 Years | 50 (34.0%) | 0 (0.0%) |
| 75 Years and over | 19 (15.1%) | 0 (0.0%) |
| Total | 564 (47.6%) | 31 (5.5%) |
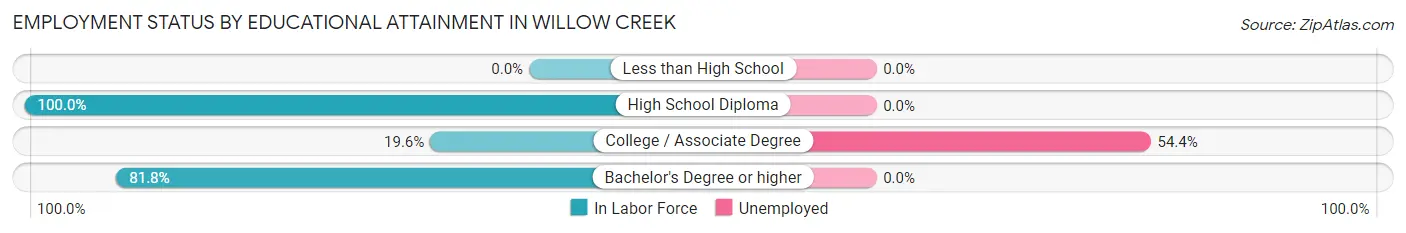
Employment Status by Educational Attainment in Willow Creek
According to labor force statistics for Willow Creek, 48.6% of individuals (357) out of the total population between 25 and 64 years of age (735) are in the labor force, with 8.7% or 31 of them being unemployed. The group with the highest labor force participation rate are those with the educational attainment of high school diploma, with 100.0% or 165 individuals in the labor force. Within the labor force, individuals with college / associate degree education have the highest percentage of unemployment, with 54.4% or 31 of them being unemployed.
| Educational Attainment | In Labor Force | Unemployed |
| Less than High School | 0 (0.0%) | 0 (0.0%) |
| High School Diploma | 165 (100.0%) | 0 (0.0%) |
| College / Associate Degree | 57 (19.6%) | 158 (54.4%) |
| Bachelor's Degree or higher | 135 (81.8%) | 0 (0.0%) |
| Total | 357 (48.6%) | 64 (8.7%) |
Employment Occupations by Sex in Willow Creek
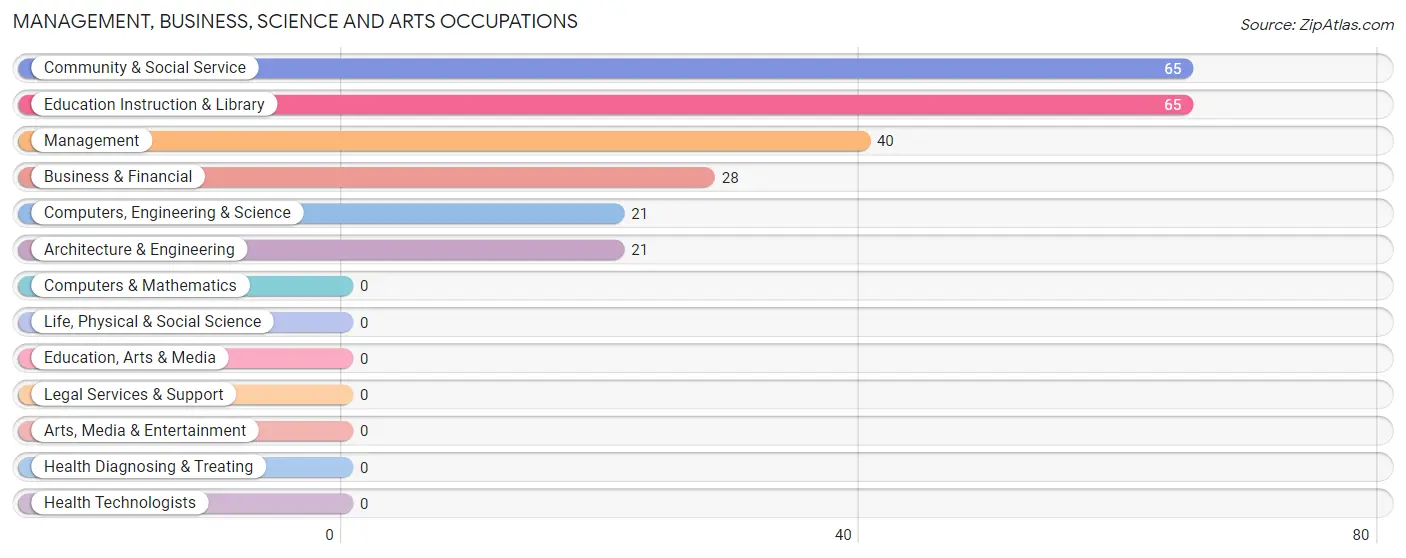
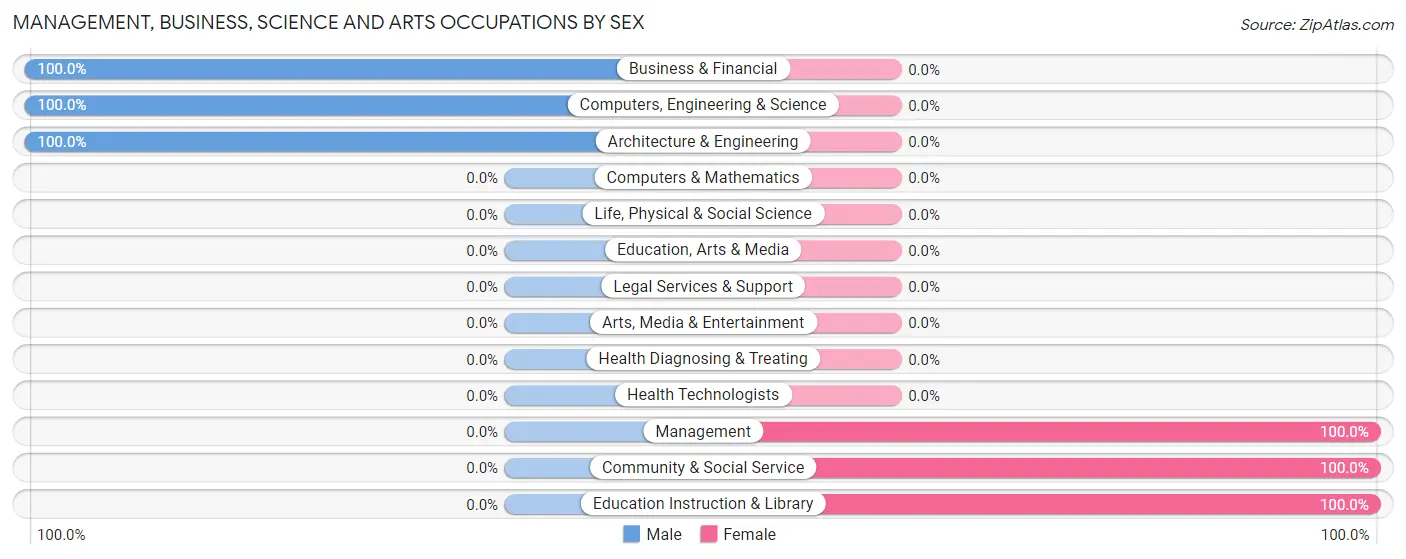
Management, Business, Science and Arts Occupations
The most common Management, Business, Science and Arts occupations in Willow Creek are Community & Social Service (65 | 12.2%), Education Instruction & Library (65 | 12.2%), Management (40 | 7.5%), Business & Financial (28 | 5.2%), and Computers, Engineering & Science (21 | 3.9%).
Management, Business, Science and Arts Occupations by Sex
Within the Management, Business, Science and Arts occupations in Willow Creek, the most male-oriented occupations are Business & Financial (100.0%), Computers, Engineering & Science (100.0%), and Architecture & Engineering (100.0%), while the most female-oriented occupations are Management (100.0%), Community & Social Service (100.0%), and Education Instruction & Library (100.0%).
| Occupation | Male | Female |
| Management | 0 (0.0%) | 40 (100.0%) |
| Business & Financial | 28 (100.0%) | 0 (0.0%) |
| Computers, Engineering & Science | 21 (100.0%) | 0 (0.0%) |
| Computers & Mathematics | 0 (0.0%) | 0 (0.0%) |
| Architecture & Engineering | 21 (100.0%) | 0 (0.0%) |
| Life, Physical & Social Science | 0 (0.0%) | 0 (0.0%) |
| Community & Social Service | 0 (0.0%) | 65 (100.0%) |
| Education, Arts & Media | 0 (0.0%) | 0 (0.0%) |
| Legal Services & Support | 0 (0.0%) | 0 (0.0%) |
| Education Instruction & Library | 0 (0.0%) | 65 (100.0%) |
| Arts, Media & Entertainment | 0 (0.0%) | 0 (0.0%) |
| Health Diagnosing & Treating | 0 (0.0%) | 0 (0.0%) |
| Health Technologists | 0 (0.0%) | 0 (0.0%) |
| Total (Category) | 49 (31.8%) | 105 (68.2%) |
| Total (Overall) | 287 (53.8%) | 246 (46.2%) |
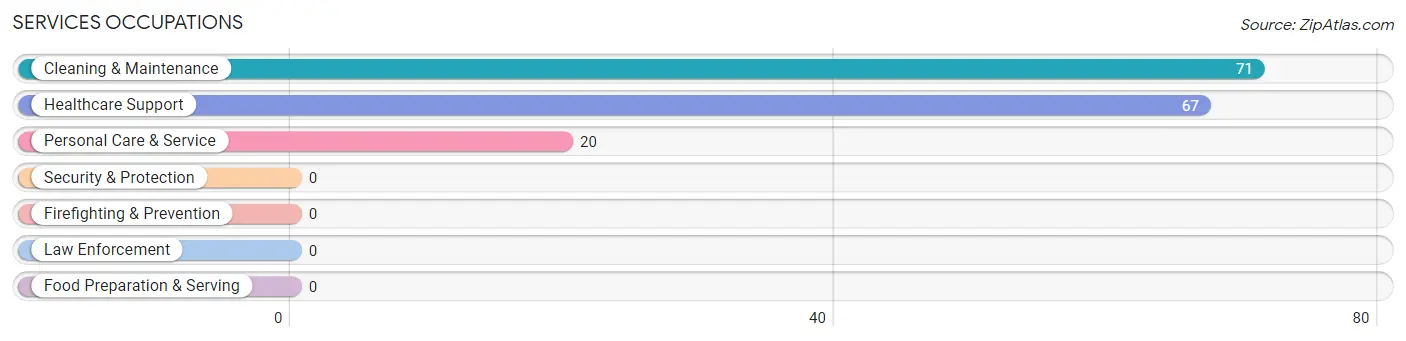
Services Occupations
The most common Services occupations in Willow Creek are Cleaning & Maintenance (71 | 13.3%), Healthcare Support (67 | 12.6%), and Personal Care & Service (20 | 3.7%).
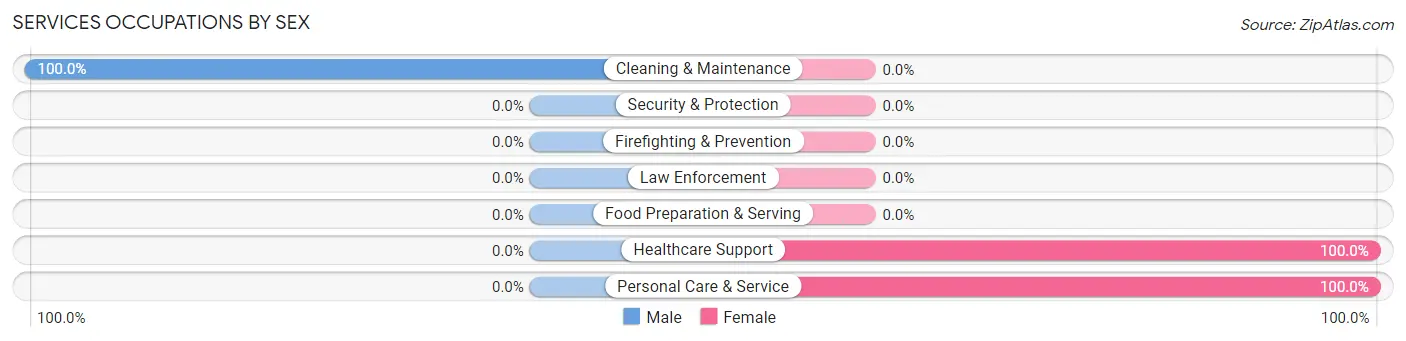
Services Occupations by Sex
| Occupation | Male | Female |
| Healthcare Support | 0 (0.0%) | 67 (100.0%) |
| Security & Protection | 0 (0.0%) | 0 (0.0%) |
| Firefighting & Prevention | 0 (0.0%) | 0 (0.0%) |
| Law Enforcement | 0 (0.0%) | 0 (0.0%) |
| Food Preparation & Serving | 0 (0.0%) | 0 (0.0%) |
| Cleaning & Maintenance | 71 (100.0%) | 0 (0.0%) |
| Personal Care & Service | 0 (0.0%) | 20 (100.0%) |
| Total (Category) | 71 (44.9%) | 87 (55.1%) |
| Total (Overall) | 287 (53.8%) | 246 (46.2%) |
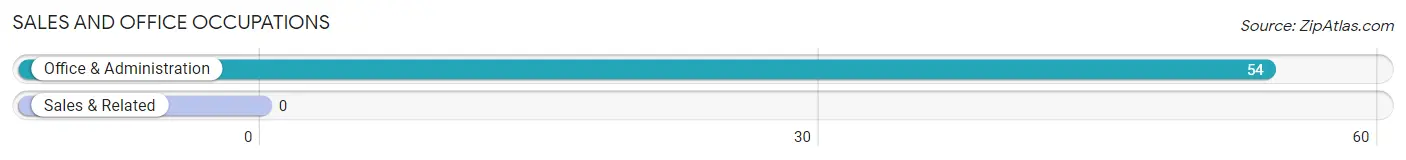
Sales and Office Occupations
The most common Sales and Office occupations in Willow Creek are , and Office & Administration (54 | 10.1%).
Sales and Office Occupations by Sex

| Occupation | Male | Female |
| Sales & Related | 0 (0.0%) | 0 (0.0%) |
| Office & Administration | 0 (0.0%) | 54 (100.0%) |
| Total (Category) | 0 (0.0%) | 54 (100.0%) |
| Total (Overall) | 287 (53.8%) | 246 (46.2%) |
Natural Resources, Construction and Maintenance Occupations
The most common Natural Resources, Construction and Maintenance occupations in Willow Creek are Construction & Extraction (117 | 22.0%), and Installation, Maintenance & Repair (19 | 3.6%).
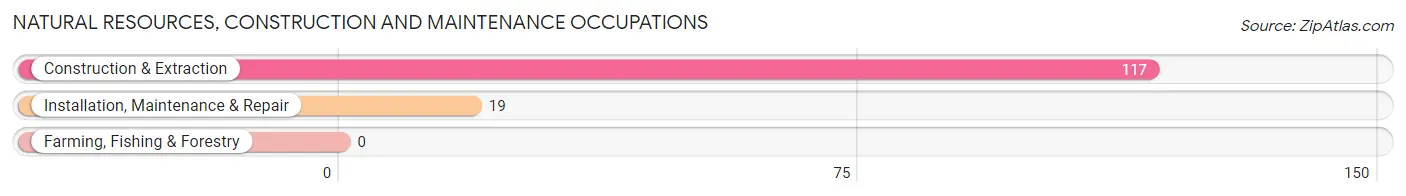
Natural Resources, Construction and Maintenance Occupations by Sex
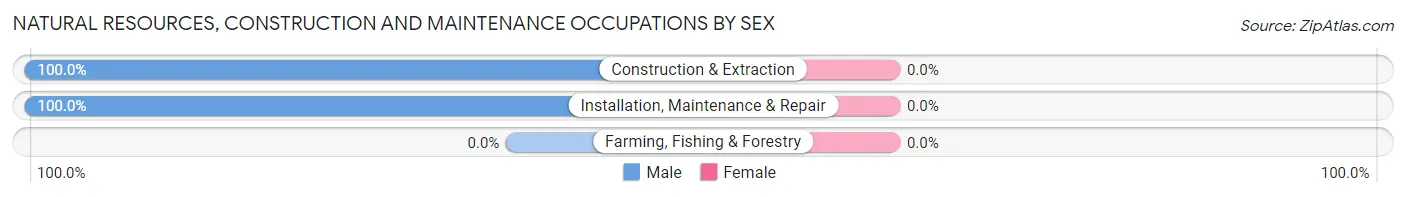
| Occupation | Male | Female |
| Farming, Fishing & Forestry | 0 (0.0%) | 0 (0.0%) |
| Construction & Extraction | 117 (100.0%) | 0 (0.0%) |
| Installation, Maintenance & Repair | 19 (100.0%) | 0 (0.0%) |
| Total (Category) | 136 (100.0%) | 0 (0.0%) |
| Total (Overall) | 287 (53.8%) | 246 (46.2%) |
Production, Transportation and Moving Occupations
The most common Production, Transportation and Moving occupations in Willow Creek are , and Production (31 | 5.8%).
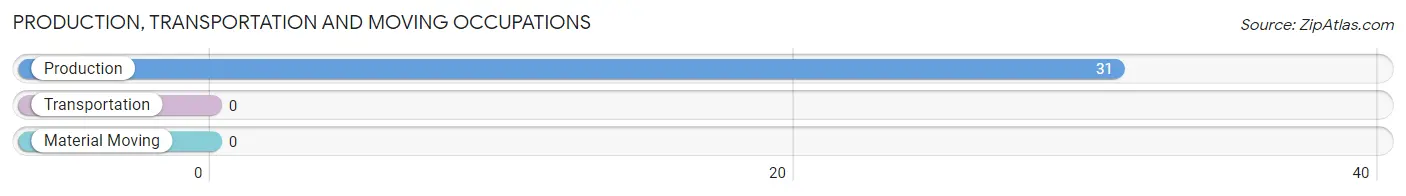
Production, Transportation and Moving Occupations by Sex
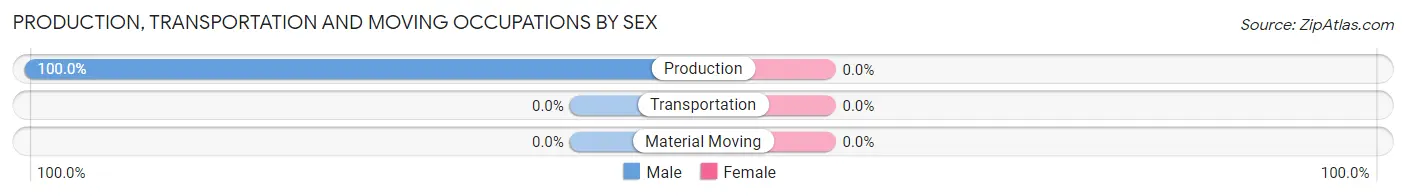
| Occupation | Male | Female |
| Production | 31 (100.0%) | 0 (0.0%) |
| Transportation | 0 (0.0%) | 0 (0.0%) |
| Material Moving | 0 (0.0%) | 0 (0.0%) |
| Total (Category) | 31 (100.0%) | 0 (0.0%) |
| Total (Overall) | 287 (53.8%) | 246 (46.2%) |
Employment Industries by Sex in Willow Creek
Employment Industries in Willow Creek
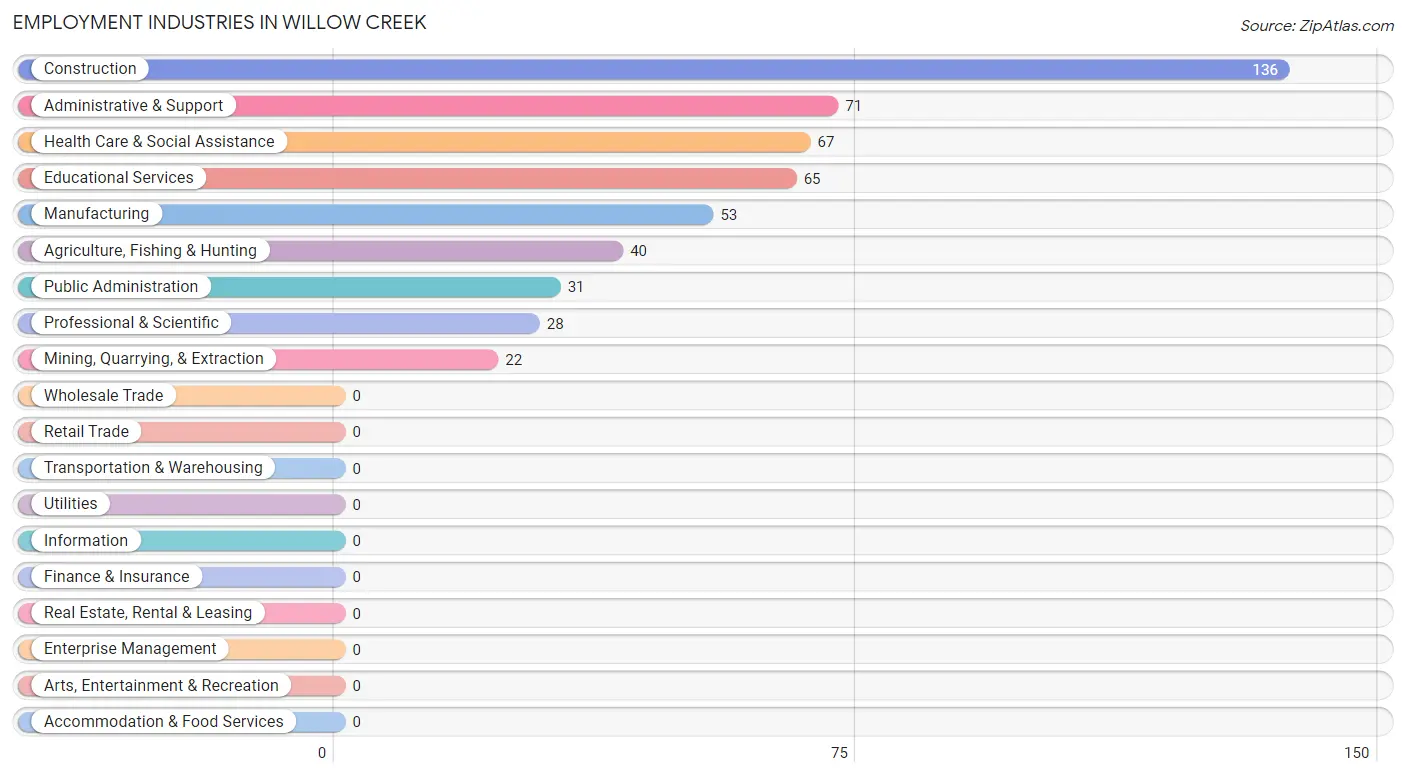
The major employment industries in Willow Creek include Construction (136 | 25.5%), Administrative & Support (71 | 13.3%), Health Care & Social Assistance (67 | 12.6%), Educational Services (65 | 12.2%), and Manufacturing (53 | 9.9%).
Employment Industries by Sex in Willow Creek
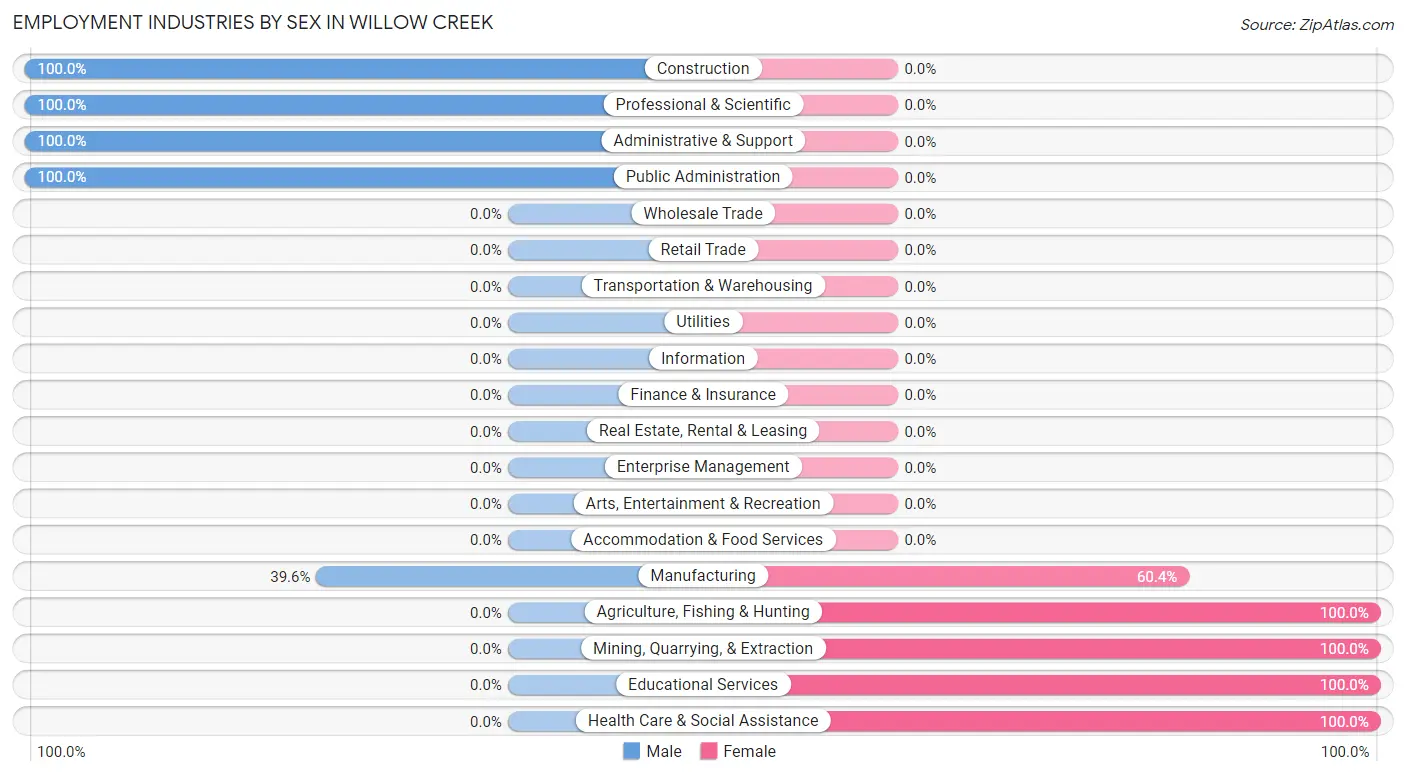
The Willow Creek industries that see more men than women are Construction (100.0%), Professional & Scientific (100.0%), and Administrative & Support (100.0%), whereas the industries that tend to have a higher number of women are Agriculture, Fishing & Hunting (100.0%), Mining, Quarrying, & Extraction (100.0%), and Educational Services (100.0%).
| Industry | Male | Female |
| Agriculture, Fishing & Hunting | 0 (0.0%) | 40 (100.0%) |
| Mining, Quarrying, & Extraction | 0 (0.0%) | 22 (100.0%) |
| Construction | 136 (100.0%) | 0 (0.0%) |
| Manufacturing | 21 (39.6%) | 32 (60.4%) |
| Wholesale Trade | 0 (0.0%) | 0 (0.0%) |
| Retail Trade | 0 (0.0%) | 0 (0.0%) |
| Transportation & Warehousing | 0 (0.0%) | 0 (0.0%) |
| Utilities | 0 (0.0%) | 0 (0.0%) |
| Information | 0 (0.0%) | 0 (0.0%) |
| Finance & Insurance | 0 (0.0%) | 0 (0.0%) |
| Real Estate, Rental & Leasing | 0 (0.0%) | 0 (0.0%) |
| Professional & Scientific | 28 (100.0%) | 0 (0.0%) |
| Enterprise Management | 0 (0.0%) | 0 (0.0%) |
| Administrative & Support | 71 (100.0%) | 0 (0.0%) |
| Educational Services | 0 (0.0%) | 65 (100.0%) |
| Health Care & Social Assistance | 0 (0.0%) | 67 (100.0%) |
| Arts, Entertainment & Recreation | 0 (0.0%) | 0 (0.0%) |
| Accommodation & Food Services | 0 (0.0%) | 0 (0.0%) |
| Public Administration | 31 (100.0%) | 0 (0.0%) |
| Total | 287 (53.8%) | 246 (46.2%) |
Education in Willow Creek
School Enrollment in Willow Creek
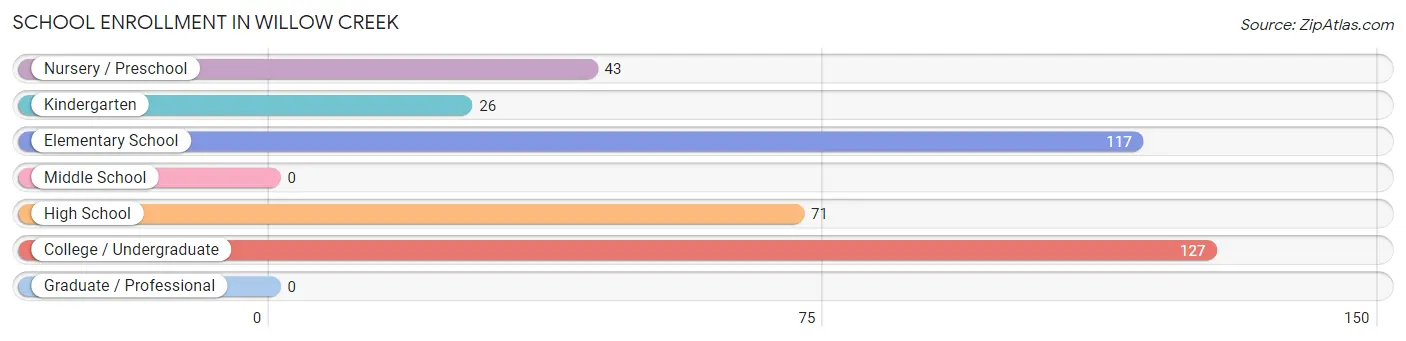
The most common levels of schooling among the 384 students in Willow Creek are college / undergraduate (127 | 33.1%), elementary school (117 | 30.5%), and high school (71 | 18.5%).
| School Level | # Students | % Students |
| Nursery / Preschool | 43 | 11.2% |
| Kindergarten | 26 | 6.8% |
| Elementary School | 117 | 30.5% |
| Middle School | 0 | 0.0% |
| High School | 71 | 18.5% |
| College / Undergraduate | 127 | 33.1% |
| Graduate / Professional | 0 | 0.0% |
| Total | 384 | 100.0% |
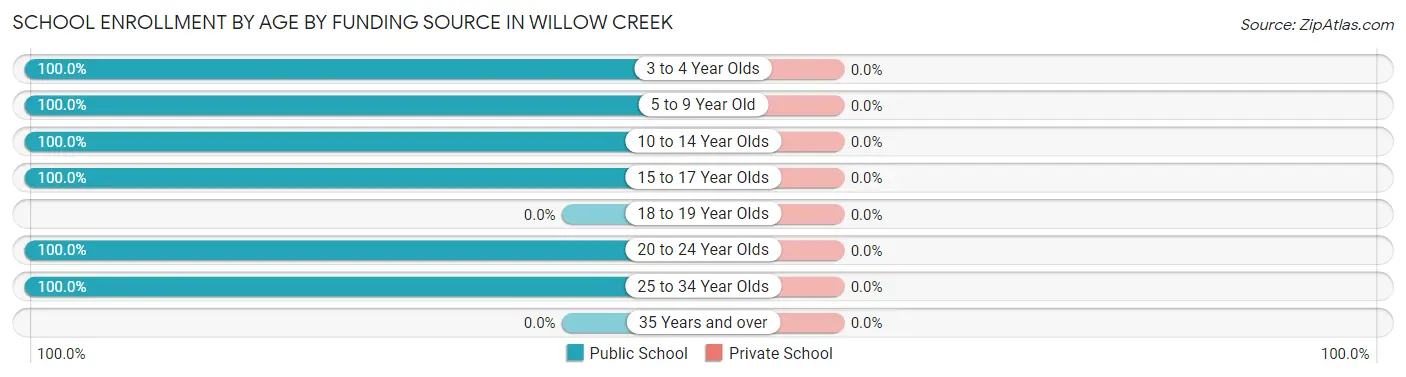
School Enrollment by Age by Funding Source in Willow Creek
| Age Bracket | Public School | Private School |
| 3 to 4 Year Olds | 43 (100.0%) | 0 (0.0%) |
| 5 to 9 Year Old | 85 (100.0%) | 0 (0.0%) |
| 10 to 14 Year Olds | 58 (100.0%) | 0 (0.0%) |
| 15 to 17 Year Olds | 71 (100.0%) | 0 (0.0%) |
| 18 to 19 Year Olds | 0 (0.0%) | 0 (0.0%) |
| 20 to 24 Year Olds | 67 (100.0%) | 0 (0.0%) |
| 25 to 34 Year Olds | 60 (100.0%) | 0 (0.0%) |
| 35 Years and over | 0 (0.0%) | 0 (0.0%) |
| Total | 384 (100.0%) | 0 (0.0%) |
Educational Attainment by Field of Study in Willow Creek
Education (69 | 27.3%), visual & performing arts (65 | 25.7%), liberal arts & history (31 | 12.2%), computers & mathematics (28 | 11.1%), and business (28 | 11.1%) are the most common fields of study among 253 individuals in Willow Creek who have obtained a bachelor's degree or higher.
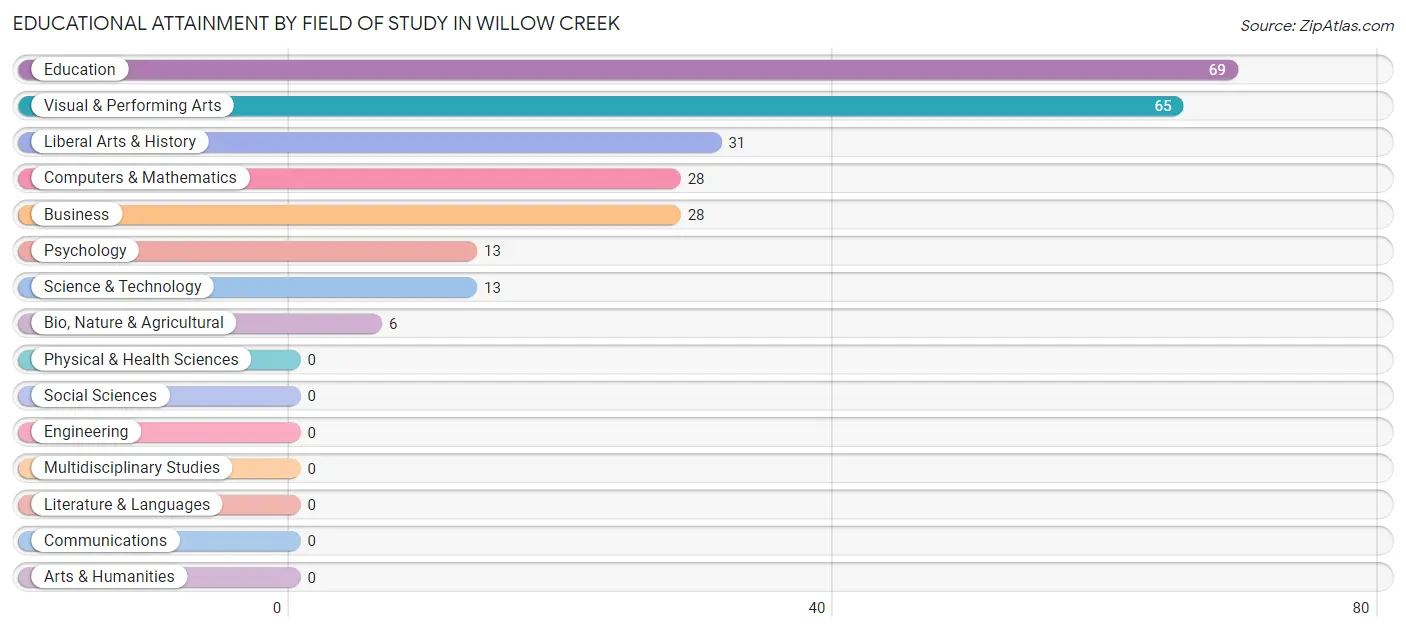
| Field of Study | # Graduates | % Graduates |
| Computers & Mathematics | 28 | 11.1% |
| Bio, Nature & Agricultural | 6 | 2.4% |
| Physical & Health Sciences | 0 | 0.0% |
| Psychology | 13 | 5.1% |
| Social Sciences | 0 | 0.0% |
| Engineering | 0 | 0.0% |
| Multidisciplinary Studies | 0 | 0.0% |
| Science & Technology | 13 | 5.1% |
| Business | 28 | 11.1% |
| Education | 69 | 27.3% |
| Literature & Languages | 0 | 0.0% |
| Liberal Arts & History | 31 | 12.2% |
| Visual & Performing Arts | 65 | 25.7% |
| Communications | 0 | 0.0% |
| Arts & Humanities | 0 | 0.0% |
| Total | 253 | 100.0% |
Transportation & Commute in Willow Creek
Vehicle Availability by Sex in Willow Creek
The most prevalent vehicle ownership categories in Willow Creek are males with 3 vehicles (136, accounting for 47.4%) and females with 3 vehicles (135, making up 55.3%).
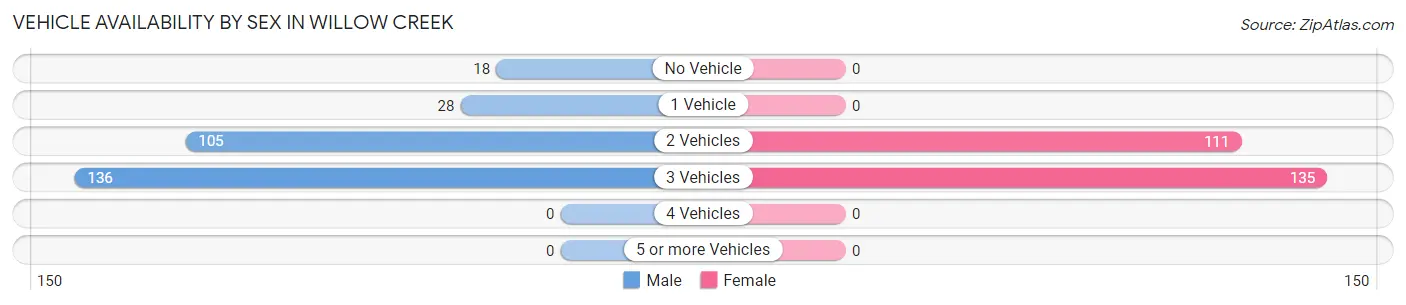
| Vehicles Available | Male | Female |
| No Vehicle | 18 (6.3%) | 0 (0.0%) |
| 1 Vehicle | 28 (9.8%) | 0 (0.0%) |
| 2 Vehicles | 105 (36.6%) | 111 (45.1%) |
| 3 Vehicles | 136 (47.4%) | 135 (54.9%) |
| 4 Vehicles | 0 (0.0%) | 0 (0.0%) |
| 5 or more Vehicles | 0 (0.0%) | 0 (0.0%) |
| Total | 287 (100.0%) | 246 (100.0%) |
Commute Time in Willow Creek
The most frequently occuring commute durations in Willow Creek are 20 to 24 minutes (173 commuters, 41.1%), less than 5 minutes (91 commuters, 21.6%), and 5 to 9 minutes (72 commuters, 17.1%).
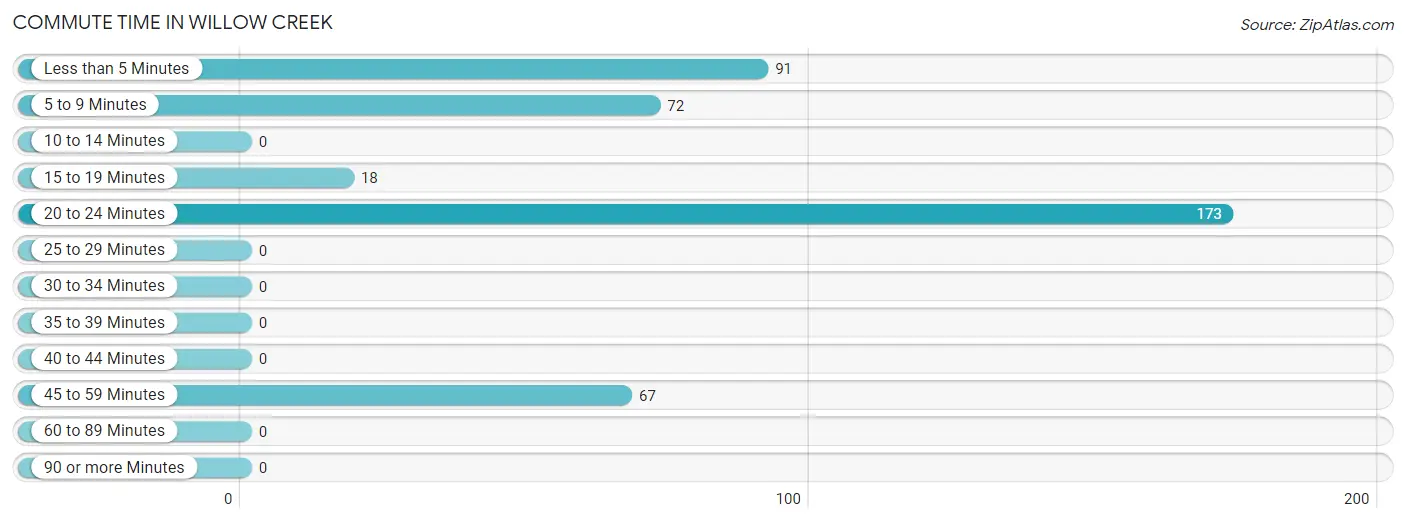
| Commute Time | # Commuters | % Commuters |
| Less than 5 Minutes | 91 | 21.6% |
| 5 to 9 Minutes | 72 | 17.1% |
| 10 to 14 Minutes | 0 | 0.0% |
| 15 to 19 Minutes | 18 | 4.3% |
| 20 to 24 Minutes | 173 | 41.1% |
| 25 to 29 Minutes | 0 | 0.0% |
| 30 to 34 Minutes | 0 | 0.0% |
| 35 to 39 Minutes | 0 | 0.0% |
| 40 to 44 Minutes | 0 | 0.0% |
| 45 to 59 Minutes | 67 | 15.9% |
| 60 to 89 Minutes | 0 | 0.0% |
| 90 or more Minutes | 0 | 0.0% |
Commute Time by Sex in Willow Creek
The most common commute times in Willow Creek are less than 5 minutes (65 commuters, 33.0%) for males and 20 to 24 minutes (111 commuters, 49.5%) for females.
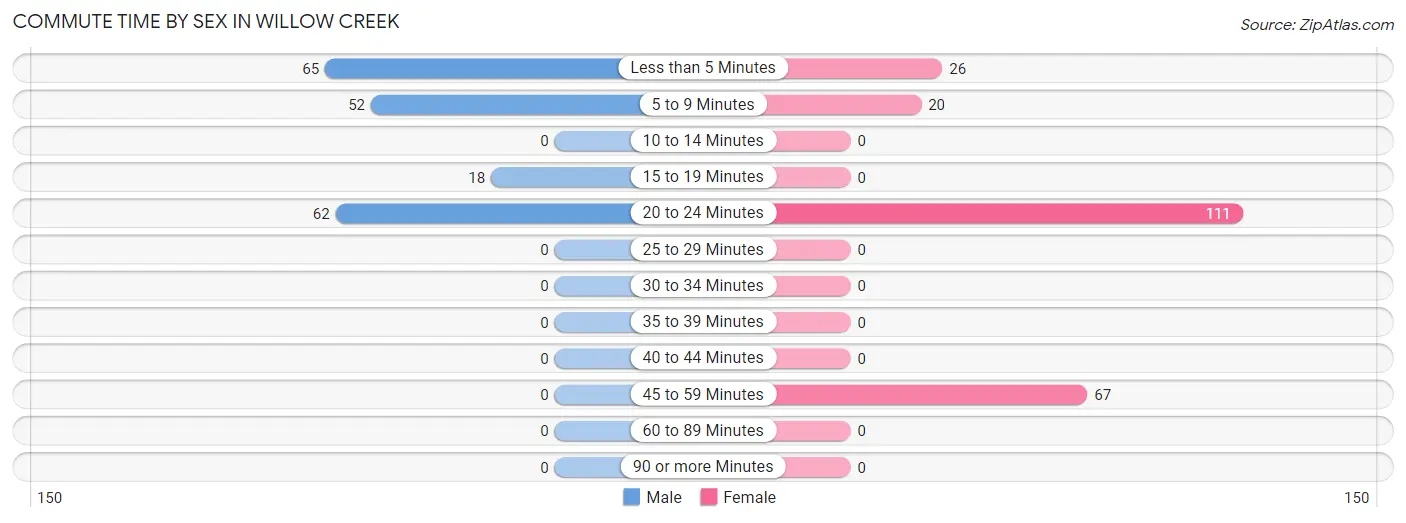
| Commute Time | Male | Female |
| Less than 5 Minutes | 65 (33.0%) | 26 (11.6%) |
| 5 to 9 Minutes | 52 (26.4%) | 20 (8.9%) |
| 10 to 14 Minutes | 0 (0.0%) | 0 (0.0%) |
| 15 to 19 Minutes | 18 (9.1%) | 0 (0.0%) |
| 20 to 24 Minutes | 62 (31.5%) | 111 (49.5%) |
| 25 to 29 Minutes | 0 (0.0%) | 0 (0.0%) |
| 30 to 34 Minutes | 0 (0.0%) | 0 (0.0%) |
| 35 to 39 Minutes | 0 (0.0%) | 0 (0.0%) |
| 40 to 44 Minutes | 0 (0.0%) | 0 (0.0%) |
| 45 to 59 Minutes | 0 (0.0%) | 67 (29.9%) |
| 60 to 89 Minutes | 0 (0.0%) | 0 (0.0%) |
| 90 or more Minutes | 0 (0.0%) | 0 (0.0%) |
Time of Departure to Work by Sex in Willow Creek
The most frequent times of departure to work in Willow Creek are 7:00 AM to 7:29 AM (99, 50.2%) for males and 12:00 PM to 3:59 PM (67, 29.9%) for females.
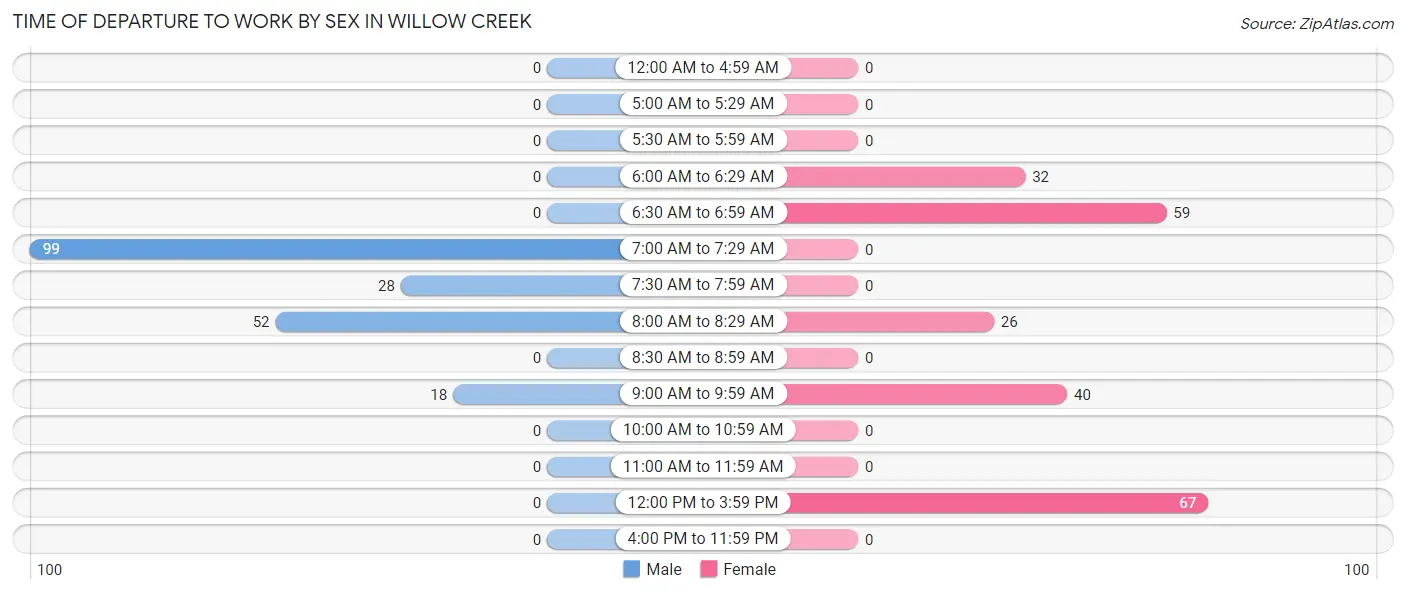
| Time of Departure | Male | Female |
| 12:00 AM to 4:59 AM | 0 (0.0%) | 0 (0.0%) |
| 5:00 AM to 5:29 AM | 0 (0.0%) | 0 (0.0%) |
| 5:30 AM to 5:59 AM | 0 (0.0%) | 0 (0.0%) |
| 6:00 AM to 6:29 AM | 0 (0.0%) | 32 (14.3%) |
| 6:30 AM to 6:59 AM | 0 (0.0%) | 59 (26.3%) |
| 7:00 AM to 7:29 AM | 99 (50.2%) | 0 (0.0%) |
| 7:30 AM to 7:59 AM | 28 (14.2%) | 0 (0.0%) |
| 8:00 AM to 8:29 AM | 52 (26.4%) | 26 (11.6%) |
| 8:30 AM to 8:59 AM | 0 (0.0%) | 0 (0.0%) |
| 9:00 AM to 9:59 AM | 18 (9.1%) | 40 (17.9%) |
| 10:00 AM to 10:59 AM | 0 (0.0%) | 0 (0.0%) |
| 11:00 AM to 11:59 AM | 0 (0.0%) | 0 (0.0%) |
| 12:00 PM to 3:59 PM | 0 (0.0%) | 67 (29.9%) |
| 4:00 PM to 11:59 PM | 0 (0.0%) | 0 (0.0%) |
| Total | 197 (100.0%) | 224 (100.0%) |
Housing Occupancy in Willow Creek
Occupancy by Ownership in Willow Creek
Of the total 573 dwellings in Willow Creek, owner-occupied units account for 365 (63.7%), while renter-occupied units make up 208 (36.3%).
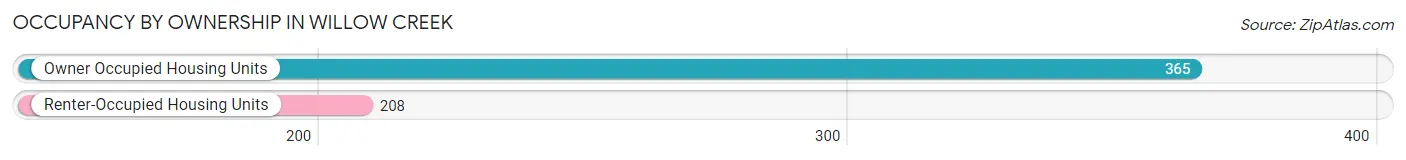
| Occupancy | # Housing Units | % Housing Units |
| Owner Occupied Housing Units | 365 | 63.7% |
| Renter-Occupied Housing Units | 208 | 36.3% |
| Total Occupied Housing Units | 573 | 100.0% |
Occupancy by Household Size in Willow Creek
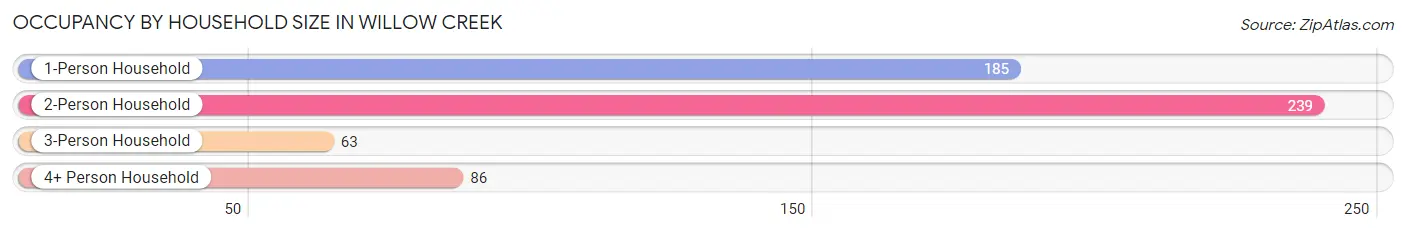
| Household Size | # Housing Units | % Housing Units |
| 1-Person Household | 185 | 32.3% |
| 2-Person Household | 239 | 41.7% |
| 3-Person Household | 63 | 11.0% |
| 4+ Person Household | 86 | 15.0% |
| Total Housing Units | 573 | 100.0% |
Occupancy by Ownership by Household Size in Willow Creek
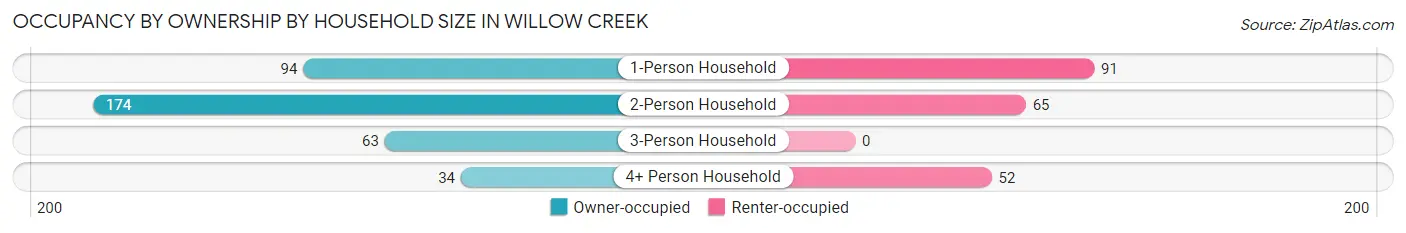
| Household Size | Owner-occupied | Renter-occupied |
| 1-Person Household | 94 (50.8%) | 91 (49.2%) |
| 2-Person Household | 174 (72.8%) | 65 (27.2%) |
| 3-Person Household | 63 (100.0%) | 0 (0.0%) |
| 4+ Person Household | 34 (39.5%) | 52 (60.5%) |
| Total Housing Units | 365 (63.7%) | 208 (36.3%) |
Occupancy by Educational Attainment in Willow Creek
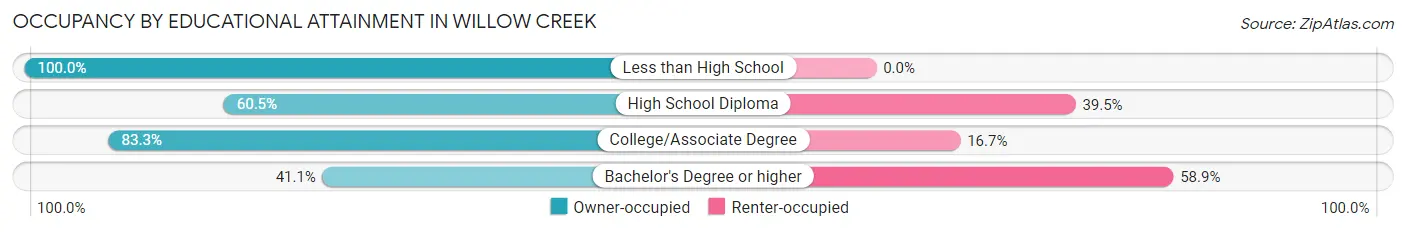
| Household Size | Owner-occupied | Renter-occupied |
| Less than High School | 19 (100.0%) | 0 (0.0%) |
| High School Diploma | 124 (60.5%) | 81 (39.5%) |
| College/Associate Degree | 155 (83.3%) | 31 (16.7%) |
| Bachelor's Degree or higher | 67 (41.1%) | 96 (58.9%) |
Occupancy by Age of Householder in Willow Creek
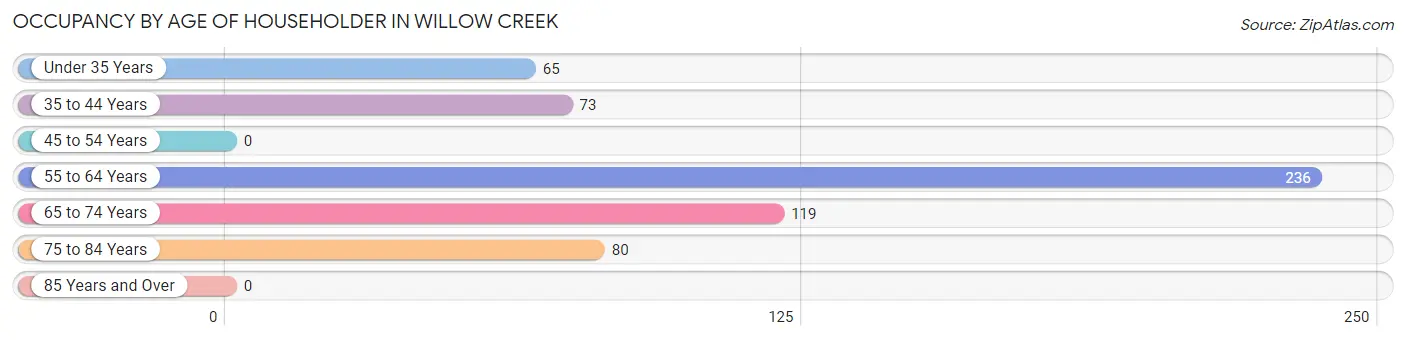
| Age Bracket | # Households | % Households |
| Under 35 Years | 65 | 11.3% |
| 35 to 44 Years | 73 | 12.7% |
| 45 to 54 Years | 0 | 0.0% |
| 55 to 64 Years | 236 | 41.2% |
| 65 to 74 Years | 119 | 20.8% |
| 75 to 84 Years | 80 | 14.0% |
| 85 Years and Over | 0 | 0.0% |
| Total | 573 | 100.0% |
Housing Finances in Willow Creek
Median Income by Occupancy in Willow Creek
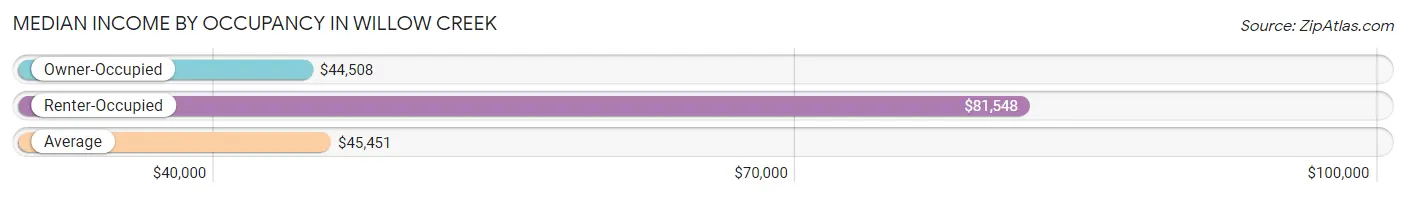
| Occupancy Type | # Households | Median Income |
| Owner-Occupied | 365 (63.7%) | $44,508 |
| Renter-Occupied | 208 (36.3%) | $81,548 |
| Average | 573 (100.0%) | $45,451 |
Occupancy by Householder Income Bracket in Willow Creek
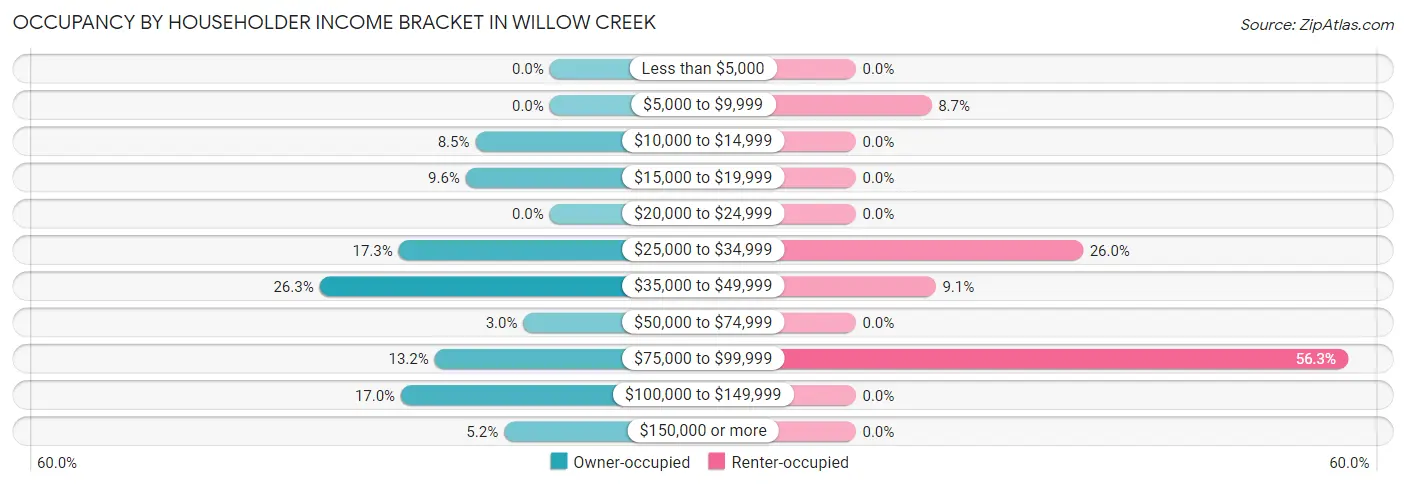
| Income Bracket | Owner-occupied | Renter-occupied |
| Less than $5,000 | 0 (0.0%) | 0 (0.0%) |
| $5,000 to $9,999 | 0 (0.0%) | 18 (8.6%) |
| $10,000 to $14,999 | 31 (8.5%) | 0 (0.0%) |
| $15,000 to $19,999 | 35 (9.6%) | 0 (0.0%) |
| $20,000 to $24,999 | 0 (0.0%) | 0 (0.0%) |
| $25,000 to $34,999 | 63 (17.3%) | 54 (26.0%) |
| $35,000 to $49,999 | 96 (26.3%) | 19 (9.1%) |
| $50,000 to $74,999 | 11 (3.0%) | 0 (0.0%) |
| $75,000 to $99,999 | 48 (13.2%) | 117 (56.2%) |
| $100,000 to $149,999 | 62 (17.0%) | 0 (0.0%) |
| $150,000 or more | 19 (5.2%) | 0 (0.0%) |
| Total | 365 (100.0%) | 208 (100.0%) |
Monthly Housing Cost Tiers in Willow Creek
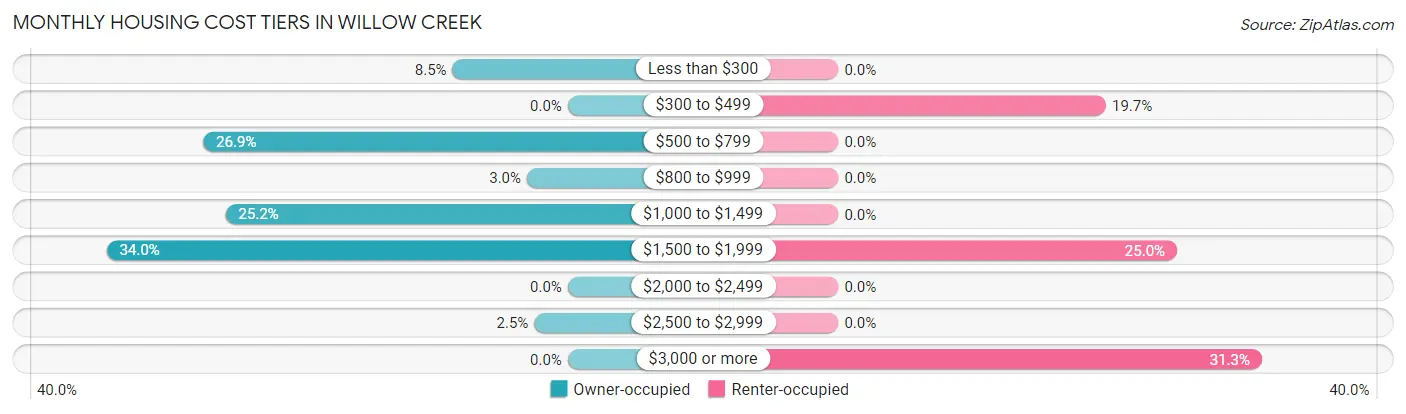
| Monthly Cost | Owner-occupied | Renter-occupied |
| Less than $300 | 31 (8.5%) | 0 (0.0%) |
| $300 to $499 | 0 (0.0%) | 41 (19.7%) |
| $500 to $799 | 98 (26.9%) | 0 (0.0%) |
| $800 to $999 | 11 (3.0%) | 0 (0.0%) |
| $1,000 to $1,499 | 92 (25.2%) | 0 (0.0%) |
| $1,500 to $1,999 | 124 (34.0%) | 52 (25.0%) |
| $2,000 to $2,499 | 0 (0.0%) | 0 (0.0%) |
| $2,500 to $2,999 | 9 (2.5%) | 0 (0.0%) |
| $3,000 or more | 0 (0.0%) | 65 (31.2%) |
| Total | 365 (100.0%) | 208 (100.0%) |
Physical Housing Characteristics in Willow Creek
Housing Structures in Willow Creek
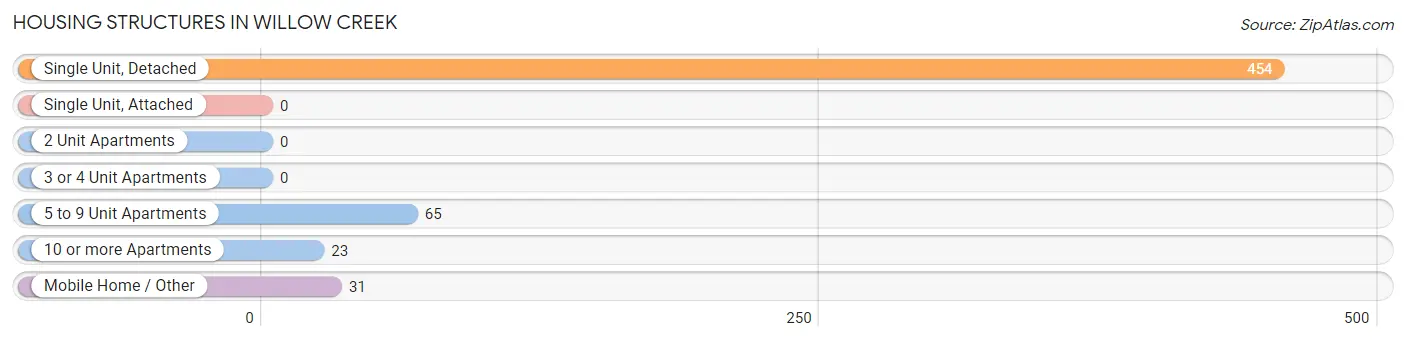
| Structure Type | # Housing Units | % Housing Units |
| Single Unit, Detached | 454 | 79.2% |
| Single Unit, Attached | 0 | 0.0% |
| 2 Unit Apartments | 0 | 0.0% |
| 3 or 4 Unit Apartments | 0 | 0.0% |
| 5 to 9 Unit Apartments | 65 | 11.3% |
| 10 or more Apartments | 23 | 4.0% |
| Mobile Home / Other | 31 | 5.4% |
| Total | 573 | 100.0% |
Housing Structures by Occupancy in Willow Creek
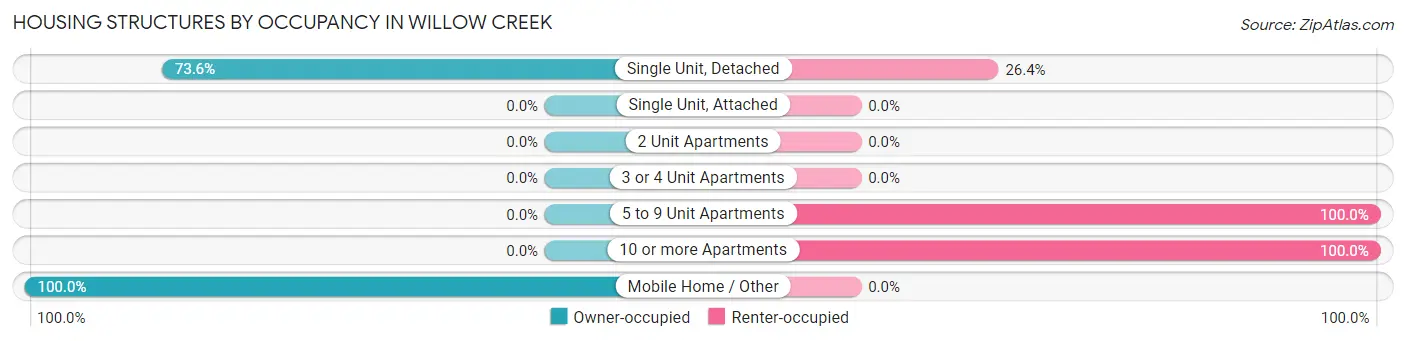
| Structure Type | Owner-occupied | Renter-occupied |
| Single Unit, Detached | 334 (73.6%) | 120 (26.4%) |
| Single Unit, Attached | 0 (0.0%) | 0 (0.0%) |
| 2 Unit Apartments | 0 (0.0%) | 0 (0.0%) |
| 3 or 4 Unit Apartments | 0 (0.0%) | 0 (0.0%) |
| 5 to 9 Unit Apartments | 0 (0.0%) | 65 (100.0%) |
| 10 or more Apartments | 0 (0.0%) | 23 (100.0%) |
| Mobile Home / Other | 31 (100.0%) | 0 (0.0%) |
| Total | 365 (63.7%) | 208 (36.3%) |
Housing Structures by Number of Rooms in Willow Creek
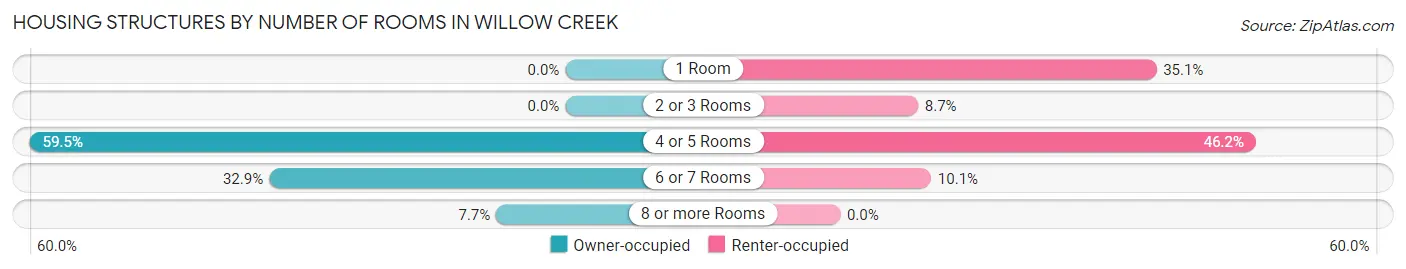
| Number of Rooms | Owner-occupied | Renter-occupied |
| 1 Room | 0 (0.0%) | 73 (35.1%) |
| 2 or 3 Rooms | 0 (0.0%) | 18 (8.6%) |
| 4 or 5 Rooms | 217 (59.5%) | 96 (46.2%) |
| 6 or 7 Rooms | 120 (32.9%) | 21 (10.1%) |
| 8 or more Rooms | 28 (7.7%) | 0 (0.0%) |
| Total | 365 (100.0%) | 208 (100.0%) |
Housing Structure by Heating Type in Willow Creek
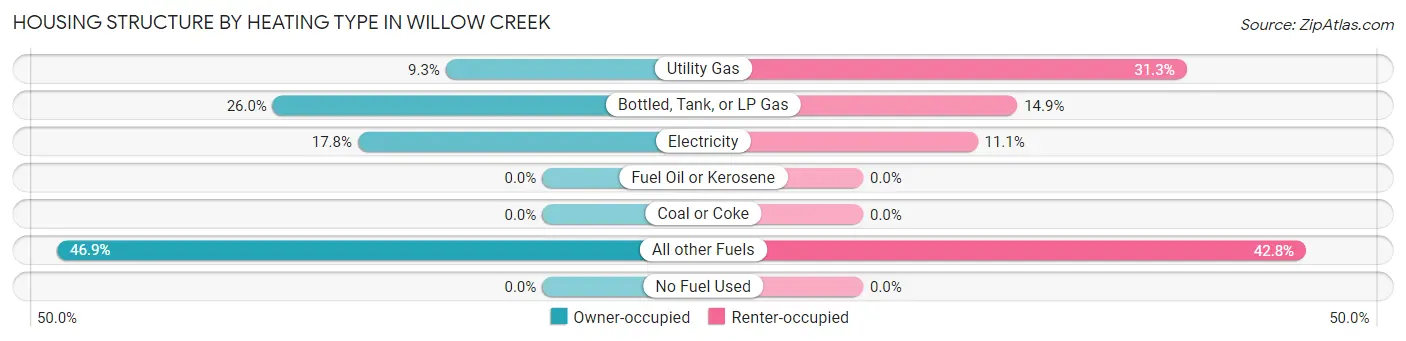
| Heating Type | Owner-occupied | Renter-occupied |
| Utility Gas | 34 (9.3%) | 65 (31.2%) |
| Bottled, Tank, or LP Gas | 95 (26.0%) | 31 (14.9%) |
| Electricity | 65 (17.8%) | 23 (11.1%) |
| Fuel Oil or Kerosene | 0 (0.0%) | 0 (0.0%) |
| Coal or Coke | 0 (0.0%) | 0 (0.0%) |
| All other Fuels | 171 (46.9%) | 89 (42.8%) |
| No Fuel Used | 0 (0.0%) | 0 (0.0%) |
| Total | 365 (100.0%) | 208 (100.0%) |
Household Vehicle Usage in Willow Creek
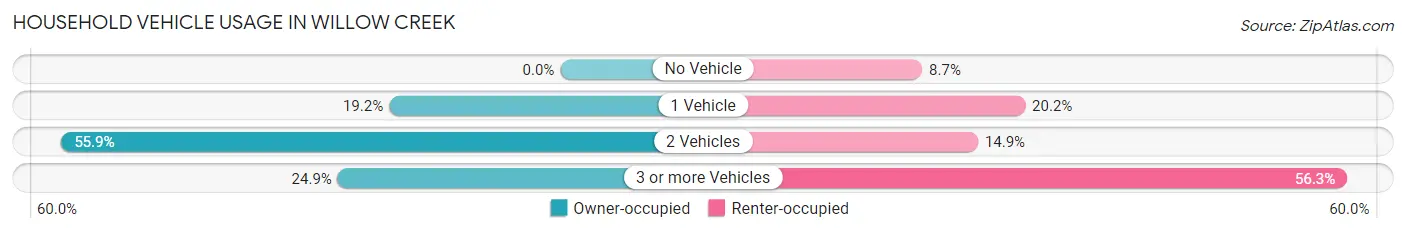
| Vehicles per Household | Owner-occupied | Renter-occupied |
| No Vehicle | 0 (0.0%) | 18 (8.6%) |
| 1 Vehicle | 70 (19.2%) | 42 (20.2%) |
| 2 Vehicles | 204 (55.9%) | 31 (14.9%) |
| 3 or more Vehicles | 91 (24.9%) | 117 (56.2%) |
| Total | 365 (100.0%) | 208 (100.0%) |
Real Estate & Mortgages in Willow Creek
Real Estate and Mortgage Overview in Willow Creek
| Characteristic | Without Mortgage | With Mortgage |
| Housing Units | 140 | 225 |
| Median Property Value | - | - |
| Median Household Income | - | - |
| Monthly Housing Costs | $606 | $0 |
| Real Estate Taxes | - | - |
Property Value by Mortgage Status in Willow Creek
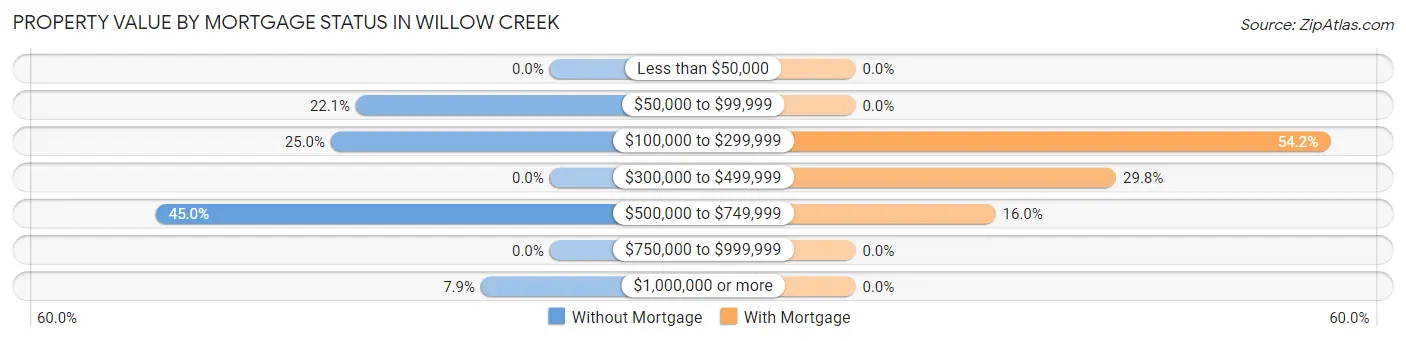
| Property Value | Without Mortgage | With Mortgage |
| Less than $50,000 | 0 (0.0%) | 0 (0.0%) |
| $50,000 to $99,999 | 31 (22.1%) | 0 (0.0%) |
| $100,000 to $299,999 | 35 (25.0%) | 122 (54.2%) |
| $300,000 to $499,999 | 0 (0.0%) | 67 (29.8%) |
| $500,000 to $749,999 | 63 (45.0%) | 36 (16.0%) |
| $750,000 to $999,999 | 0 (0.0%) | 0 (0.0%) |
| $1,000,000 or more | 11 (7.9%) | 0 (0.0%) |
| Total | 140 (100.0%) | 225 (100.0%) |
Household Income by Mortgage Status in Willow Creek
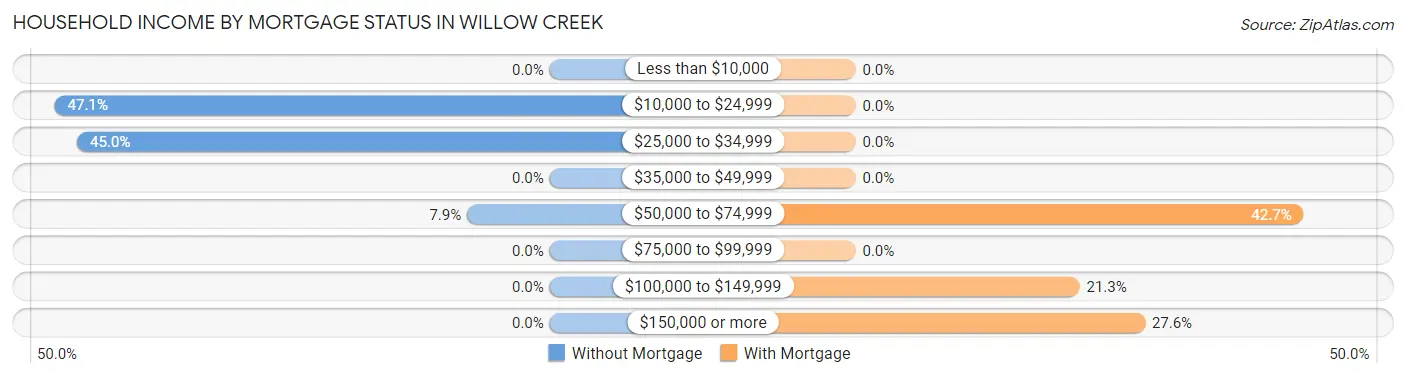
| Household Income | Without Mortgage | With Mortgage |
| Less than $10,000 | 0 (0.0%) | 0 (0.0%) |
| $10,000 to $24,999 | 66 (47.1%) | 0 (0.0%) |
| $25,000 to $34,999 | 63 (45.0%) | 0 (0.0%) |
| $35,000 to $49,999 | 0 (0.0%) | 0 (0.0%) |
| $50,000 to $74,999 | 11 (7.9%) | 96 (42.7%) |
| $75,000 to $99,999 | 0 (0.0%) | 0 (0.0%) |
| $100,000 to $149,999 | 0 (0.0%) | 48 (21.3%) |
| $150,000 or more | 0 (0.0%) | 62 (27.6%) |
| Total | 140 (100.0%) | 225 (100.0%) |
Property Value to Household Income Ratio in Willow Creek
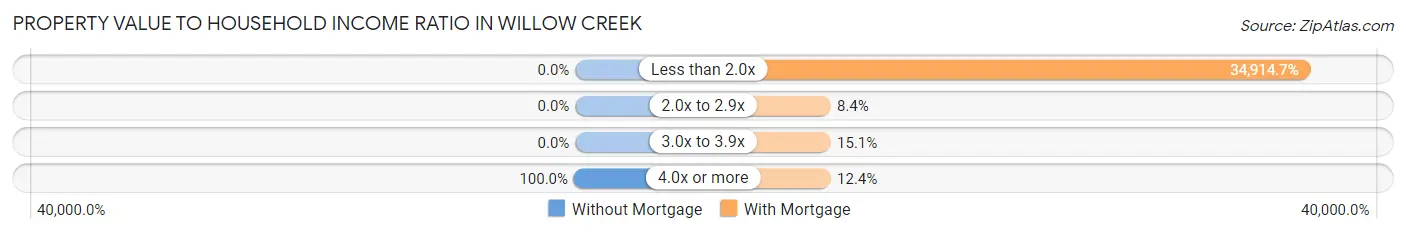
| Value-to-Income Ratio | Without Mortgage | With Mortgage |
| Less than 2.0x | 0 (0.0%) | 78,558 (34,914.7%) |
| 2.0x to 2.9x | 0 (0.0%) | 19 (8.4%) |
| 3.0x to 3.9x | 0 (0.0%) | 34 (15.1%) |
| 4.0x or more | 140 (100.0%) | 28 (12.4%) |
| Total | 140 (100.0%) | 225 (100.0%) |
Real Estate Taxes by Mortgage Status in Willow Creek
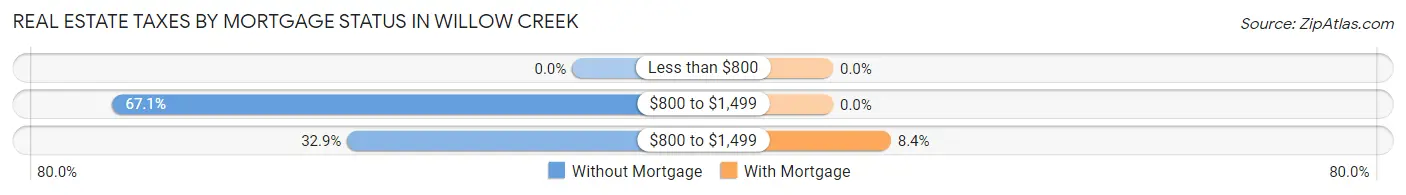
| Property Taxes | Without Mortgage | With Mortgage |
| Less than $800 | 0 (0.0%) | 0 (0.0%) |
| $800 to $1,499 | 94 (67.1%) | 0 (0.0%) |
| $800 to $1,499 | 46 (32.9%) | 19 (8.4%) |
| Total | 140 (100.0%) | 225 (100.0%) |
Health & Disability in Willow Creek
Health Insurance Coverage by Age in Willow Creek
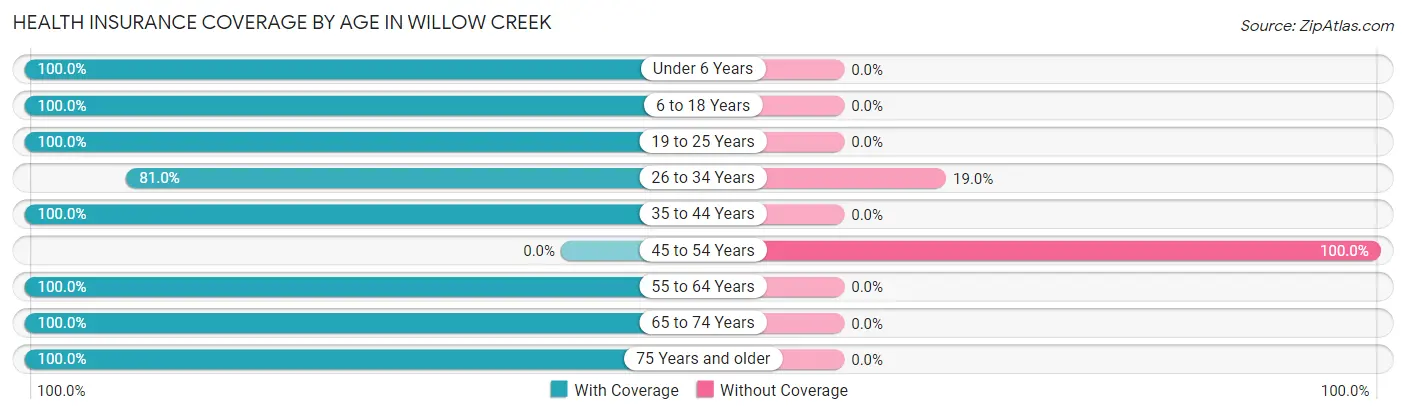
| Age Bracket | With Coverage | Without Coverage |
| Under 6 Years | 69 (100.0%) | 0 (0.0%) |
| 6 to 18 Years | 188 (100.0%) | 0 (0.0%) |
| 19 to 25 Years | 106 (100.0%) | 0 (0.0%) |
| 26 to 34 Years | 145 (81.0%) | 34 (19.0%) |
| 35 to 44 Years | 105 (100.0%) | 0 (0.0%) |
| 45 to 54 Years | 0 (0.0%) | 40 (100.0%) |
| 55 to 64 Years | 411 (100.0%) | 0 (0.0%) |
| 65 to 74 Years | 147 (100.0%) | 0 (0.0%) |
| 75 Years and older | 126 (100.0%) | 0 (0.0%) |
| Total | 1,297 (94.6%) | 74 (5.4%) |
Health Insurance Coverage by Citizenship Status in Willow Creek
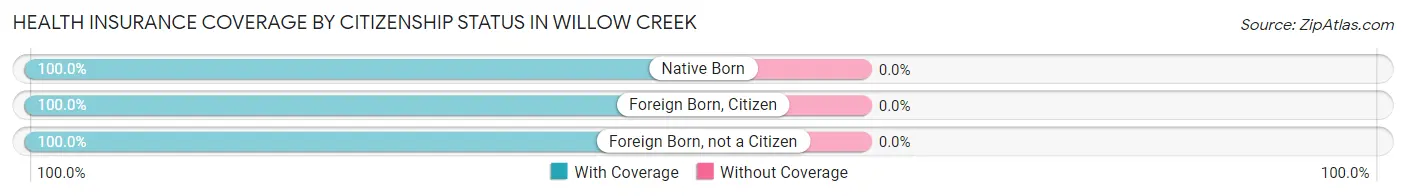
| Citizenship Status | With Coverage | Without Coverage |
| Native Born | 69 (100.0%) | 0 (0.0%) |
| Foreign Born, Citizen | 188 (100.0%) | 0 (0.0%) |
| Foreign Born, not a Citizen | 106 (100.0%) | 0 (0.0%) |
Health Insurance Coverage by Household Income in Willow Creek
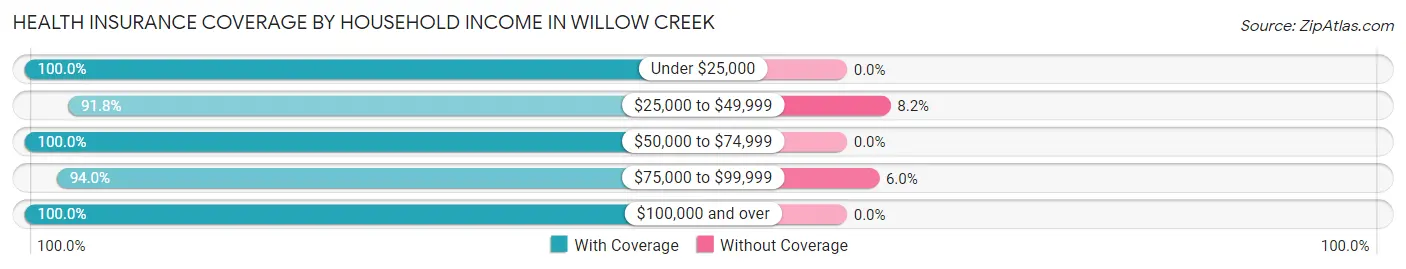
| Household Income | With Coverage | Without Coverage |
| Under $25,000 | 84 (100.0%) | 0 (0.0%) |
| $25,000 to $49,999 | 450 (91.8%) | 40 (8.2%) |
| $50,000 to $74,999 | 24 (100.0%) | 0 (0.0%) |
| $75,000 to $99,999 | 531 (94.0%) | 34 (6.0%) |
| $100,000 and over | 208 (100.0%) | 0 (0.0%) |
Public vs Private Health Insurance Coverage by Age in Willow Creek
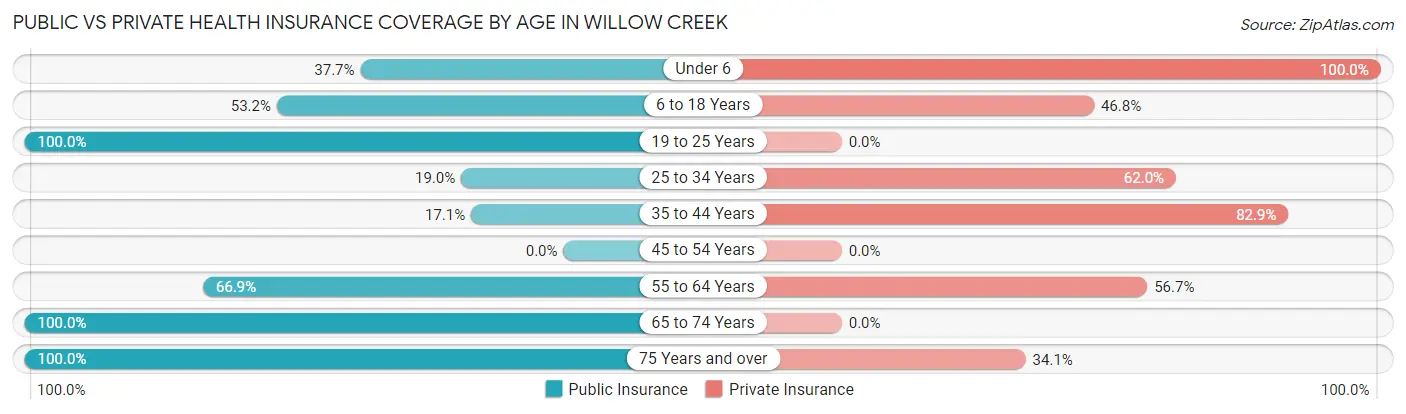
| Age Bracket | Public Insurance | Private Insurance |
| Under 6 | 26 (37.7%) | 69 (100.0%) |
| 6 to 18 Years | 100 (53.2%) | 88 (46.8%) |
| 19 to 25 Years | 106 (100.0%) | 0 (0.0%) |
| 25 to 34 Years | 34 (19.0%) | 111 (62.0%) |
| 35 to 44 Years | 18 (17.1%) | 87 (82.9%) |
| 45 to 54 Years | 0 (0.0%) | 0 (0.0%) |
| 55 to 64 Years | 275 (66.9%) | 233 (56.7%) |
| 65 to 74 Years | 147 (100.0%) | 0 (0.0%) |
| 75 Years and over | 126 (100.0%) | 43 (34.1%) |
| Total | 832 (60.7%) | 631 (46.0%) |
Disability Status by Sex by Age in Willow Creek
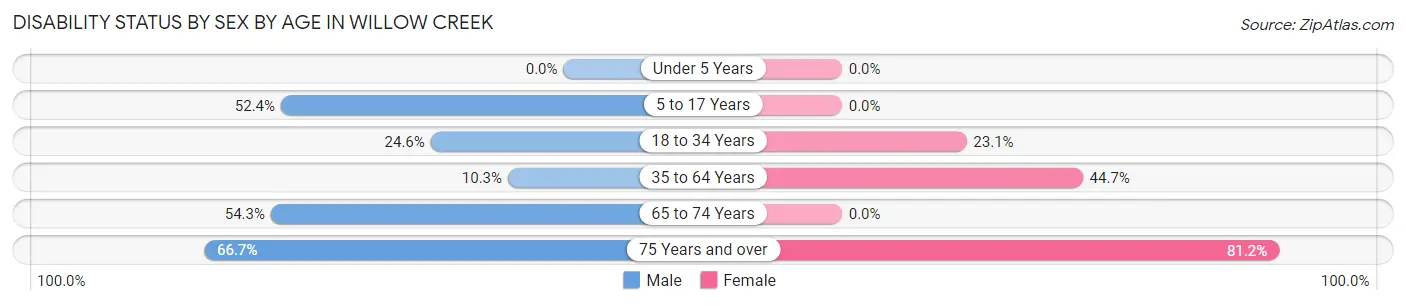
| Age Bracket | Male | Female |
| Under 5 Years | 0 (0.0%) | 0 (0.0%) |
| 5 to 17 Years | 97 (52.4%) | 0 (0.0%) |
| 18 to 34 Years | 34 (24.6%) | 34 (23.1%) |
| 35 to 64 Years | 31 (10.3%) | 114 (44.7%) |
| 65 to 74 Years | 63 (54.3%) | 0 (0.0%) |
| 75 Years and over | 38 (66.7%) | 56 (81.2%) |
Disability Class by Sex by Age in Willow Creek
Disability Class: Hearing Difficulty
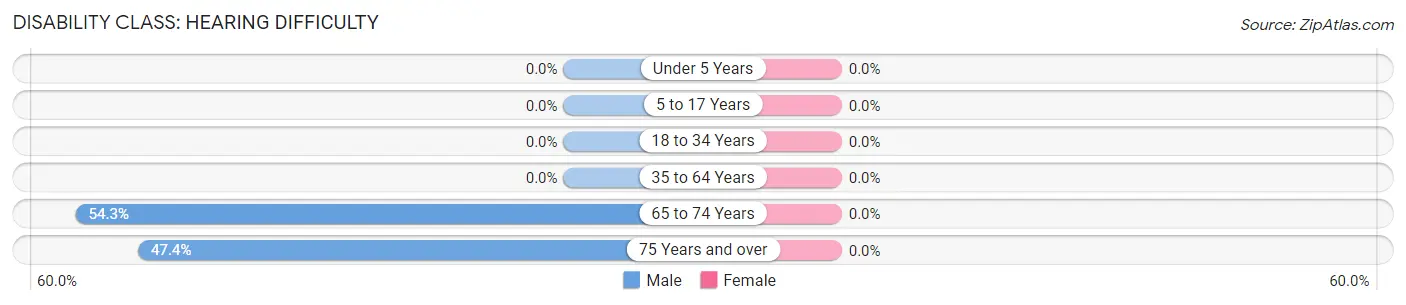
| Age Bracket | Male | Female |
| Under 5 Years | 0 (0.0%) | 0 (0.0%) |
| 5 to 17 Years | 0 (0.0%) | 0 (0.0%) |
| 18 to 34 Years | 0 (0.0%) | 0 (0.0%) |
| 35 to 64 Years | 0 (0.0%) | 0 (0.0%) |
| 65 to 74 Years | 63 (54.3%) | 0 (0.0%) |
| 75 Years and over | 27 (47.4%) | 0 (0.0%) |
Disability Class: Vision Difficulty
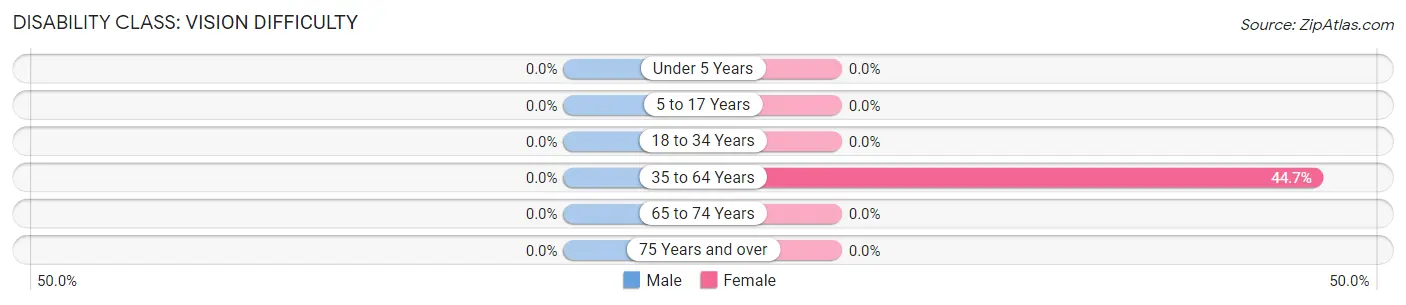
| Age Bracket | Male | Female |
| Under 5 Years | 0 (0.0%) | 0 (0.0%) |
| 5 to 17 Years | 0 (0.0%) | 0 (0.0%) |
| 18 to 34 Years | 0 (0.0%) | 0 (0.0%) |
| 35 to 64 Years | 0 (0.0%) | 114 (44.7%) |
| 65 to 74 Years | 0 (0.0%) | 0 (0.0%) |
| 75 Years and over | 0 (0.0%) | 0 (0.0%) |
Disability Class: Cognitive Difficulty
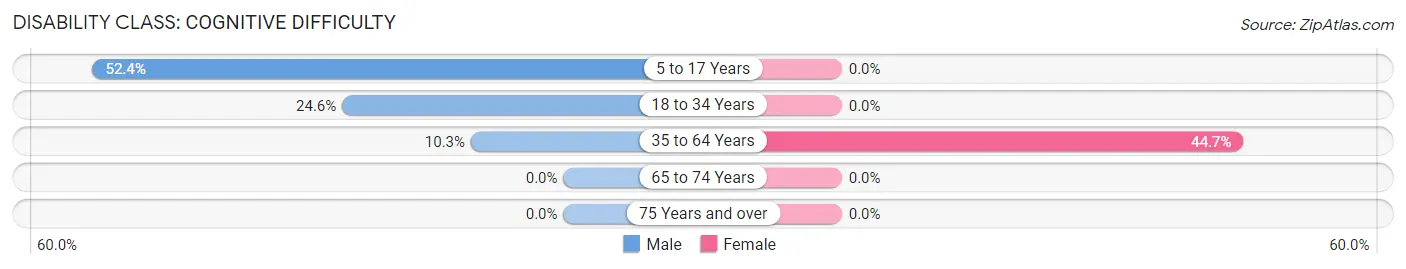
| Age Bracket | Male | Female |
| 5 to 17 Years | 97 (52.4%) | 0 (0.0%) |
| 18 to 34 Years | 34 (24.6%) | 0 (0.0%) |
| 35 to 64 Years | 31 (10.3%) | 114 (44.7%) |
| 65 to 74 Years | 0 (0.0%) | 0 (0.0%) |
| 75 Years and over | 0 (0.0%) | 0 (0.0%) |
Disability Class: Ambulatory Difficulty
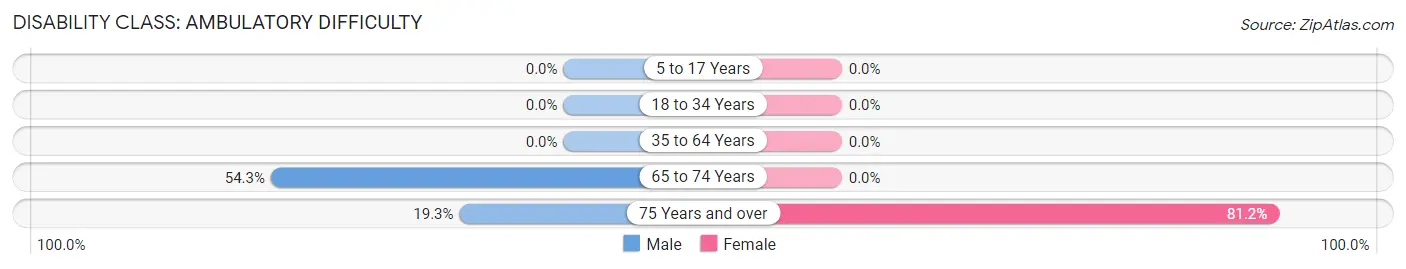
| Age Bracket | Male | Female |
| 5 to 17 Years | 0 (0.0%) | 0 (0.0%) |
| 18 to 34 Years | 0 (0.0%) | 0 (0.0%) |
| 35 to 64 Years | 0 (0.0%) | 0 (0.0%) |
| 65 to 74 Years | 63 (54.3%) | 0 (0.0%) |
| 75 Years and over | 11 (19.3%) | 56 (81.2%) |
Disability Class: Self-Care Difficulty
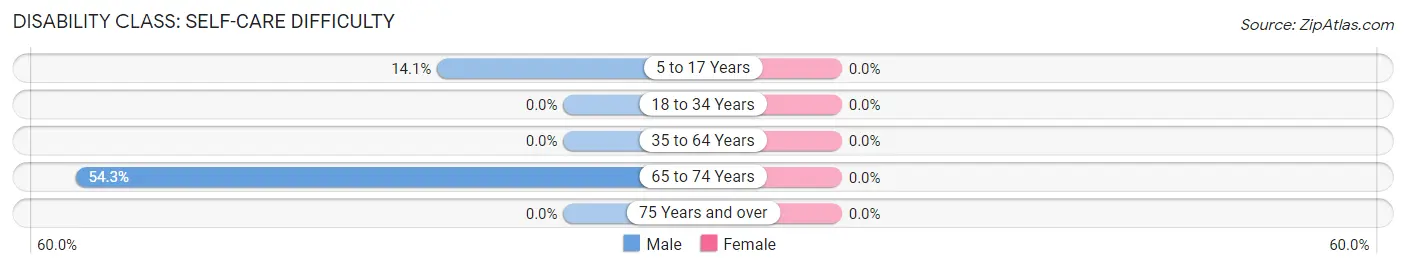
| Age Bracket | Male | Female |
| 5 to 17 Years | 26 (14.1%) | 0 (0.0%) |
| 18 to 34 Years | 0 (0.0%) | 0 (0.0%) |
| 35 to 64 Years | 0 (0.0%) | 0 (0.0%) |
| 65 to 74 Years | 63 (54.3%) | 0 (0.0%) |
| 75 Years and over | 0 (0.0%) | 0 (0.0%) |
Technology Access in Willow Creek
Computing Device Access in Willow Creek
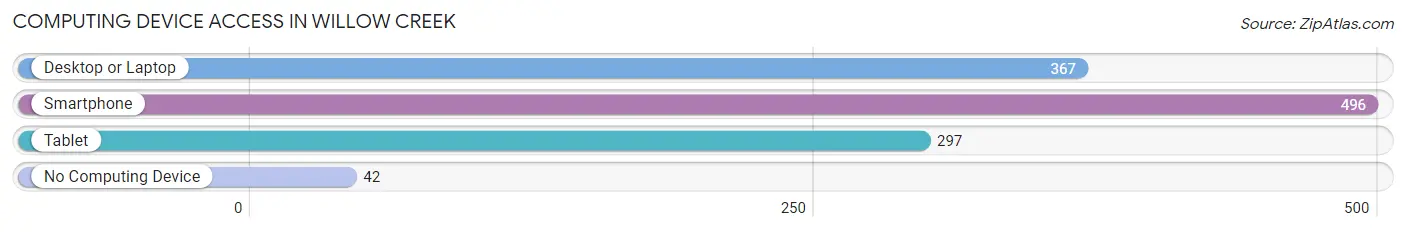
| Device Type | # Households | % Households |
| Desktop or Laptop | 367 | 64.0% |
| Smartphone | 496 | 86.6% |
| Tablet | 297 | 51.8% |
| No Computing Device | 42 | 7.3% |
| Total | 573 | 100.0% |
Internet Access in Willow Creek
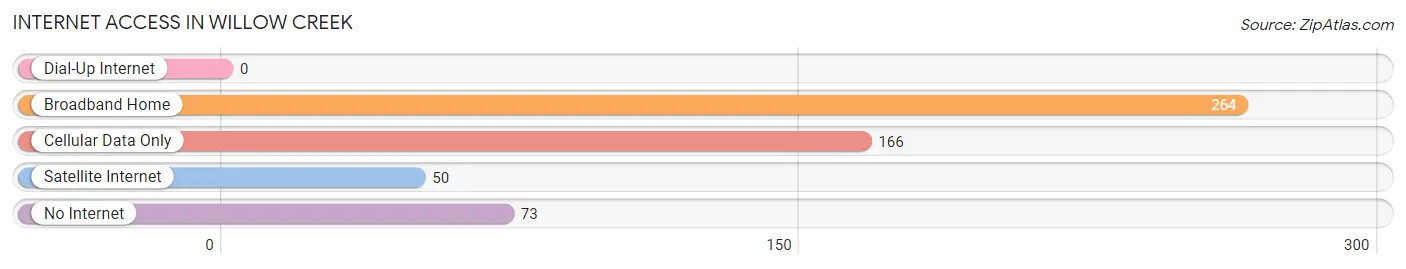
| Internet Type | # Households | % Households |
| Dial-Up Internet | 0 | 0.0% |
| Broadband Home | 264 | 46.1% |
| Cellular Data Only | 166 | 29.0% |
| Satellite Internet | 50 | 8.7% |
| No Internet | 73 | 12.7% |
| Total | 573 | 100.0% |
Willow Creek Summary
Willow Creek is a small unincorporated community located in Humboldt County, California. It is situated in the Trinity River Valley, approximately 20 miles east of the city of Eureka. The population of Willow Creek was estimated to be 1,711 in 2019.
History
Willow Creek was first settled in the late 1800s by miners and loggers who were attracted to the area by the abundance of natural resources. The town was officially established in 1876 and was named after the nearby Willow Creek. The town quickly grew and by the early 1900s, it had become a bustling center of commerce and industry.
The town was home to several sawmills, a brickyard, a tannery, and a number of other businesses. In the 1920s, the town was connected to the outside world by the construction of a railroad line. This allowed for the transport of goods and people to and from the town.
In the 1950s, the town began to decline as the timber industry moved away from the area. The population of Willow Creek decreased significantly and the town became a quiet, rural community.
Geography
Willow Creek is located in the Trinity River Valley, approximately 20 miles east of the city of Eureka. The town is situated at an elevation of 1,000 feet and is surrounded by the Trinity National Forest. The town is located in a temperate climate zone and experiences mild winters and warm summers.
The town is located near the Trinity River, which is a major tributary of the Klamath River. The river is a popular destination for fishing, boating, and other recreational activities.
Economy
The economy of Willow Creek is largely based on tourism and the timber industry. The town is home to several tourist attractions, including the Willow Creek Hatchery, the Trinity River Wildlife Refuge, and the Willow Creek Museum.
The timber industry is still an important part of the local economy. The town is home to several sawmills and logging companies. The timber industry provides jobs for many of the town’s residents.
Demographics
The population of Willow Creek was estimated to be 1,711 in 2019. The town is predominantly white, with approximately 85% of the population identifying as such. The remaining population is made up of Native Americans, African Americans, and other ethnicities.
The median household income in Willow Creek is $41,000, which is slightly lower than the national average. The town has a poverty rate of 17.3%, which is higher than the national average.
Willow Creek is a small, rural community with a rich history and a unique culture. The town is home to a diverse population and is a popular destination for tourists and outdoor enthusiasts. The town is a great place to live and work, and offers a variety of opportunities for those looking to make a life in the Trinity River Valley.
Common Questions
What is Per Capita Income in Willow Creek?
Per Capita income in Willow Creek is $26,850.
What is the Median Family Income in Willow Creek?
Median Family Income in Willow Creek is $78,109.
What is the Median Household income in Willow Creek?
Median Household Income in Willow Creek is $45,451.
What is Income or Wage Gap in Willow Creek?
Income or Wage Gap in Willow Creek is 57.2%.
Women in Willow Creek earn 42.8 cents for every dollar earned by a man.
What is Inequality or Gini Index in Willow Creek?
Inequality or Gini Index in Willow Creek is 0.35.
What is the Total Population of Willow Creek?
Total Population of Willow Creek is 1,371.
What is the Total Male Population of Willow Creek?
Total Male Population of Willow Creek is 797.
What is the Total Female Population of Willow Creek?
Total Female Population of Willow Creek is 574.
What is the Ratio of Males per 100 Females in Willow Creek?
There are 138.85 Males per 100 Females in Willow Creek.
What is the Ratio of Females per 100 Males in Willow Creek?
There are 72.02 Females per 100 Males in Willow Creek.
What is the Median Population Age in Willow Creek?
Median Population Age in Willow Creek is 54.0 Years.
What is the Average Family Size in Willow Creek
Average Family Size in Willow Creek is 3.3 People.
What is the Average Household Size in Willow Creek
Average Household Size in Willow Creek is 2.4 People.
How Large is the Labor Force in Willow Creek?
There are 564 People in the Labor Forcein in Willow Creek.
What is the Percentage of People in the Labor Force in Willow Creek?
47.6% of People are in the Labor Force in Willow Creek.
What is the Unemployment Rate in Willow Creek?
Unemployment Rate in Willow Creek is 5.5%.