Wilkerson, CA Map & Demographics
Wilkerson Map
Wilkerson Overview
$30,852
PER CAPITA INCOME
$102,955
AVG FAMILY INCOME
$103,409
AVG HOUSEHOLD INCOME
57.6%
WAGE / INCOME GAP [ % ]
42.4¢/ $1
WAGE / INCOME GAP [ $ ]
0.34
INEQUALITY / GINI INDEX
590
TOTAL POPULATION
284
MALE POPULATION
306
FEMALE POPULATION
92.81
MALES / 100 FEMALES
107.75
FEMALES / 100 MALES
41.7
MEDIAN AGE
4.1
AVG FAMILY SIZE
3.5
AVG HOUSEHOLD SIZE
255
LABOR FORCE [ PEOPLE ]
54.1%
PERCENT IN LABOR FORCE
4.3%
UNEMPLOYMENT RATE
Income in Wilkerson
Income Overview in Wilkerson
Per Capita Income in Wilkerson is $30,852, while median incomes of families and households are $102,955 and $103,409 respectively.
| Characteristic | Number | Measure |
| Per Capita Income | 590 | $30,852 |
| Median Family Income | 112 | $102,955 |
| Mean Family Income | 112 | $100,820 |
| Median Household Income | 166 | $103,409 |
| Mean Household Income | 166 | $103,114 |
| Income Deficit | 112 | $0 |
| Wage / Income Gap (%) | 590 | 57.59% |
| Wage / Income Gap ($) | 590 | 42.41¢ per $1 |
| Gini / Inequality Index | 590 | 0.34 |
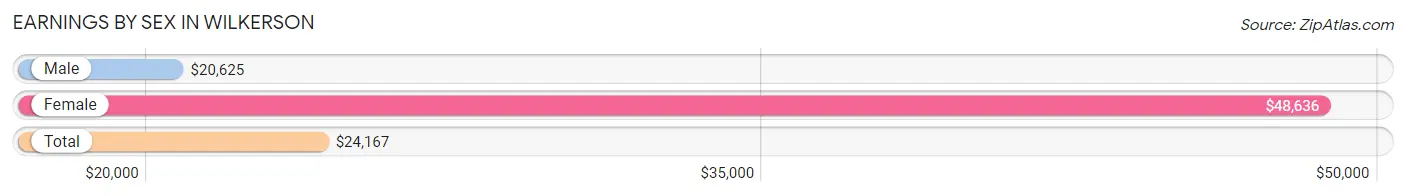
Earnings by Sex in Wilkerson
Average Earnings in Wilkerson are $24,167, $20,625 for men and $48,636 for women, a difference of 57.6%.
| Sex | Number | Average Earnings |
| Male | 162 (54.7%) | $20,625 |
| Female | 134 (45.3%) | $48,636 |
| Total | 296 (100.0%) | $24,167 |
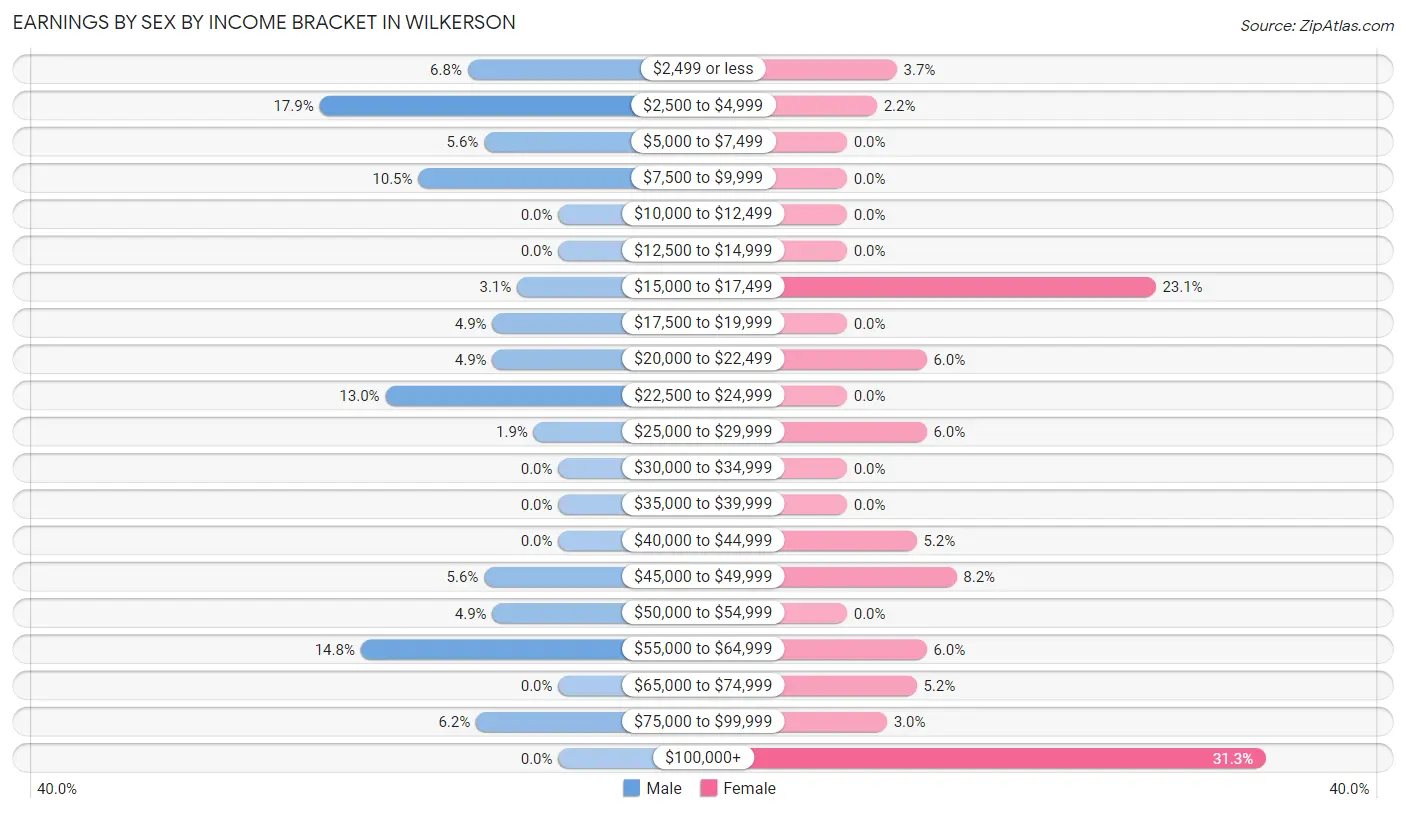
Earnings by Sex by Income Bracket in Wilkerson
The most common earnings brackets in Wilkerson are $2,500 to $4,999 for men (29 | 17.9%) and $100,000+ for women (42 | 31.3%).
| Income | Male | Female |
| $2,499 or less | 11 (6.8%) | 5 (3.7%) |
| $2,500 to $4,999 | 29 (17.9%) | 3 (2.2%) |
| $5,000 to $7,499 | 9 (5.6%) | 0 (0.0%) |
| $7,500 to $9,999 | 17 (10.5%) | 0 (0.0%) |
| $10,000 to $12,499 | 0 (0.0%) | 0 (0.0%) |
| $12,500 to $14,999 | 0 (0.0%) | 0 (0.0%) |
| $15,000 to $17,499 | 5 (3.1%) | 31 (23.1%) |
| $17,500 to $19,999 | 8 (4.9%) | 0 (0.0%) |
| $20,000 to $22,499 | 8 (4.9%) | 8 (6.0%) |
| $22,500 to $24,999 | 21 (13.0%) | 0 (0.0%) |
| $25,000 to $29,999 | 3 (1.8%) | 8 (6.0%) |
| $30,000 to $34,999 | 0 (0.0%) | 0 (0.0%) |
| $35,000 to $39,999 | 0 (0.0%) | 0 (0.0%) |
| $40,000 to $44,999 | 0 (0.0%) | 7 (5.2%) |
| $45,000 to $49,999 | 9 (5.6%) | 11 (8.2%) |
| $50,000 to $54,999 | 8 (4.9%) | 0 (0.0%) |
| $55,000 to $64,999 | 24 (14.8%) | 8 (6.0%) |
| $65,000 to $74,999 | 0 (0.0%) | 7 (5.2%) |
| $75,000 to $99,999 | 10 (6.2%) | 4 (3.0%) |
| $100,000+ | 0 (0.0%) | 42 (31.3%) |
| Total | 162 (100.0%) | 134 (100.0%) |
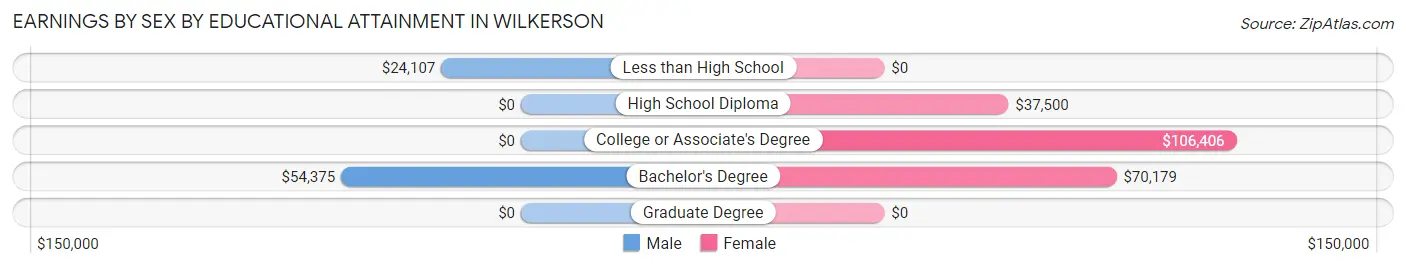
Earnings by Sex by Educational Attainment in Wilkerson
Average earnings in Wilkerson are $24,107 for men and $48,750 for women, a difference of 50.5%. Men with an educational attainment of bachelor's degree enjoy the highest average annual earnings of $54,375, while those with less than high school education earn the least with $24,107. Women with an educational attainment of college or associate's degree earn the most with the average annual earnings of $106,406, while those with high school diploma education have the smallest earnings of $37,500.
| Educational Attainment | Male Income | Female Income |
| Less than High School | $24,107 | $0 |
| High School Diploma | - | - |
| College or Associate's Degree | - | - |
| Bachelor's Degree | $54,375 | $70,179 |
| Graduate Degree | - | - |
| Total | $24,107 | $48,750 |
Family Income in Wilkerson
Family Income Brackets in Wilkerson
According to the Wilkerson family income data, there are 30 families falling into the $35,000 to $49,999 income range, which is the most common income bracket and makes up 26.8% of all families.
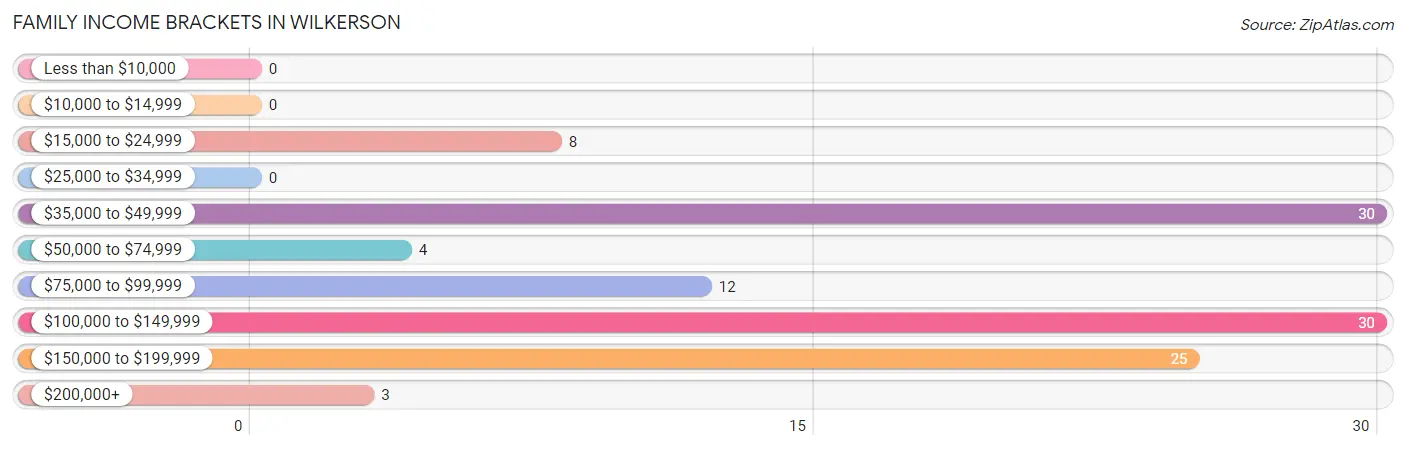
| Income Bracket | # Families | % Families |
| Less than $10,000 | 0 | 0.0% |
| $10,000 to $14,999 | 0 | 0.0% |
| $15,000 to $24,999 | 8 | 7.1% |
| $25,000 to $34,999 | 0 | 0.0% |
| $35,000 to $49,999 | 30 | 26.8% |
| $50,000 to $74,999 | 4 | 3.6% |
| $75,000 to $99,999 | 12 | 10.7% |
| $100,000 to $149,999 | 30 | 26.8% |
| $150,000 to $199,999 | 25 | 22.3% |
| $200,000+ | 3 | 2.7% |
Family Income by Famaliy Size in Wilkerson
2-person families (60 | 53.6%) account for the highest median family income in Wilkerson with $103,864 per family, while 2-person families (60 | 53.6%) have the highest median income of $51,932 per family member.
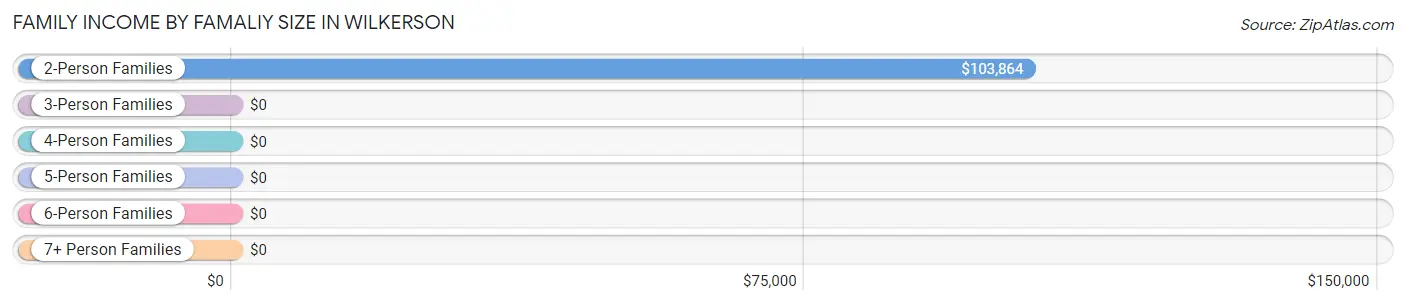
| Income Bracket | # Families | Median Income |
| 2-Person Families | 60 (53.6%) | $103,864 |
| 3-Person Families | 15 (13.4%) | $0 |
| 4-Person Families | 11 (9.8%) | $0 |
| 5-Person Families | 25 (22.3%) | $0 |
| 6-Person Families | 0 (0.0%) | $0 |
| 7+ Person Families | 1 (0.9%) | $0 |
| Total | 112 (100.0%) | $102,955 |
Family Income by Number of Earners in Wilkerson
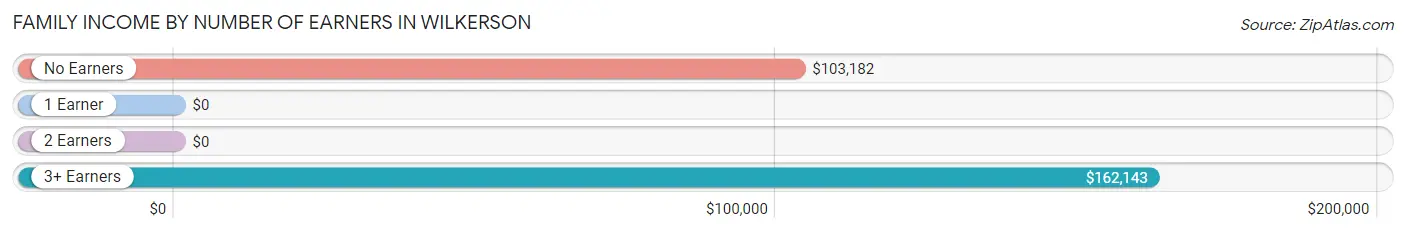
| Number of Earners | # Families | Median Income |
| No Earners | 22 (19.6%) | $103,182 |
| 1 Earner | 26 (23.2%) | $0 |
| 2 Earners | 46 (41.1%) | $0 |
| 3+ Earners | 18 (16.1%) | $162,143 |
| Total | 112 (100.0%) | $102,955 |
Household Income in Wilkerson
Household Income Brackets in Wilkerson
With 47 households falling in the category, the $100,000 to $149,999 income range is the most frequent in Wilkerson, accounting for 28.3% of all households.
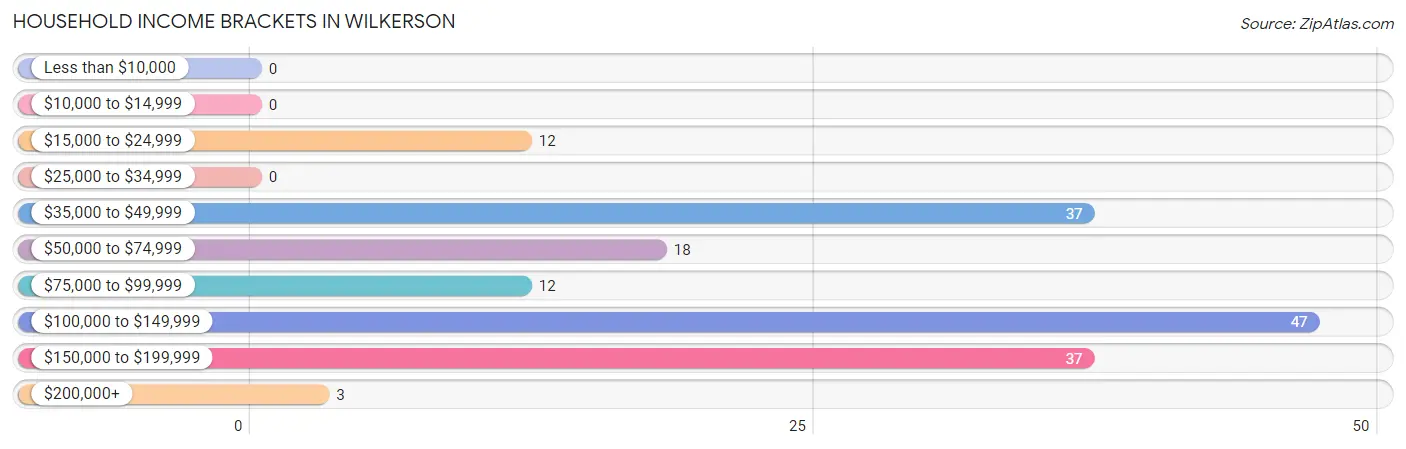
| Income Bracket | # Households | % Households |
| Less than $10,000 | 0 | 0.0% |
| $10,000 to $14,999 | 0 | 0.0% |
| $15,000 to $24,999 | 12 | 7.2% |
| $25,000 to $34,999 | 0 | 0.0% |
| $35,000 to $49,999 | 37 | 22.3% |
| $50,000 to $74,999 | 18 | 10.8% |
| $75,000 to $99,999 | 12 | 7.2% |
| $100,000 to $149,999 | 47 | 28.3% |
| $150,000 to $199,999 | 37 | 22.3% |
| $200,000+ | 3 | 1.8% |
Household Income by Householder Age in Wilkerson
The median household income in Wilkerson is $103,409, with the highest median household income of $141,250 found in the 25 to 44 years age bracket for the primary householder. A total of 38 households (22.9%) fall into this category.
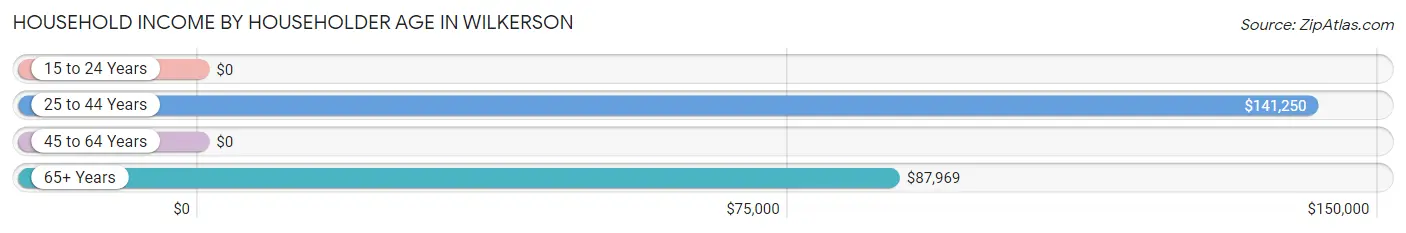
| Income Bracket | # Households | Median Income |
| 15 to 24 Years | 0 (0.0%) | $0 |
| 25 to 44 Years | 38 (22.9%) | $141,250 |
| 45 to 64 Years | 55 (33.1%) | $0 |
| 65+ Years | 73 (44.0%) | $87,969 |
| Total | 166 (100.0%) | $103,409 |
Poverty in Wilkerson
Income Below Poverty by Sex and Age in Wilkerson
With 12.3% poverty level for males and 1.0% for females among the residents of Wilkerson, under 5 year old males and 18 to 24 year old females are the most vulnerable to poverty, with 3 males (100.0%) and 1 females (100.0%) in their respective age groups living below the poverty level.
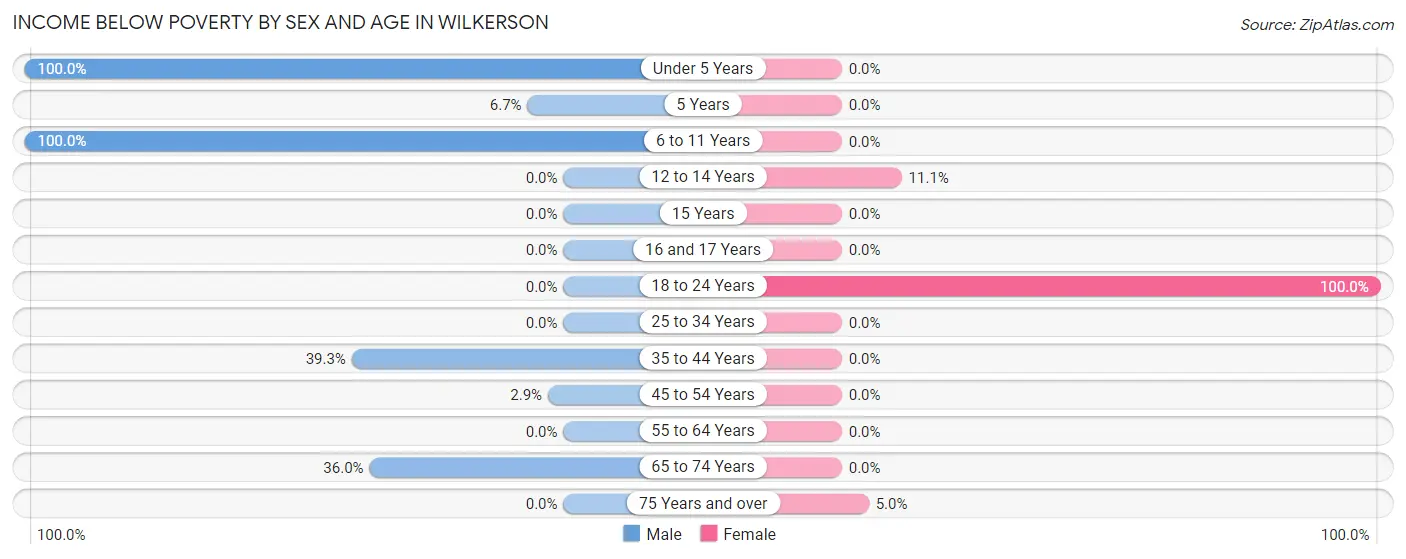
| Age Bracket | Male | Female |
| Under 5 Years | 3 (100.0%) | 0 (0.0%) |
| 5 Years | 1 (6.7%) | 0 (0.0%) |
| 6 to 11 Years | 1 (100.0%) | 0 (0.0%) |
| 12 to 14 Years | 0 (0.0%) | 1 (11.1%) |
| 15 Years | 0 (0.0%) | 0 (0.0%) |
| 16 and 17 Years | 0 (0.0%) | 0 (0.0%) |
| 18 to 24 Years | 0 (0.0%) | 1 (100.0%) |
| 25 to 34 Years | 0 (0.0%) | 0 (0.0%) |
| 35 to 44 Years | 11 (39.3%) | 0 (0.0%) |
| 45 to 54 Years | 1 (2.9%) | 0 (0.0%) |
| 55 to 64 Years | 0 (0.0%) | 0 (0.0%) |
| 65 to 74 Years | 18 (36.0%) | 0 (0.0%) |
| 75 Years and over | 0 (0.0%) | 1 (5.0%) |
| Total | 35 (12.3%) | 3 (1.0%) |
Income Above Poverty by Sex and Age in Wilkerson
According to the poverty statistics in Wilkerson, males aged 15 years and females aged under 5 years are the age groups that are most secure financially, with 100.0% of males and 100.0% of females in these age groups living above the poverty line.
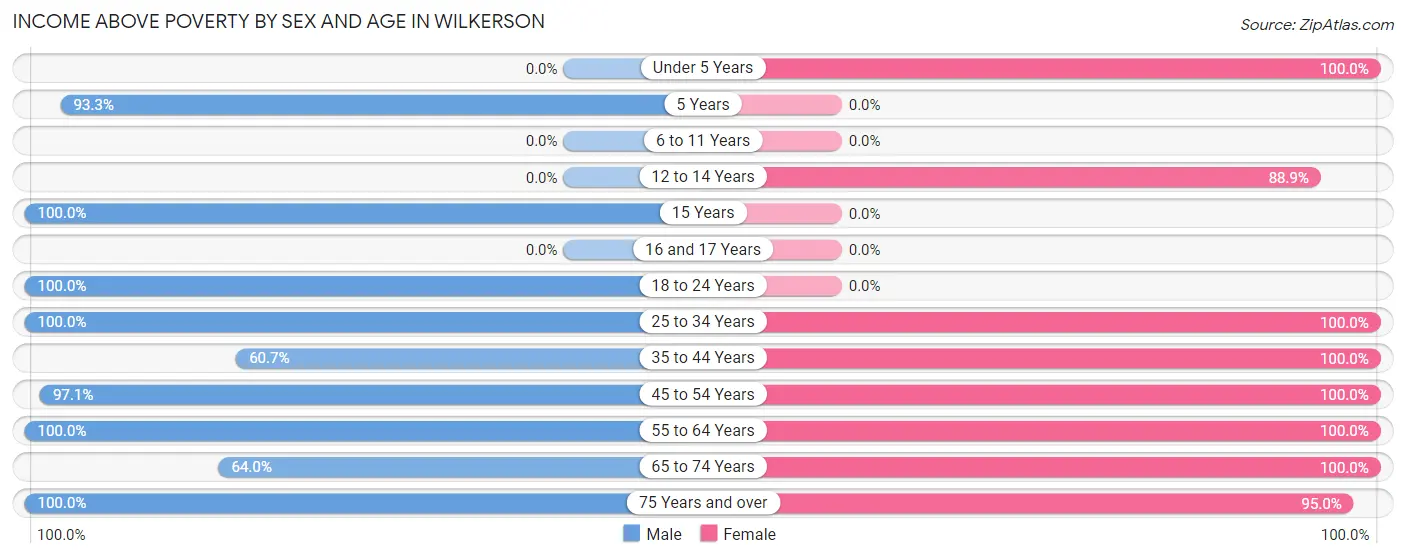
| Age Bracket | Male | Female |
| Under 5 Years | 0 (0.0%) | 84 (100.0%) |
| 5 Years | 14 (93.3%) | 0 (0.0%) |
| 6 to 11 Years | 0 (0.0%) | 0 (0.0%) |
| 12 to 14 Years | 0 (0.0%) | 8 (88.9%) |
| 15 Years | 7 (100.0%) | 0 (0.0%) |
| 16 and 17 Years | 0 (0.0%) | 0 (0.0%) |
| 18 to 24 Years | 89 (100.0%) | 0 (0.0%) |
| 25 to 34 Years | 20 (100.0%) | 30 (100.0%) |
| 35 to 44 Years | 17 (60.7%) | 41 (100.0%) |
| 45 to 54 Years | 34 (97.1%) | 35 (100.0%) |
| 55 to 64 Years | 24 (100.0%) | 25 (100.0%) |
| 65 to 74 Years | 32 (64.0%) | 61 (100.0%) |
| 75 Years and over | 12 (100.0%) | 19 (95.0%) |
| Total | 249 (87.7%) | 303 (99.0%) |
Income Below Poverty Among Married-Couple Families in Wilkerson
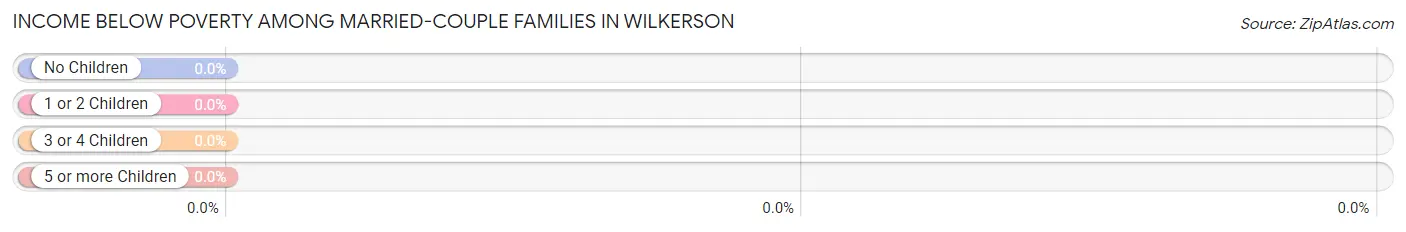
| Children | Above Poverty | Below Poverty |
| No Children | 70 (100.0%) | 0 (0.0%) |
| 1 or 2 Children | 8 (100.0%) | 0 (0.0%) |
| 3 or 4 Children | 4 (100.0%) | 0 (0.0%) |
| 5 or more Children | 0 (0.0%) | 0 (0.0%) |
| Total | 82 (100.0%) | 0 (0.0%) |
Income Below Poverty Among Single-Parent Households in Wilkerson
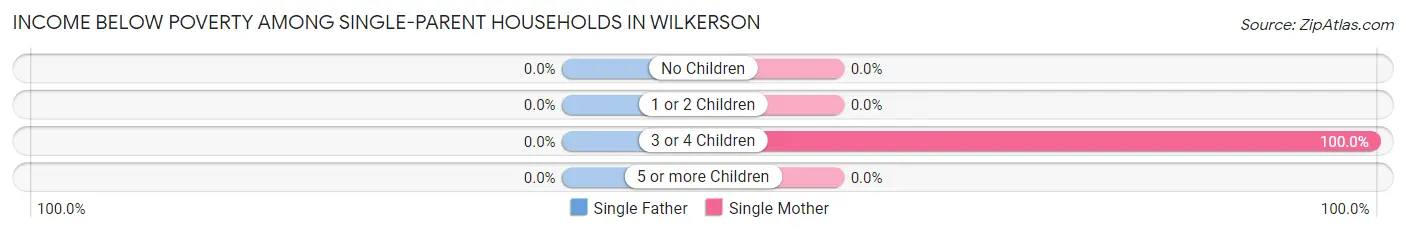
| Children | Single Father | Single Mother |
| No Children | 0 (0.0%) | 0 (0.0%) |
| 1 or 2 Children | 0 (0.0%) | 0 (0.0%) |
| 3 or 4 Children | 0 (0.0%) | 1 (100.0%) |
| 5 or more Children | 0 (0.0%) | 0 (0.0%) |
| Total | 0 (0.0%) | 1 (11.1%) |
Income Below Poverty Among Married-Couple vs Single-Parent Households in Wilkerson
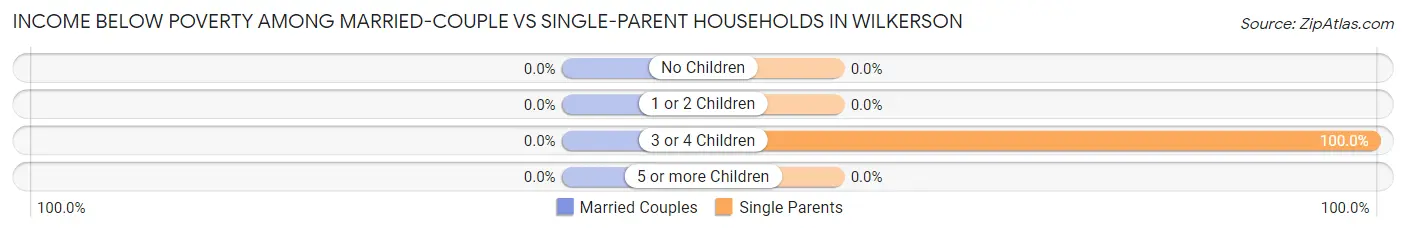
| Children | Married-Couple Families | Single-Parent Households |
| No Children | 0 (0.0%) | 0 (0.0%) |
| 1 or 2 Children | 0 (0.0%) | 0 (0.0%) |
| 3 or 4 Children | 0 (0.0%) | 1 (100.0%) |
| 5 or more Children | 0 (0.0%) | 0 (0.0%) |
| Total | 0 (0.0%) | 1 (3.3%) |
Race in Wilkerson
The most populous races in Wilkerson are White / Caucasian (384 | 65.1%), Hispanic or Latino (216 | 36.6%), and Two or more Races (185 | 31.4%).
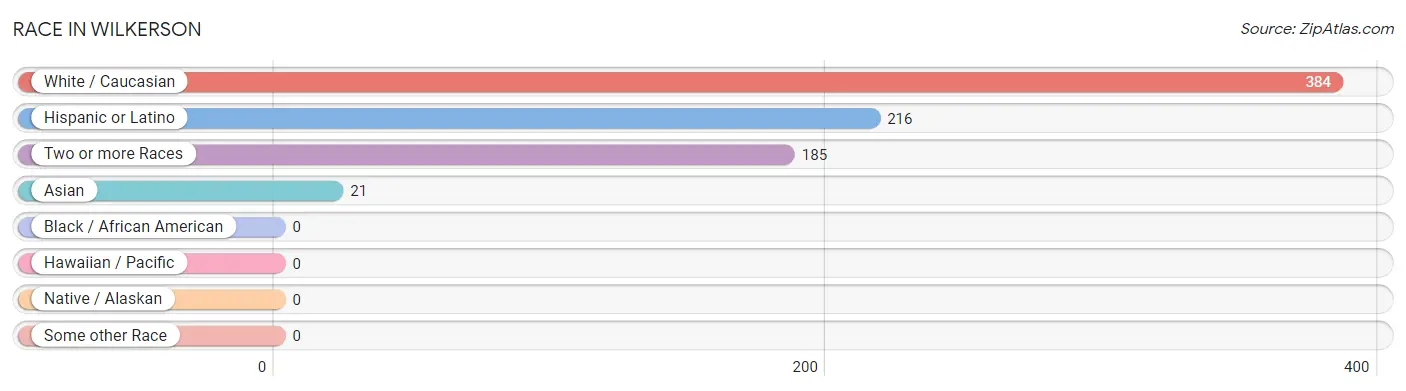
| Race | # Population | % Population |
| Asian | 21 | 3.6% |
| Black / African American | 0 | 0.0% |
| Hawaiian / Pacific | 0 | 0.0% |
| Hispanic or Latino | 216 | 36.6% |
| Native / Alaskan | 0 | 0.0% |
| White / Caucasian | 384 | 65.1% |
| Two or more Races | 185 | 31.4% |
| Some other Race | 0 | 0.0% |
| Total | 590 | 100.0% |
Ancestry in Wilkerson
The most populous ancestries reported in Wilkerson are Mexican (216 | 36.6%), English (57 | 9.7%), German (30 | 5.1%), American (28 | 4.8%), and Scottish (25 | 4.2%), together accounting for 60.3% of all Wilkerson residents.
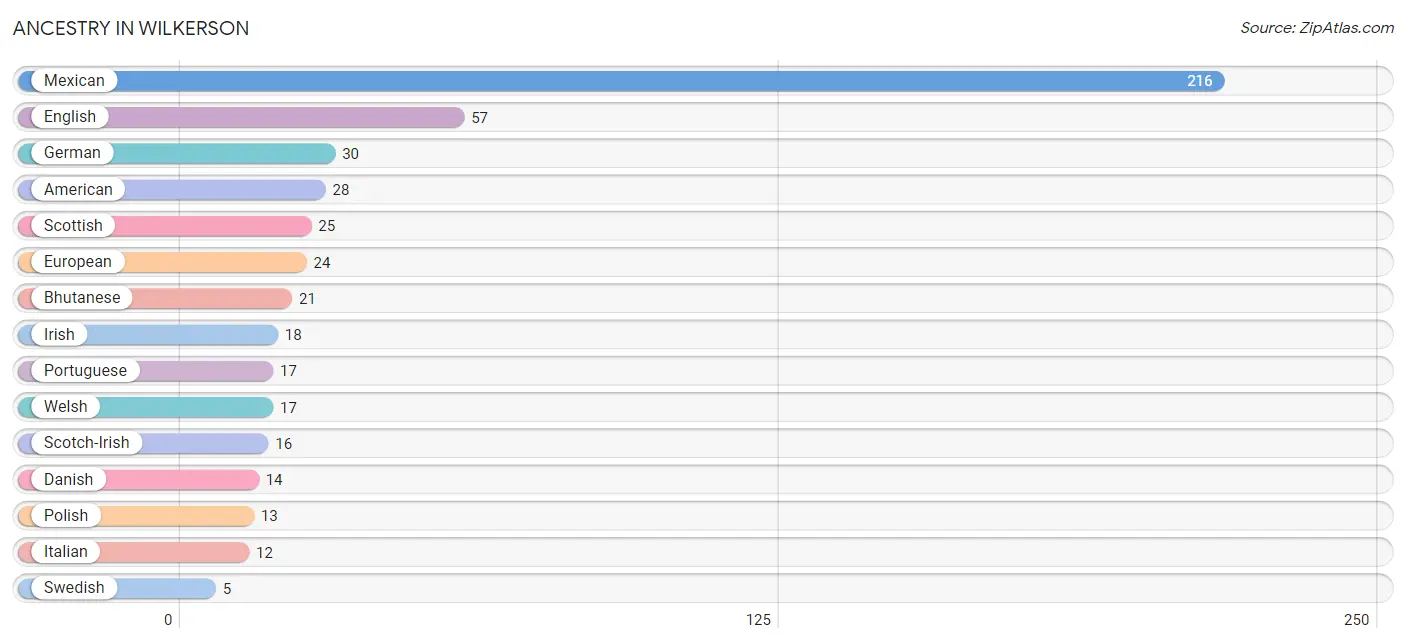
| Ancestry | # Population | % Population |
| American | 28 | 4.8% |
| Bhutanese | 21 | 3.6% |
| Croatian | 4 | 0.7% |
| Danish | 14 | 2.4% |
| English | 57 | 9.7% |
| European | 24 | 4.1% |
| German | 30 | 5.1% |
| Irish | 18 | 3.0% |
| Italian | 12 | 2.0% |
| Mexican | 216 | 36.6% |
| Polish | 13 | 2.2% |
| Portuguese | 17 | 2.9% |
| Scotch-Irish | 16 | 2.7% |
| Scottish | 25 | 4.2% |
| Swedish | 5 | 0.9% |
| Welsh | 17 | 2.9% | View All 16 Rows |
Immigrants in Wilkerson
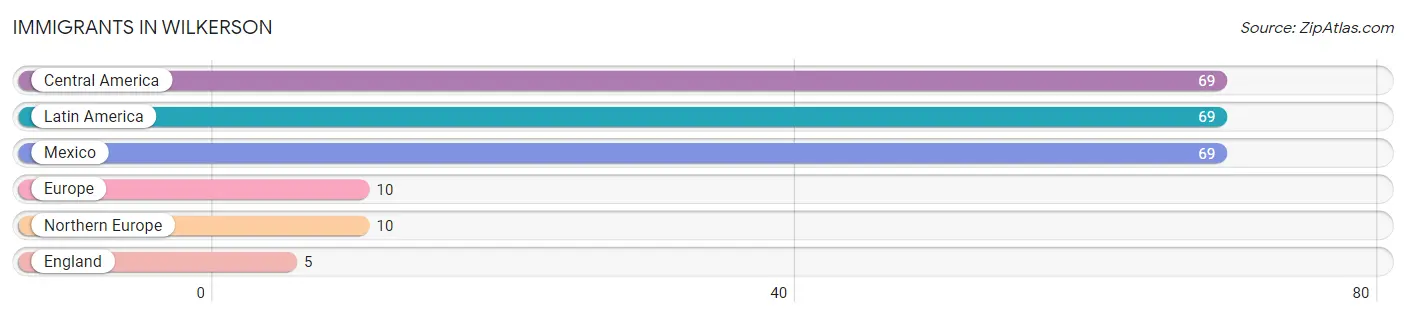
The most numerous immigrant groups reported in Wilkerson came from Central America (69 | 11.7%), Latin America (69 | 11.7%), Mexico (69 | 11.7%), Europe (10 | 1.7%), and Northern Europe (10 | 1.7%), together accounting for 38.5% of all Wilkerson residents.
| Immigration Origin | # Population | % Population |
| Central America | 69 | 11.7% |
| England | 5 | 0.9% |
| Europe | 10 | 1.7% |
| Latin America | 69 | 11.7% |
| Mexico | 69 | 11.7% |
| Northern Europe | 10 | 1.7% | View All 6 Rows |
Sex and Age in Wilkerson
Sex and Age in Wilkerson
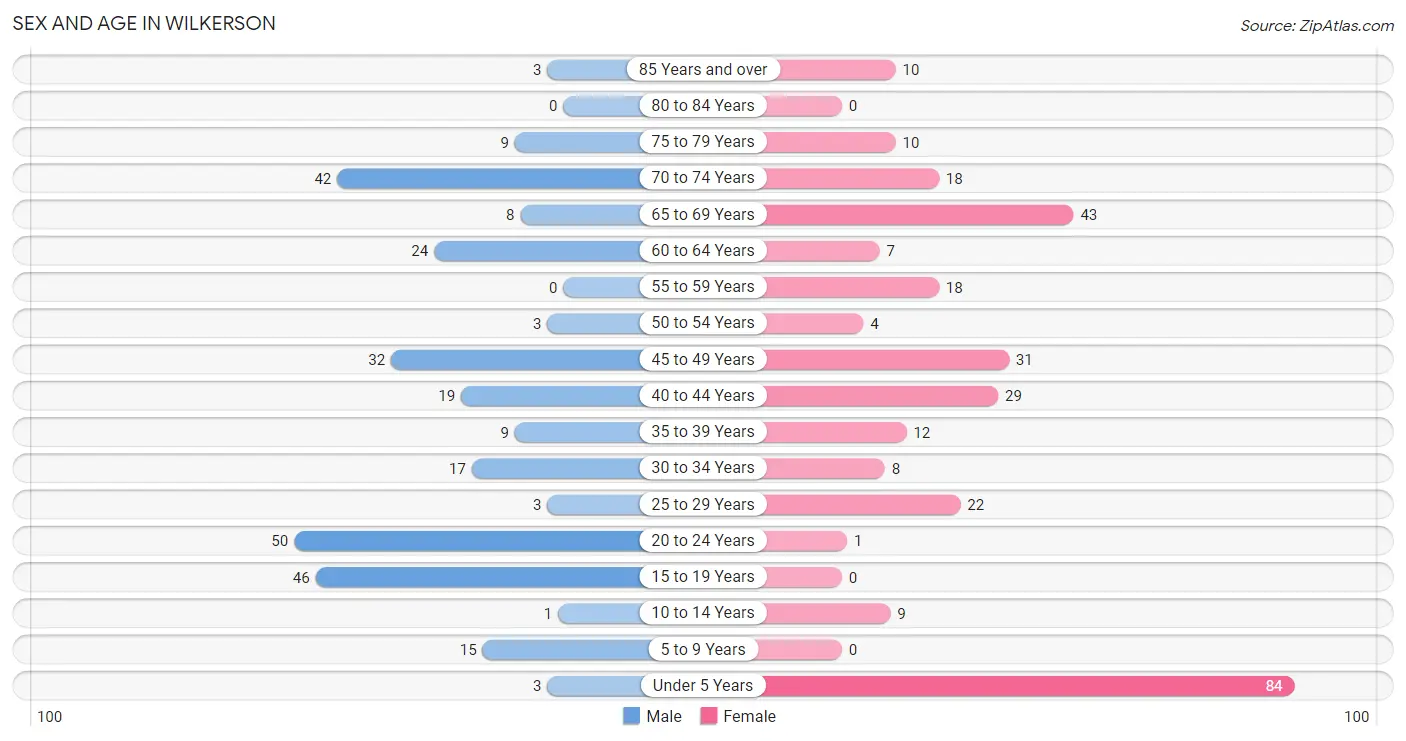
The most populous age groups in Wilkerson are 20 to 24 Years (50 | 17.6%) for men and Under 5 Years (84 | 27.5%) for women.
| Age Bracket | Male | Female |
| Under 5 Years | 3 (1.1%) | 84 (27.5%) |
| 5 to 9 Years | 15 (5.3%) | 0 (0.0%) |
| 10 to 14 Years | 1 (0.4%) | 9 (2.9%) |
| 15 to 19 Years | 46 (16.2%) | 0 (0.0%) |
| 20 to 24 Years | 50 (17.6%) | 1 (0.3%) |
| 25 to 29 Years | 3 (1.1%) | 22 (7.2%) |
| 30 to 34 Years | 17 (6.0%) | 8 (2.6%) |
| 35 to 39 Years | 9 (3.2%) | 12 (3.9%) |
| 40 to 44 Years | 19 (6.7%) | 29 (9.5%) |
| 45 to 49 Years | 32 (11.3%) | 31 (10.1%) |
| 50 to 54 Years | 3 (1.1%) | 4 (1.3%) |
| 55 to 59 Years | 0 (0.0%) | 18 (5.9%) |
| 60 to 64 Years | 24 (8.5%) | 7 (2.3%) |
| 65 to 69 Years | 8 (2.8%) | 43 (14.1%) |
| 70 to 74 Years | 42 (14.8%) | 18 (5.9%) |
| 75 to 79 Years | 9 (3.2%) | 10 (3.3%) |
| 80 to 84 Years | 0 (0.0%) | 0 (0.0%) |
| 85 Years and over | 3 (1.1%) | 10 (3.3%) |
| Total | 284 (100.0%) | 306 (100.0%) |
Families and Households in Wilkerson
Median Family Size in Wilkerson
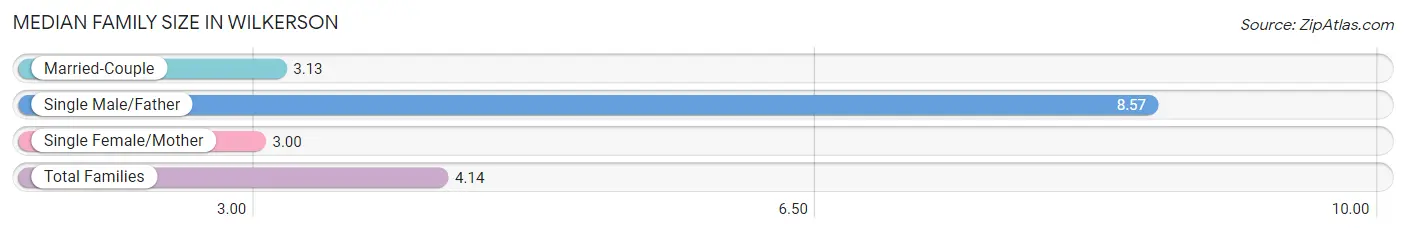
The median family size in Wilkerson is 4.14 persons per family, with single male/father families (21 | 18.8%) accounting for the largest median family size of 8.57 persons per family. On the other hand, single female/mother families (9 | 8.0%) represent the smallest median family size with 3.00 persons per family.
| Family Type | # Families | Family Size |
| Married-Couple | 82 (73.2%) | 3.13 |
| Single Male/Father | 21 (18.8%) | 8.57 |
| Single Female/Mother | 9 (8.0%) | 3.00 |
| Total Families | 112 (100.0%) | 4.14 |
Median Household Size in Wilkerson
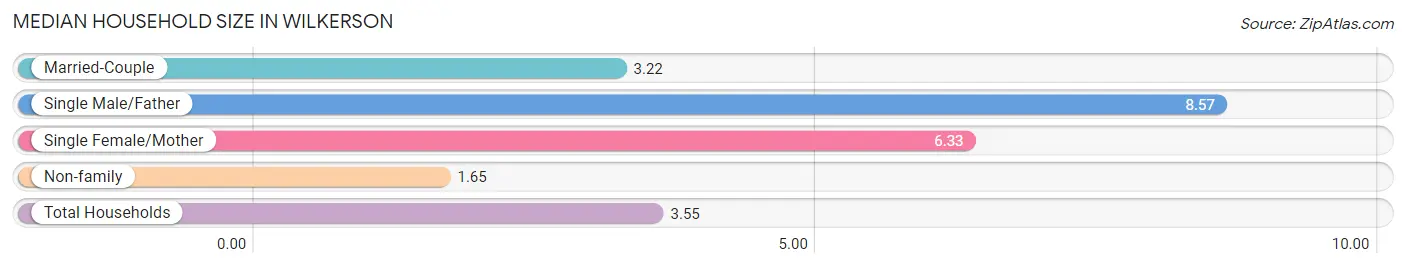
The median household size in Wilkerson is 3.55 persons per household, with single male/father households (21 | 12.7%) accounting for the largest median household size of 8.57 persons per household. non-family households (54 | 32.5%) represent the smallest median household size with 1.65 persons per household.
| Household Type | # Households | Household Size |
| Married-Couple | 82 (49.4%) | 3.22 |
| Single Male/Father | 21 (12.7%) | 8.57 |
| Single Female/Mother | 9 (5.4%) | 6.33 |
| Non-family | 54 (32.5%) | 1.65 |
| Total Households | 166 (100.0%) | 3.55 |
Household Size by Marriage Status in Wilkerson
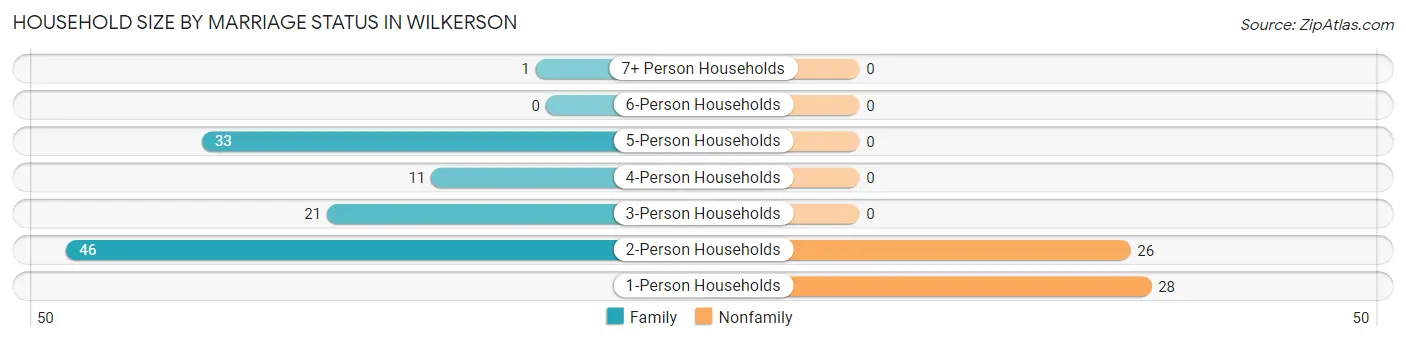
Out of a total of 166 households in Wilkerson, 112 (67.5%) are family households, while 54 (32.5%) are nonfamily households. The most numerous type of family households are 2-person households, comprising 46, and the most common type of nonfamily households are 1-person households, comprising 28.
| Household Size | Family Households | Nonfamily Households |
| 1-Person Households | - | 28 (16.9%) |
| 2-Person Households | 46 (27.7%) | 26 (15.7%) |
| 3-Person Households | 21 (12.7%) | 0 (0.0%) |
| 4-Person Households | 11 (6.6%) | 0 (0.0%) |
| 5-Person Households | 33 (19.9%) | 0 (0.0%) |
| 6-Person Households | 0 (0.0%) | 0 (0.0%) |
| 7+ Person Households | 1 (0.6%) | 0 (0.0%) |
| Total | 112 (67.5%) | 54 (32.5%) |
Female Fertility in Wilkerson
Fertility by Age in Wilkerson
| Age Bracket | Women with Births | Births / 1,000 Women |
| 15 to 19 years | 0 (0.0%) | 0.0 |
| 20 to 34 years | 0 (0.0%) | 0.0 |
| 35 to 50 years | 0 (0.0%) | 0.0 |
| Total | 0 (0.0%) | 0.0 |
Fertility by Age by Marriage Status in Wilkerson
| Age Bracket | Married | Unmarried |
| 15 to 19 years | 0 (0.0%) | 0 (0.0%) |
| 20 to 34 years | 0 (0.0%) | 0 (0.0%) |
| 35 to 50 years | 0 (0.0%) | 0 (0.0%) |
| Total | 0 (0.0%) | 0 (0.0%) |
Fertility by Education in Wilkerson
| Educational Attainment | Women with Births | Births / 1,000 Women |
| Less than High School | 0 (0.0%) | 0.0 |
| High School Diploma | 0 (0.0%) | 0.0 |
| College or Associate's Degree | 0 (0.0%) | 0.0 |
| Bachelor's Degree | 0 (0.0%) | 0.0 |
| Graduate Degree | 0 (0.0%) | 0.0 |
| Total | 0 (0.0%) | 0.0 |
Fertility by Education by Marriage Status in Wilkerson
| Educational Attainment | Married | Unmarried |
| Less than High School | 0 (0.0%) | 0 (0.0%) |
| High School Diploma | 0 (0.0%) | 0 (0.0%) |
| College or Associate's Degree | 0 (0.0%) | 0 (0.0%) |
| Bachelor's Degree | 0 (0.0%) | 0 (0.0%) |
| Graduate Degree | 0 (0.0%) | 0 (0.0%) |
| Total | 0 (0.0%) | 0 (0.0%) |
Employment Characteristics in Wilkerson
Employment by Class of Employer in Wilkerson
Among the 240 employed individuals in Wilkerson, private company employees (104 | 43.3%), local government employees (41 | 17.1%), and self-employed (not incorporated) (30 | 12.5%) make up the most common classes of employment.
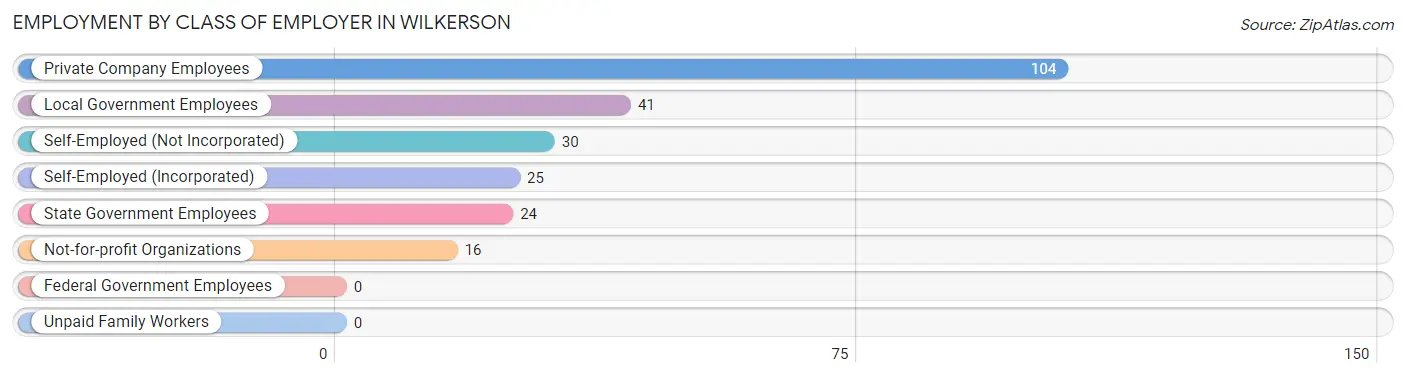
| Employer Class | # Employees | % Employees |
| Private Company Employees | 104 | 43.3% |
| Self-Employed (Incorporated) | 25 | 10.4% |
| Self-Employed (Not Incorporated) | 30 | 12.5% |
| Not-for-profit Organizations | 16 | 6.7% |
| Local Government Employees | 41 | 17.1% |
| State Government Employees | 24 | 10.0% |
| Federal Government Employees | 0 | 0.0% |
| Unpaid Family Workers | 0 | 0.0% |
| Total | 240 | 100.0% |
Employment Status by Age in Wilkerson
According to the labor force statistics for Wilkerson, out of the total population over 16 years of age (471), 54.1% or 255 individuals are in the labor force, with 4.3% or 11 of them unemployed. The age group with the highest labor force participation rate is 30 to 34 years, with 100.0% or 25 individuals in the labor force. Within the labor force, the 35 to 44 years age range has the highest percentage of unemployed individuals, with 15.9% or 11 of them being unemployed.
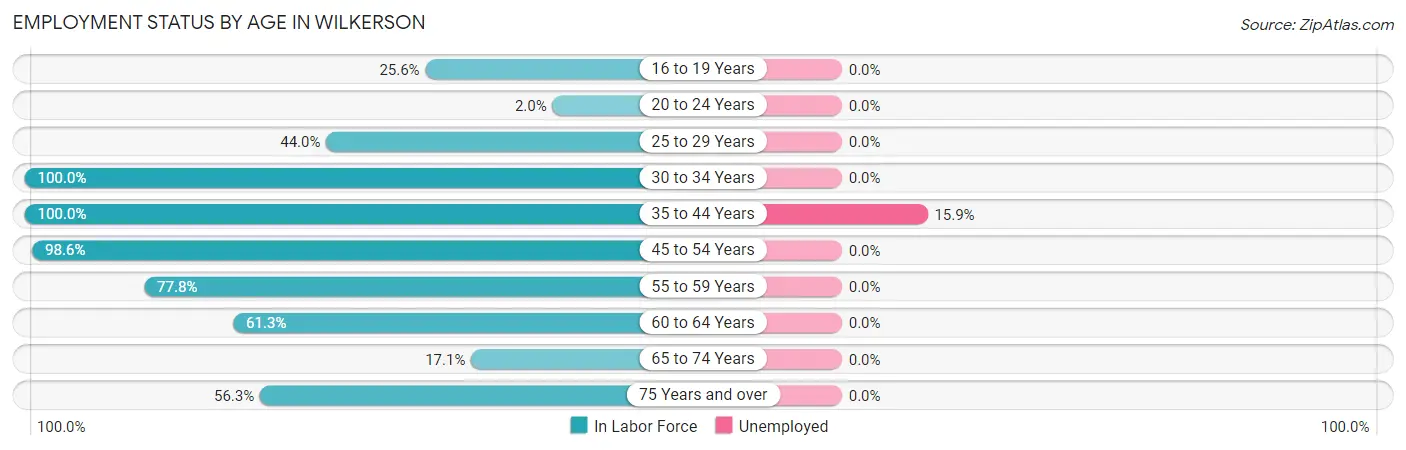
| Age Bracket | In Labor Force | Unemployed |
| 16 to 19 Years | 10 (25.6%) | 0 (0.0%) |
| 20 to 24 Years | 1 (2.0%) | 0 (0.0%) |
| 25 to 29 Years | 11 (44.0%) | 0 (0.0%) |
| 30 to 34 Years | 25 (100.0%) | 0 (0.0%) |
| 35 to 44 Years | 69 (100.0%) | 11 (15.9%) |
| 45 to 54 Years | 69 (98.6%) | 0 (0.0%) |
| 55 to 59 Years | 14 (77.8%) | 0 (0.0%) |
| 60 to 64 Years | 19 (61.3%) | 0 (0.0%) |
| 65 to 74 Years | 19 (17.1%) | 0 (0.0%) |
| 75 Years and over | 18 (56.3%) | 0 (0.0%) |
| Total | 255 (54.1%) | 11 (4.3%) |
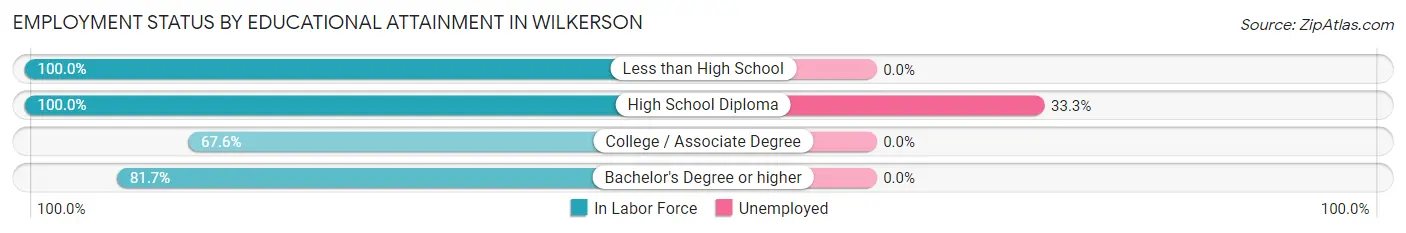
Employment Status by Educational Attainment in Wilkerson
According to labor force statistics for Wilkerson, 87.0% of individuals (207) out of the total population between 25 and 64 years of age (238) are in the labor force, with 5.3% or 11 of them being unemployed. The group with the highest labor force participation rate are those with the educational attainment of less than high school, with 100.0% or 64 individuals in the labor force. Within the labor force, individuals with high school diploma education have the highest percentage of unemployment, with 33.3% or 11 of them being unemployed.
| Educational Attainment | In Labor Force | Unemployed |
| Less than High School | 64 (100.0%) | 0 (0.0%) |
| High School Diploma | 33 (100.0%) | 11 (33.3%) |
| College / Associate Degree | 25 (67.6%) | 0 (0.0%) |
| Bachelor's Degree or higher | 85 (81.7%) | 0 (0.0%) |
| Total | 207 (87.0%) | 13 (5.3%) |
Employment Occupations by Sex in Wilkerson
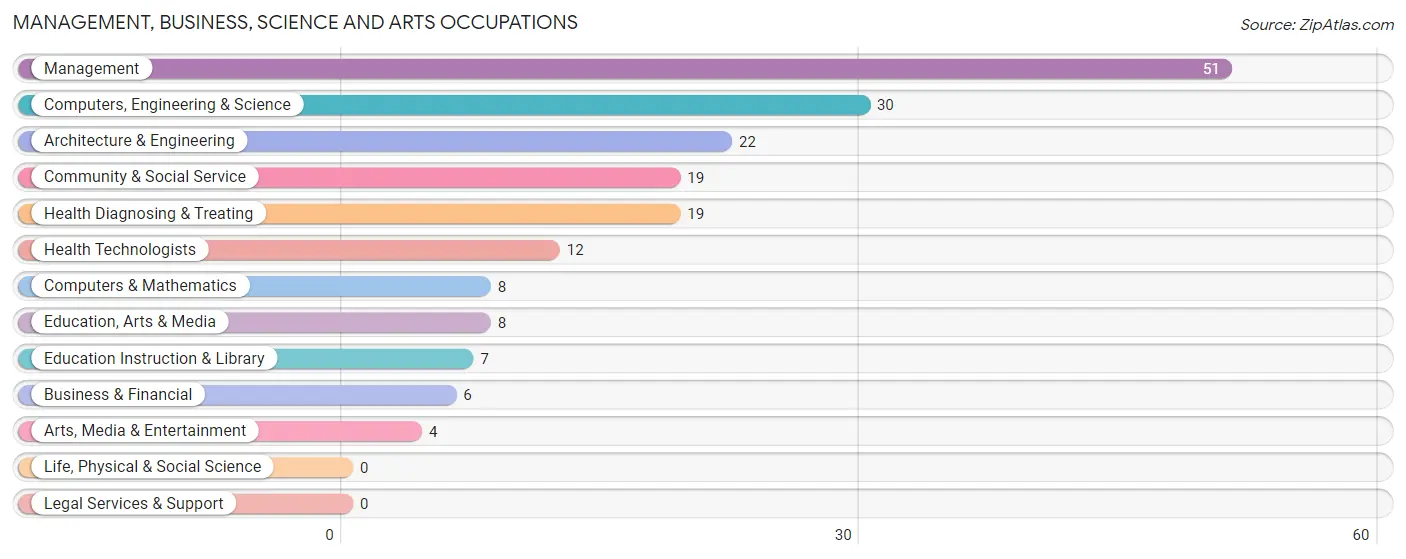
Management, Business, Science and Arts Occupations
The most common Management, Business, Science and Arts occupations in Wilkerson are Management (51 | 20.9%), Computers, Engineering & Science (30 | 12.3%), Architecture & Engineering (22 | 9.0%), Community & Social Service (19 | 7.8%), and Health Diagnosing & Treating (19 | 7.8%).
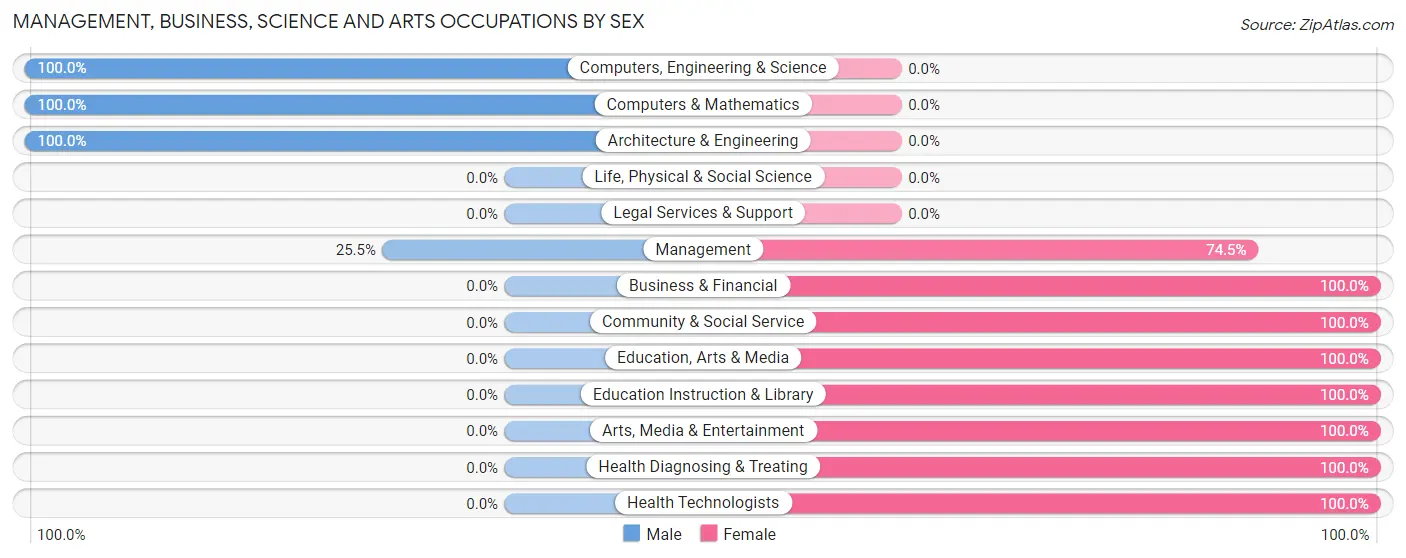
Management, Business, Science and Arts Occupations by Sex
Within the Management, Business, Science and Arts occupations in Wilkerson, the most male-oriented occupations are Computers, Engineering & Science (100.0%), Computers & Mathematics (100.0%), and Architecture & Engineering (100.0%), while the most female-oriented occupations are Business & Financial (100.0%), Community & Social Service (100.0%), and Education, Arts & Media (100.0%).
| Occupation | Male | Female |
| Management | 13 (25.5%) | 38 (74.5%) |
| Business & Financial | 0 (0.0%) | 6 (100.0%) |
| Computers, Engineering & Science | 30 (100.0%) | 0 (0.0%) |
| Computers & Mathematics | 8 (100.0%) | 0 (0.0%) |
| Architecture & Engineering | 22 (100.0%) | 0 (0.0%) |
| Life, Physical & Social Science | 0 (0.0%) | 0 (0.0%) |
| Community & Social Service | 0 (0.0%) | 19 (100.0%) |
| Education, Arts & Media | 0 (0.0%) | 8 (100.0%) |
| Legal Services & Support | 0 (0.0%) | 0 (0.0%) |
| Education Instruction & Library | 0 (0.0%) | 7 (100.0%) |
| Arts, Media & Entertainment | 0 (0.0%) | 4 (100.0%) |
| Health Diagnosing & Treating | 0 (0.0%) | 19 (100.0%) |
| Health Technologists | 0 (0.0%) | 12 (100.0%) |
| Total (Category) | 43 (34.4%) | 82 (65.6%) |
| Total (Overall) | 110 (45.1%) | 134 (54.9%) |
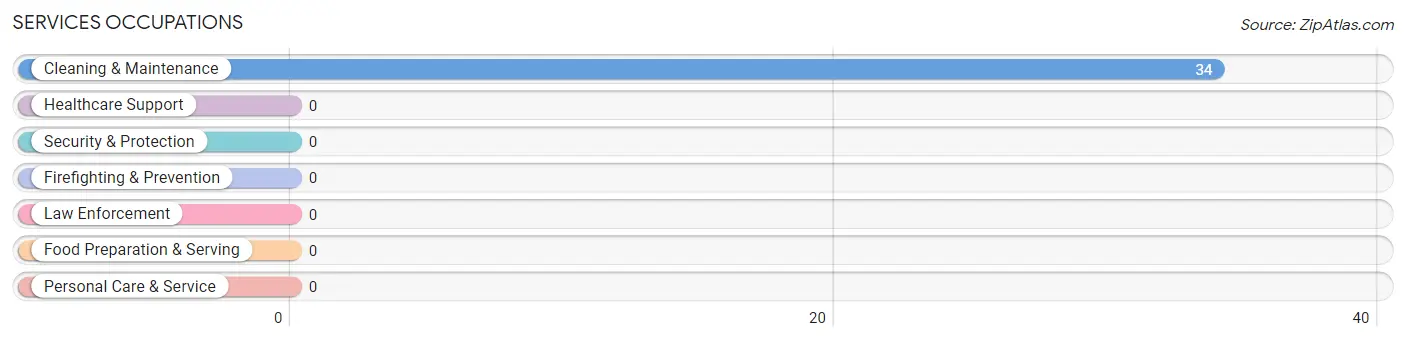
Services Occupations
The most common Services occupations in Wilkerson are , and Cleaning & Maintenance (34 | 13.9%).
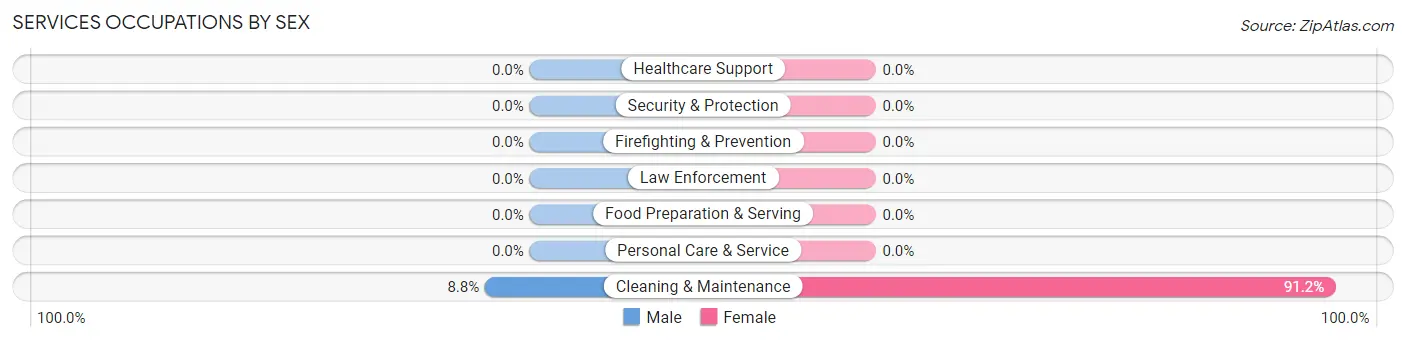
Services Occupations by Sex
| Occupation | Male | Female |
| Healthcare Support | 0 (0.0%) | 0 (0.0%) |
| Security & Protection | 0 (0.0%) | 0 (0.0%) |
| Firefighting & Prevention | 0 (0.0%) | 0 (0.0%) |
| Law Enforcement | 0 (0.0%) | 0 (0.0%) |
| Food Preparation & Serving | 0 (0.0%) | 0 (0.0%) |
| Cleaning & Maintenance | 3 (8.8%) | 31 (91.2%) |
| Personal Care & Service | 0 (0.0%) | 0 (0.0%) |
| Total (Category) | 3 (8.8%) | 31 (91.2%) |
| Total (Overall) | 110 (45.1%) | 134 (54.9%) |
Sales and Office Occupations
The most common Sales and Office occupations in Wilkerson are Sales & Related (23 | 9.4%), and Office & Administration (19 | 7.8%).
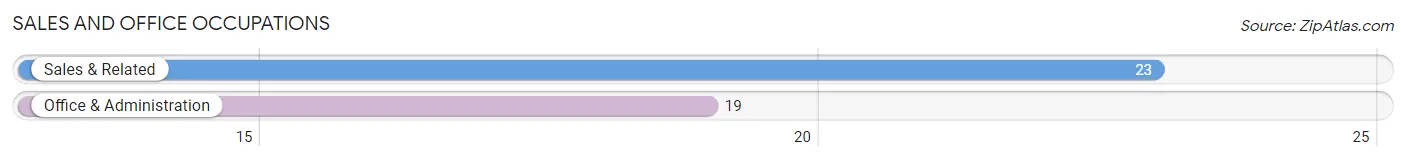
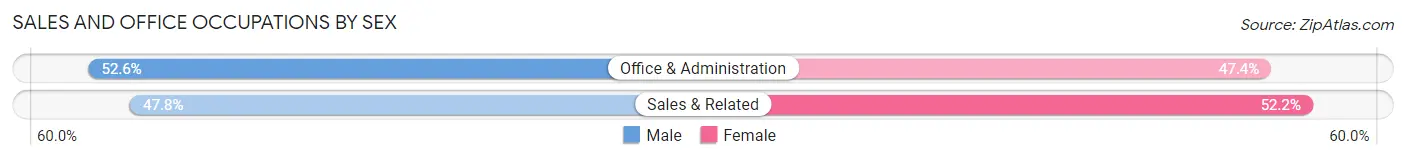
Sales and Office Occupations by Sex
| Occupation | Male | Female |
| Sales & Related | 11 (47.8%) | 12 (52.2%) |
| Office & Administration | 10 (52.6%) | 9 (47.4%) |
| Total (Category) | 21 (50.0%) | 21 (50.0%) |
| Total (Overall) | 110 (45.1%) | 134 (54.9%) |
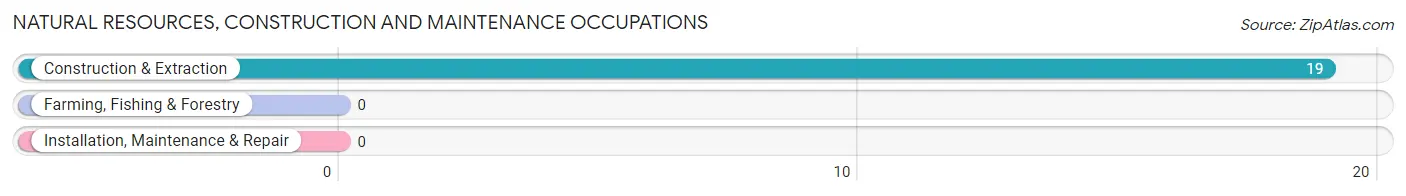
Natural Resources, Construction and Maintenance Occupations
The most common Natural Resources, Construction and Maintenance occupations in Wilkerson are , and Construction & Extraction (19 | 7.8%).
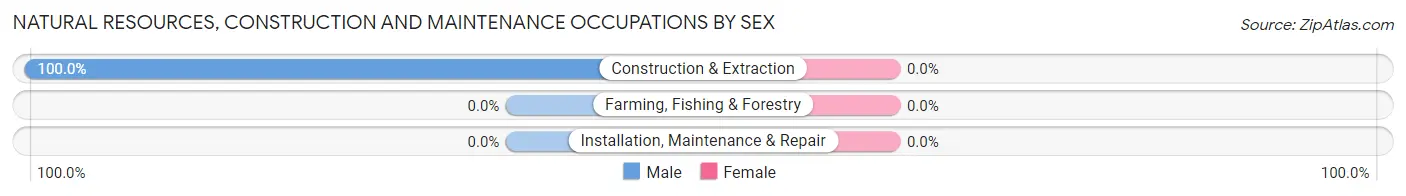
Natural Resources, Construction and Maintenance Occupations by Sex
| Occupation | Male | Female |
| Farming, Fishing & Forestry | 0 (0.0%) | 0 (0.0%) |
| Construction & Extraction | 19 (100.0%) | 0 (0.0%) |
| Installation, Maintenance & Repair | 0 (0.0%) | 0 (0.0%) |
| Total (Category) | 19 (100.0%) | 0 (0.0%) |
| Total (Overall) | 110 (45.1%) | 134 (54.9%) |
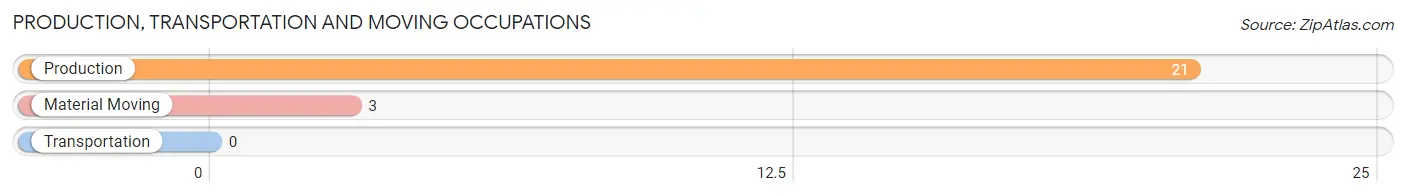
Production, Transportation and Moving Occupations
The most common Production, Transportation and Moving occupations in Wilkerson are Production (21 | 8.6%), and Material Moving (3 | 1.2%).
Production, Transportation and Moving Occupations by Sex
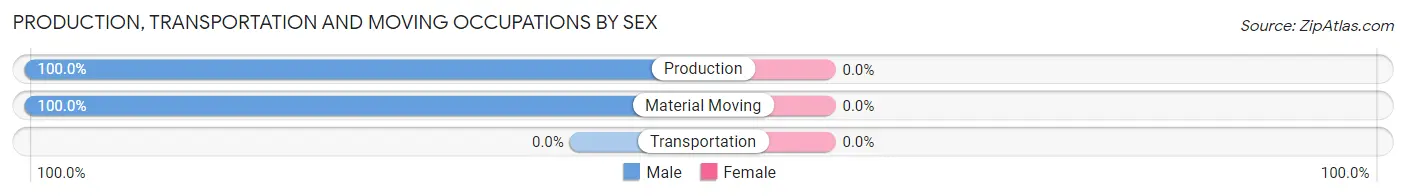
| Occupation | Male | Female |
| Production | 21 (100.0%) | 0 (0.0%) |
| Transportation | 0 (0.0%) | 0 (0.0%) |
| Material Moving | 3 (100.0%) | 0 (0.0%) |
| Total (Category) | 24 (100.0%) | 0 (0.0%) |
| Total (Overall) | 110 (45.1%) | 134 (54.9%) |
Employment Industries by Sex in Wilkerson
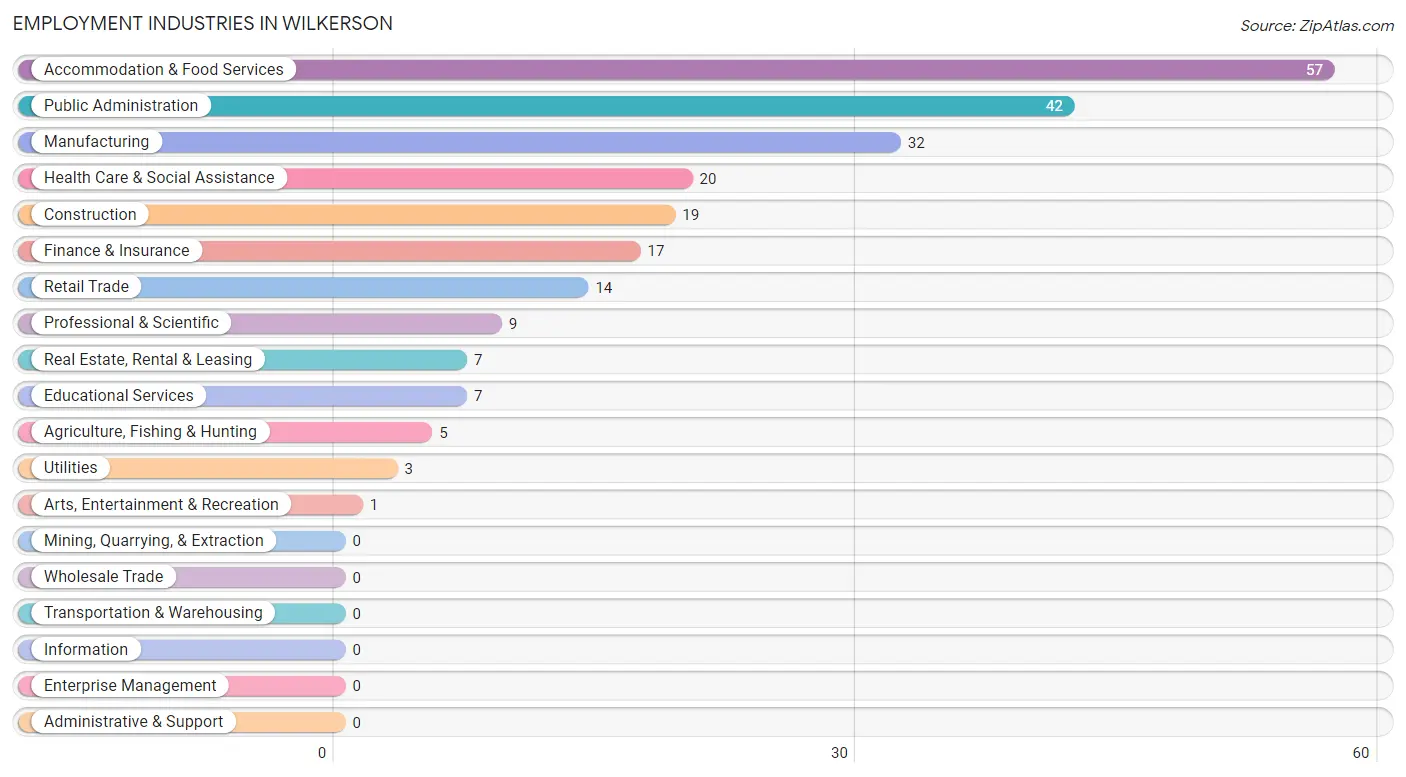
Employment Industries in Wilkerson
The major employment industries in Wilkerson include Accommodation & Food Services (57 | 23.4%), Public Administration (42 | 17.2%), Manufacturing (32 | 13.1%), Health Care & Social Assistance (20 | 8.2%), and Construction (19 | 7.8%).
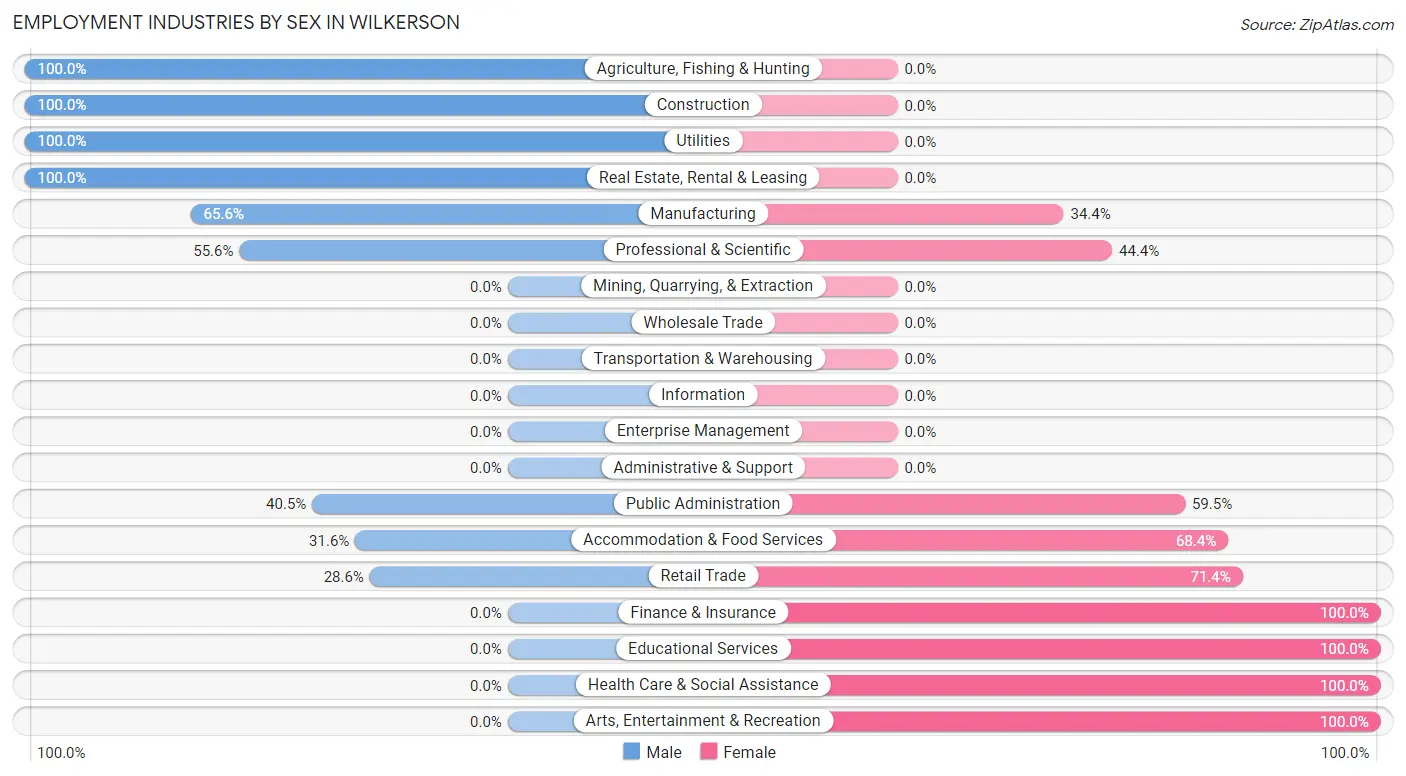
Employment Industries by Sex in Wilkerson
The Wilkerson industries that see more men than women are Agriculture, Fishing & Hunting (100.0%), Construction (100.0%), and Utilities (100.0%), whereas the industries that tend to have a higher number of women are Finance & Insurance (100.0%), Educational Services (100.0%), and Health Care & Social Assistance (100.0%).
| Industry | Male | Female |
| Agriculture, Fishing & Hunting | 5 (100.0%) | 0 (0.0%) |
| Mining, Quarrying, & Extraction | 0 (0.0%) | 0 (0.0%) |
| Construction | 19 (100.0%) | 0 (0.0%) |
| Manufacturing | 21 (65.6%) | 11 (34.4%) |
| Wholesale Trade | 0 (0.0%) | 0 (0.0%) |
| Retail Trade | 4 (28.6%) | 10 (71.4%) |
| Transportation & Warehousing | 0 (0.0%) | 0 (0.0%) |
| Utilities | 3 (100.0%) | 0 (0.0%) |
| Information | 0 (0.0%) | 0 (0.0%) |
| Finance & Insurance | 0 (0.0%) | 17 (100.0%) |
| Real Estate, Rental & Leasing | 7 (100.0%) | 0 (0.0%) |
| Professional & Scientific | 5 (55.6%) | 4 (44.4%) |
| Enterprise Management | 0 (0.0%) | 0 (0.0%) |
| Administrative & Support | 0 (0.0%) | 0 (0.0%) |
| Educational Services | 0 (0.0%) | 7 (100.0%) |
| Health Care & Social Assistance | 0 (0.0%) | 20 (100.0%) |
| Arts, Entertainment & Recreation | 0 (0.0%) | 1 (100.0%) |
| Accommodation & Food Services | 18 (31.6%) | 39 (68.4%) |
| Public Administration | 17 (40.5%) | 25 (59.5%) |
| Total | 110 (45.1%) | 134 (54.9%) |
Education in Wilkerson
School Enrollment in Wilkerson
The most common levels of schooling among the 122 students in Wilkerson are high school (86 | 70.5%), college / undergraduate (11 | 9.0%), and middle school (9 | 7.4%).
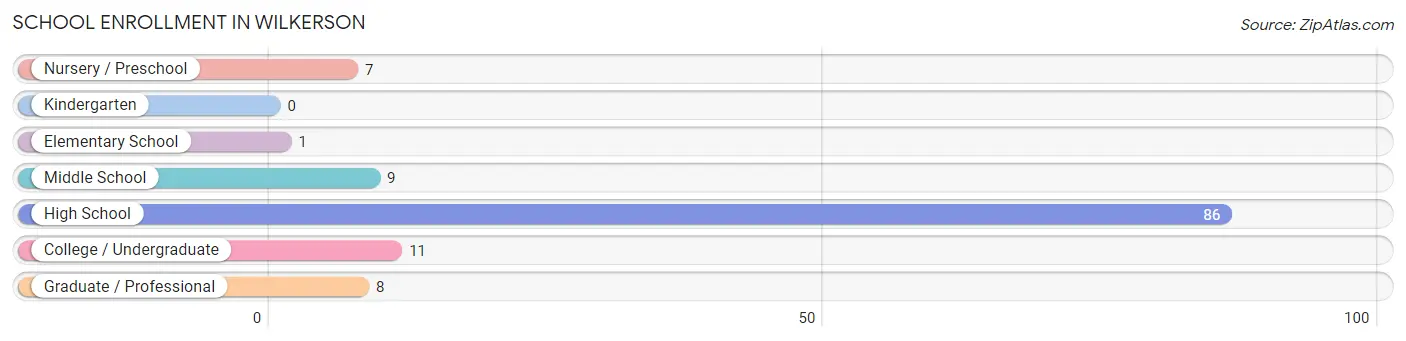
| School Level | # Students | % Students |
| Nursery / Preschool | 7 | 5.7% |
| Kindergarten | 0 | 0.0% |
| Elementary School | 1 | 0.8% |
| Middle School | 9 | 7.4% |
| High School | 86 | 70.5% |
| College / Undergraduate | 11 | 9.0% |
| Graduate / Professional | 8 | 6.6% |
| Total | 122 | 100.0% |
School Enrollment by Age by Funding Source in Wilkerson
Out of a total of 122 students who are enrolled in schools in Wilkerson, 22 (18.0%) attend a private institution, while the remaining 100 (82.0%) are enrolled in public schools. The age group of 3 to 4 year olds has the highest likelihood of being enrolled in private schools, with 6 (100.0% in the age bracket) enrolled. Conversely, the age group of 5 to 9 year old has the lowest likelihood of being enrolled in a private school, with 1 (100.0% in the age bracket) attending a public institution.
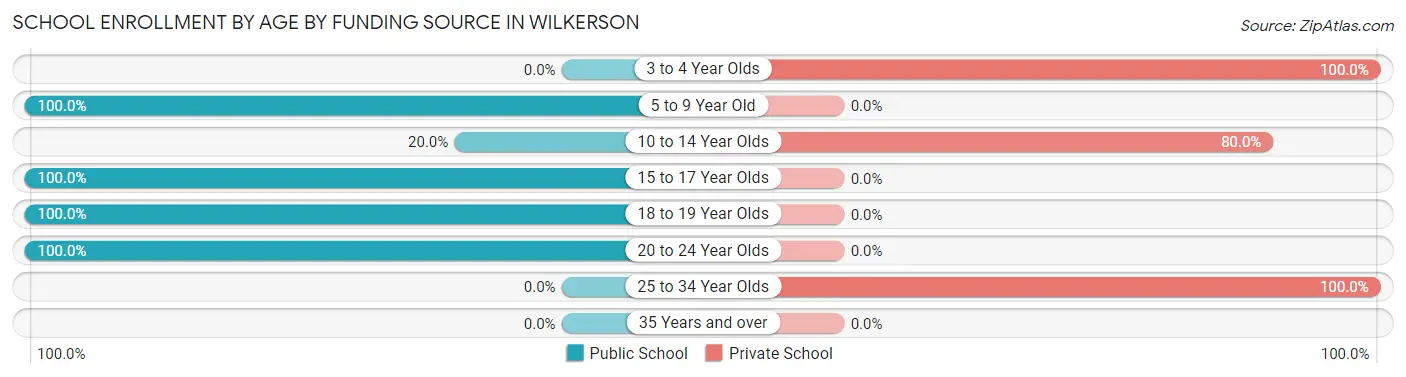
| Age Bracket | Public School | Private School |
| 3 to 4 Year Olds | 0 (0.0%) | 6 (100.0%) |
| 5 to 9 Year Old | 1 (100.0%) | 0 (0.0%) |
| 10 to 14 Year Olds | 2 (20.0%) | 8 (80.0%) |
| 15 to 17 Year Olds | 7 (100.0%) | 0 (0.0%) |
| 18 to 19 Year Olds | 39 (100.0%) | 0 (0.0%) |
| 20 to 24 Year Olds | 51 (100.0%) | 0 (0.0%) |
| 25 to 34 Year Olds | 0 (0.0%) | 8 (100.0%) |
| 35 Years and over | 0 (0.0%) | 0 (0.0%) |
| Total | 100 (82.0%) | 22 (18.0%) |
Educational Attainment by Field of Study in Wilkerson
Liberal arts & history (47 | 28.3%), social sciences (29 | 17.5%), engineering (17 | 10.2%), bio, nature & agricultural (16 | 9.6%), and business (13 | 7.8%) are the most common fields of study among 166 individuals in Wilkerson who have obtained a bachelor's degree or higher.
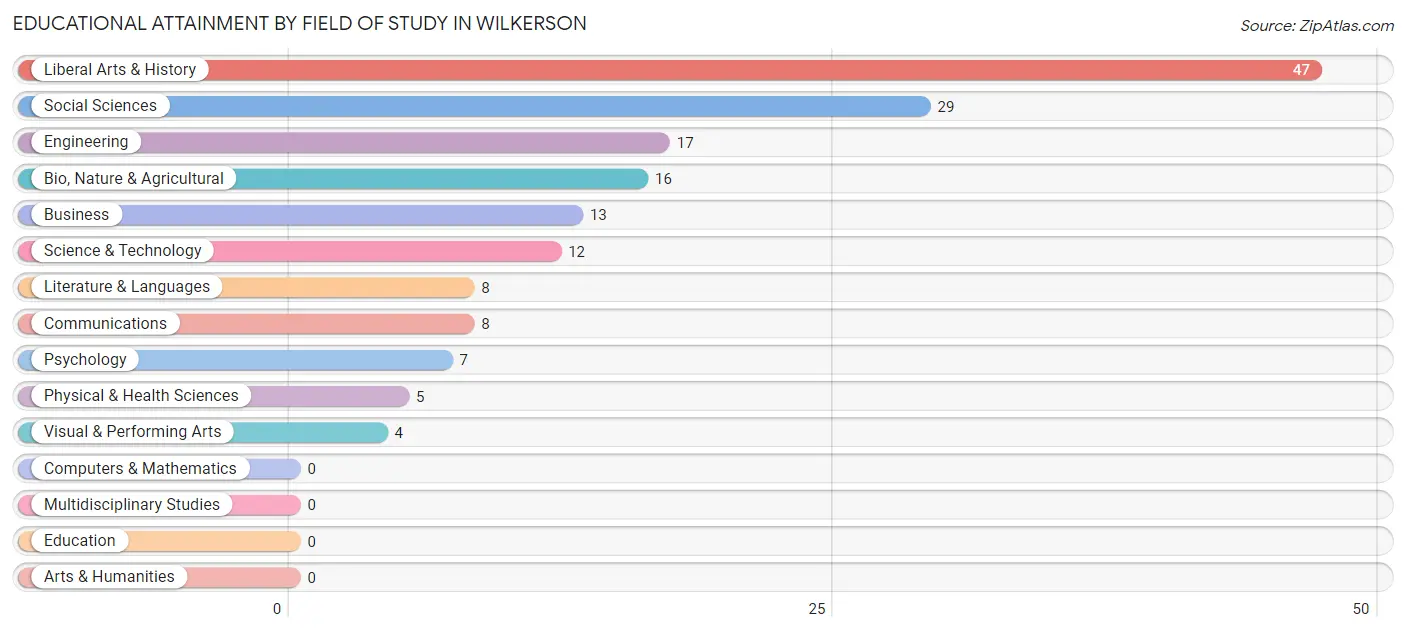
| Field of Study | # Graduates | % Graduates |
| Computers & Mathematics | 0 | 0.0% |
| Bio, Nature & Agricultural | 16 | 9.6% |
| Physical & Health Sciences | 5 | 3.0% |
| Psychology | 7 | 4.2% |
| Social Sciences | 29 | 17.5% |
| Engineering | 17 | 10.2% |
| Multidisciplinary Studies | 0 | 0.0% |
| Science & Technology | 12 | 7.2% |
| Business | 13 | 7.8% |
| Education | 0 | 0.0% |
| Literature & Languages | 8 | 4.8% |
| Liberal Arts & History | 47 | 28.3% |
| Visual & Performing Arts | 4 | 2.4% |
| Communications | 8 | 4.8% |
| Arts & Humanities | 0 | 0.0% |
| Total | 166 | 100.0% |
Transportation & Commute in Wilkerson
Vehicle Availability by Sex in Wilkerson
The most prevalent vehicle ownership categories in Wilkerson are males with 3 vehicles (60, accounting for 54.5%) and females with 3 vehicles (54, making up 46.2%).
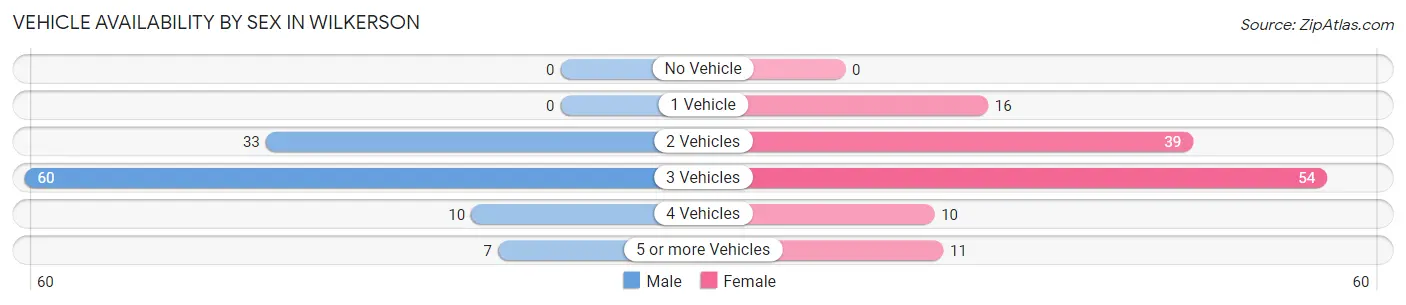
| Vehicles Available | Male | Female |
| No Vehicle | 0 (0.0%) | 0 (0.0%) |
| 1 Vehicle | 0 (0.0%) | 16 (12.3%) |
| 2 Vehicles | 33 (30.0%) | 39 (30.0%) |
| 3 Vehicles | 60 (54.5%) | 54 (41.5%) |
| 4 Vehicles | 10 (9.1%) | 10 (7.7%) |
| 5 or more Vehicles | 7 (6.4%) | 11 (8.5%) |
| Total | 110 (100.0%) | 130 (100.0%) |
Commute Time in Wilkerson
The most frequently occuring commute durations in Wilkerson are 10 to 14 minutes (120 commuters, 54.5%), 5 to 9 minutes (35 commuters, 15.9%), and 45 to 59 minutes (22 commuters, 10.0%).
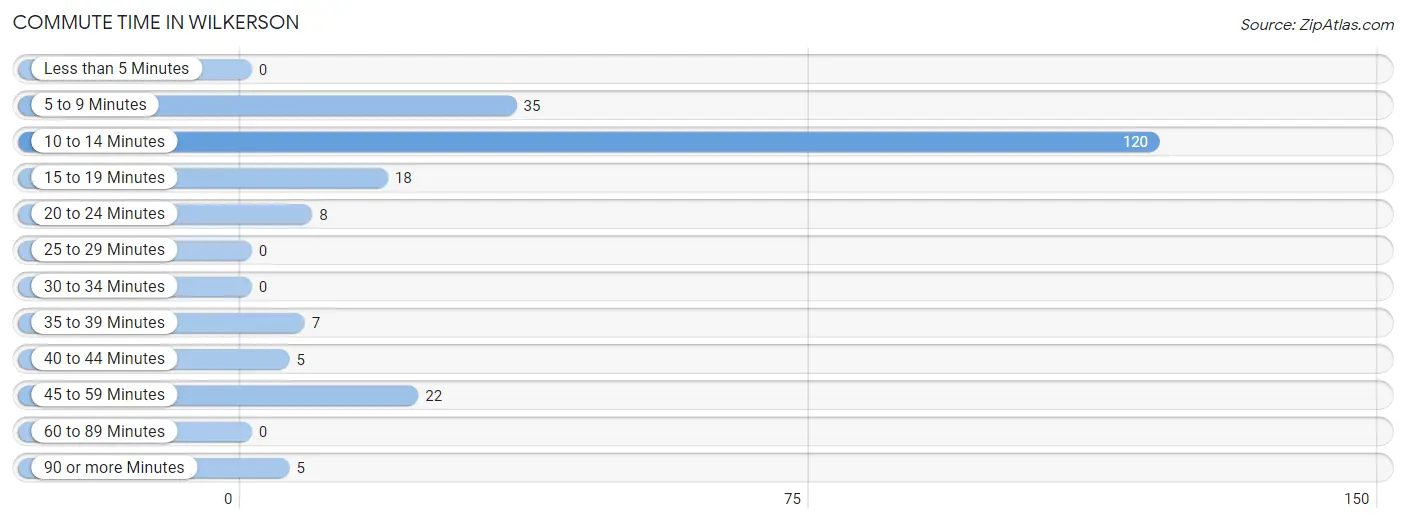
| Commute Time | # Commuters | % Commuters |
| Less than 5 Minutes | 0 | 0.0% |
| 5 to 9 Minutes | 35 | 15.9% |
| 10 to 14 Minutes | 120 | 54.5% |
| 15 to 19 Minutes | 18 | 8.2% |
| 20 to 24 Minutes | 8 | 3.6% |
| 25 to 29 Minutes | 0 | 0.0% |
| 30 to 34 Minutes | 0 | 0.0% |
| 35 to 39 Minutes | 7 | 3.2% |
| 40 to 44 Minutes | 5 | 2.3% |
| 45 to 59 Minutes | 22 | 10.0% |
| 60 to 89 Minutes | 0 | 0.0% |
| 90 or more Minutes | 5 | 2.3% |
Commute Time by Sex in Wilkerson
The most common commute times in Wilkerson are 10 to 14 minutes (53 commuters, 50.5%) for males and 10 to 14 minutes (67 commuters, 58.3%) for females.
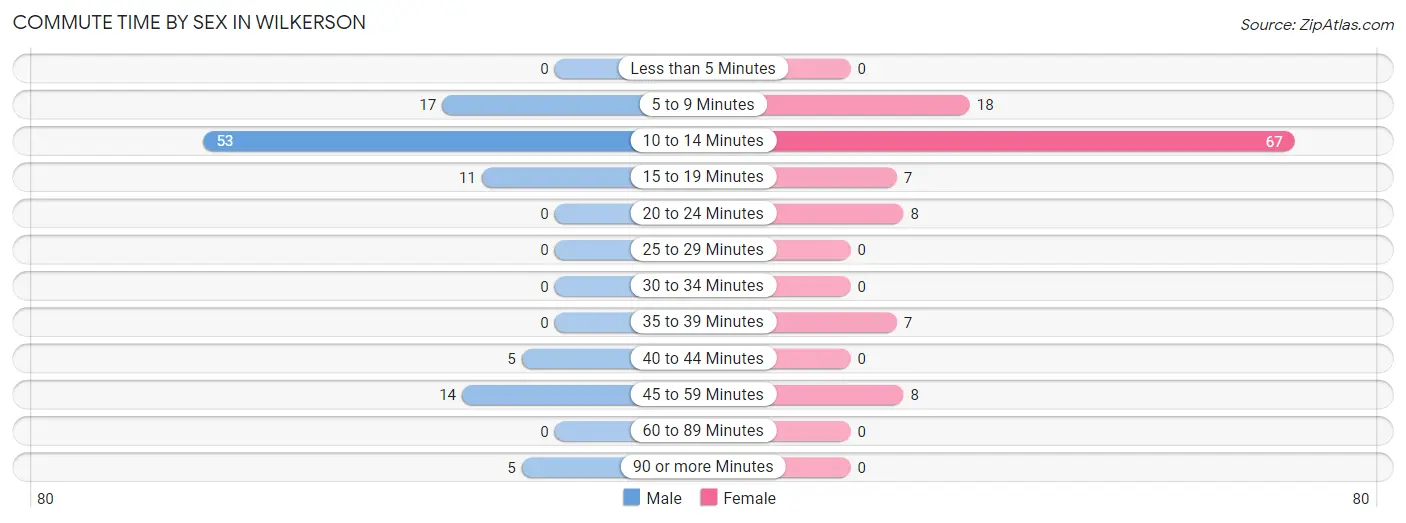
| Commute Time | Male | Female |
| Less than 5 Minutes | 0 (0.0%) | 0 (0.0%) |
| 5 to 9 Minutes | 17 (16.2%) | 18 (15.7%) |
| 10 to 14 Minutes | 53 (50.5%) | 67 (58.3%) |
| 15 to 19 Minutes | 11 (10.5%) | 7 (6.1%) |
| 20 to 24 Minutes | 0 (0.0%) | 8 (7.0%) |
| 25 to 29 Minutes | 0 (0.0%) | 0 (0.0%) |
| 30 to 34 Minutes | 0 (0.0%) | 0 (0.0%) |
| 35 to 39 Minutes | 0 (0.0%) | 7 (6.1%) |
| 40 to 44 Minutes | 5 (4.8%) | 0 (0.0%) |
| 45 to 59 Minutes | 14 (13.3%) | 8 (7.0%) |
| 60 to 89 Minutes | 0 (0.0%) | 0 (0.0%) |
| 90 or more Minutes | 5 (4.8%) | 0 (0.0%) |
Time of Departure to Work by Sex in Wilkerson
The most frequent times of departure to work in Wilkerson are 8:00 AM to 8:29 AM (32, 30.5%) for males and 7:30 AM to 7:59 AM (41, 35.6%) for females.
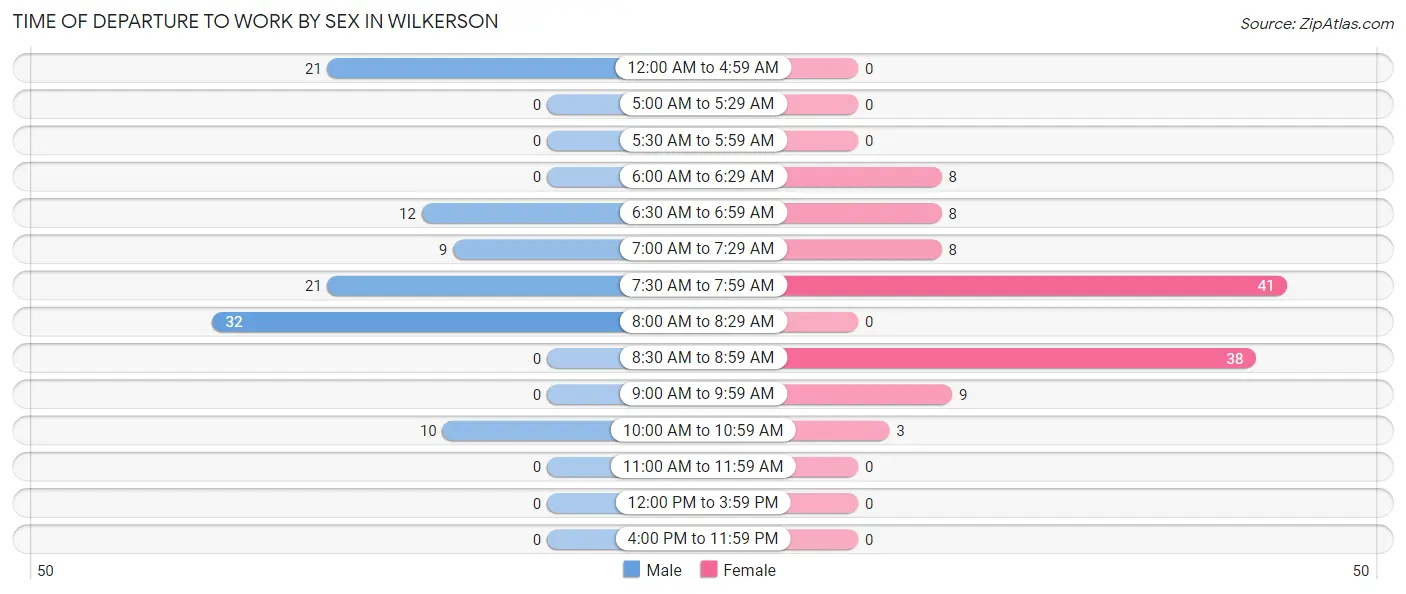
| Time of Departure | Male | Female |
| 12:00 AM to 4:59 AM | 21 (20.0%) | 0 (0.0%) |
| 5:00 AM to 5:29 AM | 0 (0.0%) | 0 (0.0%) |
| 5:30 AM to 5:59 AM | 0 (0.0%) | 0 (0.0%) |
| 6:00 AM to 6:29 AM | 0 (0.0%) | 8 (7.0%) |
| 6:30 AM to 6:59 AM | 12 (11.4%) | 8 (7.0%) |
| 7:00 AM to 7:29 AM | 9 (8.6%) | 8 (7.0%) |
| 7:30 AM to 7:59 AM | 21 (20.0%) | 41 (35.6%) |
| 8:00 AM to 8:29 AM | 32 (30.5%) | 0 (0.0%) |
| 8:30 AM to 8:59 AM | 0 (0.0%) | 38 (33.0%) |
| 9:00 AM to 9:59 AM | 0 (0.0%) | 9 (7.8%) |
| 10:00 AM to 10:59 AM | 10 (9.5%) | 3 (2.6%) |
| 11:00 AM to 11:59 AM | 0 (0.0%) | 0 (0.0%) |
| 12:00 PM to 3:59 PM | 0 (0.0%) | 0 (0.0%) |
| 4:00 PM to 11:59 PM | 0 (0.0%) | 0 (0.0%) |
| Total | 105 (100.0%) | 115 (100.0%) |
Housing Occupancy in Wilkerson
Occupancy by Ownership in Wilkerson
Of the total 166 dwellings in Wilkerson, owner-occupied units account for 145 (87.4%), while renter-occupied units make up 21 (12.7%).
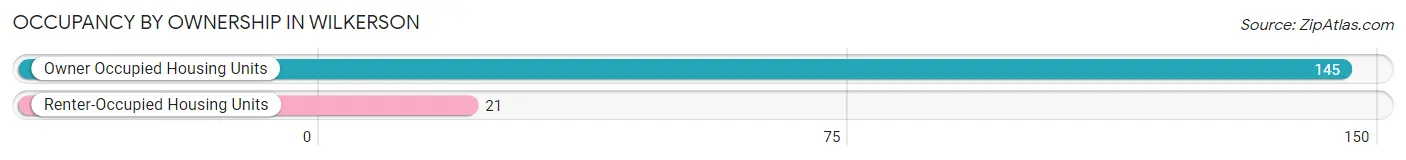
| Occupancy | # Housing Units | % Housing Units |
| Owner Occupied Housing Units | 145 | 87.4% |
| Renter-Occupied Housing Units | 21 | 12.7% |
| Total Occupied Housing Units | 166 | 100.0% |
Occupancy by Household Size in Wilkerson
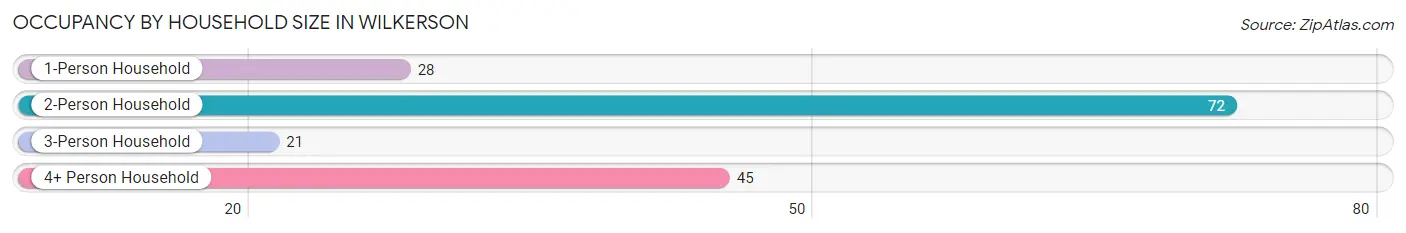
| Household Size | # Housing Units | % Housing Units |
| 1-Person Household | 28 | 16.9% |
| 2-Person Household | 72 | 43.4% |
| 3-Person Household | 21 | 12.7% |
| 4+ Person Household | 45 | 27.1% |
| Total Housing Units | 166 | 100.0% |
Occupancy by Ownership by Household Size in Wilkerson
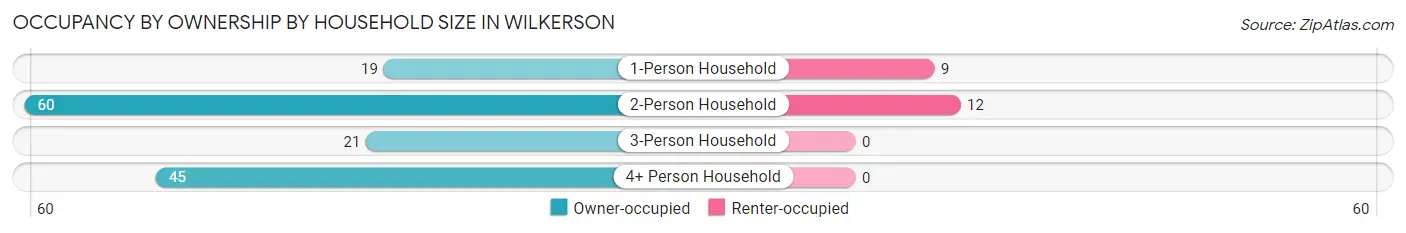
| Household Size | Owner-occupied | Renter-occupied |
| 1-Person Household | 19 (67.9%) | 9 (32.1%) |
| 2-Person Household | 60 (83.3%) | 12 (16.7%) |
| 3-Person Household | 21 (100.0%) | 0 (0.0%) |
| 4+ Person Household | 45 (100.0%) | 0 (0.0%) |
| Total Housing Units | 145 (87.4%) | 21 (12.7%) |
Occupancy by Educational Attainment in Wilkerson
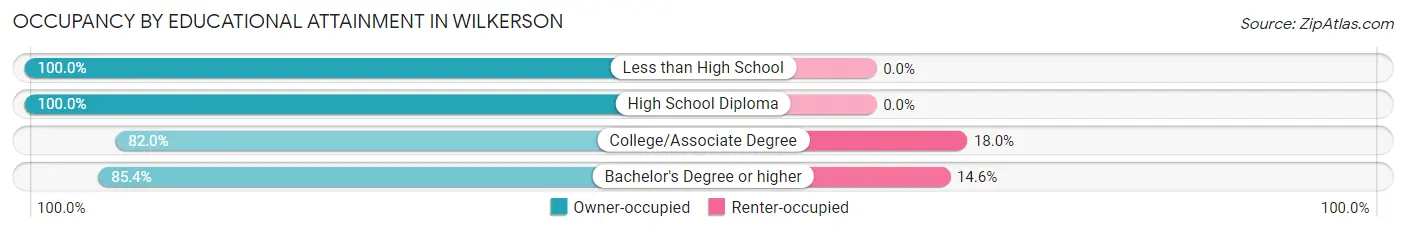
| Household Size | Owner-occupied | Renter-occupied |
| Less than High School | 27 (100.0%) | 0 (0.0%) |
| High School Diploma | 7 (100.0%) | 0 (0.0%) |
| College/Associate Degree | 41 (82.0%) | 9 (18.0%) |
| Bachelor's Degree or higher | 70 (85.4%) | 12 (14.6%) |
Occupancy by Age of Householder in Wilkerson
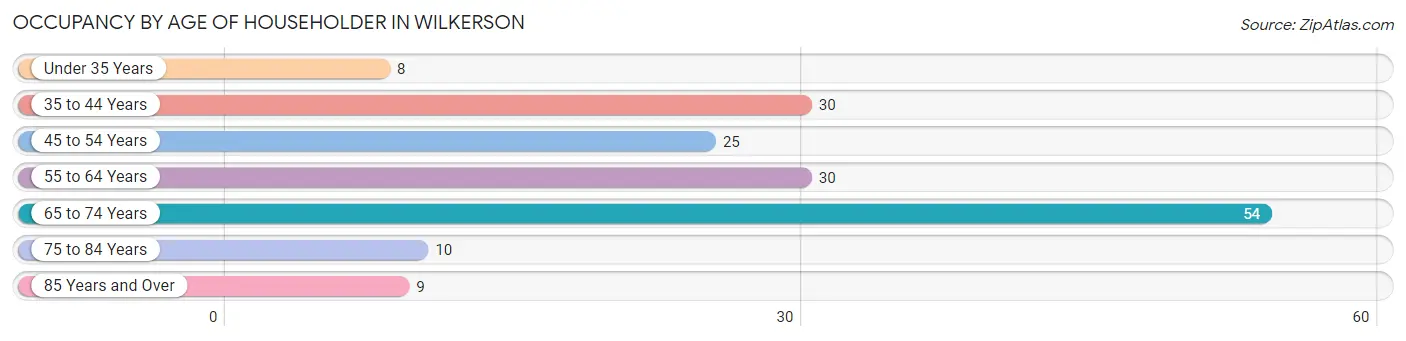
| Age Bracket | # Households | % Households |
| Under 35 Years | 8 | 4.8% |
| 35 to 44 Years | 30 | 18.1% |
| 45 to 54 Years | 25 | 15.1% |
| 55 to 64 Years | 30 | 18.1% |
| 65 to 74 Years | 54 | 32.5% |
| 75 to 84 Years | 10 | 6.0% |
| 85 Years and Over | 9 | 5.4% |
| Total | 166 | 100.0% |
Housing Finances in Wilkerson
Median Income by Occupancy in Wilkerson
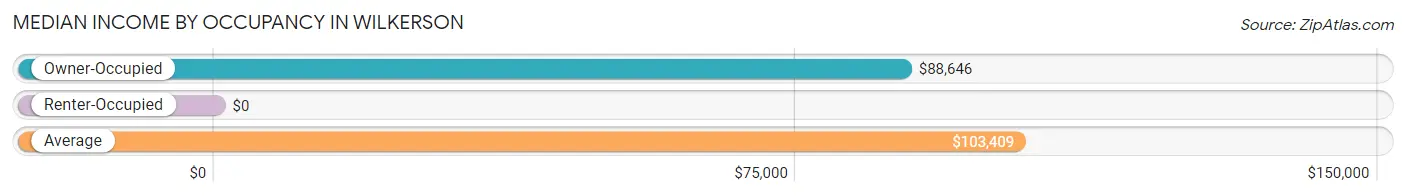
| Occupancy Type | # Households | Median Income |
| Owner-Occupied | 145 (87.4%) | $88,646 |
| Renter-Occupied | 21 (12.7%) | $0 |
| Average | 166 (100.0%) | $103,409 |
Occupancy by Householder Income Bracket in Wilkerson
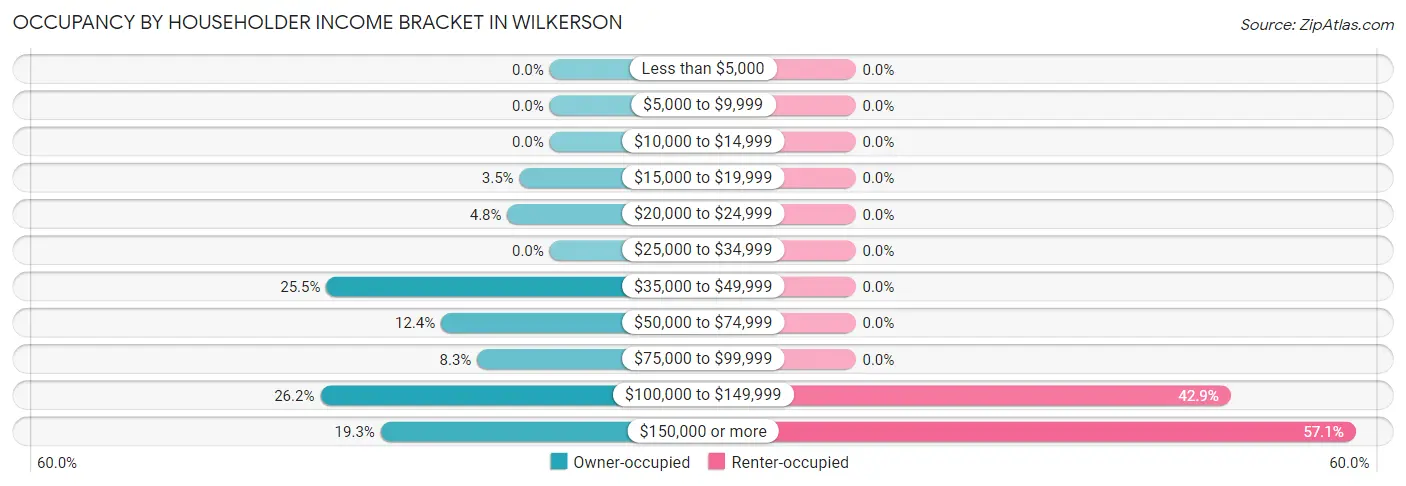
| Income Bracket | Owner-occupied | Renter-occupied |
| Less than $5,000 | 0 (0.0%) | 0 (0.0%) |
| $5,000 to $9,999 | 0 (0.0%) | 0 (0.0%) |
| $10,000 to $14,999 | 0 (0.0%) | 0 (0.0%) |
| $15,000 to $19,999 | 5 (3.5%) | 0 (0.0%) |
| $20,000 to $24,999 | 7 (4.8%) | 0 (0.0%) |
| $25,000 to $34,999 | 0 (0.0%) | 0 (0.0%) |
| $35,000 to $49,999 | 37 (25.5%) | 0 (0.0%) |
| $50,000 to $74,999 | 18 (12.4%) | 0 (0.0%) |
| $75,000 to $99,999 | 12 (8.3%) | 0 (0.0%) |
| $100,000 to $149,999 | 38 (26.2%) | 9 (42.9%) |
| $150,000 or more | 28 (19.3%) | 12 (57.1%) |
| Total | 145 (100.0%) | 21 (100.0%) |
Monthly Housing Cost Tiers in Wilkerson
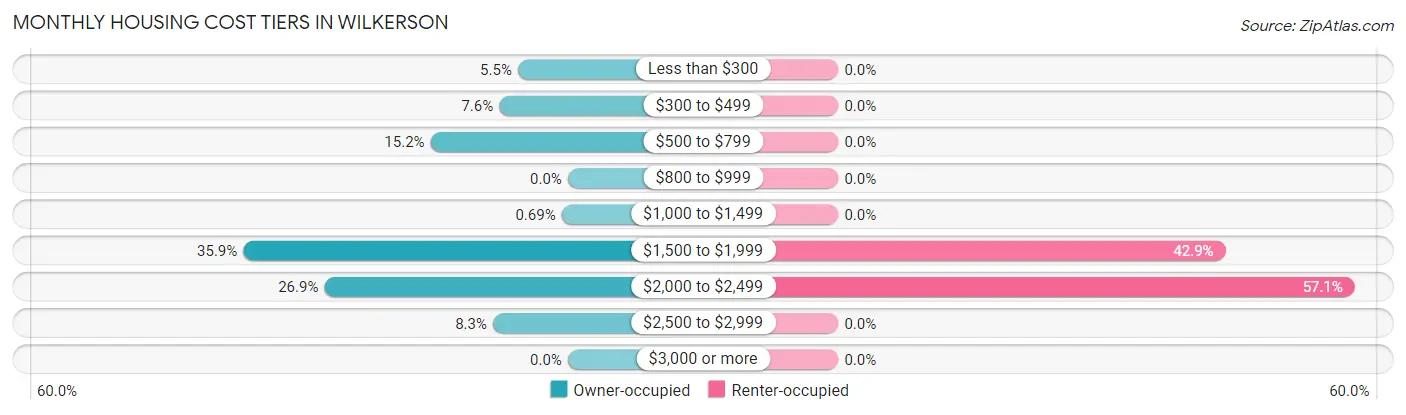
| Monthly Cost | Owner-occupied | Renter-occupied |
| Less than $300 | 8 (5.5%) | 0 (0.0%) |
| $300 to $499 | 11 (7.6%) | 0 (0.0%) |
| $500 to $799 | 22 (15.2%) | 0 (0.0%) |
| $800 to $999 | 0 (0.0%) | 0 (0.0%) |
| $1,000 to $1,499 | 1 (0.7%) | 0 (0.0%) |
| $1,500 to $1,999 | 52 (35.9%) | 9 (42.9%) |
| $2,000 to $2,499 | 39 (26.9%) | 12 (57.1%) |
| $2,500 to $2,999 | 12 (8.3%) | 0 (0.0%) |
| $3,000 or more | 0 (0.0%) | 0 (0.0%) |
| Total | 145 (100.0%) | 21 (100.0%) |
Physical Housing Characteristics in Wilkerson
Housing Structures in Wilkerson
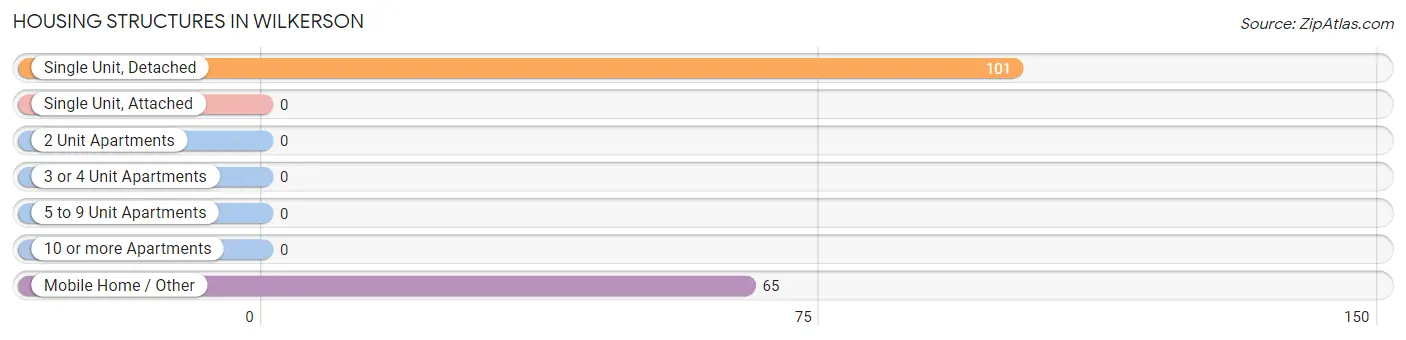
| Structure Type | # Housing Units | % Housing Units |
| Single Unit, Detached | 101 | 60.8% |
| Single Unit, Attached | 0 | 0.0% |
| 2 Unit Apartments | 0 | 0.0% |
| 3 or 4 Unit Apartments | 0 | 0.0% |
| 5 to 9 Unit Apartments | 0 | 0.0% |
| 10 or more Apartments | 0 | 0.0% |
| Mobile Home / Other | 65 | 39.2% |
| Total | 166 | 100.0% |
Housing Structures by Occupancy in Wilkerson
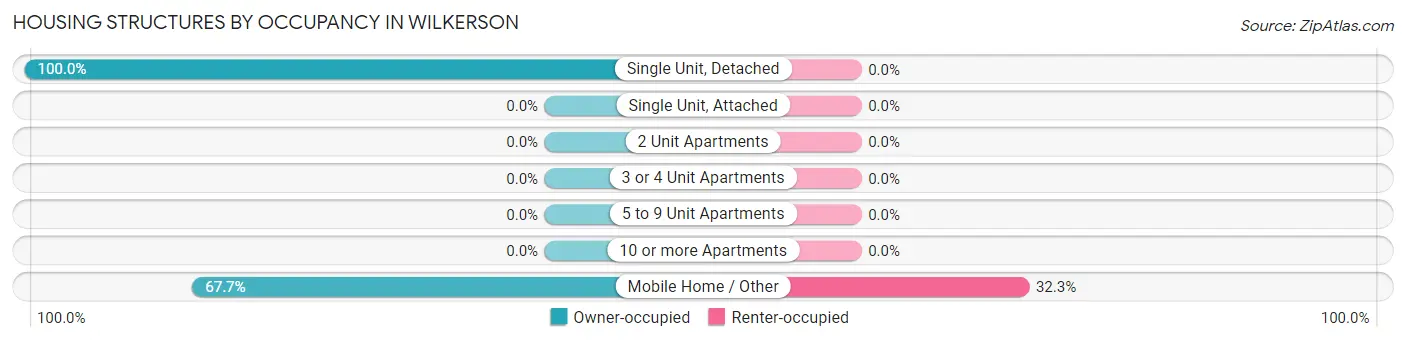
| Structure Type | Owner-occupied | Renter-occupied |
| Single Unit, Detached | 101 (100.0%) | 0 (0.0%) |
| Single Unit, Attached | 0 (0.0%) | 0 (0.0%) |
| 2 Unit Apartments | 0 (0.0%) | 0 (0.0%) |
| 3 or 4 Unit Apartments | 0 (0.0%) | 0 (0.0%) |
| 5 to 9 Unit Apartments | 0 (0.0%) | 0 (0.0%) |
| 10 or more Apartments | 0 (0.0%) | 0 (0.0%) |
| Mobile Home / Other | 44 (67.7%) | 21 (32.3%) |
| Total | 145 (87.4%) | 21 (12.7%) |
Housing Structures by Number of Rooms in Wilkerson
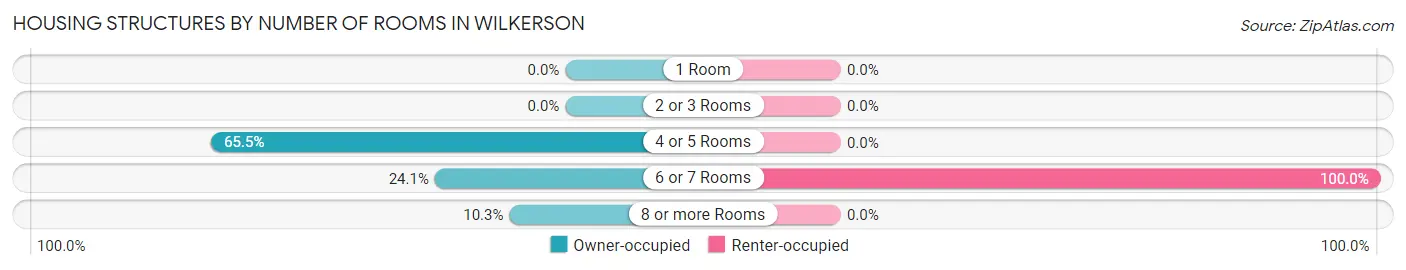
| Number of Rooms | Owner-occupied | Renter-occupied |
| 1 Room | 0 (0.0%) | 0 (0.0%) |
| 2 or 3 Rooms | 0 (0.0%) | 0 (0.0%) |
| 4 or 5 Rooms | 95 (65.5%) | 0 (0.0%) |
| 6 or 7 Rooms | 35 (24.1%) | 21 (100.0%) |
| 8 or more Rooms | 15 (10.3%) | 0 (0.0%) |
| Total | 145 (100.0%) | 21 (100.0%) |
Housing Structure by Heating Type in Wilkerson
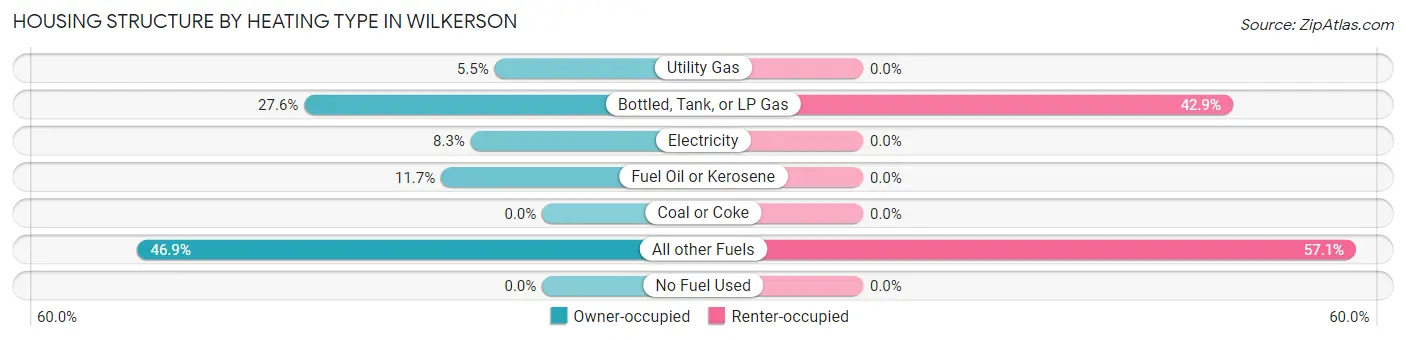
| Heating Type | Owner-occupied | Renter-occupied |
| Utility Gas | 8 (5.5%) | 0 (0.0%) |
| Bottled, Tank, or LP Gas | 40 (27.6%) | 9 (42.9%) |
| Electricity | 12 (8.3%) | 0 (0.0%) |
| Fuel Oil or Kerosene | 17 (11.7%) | 0 (0.0%) |
| Coal or Coke | 0 (0.0%) | 0 (0.0%) |
| All other Fuels | 68 (46.9%) | 12 (57.1%) |
| No Fuel Used | 0 (0.0%) | 0 (0.0%) |
| Total | 145 (100.0%) | 21 (100.0%) |
Household Vehicle Usage in Wilkerson
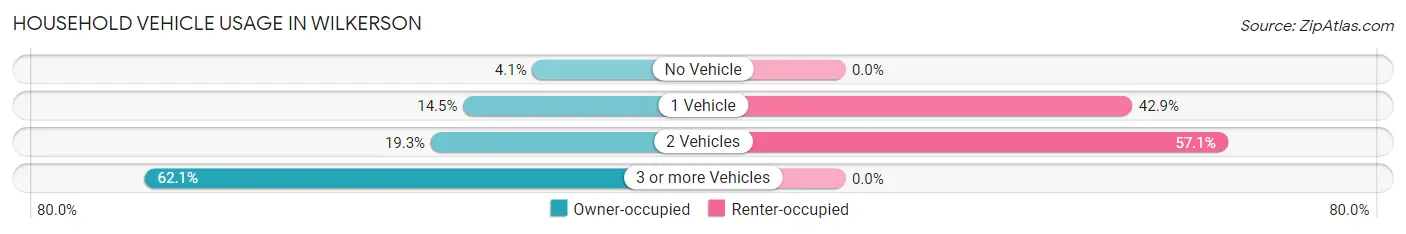
| Vehicles per Household | Owner-occupied | Renter-occupied |
| No Vehicle | 6 (4.1%) | 0 (0.0%) |
| 1 Vehicle | 21 (14.5%) | 9 (42.9%) |
| 2 Vehicles | 28 (19.3%) | 12 (57.1%) |
| 3 or more Vehicles | 90 (62.1%) | 0 (0.0%) |
| Total | 145 (100.0%) | 21 (100.0%) |
Real Estate & Mortgages in Wilkerson
Real Estate and Mortgage Overview in Wilkerson
| Characteristic | Without Mortgage | With Mortgage |
| Housing Units | 50 | 95 |
| Median Property Value | $325,000 | $307,100 |
| Median Household Income | - | - |
| Monthly Housing Costs | $667 | $0 |
| Real Estate Taxes | $1,688 | $21 |
Property Value by Mortgage Status in Wilkerson
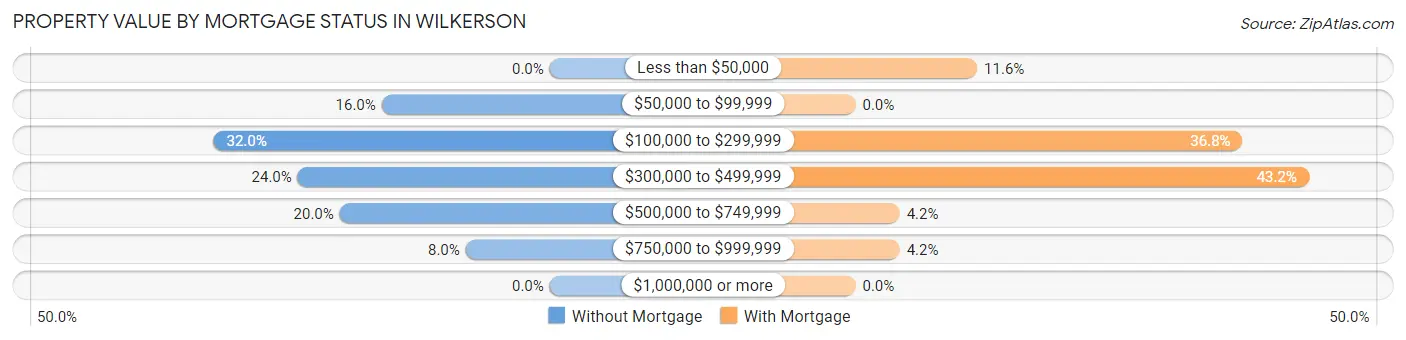
| Property Value | Without Mortgage | With Mortgage |
| Less than $50,000 | 0 (0.0%) | 11 (11.6%) |
| $50,000 to $99,999 | 8 (16.0%) | 0 (0.0%) |
| $100,000 to $299,999 | 16 (32.0%) | 35 (36.8%) |
| $300,000 to $499,999 | 12 (24.0%) | 41 (43.2%) |
| $500,000 to $749,999 | 10 (20.0%) | 4 (4.2%) |
| $750,000 to $999,999 | 4 (8.0%) | 4 (4.2%) |
| $1,000,000 or more | 0 (0.0%) | 0 (0.0%) |
| Total | 50 (100.0%) | 95 (100.0%) |
Household Income by Mortgage Status in Wilkerson
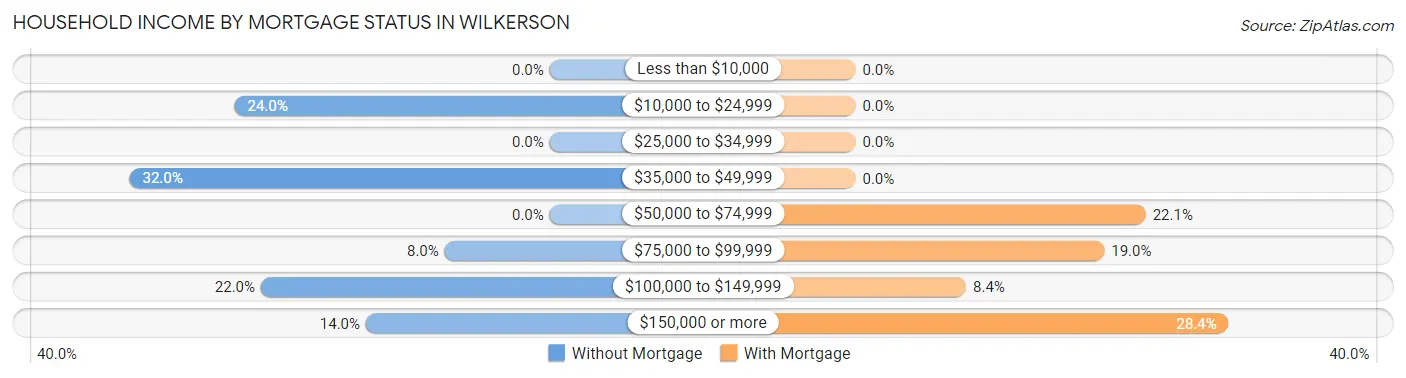
| Household Income | Without Mortgage | With Mortgage |
| Less than $10,000 | 0 (0.0%) | 0 (0.0%) |
| $10,000 to $24,999 | 12 (24.0%) | 0 (0.0%) |
| $25,000 to $34,999 | 0 (0.0%) | 0 (0.0%) |
| $35,000 to $49,999 | 16 (32.0%) | 0 (0.0%) |
| $50,000 to $74,999 | 0 (0.0%) | 21 (22.1%) |
| $75,000 to $99,999 | 4 (8.0%) | 18 (19.0%) |
| $100,000 to $149,999 | 11 (22.0%) | 8 (8.4%) |
| $150,000 or more | 7 (14.0%) | 27 (28.4%) |
| Total | 50 (100.0%) | 95 (100.0%) |
Property Value to Household Income Ratio in Wilkerson
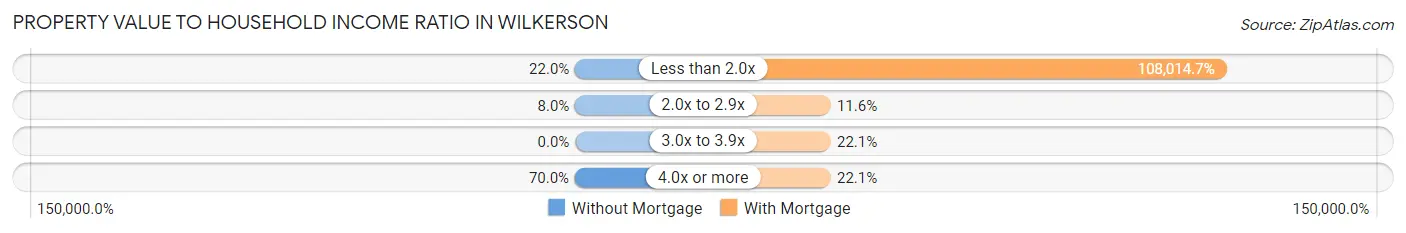
| Value-to-Income Ratio | Without Mortgage | With Mortgage |
| Less than 2.0x | 11 (22.0%) | 102,614 (108,014.7%) |
| 2.0x to 2.9x | 4 (8.0%) | 11 (11.6%) |
| 3.0x to 3.9x | 0 (0.0%) | 21 (22.1%) |
| 4.0x or more | 35 (70.0%) | 21 (22.1%) |
| Total | 50 (100.0%) | 95 (100.0%) |
Real Estate Taxes by Mortgage Status in Wilkerson
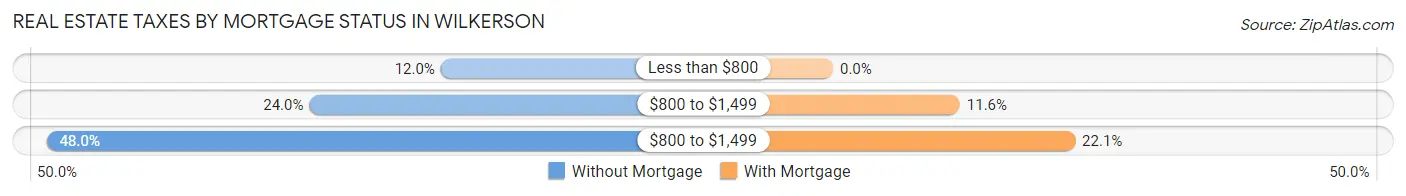
| Property Taxes | Without Mortgage | With Mortgage |
| Less than $800 | 6 (12.0%) | 0 (0.0%) |
| $800 to $1,499 | 12 (24.0%) | 11 (11.6%) |
| $800 to $1,499 | 24 (48.0%) | 21 (22.1%) |
| Total | 50 (100.0%) | 95 (100.0%) |
Health & Disability in Wilkerson
Health Insurance Coverage by Age in Wilkerson
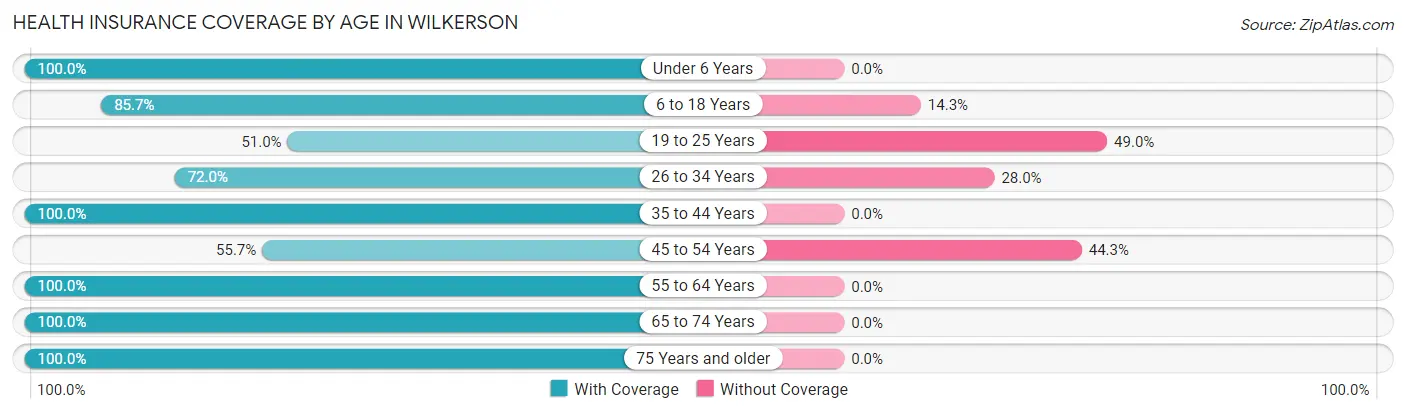
| Age Bracket | With Coverage | Without Coverage |
| Under 6 Years | 102 (100.0%) | 0 (0.0%) |
| 6 to 18 Years | 48 (85.7%) | 8 (14.3%) |
| 19 to 25 Years | 26 (51.0%) | 25 (49.0%) |
| 26 to 34 Years | 36 (72.0%) | 14 (28.0%) |
| 35 to 44 Years | 69 (100.0%) | 0 (0.0%) |
| 45 to 54 Years | 39 (55.7%) | 31 (44.3%) |
| 55 to 64 Years | 49 (100.0%) | 0 (0.0%) |
| 65 to 74 Years | 111 (100.0%) | 0 (0.0%) |
| 75 Years and older | 32 (100.0%) | 0 (0.0%) |
| Total | 512 (86.8%) | 78 (13.2%) |
Health Insurance Coverage by Citizenship Status in Wilkerson
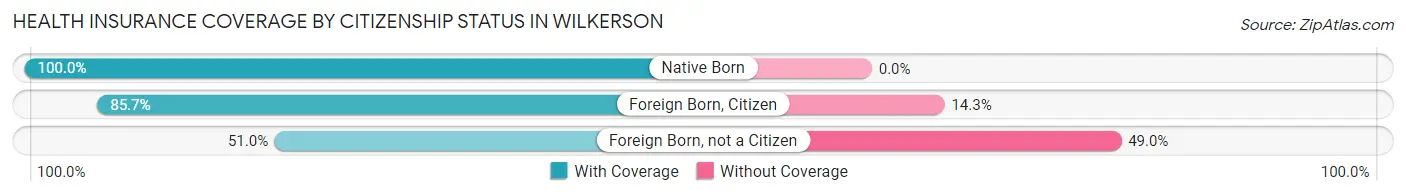
| Citizenship Status | With Coverage | Without Coverage |
| Native Born | 102 (100.0%) | 0 (0.0%) |
| Foreign Born, Citizen | 48 (85.7%) | 8 (14.3%) |
| Foreign Born, not a Citizen | 26 (51.0%) | 25 (49.0%) |
Health Insurance Coverage by Household Income in Wilkerson
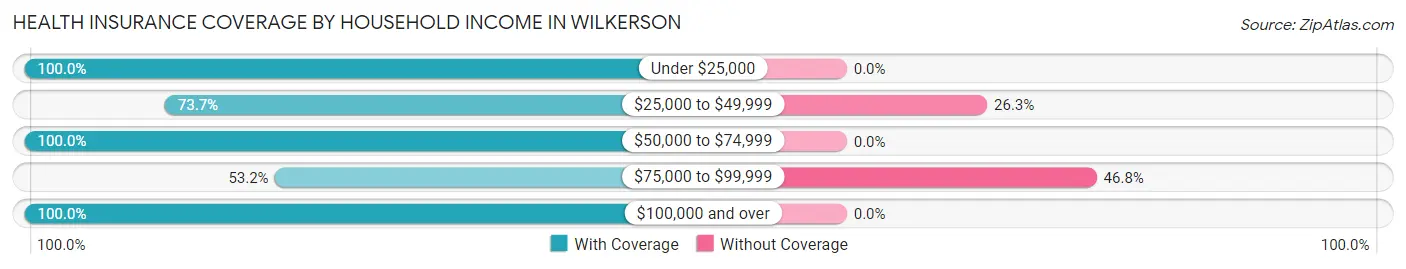
| Household Income | With Coverage | Without Coverage |
| Under $25,000 | 12 (100.0%) | 0 (0.0%) |
| $25,000 to $49,999 | 157 (73.7%) | 56 (26.3%) |
| $50,000 to $74,999 | 40 (100.0%) | 0 (0.0%) |
| $75,000 to $99,999 | 25 (53.2%) | 22 (46.8%) |
| $100,000 and over | 278 (100.0%) | 0 (0.0%) |
Public vs Private Health Insurance Coverage by Age in Wilkerson
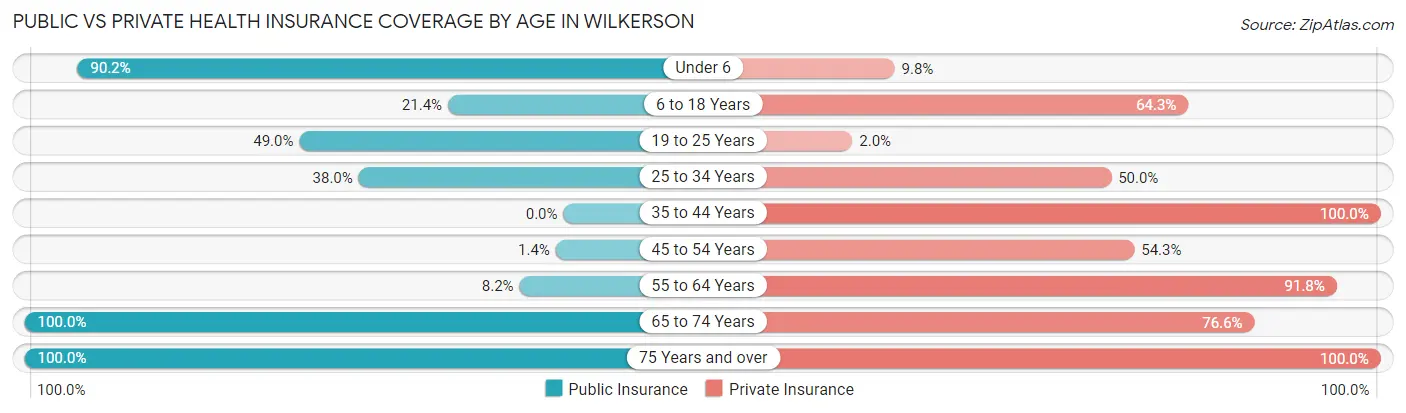
| Age Bracket | Public Insurance | Private Insurance |
| Under 6 | 92 (90.2%) | 10 (9.8%) |
| 6 to 18 Years | 12 (21.4%) | 36 (64.3%) |
| 19 to 25 Years | 25 (49.0%) | 1 (2.0%) |
| 25 to 34 Years | 19 (38.0%) | 25 (50.0%) |
| 35 to 44 Years | 0 (0.0%) | 69 (100.0%) |
| 45 to 54 Years | 1 (1.4%) | 38 (54.3%) |
| 55 to 64 Years | 4 (8.2%) | 45 (91.8%) |
| 65 to 74 Years | 111 (100.0%) | 85 (76.6%) |
| 75 Years and over | 32 (100.0%) | 32 (100.0%) |
| Total | 296 (50.2%) | 341 (57.8%) |
Disability Status by Sex by Age in Wilkerson
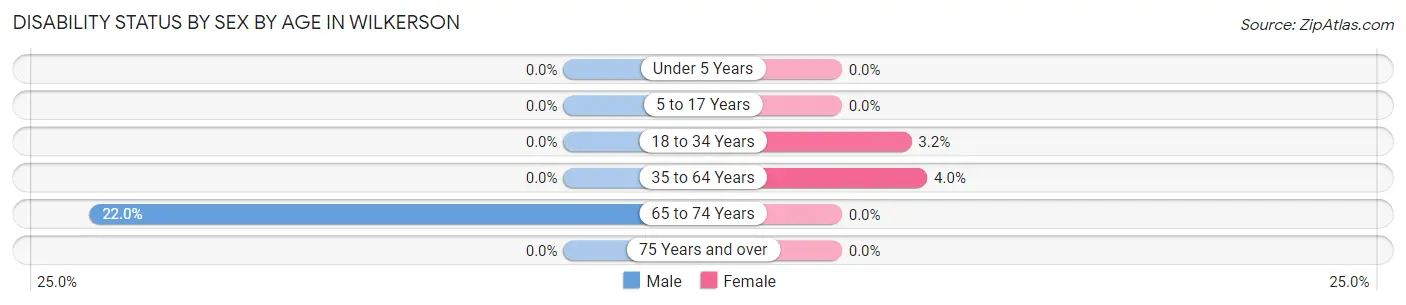
| Age Bracket | Male | Female |
| Under 5 Years | 0 (0.0%) | 0 (0.0%) |
| 5 to 17 Years | 0 (0.0%) | 0 (0.0%) |
| 18 to 34 Years | 0 (0.0%) | 1 (3.2%) |
| 35 to 64 Years | 0 (0.0%) | 4 (4.0%) |
| 65 to 74 Years | 11 (22.0%) | 0 (0.0%) |
| 75 Years and over | 0 (0.0%) | 0 (0.0%) |
Disability Class by Sex by Age in Wilkerson
Disability Class: Hearing Difficulty
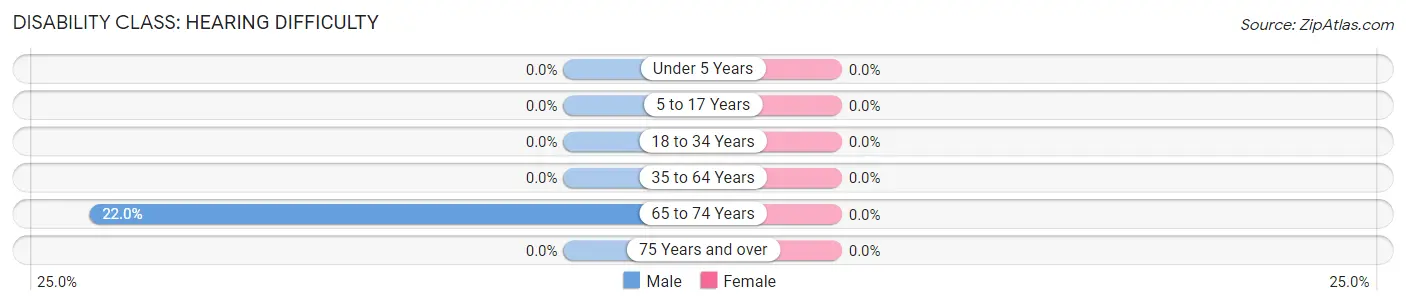
| Age Bracket | Male | Female |
| Under 5 Years | 0 (0.0%) | 0 (0.0%) |
| 5 to 17 Years | 0 (0.0%) | 0 (0.0%) |
| 18 to 34 Years | 0 (0.0%) | 0 (0.0%) |
| 35 to 64 Years | 0 (0.0%) | 0 (0.0%) |
| 65 to 74 Years | 11 (22.0%) | 0 (0.0%) |
| 75 Years and over | 0 (0.0%) | 0 (0.0%) |
Disability Class: Vision Difficulty
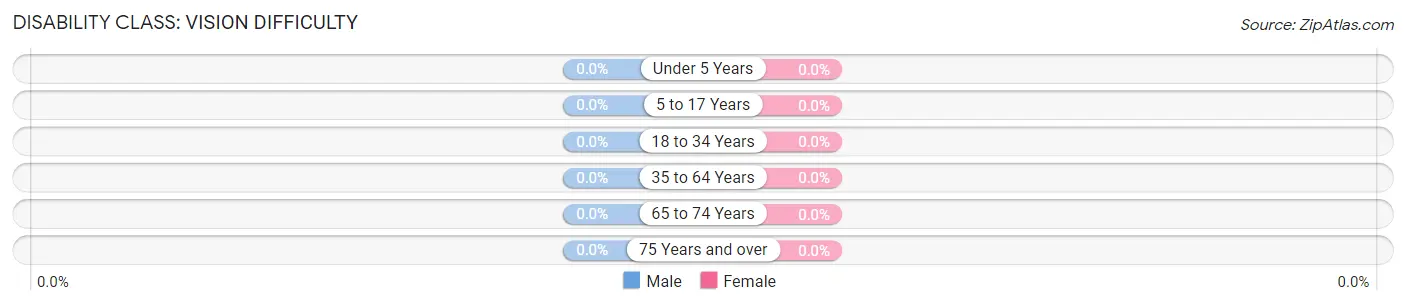
| Age Bracket | Male | Female |
| Under 5 Years | 0 (0.0%) | 0 (0.0%) |
| 5 to 17 Years | 0 (0.0%) | 0 (0.0%) |
| 18 to 34 Years | 0 (0.0%) | 0 (0.0%) |
| 35 to 64 Years | 0 (0.0%) | 0 (0.0%) |
| 65 to 74 Years | 0 (0.0%) | 0 (0.0%) |
| 75 Years and over | 0 (0.0%) | 0 (0.0%) |
Disability Class: Cognitive Difficulty
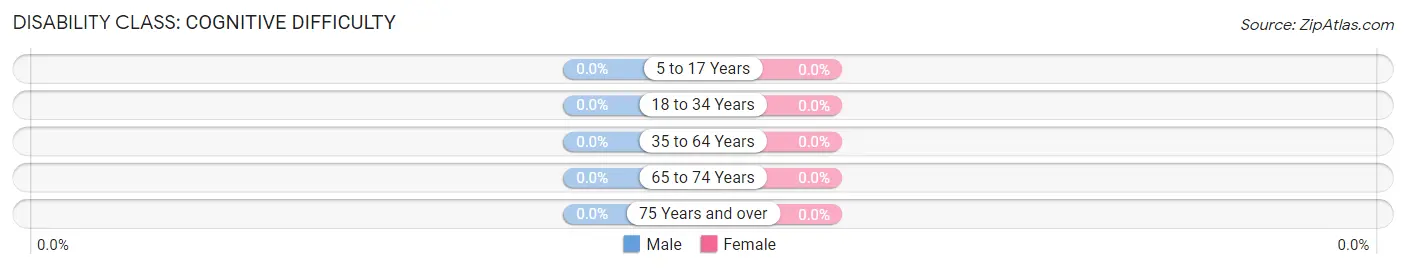
| Age Bracket | Male | Female |
| 5 to 17 Years | 0 (0.0%) | 0 (0.0%) |
| 18 to 34 Years | 0 (0.0%) | 0 (0.0%) |
| 35 to 64 Years | 0 (0.0%) | 0 (0.0%) |
| 65 to 74 Years | 0 (0.0%) | 0 (0.0%) |
| 75 Years and over | 0 (0.0%) | 0 (0.0%) |
Disability Class: Ambulatory Difficulty
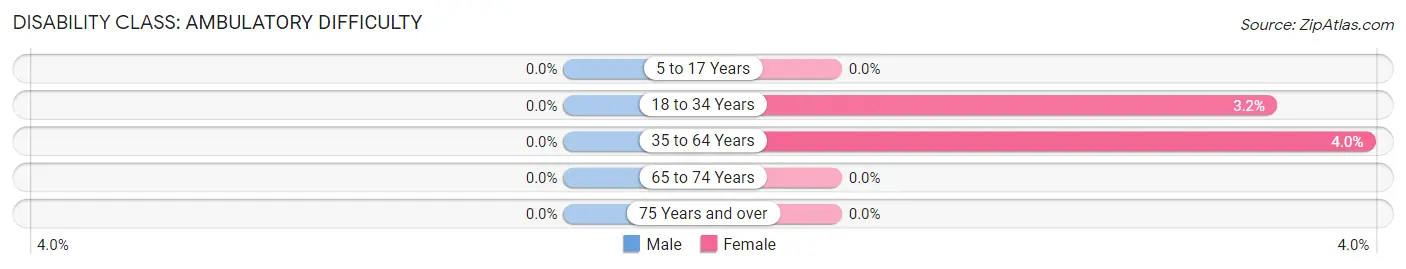
| Age Bracket | Male | Female |
| 5 to 17 Years | 0 (0.0%) | 0 (0.0%) |
| 18 to 34 Years | 0 (0.0%) | 1 (3.2%) |
| 35 to 64 Years | 0 (0.0%) | 4 (4.0%) |
| 65 to 74 Years | 0 (0.0%) | 0 (0.0%) |
| 75 Years and over | 0 (0.0%) | 0 (0.0%) |
Disability Class: Self-Care Difficulty
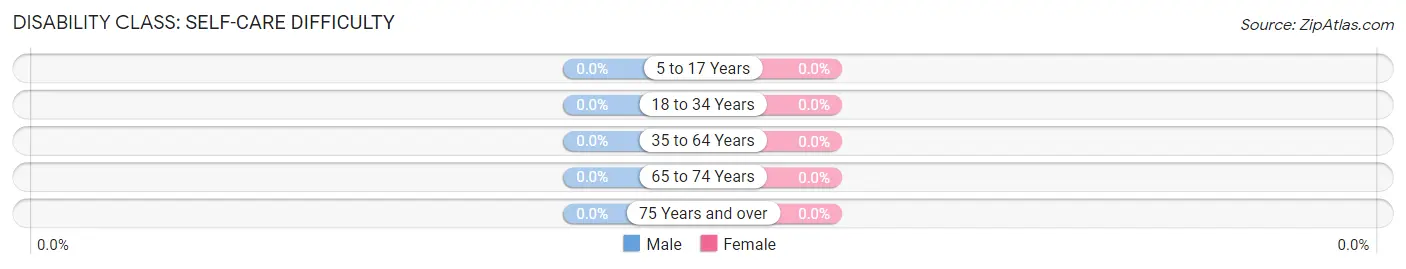
| Age Bracket | Male | Female |
| 5 to 17 Years | 0 (0.0%) | 0 (0.0%) |
| 18 to 34 Years | 0 (0.0%) | 0 (0.0%) |
| 35 to 64 Years | 0 (0.0%) | 0 (0.0%) |
| 65 to 74 Years | 0 (0.0%) | 0 (0.0%) |
| 75 Years and over | 0 (0.0%) | 0 (0.0%) |
Technology Access in Wilkerson
Computing Device Access in Wilkerson
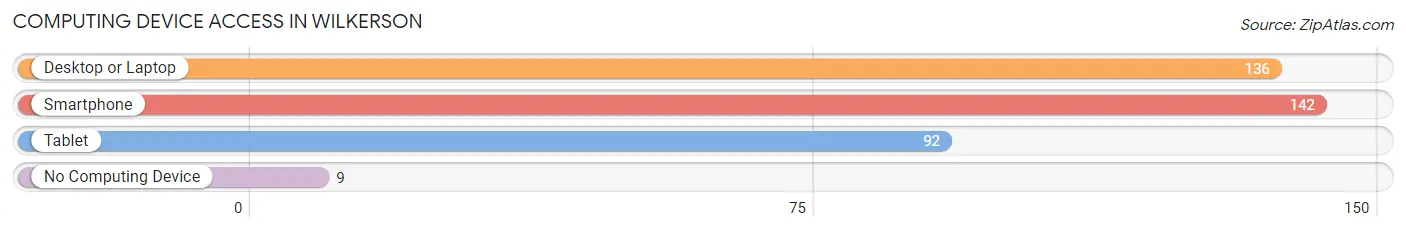
| Device Type | # Households | % Households |
| Desktop or Laptop | 136 | 81.9% |
| Smartphone | 142 | 85.5% |
| Tablet | 92 | 55.4% |
| No Computing Device | 9 | 5.4% |
| Total | 166 | 100.0% |
Internet Access in Wilkerson
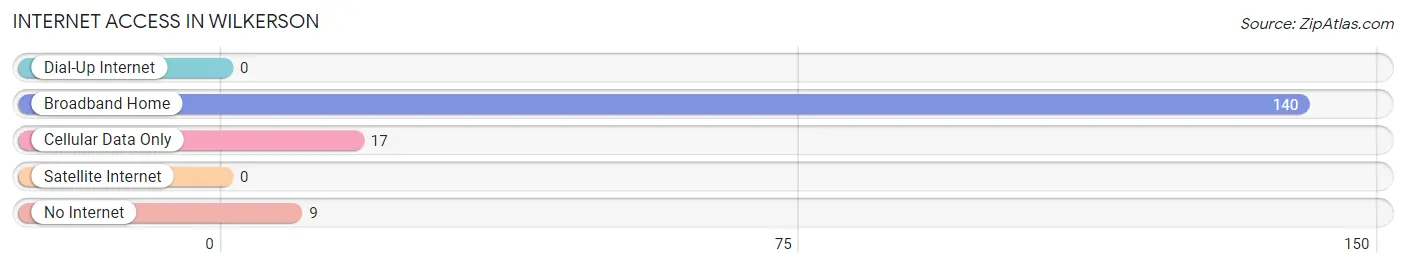
| Internet Type | # Households | % Households |
| Dial-Up Internet | 0 | 0.0% |
| Broadband Home | 140 | 84.3% |
| Cellular Data Only | 17 | 10.2% |
| Satellite Internet | 0 | 0.0% |
| No Internet | 9 | 5.4% |
| Total | 166 | 100.0% |
Wilkerson Summary
Wilkerson is a small unincorporated community located in the foothills of the Sierra Nevada Mountains in California. It is situated in the Sierra Valley, which is a large agricultural valley located in the northeastern part of the state. The community is located in Sierra County, which is one of the least populated counties in California. Wilkerson is located approximately 30 miles northeast of the city of Reno, Nevada, and is about a two-hour drive from Sacramento, the state capital.
History
The area that is now Wilkerson was originally inhabited by the Washoe people, who were a Native American tribe that lived in the Sierra Nevada region. The Washoe people were hunter-gatherers who lived in the area for thousands of years before the arrival of European settlers.
The first European settlers to arrive in the area were miners who were searching for gold in the Sierra Nevada Mountains. The first permanent settlement in the area was established in 1852 by a group of miners who named the settlement Wilkerson after one of the miners, William Wilkerson. The settlement was initially a mining camp, but it soon became a small farming community.
In the late 19th century, Wilkerson became a popular destination for tourists who were looking to escape the summer heat of the Central Valley. The town was also a popular stop for stagecoaches traveling between Reno and Sacramento.
Geography
Wilkerson is located in the Sierra Valley, which is a large agricultural valley located in the northeastern part of the state. The valley is surrounded by the Sierra Nevada Mountains to the east and the Cascade Range to the west. The valley is approximately 40 miles long and 10 miles wide, and is home to several small towns and villages.
The town of Wilkerson is located at an elevation of 4,000 feet, and is situated on the banks of the Feather River. The town is surrounded by rolling hills and is home to several small lakes and streams. The climate in Wilkerson is mild and dry, with hot summers and cold winters.
Economy
The economy of Wilkerson is largely based on agriculture. The town is located in the heart of the Sierra Valley, which is one of the most productive agricultural regions in the state. The valley is home to a variety of crops, including alfalfa, wheat, barley, and hay. The valley is also home to several cattle ranches and dairy farms.
In addition to agriculture, Wilkerson is also home to several small businesses, including restaurants, stores, and a post office. The town is also home to a small airport, which is used for recreational and business purposes.
Demographics
As of the 2010 census, the population of Wilkerson was 1,093. The population is largely white (94.3%), with small percentages of Hispanic (2.2%), African American (1.2%), and Native American (0.7%) residents. The median household income in Wilkerson is $45,000, and the median age is 44.
Wilkerson is a small, rural community that is home to a diverse population. The town is a popular destination for tourists who are looking to escape the hustle and bustle of city life, and is a great place to experience the beauty of the Sierra Nevada Mountains.
Common Questions
What is Per Capita Income in Wilkerson?
Per Capita income in Wilkerson is $30,852.
What is the Median Family Income in Wilkerson?
Median Family Income in Wilkerson is $102,955.
What is the Median Household income in Wilkerson?
Median Household Income in Wilkerson is $103,409.
What is Income or Wage Gap in Wilkerson?
Income or Wage Gap in Wilkerson is 57.6%.
Women in Wilkerson earn 42.4 cents for every dollar earned by a man.
What is Inequality or Gini Index in Wilkerson?
Inequality or Gini Index in Wilkerson is 0.34.
What is the Total Population of Wilkerson?
Total Population of Wilkerson is 590.
What is the Total Male Population of Wilkerson?
Total Male Population of Wilkerson is 284.
What is the Total Female Population of Wilkerson?
Total Female Population of Wilkerson is 306.
What is the Ratio of Males per 100 Females in Wilkerson?
There are 92.81 Males per 100 Females in Wilkerson.
What is the Ratio of Females per 100 Males in Wilkerson?
There are 107.75 Females per 100 Males in Wilkerson.
What is the Median Population Age in Wilkerson?
Median Population Age in Wilkerson is 41.7 Years.
What is the Average Family Size in Wilkerson
Average Family Size in Wilkerson is 4.1 People.
What is the Average Household Size in Wilkerson
Average Household Size in Wilkerson is 3.5 People.
How Large is the Labor Force in Wilkerson?
There are 255 People in the Labor Forcein in Wilkerson.
What is the Percentage of People in the Labor Force in Wilkerson?
54.1% of People are in the Labor Force in Wilkerson.
What is the Unemployment Rate in Wilkerson?
Unemployment Rate in Wilkerson is 4.3%.